Embed Size (px)
Citation preview

PEER-REVIEWED ARTICLE bioresourcescom
Krongtaew et al (2010) ldquoPart 2 Quantitative NIRrdquo BioResources 5(4) 2081-2096 2081
CHARACTERIZATION OF KEY PARAMETERS FOR BIOTECHNOLOGICAL LIGNOCELLULOSE CONVERSION ASSESSED BY FT-NIR SPECTROSCOPY PART II QUANTITATIVE ANALYSIS BY PARTIAL LEAST SQUARES REGRESSION Chularat Krongtaewa Kurt Messnerb Thomas Tersc and Karin Fackler b
Wheat straw (Triticum aestivum L) and oat straw (Avena sativa L) were chemically pretreated at different severities with the purpose of delignification which in turn leads to a better accessibility of plant cell wall polysaccharides for further biotechnological conversion Key parameters of these samples ie weight loss residual lignin content and hydrolysable sugars serving as precursors for biofuel production were monitored by wet-chemistry analyses Fourier transform near infrared (FT-NIR) spectra were correlated to these data by means of partial least-squares (PLS) regression Weight loss (40 ndash 335) of the wheat straw could be predicted (RMSEP = 35 Rsup2test = 075) from the entire FT-NIR spectra (10000 ndash 4000 cm-1) Residual lignin content (79 ndash 207 RMSEP = 09 Rsup2test = 094) and amount of reducing sugars based on pretreated wheat straw (128 ndash 1000 mg g-1 RMSEP = 83 mg g-1 Rsup2test = 089) were powerfully evaluated between 6900 and 5510 cm-1 a spectral region where polysaccharides and lignin absorb All these parameters could be equally predicted with even higher accuracy from pre-treated oat straw samples Furthermore some important parameters for anaerobic conversion of wheat straw to biogas ndash biogas production total solids and volatile solids content ndash could be estimated
Keywords Wheat and oat straw pre-treatment Fourier transform near-infrared spectroscopy (FT-NIR) Biogas potential test Anaerobic fermentation Multivariate data analysis Partial least-squares (PLS) regression Contact information a Department of Chemical Engineering Faculty of Engineering Mahidol University 2525 Puttamonthon 4 Road Salaya Nakhon Pathom 73170 Thailand b Institute of Chemical Engineering Vienna University of Technology Getreidemarkt 9166 A-1060 Vienna Austria c Department of Material Sciences and Process Engineering BOKU - University of Natural Resources and Applied Life Sciences Peter Jordan Strasse 82 A-1190 Vienna Austria Corresponding author egchularatmahidolacth INTRODUCTION Wheat and oat straw are lignocellulosic materials primarily containing 30-35 cellulose 20-25 hemicelluloses and 17-20 lignin The complex structure of the lignocellulose complex is considered as the major obstacle for polysaccharides utilization in fermentation processes (Himmel et al 2007 Chandra et al 2007) Pre-treatment is required to open up the lignocellulose structure and to increase the accessibility to microbial enzymes which hydrolyze the carbohydrate constituents to fermentable sugars These sugars are regarded as precursor substances for biofuels or building blocks for
PEER-REVIEWED ARTICLE bioresourcescom
Krongtaew et al (2010) ldquoPart 2 Quantitative NIRrdquo BioResources 5(4) 2081-2096 2082
chemical syntheses Lignin removal hemicellulose depolymerisation and solubilization swelling of the fibre structure decrease of cellulose crystallinity etc may be results of the pre-treatment (Kumar et al 2009)
To assess the properties of pretreated lignocellulosic materials a number of wet-laboratory methods have been proposed and standardized (Energy Efficiency amp Renewable Energy US Department of Energy 2009) These mostly destructive methods are costly time-consuming and tiresome Alternatively Fourier transform near-infrared spectroscopy (FT-NIR) which is a simple powerful and sensitive non-destructive tool can provide the information of chemical and physical properties of lignocelluloses and other food and agricultural products (Ghosh and Rodgers 2001 Shenk et al 2001 Siesler et al 2002 Ozaki et al 2007) NIR absorption bands are derived from the overtones and combinations of ie C-H N-H O-H and C=O vibrations By this spectroscopic means not only the chemical structure modification but also the physical and morphological changes of organic substances can be characterised Combined with multivariate data analyses a number of studies on quantitative analyses of lignocelluloses and cereals composition by means of NIR spectroscopy have been reported (Kong et al 2005 Fackler et al 2007ab) Partial least-square (PLS) regression is an efficient mathematical tool revealing the quantitative information of the spectral data Recently many distinct NIR bands of lignocellulose materials have been assigned (Tsuchikawa and Siesler 2003a Tsuchikawa and Siesler 2003b Tsuchikawa et al 2005 Watanabe et al 2006 Mitsui et al 2008) providing more descriptive explanatory details for understanding the multivariate regression models In the first part of the study (Krongtaew et al 2010) FT-NIR spectra of 80 pretreated wheat straw samples and 53 pretreated oat straw samples were discussed qualitatively using multivariate tools of data analysis (principal component analysis) In this second part of the study the same FT-NIR spectra were used to assess the lignin content reducing sugar and weight loss of the pretreated samples analysed quantitatively using partial least-squares (PLS) regression This work has shown the powerful assessment of key parameters for biotechnological conversion of biomass particularly biogas yield based on characteristics of pretreated lignocelluloses which have not been mentioned before EXPERIMENTAL Materials
Wheat straw (Triticum aestivum L) and oat straw (Avena sativa L) were obtained from Wirtschaftsbetriebe Herbert Rauch Houmlpfner Vienna Austria from the 2005 harvest Wheat straw contained 63 polysaccharides 215 lignin 114 extractives and 42 ash while oat straw contained 51 polysaccharides 196 lignin 205 extractives and 89 ash These data were from wet-chemistry analyses All chemicals for pre-treatment and analytical assays were pa grade and purchased from Sigma-Aldrich (wwwsigmaaldrichcom) Digested sludge for anaerobic digestion was kindly contributed from the wastewater treatment plant in Schwechat Austria and cattle manure
PEER-REVIEWED ARTICLE bioresourcescom
Krongtaew et al (2010) ldquoPart 2 Quantitative NIRrdquo BioResources 5(4) 2081-2096 2083
was kindly provided by the Teufel farm in Zipf and the Gradinger farm in MuumlhlheimInn Upper Austria Methods Pre-treatment of straw
Wheat and oat straw were chopped to 1-cm length 20 g dry straw was treated in 200 mL solution (solid-to-liquid ratio of 110) at different concentrations of acid acidH2O2 alkali and alkaliH2O2 The initial pH of pre-treatment in acidic (pH 25 to 45) and alkaline (pH 9 to 12) conditions was adjusted by concentrated sulphuric acid (gt 95) and 1 molL-1 sodium hydroxide respectively Some pre-treatments were carried out in the presence of different amounts of hydrogen peroxide (2 to 10 ww based on dry straw) The pre-treatment was carried out for 4 h in a water bath at different temperatures varied from room temperature (25degC) to 90degC After pre-treatment straw was washed with 1 L distilled water and dried for at least 24 h at 50degC for analyses This moderate temperature was used in order to prevent chemical modifications of pretreated straw during drying which might influence FT-NIR spectra Enzyme hydrolysis of treated straw samples
Prior to hydrolysis crude Viscozym L (wwwnovozymescom) was purified by Econo-Pac 10DG column (wwwbio-radcom) using water as eluent to eliminate low molecular weight compounds like sugars and salts Afterwards 100 mg straw (dry basis at 50degC) was hydrolysed in enzyme solution containing 1 mL purified Viscozym L and 9 mL 30 mmolL-1 sodium-acetate buffer pH 40 The enzyme hydrolysis was performed at 40degC for 48 h and subsequently 1 mL of supernatant was centrifuged and analysed for reducing sugar content Inoculum seed preparation and biogas potential test
To get the equal quality of inoculum for the biogas potential test inoculum seed was prepared in 2-L semi-continuously stirred tank reactor (CSTR) system as illustrated in Fig 1 To the 2-L final volume 800 mL raw sludge and 200 g cow manure 200 mL nutrient solution (003 gL-1 NH4Cl 02 gL-1 K2HPO4 005 gL-1 MgSO47H2O and 001 gL-1 yeast extract) and tap water were added The initial pH was adjusted to 72 and maintained during the digestion by adding 1 molL-1 NaOH The temperature for anaerobic digestion was controlled at 37degC and 2 gVS L-1d-1 of organic loading rate of wheat straw (2 mm particles) was fed daily Biogas generated was measured by compact automated displacement gas metering system (Angelidaki et al 1992) The digestion was carried out until the system reached the steady state condition as indicated by 1) constant biogas production 2) constant substance concentration (volatile fatty acid and alkalinity) and 3) constant destruction of straw (total solid and volatile solid removals) Then the sludge mixture was ready to use as inoculum seed for the biogas potential test in batch fermenter For the batch biogas potential test 1 g pretreated straw (oven dry basis) and 150 mL inoculum seed from the CSTR system was added into a 500-mL Erlenmeyer flask The anaerobic digestion started at 37degC after flushing the head space with nitrogen gas The mixture was shaken twice daily Accumulative biogas generation was recorded by a
PEER-REVIEWED ARTICLE bioresourcescom
Krongtaew et al (2010) ldquoPart 2 Quantitative NIRrdquo BioResources 5(4) 2081-2096 2084
liquid displacement method using acidified water (12 molL-1 hydrochloric acid for pH 2-3) to prevent solubilization of CO2 (Wilkie et al 2004) Total solids and volatile solids removals of sludge mixture were determined after the gas generation ceased Biogas yield referred to accumulative biogas volume divided by straw dry weight (mL biogas g-1 straw)
Fig 1 Semi-continuous anaerobic digestion for inoculum seed preparation (1) 3-liter continuously stirred tank reactor (CSTR) (2) water coil (3) weight balance (4) motor for stirrer (5) temperature controlled water bath (6) continuous gas collecting column (7) counting device (8) gas release valve (9) gastight tube (10) syringe for feeding substrate (11) airtight valve (12) effluent tube (13) liquid pump and (14) effluent flask Analyses
Weight loss of pretreated straw was determined after drying at 50degC for 24 h Reducing sugars in supernatant after enzyme hydrolysis were determined by a modified dinitrosalicylic (DNS) acid method Reducing sugar yield (mg sugar g-1 pretreated straw) was calculated based on glucose equivalent from the calibration curve As the method does not differentiate between reducing end groups of pentoses and hexoses the pentoses was overestimated (factor = 12) Dry straw samples were then milled to 80 microm particles using the ultra-centrifugal mill (Retsch ZM 1000 Germany) for analyses of extractives Klason lignin acid-soluble lignin and FT-NIR spectroscopy Total solids and volatile solids content were also monitored for pretreated samples stored at the same relative humidity and temperature The procedures were reported elsewhere (Krongtaew et al 2010)
PEER-REVIEWED ARTICLE bioresourcescom
Krongtaew et al (2010) ldquoPart 2 Quantitative NIRrdquo BioResources 5(4) 2081-2096 2085
Fourier transform near-infrared (FT-NIR) spectroscopy FT-NIR spectroscopy of milled samples (80 microm particles) was carried out in
terms of apparent absorbance log [1Reflectance] by FT-NIR spectrometer using a fiber-optic probe (Equinox 55 Bruker Optics Inc Germany) Spectroscopy was performed with 8 cm-1 resolution 100 scans (60 seconds) and wave numbers ranging from 10000 to 4000 cm-1 The average spectra of 4 replicates were calculated
Partial least-squares (PLS) regression models between FT-NIR spectra and the key parameters from straw pre-treatment namely total lignin content amount of reducing sugars and weight loss were set up by OPUS QUANT 2 version 60 (Bruker Germany) In some cases spectra were differentiated to second derivatives (17 smoothing points 2nd order polynomial fit using the Savitzky and Golay algorithm (1964)) or minimummaximum normalized in the respective spectral range (Tables 1 and 2) From 80 wheat straw samples and 53 oat straw samples half of the samples were chosen randomly for the calibration and the remaining samples were used as the test set to validate the models The validity of models was indicated by the determination coefficient of test samples (R2
test) and root mean square error of prediction (RMSEP) The ranges of wavenumber for setting up the PLS models of lignin content reducing sugar and weight loss were chosen using OPUS QUANT 2 Optimization The other ranges (7500 7200 ndash 5500 cm-1) covered 1st overtones of O-H and C-H stretching bands of water lignin and polysaccharides (Krongtaew et al 2010) The PLS models of total solid volatile solids and biogas yield the crucial parameters for anaerobic fermentation were calculated from the alternate sample set (42 wheat straw samples) Due to the smaller number of samples leave-one-out cross validation was performed RESULTS AND DISCUSSION FT-NIR spectra
In Fig 2 pre-processed FT-NIR spectra are shown in the spectral region used for the regression models As illustrated in Fig 2(B) and 2(C) 2nd derivative FT-NIR spectra of straw samples after different severities of physico-chemical pre-treatment show significant changes in the range between 7200 and 5500 cm-1 This spectral region is attributed to CH stretch 1st overtone vibration of the aromatic lignin structure which is overlapped with CH stretch 1st overtone vibration band of acetyl groups (CH3) of hemicelluloses mainly xylan in straw (Shenk et al 2001 Fackler et al 2007b Tsuchikawa et al 2005) Moreover modification of FT-NIR spectra ranging from 7200 to 6000 cm-1 attributed to alteration of OH stretch 1st overtone of amorphous semi-crystalline and crystalline cellulose (Tsuchikawa and Siesler 2003a Tsuchikawa and Siesler 2003b Watanabe et al 2006) were also observed after physico-chemical pre-treatment Qualitative changes in FT-NIR spectra after lignin degradation as well as degradation or deacetylation of polysaccharides were described in detail in the preceding article (Krongtaew et al 2010)
During the physico-chemical pre-treatment lignin and hemicelluloses were solubilized and the crystalline structure of the substrate was substantially changed These changes were reflected in the FT-NIR absorbance PLS regression models of FT-NIR
PEER-REVIEWED ARTICLE bioresourcescom
Krongtaew et al (2010) ldquoPart 2 Quantitative NIRrdquo BioResources 5(4) 2081-2096 2086
spectra between 6900 and 5510 cm-1 were set up for predicting total residual lignin content and the amount of hydrolysable reducing sugars of pretreated straw samples (Table 1) This spectral region includes a lignin band near 5980 cm-1 and xylan bands near 5800 5960 5990 cm-1 (Krongtaew et al 2010) as well as information on cellulose crystallinity (Fig 2(B)) A further PLS model was calculated from the entire FT-NIR spectra ranging from 10000 to 4000 cm-1 to estimate the weight loss after pre-treatment (Table 1) Weight loss leads to loss of NIR absorption of C-H O-H N-H and C=O vibration bands of organic substances (Fig 2(A)) Table 1 Parameters and Errors from Partial Least-Squares (PLS) Regression Models of Total Residual Lignin Reducing Sugar and Weight Loss of Delignified Wheat and Oat Straw Models Substrate Component
range No of samples No of test samples
Spectral region (cm-1)
Spectral pre-processing
Total residual lignin (ww)
Wheat straw Oat straw
79 - 207 83 - 185
80 40 53 27
6900- 5510 6900- 5510
2nd derivative 2nd derivative
Reducing sugars (mg g-1- straw)
Wheat straw Oat straw
128 - 1000 131 -812
80 40 53 27
6900- 5510 6900- 5510
2nd derivative 2nd derivative
Weight loss () Wheat straw Oat straw
40 - 335 50 - 440
80 40 53 27
10000-4000 10000-4000
No processing No processing
Models Substrate 1R2
cal 2RMSEE 3R2
test 4RMSEP No of
PLS Factors
Total residual lignin (ww)
Wheat straw Oat straw
095 099
09 05
094 096
09 08
3 1
Reducing sugars (mg g-1- straw)
Wheat straw Oat straw
094 096
45 mg g-1 54 mg g-1
089 093
83 mg g-1 64 mg g-1
4 1
Weight loss () Wheat straw Oat straw
085 096
29 26
075 091
35 34
4 4
1 Coefficient of determination of the calibration model 2 Root-mean-square error of estimation
3 Coefficient of determination of the test model 4 Root-mean-square error of prediction for future analysis
Lignin content amount of reducing sugars and the weight loss of oat straw of the pretreated samples were accurately evaluated from FT-NIR spectra by means of PLS regression (Table 1 and Fig 3) Good correlations between NIR-predicted and measured values were obtained for calibration and test sets as indicated by high values of the determination coefficients (Rsup2cal and R2
test) and low root-mean-square error of estimation and prediction (RMSEE and RMSEP) These model parameters and the low number of factors required to obtain this high correlation are good indications for the robustness and applicability of the regression models
PEER-REVIEWED ARTICLE bioresourcescom
Krongtaew et al (2010) ldquoPart 2 Quantitative NIRrdquo BioResources 5(4) 2081-2096 2087
Fig 2 FT-NIR spectra of wheat straw (A) and second derivative of FT-NIR spectra of pretreated wheat (B) and oat straw (C) samples containing different residual lignin contents
PEER-REVIEWED ARTICLE bioresourcescom
Krongtaew et al (2010) ldquoPart 2 Quantitative NIRrdquo BioResources 5(4) 2081-2096 2088
Fig 3 NIR-predicted and measured values of the PLS regression models of total residual lignin content (A D) reducing sugars (B E) and weight loss (C F) of calibration and test samples of pretreated wheat (WS) and oat straw (OS) samples The re-sampling method was applied for the models to ensure the reliability of all the PLS models as they were limited by a smaller number of observations when dividing the sample into two halves for calibration and test sets (Yu 2003) Ranges of R2
test RMSEP and number of PLS factors of ten different calibration and test sets demon-strated consistent and reliable results as shown in Table 2 The results showed the robustness and validity of the models for predicting total residual lignin reducing sugar and weight loss of physic-chemically pretreated wheat and oat straw samples Table 2 Re-Sampled Models of Ten Different Sub-Sample Sets for PLS Models of Total Residual Lignin Reducing Sugar and Weight Loss
Models Substrate Spectral region (cm-1)
Spectral pre-processing
1R2test 2RMSEP No of
PLS Factors
Total residual lignin (ww)
Wheat straw Oat straw
6900 ndash 5510 6900 ndash 5510
2nd derivative 2nd derivative
092-095 095-098
08-10 06-08
3 2-3
Reducing sugars (mg g-1 straw)
Wheat straw Oat straw
6900 ndash 5510 6900 ndash 5510
2nd derivative 2nd derivative
082-092 092-096
53-96 mg g-1 45-65 mg g-1
3-4 1-3
Weight loss () Wheat straw Oat straw
10000 ndash 4000 10000 ndash 4000
No processing No processing
065-073 084-093
33-41 24-39
3-4 4-5
1 Coefficient of determination of the test model 2 Root-mean-square error of prediction for future analysis
PEER-REVIEWED ARTICLE bioresourcescom
Krongtaew et al (2010) ldquoPart 2 Quantitative NIRrdquo BioResources 5(4) 2081-2096 2089
Assessment of Wheat Straw-to-Biogas Conversion by FT-NIR To optimize the PLS models for total solid content volatile solid content and
biogas yield some outliers were excluded from the 42 original samples thus the numbers of samples were different from those shown in Table 3 Although Rsup2cv of those cross-validated PLS models for total solid volatile solid and biogas yield were not as high as for those described above (Table 3 and Fig 5) the current models deliver a good estimation of these parameters Furthermore the much higher Rsup2cal the low number of PLS factors and the low bias of these models indicate the high potential of the FT-NIR method also to analyse these parameters
Table 3 PLS Regression Models from FT-NIR Spectral Data of Pretreated Wheat Straw Parameters Total solids Volatile solids Biogas Wave number [cm-1] Component range Spectral processing No of samples No of PLS factors
7200 - 5500 936-997 Second derivative 32 5
7200 - 5500 945-992 Second derivative 38 5
7500 - 5500 219-387 mL g-1 straw Min-Max normalization 30 5
Calibration R2
cal
RMSEE1
091 07
091 03
077 21 mL g-1 straw
Cross validation R2
cv RMSECV2
Bias
080 09 -005
075 05 003
065 23 mL g-1 straw 073
1 Root mean square error of estimation 2 Root mean square error of cross validation
An acceptable prediction of biogas yield was obtained (R2
cv = 065) from pretreated straw spectra when the consistency of inoculum seed quality and digestion condition were controlled Thus the analytical technology using the implementation of FT-NIR spectroscopy in the combination of mathematically spectral data processing could be applied to the entire system of biomass-to-bioenergy processes Biogas yield was well correlated to the amount of fermentable sugars available as carbon source for anaerobic digestion and also to the lignin content of the pretreated straw (Table 4) It was additionally observed that the yield of anaerobic digestion was influenced by the particle size of wheat straw (80 microm and 2 mm) (Fig 4) Pretreated straw with smaller particles (80 microm) gave higher biogas yields compared with larger particles (2 mm) while lignin content and the amount of reducing sugars of the same samples from wet-chemistry analyses were at the same levels The reason is most likely due to better accessibility of microbial enzymes toward the smaller particle size of straw Moreover the coefficient of correlation (R) between lignin and biogas as well as reducing sugar and biogas (Fig 4(A) 4(B)) were higher when determined among the same sets of particle size compared with those from all samples (Table 4) The PLS model however included all particle sizes
PEER-REVIEWED ARTICLE bioresourcescom
Krongtaew et al (2010) ldquoPart 2 Quantitative NIRrdquo BioResources 5(4) 2081-2096 2090
Table 4 Correlation Matrix of Key Parameters for Biomass-to-Biogas Conversion of Wheat Straw
Lignin Reducing sugars
Weight loss Total solid Volatile solid
Biogas
Lignin R=10
R=-08
R=-09
R=-02
R=-04
R=-06 Reducing sugars
-
R=10
R=08
R=01
R=02
R=06
Weight loss -
-
R=10
R=00
R=04
R=01
Total solid
-
-
-
R=10
R=-04
R=03
Volatile solid
-
-
-
-
R=10
R=-02
Biogas -
-
-
-
-
R=10
Fig 4 Correlation between total lignin and biogas (A) and enzymatically released reducing sugars and biogas (B) where diams and represent data from 80-microm and 2-mm straw samples respectively
PEER-REVIEWED ARTICLE bioresourcescom
Krongtaew et al (2010) ldquoPart 2 Quantitative NIRrdquo BioResources 5(4) 2081-2096 2091
Fig 5 NIR-predicted and measured values of (A) total solid (B) volatile solids and (C) biogas yield from the cross validation of PLS regression models of pretreated wheat straw Black solid indicates the outlier
A recent study demonstrated the prediction of biological methane potential based on a number of parameters - carbohydrates proteins lipids acetate and propionate concentration of a digested sludge mixture (Kaparaju et al 2009) Some scientific work also demonstrated the potential application of NIR for predicting volatile solids total solids chemical oxygen demand (COD) and several volatile fatty acids (VFA) of digested sludge from the biogas pilot plant the models relied mainly on different process constraints and were designed as analytical techniques for online-process control (Holm-Nielsen et al 2006 2007) The present study in contrast demonstrates the assessment of biogas yield based on chemical structure and composition of the substrate by FT-NIR spectroscopy Biogas yield is based on the stoichiometric conversion of organic material to biogas as shown in equation (1) Volatile organic compounds in lignocelluloses are theoretically converted to methane (CH4) and carbon dioxide (CO2) which are collectively called biogas (Buswell and Mueller 1952) In most methanogenic fermentations the methane yield lies close to the theoretical maximum of 3 moles of methane per mole of glucose as calculated from the Buswell equation (1) (Ahring and Westermann 2007) Thus the theoretical methane yield of untreated wheat straw is approximately 105 mmol CH4 and 105 mmol CO2 per g straw as wheat straw contains 63 polysaccharides (glucose equivalence) These values were calculated to 2352 mL CH4 and 2352 mL CO2 as one mole of an ideal gas at STP occupies 224 L
242 48248224COcbaCHcbaOHcbaOHC cba ⎟⎠⎞
⎜⎝⎛ +minus+⎟
⎠⎞
⎜⎝⎛ minus+rarr⎟
⎠⎞
⎜⎝⎛ minusminus+ (1)
However due to the complex structure which is rather hard to attack lignocellulose leads to yields lower than this theoretical maximum The presence of organic recalcitrant compounds in straw eg lignin and crystalline cellulose influences the yield of anaerobic digestion These properties of the substrate are reflected in the FT-NIR spectra and can serve for the prediction of the potential biogas yield For instance it has been reported that some parts of the crystalline structure of cellulose are loosened and
PEER-REVIEWED ARTICLE bioresourcescom
Krongtaew et al (2010) ldquoPart 2 Quantitative NIRrdquo BioResources 5(4) 2081-2096 2092
converted to semi-crystalline structures after physico-chemical pre-treatment (Krongtaew et al 2010) This could lead to higher susceptibility of cellulose and provided higher biomass utilization efficiency PLS Loading Spectra
PLS loading spectra contain the descriptive information of FT-NIR absorption regions that influence the PLS regression models As shown in Fig 6(A) the first loading factor (PLS1 2nd derivative pre-processing) of lignin content represents 82 of the data variance and PLS1 of reducing sugar represents 75 of the data variance The major fraction of the spectral variance influencing these models is found between 7200 and 5500 cm-1 where lignin xylan and acetyl groups of polysaccharides absorb As shown by highest negative amplitudes near 5980 cm-1 the spectral position is attributed to the C-H stretch 1st overtone of aromatic rings and the prediction of the lignin content is mainly based on this band But a high lignin content is also correlated with a low xylan content as indicated by the negative PLS loading vectors of lignin+polysaccharides bands near 5800 cm-1 the overlapping band of C-H stretch 1st overtone of lignin and acetyl groups (Lg+Xy Fig 6A) and the broad band of amorphous polysaccharides near 7000 cm-1 Bands assigned to crystalline II (6280 cm-1) and semi-crystalline (6722 cm-1) cellulose however exhibit positive loading vectors indicating high cellulose content of the samples with low lignin content and vice versa It is known that lignin degradation of lignocellulosic substrates leads to better accessible and enzymatically hydrolysable polysaccharides and thus to a higher yield of reducing sugars In fact these two parameters showed a high negative correlation of R = -08 in the data set analysed here (Table 4) This correlation was also found in the first loading spectrum of the model for reducing sugars which is very much alike that of the lignin model but shows the opposite algebraic sign
The correlation matrix (Table 4) shows the low correlation of total solids with all other parameters determined Consequently PLS-loading spectra (Fig 6(B)) were not directly connected to the content of the straw constituents Nevertheless most of the data variance (62) was explained by the second and third PLS loading factor (PLS2 and PLS3 2nd derivative pre-processing) and the regression model showed good predictable results for total solid content (Table 3 and Fig 5(A))
For the PLS loading spectra (2nd derivative pre-processing) of volatile solids (Fig 6(C)) which is the content of combustible organic materials PLS1 and PLS3 contributed mostly to the PLS model In the PLS1 loading spectrum lignin and xylan overlapping band (Lg+Xy) showed the highest influence on the model Amorphous polysaccharides (Am) near 7000 cm-1 and lignin-polysaccharide overlapping band near 5800 cm-1 (Lg+Ps) also appeared A high content of volatile solids was predicted from pretreated straw sample which contained low lignin and xylan (Lg+Xy) content as well as lignin and polysaccharide overlapping (Lg+Ps) but high amount of crystalline (Cry II) semi-crystalline (Sc) and amorphous (Am) cellulose indicating the extraction of inorganic compounds during the pre-treatment
PEER-REVIEWED ARTICLE bioresourcescom
Krongtaew et al (2010) ldquoPart 2 Quantitative NIRrdquo BioResources 5(4) 2081-2096 2093
Fig 6 PLS loading spectra of partial least-squares regression models (A) lignin content and amount of reducing sugar (B) total solids (C) volatile solids and (D) biogas yield
PEER-REVIEWED ARTICLE bioresourcescom
Krongtaew et al (2010) ldquoPart 2 Quantitative NIRrdquo BioResources 5(4) 2081-2096 2094
The first PLS factor of PLS regression models (minimummaximum normaliza-tion pre-processing) of biogas accounted for only 1 of the data variance therefore the second PLS factors is discussed here (Fig 6(D)) PLS2 represented 31 of the data variance and showed the importance of amorphous (Am) polysaccharides for a high biogas yield Crystalline cellulose (Cry II) however had an adverse effect as indicated by a negative loading vector of PLS2 in the respective region In summary it can be seen from the PLS loading spectra that lignin xylan and both amorphous and crystalline moieties of cellulose were representative onto the PLS model for evaluating biogas yield based on straw chemical structure after different severities of various physico-chemical pre-treatment methods Thus biogas potential of physico-chemically pretreated straw can be predicted based on the chemical characteristics and composition by FT-NIR assisted by multivariate data analysis
CONCLUSIONS
Fourier transform near-infrared (FT-NIR) spectroscopy combined with multi-variate data analyses has potential as an analytical tool for not only qualitative characterization of lignocellulose after different pre-treatment methods through the vibration bands of FT-NIR spectra (Krongtaew et al 2010) but also quantitative assessment for key parameters of both pre-treatment and biomass-to-bioenergy production Total residual lignin content enzymatically released reducing sugars total solids (TS) volatile solids (VS) and biogas yield can be analysed This approach can be considered as an alternative process analytical technology (PAT) for assessment of biomass utilization and biomass-to-biogas production offering a powerful and low-budget technique for rapidly growing and bulk volume industries
Furthermore the descriptive information in the loading vectors confirmed the importance of delignification for successful enzymatic and microbial conversion of the structural polysaccharides as well as the adverse effect of high cellulose crystallinity ACKNOWLEDGEMENTS
The authors are grateful to the financial support from the Austrian Research Promotion Agency (FFG project number 81954914233SCKSAI) KF acknowledges the support of FWF the Austrian Science Fund (FWF project number V117-N17) REFERENCES CITED Ahring B K and Westermann P (2007) ldquoCoproduction of bioethanol with other
biofuelsrdquo Adv Biochem EnginBiotechnol 108 289-302 Angelidaki I Ellegaard L and Ahring B K (1992) ldquoCompact automated
displacement gas metering system for measurement of low gas rates from laboratory fermentorsrdquo Biotechnol Bioeng 39 351-353
PEER-REVIEWED ARTICLE bioresourcescom
Krongtaew et al (2010) ldquoPart 2 Quantitative NIRrdquo BioResources 5(4) 2081-2096 2095
Buswell A M and Mueller H F (1952) ldquoMechanism of methane fermentationrdquo Ind Engin Chem 44(3) 550-552
Chandra R P Bura R Mabee W Pan X Berlin A and Saddler J N (2007) ldquoSubstrate pretreatment The key to effective enzymatic hydrolysis of lignocellulosicsrdquo Adv Biochem EnginBiotechnol 108 67-93
Energy Efficiency amp Renewable Energy US Department of Energy (2009) lthttpwww1eereenergygovbiomassanalytical_procedureshtmlgt viewed in September 2009
Fackler K Schmutzer M Manoch L Schwanninger M Hinterstoisser B Ters T Messner K and Gradinger C (2007a) ldquoEvaluation of the selectivity of white rot isolates using near infrared spectroscopic techniquesrdquo Enzyme Microb Technol 41 881-887
Fackler K Schwanninger M Gradinger C Hinterstoisser B and Messner K (2007b) ldquoQualitative and quantitative changes of beech wood degraded by wood-rotting basidiomycetes monitored by Fourier transform infrared spectroscopic methods and multivariate data analysisrdquo FEMS Microbiol Lett 271(2) 162-169
Ghosh S and Rodgers J (2001) ldquoNIR analysis of textilesrdquo In Burns D A and Ciurczak E W (eds) Handbook of Near-Infrared Analysis 2nd Ed Marcel Dekker Inc New York 573-607
Himmel M E Ding S Y Johnson D K Adney W S Numlos M R Brady J W and Foust T D (2007) ldquoBiomass recalcitrance Engineering plants and enzymes for biofuels productionrdquo Science 315 804-807
Holm-Nielsen J B Dahl C K and Esbensen K H (2006) ldquoRepresentative sampling for process analytical characterization of heterogeneous bioslurry systemsmdasha reference study of sampling issues in PATrdquo Chemom Intell Lab Syst 83 114-126
Holm-Nielsen J B Andree H Lindorfer H and Esbensen K H (2007) ldquoTransflexive embedded near infrared monitoring for key process intermediates in anaerobic digestionbiogas productionrdquo J Near Infrared Spectrosc 15 123-135
Kaparaju P Serrano M Thomsen A B Kongjan P and Angelidaki I (2009) ldquoBioethanol biohydrogen and biogas production from wheat straw in a biorefinery conceptrdquo Biores Technol 100 2562-2568
Kong X Xie J Wu Y Huang Y and Bao J (2005) ldquoRapid prediction of acid detergent fiber neutral detergent fiber and acid detergent lignin of rice materials by near-infrared spectroscopyrdquo J Agric Food Chem 53 2843-2848
Krongtaew C Messner K Ters T and Fackler K (2010) ldquoCharacterization of key parameters for biotechnological lignocellulose conversion assessed by FT-NIR spectroscopy Part I Qualitative analysis of pretreated strawrdquo BioResources 5(4) 2063-2080
Kumar P Barrett D M Delwiche M J and Stroeve P (2009) ldquoMethods for pretreatment of lignocellulosic biomass for efficient hydrolysis and biofuel productionrdquo Ind Eng Chem Res 48 3713-3729
Ozaki Y McClure W F and Christy A A (2007) Near Infrared Spectroscopy in Food Science and Technology Wiley Interscience New Jersey
Savitzky A and Golay M J E (1964) ldquoSmoothing and differentiation of data by simplified least squares proceduresrdquo Anal Chem 36(8) 1627-1639
PEER-REVIEWED ARTICLE bioresourcescom
Krongtaew et al (2010) ldquoPart 2 Quantitative NIRrdquo BioResources 5(4) 2081-2096 2096
Shenk J S Workman J J and Westerhaus M O (2001) ldquoApplication of NIR spectroscopy to agricultural productsrdquo In Burns D A and Ciurczak E W (eds) Handbook of Near-Infrared Analysis 2nd Ed Marcel Dekker Inc New York 419-474
Siesler H W Ozaki Y Kawata S and Heise H M (2002) Near Infrared Spectroscopy Principles Instruments and Applications Wiley VCH Germany
Tsuchikawa S and Siesler H W (2003a) ldquoNear-infrared spectroscopic monitoring of the diffusion process of deuterium-labeled molecules in wood Part II Hardwoodrdquo Appl Spectrosc 57 675-681
Tsuchikawa S and Siesler H W (2003b) ldquoNear-infrared spectroscopic monitoring of the diffusion process of deuterium-labeled molecules in wood Part I Softwoodrdquo Appl Spectrosc 57 667-674
Tsuchikawa S Yonenobu H and Siesler H W (2005) ldquoNear-infrared spectroscopic observation of the ageing process in archaeological wood using a deuterium exchange methodrdquo Analyst 130 379-384
Watanabe A Morita S and Ozaki Y (2006) ldquoTemperature-dependent structural changes in hydrogen bonds in microcrystalline cellulose studied by infrared and near-infrared spectroscopy with perturbation-correlation moving-window two-dimensional correlation analysisrdquo Appl Spectrosc 60(6) 611-618
Wilkie A C Smith P H and Bordeaux F M (2004) ldquoAn economical bioreactor for evaluating biogas potential of particulate biomassrdquo Biores Technol 92 103-109
Yu C H (2003) ldquoResampling methods Concepts applications and justificationrdquo Practical Assessment Research amp Evaluation 8(19) Retrieved July 31 2010 from httpPAREonlinenetgetvnaspv=8ampn=19
Article submitted June 22 2010 Peer review completed July 18 2010 Revised version received and accepted August 5 2010 Published August 6 2010
PEER-REVIEWED ARTICLE bioresourcescom
Krongtaew et al (2010) ldquoPart 2 Quantitative NIRrdquo BioResources 5(4) 2081-2096 2082
chemical syntheses Lignin removal hemicellulose depolymerisation and solubilization swelling of the fibre structure decrease of cellulose crystallinity etc may be results of the pre-treatment (Kumar et al 2009)
To assess the properties of pretreated lignocellulosic materials a number of wet-laboratory methods have been proposed and standardized (Energy Efficiency amp Renewable Energy US Department of Energy 2009) These mostly destructive methods are costly time-consuming and tiresome Alternatively Fourier transform near-infrared spectroscopy (FT-NIR) which is a simple powerful and sensitive non-destructive tool can provide the information of chemical and physical properties of lignocelluloses and other food and agricultural products (Ghosh and Rodgers 2001 Shenk et al 2001 Siesler et al 2002 Ozaki et al 2007) NIR absorption bands are derived from the overtones and combinations of ie C-H N-H O-H and C=O vibrations By this spectroscopic means not only the chemical structure modification but also the physical and morphological changes of organic substances can be characterised Combined with multivariate data analyses a number of studies on quantitative analyses of lignocelluloses and cereals composition by means of NIR spectroscopy have been reported (Kong et al 2005 Fackler et al 2007ab) Partial least-square (PLS) regression is an efficient mathematical tool revealing the quantitative information of the spectral data Recently many distinct NIR bands of lignocellulose materials have been assigned (Tsuchikawa and Siesler 2003a Tsuchikawa and Siesler 2003b Tsuchikawa et al 2005 Watanabe et al 2006 Mitsui et al 2008) providing more descriptive explanatory details for understanding the multivariate regression models In the first part of the study (Krongtaew et al 2010) FT-NIR spectra of 80 pretreated wheat straw samples and 53 pretreated oat straw samples were discussed qualitatively using multivariate tools of data analysis (principal component analysis) In this second part of the study the same FT-NIR spectra were used to assess the lignin content reducing sugar and weight loss of the pretreated samples analysed quantitatively using partial least-squares (PLS) regression This work has shown the powerful assessment of key parameters for biotechnological conversion of biomass particularly biogas yield based on characteristics of pretreated lignocelluloses which have not been mentioned before EXPERIMENTAL Materials
Wheat straw (Triticum aestivum L) and oat straw (Avena sativa L) were obtained from Wirtschaftsbetriebe Herbert Rauch Houmlpfner Vienna Austria from the 2005 harvest Wheat straw contained 63 polysaccharides 215 lignin 114 extractives and 42 ash while oat straw contained 51 polysaccharides 196 lignin 205 extractives and 89 ash These data were from wet-chemistry analyses All chemicals for pre-treatment and analytical assays were pa grade and purchased from Sigma-Aldrich (wwwsigmaaldrichcom) Digested sludge for anaerobic digestion was kindly contributed from the wastewater treatment plant in Schwechat Austria and cattle manure
PEER-REVIEWED ARTICLE bioresourcescom
Krongtaew et al (2010) ldquoPart 2 Quantitative NIRrdquo BioResources 5(4) 2081-2096 2083
was kindly provided by the Teufel farm in Zipf and the Gradinger farm in MuumlhlheimInn Upper Austria Methods Pre-treatment of straw
Wheat and oat straw were chopped to 1-cm length 20 g dry straw was treated in 200 mL solution (solid-to-liquid ratio of 110) at different concentrations of acid acidH2O2 alkali and alkaliH2O2 The initial pH of pre-treatment in acidic (pH 25 to 45) and alkaline (pH 9 to 12) conditions was adjusted by concentrated sulphuric acid (gt 95) and 1 molL-1 sodium hydroxide respectively Some pre-treatments were carried out in the presence of different amounts of hydrogen peroxide (2 to 10 ww based on dry straw) The pre-treatment was carried out for 4 h in a water bath at different temperatures varied from room temperature (25degC) to 90degC After pre-treatment straw was washed with 1 L distilled water and dried for at least 24 h at 50degC for analyses This moderate temperature was used in order to prevent chemical modifications of pretreated straw during drying which might influence FT-NIR spectra Enzyme hydrolysis of treated straw samples
Prior to hydrolysis crude Viscozym L (wwwnovozymescom) was purified by Econo-Pac 10DG column (wwwbio-radcom) using water as eluent to eliminate low molecular weight compounds like sugars and salts Afterwards 100 mg straw (dry basis at 50degC) was hydrolysed in enzyme solution containing 1 mL purified Viscozym L and 9 mL 30 mmolL-1 sodium-acetate buffer pH 40 The enzyme hydrolysis was performed at 40degC for 48 h and subsequently 1 mL of supernatant was centrifuged and analysed for reducing sugar content Inoculum seed preparation and biogas potential test
To get the equal quality of inoculum for the biogas potential test inoculum seed was prepared in 2-L semi-continuously stirred tank reactor (CSTR) system as illustrated in Fig 1 To the 2-L final volume 800 mL raw sludge and 200 g cow manure 200 mL nutrient solution (003 gL-1 NH4Cl 02 gL-1 K2HPO4 005 gL-1 MgSO47H2O and 001 gL-1 yeast extract) and tap water were added The initial pH was adjusted to 72 and maintained during the digestion by adding 1 molL-1 NaOH The temperature for anaerobic digestion was controlled at 37degC and 2 gVS L-1d-1 of organic loading rate of wheat straw (2 mm particles) was fed daily Biogas generated was measured by compact automated displacement gas metering system (Angelidaki et al 1992) The digestion was carried out until the system reached the steady state condition as indicated by 1) constant biogas production 2) constant substance concentration (volatile fatty acid and alkalinity) and 3) constant destruction of straw (total solid and volatile solid removals) Then the sludge mixture was ready to use as inoculum seed for the biogas potential test in batch fermenter For the batch biogas potential test 1 g pretreated straw (oven dry basis) and 150 mL inoculum seed from the CSTR system was added into a 500-mL Erlenmeyer flask The anaerobic digestion started at 37degC after flushing the head space with nitrogen gas The mixture was shaken twice daily Accumulative biogas generation was recorded by a
PEER-REVIEWED ARTICLE bioresourcescom
Krongtaew et al (2010) ldquoPart 2 Quantitative NIRrdquo BioResources 5(4) 2081-2096 2084
liquid displacement method using acidified water (12 molL-1 hydrochloric acid for pH 2-3) to prevent solubilization of CO2 (Wilkie et al 2004) Total solids and volatile solids removals of sludge mixture were determined after the gas generation ceased Biogas yield referred to accumulative biogas volume divided by straw dry weight (mL biogas g-1 straw)
Fig 1 Semi-continuous anaerobic digestion for inoculum seed preparation (1) 3-liter continuously stirred tank reactor (CSTR) (2) water coil (3) weight balance (4) motor for stirrer (5) temperature controlled water bath (6) continuous gas collecting column (7) counting device (8) gas release valve (9) gastight tube (10) syringe for feeding substrate (11) airtight valve (12) effluent tube (13) liquid pump and (14) effluent flask Analyses
Weight loss of pretreated straw was determined after drying at 50degC for 24 h Reducing sugars in supernatant after enzyme hydrolysis were determined by a modified dinitrosalicylic (DNS) acid method Reducing sugar yield (mg sugar g-1 pretreated straw) was calculated based on glucose equivalent from the calibration curve As the method does not differentiate between reducing end groups of pentoses and hexoses the pentoses was overestimated (factor = 12) Dry straw samples were then milled to 80 microm particles using the ultra-centrifugal mill (Retsch ZM 1000 Germany) for analyses of extractives Klason lignin acid-soluble lignin and FT-NIR spectroscopy Total solids and volatile solids content were also monitored for pretreated samples stored at the same relative humidity and temperature The procedures were reported elsewhere (Krongtaew et al 2010)
PEER-REVIEWED ARTICLE bioresourcescom
Krongtaew et al (2010) ldquoPart 2 Quantitative NIRrdquo BioResources 5(4) 2081-2096 2085
Fourier transform near-infrared (FT-NIR) spectroscopy FT-NIR spectroscopy of milled samples (80 microm particles) was carried out in
terms of apparent absorbance log [1Reflectance] by FT-NIR spectrometer using a fiber-optic probe (Equinox 55 Bruker Optics Inc Germany) Spectroscopy was performed with 8 cm-1 resolution 100 scans (60 seconds) and wave numbers ranging from 10000 to 4000 cm-1 The average spectra of 4 replicates were calculated
Partial least-squares (PLS) regression models between FT-NIR spectra and the key parameters from straw pre-treatment namely total lignin content amount of reducing sugars and weight loss were set up by OPUS QUANT 2 version 60 (Bruker Germany) In some cases spectra were differentiated to second derivatives (17 smoothing points 2nd order polynomial fit using the Savitzky and Golay algorithm (1964)) or minimummaximum normalized in the respective spectral range (Tables 1 and 2) From 80 wheat straw samples and 53 oat straw samples half of the samples were chosen randomly for the calibration and the remaining samples were used as the test set to validate the models The validity of models was indicated by the determination coefficient of test samples (R2
test) and root mean square error of prediction (RMSEP) The ranges of wavenumber for setting up the PLS models of lignin content reducing sugar and weight loss were chosen using OPUS QUANT 2 Optimization The other ranges (7500 7200 ndash 5500 cm-1) covered 1st overtones of O-H and C-H stretching bands of water lignin and polysaccharides (Krongtaew et al 2010) The PLS models of total solid volatile solids and biogas yield the crucial parameters for anaerobic fermentation were calculated from the alternate sample set (42 wheat straw samples) Due to the smaller number of samples leave-one-out cross validation was performed RESULTS AND DISCUSSION FT-NIR spectra
In Fig 2 pre-processed FT-NIR spectra are shown in the spectral region used for the regression models As illustrated in Fig 2(B) and 2(C) 2nd derivative FT-NIR spectra of straw samples after different severities of physico-chemical pre-treatment show significant changes in the range between 7200 and 5500 cm-1 This spectral region is attributed to CH stretch 1st overtone vibration of the aromatic lignin structure which is overlapped with CH stretch 1st overtone vibration band of acetyl groups (CH3) of hemicelluloses mainly xylan in straw (Shenk et al 2001 Fackler et al 2007b Tsuchikawa et al 2005) Moreover modification of FT-NIR spectra ranging from 7200 to 6000 cm-1 attributed to alteration of OH stretch 1st overtone of amorphous semi-crystalline and crystalline cellulose (Tsuchikawa and Siesler 2003a Tsuchikawa and Siesler 2003b Watanabe et al 2006) were also observed after physico-chemical pre-treatment Qualitative changes in FT-NIR spectra after lignin degradation as well as degradation or deacetylation of polysaccharides were described in detail in the preceding article (Krongtaew et al 2010)
During the physico-chemical pre-treatment lignin and hemicelluloses were solubilized and the crystalline structure of the substrate was substantially changed These changes were reflected in the FT-NIR absorbance PLS regression models of FT-NIR
PEER-REVIEWED ARTICLE bioresourcescom
Krongtaew et al (2010) ldquoPart 2 Quantitative NIRrdquo BioResources 5(4) 2081-2096 2086
spectra between 6900 and 5510 cm-1 were set up for predicting total residual lignin content and the amount of hydrolysable reducing sugars of pretreated straw samples (Table 1) This spectral region includes a lignin band near 5980 cm-1 and xylan bands near 5800 5960 5990 cm-1 (Krongtaew et al 2010) as well as information on cellulose crystallinity (Fig 2(B)) A further PLS model was calculated from the entire FT-NIR spectra ranging from 10000 to 4000 cm-1 to estimate the weight loss after pre-treatment (Table 1) Weight loss leads to loss of NIR absorption of C-H O-H N-H and C=O vibration bands of organic substances (Fig 2(A)) Table 1 Parameters and Errors from Partial Least-Squares (PLS) Regression Models of Total Residual Lignin Reducing Sugar and Weight Loss of Delignified Wheat and Oat Straw Models Substrate Component
range No of samples No of test samples
Spectral region (cm-1)
Spectral pre-processing
Total residual lignin (ww)
Wheat straw Oat straw
79 - 207 83 - 185
80 40 53 27
6900- 5510 6900- 5510
2nd derivative 2nd derivative
Reducing sugars (mg g-1- straw)
Wheat straw Oat straw
128 - 1000 131 -812
80 40 53 27
6900- 5510 6900- 5510
2nd derivative 2nd derivative
Weight loss () Wheat straw Oat straw
40 - 335 50 - 440
80 40 53 27
10000-4000 10000-4000
No processing No processing
Models Substrate 1R2
cal 2RMSEE 3R2
test 4RMSEP No of
PLS Factors
Total residual lignin (ww)
Wheat straw Oat straw
095 099
09 05
094 096
09 08
3 1
Reducing sugars (mg g-1- straw)
Wheat straw Oat straw
094 096
45 mg g-1 54 mg g-1
089 093
83 mg g-1 64 mg g-1
4 1
Weight loss () Wheat straw Oat straw
085 096
29 26
075 091
35 34
4 4
1 Coefficient of determination of the calibration model 2 Root-mean-square error of estimation
3 Coefficient of determination of the test model 4 Root-mean-square error of prediction for future analysis
Lignin content amount of reducing sugars and the weight loss of oat straw of the pretreated samples were accurately evaluated from FT-NIR spectra by means of PLS regression (Table 1 and Fig 3) Good correlations between NIR-predicted and measured values were obtained for calibration and test sets as indicated by high values of the determination coefficients (Rsup2cal and R2
test) and low root-mean-square error of estimation and prediction (RMSEE and RMSEP) These model parameters and the low number of factors required to obtain this high correlation are good indications for the robustness and applicability of the regression models
PEER-REVIEWED ARTICLE bioresourcescom
Krongtaew et al (2010) ldquoPart 2 Quantitative NIRrdquo BioResources 5(4) 2081-2096 2087
Fig 2 FT-NIR spectra of wheat straw (A) and second derivative of FT-NIR spectra of pretreated wheat (B) and oat straw (C) samples containing different residual lignin contents
PEER-REVIEWED ARTICLE bioresourcescom
Krongtaew et al (2010) ldquoPart 2 Quantitative NIRrdquo BioResources 5(4) 2081-2096 2088
Fig 3 NIR-predicted and measured values of the PLS regression models of total residual lignin content (A D) reducing sugars (B E) and weight loss (C F) of calibration and test samples of pretreated wheat (WS) and oat straw (OS) samples The re-sampling method was applied for the models to ensure the reliability of all the PLS models as they were limited by a smaller number of observations when dividing the sample into two halves for calibration and test sets (Yu 2003) Ranges of R2
test RMSEP and number of PLS factors of ten different calibration and test sets demon-strated consistent and reliable results as shown in Table 2 The results showed the robustness and validity of the models for predicting total residual lignin reducing sugar and weight loss of physic-chemically pretreated wheat and oat straw samples Table 2 Re-Sampled Models of Ten Different Sub-Sample Sets for PLS Models of Total Residual Lignin Reducing Sugar and Weight Loss
Models Substrate Spectral region (cm-1)
Spectral pre-processing
1R2test 2RMSEP No of
PLS Factors
Total residual lignin (ww)
Wheat straw Oat straw
6900 ndash 5510 6900 ndash 5510
2nd derivative 2nd derivative
092-095 095-098
08-10 06-08
3 2-3
Reducing sugars (mg g-1 straw)
Wheat straw Oat straw
6900 ndash 5510 6900 ndash 5510
2nd derivative 2nd derivative
082-092 092-096
53-96 mg g-1 45-65 mg g-1
3-4 1-3
Weight loss () Wheat straw Oat straw
10000 ndash 4000 10000 ndash 4000
No processing No processing
065-073 084-093
33-41 24-39
3-4 4-5
1 Coefficient of determination of the test model 2 Root-mean-square error of prediction for future analysis
PEER-REVIEWED ARTICLE bioresourcescom
Krongtaew et al (2010) ldquoPart 2 Quantitative NIRrdquo BioResources 5(4) 2081-2096 2089
Assessment of Wheat Straw-to-Biogas Conversion by FT-NIR To optimize the PLS models for total solid content volatile solid content and
biogas yield some outliers were excluded from the 42 original samples thus the numbers of samples were different from those shown in Table 3 Although Rsup2cv of those cross-validated PLS models for total solid volatile solid and biogas yield were not as high as for those described above (Table 3 and Fig 5) the current models deliver a good estimation of these parameters Furthermore the much higher Rsup2cal the low number of PLS factors and the low bias of these models indicate the high potential of the FT-NIR method also to analyse these parameters
Table 3 PLS Regression Models from FT-NIR Spectral Data of Pretreated Wheat Straw Parameters Total solids Volatile solids Biogas Wave number [cm-1] Component range Spectral processing No of samples No of PLS factors
7200 - 5500 936-997 Second derivative 32 5
7200 - 5500 945-992 Second derivative 38 5
7500 - 5500 219-387 mL g-1 straw Min-Max normalization 30 5
Calibration R2
cal
RMSEE1
091 07
091 03
077 21 mL g-1 straw
Cross validation R2
cv RMSECV2
Bias
080 09 -005
075 05 003
065 23 mL g-1 straw 073
1 Root mean square error of estimation 2 Root mean square error of cross validation
An acceptable prediction of biogas yield was obtained (R2
cv = 065) from pretreated straw spectra when the consistency of inoculum seed quality and digestion condition were controlled Thus the analytical technology using the implementation of FT-NIR spectroscopy in the combination of mathematically spectral data processing could be applied to the entire system of biomass-to-bioenergy processes Biogas yield was well correlated to the amount of fermentable sugars available as carbon source for anaerobic digestion and also to the lignin content of the pretreated straw (Table 4) It was additionally observed that the yield of anaerobic digestion was influenced by the particle size of wheat straw (80 microm and 2 mm) (Fig 4) Pretreated straw with smaller particles (80 microm) gave higher biogas yields compared with larger particles (2 mm) while lignin content and the amount of reducing sugars of the same samples from wet-chemistry analyses were at the same levels The reason is most likely due to better accessibility of microbial enzymes toward the smaller particle size of straw Moreover the coefficient of correlation (R) between lignin and biogas as well as reducing sugar and biogas (Fig 4(A) 4(B)) were higher when determined among the same sets of particle size compared with those from all samples (Table 4) The PLS model however included all particle sizes
PEER-REVIEWED ARTICLE bioresourcescom
Krongtaew et al (2010) ldquoPart 2 Quantitative NIRrdquo BioResources 5(4) 2081-2096 2090
Table 4 Correlation Matrix of Key Parameters for Biomass-to-Biogas Conversion of Wheat Straw
Lignin Reducing sugars
Weight loss Total solid Volatile solid
Biogas
Lignin R=10
R=-08
R=-09
R=-02
R=-04
R=-06 Reducing sugars
-
R=10
R=08
R=01
R=02
R=06
Weight loss -
-
R=10
R=00
R=04
R=01
Total solid
-
-
-
R=10
R=-04
R=03
Volatile solid
-
-
-
-
R=10
R=-02
Biogas -
-
-
-
-
R=10
Fig 4 Correlation between total lignin and biogas (A) and enzymatically released reducing sugars and biogas (B) where diams and represent data from 80-microm and 2-mm straw samples respectively
PEER-REVIEWED ARTICLE bioresourcescom
Krongtaew et al (2010) ldquoPart 2 Quantitative NIRrdquo BioResources 5(4) 2081-2096 2091
Fig 5 NIR-predicted and measured values of (A) total solid (B) volatile solids and (C) biogas yield from the cross validation of PLS regression models of pretreated wheat straw Black solid indicates the outlier
A recent study demonstrated the prediction of biological methane potential based on a number of parameters - carbohydrates proteins lipids acetate and propionate concentration of a digested sludge mixture (Kaparaju et al 2009) Some scientific work also demonstrated the potential application of NIR for predicting volatile solids total solids chemical oxygen demand (COD) and several volatile fatty acids (VFA) of digested sludge from the biogas pilot plant the models relied mainly on different process constraints and were designed as analytical techniques for online-process control (Holm-Nielsen et al 2006 2007) The present study in contrast demonstrates the assessment of biogas yield based on chemical structure and composition of the substrate by FT-NIR spectroscopy Biogas yield is based on the stoichiometric conversion of organic material to biogas as shown in equation (1) Volatile organic compounds in lignocelluloses are theoretically converted to methane (CH4) and carbon dioxide (CO2) which are collectively called biogas (Buswell and Mueller 1952) In most methanogenic fermentations the methane yield lies close to the theoretical maximum of 3 moles of methane per mole of glucose as calculated from the Buswell equation (1) (Ahring and Westermann 2007) Thus the theoretical methane yield of untreated wheat straw is approximately 105 mmol CH4 and 105 mmol CO2 per g straw as wheat straw contains 63 polysaccharides (glucose equivalence) These values were calculated to 2352 mL CH4 and 2352 mL CO2 as one mole of an ideal gas at STP occupies 224 L
242 48248224COcbaCHcbaOHcbaOHC cba ⎟⎠⎞
⎜⎝⎛ +minus+⎟
⎠⎞
⎜⎝⎛ minus+rarr⎟
⎠⎞
⎜⎝⎛ minusminus+ (1)
However due to the complex structure which is rather hard to attack lignocellulose leads to yields lower than this theoretical maximum The presence of organic recalcitrant compounds in straw eg lignin and crystalline cellulose influences the yield of anaerobic digestion These properties of the substrate are reflected in the FT-NIR spectra and can serve for the prediction of the potential biogas yield For instance it has been reported that some parts of the crystalline structure of cellulose are loosened and
PEER-REVIEWED ARTICLE bioresourcescom
Krongtaew et al (2010) ldquoPart 2 Quantitative NIRrdquo BioResources 5(4) 2081-2096 2092
converted to semi-crystalline structures after physico-chemical pre-treatment (Krongtaew et al 2010) This could lead to higher susceptibility of cellulose and provided higher biomass utilization efficiency PLS Loading Spectra
PLS loading spectra contain the descriptive information of FT-NIR absorption regions that influence the PLS regression models As shown in Fig 6(A) the first loading factor (PLS1 2nd derivative pre-processing) of lignin content represents 82 of the data variance and PLS1 of reducing sugar represents 75 of the data variance The major fraction of the spectral variance influencing these models is found between 7200 and 5500 cm-1 where lignin xylan and acetyl groups of polysaccharides absorb As shown by highest negative amplitudes near 5980 cm-1 the spectral position is attributed to the C-H stretch 1st overtone of aromatic rings and the prediction of the lignin content is mainly based on this band But a high lignin content is also correlated with a low xylan content as indicated by the negative PLS loading vectors of lignin+polysaccharides bands near 5800 cm-1 the overlapping band of C-H stretch 1st overtone of lignin and acetyl groups (Lg+Xy Fig 6A) and the broad band of amorphous polysaccharides near 7000 cm-1 Bands assigned to crystalline II (6280 cm-1) and semi-crystalline (6722 cm-1) cellulose however exhibit positive loading vectors indicating high cellulose content of the samples with low lignin content and vice versa It is known that lignin degradation of lignocellulosic substrates leads to better accessible and enzymatically hydrolysable polysaccharides and thus to a higher yield of reducing sugars In fact these two parameters showed a high negative correlation of R = -08 in the data set analysed here (Table 4) This correlation was also found in the first loading spectrum of the model for reducing sugars which is very much alike that of the lignin model but shows the opposite algebraic sign
The correlation matrix (Table 4) shows the low correlation of total solids with all other parameters determined Consequently PLS-loading spectra (Fig 6(B)) were not directly connected to the content of the straw constituents Nevertheless most of the data variance (62) was explained by the second and third PLS loading factor (PLS2 and PLS3 2nd derivative pre-processing) and the regression model showed good predictable results for total solid content (Table 3 and Fig 5(A))
For the PLS loading spectra (2nd derivative pre-processing) of volatile solids (Fig 6(C)) which is the content of combustible organic materials PLS1 and PLS3 contributed mostly to the PLS model In the PLS1 loading spectrum lignin and xylan overlapping band (Lg+Xy) showed the highest influence on the model Amorphous polysaccharides (Am) near 7000 cm-1 and lignin-polysaccharide overlapping band near 5800 cm-1 (Lg+Ps) also appeared A high content of volatile solids was predicted from pretreated straw sample which contained low lignin and xylan (Lg+Xy) content as well as lignin and polysaccharide overlapping (Lg+Ps) but high amount of crystalline (Cry II) semi-crystalline (Sc) and amorphous (Am) cellulose indicating the extraction of inorganic compounds during the pre-treatment
PEER-REVIEWED ARTICLE bioresourcescom
Krongtaew et al (2010) ldquoPart 2 Quantitative NIRrdquo BioResources 5(4) 2081-2096 2093
Fig 6 PLS loading spectra of partial least-squares regression models (A) lignin content and amount of reducing sugar (B) total solids (C) volatile solids and (D) biogas yield
PEER-REVIEWED ARTICLE bioresourcescom
Krongtaew et al (2010) ldquoPart 2 Quantitative NIRrdquo BioResources 5(4) 2081-2096 2094
The first PLS factor of PLS regression models (minimummaximum normaliza-tion pre-processing) of biogas accounted for only 1 of the data variance therefore the second PLS factors is discussed here (Fig 6(D)) PLS2 represented 31 of the data variance and showed the importance of amorphous (Am) polysaccharides for a high biogas yield Crystalline cellulose (Cry II) however had an adverse effect as indicated by a negative loading vector of PLS2 in the respective region In summary it can be seen from the PLS loading spectra that lignin xylan and both amorphous and crystalline moieties of cellulose were representative onto the PLS model for evaluating biogas yield based on straw chemical structure after different severities of various physico-chemical pre-treatment methods Thus biogas potential of physico-chemically pretreated straw can be predicted based on the chemical characteristics and composition by FT-NIR assisted by multivariate data analysis
CONCLUSIONS
Fourier transform near-infrared (FT-NIR) spectroscopy combined with multi-variate data analyses has potential as an analytical tool for not only qualitative characterization of lignocellulose after different pre-treatment methods through the vibration bands of FT-NIR spectra (Krongtaew et al 2010) but also quantitative assessment for key parameters of both pre-treatment and biomass-to-bioenergy production Total residual lignin content enzymatically released reducing sugars total solids (TS) volatile solids (VS) and biogas yield can be analysed This approach can be considered as an alternative process analytical technology (PAT) for assessment of biomass utilization and biomass-to-biogas production offering a powerful and low-budget technique for rapidly growing and bulk volume industries
Furthermore the descriptive information in the loading vectors confirmed the importance of delignification for successful enzymatic and microbial conversion of the structural polysaccharides as well as the adverse effect of high cellulose crystallinity ACKNOWLEDGEMENTS
The authors are grateful to the financial support from the Austrian Research Promotion Agency (FFG project number 81954914233SCKSAI) KF acknowledges the support of FWF the Austrian Science Fund (FWF project number V117-N17) REFERENCES CITED Ahring B K and Westermann P (2007) ldquoCoproduction of bioethanol with other
biofuelsrdquo Adv Biochem EnginBiotechnol 108 289-302 Angelidaki I Ellegaard L and Ahring B K (1992) ldquoCompact automated
displacement gas metering system for measurement of low gas rates from laboratory fermentorsrdquo Biotechnol Bioeng 39 351-353
PEER-REVIEWED ARTICLE bioresourcescom
Krongtaew et al (2010) ldquoPart 2 Quantitative NIRrdquo BioResources 5(4) 2081-2096 2095
Buswell A M and Mueller H F (1952) ldquoMechanism of methane fermentationrdquo Ind Engin Chem 44(3) 550-552
Chandra R P Bura R Mabee W Pan X Berlin A and Saddler J N (2007) ldquoSubstrate pretreatment The key to effective enzymatic hydrolysis of lignocellulosicsrdquo Adv Biochem EnginBiotechnol 108 67-93
Energy Efficiency amp Renewable Energy US Department of Energy (2009) lthttpwww1eereenergygovbiomassanalytical_procedureshtmlgt viewed in September 2009
Fackler K Schmutzer M Manoch L Schwanninger M Hinterstoisser B Ters T Messner K and Gradinger C (2007a) ldquoEvaluation of the selectivity of white rot isolates using near infrared spectroscopic techniquesrdquo Enzyme Microb Technol 41 881-887
Fackler K Schwanninger M Gradinger C Hinterstoisser B and Messner K (2007b) ldquoQualitative and quantitative changes of beech wood degraded by wood-rotting basidiomycetes monitored by Fourier transform infrared spectroscopic methods and multivariate data analysisrdquo FEMS Microbiol Lett 271(2) 162-169
Ghosh S and Rodgers J (2001) ldquoNIR analysis of textilesrdquo In Burns D A and Ciurczak E W (eds) Handbook of Near-Infrared Analysis 2nd Ed Marcel Dekker Inc New York 573-607
Himmel M E Ding S Y Johnson D K Adney W S Numlos M R Brady J W and Foust T D (2007) ldquoBiomass recalcitrance Engineering plants and enzymes for biofuels productionrdquo Science 315 804-807
Holm-Nielsen J B Dahl C K and Esbensen K H (2006) ldquoRepresentative sampling for process analytical characterization of heterogeneous bioslurry systemsmdasha reference study of sampling issues in PATrdquo Chemom Intell Lab Syst 83 114-126
Holm-Nielsen J B Andree H Lindorfer H and Esbensen K H (2007) ldquoTransflexive embedded near infrared monitoring for key process intermediates in anaerobic digestionbiogas productionrdquo J Near Infrared Spectrosc 15 123-135
Kaparaju P Serrano M Thomsen A B Kongjan P and Angelidaki I (2009) ldquoBioethanol biohydrogen and biogas production from wheat straw in a biorefinery conceptrdquo Biores Technol 100 2562-2568
Kong X Xie J Wu Y Huang Y and Bao J (2005) ldquoRapid prediction of acid detergent fiber neutral detergent fiber and acid detergent lignin of rice materials by near-infrared spectroscopyrdquo J Agric Food Chem 53 2843-2848
Krongtaew C Messner K Ters T and Fackler K (2010) ldquoCharacterization of key parameters for biotechnological lignocellulose conversion assessed by FT-NIR spectroscopy Part I Qualitative analysis of pretreated strawrdquo BioResources 5(4) 2063-2080
Kumar P Barrett D M Delwiche M J and Stroeve P (2009) ldquoMethods for pretreatment of lignocellulosic biomass for efficient hydrolysis and biofuel productionrdquo Ind Eng Chem Res 48 3713-3729
Ozaki Y McClure W F and Christy A A (2007) Near Infrared Spectroscopy in Food Science and Technology Wiley Interscience New Jersey
Savitzky A and Golay M J E (1964) ldquoSmoothing and differentiation of data by simplified least squares proceduresrdquo Anal Chem 36(8) 1627-1639
PEER-REVIEWED ARTICLE bioresourcescom
Krongtaew et al (2010) ldquoPart 2 Quantitative NIRrdquo BioResources 5(4) 2081-2096 2096
Shenk J S Workman J J and Westerhaus M O (2001) ldquoApplication of NIR spectroscopy to agricultural productsrdquo In Burns D A and Ciurczak E W (eds) Handbook of Near-Infrared Analysis 2nd Ed Marcel Dekker Inc New York 419-474
Siesler H W Ozaki Y Kawata S and Heise H M (2002) Near Infrared Spectroscopy Principles Instruments and Applications Wiley VCH Germany
Tsuchikawa S and Siesler H W (2003a) ldquoNear-infrared spectroscopic monitoring of the diffusion process of deuterium-labeled molecules in wood Part II Hardwoodrdquo Appl Spectrosc 57 675-681
Tsuchikawa S and Siesler H W (2003b) ldquoNear-infrared spectroscopic monitoring of the diffusion process of deuterium-labeled molecules in wood Part I Softwoodrdquo Appl Spectrosc 57 667-674
Tsuchikawa S Yonenobu H and Siesler H W (2005) ldquoNear-infrared spectroscopic observation of the ageing process in archaeological wood using a deuterium exchange methodrdquo Analyst 130 379-384
Watanabe A Morita S and Ozaki Y (2006) ldquoTemperature-dependent structural changes in hydrogen bonds in microcrystalline cellulose studied by infrared and near-infrared spectroscopy with perturbation-correlation moving-window two-dimensional correlation analysisrdquo Appl Spectrosc 60(6) 611-618
Wilkie A C Smith P H and Bordeaux F M (2004) ldquoAn economical bioreactor for evaluating biogas potential of particulate biomassrdquo Biores Technol 92 103-109
Yu C H (2003) ldquoResampling methods Concepts applications and justificationrdquo Practical Assessment Research amp Evaluation 8(19) Retrieved July 31 2010 from httpPAREonlinenetgetvnaspv=8ampn=19
Article submitted June 22 2010 Peer review completed July 18 2010 Revised version received and accepted August 5 2010 Published August 6 2010

PEER-REVIEWED ARTICLE bioresourcescom
Krongtaew et al (2010) ldquoPart 2 Quantitative NIRrdquo BioResources 5(4) 2081-2096 2083
was kindly provided by the Teufel farm in Zipf and the Gradinger farm in MuumlhlheimInn Upper Austria Methods Pre-treatment of straw
Wheat and oat straw were chopped to 1-cm length 20 g dry straw was treated in 200 mL solution (solid-to-liquid ratio of 110) at different concentrations of acid acidH2O2 alkali and alkaliH2O2 The initial pH of pre-treatment in acidic (pH 25 to 45) and alkaline (pH 9 to 12) conditions was adjusted by concentrated sulphuric acid (gt 95) and 1 molL-1 sodium hydroxide respectively Some pre-treatments were carried out in the presence of different amounts of hydrogen peroxide (2 to 10 ww based on dry straw) The pre-treatment was carried out for 4 h in a water bath at different temperatures varied from room temperature (25degC) to 90degC After pre-treatment straw was washed with 1 L distilled water and dried for at least 24 h at 50degC for analyses This moderate temperature was used in order to prevent chemical modifications of pretreated straw during drying which might influence FT-NIR spectra Enzyme hydrolysis of treated straw samples
Prior to hydrolysis crude Viscozym L (wwwnovozymescom) was purified by Econo-Pac 10DG column (wwwbio-radcom) using water as eluent to eliminate low molecular weight compounds like sugars and salts Afterwards 100 mg straw (dry basis at 50degC) was hydrolysed in enzyme solution containing 1 mL purified Viscozym L and 9 mL 30 mmolL-1 sodium-acetate buffer pH 40 The enzyme hydrolysis was performed at 40degC for 48 h and subsequently 1 mL of supernatant was centrifuged and analysed for reducing sugar content Inoculum seed preparation and biogas potential test
To get the equal quality of inoculum for the biogas potential test inoculum seed was prepared in 2-L semi-continuously stirred tank reactor (CSTR) system as illustrated in Fig 1 To the 2-L final volume 800 mL raw sludge and 200 g cow manure 200 mL nutrient solution (003 gL-1 NH4Cl 02 gL-1 K2HPO4 005 gL-1 MgSO47H2O and 001 gL-1 yeast extract) and tap water were added The initial pH was adjusted to 72 and maintained during the digestion by adding 1 molL-1 NaOH The temperature for anaerobic digestion was controlled at 37degC and 2 gVS L-1d-1 of organic loading rate of wheat straw (2 mm particles) was fed daily Biogas generated was measured by compact automated displacement gas metering system (Angelidaki et al 1992) The digestion was carried out until the system reached the steady state condition as indicated by 1) constant biogas production 2) constant substance concentration (volatile fatty acid and alkalinity) and 3) constant destruction of straw (total solid and volatile solid removals) Then the sludge mixture was ready to use as inoculum seed for the biogas potential test in batch fermenter For the batch biogas potential test 1 g pretreated straw (oven dry basis) and 150 mL inoculum seed from the CSTR system was added into a 500-mL Erlenmeyer flask The anaerobic digestion started at 37degC after flushing the head space with nitrogen gas The mixture was shaken twice daily Accumulative biogas generation was recorded by a
PEER-REVIEWED ARTICLE bioresourcescom
Krongtaew et al (2010) ldquoPart 2 Quantitative NIRrdquo BioResources 5(4) 2081-2096 2084
liquid displacement method using acidified water (12 molL-1 hydrochloric acid for pH 2-3) to prevent solubilization of CO2 (Wilkie et al 2004) Total solids and volatile solids removals of sludge mixture were determined after the gas generation ceased Biogas yield referred to accumulative biogas volume divided by straw dry weight (mL biogas g-1 straw)
Fig 1 Semi-continuous anaerobic digestion for inoculum seed preparation (1) 3-liter continuously stirred tank reactor (CSTR) (2) water coil (3) weight balance (4) motor for stirrer (5) temperature controlled water bath (6) continuous gas collecting column (7) counting device (8) gas release valve (9) gastight tube (10) syringe for feeding substrate (11) airtight valve (12) effluent tube (13) liquid pump and (14) effluent flask Analyses
Weight loss of pretreated straw was determined after drying at 50degC for 24 h Reducing sugars in supernatant after enzyme hydrolysis were determined by a modified dinitrosalicylic (DNS) acid method Reducing sugar yield (mg sugar g-1 pretreated straw) was calculated based on glucose equivalent from the calibration curve As the method does not differentiate between reducing end groups of pentoses and hexoses the pentoses was overestimated (factor = 12) Dry straw samples were then milled to 80 microm particles using the ultra-centrifugal mill (Retsch ZM 1000 Germany) for analyses of extractives Klason lignin acid-soluble lignin and FT-NIR spectroscopy Total solids and volatile solids content were also monitored for pretreated samples stored at the same relative humidity and temperature The procedures were reported elsewhere (Krongtaew et al 2010)
PEER-REVIEWED ARTICLE bioresourcescom
Krongtaew et al (2010) ldquoPart 2 Quantitative NIRrdquo BioResources 5(4) 2081-2096 2085
Fourier transform near-infrared (FT-NIR) spectroscopy FT-NIR spectroscopy of milled samples (80 microm particles) was carried out in
terms of apparent absorbance log [1Reflectance] by FT-NIR spectrometer using a fiber-optic probe (Equinox 55 Bruker Optics Inc Germany) Spectroscopy was performed with 8 cm-1 resolution 100 scans (60 seconds) and wave numbers ranging from 10000 to 4000 cm-1 The average spectra of 4 replicates were calculated
Partial least-squares (PLS) regression models between FT-NIR spectra and the key parameters from straw pre-treatment namely total lignin content amount of reducing sugars and weight loss were set up by OPUS QUANT 2 version 60 (Bruker Germany) In some cases spectra were differentiated to second derivatives (17 smoothing points 2nd order polynomial fit using the Savitzky and Golay algorithm (1964)) or minimummaximum normalized in the respective spectral range (Tables 1 and 2) From 80 wheat straw samples and 53 oat straw samples half of the samples were chosen randomly for the calibration and the remaining samples were used as the test set to validate the models The validity of models was indicated by the determination coefficient of test samples (R2
test) and root mean square error of prediction (RMSEP) The ranges of wavenumber for setting up the PLS models of lignin content reducing sugar and weight loss were chosen using OPUS QUANT 2 Optimization The other ranges (7500 7200 ndash 5500 cm-1) covered 1st overtones of O-H and C-H stretching bands of water lignin and polysaccharides (Krongtaew et al 2010) The PLS models of total solid volatile solids and biogas yield the crucial parameters for anaerobic fermentation were calculated from the alternate sample set (42 wheat straw samples) Due to the smaller number of samples leave-one-out cross validation was performed RESULTS AND DISCUSSION FT-NIR spectra
In Fig 2 pre-processed FT-NIR spectra are shown in the spectral region used for the regression models As illustrated in Fig 2(B) and 2(C) 2nd derivative FT-NIR spectra of straw samples after different severities of physico-chemical pre-treatment show significant changes in the range between 7200 and 5500 cm-1 This spectral region is attributed to CH stretch 1st overtone vibration of the aromatic lignin structure which is overlapped with CH stretch 1st overtone vibration band of acetyl groups (CH3) of hemicelluloses mainly xylan in straw (Shenk et al 2001 Fackler et al 2007b Tsuchikawa et al 2005) Moreover modification of FT-NIR spectra ranging from 7200 to 6000 cm-1 attributed to alteration of OH stretch 1st overtone of amorphous semi-crystalline and crystalline cellulose (Tsuchikawa and Siesler 2003a Tsuchikawa and Siesler 2003b Watanabe et al 2006) were also observed after physico-chemical pre-treatment Qualitative changes in FT-NIR spectra after lignin degradation as well as degradation or deacetylation of polysaccharides were described in detail in the preceding article (Krongtaew et al 2010)
During the physico-chemical pre-treatment lignin and hemicelluloses were solubilized and the crystalline structure of the substrate was substantially changed These changes were reflected in the FT-NIR absorbance PLS regression models of FT-NIR
PEER-REVIEWED ARTICLE bioresourcescom
Krongtaew et al (2010) ldquoPart 2 Quantitative NIRrdquo BioResources 5(4) 2081-2096 2086
spectra between 6900 and 5510 cm-1 were set up for predicting total residual lignin content and the amount of hydrolysable reducing sugars of pretreated straw samples (Table 1) This spectral region includes a lignin band near 5980 cm-1 and xylan bands near 5800 5960 5990 cm-1 (Krongtaew et al 2010) as well as information on cellulose crystallinity (Fig 2(B)) A further PLS model was calculated from the entire FT-NIR spectra ranging from 10000 to 4000 cm-1 to estimate the weight loss after pre-treatment (Table 1) Weight loss leads to loss of NIR absorption of C-H O-H N-H and C=O vibration bands of organic substances (Fig 2(A)) Table 1 Parameters and Errors from Partial Least-Squares (PLS) Regression Models of Total Residual Lignin Reducing Sugar and Weight Loss of Delignified Wheat and Oat Straw Models Substrate Component
range No of samples No of test samples
Spectral region (cm-1)
Spectral pre-processing
Total residual lignin (ww)
Wheat straw Oat straw
79 - 207 83 - 185
80 40 53 27
6900- 5510 6900- 5510
2nd derivative 2nd derivative
Reducing sugars (mg g-1- straw)
Wheat straw Oat straw
128 - 1000 131 -812
80 40 53 27
6900- 5510 6900- 5510
2nd derivative 2nd derivative
Weight loss () Wheat straw Oat straw
40 - 335 50 - 440
80 40 53 27
10000-4000 10000-4000
No processing No processing
Models Substrate 1R2
cal 2RMSEE 3R2
test 4RMSEP No of
PLS Factors
Total residual lignin (ww)
Wheat straw Oat straw
095 099
09 05
094 096
09 08
3 1
Reducing sugars (mg g-1- straw)
Wheat straw Oat straw
094 096
45 mg g-1 54 mg g-1
089 093
83 mg g-1 64 mg g-1
4 1
Weight loss () Wheat straw Oat straw
085 096
29 26
075 091
35 34
4 4
1 Coefficient of determination of the calibration model 2 Root-mean-square error of estimation
3 Coefficient of determination of the test model 4 Root-mean-square error of prediction for future analysis
Lignin content amount of reducing sugars and the weight loss of oat straw of the pretreated samples were accurately evaluated from FT-NIR spectra by means of PLS regression (Table 1 and Fig 3) Good correlations between NIR-predicted and measured values were obtained for calibration and test sets as indicated by high values of the determination coefficients (Rsup2cal and R2
test) and low root-mean-square error of estimation and prediction (RMSEE and RMSEP) These model parameters and the low number of factors required to obtain this high correlation are good indications for the robustness and applicability of the regression models
PEER-REVIEWED ARTICLE bioresourcescom
Krongtaew et al (2010) ldquoPart 2 Quantitative NIRrdquo BioResources 5(4) 2081-2096 2087
Fig 2 FT-NIR spectra of wheat straw (A) and second derivative of FT-NIR spectra of pretreated wheat (B) and oat straw (C) samples containing different residual lignin contents
PEER-REVIEWED ARTICLE bioresourcescom
Krongtaew et al (2010) ldquoPart 2 Quantitative NIRrdquo BioResources 5(4) 2081-2096 2088
Fig 3 NIR-predicted and measured values of the PLS regression models of total residual lignin content (A D) reducing sugars (B E) and weight loss (C F) of calibration and test samples of pretreated wheat (WS) and oat straw (OS) samples The re-sampling method was applied for the models to ensure the reliability of all the PLS models as they were limited by a smaller number of observations when dividing the sample into two halves for calibration and test sets (Yu 2003) Ranges of R2
test RMSEP and number of PLS factors of ten different calibration and test sets demon-strated consistent and reliable results as shown in Table 2 The results showed the robustness and validity of the models for predicting total residual lignin reducing sugar and weight loss of physic-chemically pretreated wheat and oat straw samples Table 2 Re-Sampled Models of Ten Different Sub-Sample Sets for PLS Models of Total Residual Lignin Reducing Sugar and Weight Loss
Models Substrate Spectral region (cm-1)
Spectral pre-processing
1R2test 2RMSEP No of
PLS Factors
Total residual lignin (ww)
Wheat straw Oat straw
6900 ndash 5510 6900 ndash 5510
2nd derivative 2nd derivative
092-095 095-098
08-10 06-08
3 2-3
Reducing sugars (mg g-1 straw)
Wheat straw Oat straw
6900 ndash 5510 6900 ndash 5510
2nd derivative 2nd derivative
082-092 092-096
53-96 mg g-1 45-65 mg g-1
3-4 1-3
Weight loss () Wheat straw Oat straw
10000 ndash 4000 10000 ndash 4000
No processing No processing
065-073 084-093
33-41 24-39
3-4 4-5
1 Coefficient of determination of the test model 2 Root-mean-square error of prediction for future analysis
PEER-REVIEWED ARTICLE bioresourcescom
Krongtaew et al (2010) ldquoPart 2 Quantitative NIRrdquo BioResources 5(4) 2081-2096 2089
Assessment of Wheat Straw-to-Biogas Conversion by FT-NIR To optimize the PLS models for total solid content volatile solid content and
biogas yield some outliers were excluded from the 42 original samples thus the numbers of samples were different from those shown in Table 3 Although Rsup2cv of those cross-validated PLS models for total solid volatile solid and biogas yield were not as high as for those described above (Table 3 and Fig 5) the current models deliver a good estimation of these parameters Furthermore the much higher Rsup2cal the low number of PLS factors and the low bias of these models indicate the high potential of the FT-NIR method also to analyse these parameters
Table 3 PLS Regression Models from FT-NIR Spectral Data of Pretreated Wheat Straw Parameters Total solids Volatile solids Biogas Wave number [cm-1] Component range Spectral processing No of samples No of PLS factors
7200 - 5500 936-997 Second derivative 32 5
7200 - 5500 945-992 Second derivative 38 5
7500 - 5500 219-387 mL g-1 straw Min-Max normalization 30 5
Calibration R2
cal
RMSEE1
091 07
091 03
077 21 mL g-1 straw
Cross validation R2
cv RMSECV2
Bias
080 09 -005
075 05 003
065 23 mL g-1 straw 073
1 Root mean square error of estimation 2 Root mean square error of cross validation
An acceptable prediction of biogas yield was obtained (R2
cv = 065) from pretreated straw spectra when the consistency of inoculum seed quality and digestion condition were controlled Thus the analytical technology using the implementation of FT-NIR spectroscopy in the combination of mathematically spectral data processing could be applied to the entire system of biomass-to-bioenergy processes Biogas yield was well correlated to the amount of fermentable sugars available as carbon source for anaerobic digestion and also to the lignin content of the pretreated straw (Table 4) It was additionally observed that the yield of anaerobic digestion was influenced by the particle size of wheat straw (80 microm and 2 mm) (Fig 4) Pretreated straw with smaller particles (80 microm) gave higher biogas yields compared with larger particles (2 mm) while lignin content and the amount of reducing sugars of the same samples from wet-chemistry analyses were at the same levels The reason is most likely due to better accessibility of microbial enzymes toward the smaller particle size of straw Moreover the coefficient of correlation (R) between lignin and biogas as well as reducing sugar and biogas (Fig 4(A) 4(B)) were higher when determined among the same sets of particle size compared with those from all samples (Table 4) The PLS model however included all particle sizes
PEER-REVIEWED ARTICLE bioresourcescom
Krongtaew et al (2010) ldquoPart 2 Quantitative NIRrdquo BioResources 5(4) 2081-2096 2090
Table 4 Correlation Matrix of Key Parameters for Biomass-to-Biogas Conversion of Wheat Straw
Lignin Reducing sugars
Weight loss Total solid Volatile solid
Biogas
Lignin R=10
R=-08
R=-09
R=-02
R=-04
R=-06 Reducing sugars
-
R=10
R=08
R=01
R=02
R=06
Weight loss -
-
R=10
R=00
R=04
R=01
Total solid
-
-
-
R=10
R=-04
R=03
Volatile solid
-
-
-
-
R=10
R=-02
Biogas -
-
-
-
-
R=10
Fig 4 Correlation between total lignin and biogas (A) and enzymatically released reducing sugars and biogas (B) where diams and represent data from 80-microm and 2-mm straw samples respectively
PEER-REVIEWED ARTICLE bioresourcescom
Krongtaew et al (2010) ldquoPart 2 Quantitative NIRrdquo BioResources 5(4) 2081-2096 2091
Fig 5 NIR-predicted and measured values of (A) total solid (B) volatile solids and (C) biogas yield from the cross validation of PLS regression models of pretreated wheat straw Black solid indicates the outlier
A recent study demonstrated the prediction of biological methane potential based on a number of parameters - carbohydrates proteins lipids acetate and propionate concentration of a digested sludge mixture (Kaparaju et al 2009) Some scientific work also demonstrated the potential application of NIR for predicting volatile solids total solids chemical oxygen demand (COD) and several volatile fatty acids (VFA) of digested sludge from the biogas pilot plant the models relied mainly on different process constraints and were designed as analytical techniques for online-process control (Holm-Nielsen et al 2006 2007) The present study in contrast demonstrates the assessment of biogas yield based on chemical structure and composition of the substrate by FT-NIR spectroscopy Biogas yield is based on the stoichiometric conversion of organic material to biogas as shown in equation (1) Volatile organic compounds in lignocelluloses are theoretically converted to methane (CH4) and carbon dioxide (CO2) which are collectively called biogas (Buswell and Mueller 1952) In most methanogenic fermentations the methane yield lies close to the theoretical maximum of 3 moles of methane per mole of glucose as calculated from the Buswell equation (1) (Ahring and Westermann 2007) Thus the theoretical methane yield of untreated wheat straw is approximately 105 mmol CH4 and 105 mmol CO2 per g straw as wheat straw contains 63 polysaccharides (glucose equivalence) These values were calculated to 2352 mL CH4 and 2352 mL CO2 as one mole of an ideal gas at STP occupies 224 L
242 48248224COcbaCHcbaOHcbaOHC cba ⎟⎠⎞
⎜⎝⎛ +minus+⎟
⎠⎞
⎜⎝⎛ minus+rarr⎟
⎠⎞
⎜⎝⎛ minusminus+ (1)
However due to the complex structure which is rather hard to attack lignocellulose leads to yields lower than this theoretical maximum The presence of organic recalcitrant compounds in straw eg lignin and crystalline cellulose influences the yield of anaerobic digestion These properties of the substrate are reflected in the FT-NIR spectra and can serve for the prediction of the potential biogas yield For instance it has been reported that some parts of the crystalline structure of cellulose are loosened and
PEER-REVIEWED ARTICLE bioresourcescom
Krongtaew et al (2010) ldquoPart 2 Quantitative NIRrdquo BioResources 5(4) 2081-2096 2092
converted to semi-crystalline structures after physico-chemical pre-treatment (Krongtaew et al 2010) This could lead to higher susceptibility of cellulose and provided higher biomass utilization efficiency PLS Loading Spectra
PLS loading spectra contain the descriptive information of FT-NIR absorption regions that influence the PLS regression models As shown in Fig 6(A) the first loading factor (PLS1 2nd derivative pre-processing) of lignin content represents 82 of the data variance and PLS1 of reducing sugar represents 75 of the data variance The major fraction of the spectral variance influencing these models is found between 7200 and 5500 cm-1 where lignin xylan and acetyl groups of polysaccharides absorb As shown by highest negative amplitudes near 5980 cm-1 the spectral position is attributed to the C-H stretch 1st overtone of aromatic rings and the prediction of the lignin content is mainly based on this band But a high lignin content is also correlated with a low xylan content as indicated by the negative PLS loading vectors of lignin+polysaccharides bands near 5800 cm-1 the overlapping band of C-H stretch 1st overtone of lignin and acetyl groups (Lg+Xy Fig 6A) and the broad band of amorphous polysaccharides near 7000 cm-1 Bands assigned to crystalline II (6280 cm-1) and semi-crystalline (6722 cm-1) cellulose however exhibit positive loading vectors indicating high cellulose content of the samples with low lignin content and vice versa It is known that lignin degradation of lignocellulosic substrates leads to better accessible and enzymatically hydrolysable polysaccharides and thus to a higher yield of reducing sugars In fact these two parameters showed a high negative correlation of R = -08 in the data set analysed here (Table 4) This correlation was also found in the first loading spectrum of the model for reducing sugars which is very much alike that of the lignin model but shows the opposite algebraic sign
The correlation matrix (Table 4) shows the low correlation of total solids with all other parameters determined Consequently PLS-loading spectra (Fig 6(B)) were not directly connected to the content of the straw constituents Nevertheless most of the data variance (62) was explained by the second and third PLS loading factor (PLS2 and PLS3 2nd derivative pre-processing) and the regression model showed good predictable results for total solid content (Table 3 and Fig 5(A))
For the PLS loading spectra (2nd derivative pre-processing) of volatile solids (Fig 6(C)) which is the content of combustible organic materials PLS1 and PLS3 contributed mostly to the PLS model In the PLS1 loading spectrum lignin and xylan overlapping band (Lg+Xy) showed the highest influence on the model Amorphous polysaccharides (Am) near 7000 cm-1 and lignin-polysaccharide overlapping band near 5800 cm-1 (Lg+Ps) also appeared A high content of volatile solids was predicted from pretreated straw sample which contained low lignin and xylan (Lg+Xy) content as well as lignin and polysaccharide overlapping (Lg+Ps) but high amount of crystalline (Cry II) semi-crystalline (Sc) and amorphous (Am) cellulose indicating the extraction of inorganic compounds during the pre-treatment
PEER-REVIEWED ARTICLE bioresourcescom
Krongtaew et al (2010) ldquoPart 2 Quantitative NIRrdquo BioResources 5(4) 2081-2096 2093
Fig 6 PLS loading spectra of partial least-squares regression models (A) lignin content and amount of reducing sugar (B) total solids (C) volatile solids and (D) biogas yield
PEER-REVIEWED ARTICLE bioresourcescom
Krongtaew et al (2010) ldquoPart 2 Quantitative NIRrdquo BioResources 5(4) 2081-2096 2094
The first PLS factor of PLS regression models (minimummaximum normaliza-tion pre-processing) of biogas accounted for only 1 of the data variance therefore the second PLS factors is discussed here (Fig 6(D)) PLS2 represented 31 of the data variance and showed the importance of amorphous (Am) polysaccharides for a high biogas yield Crystalline cellulose (Cry II) however had an adverse effect as indicated by a negative loading vector of PLS2 in the respective region In summary it can be seen from the PLS loading spectra that lignin xylan and both amorphous and crystalline moieties of cellulose were representative onto the PLS model for evaluating biogas yield based on straw chemical structure after different severities of various physico-chemical pre-treatment methods Thus biogas potential of physico-chemically pretreated straw can be predicted based on the chemical characteristics and composition by FT-NIR assisted by multivariate data analysis
CONCLUSIONS
Fourier transform near-infrared (FT-NIR) spectroscopy combined with multi-variate data analyses has potential as an analytical tool for not only qualitative characterization of lignocellulose after different pre-treatment methods through the vibration bands of FT-NIR spectra (Krongtaew et al 2010) but also quantitative assessment for key parameters of both pre-treatment and biomass-to-bioenergy production Total residual lignin content enzymatically released reducing sugars total solids (TS) volatile solids (VS) and biogas yield can be analysed This approach can be considered as an alternative process analytical technology (PAT) for assessment of biomass utilization and biomass-to-biogas production offering a powerful and low-budget technique for rapidly growing and bulk volume industries
Furthermore the descriptive information in the loading vectors confirmed the importance of delignification for successful enzymatic and microbial conversion of the structural polysaccharides as well as the adverse effect of high cellulose crystallinity ACKNOWLEDGEMENTS
The authors are grateful to the financial support from the Austrian Research Promotion Agency (FFG project number 81954914233SCKSAI) KF acknowledges the support of FWF the Austrian Science Fund (FWF project number V117-N17) REFERENCES CITED Ahring B K and Westermann P (2007) ldquoCoproduction of bioethanol with other
biofuelsrdquo Adv Biochem EnginBiotechnol 108 289-302 Angelidaki I Ellegaard L and Ahring B K (1992) ldquoCompact automated
displacement gas metering system for measurement of low gas rates from laboratory fermentorsrdquo Biotechnol Bioeng 39 351-353
PEER-REVIEWED ARTICLE bioresourcescom
Krongtaew et al (2010) ldquoPart 2 Quantitative NIRrdquo BioResources 5(4) 2081-2096 2095
Buswell A M and Mueller H F (1952) ldquoMechanism of methane fermentationrdquo Ind Engin Chem 44(3) 550-552
Chandra R P Bura R Mabee W Pan X Berlin A and Saddler J N (2007) ldquoSubstrate pretreatment The key to effective enzymatic hydrolysis of lignocellulosicsrdquo Adv Biochem EnginBiotechnol 108 67-93
Energy Efficiency amp Renewable Energy US Department of Energy (2009) lthttpwww1eereenergygovbiomassanalytical_procedureshtmlgt viewed in September 2009
Fackler K Schmutzer M Manoch L Schwanninger M Hinterstoisser B Ters T Messner K and Gradinger C (2007a) ldquoEvaluation of the selectivity of white rot isolates using near infrared spectroscopic techniquesrdquo Enzyme Microb Technol 41 881-887
Fackler K Schwanninger M Gradinger C Hinterstoisser B and Messner K (2007b) ldquoQualitative and quantitative changes of beech wood degraded by wood-rotting basidiomycetes monitored by Fourier transform infrared spectroscopic methods and multivariate data analysisrdquo FEMS Microbiol Lett 271(2) 162-169
Ghosh S and Rodgers J (2001) ldquoNIR analysis of textilesrdquo In Burns D A and Ciurczak E W (eds) Handbook of Near-Infrared Analysis 2nd Ed Marcel Dekker Inc New York 573-607
Himmel M E Ding S Y Johnson D K Adney W S Numlos M R Brady J W and Foust T D (2007) ldquoBiomass recalcitrance Engineering plants and enzymes for biofuels productionrdquo Science 315 804-807
Holm-Nielsen J B Dahl C K and Esbensen K H (2006) ldquoRepresentative sampling for process analytical characterization of heterogeneous bioslurry systemsmdasha reference study of sampling issues in PATrdquo Chemom Intell Lab Syst 83 114-126
Holm-Nielsen J B Andree H Lindorfer H and Esbensen K H (2007) ldquoTransflexive embedded near infrared monitoring for key process intermediates in anaerobic digestionbiogas productionrdquo J Near Infrared Spectrosc 15 123-135
Kaparaju P Serrano M Thomsen A B Kongjan P and Angelidaki I (2009) ldquoBioethanol biohydrogen and biogas production from wheat straw in a biorefinery conceptrdquo Biores Technol 100 2562-2568
Kong X Xie J Wu Y Huang Y and Bao J (2005) ldquoRapid prediction of acid detergent fiber neutral detergent fiber and acid detergent lignin of rice materials by near-infrared spectroscopyrdquo J Agric Food Chem 53 2843-2848
Krongtaew C Messner K Ters T and Fackler K (2010) ldquoCharacterization of key parameters for biotechnological lignocellulose conversion assessed by FT-NIR spectroscopy Part I Qualitative analysis of pretreated strawrdquo BioResources 5(4) 2063-2080
Kumar P Barrett D M Delwiche M J and Stroeve P (2009) ldquoMethods for pretreatment of lignocellulosic biomass for efficient hydrolysis and biofuel productionrdquo Ind Eng Chem Res 48 3713-3729
Ozaki Y McClure W F and Christy A A (2007) Near Infrared Spectroscopy in Food Science and Technology Wiley Interscience New Jersey
Savitzky A and Golay M J E (1964) ldquoSmoothing and differentiation of data by simplified least squares proceduresrdquo Anal Chem 36(8) 1627-1639
PEER-REVIEWED ARTICLE bioresourcescom
Krongtaew et al (2010) ldquoPart 2 Quantitative NIRrdquo BioResources 5(4) 2081-2096 2096
Shenk J S Workman J J and Westerhaus M O (2001) ldquoApplication of NIR spectroscopy to agricultural productsrdquo In Burns D A and Ciurczak E W (eds) Handbook of Near-Infrared Analysis 2nd Ed Marcel Dekker Inc New York 419-474
Siesler H W Ozaki Y Kawata S and Heise H M (2002) Near Infrared Spectroscopy Principles Instruments and Applications Wiley VCH Germany
Tsuchikawa S and Siesler H W (2003a) ldquoNear-infrared spectroscopic monitoring of the diffusion process of deuterium-labeled molecules in wood Part II Hardwoodrdquo Appl Spectrosc 57 675-681
Tsuchikawa S and Siesler H W (2003b) ldquoNear-infrared spectroscopic monitoring of the diffusion process of deuterium-labeled molecules in wood Part I Softwoodrdquo Appl Spectrosc 57 667-674
Tsuchikawa S Yonenobu H and Siesler H W (2005) ldquoNear-infrared spectroscopic observation of the ageing process in archaeological wood using a deuterium exchange methodrdquo Analyst 130 379-384
Watanabe A Morita S and Ozaki Y (2006) ldquoTemperature-dependent structural changes in hydrogen bonds in microcrystalline cellulose studied by infrared and near-infrared spectroscopy with perturbation-correlation moving-window two-dimensional correlation analysisrdquo Appl Spectrosc 60(6) 611-618
Wilkie A C Smith P H and Bordeaux F M (2004) ldquoAn economical bioreactor for evaluating biogas potential of particulate biomassrdquo Biores Technol 92 103-109
Yu C H (2003) ldquoResampling methods Concepts applications and justificationrdquo Practical Assessment Research amp Evaluation 8(19) Retrieved July 31 2010 from httpPAREonlinenetgetvnaspv=8ampn=19
Article submitted June 22 2010 Peer review completed July 18 2010 Revised version received and accepted August 5 2010 Published August 6 2010
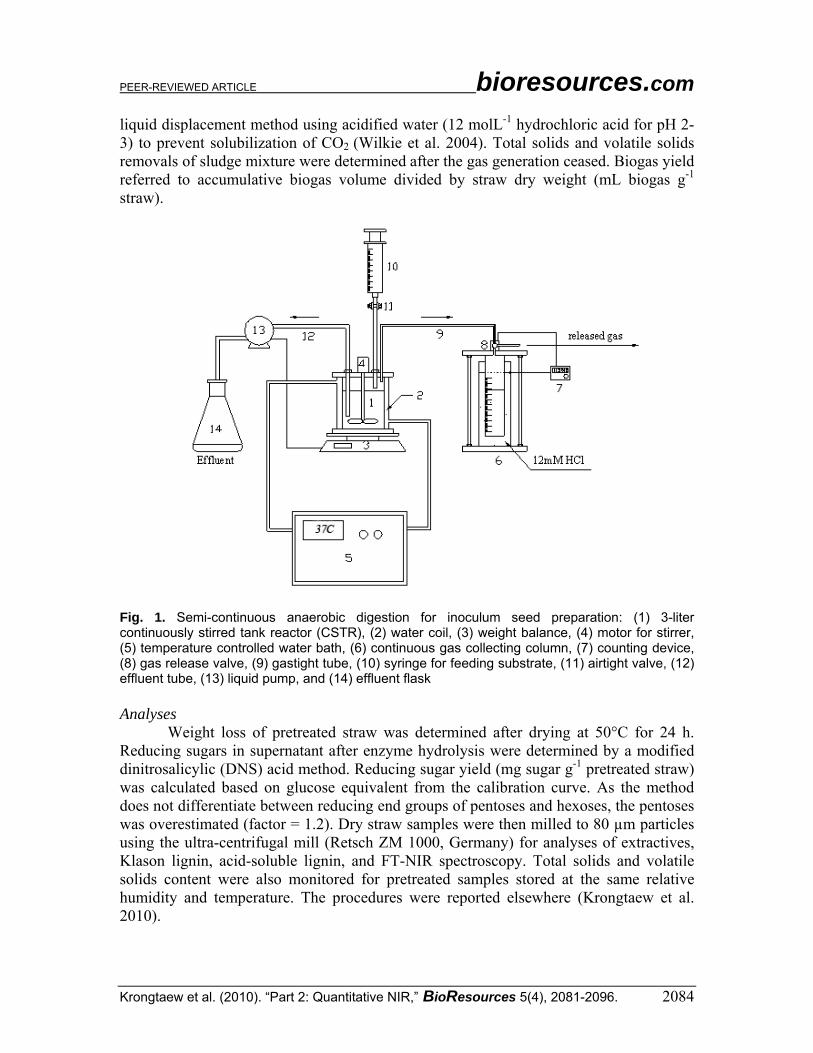
PEER-REVIEWED ARTICLE bioresourcescom
Krongtaew et al (2010) ldquoPart 2 Quantitative NIRrdquo BioResources 5(4) 2081-2096 2084
liquid displacement method using acidified water (12 molL-1 hydrochloric acid for pH 2-3) to prevent solubilization of CO2 (Wilkie et al 2004) Total solids and volatile solids removals of sludge mixture were determined after the gas generation ceased Biogas yield referred to accumulative biogas volume divided by straw dry weight (mL biogas g-1 straw)
Fig 1 Semi-continuous anaerobic digestion for inoculum seed preparation (1) 3-liter continuously stirred tank reactor (CSTR) (2) water coil (3) weight balance (4) motor for stirrer (5) temperature controlled water bath (6) continuous gas collecting column (7) counting device (8) gas release valve (9) gastight tube (10) syringe for feeding substrate (11) airtight valve (12) effluent tube (13) liquid pump and (14) effluent flask Analyses
Weight loss of pretreated straw was determined after drying at 50degC for 24 h Reducing sugars in supernatant after enzyme hydrolysis were determined by a modified dinitrosalicylic (DNS) acid method Reducing sugar yield (mg sugar g-1 pretreated straw) was calculated based on glucose equivalent from the calibration curve As the method does not differentiate between reducing end groups of pentoses and hexoses the pentoses was overestimated (factor = 12) Dry straw samples were then milled to 80 microm particles using the ultra-centrifugal mill (Retsch ZM 1000 Germany) for analyses of extractives Klason lignin acid-soluble lignin and FT-NIR spectroscopy Total solids and volatile solids content were also monitored for pretreated samples stored at the same relative humidity and temperature The procedures were reported elsewhere (Krongtaew et al 2010)
PEER-REVIEWED ARTICLE bioresourcescom
Krongtaew et al (2010) ldquoPart 2 Quantitative NIRrdquo BioResources 5(4) 2081-2096 2085
Fourier transform near-infrared (FT-NIR) spectroscopy FT-NIR spectroscopy of milled samples (80 microm particles) was carried out in
terms of apparent absorbance log [1Reflectance] by FT-NIR spectrometer using a fiber-optic probe (Equinox 55 Bruker Optics Inc Germany) Spectroscopy was performed with 8 cm-1 resolution 100 scans (60 seconds) and wave numbers ranging from 10000 to 4000 cm-1 The average spectra of 4 replicates were calculated
Partial least-squares (PLS) regression models between FT-NIR spectra and the key parameters from straw pre-treatment namely total lignin content amount of reducing sugars and weight loss were set up by OPUS QUANT 2 version 60 (Bruker Germany) In some cases spectra were differentiated to second derivatives (17 smoothing points 2nd order polynomial fit using the Savitzky and Golay algorithm (1964)) or minimummaximum normalized in the respective spectral range (Tables 1 and 2) From 80 wheat straw samples and 53 oat straw samples half of the samples were chosen randomly for the calibration and the remaining samples were used as the test set to validate the models The validity of models was indicated by the determination coefficient of test samples (R2
test) and root mean square error of prediction (RMSEP) The ranges of wavenumber for setting up the PLS models of lignin content reducing sugar and weight loss were chosen using OPUS QUANT 2 Optimization The other ranges (7500 7200 ndash 5500 cm-1) covered 1st overtones of O-H and C-H stretching bands of water lignin and polysaccharides (Krongtaew et al 2010) The PLS models of total solid volatile solids and biogas yield the crucial parameters for anaerobic fermentation were calculated from the alternate sample set (42 wheat straw samples) Due to the smaller number of samples leave-one-out cross validation was performed RESULTS AND DISCUSSION FT-NIR spectra
In Fig 2 pre-processed FT-NIR spectra are shown in the spectral region used for the regression models As illustrated in Fig 2(B) and 2(C) 2nd derivative FT-NIR spectra of straw samples after different severities of physico-chemical pre-treatment show significant changes in the range between 7200 and 5500 cm-1 This spectral region is attributed to CH stretch 1st overtone vibration of the aromatic lignin structure which is overlapped with CH stretch 1st overtone vibration band of acetyl groups (CH3) of hemicelluloses mainly xylan in straw (Shenk et al 2001 Fackler et al 2007b Tsuchikawa et al 2005) Moreover modification of FT-NIR spectra ranging from 7200 to 6000 cm-1 attributed to alteration of OH stretch 1st overtone of amorphous semi-crystalline and crystalline cellulose (Tsuchikawa and Siesler 2003a Tsuchikawa and Siesler 2003b Watanabe et al 2006) were also observed after physico-chemical pre-treatment Qualitative changes in FT-NIR spectra after lignin degradation as well as degradation or deacetylation of polysaccharides were described in detail in the preceding article (Krongtaew et al 2010)
During the physico-chemical pre-treatment lignin and hemicelluloses were solubilized and the crystalline structure of the substrate was substantially changed These changes were reflected in the FT-NIR absorbance PLS regression models of FT-NIR
PEER-REVIEWED ARTICLE bioresourcescom
Krongtaew et al (2010) ldquoPart 2 Quantitative NIRrdquo BioResources 5(4) 2081-2096 2086
spectra between 6900 and 5510 cm-1 were set up for predicting total residual lignin content and the amount of hydrolysable reducing sugars of pretreated straw samples (Table 1) This spectral region includes a lignin band near 5980 cm-1 and xylan bands near 5800 5960 5990 cm-1 (Krongtaew et al 2010) as well as information on cellulose crystallinity (Fig 2(B)) A further PLS model was calculated from the entire FT-NIR spectra ranging from 10000 to 4000 cm-1 to estimate the weight loss after pre-treatment (Table 1) Weight loss leads to loss of NIR absorption of C-H O-H N-H and C=O vibration bands of organic substances (Fig 2(A)) Table 1 Parameters and Errors from Partial Least-Squares (PLS) Regression Models of Total Residual Lignin Reducing Sugar and Weight Loss of Delignified Wheat and Oat Straw Models Substrate Component
range No of samples No of test samples
Spectral region (cm-1)
Spectral pre-processing
Total residual lignin (ww)
Wheat straw Oat straw
79 - 207 83 - 185
80 40 53 27
6900- 5510 6900- 5510
2nd derivative 2nd derivative
Reducing sugars (mg g-1- straw)
Wheat straw Oat straw
128 - 1000 131 -812
80 40 53 27
6900- 5510 6900- 5510
2nd derivative 2nd derivative
Weight loss () Wheat straw Oat straw
40 - 335 50 - 440
80 40 53 27
10000-4000 10000-4000
No processing No processing
Models Substrate 1R2
cal 2RMSEE 3R2
test 4RMSEP No of
PLS Factors
Total residual lignin (ww)
Wheat straw Oat straw
095 099
09 05
094 096
09 08
3 1
Reducing sugars (mg g-1- straw)
Wheat straw Oat straw
094 096
45 mg g-1 54 mg g-1
089 093
83 mg g-1 64 mg g-1
4 1
Weight loss () Wheat straw Oat straw
085 096
29 26
075 091
35 34
4 4
1 Coefficient of determination of the calibration model 2 Root-mean-square error of estimation
3 Coefficient of determination of the test model 4 Root-mean-square error of prediction for future analysis
Lignin content amount of reducing sugars and the weight loss of oat straw of the pretreated samples were accurately evaluated from FT-NIR spectra by means of PLS regression (Table 1 and Fig 3) Good correlations between NIR-predicted and measured values were obtained for calibration and test sets as indicated by high values of the determination coefficients (Rsup2cal and R2
test) and low root-mean-square error of estimation and prediction (RMSEE and RMSEP) These model parameters and the low number of factors required to obtain this high correlation are good indications for the robustness and applicability of the regression models
PEER-REVIEWED ARTICLE bioresourcescom
Krongtaew et al (2010) ldquoPart 2 Quantitative NIRrdquo BioResources 5(4) 2081-2096 2087
Fig 2 FT-NIR spectra of wheat straw (A) and second derivative of FT-NIR spectra of pretreated wheat (B) and oat straw (C) samples containing different residual lignin contents
PEER-REVIEWED ARTICLE bioresourcescom
Krongtaew et al (2010) ldquoPart 2 Quantitative NIRrdquo BioResources 5(4) 2081-2096 2088
Fig 3 NIR-predicted and measured values of the PLS regression models of total residual lignin content (A D) reducing sugars (B E) and weight loss (C F) of calibration and test samples of pretreated wheat (WS) and oat straw (OS) samples The re-sampling method was applied for the models to ensure the reliability of all the PLS models as they were limited by a smaller number of observations when dividing the sample into two halves for calibration and test sets (Yu 2003) Ranges of R2
test RMSEP and number of PLS factors of ten different calibration and test sets demon-strated consistent and reliable results as shown in Table 2 The results showed the robustness and validity of the models for predicting total residual lignin reducing sugar and weight loss of physic-chemically pretreated wheat and oat straw samples Table 2 Re-Sampled Models of Ten Different Sub-Sample Sets for PLS Models of Total Residual Lignin Reducing Sugar and Weight Loss
Models Substrate Spectral region (cm-1)
Spectral pre-processing
1R2test 2RMSEP No of
PLS Factors
Total residual lignin (ww)
Wheat straw Oat straw
6900 ndash 5510 6900 ndash 5510
2nd derivative 2nd derivative
092-095 095-098
08-10 06-08
3 2-3
Reducing sugars (mg g-1 straw)
Wheat straw Oat straw
6900 ndash 5510 6900 ndash 5510
2nd derivative 2nd derivative
082-092 092-096
53-96 mg g-1 45-65 mg g-1
3-4 1-3
Weight loss () Wheat straw Oat straw
10000 ndash 4000 10000 ndash 4000
No processing No processing
065-073 084-093
33-41 24-39
3-4 4-5
1 Coefficient of determination of the test model 2 Root-mean-square error of prediction for future analysis
PEER-REVIEWED ARTICLE bioresourcescom
Krongtaew et al (2010) ldquoPart 2 Quantitative NIRrdquo BioResources 5(4) 2081-2096 2089
Assessment of Wheat Straw-to-Biogas Conversion by FT-NIR To optimize the PLS models for total solid content volatile solid content and
biogas yield some outliers were excluded from the 42 original samples thus the numbers of samples were different from those shown in Table 3 Although Rsup2cv of those cross-validated PLS models for total solid volatile solid and biogas yield were not as high as for those described above (Table 3 and Fig 5) the current models deliver a good estimation of these parameters Furthermore the much higher Rsup2cal the low number of PLS factors and the low bias of these models indicate the high potential of the FT-NIR method also to analyse these parameters
Table 3 PLS Regression Models from FT-NIR Spectral Data of Pretreated Wheat Straw Parameters Total solids Volatile solids Biogas Wave number [cm-1] Component range Spectral processing No of samples No of PLS factors
7200 - 5500 936-997 Second derivative 32 5
7200 - 5500 945-992 Second derivative 38 5
7500 - 5500 219-387 mL g-1 straw Min-Max normalization 30 5
Calibration R2
cal
RMSEE1
091 07
091 03
077 21 mL g-1 straw
Cross validation R2
cv RMSECV2
Bias
080 09 -005
075 05 003
065 23 mL g-1 straw 073
1 Root mean square error of estimation 2 Root mean square error of cross validation
An acceptable prediction of biogas yield was obtained (R2
cv = 065) from pretreated straw spectra when the consistency of inoculum seed quality and digestion condition were controlled Thus the analytical technology using the implementation of FT-NIR spectroscopy in the combination of mathematically spectral data processing could be applied to the entire system of biomass-to-bioenergy processes Biogas yield was well correlated to the amount of fermentable sugars available as carbon source for anaerobic digestion and also to the lignin content of the pretreated straw (Table 4) It was additionally observed that the yield of anaerobic digestion was influenced by the particle size of wheat straw (80 microm and 2 mm) (Fig 4) Pretreated straw with smaller particles (80 microm) gave higher biogas yields compared with larger particles (2 mm) while lignin content and the amount of reducing sugars of the same samples from wet-chemistry analyses were at the same levels The reason is most likely due to better accessibility of microbial enzymes toward the smaller particle size of straw Moreover the coefficient of correlation (R) between lignin and biogas as well as reducing sugar and biogas (Fig 4(A) 4(B)) were higher when determined among the same sets of particle size compared with those from all samples (Table 4) The PLS model however included all particle sizes
PEER-REVIEWED ARTICLE bioresourcescom
Krongtaew et al (2010) ldquoPart 2 Quantitative NIRrdquo BioResources 5(4) 2081-2096 2090
Table 4 Correlation Matrix of Key Parameters for Biomass-to-Biogas Conversion of Wheat Straw
Lignin Reducing sugars
Weight loss Total solid Volatile solid
Biogas
Lignin R=10
R=-08
R=-09
R=-02
R=-04
R=-06 Reducing sugars
-
R=10
R=08
R=01
R=02
R=06
Weight loss -
-
R=10
R=00
R=04
R=01
Total solid
-
-
-
R=10
R=-04
R=03
Volatile solid
-
-
-
-
R=10
R=-02
Biogas -
-
-
-
-
R=10
Fig 4 Correlation between total lignin and biogas (A) and enzymatically released reducing sugars and biogas (B) where diams and represent data from 80-microm and 2-mm straw samples respectively
PEER-REVIEWED ARTICLE bioresourcescom
Krongtaew et al (2010) ldquoPart 2 Quantitative NIRrdquo BioResources 5(4) 2081-2096 2091
Fig 5 NIR-predicted and measured values of (A) total solid (B) volatile solids and (C) biogas yield from the cross validation of PLS regression models of pretreated wheat straw Black solid indicates the outlier
A recent study demonstrated the prediction of biological methane potential based on a number of parameters - carbohydrates proteins lipids acetate and propionate concentration of a digested sludge mixture (Kaparaju et al 2009) Some scientific work also demonstrated the potential application of NIR for predicting volatile solids total solids chemical oxygen demand (COD) and several volatile fatty acids (VFA) of digested sludge from the biogas pilot plant the models relied mainly on different process constraints and were designed as analytical techniques for online-process control (Holm-Nielsen et al 2006 2007) The present study in contrast demonstrates the assessment of biogas yield based on chemical structure and composition of the substrate by FT-NIR spectroscopy Biogas yield is based on the stoichiometric conversion of organic material to biogas as shown in equation (1) Volatile organic compounds in lignocelluloses are theoretically converted to methane (CH4) and carbon dioxide (CO2) which are collectively called biogas (Buswell and Mueller 1952) In most methanogenic fermentations the methane yield lies close to the theoretical maximum of 3 moles of methane per mole of glucose as calculated from the Buswell equation (1) (Ahring and Westermann 2007) Thus the theoretical methane yield of untreated wheat straw is approximately 105 mmol CH4 and 105 mmol CO2 per g straw as wheat straw contains 63 polysaccharides (glucose equivalence) These values were calculated to 2352 mL CH4 and 2352 mL CO2 as one mole of an ideal gas at STP occupies 224 L
242 48248224COcbaCHcbaOHcbaOHC cba ⎟⎠⎞
⎜⎝⎛ +minus+⎟
⎠⎞
⎜⎝⎛ minus+rarr⎟
⎠⎞
⎜⎝⎛ minusminus+ (1)
However due to the complex structure which is rather hard to attack lignocellulose leads to yields lower than this theoretical maximum The presence of organic recalcitrant compounds in straw eg lignin and crystalline cellulose influences the yield of anaerobic digestion These properties of the substrate are reflected in the FT-NIR spectra and can serve for the prediction of the potential biogas yield For instance it has been reported that some parts of the crystalline structure of cellulose are loosened and
PEER-REVIEWED ARTICLE bioresourcescom
Krongtaew et al (2010) ldquoPart 2 Quantitative NIRrdquo BioResources 5(4) 2081-2096 2092
converted to semi-crystalline structures after physico-chemical pre-treatment (Krongtaew et al 2010) This could lead to higher susceptibility of cellulose and provided higher biomass utilization efficiency PLS Loading Spectra
PLS loading spectra contain the descriptive information of FT-NIR absorption regions that influence the PLS regression models As shown in Fig 6(A) the first loading factor (PLS1 2nd derivative pre-processing) of lignin content represents 82 of the data variance and PLS1 of reducing sugar represents 75 of the data variance The major fraction of the spectral variance influencing these models is found between 7200 and 5500 cm-1 where lignin xylan and acetyl groups of polysaccharides absorb As shown by highest negative amplitudes near 5980 cm-1 the spectral position is attributed to the C-H stretch 1st overtone of aromatic rings and the prediction of the lignin content is mainly based on this band But a high lignin content is also correlated with a low xylan content as indicated by the negative PLS loading vectors of lignin+polysaccharides bands near 5800 cm-1 the overlapping band of C-H stretch 1st overtone of lignin and acetyl groups (Lg+Xy Fig 6A) and the broad band of amorphous polysaccharides near 7000 cm-1 Bands assigned to crystalline II (6280 cm-1) and semi-crystalline (6722 cm-1) cellulose however exhibit positive loading vectors indicating high cellulose content of the samples with low lignin content and vice versa It is known that lignin degradation of lignocellulosic substrates leads to better accessible and enzymatically hydrolysable polysaccharides and thus to a higher yield of reducing sugars In fact these two parameters showed a high negative correlation of R = -08 in the data set analysed here (Table 4) This correlation was also found in the first loading spectrum of the model for reducing sugars which is very much alike that of the lignin model but shows the opposite algebraic sign
The correlation matrix (Table 4) shows the low correlation of total solids with all other parameters determined Consequently PLS-loading spectra (Fig 6(B)) were not directly connected to the content of the straw constituents Nevertheless most of the data variance (62) was explained by the second and third PLS loading factor (PLS2 and PLS3 2nd derivative pre-processing) and the regression model showed good predictable results for total solid content (Table 3 and Fig 5(A))
For the PLS loading spectra (2nd derivative pre-processing) of volatile solids (Fig 6(C)) which is the content of combustible organic materials PLS1 and PLS3 contributed mostly to the PLS model In the PLS1 loading spectrum lignin and xylan overlapping band (Lg+Xy) showed the highest influence on the model Amorphous polysaccharides (Am) near 7000 cm-1 and lignin-polysaccharide overlapping band near 5800 cm-1 (Lg+Ps) also appeared A high content of volatile solids was predicted from pretreated straw sample which contained low lignin and xylan (Lg+Xy) content as well as lignin and polysaccharide overlapping (Lg+Ps) but high amount of crystalline (Cry II) semi-crystalline (Sc) and amorphous (Am) cellulose indicating the extraction of inorganic compounds during the pre-treatment
PEER-REVIEWED ARTICLE bioresourcescom
Krongtaew et al (2010) ldquoPart 2 Quantitative NIRrdquo BioResources 5(4) 2081-2096 2093
Fig 6 PLS loading spectra of partial least-squares regression models (A) lignin content and amount of reducing sugar (B) total solids (C) volatile solids and (D) biogas yield
PEER-REVIEWED ARTICLE bioresourcescom
Krongtaew et al (2010) ldquoPart 2 Quantitative NIRrdquo BioResources 5(4) 2081-2096 2094
The first PLS factor of PLS regression models (minimummaximum normaliza-tion pre-processing) of biogas accounted for only 1 of the data variance therefore the second PLS factors is discussed here (Fig 6(D)) PLS2 represented 31 of the data variance and showed the importance of amorphous (Am) polysaccharides for a high biogas yield Crystalline cellulose (Cry II) however had an adverse effect as indicated by a negative loading vector of PLS2 in the respective region In summary it can be seen from the PLS loading spectra that lignin xylan and both amorphous and crystalline moieties of cellulose were representative onto the PLS model for evaluating biogas yield based on straw chemical structure after different severities of various physico-chemical pre-treatment methods Thus biogas potential of physico-chemically pretreated straw can be predicted based on the chemical characteristics and composition by FT-NIR assisted by multivariate data analysis
CONCLUSIONS
Fourier transform near-infrared (FT-NIR) spectroscopy combined with multi-variate data analyses has potential as an analytical tool for not only qualitative characterization of lignocellulose after different pre-treatment methods through the vibration bands of FT-NIR spectra (Krongtaew et al 2010) but also quantitative assessment for key parameters of both pre-treatment and biomass-to-bioenergy production Total residual lignin content enzymatically released reducing sugars total solids (TS) volatile solids (VS) and biogas yield can be analysed This approach can be considered as an alternative process analytical technology (PAT) for assessment of biomass utilization and biomass-to-biogas production offering a powerful and low-budget technique for rapidly growing and bulk volume industries
Furthermore the descriptive information in the loading vectors confirmed the importance of delignification for successful enzymatic and microbial conversion of the structural polysaccharides as well as the adverse effect of high cellulose crystallinity ACKNOWLEDGEMENTS
The authors are grateful to the financial support from the Austrian Research Promotion Agency (FFG project number 81954914233SCKSAI) KF acknowledges the support of FWF the Austrian Science Fund (FWF project number V117-N17) REFERENCES CITED Ahring B K and Westermann P (2007) ldquoCoproduction of bioethanol with other
biofuelsrdquo Adv Biochem EnginBiotechnol 108 289-302 Angelidaki I Ellegaard L and Ahring B K (1992) ldquoCompact automated
displacement gas metering system for measurement of low gas rates from laboratory fermentorsrdquo Biotechnol Bioeng 39 351-353
PEER-REVIEWED ARTICLE bioresourcescom
Krongtaew et al (2010) ldquoPart 2 Quantitative NIRrdquo BioResources 5(4) 2081-2096 2095
Buswell A M and Mueller H F (1952) ldquoMechanism of methane fermentationrdquo Ind Engin Chem 44(3) 550-552
Chandra R P Bura R Mabee W Pan X Berlin A and Saddler J N (2007) ldquoSubstrate pretreatment The key to effective enzymatic hydrolysis of lignocellulosicsrdquo Adv Biochem EnginBiotechnol 108 67-93
Energy Efficiency amp Renewable Energy US Department of Energy (2009) lthttpwww1eereenergygovbiomassanalytical_procedureshtmlgt viewed in September 2009
Fackler K Schmutzer M Manoch L Schwanninger M Hinterstoisser B Ters T Messner K and Gradinger C (2007a) ldquoEvaluation of the selectivity of white rot isolates using near infrared spectroscopic techniquesrdquo Enzyme Microb Technol 41 881-887
Fackler K Schwanninger M Gradinger C Hinterstoisser B and Messner K (2007b) ldquoQualitative and quantitative changes of beech wood degraded by wood-rotting basidiomycetes monitored by Fourier transform infrared spectroscopic methods and multivariate data analysisrdquo FEMS Microbiol Lett 271(2) 162-169
Ghosh S and Rodgers J (2001) ldquoNIR analysis of textilesrdquo In Burns D A and Ciurczak E W (eds) Handbook of Near-Infrared Analysis 2nd Ed Marcel Dekker Inc New York 573-607
Himmel M E Ding S Y Johnson D K Adney W S Numlos M R Brady J W and Foust T D (2007) ldquoBiomass recalcitrance Engineering plants and enzymes for biofuels productionrdquo Science 315 804-807
Holm-Nielsen J B Dahl C K and Esbensen K H (2006) ldquoRepresentative sampling for process analytical characterization of heterogeneous bioslurry systemsmdasha reference study of sampling issues in PATrdquo Chemom Intell Lab Syst 83 114-126
Holm-Nielsen J B Andree H Lindorfer H and Esbensen K H (2007) ldquoTransflexive embedded near infrared monitoring for key process intermediates in anaerobic digestionbiogas productionrdquo J Near Infrared Spectrosc 15 123-135
Kaparaju P Serrano M Thomsen A B Kongjan P and Angelidaki I (2009) ldquoBioethanol biohydrogen and biogas production from wheat straw in a biorefinery conceptrdquo Biores Technol 100 2562-2568
Kong X Xie J Wu Y Huang Y and Bao J (2005) ldquoRapid prediction of acid detergent fiber neutral detergent fiber and acid detergent lignin of rice materials by near-infrared spectroscopyrdquo J Agric Food Chem 53 2843-2848
Krongtaew C Messner K Ters T and Fackler K (2010) ldquoCharacterization of key parameters for biotechnological lignocellulose conversion assessed by FT-NIR spectroscopy Part I Qualitative analysis of pretreated strawrdquo BioResources 5(4) 2063-2080
Kumar P Barrett D M Delwiche M J and Stroeve P (2009) ldquoMethods for pretreatment of lignocellulosic biomass for efficient hydrolysis and biofuel productionrdquo Ind Eng Chem Res 48 3713-3729
Ozaki Y McClure W F and Christy A A (2007) Near Infrared Spectroscopy in Food Science and Technology Wiley Interscience New Jersey
Savitzky A and Golay M J E (1964) ldquoSmoothing and differentiation of data by simplified least squares proceduresrdquo Anal Chem 36(8) 1627-1639
PEER-REVIEWED ARTICLE bioresourcescom
Krongtaew et al (2010) ldquoPart 2 Quantitative NIRrdquo BioResources 5(4) 2081-2096 2096
Shenk J S Workman J J and Westerhaus M O (2001) ldquoApplication of NIR spectroscopy to agricultural productsrdquo In Burns D A and Ciurczak E W (eds) Handbook of Near-Infrared Analysis 2nd Ed Marcel Dekker Inc New York 419-474
Siesler H W Ozaki Y Kawata S and Heise H M (2002) Near Infrared Spectroscopy Principles Instruments and Applications Wiley VCH Germany
Tsuchikawa S and Siesler H W (2003a) ldquoNear-infrared spectroscopic monitoring of the diffusion process of deuterium-labeled molecules in wood Part II Hardwoodrdquo Appl Spectrosc 57 675-681
Tsuchikawa S and Siesler H W (2003b) ldquoNear-infrared spectroscopic monitoring of the diffusion process of deuterium-labeled molecules in wood Part I Softwoodrdquo Appl Spectrosc 57 667-674
Tsuchikawa S Yonenobu H and Siesler H W (2005) ldquoNear-infrared spectroscopic observation of the ageing process in archaeological wood using a deuterium exchange methodrdquo Analyst 130 379-384
Watanabe A Morita S and Ozaki Y (2006) ldquoTemperature-dependent structural changes in hydrogen bonds in microcrystalline cellulose studied by infrared and near-infrared spectroscopy with perturbation-correlation moving-window two-dimensional correlation analysisrdquo Appl Spectrosc 60(6) 611-618
Wilkie A C Smith P H and Bordeaux F M (2004) ldquoAn economical bioreactor for evaluating biogas potential of particulate biomassrdquo Biores Technol 92 103-109
Yu C H (2003) ldquoResampling methods Concepts applications and justificationrdquo Practical Assessment Research amp Evaluation 8(19) Retrieved July 31 2010 from httpPAREonlinenetgetvnaspv=8ampn=19
Article submitted June 22 2010 Peer review completed July 18 2010 Revised version received and accepted August 5 2010 Published August 6 2010
PEER-REVIEWED ARTICLE bioresourcescom
Krongtaew et al (2010) ldquoPart 2 Quantitative NIRrdquo BioResources 5(4) 2081-2096 2085
Fourier transform near-infrared (FT-NIR) spectroscopy FT-NIR spectroscopy of milled samples (80 microm particles) was carried out in
terms of apparent absorbance log [1Reflectance] by FT-NIR spectrometer using a fiber-optic probe (Equinox 55 Bruker Optics Inc Germany) Spectroscopy was performed with 8 cm-1 resolution 100 scans (60 seconds) and wave numbers ranging from 10000 to 4000 cm-1 The average spectra of 4 replicates were calculated
Partial least-squares (PLS) regression models between FT-NIR spectra and the key parameters from straw pre-treatment namely total lignin content amount of reducing sugars and weight loss were set up by OPUS QUANT 2 version 60 (Bruker Germany) In some cases spectra were differentiated to second derivatives (17 smoothing points 2nd order polynomial fit using the Savitzky and Golay algorithm (1964)) or minimummaximum normalized in the respective spectral range (Tables 1 and 2) From 80 wheat straw samples and 53 oat straw samples half of the samples were chosen randomly for the calibration and the remaining samples were used as the test set to validate the models The validity of models was indicated by the determination coefficient of test samples (R2
test) and root mean square error of prediction (RMSEP) The ranges of wavenumber for setting up the PLS models of lignin content reducing sugar and weight loss were chosen using OPUS QUANT 2 Optimization The other ranges (7500 7200 ndash 5500 cm-1) covered 1st overtones of O-H and C-H stretching bands of water lignin and polysaccharides (Krongtaew et al 2010) The PLS models of total solid volatile solids and biogas yield the crucial parameters for anaerobic fermentation were calculated from the alternate sample set (42 wheat straw samples) Due to the smaller number of samples leave-one-out cross validation was performed RESULTS AND DISCUSSION FT-NIR spectra
In Fig 2 pre-processed FT-NIR spectra are shown in the spectral region used for the regression models As illustrated in Fig 2(B) and 2(C) 2nd derivative FT-NIR spectra of straw samples after different severities of physico-chemical pre-treatment show significant changes in the range between 7200 and 5500 cm-1 This spectral region is attributed to CH stretch 1st overtone vibration of the aromatic lignin structure which is overlapped with CH stretch 1st overtone vibration band of acetyl groups (CH3) of hemicelluloses mainly xylan in straw (Shenk et al 2001 Fackler et al 2007b Tsuchikawa et al 2005) Moreover modification of FT-NIR spectra ranging from 7200 to 6000 cm-1 attributed to alteration of OH stretch 1st overtone of amorphous semi-crystalline and crystalline cellulose (Tsuchikawa and Siesler 2003a Tsuchikawa and Siesler 2003b Watanabe et al 2006) were also observed after physico-chemical pre-treatment Qualitative changes in FT-NIR spectra after lignin degradation as well as degradation or deacetylation of polysaccharides were described in detail in the preceding article (Krongtaew et al 2010)
During the physico-chemical pre-treatment lignin and hemicelluloses were solubilized and the crystalline structure of the substrate was substantially changed These changes were reflected in the FT-NIR absorbance PLS regression models of FT-NIR
PEER-REVIEWED ARTICLE bioresourcescom
Krongtaew et al (2010) ldquoPart 2 Quantitative NIRrdquo BioResources 5(4) 2081-2096 2086
spectra between 6900 and 5510 cm-1 were set up for predicting total residual lignin content and the amount of hydrolysable reducing sugars of pretreated straw samples (Table 1) This spectral region includes a lignin band near 5980 cm-1 and xylan bands near 5800 5960 5990 cm-1 (Krongtaew et al 2010) as well as information on cellulose crystallinity (Fig 2(B)) A further PLS model was calculated from the entire FT-NIR spectra ranging from 10000 to 4000 cm-1 to estimate the weight loss after pre-treatment (Table 1) Weight loss leads to loss of NIR absorption of C-H O-H N-H and C=O vibration bands of organic substances (Fig 2(A)) Table 1 Parameters and Errors from Partial Least-Squares (PLS) Regression Models of Total Residual Lignin Reducing Sugar and Weight Loss of Delignified Wheat and Oat Straw Models Substrate Component
range No of samples No of test samples
Spectral region (cm-1)
Spectral pre-processing
Total residual lignin (ww)
Wheat straw Oat straw
79 - 207 83 - 185
80 40 53 27
6900- 5510 6900- 5510
2nd derivative 2nd derivative
Reducing sugars (mg g-1- straw)
Wheat straw Oat straw
128 - 1000 131 -812
80 40 53 27
6900- 5510 6900- 5510
2nd derivative 2nd derivative
Weight loss () Wheat straw Oat straw
40 - 335 50 - 440
80 40 53 27
10000-4000 10000-4000
No processing No processing
Models Substrate 1R2
cal 2RMSEE 3R2
test 4RMSEP No of
PLS Factors
Total residual lignin (ww)
Wheat straw Oat straw
095 099
09 05
094 096
09 08
3 1
Reducing sugars (mg g-1- straw)
Wheat straw Oat straw
094 096
45 mg g-1 54 mg g-1
089 093
83 mg g-1 64 mg g-1
4 1
Weight loss () Wheat straw Oat straw
085 096
29 26
075 091
35 34
4 4
1 Coefficient of determination of the calibration model 2 Root-mean-square error of estimation
3 Coefficient of determination of the test model 4 Root-mean-square error of prediction for future analysis
Lignin content amount of reducing sugars and the weight loss of oat straw of the pretreated samples were accurately evaluated from FT-NIR spectra by means of PLS regression (Table 1 and Fig 3) Good correlations between NIR-predicted and measured values were obtained for calibration and test sets as indicated by high values of the determination coefficients (Rsup2cal and R2
test) and low root-mean-square error of estimation and prediction (RMSEE and RMSEP) These model parameters and the low number of factors required to obtain this high correlation are good indications for the robustness and applicability of the regression models
PEER-REVIEWED ARTICLE bioresourcescom
Krongtaew et al (2010) ldquoPart 2 Quantitative NIRrdquo BioResources 5(4) 2081-2096 2087
Fig 2 FT-NIR spectra of wheat straw (A) and second derivative of FT-NIR spectra of pretreated wheat (B) and oat straw (C) samples containing different residual lignin contents
PEER-REVIEWED ARTICLE bioresourcescom
Krongtaew et al (2010) ldquoPart 2 Quantitative NIRrdquo BioResources 5(4) 2081-2096 2088
Fig 3 NIR-predicted and measured values of the PLS regression models of total residual lignin content (A D) reducing sugars (B E) and weight loss (C F) of calibration and test samples of pretreated wheat (WS) and oat straw (OS) samples The re-sampling method was applied for the models to ensure the reliability of all the PLS models as they were limited by a smaller number of observations when dividing the sample into two halves for calibration and test sets (Yu 2003) Ranges of R2
test RMSEP and number of PLS factors of ten different calibration and test sets demon-strated consistent and reliable results as shown in Table 2 The results showed the robustness and validity of the models for predicting total residual lignin reducing sugar and weight loss of physic-chemically pretreated wheat and oat straw samples Table 2 Re-Sampled Models of Ten Different Sub-Sample Sets for PLS Models of Total Residual Lignin Reducing Sugar and Weight Loss
Models Substrate Spectral region (cm-1)
Spectral pre-processing
1R2test 2RMSEP No of
PLS Factors
Total residual lignin (ww)
Wheat straw Oat straw
6900 ndash 5510 6900 ndash 5510
2nd derivative 2nd derivative
092-095 095-098
08-10 06-08
3 2-3
Reducing sugars (mg g-1 straw)
Wheat straw Oat straw
6900 ndash 5510 6900 ndash 5510
2nd derivative 2nd derivative
082-092 092-096
53-96 mg g-1 45-65 mg g-1
3-4 1-3
Weight loss () Wheat straw Oat straw
10000 ndash 4000 10000 ndash 4000
No processing No processing
065-073 084-093
33-41 24-39
3-4 4-5
1 Coefficient of determination of the test model 2 Root-mean-square error of prediction for future analysis
PEER-REVIEWED ARTICLE bioresourcescom
Krongtaew et al (2010) ldquoPart 2 Quantitative NIRrdquo BioResources 5(4) 2081-2096 2089
Assessment of Wheat Straw-to-Biogas Conversion by FT-NIR To optimize the PLS models for total solid content volatile solid content and
biogas yield some outliers were excluded from the 42 original samples thus the numbers of samples were different from those shown in Table 3 Although Rsup2cv of those cross-validated PLS models for total solid volatile solid and biogas yield were not as high as for those described above (Table 3 and Fig 5) the current models deliver a good estimation of these parameters Furthermore the much higher Rsup2cal the low number of PLS factors and the low bias of these models indicate the high potential of the FT-NIR method also to analyse these parameters
Table 3 PLS Regression Models from FT-NIR Spectral Data of Pretreated Wheat Straw Parameters Total solids Volatile solids Biogas Wave number [cm-1] Component range Spectral processing No of samples No of PLS factors
7200 - 5500 936-997 Second derivative 32 5
7200 - 5500 945-992 Second derivative 38 5
7500 - 5500 219-387 mL g-1 straw Min-Max normalization 30 5
Calibration R2
cal
RMSEE1
091 07
091 03
077 21 mL g-1 straw
Cross validation R2
cv RMSECV2
Bias
080 09 -005
075 05 003
065 23 mL g-1 straw 073
1 Root mean square error of estimation 2 Root mean square error of cross validation
An acceptable prediction of biogas yield was obtained (R2
cv = 065) from pretreated straw spectra when the consistency of inoculum seed quality and digestion condition were controlled Thus the analytical technology using the implementation of FT-NIR spectroscopy in the combination of mathematically spectral data processing could be applied to the entire system of biomass-to-bioenergy processes Biogas yield was well correlated to the amount of fermentable sugars available as carbon source for anaerobic digestion and also to the lignin content of the pretreated straw (Table 4) It was additionally observed that the yield of anaerobic digestion was influenced by the particle size of wheat straw (80 microm and 2 mm) (Fig 4) Pretreated straw with smaller particles (80 microm) gave higher biogas yields compared with larger particles (2 mm) while lignin content and the amount of reducing sugars of the same samples from wet-chemistry analyses were at the same levels The reason is most likely due to better accessibility of microbial enzymes toward the smaller particle size of straw Moreover the coefficient of correlation (R) between lignin and biogas as well as reducing sugar and biogas (Fig 4(A) 4(B)) were higher when determined among the same sets of particle size compared with those from all samples (Table 4) The PLS model however included all particle sizes
PEER-REVIEWED ARTICLE bioresourcescom
Krongtaew et al (2010) ldquoPart 2 Quantitative NIRrdquo BioResources 5(4) 2081-2096 2090
Table 4 Correlation Matrix of Key Parameters for Biomass-to-Biogas Conversion of Wheat Straw
Lignin Reducing sugars
Weight loss Total solid Volatile solid
Biogas
Lignin R=10
R=-08
R=-09
R=-02
R=-04
R=-06 Reducing sugars
-
R=10
R=08
R=01
R=02
R=06
Weight loss -
-
R=10
R=00
R=04
R=01
Total solid
-
-
-
R=10
R=-04
R=03
Volatile solid
-
-
-
-
R=10
R=-02
Biogas -
-
-
-
-
R=10
Fig 4 Correlation between total lignin and biogas (A) and enzymatically released reducing sugars and biogas (B) where diams and represent data from 80-microm and 2-mm straw samples respectively
PEER-REVIEWED ARTICLE bioresourcescom
Krongtaew et al (2010) ldquoPart 2 Quantitative NIRrdquo BioResources 5(4) 2081-2096 2091
Fig 5 NIR-predicted and measured values of (A) total solid (B) volatile solids and (C) biogas yield from the cross validation of PLS regression models of pretreated wheat straw Black solid indicates the outlier
A recent study demonstrated the prediction of biological methane potential based on a number of parameters - carbohydrates proteins lipids acetate and propionate concentration of a digested sludge mixture (Kaparaju et al 2009) Some scientific work also demonstrated the potential application of NIR for predicting volatile solids total solids chemical oxygen demand (COD) and several volatile fatty acids (VFA) of digested sludge from the biogas pilot plant the models relied mainly on different process constraints and were designed as analytical techniques for online-process control (Holm-Nielsen et al 2006 2007) The present study in contrast demonstrates the assessment of biogas yield based on chemical structure and composition of the substrate by FT-NIR spectroscopy Biogas yield is based on the stoichiometric conversion of organic material to biogas as shown in equation (1) Volatile organic compounds in lignocelluloses are theoretically converted to methane (CH4) and carbon dioxide (CO2) which are collectively called biogas (Buswell and Mueller 1952) In most methanogenic fermentations the methane yield lies close to the theoretical maximum of 3 moles of methane per mole of glucose as calculated from the Buswell equation (1) (Ahring and Westermann 2007) Thus the theoretical methane yield of untreated wheat straw is approximately 105 mmol CH4 and 105 mmol CO2 per g straw as wheat straw contains 63 polysaccharides (glucose equivalence) These values were calculated to 2352 mL CH4 and 2352 mL CO2 as one mole of an ideal gas at STP occupies 224 L
242 48248224COcbaCHcbaOHcbaOHC cba ⎟⎠⎞
⎜⎝⎛ +minus+⎟
⎠⎞
⎜⎝⎛ minus+rarr⎟
⎠⎞
⎜⎝⎛ minusminus+ (1)
However due to the complex structure which is rather hard to attack lignocellulose leads to yields lower than this theoretical maximum The presence of organic recalcitrant compounds in straw eg lignin and crystalline cellulose influences the yield of anaerobic digestion These properties of the substrate are reflected in the FT-NIR spectra and can serve for the prediction of the potential biogas yield For instance it has been reported that some parts of the crystalline structure of cellulose are loosened and
PEER-REVIEWED ARTICLE bioresourcescom
Krongtaew et al (2010) ldquoPart 2 Quantitative NIRrdquo BioResources 5(4) 2081-2096 2092
converted to semi-crystalline structures after physico-chemical pre-treatment (Krongtaew et al 2010) This could lead to higher susceptibility of cellulose and provided higher biomass utilization efficiency PLS Loading Spectra
PLS loading spectra contain the descriptive information of FT-NIR absorption regions that influence the PLS regression models As shown in Fig 6(A) the first loading factor (PLS1 2nd derivative pre-processing) of lignin content represents 82 of the data variance and PLS1 of reducing sugar represents 75 of the data variance The major fraction of the spectral variance influencing these models is found between 7200 and 5500 cm-1 where lignin xylan and acetyl groups of polysaccharides absorb As shown by highest negative amplitudes near 5980 cm-1 the spectral position is attributed to the C-H stretch 1st overtone of aromatic rings and the prediction of the lignin content is mainly based on this band But a high lignin content is also correlated with a low xylan content as indicated by the negative PLS loading vectors of lignin+polysaccharides bands near 5800 cm-1 the overlapping band of C-H stretch 1st overtone of lignin and acetyl groups (Lg+Xy Fig 6A) and the broad band of amorphous polysaccharides near 7000 cm-1 Bands assigned to crystalline II (6280 cm-1) and semi-crystalline (6722 cm-1) cellulose however exhibit positive loading vectors indicating high cellulose content of the samples with low lignin content and vice versa It is known that lignin degradation of lignocellulosic substrates leads to better accessible and enzymatically hydrolysable polysaccharides and thus to a higher yield of reducing sugars In fact these two parameters showed a high negative correlation of R = -08 in the data set analysed here (Table 4) This correlation was also found in the first loading spectrum of the model for reducing sugars which is very much alike that of the lignin model but shows the opposite algebraic sign
The correlation matrix (Table 4) shows the low correlation of total solids with all other parameters determined Consequently PLS-loading spectra (Fig 6(B)) were not directly connected to the content of the straw constituents Nevertheless most of the data variance (62) was explained by the second and third PLS loading factor (PLS2 and PLS3 2nd derivative pre-processing) and the regression model showed good predictable results for total solid content (Table 3 and Fig 5(A))
For the PLS loading spectra (2nd derivative pre-processing) of volatile solids (Fig 6(C)) which is the content of combustible organic materials PLS1 and PLS3 contributed mostly to the PLS model In the PLS1 loading spectrum lignin and xylan overlapping band (Lg+Xy) showed the highest influence on the model Amorphous polysaccharides (Am) near 7000 cm-1 and lignin-polysaccharide overlapping band near 5800 cm-1 (Lg+Ps) also appeared A high content of volatile solids was predicted from pretreated straw sample which contained low lignin and xylan (Lg+Xy) content as well as lignin and polysaccharide overlapping (Lg+Ps) but high amount of crystalline (Cry II) semi-crystalline (Sc) and amorphous (Am) cellulose indicating the extraction of inorganic compounds during the pre-treatment
PEER-REVIEWED ARTICLE bioresourcescom
Krongtaew et al (2010) ldquoPart 2 Quantitative NIRrdquo BioResources 5(4) 2081-2096 2093
Fig 6 PLS loading spectra of partial least-squares regression models (A) lignin content and amount of reducing sugar (B) total solids (C) volatile solids and (D) biogas yield
PEER-REVIEWED ARTICLE bioresourcescom
Krongtaew et al (2010) ldquoPart 2 Quantitative NIRrdquo BioResources 5(4) 2081-2096 2094
The first PLS factor of PLS regression models (minimummaximum normaliza-tion pre-processing) of biogas accounted for only 1 of the data variance therefore the second PLS factors is discussed here (Fig 6(D)) PLS2 represented 31 of the data variance and showed the importance of amorphous (Am) polysaccharides for a high biogas yield Crystalline cellulose (Cry II) however had an adverse effect as indicated by a negative loading vector of PLS2 in the respective region In summary it can be seen from the PLS loading spectra that lignin xylan and both amorphous and crystalline moieties of cellulose were representative onto the PLS model for evaluating biogas yield based on straw chemical structure after different severities of various physico-chemical pre-treatment methods Thus biogas potential of physico-chemically pretreated straw can be predicted based on the chemical characteristics and composition by FT-NIR assisted by multivariate data analysis
CONCLUSIONS
Fourier transform near-infrared (FT-NIR) spectroscopy combined with multi-variate data analyses has potential as an analytical tool for not only qualitative characterization of lignocellulose after different pre-treatment methods through the vibration bands of FT-NIR spectra (Krongtaew et al 2010) but also quantitative assessment for key parameters of both pre-treatment and biomass-to-bioenergy production Total residual lignin content enzymatically released reducing sugars total solids (TS) volatile solids (VS) and biogas yield can be analysed This approach can be considered as an alternative process analytical technology (PAT) for assessment of biomass utilization and biomass-to-biogas production offering a powerful and low-budget technique for rapidly growing and bulk volume industries
Furthermore the descriptive information in the loading vectors confirmed the importance of delignification for successful enzymatic and microbial conversion of the structural polysaccharides as well as the adverse effect of high cellulose crystallinity ACKNOWLEDGEMENTS
The authors are grateful to the financial support from the Austrian Research Promotion Agency (FFG project number 81954914233SCKSAI) KF acknowledges the support of FWF the Austrian Science Fund (FWF project number V117-N17) REFERENCES CITED Ahring B K and Westermann P (2007) ldquoCoproduction of bioethanol with other
biofuelsrdquo Adv Biochem EnginBiotechnol 108 289-302 Angelidaki I Ellegaard L and Ahring B K (1992) ldquoCompact automated
displacement gas metering system for measurement of low gas rates from laboratory fermentorsrdquo Biotechnol Bioeng 39 351-353
PEER-REVIEWED ARTICLE bioresourcescom
Krongtaew et al (2010) ldquoPart 2 Quantitative NIRrdquo BioResources 5(4) 2081-2096 2095
Buswell A M and Mueller H F (1952) ldquoMechanism of methane fermentationrdquo Ind Engin Chem 44(3) 550-552
Chandra R P Bura R Mabee W Pan X Berlin A and Saddler J N (2007) ldquoSubstrate pretreatment The key to effective enzymatic hydrolysis of lignocellulosicsrdquo Adv Biochem EnginBiotechnol 108 67-93
Energy Efficiency amp Renewable Energy US Department of Energy (2009) lthttpwww1eereenergygovbiomassanalytical_procedureshtmlgt viewed in September 2009
Fackler K Schmutzer M Manoch L Schwanninger M Hinterstoisser B Ters T Messner K and Gradinger C (2007a) ldquoEvaluation of the selectivity of white rot isolates using near infrared spectroscopic techniquesrdquo Enzyme Microb Technol 41 881-887
Fackler K Schwanninger M Gradinger C Hinterstoisser B and Messner K (2007b) ldquoQualitative and quantitative changes of beech wood degraded by wood-rotting basidiomycetes monitored by Fourier transform infrared spectroscopic methods and multivariate data analysisrdquo FEMS Microbiol Lett 271(2) 162-169
Ghosh S and Rodgers J (2001) ldquoNIR analysis of textilesrdquo In Burns D A and Ciurczak E W (eds) Handbook of Near-Infrared Analysis 2nd Ed Marcel Dekker Inc New York 573-607
Himmel M E Ding S Y Johnson D K Adney W S Numlos M R Brady J W and Foust T D (2007) ldquoBiomass recalcitrance Engineering plants and enzymes for biofuels productionrdquo Science 315 804-807
Holm-Nielsen J B Dahl C K and Esbensen K H (2006) ldquoRepresentative sampling for process analytical characterization of heterogeneous bioslurry systemsmdasha reference study of sampling issues in PATrdquo Chemom Intell Lab Syst 83 114-126
Holm-Nielsen J B Andree H Lindorfer H and Esbensen K H (2007) ldquoTransflexive embedded near infrared monitoring for key process intermediates in anaerobic digestionbiogas productionrdquo J Near Infrared Spectrosc 15 123-135
Kaparaju P Serrano M Thomsen A B Kongjan P and Angelidaki I (2009) ldquoBioethanol biohydrogen and biogas production from wheat straw in a biorefinery conceptrdquo Biores Technol 100 2562-2568
Kong X Xie J Wu Y Huang Y and Bao J (2005) ldquoRapid prediction of acid detergent fiber neutral detergent fiber and acid detergent lignin of rice materials by near-infrared spectroscopyrdquo J Agric Food Chem 53 2843-2848
Krongtaew C Messner K Ters T and Fackler K (2010) ldquoCharacterization of key parameters for biotechnological lignocellulose conversion assessed by FT-NIR spectroscopy Part I Qualitative analysis of pretreated strawrdquo BioResources 5(4) 2063-2080
Kumar P Barrett D M Delwiche M J and Stroeve P (2009) ldquoMethods for pretreatment of lignocellulosic biomass for efficient hydrolysis and biofuel productionrdquo Ind Eng Chem Res 48 3713-3729
Ozaki Y McClure W F and Christy A A (2007) Near Infrared Spectroscopy in Food Science and Technology Wiley Interscience New Jersey
Savitzky A and Golay M J E (1964) ldquoSmoothing and differentiation of data by simplified least squares proceduresrdquo Anal Chem 36(8) 1627-1639
PEER-REVIEWED ARTICLE bioresourcescom
Krongtaew et al (2010) ldquoPart 2 Quantitative NIRrdquo BioResources 5(4) 2081-2096 2096
Shenk J S Workman J J and Westerhaus M O (2001) ldquoApplication of NIR spectroscopy to agricultural productsrdquo In Burns D A and Ciurczak E W (eds) Handbook of Near-Infrared Analysis 2nd Ed Marcel Dekker Inc New York 419-474
Siesler H W Ozaki Y Kawata S and Heise H M (2002) Near Infrared Spectroscopy Principles Instruments and Applications Wiley VCH Germany
Tsuchikawa S and Siesler H W (2003a) ldquoNear-infrared spectroscopic monitoring of the diffusion process of deuterium-labeled molecules in wood Part II Hardwoodrdquo Appl Spectrosc 57 675-681
Tsuchikawa S and Siesler H W (2003b) ldquoNear-infrared spectroscopic monitoring of the diffusion process of deuterium-labeled molecules in wood Part I Softwoodrdquo Appl Spectrosc 57 667-674
Tsuchikawa S Yonenobu H and Siesler H W (2005) ldquoNear-infrared spectroscopic observation of the ageing process in archaeological wood using a deuterium exchange methodrdquo Analyst 130 379-384
Watanabe A Morita S and Ozaki Y (2006) ldquoTemperature-dependent structural changes in hydrogen bonds in microcrystalline cellulose studied by infrared and near-infrared spectroscopy with perturbation-correlation moving-window two-dimensional correlation analysisrdquo Appl Spectrosc 60(6) 611-618
Wilkie A C Smith P H and Bordeaux F M (2004) ldquoAn economical bioreactor for evaluating biogas potential of particulate biomassrdquo Biores Technol 92 103-109
Yu C H (2003) ldquoResampling methods Concepts applications and justificationrdquo Practical Assessment Research amp Evaluation 8(19) Retrieved July 31 2010 from httpPAREonlinenetgetvnaspv=8ampn=19
Article submitted June 22 2010 Peer review completed July 18 2010 Revised version received and accepted August 5 2010 Published August 6 2010
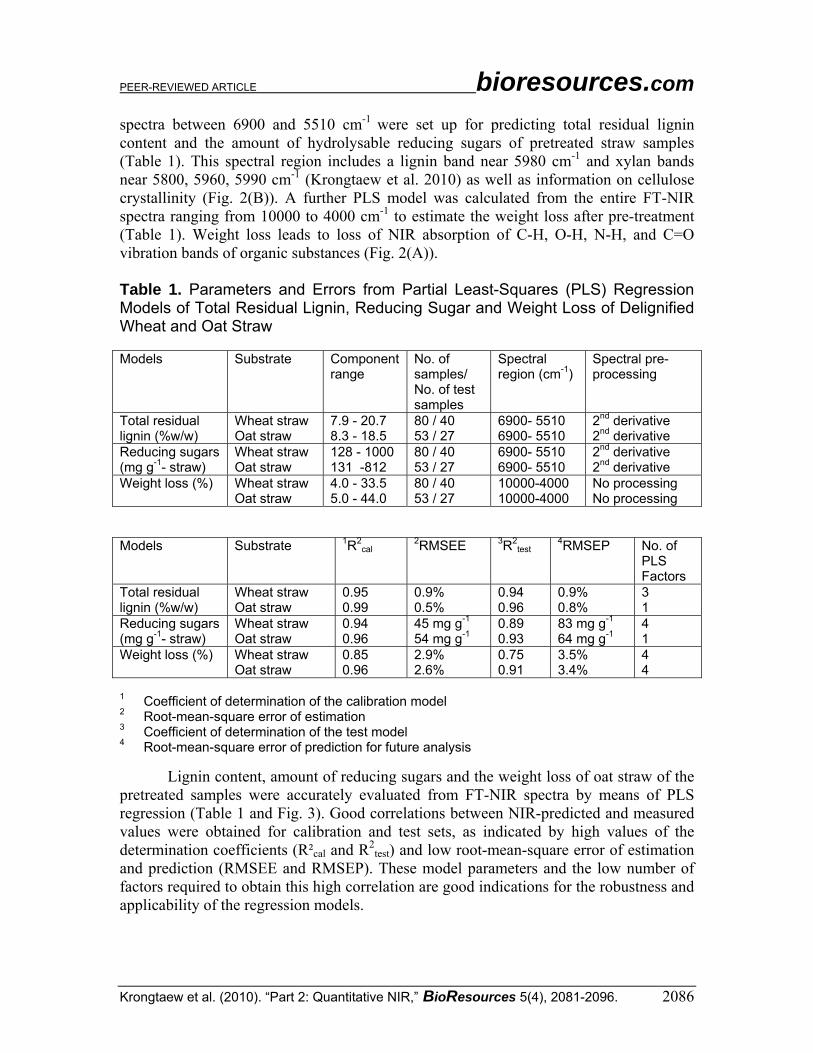
PEER-REVIEWED ARTICLE bioresourcescom
Krongtaew et al (2010) ldquoPart 2 Quantitative NIRrdquo BioResources 5(4) 2081-2096 2086
spectra between 6900 and 5510 cm-1 were set up for predicting total residual lignin content and the amount of hydrolysable reducing sugars of pretreated straw samples (Table 1) This spectral region includes a lignin band near 5980 cm-1 and xylan bands near 5800 5960 5990 cm-1 (Krongtaew et al 2010) as well as information on cellulose crystallinity (Fig 2(B)) A further PLS model was calculated from the entire FT-NIR spectra ranging from 10000 to 4000 cm-1 to estimate the weight loss after pre-treatment (Table 1) Weight loss leads to loss of NIR absorption of C-H O-H N-H and C=O vibration bands of organic substances (Fig 2(A)) Table 1 Parameters and Errors from Partial Least-Squares (PLS) Regression Models of Total Residual Lignin Reducing Sugar and Weight Loss of Delignified Wheat and Oat Straw Models Substrate Component
range No of samples No of test samples
Spectral region (cm-1)
Spectral pre-processing
Total residual lignin (ww)
Wheat straw Oat straw
79 - 207 83 - 185
80 40 53 27
6900- 5510 6900- 5510
2nd derivative 2nd derivative
Reducing sugars (mg g-1- straw)
Wheat straw Oat straw
128 - 1000 131 -812
80 40 53 27
6900- 5510 6900- 5510
2nd derivative 2nd derivative
Weight loss () Wheat straw Oat straw
40 - 335 50 - 440
80 40 53 27
10000-4000 10000-4000
No processing No processing
Models Substrate 1R2
cal 2RMSEE 3R2
test 4RMSEP No of
PLS Factors
Total residual lignin (ww)
Wheat straw Oat straw
095 099
09 05
094 096
09 08
3 1
Reducing sugars (mg g-1- straw)
Wheat straw Oat straw
094 096
45 mg g-1 54 mg g-1
089 093
83 mg g-1 64 mg g-1
4 1
Weight loss () Wheat straw Oat straw
085 096
29 26
075 091
35 34
4 4
1 Coefficient of determination of the calibration model 2 Root-mean-square error of estimation
3 Coefficient of determination of the test model 4 Root-mean-square error of prediction for future analysis
Lignin content amount of reducing sugars and the weight loss of oat straw of the pretreated samples were accurately evaluated from FT-NIR spectra by means of PLS regression (Table 1 and Fig 3) Good correlations between NIR-predicted and measured values were obtained for calibration and test sets as indicated by high values of the determination coefficients (Rsup2cal and R2
test) and low root-mean-square error of estimation and prediction (RMSEE and RMSEP) These model parameters and the low number of factors required to obtain this high correlation are good indications for the robustness and applicability of the regression models
PEER-REVIEWED ARTICLE bioresourcescom
Krongtaew et al (2010) ldquoPart 2 Quantitative NIRrdquo BioResources 5(4) 2081-2096 2087
Fig 2 FT-NIR spectra of wheat straw (A) and second derivative of FT-NIR spectra of pretreated wheat (B) and oat straw (C) samples containing different residual lignin contents
PEER-REVIEWED ARTICLE bioresourcescom
Krongtaew et al (2010) ldquoPart 2 Quantitative NIRrdquo BioResources 5(4) 2081-2096 2088
Fig 3 NIR-predicted and measured values of the PLS regression models of total residual lignin content (A D) reducing sugars (B E) and weight loss (C F) of calibration and test samples of pretreated wheat (WS) and oat straw (OS) samples The re-sampling method was applied for the models to ensure the reliability of all the PLS models as they were limited by a smaller number of observations when dividing the sample into two halves for calibration and test sets (Yu 2003) Ranges of R2
test RMSEP and number of PLS factors of ten different calibration and test sets demon-strated consistent and reliable results as shown in Table 2 The results showed the robustness and validity of the models for predicting total residual lignin reducing sugar and weight loss of physic-chemically pretreated wheat and oat straw samples Table 2 Re-Sampled Models of Ten Different Sub-Sample Sets for PLS Models of Total Residual Lignin Reducing Sugar and Weight Loss
Models Substrate Spectral region (cm-1)
Spectral pre-processing
1R2test 2RMSEP No of
PLS Factors
Total residual lignin (ww)
Wheat straw Oat straw
6900 ndash 5510 6900 ndash 5510
2nd derivative 2nd derivative
092-095 095-098
08-10 06-08
3 2-3
Reducing sugars (mg g-1 straw)
Wheat straw Oat straw
6900 ndash 5510 6900 ndash 5510
2nd derivative 2nd derivative
082-092 092-096
53-96 mg g-1 45-65 mg g-1
3-4 1-3
Weight loss () Wheat straw Oat straw
10000 ndash 4000 10000 ndash 4000
No processing No processing
065-073 084-093
33-41 24-39
3-4 4-5
1 Coefficient of determination of the test model 2 Root-mean-square error of prediction for future analysis
PEER-REVIEWED ARTICLE bioresourcescom
Krongtaew et al (2010) ldquoPart 2 Quantitative NIRrdquo BioResources 5(4) 2081-2096 2089
Assessment of Wheat Straw-to-Biogas Conversion by FT-NIR To optimize the PLS models for total solid content volatile solid content and
biogas yield some outliers were excluded from the 42 original samples thus the numbers of samples were different from those shown in Table 3 Although Rsup2cv of those cross-validated PLS models for total solid volatile solid and biogas yield were not as high as for those described above (Table 3 and Fig 5) the current models deliver a good estimation of these parameters Furthermore the much higher Rsup2cal the low number of PLS factors and the low bias of these models indicate the high potential of the FT-NIR method also to analyse these parameters
Table 3 PLS Regression Models from FT-NIR Spectral Data of Pretreated Wheat Straw Parameters Total solids Volatile solids Biogas Wave number [cm-1] Component range Spectral processing No of samples No of PLS factors
7200 - 5500 936-997 Second derivative 32 5
7200 - 5500 945-992 Second derivative 38 5
7500 - 5500 219-387 mL g-1 straw Min-Max normalization 30 5
Calibration R2
cal
RMSEE1
091 07
091 03
077 21 mL g-1 straw
Cross validation R2
cv RMSECV2
Bias
080 09 -005
075 05 003
065 23 mL g-1 straw 073
1 Root mean square error of estimation 2 Root mean square error of cross validation
An acceptable prediction of biogas yield was obtained (R2
cv = 065) from pretreated straw spectra when the consistency of inoculum seed quality and digestion condition were controlled Thus the analytical technology using the implementation of FT-NIR spectroscopy in the combination of mathematically spectral data processing could be applied to the entire system of biomass-to-bioenergy processes Biogas yield was well correlated to the amount of fermentable sugars available as carbon source for anaerobic digestion and also to the lignin content of the pretreated straw (Table 4) It was additionally observed that the yield of anaerobic digestion was influenced by the particle size of wheat straw (80 microm and 2 mm) (Fig 4) Pretreated straw with smaller particles (80 microm) gave higher biogas yields compared with larger particles (2 mm) while lignin content and the amount of reducing sugars of the same samples from wet-chemistry analyses were at the same levels The reason is most likely due to better accessibility of microbial enzymes toward the smaller particle size of straw Moreover the coefficient of correlation (R) between lignin and biogas as well as reducing sugar and biogas (Fig 4(A) 4(B)) were higher when determined among the same sets of particle size compared with those from all samples (Table 4) The PLS model however included all particle sizes
PEER-REVIEWED ARTICLE bioresourcescom
Krongtaew et al (2010) ldquoPart 2 Quantitative NIRrdquo BioResources 5(4) 2081-2096 2090
Table 4 Correlation Matrix of Key Parameters for Biomass-to-Biogas Conversion of Wheat Straw
Lignin Reducing sugars
Weight loss Total solid Volatile solid
Biogas
Lignin R=10
R=-08
R=-09
R=-02
R=-04
R=-06 Reducing sugars
-
R=10
R=08
R=01
R=02
R=06
Weight loss -
-
R=10
R=00
R=04
R=01
Total solid
-
-
-
R=10
R=-04
R=03
Volatile solid
-
-
-
-
R=10
R=-02
Biogas -
-
-
-
-
R=10
Fig 4 Correlation between total lignin and biogas (A) and enzymatically released reducing sugars and biogas (B) where diams and represent data from 80-microm and 2-mm straw samples respectively
PEER-REVIEWED ARTICLE bioresourcescom
Krongtaew et al (2010) ldquoPart 2 Quantitative NIRrdquo BioResources 5(4) 2081-2096 2091
Fig 5 NIR-predicted and measured values of (A) total solid (B) volatile solids and (C) biogas yield from the cross validation of PLS regression models of pretreated wheat straw Black solid indicates the outlier
A recent study demonstrated the prediction of biological methane potential based on a number of parameters - carbohydrates proteins lipids acetate and propionate concentration of a digested sludge mixture (Kaparaju et al 2009) Some scientific work also demonstrated the potential application of NIR for predicting volatile solids total solids chemical oxygen demand (COD) and several volatile fatty acids (VFA) of digested sludge from the biogas pilot plant the models relied mainly on different process constraints and were designed as analytical techniques for online-process control (Holm-Nielsen et al 2006 2007) The present study in contrast demonstrates the assessment of biogas yield based on chemical structure and composition of the substrate by FT-NIR spectroscopy Biogas yield is based on the stoichiometric conversion of organic material to biogas as shown in equation (1) Volatile organic compounds in lignocelluloses are theoretically converted to methane (CH4) and carbon dioxide (CO2) which are collectively called biogas (Buswell and Mueller 1952) In most methanogenic fermentations the methane yield lies close to the theoretical maximum of 3 moles of methane per mole of glucose as calculated from the Buswell equation (1) (Ahring and Westermann 2007) Thus the theoretical methane yield of untreated wheat straw is approximately 105 mmol CH4 and 105 mmol CO2 per g straw as wheat straw contains 63 polysaccharides (glucose equivalence) These values were calculated to 2352 mL CH4 and 2352 mL CO2 as one mole of an ideal gas at STP occupies 224 L
242 48248224COcbaCHcbaOHcbaOHC cba ⎟⎠⎞
⎜⎝⎛ +minus+⎟
⎠⎞
⎜⎝⎛ minus+rarr⎟
⎠⎞
⎜⎝⎛ minusminus+ (1)
However due to the complex structure which is rather hard to attack lignocellulose leads to yields lower than this theoretical maximum The presence of organic recalcitrant compounds in straw eg lignin and crystalline cellulose influences the yield of anaerobic digestion These properties of the substrate are reflected in the FT-NIR spectra and can serve for the prediction of the potential biogas yield For instance it has been reported that some parts of the crystalline structure of cellulose are loosened and
PEER-REVIEWED ARTICLE bioresourcescom
Krongtaew et al (2010) ldquoPart 2 Quantitative NIRrdquo BioResources 5(4) 2081-2096 2092
converted to semi-crystalline structures after physico-chemical pre-treatment (Krongtaew et al 2010) This could lead to higher susceptibility of cellulose and provided higher biomass utilization efficiency PLS Loading Spectra
PLS loading spectra contain the descriptive information of FT-NIR absorption regions that influence the PLS regression models As shown in Fig 6(A) the first loading factor (PLS1 2nd derivative pre-processing) of lignin content represents 82 of the data variance and PLS1 of reducing sugar represents 75 of the data variance The major fraction of the spectral variance influencing these models is found between 7200 and 5500 cm-1 where lignin xylan and acetyl groups of polysaccharides absorb As shown by highest negative amplitudes near 5980 cm-1 the spectral position is attributed to the C-H stretch 1st overtone of aromatic rings and the prediction of the lignin content is mainly based on this band But a high lignin content is also correlated with a low xylan content as indicated by the negative PLS loading vectors of lignin+polysaccharides bands near 5800 cm-1 the overlapping band of C-H stretch 1st overtone of lignin and acetyl groups (Lg+Xy Fig 6A) and the broad band of amorphous polysaccharides near 7000 cm-1 Bands assigned to crystalline II (6280 cm-1) and semi-crystalline (6722 cm-1) cellulose however exhibit positive loading vectors indicating high cellulose content of the samples with low lignin content and vice versa It is known that lignin degradation of lignocellulosic substrates leads to better accessible and enzymatically hydrolysable polysaccharides and thus to a higher yield of reducing sugars In fact these two parameters showed a high negative correlation of R = -08 in the data set analysed here (Table 4) This correlation was also found in the first loading spectrum of the model for reducing sugars which is very much alike that of the lignin model but shows the opposite algebraic sign
The correlation matrix (Table 4) shows the low correlation of total solids with all other parameters determined Consequently PLS-loading spectra (Fig 6(B)) were not directly connected to the content of the straw constituents Nevertheless most of the data variance (62) was explained by the second and third PLS loading factor (PLS2 and PLS3 2nd derivative pre-processing) and the regression model showed good predictable results for total solid content (Table 3 and Fig 5(A))
For the PLS loading spectra (2nd derivative pre-processing) of volatile solids (Fig 6(C)) which is the content of combustible organic materials PLS1 and PLS3 contributed mostly to the PLS model In the PLS1 loading spectrum lignin and xylan overlapping band (Lg+Xy) showed the highest influence on the model Amorphous polysaccharides (Am) near 7000 cm-1 and lignin-polysaccharide overlapping band near 5800 cm-1 (Lg+Ps) also appeared A high content of volatile solids was predicted from pretreated straw sample which contained low lignin and xylan (Lg+Xy) content as well as lignin and polysaccharide overlapping (Lg+Ps) but high amount of crystalline (Cry II) semi-crystalline (Sc) and amorphous (Am) cellulose indicating the extraction of inorganic compounds during the pre-treatment
PEER-REVIEWED ARTICLE bioresourcescom
Krongtaew et al (2010) ldquoPart 2 Quantitative NIRrdquo BioResources 5(4) 2081-2096 2093
Fig 6 PLS loading spectra of partial least-squares regression models (A) lignin content and amount of reducing sugar (B) total solids (C) volatile solids and (D) biogas yield
PEER-REVIEWED ARTICLE bioresourcescom
Krongtaew et al (2010) ldquoPart 2 Quantitative NIRrdquo BioResources 5(4) 2081-2096 2094
The first PLS factor of PLS regression models (minimummaximum normaliza-tion pre-processing) of biogas accounted for only 1 of the data variance therefore the second PLS factors is discussed here (Fig 6(D)) PLS2 represented 31 of the data variance and showed the importance of amorphous (Am) polysaccharides for a high biogas yield Crystalline cellulose (Cry II) however had an adverse effect as indicated by a negative loading vector of PLS2 in the respective region In summary it can be seen from the PLS loading spectra that lignin xylan and both amorphous and crystalline moieties of cellulose were representative onto the PLS model for evaluating biogas yield based on straw chemical structure after different severities of various physico-chemical pre-treatment methods Thus biogas potential of physico-chemically pretreated straw can be predicted based on the chemical characteristics and composition by FT-NIR assisted by multivariate data analysis
CONCLUSIONS
Fourier transform near-infrared (FT-NIR) spectroscopy combined with multi-variate data analyses has potential as an analytical tool for not only qualitative characterization of lignocellulose after different pre-treatment methods through the vibration bands of FT-NIR spectra (Krongtaew et al 2010) but also quantitative assessment for key parameters of both pre-treatment and biomass-to-bioenergy production Total residual lignin content enzymatically released reducing sugars total solids (TS) volatile solids (VS) and biogas yield can be analysed This approach can be considered as an alternative process analytical technology (PAT) for assessment of biomass utilization and biomass-to-biogas production offering a powerful and low-budget technique for rapidly growing and bulk volume industries
Furthermore the descriptive information in the loading vectors confirmed the importance of delignification for successful enzymatic and microbial conversion of the structural polysaccharides as well as the adverse effect of high cellulose crystallinity ACKNOWLEDGEMENTS
The authors are grateful to the financial support from the Austrian Research Promotion Agency (FFG project number 81954914233SCKSAI) KF acknowledges the support of FWF the Austrian Science Fund (FWF project number V117-N17) REFERENCES CITED Ahring B K and Westermann P (2007) ldquoCoproduction of bioethanol with other
biofuelsrdquo Adv Biochem EnginBiotechnol 108 289-302 Angelidaki I Ellegaard L and Ahring B K (1992) ldquoCompact automated
displacement gas metering system for measurement of low gas rates from laboratory fermentorsrdquo Biotechnol Bioeng 39 351-353
PEER-REVIEWED ARTICLE bioresourcescom
Krongtaew et al (2010) ldquoPart 2 Quantitative NIRrdquo BioResources 5(4) 2081-2096 2095
Buswell A M and Mueller H F (1952) ldquoMechanism of methane fermentationrdquo Ind Engin Chem 44(3) 550-552
Chandra R P Bura R Mabee W Pan X Berlin A and Saddler J N (2007) ldquoSubstrate pretreatment The key to effective enzymatic hydrolysis of lignocellulosicsrdquo Adv Biochem EnginBiotechnol 108 67-93
Energy Efficiency amp Renewable Energy US Department of Energy (2009) lthttpwww1eereenergygovbiomassanalytical_procedureshtmlgt viewed in September 2009
Fackler K Schmutzer M Manoch L Schwanninger M Hinterstoisser B Ters T Messner K and Gradinger C (2007a) ldquoEvaluation of the selectivity of white rot isolates using near infrared spectroscopic techniquesrdquo Enzyme Microb Technol 41 881-887
Fackler K Schwanninger M Gradinger C Hinterstoisser B and Messner K (2007b) ldquoQualitative and quantitative changes of beech wood degraded by wood-rotting basidiomycetes monitored by Fourier transform infrared spectroscopic methods and multivariate data analysisrdquo FEMS Microbiol Lett 271(2) 162-169
Ghosh S and Rodgers J (2001) ldquoNIR analysis of textilesrdquo In Burns D A and Ciurczak E W (eds) Handbook of Near-Infrared Analysis 2nd Ed Marcel Dekker Inc New York 573-607
Himmel M E Ding S Y Johnson D K Adney W S Numlos M R Brady J W and Foust T D (2007) ldquoBiomass recalcitrance Engineering plants and enzymes for biofuels productionrdquo Science 315 804-807
Holm-Nielsen J B Dahl C K and Esbensen K H (2006) ldquoRepresentative sampling for process analytical characterization of heterogeneous bioslurry systemsmdasha reference study of sampling issues in PATrdquo Chemom Intell Lab Syst 83 114-126
Holm-Nielsen J B Andree H Lindorfer H and Esbensen K H (2007) ldquoTransflexive embedded near infrared monitoring for key process intermediates in anaerobic digestionbiogas productionrdquo J Near Infrared Spectrosc 15 123-135
Kaparaju P Serrano M Thomsen A B Kongjan P and Angelidaki I (2009) ldquoBioethanol biohydrogen and biogas production from wheat straw in a biorefinery conceptrdquo Biores Technol 100 2562-2568
Kong X Xie J Wu Y Huang Y and Bao J (2005) ldquoRapid prediction of acid detergent fiber neutral detergent fiber and acid detergent lignin of rice materials by near-infrared spectroscopyrdquo J Agric Food Chem 53 2843-2848
Krongtaew C Messner K Ters T and Fackler K (2010) ldquoCharacterization of key parameters for biotechnological lignocellulose conversion assessed by FT-NIR spectroscopy Part I Qualitative analysis of pretreated strawrdquo BioResources 5(4) 2063-2080
Kumar P Barrett D M Delwiche M J and Stroeve P (2009) ldquoMethods for pretreatment of lignocellulosic biomass for efficient hydrolysis and biofuel productionrdquo Ind Eng Chem Res 48 3713-3729
Ozaki Y McClure W F and Christy A A (2007) Near Infrared Spectroscopy in Food Science and Technology Wiley Interscience New Jersey
Savitzky A and Golay M J E (1964) ldquoSmoothing and differentiation of data by simplified least squares proceduresrdquo Anal Chem 36(8) 1627-1639
PEER-REVIEWED ARTICLE bioresourcescom
Krongtaew et al (2010) ldquoPart 2 Quantitative NIRrdquo BioResources 5(4) 2081-2096 2096
Shenk J S Workman J J and Westerhaus M O (2001) ldquoApplication of NIR spectroscopy to agricultural productsrdquo In Burns D A and Ciurczak E W (eds) Handbook of Near-Infrared Analysis 2nd Ed Marcel Dekker Inc New York 419-474
Siesler H W Ozaki Y Kawata S and Heise H M (2002) Near Infrared Spectroscopy Principles Instruments and Applications Wiley VCH Germany
Tsuchikawa S and Siesler H W (2003a) ldquoNear-infrared spectroscopic monitoring of the diffusion process of deuterium-labeled molecules in wood Part II Hardwoodrdquo Appl Spectrosc 57 675-681
Tsuchikawa S and Siesler H W (2003b) ldquoNear-infrared spectroscopic monitoring of the diffusion process of deuterium-labeled molecules in wood Part I Softwoodrdquo Appl Spectrosc 57 667-674
Tsuchikawa S Yonenobu H and Siesler H W (2005) ldquoNear-infrared spectroscopic observation of the ageing process in archaeological wood using a deuterium exchange methodrdquo Analyst 130 379-384
Watanabe A Morita S and Ozaki Y (2006) ldquoTemperature-dependent structural changes in hydrogen bonds in microcrystalline cellulose studied by infrared and near-infrared spectroscopy with perturbation-correlation moving-window two-dimensional correlation analysisrdquo Appl Spectrosc 60(6) 611-618
Wilkie A C Smith P H and Bordeaux F M (2004) ldquoAn economical bioreactor for evaluating biogas potential of particulate biomassrdquo Biores Technol 92 103-109
Yu C H (2003) ldquoResampling methods Concepts applications and justificationrdquo Practical Assessment Research amp Evaluation 8(19) Retrieved July 31 2010 from httpPAREonlinenetgetvnaspv=8ampn=19
Article submitted June 22 2010 Peer review completed July 18 2010 Revised version received and accepted August 5 2010 Published August 6 2010
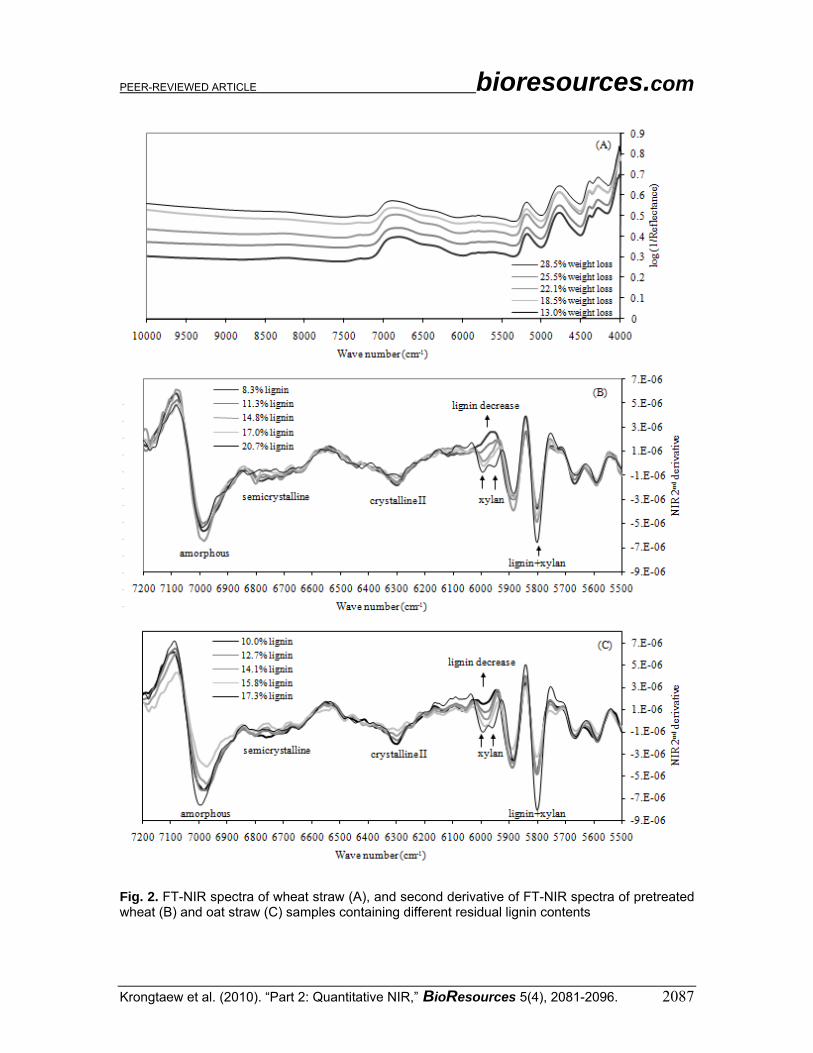
PEER-REVIEWED ARTICLE bioresourcescom
Krongtaew et al (2010) ldquoPart 2 Quantitative NIRrdquo BioResources 5(4) 2081-2096 2087
Fig 2 FT-NIR spectra of wheat straw (A) and second derivative of FT-NIR spectra of pretreated wheat (B) and oat straw (C) samples containing different residual lignin contents
PEER-REVIEWED ARTICLE bioresourcescom
Krongtaew et al (2010) ldquoPart 2 Quantitative NIRrdquo BioResources 5(4) 2081-2096 2088
Fig 3 NIR-predicted and measured values of the PLS regression models of total residual lignin content (A D) reducing sugars (B E) and weight loss (C F) of calibration and test samples of pretreated wheat (WS) and oat straw (OS) samples The re-sampling method was applied for the models to ensure the reliability of all the PLS models as they were limited by a smaller number of observations when dividing the sample into two halves for calibration and test sets (Yu 2003) Ranges of R2
test RMSEP and number of PLS factors of ten different calibration and test sets demon-strated consistent and reliable results as shown in Table 2 The results showed the robustness and validity of the models for predicting total residual lignin reducing sugar and weight loss of physic-chemically pretreated wheat and oat straw samples Table 2 Re-Sampled Models of Ten Different Sub-Sample Sets for PLS Models of Total Residual Lignin Reducing Sugar and Weight Loss
Models Substrate Spectral region (cm-1)
Spectral pre-processing
1R2test 2RMSEP No of
PLS Factors
Total residual lignin (ww)
Wheat straw Oat straw
6900 ndash 5510 6900 ndash 5510
2nd derivative 2nd derivative
092-095 095-098
08-10 06-08
3 2-3
Reducing sugars (mg g-1 straw)
Wheat straw Oat straw
6900 ndash 5510 6900 ndash 5510
2nd derivative 2nd derivative
082-092 092-096
53-96 mg g-1 45-65 mg g-1
3-4 1-3
Weight loss () Wheat straw Oat straw
10000 ndash 4000 10000 ndash 4000
No processing No processing
065-073 084-093
33-41 24-39
3-4 4-5
1 Coefficient of determination of the test model 2 Root-mean-square error of prediction for future analysis
PEER-REVIEWED ARTICLE bioresourcescom
Krongtaew et al (2010) ldquoPart 2 Quantitative NIRrdquo BioResources 5(4) 2081-2096 2089
Assessment of Wheat Straw-to-Biogas Conversion by FT-NIR To optimize the PLS models for total solid content volatile solid content and
biogas yield some outliers were excluded from the 42 original samples thus the numbers of samples were different from those shown in Table 3 Although Rsup2cv of those cross-validated PLS models for total solid volatile solid and biogas yield were not as high as for those described above (Table 3 and Fig 5) the current models deliver a good estimation of these parameters Furthermore the much higher Rsup2cal the low number of PLS factors and the low bias of these models indicate the high potential of the FT-NIR method also to analyse these parameters
Table 3 PLS Regression Models from FT-NIR Spectral Data of Pretreated Wheat Straw Parameters Total solids Volatile solids Biogas Wave number [cm-1] Component range Spectral processing No of samples No of PLS factors
7200 - 5500 936-997 Second derivative 32 5
7200 - 5500 945-992 Second derivative 38 5
7500 - 5500 219-387 mL g-1 straw Min-Max normalization 30 5
Calibration R2
cal
RMSEE1
091 07
091 03
077 21 mL g-1 straw
Cross validation R2
cv RMSECV2
Bias
080 09 -005
075 05 003
065 23 mL g-1 straw 073
1 Root mean square error of estimation 2 Root mean square error of cross validation
An acceptable prediction of biogas yield was obtained (R2
cv = 065) from pretreated straw spectra when the consistency of inoculum seed quality and digestion condition were controlled Thus the analytical technology using the implementation of FT-NIR spectroscopy in the combination of mathematically spectral data processing could be applied to the entire system of biomass-to-bioenergy processes Biogas yield was well correlated to the amount of fermentable sugars available as carbon source for anaerobic digestion and also to the lignin content of the pretreated straw (Table 4) It was additionally observed that the yield of anaerobic digestion was influenced by the particle size of wheat straw (80 microm and 2 mm) (Fig 4) Pretreated straw with smaller particles (80 microm) gave higher biogas yields compared with larger particles (2 mm) while lignin content and the amount of reducing sugars of the same samples from wet-chemistry analyses were at the same levels The reason is most likely due to better accessibility of microbial enzymes toward the smaller particle size of straw Moreover the coefficient of correlation (R) between lignin and biogas as well as reducing sugar and biogas (Fig 4(A) 4(B)) were higher when determined among the same sets of particle size compared with those from all samples (Table 4) The PLS model however included all particle sizes
PEER-REVIEWED ARTICLE bioresourcescom
Krongtaew et al (2010) ldquoPart 2 Quantitative NIRrdquo BioResources 5(4) 2081-2096 2090
Table 4 Correlation Matrix of Key Parameters for Biomass-to-Biogas Conversion of Wheat Straw
Lignin Reducing sugars
Weight loss Total solid Volatile solid
Biogas
Lignin R=10
R=-08
R=-09
R=-02
R=-04
R=-06 Reducing sugars
-
R=10
R=08
R=01
R=02
R=06
Weight loss -
-
R=10
R=00
R=04
R=01
Total solid
-
-
-
R=10
R=-04
R=03
Volatile solid
-
-
-
-
R=10
R=-02
Biogas -
-
-
-
-
R=10
Fig 4 Correlation between total lignin and biogas (A) and enzymatically released reducing sugars and biogas (B) where diams and represent data from 80-microm and 2-mm straw samples respectively
PEER-REVIEWED ARTICLE bioresourcescom
Krongtaew et al (2010) ldquoPart 2 Quantitative NIRrdquo BioResources 5(4) 2081-2096 2091
Fig 5 NIR-predicted and measured values of (A) total solid (B) volatile solids and (C) biogas yield from the cross validation of PLS regression models of pretreated wheat straw Black solid indicates the outlier
A recent study demonstrated the prediction of biological methane potential based on a number of parameters - carbohydrates proteins lipids acetate and propionate concentration of a digested sludge mixture (Kaparaju et al 2009) Some scientific work also demonstrated the potential application of NIR for predicting volatile solids total solids chemical oxygen demand (COD) and several volatile fatty acids (VFA) of digested sludge from the biogas pilot plant the models relied mainly on different process constraints and were designed as analytical techniques for online-process control (Holm-Nielsen et al 2006 2007) The present study in contrast demonstrates the assessment of biogas yield based on chemical structure and composition of the substrate by FT-NIR spectroscopy Biogas yield is based on the stoichiometric conversion of organic material to biogas as shown in equation (1) Volatile organic compounds in lignocelluloses are theoretically converted to methane (CH4) and carbon dioxide (CO2) which are collectively called biogas (Buswell and Mueller 1952) In most methanogenic fermentations the methane yield lies close to the theoretical maximum of 3 moles of methane per mole of glucose as calculated from the Buswell equation (1) (Ahring and Westermann 2007) Thus the theoretical methane yield of untreated wheat straw is approximately 105 mmol CH4 and 105 mmol CO2 per g straw as wheat straw contains 63 polysaccharides (glucose equivalence) These values were calculated to 2352 mL CH4 and 2352 mL CO2 as one mole of an ideal gas at STP occupies 224 L
242 48248224COcbaCHcbaOHcbaOHC cba ⎟⎠⎞
⎜⎝⎛ +minus+⎟
⎠⎞
⎜⎝⎛ minus+rarr⎟
⎠⎞
⎜⎝⎛ minusminus+ (1)
However due to the complex structure which is rather hard to attack lignocellulose leads to yields lower than this theoretical maximum The presence of organic recalcitrant compounds in straw eg lignin and crystalline cellulose influences the yield of anaerobic digestion These properties of the substrate are reflected in the FT-NIR spectra and can serve for the prediction of the potential biogas yield For instance it has been reported that some parts of the crystalline structure of cellulose are loosened and
PEER-REVIEWED ARTICLE bioresourcescom
Krongtaew et al (2010) ldquoPart 2 Quantitative NIRrdquo BioResources 5(4) 2081-2096 2092
converted to semi-crystalline structures after physico-chemical pre-treatment (Krongtaew et al 2010) This could lead to higher susceptibility of cellulose and provided higher biomass utilization efficiency PLS Loading Spectra
PLS loading spectra contain the descriptive information of FT-NIR absorption regions that influence the PLS regression models As shown in Fig 6(A) the first loading factor (PLS1 2nd derivative pre-processing) of lignin content represents 82 of the data variance and PLS1 of reducing sugar represents 75 of the data variance The major fraction of the spectral variance influencing these models is found between 7200 and 5500 cm-1 where lignin xylan and acetyl groups of polysaccharides absorb As shown by highest negative amplitudes near 5980 cm-1 the spectral position is attributed to the C-H stretch 1st overtone of aromatic rings and the prediction of the lignin content is mainly based on this band But a high lignin content is also correlated with a low xylan content as indicated by the negative PLS loading vectors of lignin+polysaccharides bands near 5800 cm-1 the overlapping band of C-H stretch 1st overtone of lignin and acetyl groups (Lg+Xy Fig 6A) and the broad band of amorphous polysaccharides near 7000 cm-1 Bands assigned to crystalline II (6280 cm-1) and semi-crystalline (6722 cm-1) cellulose however exhibit positive loading vectors indicating high cellulose content of the samples with low lignin content and vice versa It is known that lignin degradation of lignocellulosic substrates leads to better accessible and enzymatically hydrolysable polysaccharides and thus to a higher yield of reducing sugars In fact these two parameters showed a high negative correlation of R = -08 in the data set analysed here (Table 4) This correlation was also found in the first loading spectrum of the model for reducing sugars which is very much alike that of the lignin model but shows the opposite algebraic sign
The correlation matrix (Table 4) shows the low correlation of total solids with all other parameters determined Consequently PLS-loading spectra (Fig 6(B)) were not directly connected to the content of the straw constituents Nevertheless most of the data variance (62) was explained by the second and third PLS loading factor (PLS2 and PLS3 2nd derivative pre-processing) and the regression model showed good predictable results for total solid content (Table 3 and Fig 5(A))
For the PLS loading spectra (2nd derivative pre-processing) of volatile solids (Fig 6(C)) which is the content of combustible organic materials PLS1 and PLS3 contributed mostly to the PLS model In the PLS1 loading spectrum lignin and xylan overlapping band (Lg+Xy) showed the highest influence on the model Amorphous polysaccharides (Am) near 7000 cm-1 and lignin-polysaccharide overlapping band near 5800 cm-1 (Lg+Ps) also appeared A high content of volatile solids was predicted from pretreated straw sample which contained low lignin and xylan (Lg+Xy) content as well as lignin and polysaccharide overlapping (Lg+Ps) but high amount of crystalline (Cry II) semi-crystalline (Sc) and amorphous (Am) cellulose indicating the extraction of inorganic compounds during the pre-treatment
PEER-REVIEWED ARTICLE bioresourcescom
Krongtaew et al (2010) ldquoPart 2 Quantitative NIRrdquo BioResources 5(4) 2081-2096 2093
Fig 6 PLS loading spectra of partial least-squares regression models (A) lignin content and amount of reducing sugar (B) total solids (C) volatile solids and (D) biogas yield
PEER-REVIEWED ARTICLE bioresourcescom
Krongtaew et al (2010) ldquoPart 2 Quantitative NIRrdquo BioResources 5(4) 2081-2096 2094
The first PLS factor of PLS regression models (minimummaximum normaliza-tion pre-processing) of biogas accounted for only 1 of the data variance therefore the second PLS factors is discussed here (Fig 6(D)) PLS2 represented 31 of the data variance and showed the importance of amorphous (Am) polysaccharides for a high biogas yield Crystalline cellulose (Cry II) however had an adverse effect as indicated by a negative loading vector of PLS2 in the respective region In summary it can be seen from the PLS loading spectra that lignin xylan and both amorphous and crystalline moieties of cellulose were representative onto the PLS model for evaluating biogas yield based on straw chemical structure after different severities of various physico-chemical pre-treatment methods Thus biogas potential of physico-chemically pretreated straw can be predicted based on the chemical characteristics and composition by FT-NIR assisted by multivariate data analysis
CONCLUSIONS
Fourier transform near-infrared (FT-NIR) spectroscopy combined with multi-variate data analyses has potential as an analytical tool for not only qualitative characterization of lignocellulose after different pre-treatment methods through the vibration bands of FT-NIR spectra (Krongtaew et al 2010) but also quantitative assessment for key parameters of both pre-treatment and biomass-to-bioenergy production Total residual lignin content enzymatically released reducing sugars total solids (TS) volatile solids (VS) and biogas yield can be analysed This approach can be considered as an alternative process analytical technology (PAT) for assessment of biomass utilization and biomass-to-biogas production offering a powerful and low-budget technique for rapidly growing and bulk volume industries
Furthermore the descriptive information in the loading vectors confirmed the importance of delignification for successful enzymatic and microbial conversion of the structural polysaccharides as well as the adverse effect of high cellulose crystallinity ACKNOWLEDGEMENTS
The authors are grateful to the financial support from the Austrian Research Promotion Agency (FFG project number 81954914233SCKSAI) KF acknowledges the support of FWF the Austrian Science Fund (FWF project number V117-N17) REFERENCES CITED Ahring B K and Westermann P (2007) ldquoCoproduction of bioethanol with other
biofuelsrdquo Adv Biochem EnginBiotechnol 108 289-302 Angelidaki I Ellegaard L and Ahring B K (1992) ldquoCompact automated
displacement gas metering system for measurement of low gas rates from laboratory fermentorsrdquo Biotechnol Bioeng 39 351-353
PEER-REVIEWED ARTICLE bioresourcescom
Krongtaew et al (2010) ldquoPart 2 Quantitative NIRrdquo BioResources 5(4) 2081-2096 2095
Buswell A M and Mueller H F (1952) ldquoMechanism of methane fermentationrdquo Ind Engin Chem 44(3) 550-552
Chandra R P Bura R Mabee W Pan X Berlin A and Saddler J N (2007) ldquoSubstrate pretreatment The key to effective enzymatic hydrolysis of lignocellulosicsrdquo Adv Biochem EnginBiotechnol 108 67-93
Energy Efficiency amp Renewable Energy US Department of Energy (2009) lthttpwww1eereenergygovbiomassanalytical_procedureshtmlgt viewed in September 2009
Fackler K Schmutzer M Manoch L Schwanninger M Hinterstoisser B Ters T Messner K and Gradinger C (2007a) ldquoEvaluation of the selectivity of white rot isolates using near infrared spectroscopic techniquesrdquo Enzyme Microb Technol 41 881-887
Fackler K Schwanninger M Gradinger C Hinterstoisser B and Messner K (2007b) ldquoQualitative and quantitative changes of beech wood degraded by wood-rotting basidiomycetes monitored by Fourier transform infrared spectroscopic methods and multivariate data analysisrdquo FEMS Microbiol Lett 271(2) 162-169
Ghosh S and Rodgers J (2001) ldquoNIR analysis of textilesrdquo In Burns D A and Ciurczak E W (eds) Handbook of Near-Infrared Analysis 2nd Ed Marcel Dekker Inc New York 573-607
Himmel M E Ding S Y Johnson D K Adney W S Numlos M R Brady J W and Foust T D (2007) ldquoBiomass recalcitrance Engineering plants and enzymes for biofuels productionrdquo Science 315 804-807
Holm-Nielsen J B Dahl C K and Esbensen K H (2006) ldquoRepresentative sampling for process analytical characterization of heterogeneous bioslurry systemsmdasha reference study of sampling issues in PATrdquo Chemom Intell Lab Syst 83 114-126
Holm-Nielsen J B Andree H Lindorfer H and Esbensen K H (2007) ldquoTransflexive embedded near infrared monitoring for key process intermediates in anaerobic digestionbiogas productionrdquo J Near Infrared Spectrosc 15 123-135
Kaparaju P Serrano M Thomsen A B Kongjan P and Angelidaki I (2009) ldquoBioethanol biohydrogen and biogas production from wheat straw in a biorefinery conceptrdquo Biores Technol 100 2562-2568
Kong X Xie J Wu Y Huang Y and Bao J (2005) ldquoRapid prediction of acid detergent fiber neutral detergent fiber and acid detergent lignin of rice materials by near-infrared spectroscopyrdquo J Agric Food Chem 53 2843-2848
Krongtaew C Messner K Ters T and Fackler K (2010) ldquoCharacterization of key parameters for biotechnological lignocellulose conversion assessed by FT-NIR spectroscopy Part I Qualitative analysis of pretreated strawrdquo BioResources 5(4) 2063-2080
Kumar P Barrett D M Delwiche M J and Stroeve P (2009) ldquoMethods for pretreatment of lignocellulosic biomass for efficient hydrolysis and biofuel productionrdquo Ind Eng Chem Res 48 3713-3729
Ozaki Y McClure W F and Christy A A (2007) Near Infrared Spectroscopy in Food Science and Technology Wiley Interscience New Jersey
Savitzky A and Golay M J E (1964) ldquoSmoothing and differentiation of data by simplified least squares proceduresrdquo Anal Chem 36(8) 1627-1639
PEER-REVIEWED ARTICLE bioresourcescom
Krongtaew et al (2010) ldquoPart 2 Quantitative NIRrdquo BioResources 5(4) 2081-2096 2096
Shenk J S Workman J J and Westerhaus M O (2001) ldquoApplication of NIR spectroscopy to agricultural productsrdquo In Burns D A and Ciurczak E W (eds) Handbook of Near-Infrared Analysis 2nd Ed Marcel Dekker Inc New York 419-474
Siesler H W Ozaki Y Kawata S and Heise H M (2002) Near Infrared Spectroscopy Principles Instruments and Applications Wiley VCH Germany
Tsuchikawa S and Siesler H W (2003a) ldquoNear-infrared spectroscopic monitoring of the diffusion process of deuterium-labeled molecules in wood Part II Hardwoodrdquo Appl Spectrosc 57 675-681
Tsuchikawa S and Siesler H W (2003b) ldquoNear-infrared spectroscopic monitoring of the diffusion process of deuterium-labeled molecules in wood Part I Softwoodrdquo Appl Spectrosc 57 667-674
Tsuchikawa S Yonenobu H and Siesler H W (2005) ldquoNear-infrared spectroscopic observation of the ageing process in archaeological wood using a deuterium exchange methodrdquo Analyst 130 379-384
Watanabe A Morita S and Ozaki Y (2006) ldquoTemperature-dependent structural changes in hydrogen bonds in microcrystalline cellulose studied by infrared and near-infrared spectroscopy with perturbation-correlation moving-window two-dimensional correlation analysisrdquo Appl Spectrosc 60(6) 611-618
Wilkie A C Smith P H and Bordeaux F M (2004) ldquoAn economical bioreactor for evaluating biogas potential of particulate biomassrdquo Biores Technol 92 103-109
Yu C H (2003) ldquoResampling methods Concepts applications and justificationrdquo Practical Assessment Research amp Evaluation 8(19) Retrieved July 31 2010 from httpPAREonlinenetgetvnaspv=8ampn=19
Article submitted June 22 2010 Peer review completed July 18 2010 Revised version received and accepted August 5 2010 Published August 6 2010
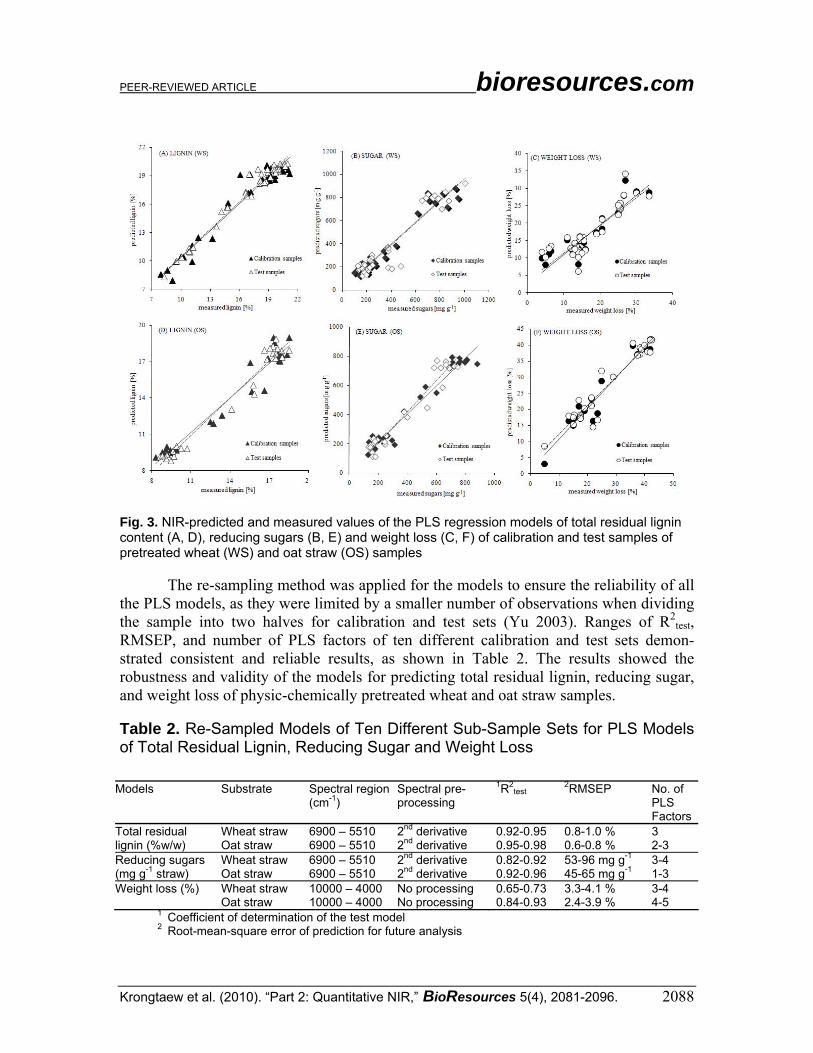
PEER-REVIEWED ARTICLE bioresourcescom
Krongtaew et al (2010) ldquoPart 2 Quantitative NIRrdquo BioResources 5(4) 2081-2096 2088
Fig 3 NIR-predicted and measured values of the PLS regression models of total residual lignin content (A D) reducing sugars (B E) and weight loss (C F) of calibration and test samples of pretreated wheat (WS) and oat straw (OS) samples The re-sampling method was applied for the models to ensure the reliability of all the PLS models as they were limited by a smaller number of observations when dividing the sample into two halves for calibration and test sets (Yu 2003) Ranges of R2
test RMSEP and number of PLS factors of ten different calibration and test sets demon-strated consistent and reliable results as shown in Table 2 The results showed the robustness and validity of the models for predicting total residual lignin reducing sugar and weight loss of physic-chemically pretreated wheat and oat straw samples Table 2 Re-Sampled Models of Ten Different Sub-Sample Sets for PLS Models of Total Residual Lignin Reducing Sugar and Weight Loss
Models Substrate Spectral region (cm-1)
Spectral pre-processing
1R2test 2RMSEP No of
PLS Factors
Total residual lignin (ww)
Wheat straw Oat straw
6900 ndash 5510 6900 ndash 5510
2nd derivative 2nd derivative
092-095 095-098
08-10 06-08
3 2-3
Reducing sugars (mg g-1 straw)
Wheat straw Oat straw
6900 ndash 5510 6900 ndash 5510
2nd derivative 2nd derivative
082-092 092-096
53-96 mg g-1 45-65 mg g-1
3-4 1-3
Weight loss () Wheat straw Oat straw
10000 ndash 4000 10000 ndash 4000
No processing No processing
065-073 084-093
33-41 24-39
3-4 4-5
1 Coefficient of determination of the test model 2 Root-mean-square error of prediction for future analysis
PEER-REVIEWED ARTICLE bioresourcescom
Krongtaew et al (2010) ldquoPart 2 Quantitative NIRrdquo BioResources 5(4) 2081-2096 2089
Assessment of Wheat Straw-to-Biogas Conversion by FT-NIR To optimize the PLS models for total solid content volatile solid content and
biogas yield some outliers were excluded from the 42 original samples thus the numbers of samples were different from those shown in Table 3 Although Rsup2cv of those cross-validated PLS models for total solid volatile solid and biogas yield were not as high as for those described above (Table 3 and Fig 5) the current models deliver a good estimation of these parameters Furthermore the much higher Rsup2cal the low number of PLS factors and the low bias of these models indicate the high potential of the FT-NIR method also to analyse these parameters
Table 3 PLS Regression Models from FT-NIR Spectral Data of Pretreated Wheat Straw Parameters Total solids Volatile solids Biogas Wave number [cm-1] Component range Spectral processing No of samples No of PLS factors
7200 - 5500 936-997 Second derivative 32 5
7200 - 5500 945-992 Second derivative 38 5
7500 - 5500 219-387 mL g-1 straw Min-Max normalization 30 5
Calibration R2
cal
RMSEE1
091 07
091 03
077 21 mL g-1 straw
Cross validation R2
cv RMSECV2
Bias
080 09 -005
075 05 003
065 23 mL g-1 straw 073
1 Root mean square error of estimation 2 Root mean square error of cross validation
An acceptable prediction of biogas yield was obtained (R2
cv = 065) from pretreated straw spectra when the consistency of inoculum seed quality and digestion condition were controlled Thus the analytical technology using the implementation of FT-NIR spectroscopy in the combination of mathematically spectral data processing could be applied to the entire system of biomass-to-bioenergy processes Biogas yield was well correlated to the amount of fermentable sugars available as carbon source for anaerobic digestion and also to the lignin content of the pretreated straw (Table 4) It was additionally observed that the yield of anaerobic digestion was influenced by the particle size of wheat straw (80 microm and 2 mm) (Fig 4) Pretreated straw with smaller particles (80 microm) gave higher biogas yields compared with larger particles (2 mm) while lignin content and the amount of reducing sugars of the same samples from wet-chemistry analyses were at the same levels The reason is most likely due to better accessibility of microbial enzymes toward the smaller particle size of straw Moreover the coefficient of correlation (R) between lignin and biogas as well as reducing sugar and biogas (Fig 4(A) 4(B)) were higher when determined among the same sets of particle size compared with those from all samples (Table 4) The PLS model however included all particle sizes
PEER-REVIEWED ARTICLE bioresourcescom
Krongtaew et al (2010) ldquoPart 2 Quantitative NIRrdquo BioResources 5(4) 2081-2096 2090
Table 4 Correlation Matrix of Key Parameters for Biomass-to-Biogas Conversion of Wheat Straw
Lignin Reducing sugars
Weight loss Total solid Volatile solid
Biogas
Lignin R=10
R=-08
R=-09
R=-02
R=-04
R=-06 Reducing sugars
-
R=10
R=08
R=01
R=02
R=06
Weight loss -
-
R=10
R=00
R=04
R=01
Total solid
-
-
-
R=10
R=-04
R=03
Volatile solid
-
-
-
-
R=10
R=-02
Biogas -
-
-
-
-
R=10
Fig 4 Correlation between total lignin and biogas (A) and enzymatically released reducing sugars and biogas (B) where diams and represent data from 80-microm and 2-mm straw samples respectively
PEER-REVIEWED ARTICLE bioresourcescom
Krongtaew et al (2010) ldquoPart 2 Quantitative NIRrdquo BioResources 5(4) 2081-2096 2091
Fig 5 NIR-predicted and measured values of (A) total solid (B) volatile solids and (C) biogas yield from the cross validation of PLS regression models of pretreated wheat straw Black solid indicates the outlier
A recent study demonstrated the prediction of biological methane potential based on a number of parameters - carbohydrates proteins lipids acetate and propionate concentration of a digested sludge mixture (Kaparaju et al 2009) Some scientific work also demonstrated the potential application of NIR for predicting volatile solids total solids chemical oxygen demand (COD) and several volatile fatty acids (VFA) of digested sludge from the biogas pilot plant the models relied mainly on different process constraints and were designed as analytical techniques for online-process control (Holm-Nielsen et al 2006 2007) The present study in contrast demonstrates the assessment of biogas yield based on chemical structure and composition of the substrate by FT-NIR spectroscopy Biogas yield is based on the stoichiometric conversion of organic material to biogas as shown in equation (1) Volatile organic compounds in lignocelluloses are theoretically converted to methane (CH4) and carbon dioxide (CO2) which are collectively called biogas (Buswell and Mueller 1952) In most methanogenic fermentations the methane yield lies close to the theoretical maximum of 3 moles of methane per mole of glucose as calculated from the Buswell equation (1) (Ahring and Westermann 2007) Thus the theoretical methane yield of untreated wheat straw is approximately 105 mmol CH4 and 105 mmol CO2 per g straw as wheat straw contains 63 polysaccharides (glucose equivalence) These values were calculated to 2352 mL CH4 and 2352 mL CO2 as one mole of an ideal gas at STP occupies 224 L
242 48248224COcbaCHcbaOHcbaOHC cba ⎟⎠⎞
⎜⎝⎛ +minus+⎟
⎠⎞
⎜⎝⎛ minus+rarr⎟
⎠⎞
⎜⎝⎛ minusminus+ (1)
However due to the complex structure which is rather hard to attack lignocellulose leads to yields lower than this theoretical maximum The presence of organic recalcitrant compounds in straw eg lignin and crystalline cellulose influences the yield of anaerobic digestion These properties of the substrate are reflected in the FT-NIR spectra and can serve for the prediction of the potential biogas yield For instance it has been reported that some parts of the crystalline structure of cellulose are loosened and
PEER-REVIEWED ARTICLE bioresourcescom
Krongtaew et al (2010) ldquoPart 2 Quantitative NIRrdquo BioResources 5(4) 2081-2096 2092
converted to semi-crystalline structures after physico-chemical pre-treatment (Krongtaew et al 2010) This could lead to higher susceptibility of cellulose and provided higher biomass utilization efficiency PLS Loading Spectra
PLS loading spectra contain the descriptive information of FT-NIR absorption regions that influence the PLS regression models As shown in Fig 6(A) the first loading factor (PLS1 2nd derivative pre-processing) of lignin content represents 82 of the data variance and PLS1 of reducing sugar represents 75 of the data variance The major fraction of the spectral variance influencing these models is found between 7200 and 5500 cm-1 where lignin xylan and acetyl groups of polysaccharides absorb As shown by highest negative amplitudes near 5980 cm-1 the spectral position is attributed to the C-H stretch 1st overtone of aromatic rings and the prediction of the lignin content is mainly based on this band But a high lignin content is also correlated with a low xylan content as indicated by the negative PLS loading vectors of lignin+polysaccharides bands near 5800 cm-1 the overlapping band of C-H stretch 1st overtone of lignin and acetyl groups (Lg+Xy Fig 6A) and the broad band of amorphous polysaccharides near 7000 cm-1 Bands assigned to crystalline II (6280 cm-1) and semi-crystalline (6722 cm-1) cellulose however exhibit positive loading vectors indicating high cellulose content of the samples with low lignin content and vice versa It is known that lignin degradation of lignocellulosic substrates leads to better accessible and enzymatically hydrolysable polysaccharides and thus to a higher yield of reducing sugars In fact these two parameters showed a high negative correlation of R = -08 in the data set analysed here (Table 4) This correlation was also found in the first loading spectrum of the model for reducing sugars which is very much alike that of the lignin model but shows the opposite algebraic sign
The correlation matrix (Table 4) shows the low correlation of total solids with all other parameters determined Consequently PLS-loading spectra (Fig 6(B)) were not directly connected to the content of the straw constituents Nevertheless most of the data variance (62) was explained by the second and third PLS loading factor (PLS2 and PLS3 2nd derivative pre-processing) and the regression model showed good predictable results for total solid content (Table 3 and Fig 5(A))
For the PLS loading spectra (2nd derivative pre-processing) of volatile solids (Fig 6(C)) which is the content of combustible organic materials PLS1 and PLS3 contributed mostly to the PLS model In the PLS1 loading spectrum lignin and xylan overlapping band (Lg+Xy) showed the highest influence on the model Amorphous polysaccharides (Am) near 7000 cm-1 and lignin-polysaccharide overlapping band near 5800 cm-1 (Lg+Ps) also appeared A high content of volatile solids was predicted from pretreated straw sample which contained low lignin and xylan (Lg+Xy) content as well as lignin and polysaccharide overlapping (Lg+Ps) but high amount of crystalline (Cry II) semi-crystalline (Sc) and amorphous (Am) cellulose indicating the extraction of inorganic compounds during the pre-treatment
PEER-REVIEWED ARTICLE bioresourcescom
Krongtaew et al (2010) ldquoPart 2 Quantitative NIRrdquo BioResources 5(4) 2081-2096 2093
Fig 6 PLS loading spectra of partial least-squares regression models (A) lignin content and amount of reducing sugar (B) total solids (C) volatile solids and (D) biogas yield
PEER-REVIEWED ARTICLE bioresourcescom
Krongtaew et al (2010) ldquoPart 2 Quantitative NIRrdquo BioResources 5(4) 2081-2096 2094
The first PLS factor of PLS regression models (minimummaximum normaliza-tion pre-processing) of biogas accounted for only 1 of the data variance therefore the second PLS factors is discussed here (Fig 6(D)) PLS2 represented 31 of the data variance and showed the importance of amorphous (Am) polysaccharides for a high biogas yield Crystalline cellulose (Cry II) however had an adverse effect as indicated by a negative loading vector of PLS2 in the respective region In summary it can be seen from the PLS loading spectra that lignin xylan and both amorphous and crystalline moieties of cellulose were representative onto the PLS model for evaluating biogas yield based on straw chemical structure after different severities of various physico-chemical pre-treatment methods Thus biogas potential of physico-chemically pretreated straw can be predicted based on the chemical characteristics and composition by FT-NIR assisted by multivariate data analysis
CONCLUSIONS
Fourier transform near-infrared (FT-NIR) spectroscopy combined with multi-variate data analyses has potential as an analytical tool for not only qualitative characterization of lignocellulose after different pre-treatment methods through the vibration bands of FT-NIR spectra (Krongtaew et al 2010) but also quantitative assessment for key parameters of both pre-treatment and biomass-to-bioenergy production Total residual lignin content enzymatically released reducing sugars total solids (TS) volatile solids (VS) and biogas yield can be analysed This approach can be considered as an alternative process analytical technology (PAT) for assessment of biomass utilization and biomass-to-biogas production offering a powerful and low-budget technique for rapidly growing and bulk volume industries
Furthermore the descriptive information in the loading vectors confirmed the importance of delignification for successful enzymatic and microbial conversion of the structural polysaccharides as well as the adverse effect of high cellulose crystallinity ACKNOWLEDGEMENTS
The authors are grateful to the financial support from the Austrian Research Promotion Agency (FFG project number 81954914233SCKSAI) KF acknowledges the support of FWF the Austrian Science Fund (FWF project number V117-N17) REFERENCES CITED Ahring B K and Westermann P (2007) ldquoCoproduction of bioethanol with other
biofuelsrdquo Adv Biochem EnginBiotechnol 108 289-302 Angelidaki I Ellegaard L and Ahring B K (1992) ldquoCompact automated
displacement gas metering system for measurement of low gas rates from laboratory fermentorsrdquo Biotechnol Bioeng 39 351-353
PEER-REVIEWED ARTICLE bioresourcescom
Krongtaew et al (2010) ldquoPart 2 Quantitative NIRrdquo BioResources 5(4) 2081-2096 2095
Buswell A M and Mueller H F (1952) ldquoMechanism of methane fermentationrdquo Ind Engin Chem 44(3) 550-552
Chandra R P Bura R Mabee W Pan X Berlin A and Saddler J N (2007) ldquoSubstrate pretreatment The key to effective enzymatic hydrolysis of lignocellulosicsrdquo Adv Biochem EnginBiotechnol 108 67-93
Energy Efficiency amp Renewable Energy US Department of Energy (2009) lthttpwww1eereenergygovbiomassanalytical_procedureshtmlgt viewed in September 2009
Fackler K Schmutzer M Manoch L Schwanninger M Hinterstoisser B Ters T Messner K and Gradinger C (2007a) ldquoEvaluation of the selectivity of white rot isolates using near infrared spectroscopic techniquesrdquo Enzyme Microb Technol 41 881-887
Fackler K Schwanninger M Gradinger C Hinterstoisser B and Messner K (2007b) ldquoQualitative and quantitative changes of beech wood degraded by wood-rotting basidiomycetes monitored by Fourier transform infrared spectroscopic methods and multivariate data analysisrdquo FEMS Microbiol Lett 271(2) 162-169
Ghosh S and Rodgers J (2001) ldquoNIR analysis of textilesrdquo In Burns D A and Ciurczak E W (eds) Handbook of Near-Infrared Analysis 2nd Ed Marcel Dekker Inc New York 573-607
Himmel M E Ding S Y Johnson D K Adney W S Numlos M R Brady J W and Foust T D (2007) ldquoBiomass recalcitrance Engineering plants and enzymes for biofuels productionrdquo Science 315 804-807
Holm-Nielsen J B Dahl C K and Esbensen K H (2006) ldquoRepresentative sampling for process analytical characterization of heterogeneous bioslurry systemsmdasha reference study of sampling issues in PATrdquo Chemom Intell Lab Syst 83 114-126
Holm-Nielsen J B Andree H Lindorfer H and Esbensen K H (2007) ldquoTransflexive embedded near infrared monitoring for key process intermediates in anaerobic digestionbiogas productionrdquo J Near Infrared Spectrosc 15 123-135
Kaparaju P Serrano M Thomsen A B Kongjan P and Angelidaki I (2009) ldquoBioethanol biohydrogen and biogas production from wheat straw in a biorefinery conceptrdquo Biores Technol 100 2562-2568
Kong X Xie J Wu Y Huang Y and Bao J (2005) ldquoRapid prediction of acid detergent fiber neutral detergent fiber and acid detergent lignin of rice materials by near-infrared spectroscopyrdquo J Agric Food Chem 53 2843-2848
Krongtaew C Messner K Ters T and Fackler K (2010) ldquoCharacterization of key parameters for biotechnological lignocellulose conversion assessed by FT-NIR spectroscopy Part I Qualitative analysis of pretreated strawrdquo BioResources 5(4) 2063-2080
Kumar P Barrett D M Delwiche M J and Stroeve P (2009) ldquoMethods for pretreatment of lignocellulosic biomass for efficient hydrolysis and biofuel productionrdquo Ind Eng Chem Res 48 3713-3729
Ozaki Y McClure W F and Christy A A (2007) Near Infrared Spectroscopy in Food Science and Technology Wiley Interscience New Jersey
Savitzky A and Golay M J E (1964) ldquoSmoothing and differentiation of data by simplified least squares proceduresrdquo Anal Chem 36(8) 1627-1639
PEER-REVIEWED ARTICLE bioresourcescom
Krongtaew et al (2010) ldquoPart 2 Quantitative NIRrdquo BioResources 5(4) 2081-2096 2096
Shenk J S Workman J J and Westerhaus M O (2001) ldquoApplication of NIR spectroscopy to agricultural productsrdquo In Burns D A and Ciurczak E W (eds) Handbook of Near-Infrared Analysis 2nd Ed Marcel Dekker Inc New York 419-474
Siesler H W Ozaki Y Kawata S and Heise H M (2002) Near Infrared Spectroscopy Principles Instruments and Applications Wiley VCH Germany
Tsuchikawa S and Siesler H W (2003a) ldquoNear-infrared spectroscopic monitoring of the diffusion process of deuterium-labeled molecules in wood Part II Hardwoodrdquo Appl Spectrosc 57 675-681
Tsuchikawa S and Siesler H W (2003b) ldquoNear-infrared spectroscopic monitoring of the diffusion process of deuterium-labeled molecules in wood Part I Softwoodrdquo Appl Spectrosc 57 667-674
Tsuchikawa S Yonenobu H and Siesler H W (2005) ldquoNear-infrared spectroscopic observation of the ageing process in archaeological wood using a deuterium exchange methodrdquo Analyst 130 379-384
Watanabe A Morita S and Ozaki Y (2006) ldquoTemperature-dependent structural changes in hydrogen bonds in microcrystalline cellulose studied by infrared and near-infrared spectroscopy with perturbation-correlation moving-window two-dimensional correlation analysisrdquo Appl Spectrosc 60(6) 611-618
Wilkie A C Smith P H and Bordeaux F M (2004) ldquoAn economical bioreactor for evaluating biogas potential of particulate biomassrdquo Biores Technol 92 103-109
Yu C H (2003) ldquoResampling methods Concepts applications and justificationrdquo Practical Assessment Research amp Evaluation 8(19) Retrieved July 31 2010 from httpPAREonlinenetgetvnaspv=8ampn=19
Article submitted June 22 2010 Peer review completed July 18 2010 Revised version received and accepted August 5 2010 Published August 6 2010
PEER-REVIEWED ARTICLE bioresourcescom
Krongtaew et al (2010) ldquoPart 2 Quantitative NIRrdquo BioResources 5(4) 2081-2096 2089
Assessment of Wheat Straw-to-Biogas Conversion by FT-NIR To optimize the PLS models for total solid content volatile solid content and
biogas yield some outliers were excluded from the 42 original samples thus the numbers of samples were different from those shown in Table 3 Although Rsup2cv of those cross-validated PLS models for total solid volatile solid and biogas yield were not as high as for those described above (Table 3 and Fig 5) the current models deliver a good estimation of these parameters Furthermore the much higher Rsup2cal the low number of PLS factors and the low bias of these models indicate the high potential of the FT-NIR method also to analyse these parameters
Table 3 PLS Regression Models from FT-NIR Spectral Data of Pretreated Wheat Straw Parameters Total solids Volatile solids Biogas Wave number [cm-1] Component range Spectral processing No of samples No of PLS factors
7200 - 5500 936-997 Second derivative 32 5
7200 - 5500 945-992 Second derivative 38 5
7500 - 5500 219-387 mL g-1 straw Min-Max normalization 30 5
Calibration R2
cal
RMSEE1
091 07
091 03
077 21 mL g-1 straw
Cross validation R2
cv RMSECV2
Bias
080 09 -005
075 05 003
065 23 mL g-1 straw 073
1 Root mean square error of estimation 2 Root mean square error of cross validation
An acceptable prediction of biogas yield was obtained (R2
cv = 065) from pretreated straw spectra when the consistency of inoculum seed quality and digestion condition were controlled Thus the analytical technology using the implementation of FT-NIR spectroscopy in the combination of mathematically spectral data processing could be applied to the entire system of biomass-to-bioenergy processes Biogas yield was well correlated to the amount of fermentable sugars available as carbon source for anaerobic digestion and also to the lignin content of the pretreated straw (Table 4) It was additionally observed that the yield of anaerobic digestion was influenced by the particle size of wheat straw (80 microm and 2 mm) (Fig 4) Pretreated straw with smaller particles (80 microm) gave higher biogas yields compared with larger particles (2 mm) while lignin content and the amount of reducing sugars of the same samples from wet-chemistry analyses were at the same levels The reason is most likely due to better accessibility of microbial enzymes toward the smaller particle size of straw Moreover the coefficient of correlation (R) between lignin and biogas as well as reducing sugar and biogas (Fig 4(A) 4(B)) were higher when determined among the same sets of particle size compared with those from all samples (Table 4) The PLS model however included all particle sizes
PEER-REVIEWED ARTICLE bioresourcescom
Krongtaew et al (2010) ldquoPart 2 Quantitative NIRrdquo BioResources 5(4) 2081-2096 2090
Table 4 Correlation Matrix of Key Parameters for Biomass-to-Biogas Conversion of Wheat Straw
Lignin Reducing sugars
Weight loss Total solid Volatile solid
Biogas
Lignin R=10
R=-08
R=-09
R=-02
R=-04
R=-06 Reducing sugars
-
R=10
R=08
R=01
R=02
R=06
Weight loss -
-
R=10
R=00
R=04
R=01
Total solid
-
-
-
R=10
R=-04
R=03
Volatile solid
-
-
-
-
R=10
R=-02
Biogas -
-
-
-
-
R=10
Fig 4 Correlation between total lignin and biogas (A) and enzymatically released reducing sugars and biogas (B) where diams and represent data from 80-microm and 2-mm straw samples respectively
PEER-REVIEWED ARTICLE bioresourcescom
Krongtaew et al (2010) ldquoPart 2 Quantitative NIRrdquo BioResources 5(4) 2081-2096 2091
Fig 5 NIR-predicted and measured values of (A) total solid (B) volatile solids and (C) biogas yield from the cross validation of PLS regression models of pretreated wheat straw Black solid indicates the outlier
A recent study demonstrated the prediction of biological methane potential based on a number of parameters - carbohydrates proteins lipids acetate and propionate concentration of a digested sludge mixture (Kaparaju et al 2009) Some scientific work also demonstrated the potential application of NIR for predicting volatile solids total solids chemical oxygen demand (COD) and several volatile fatty acids (VFA) of digested sludge from the biogas pilot plant the models relied mainly on different process constraints and were designed as analytical techniques for online-process control (Holm-Nielsen et al 2006 2007) The present study in contrast demonstrates the assessment of biogas yield based on chemical structure and composition of the substrate by FT-NIR spectroscopy Biogas yield is based on the stoichiometric conversion of organic material to biogas as shown in equation (1) Volatile organic compounds in lignocelluloses are theoretically converted to methane (CH4) and carbon dioxide (CO2) which are collectively called biogas (Buswell and Mueller 1952) In most methanogenic fermentations the methane yield lies close to the theoretical maximum of 3 moles of methane per mole of glucose as calculated from the Buswell equation (1) (Ahring and Westermann 2007) Thus the theoretical methane yield of untreated wheat straw is approximately 105 mmol CH4 and 105 mmol CO2 per g straw as wheat straw contains 63 polysaccharides (glucose equivalence) These values were calculated to 2352 mL CH4 and 2352 mL CO2 as one mole of an ideal gas at STP occupies 224 L
242 48248224COcbaCHcbaOHcbaOHC cba ⎟⎠⎞
⎜⎝⎛ +minus+⎟
⎠⎞
⎜⎝⎛ minus+rarr⎟
⎠⎞
⎜⎝⎛ minusminus+ (1)
However due to the complex structure which is rather hard to attack lignocellulose leads to yields lower than this theoretical maximum The presence of organic recalcitrant compounds in straw eg lignin and crystalline cellulose influences the yield of anaerobic digestion These properties of the substrate are reflected in the FT-NIR spectra and can serve for the prediction of the potential biogas yield For instance it has been reported that some parts of the crystalline structure of cellulose are loosened and
PEER-REVIEWED ARTICLE bioresourcescom
Krongtaew et al (2010) ldquoPart 2 Quantitative NIRrdquo BioResources 5(4) 2081-2096 2092
converted to semi-crystalline structures after physico-chemical pre-treatment (Krongtaew et al 2010) This could lead to higher susceptibility of cellulose and provided higher biomass utilization efficiency PLS Loading Spectra
PLS loading spectra contain the descriptive information of FT-NIR absorption regions that influence the PLS regression models As shown in Fig 6(A) the first loading factor (PLS1 2nd derivative pre-processing) of lignin content represents 82 of the data variance and PLS1 of reducing sugar represents 75 of the data variance The major fraction of the spectral variance influencing these models is found between 7200 and 5500 cm-1 where lignin xylan and acetyl groups of polysaccharides absorb As shown by highest negative amplitudes near 5980 cm-1 the spectral position is attributed to the C-H stretch 1st overtone of aromatic rings and the prediction of the lignin content is mainly based on this band But a high lignin content is also correlated with a low xylan content as indicated by the negative PLS loading vectors of lignin+polysaccharides bands near 5800 cm-1 the overlapping band of C-H stretch 1st overtone of lignin and acetyl groups (Lg+Xy Fig 6A) and the broad band of amorphous polysaccharides near 7000 cm-1 Bands assigned to crystalline II (6280 cm-1) and semi-crystalline (6722 cm-1) cellulose however exhibit positive loading vectors indicating high cellulose content of the samples with low lignin content and vice versa It is known that lignin degradation of lignocellulosic substrates leads to better accessible and enzymatically hydrolysable polysaccharides and thus to a higher yield of reducing sugars In fact these two parameters showed a high negative correlation of R = -08 in the data set analysed here (Table 4) This correlation was also found in the first loading spectrum of the model for reducing sugars which is very much alike that of the lignin model but shows the opposite algebraic sign
The correlation matrix (Table 4) shows the low correlation of total solids with all other parameters determined Consequently PLS-loading spectra (Fig 6(B)) were not directly connected to the content of the straw constituents Nevertheless most of the data variance (62) was explained by the second and third PLS loading factor (PLS2 and PLS3 2nd derivative pre-processing) and the regression model showed good predictable results for total solid content (Table 3 and Fig 5(A))
For the PLS loading spectra (2nd derivative pre-processing) of volatile solids (Fig 6(C)) which is the content of combustible organic materials PLS1 and PLS3 contributed mostly to the PLS model In the PLS1 loading spectrum lignin and xylan overlapping band (Lg+Xy) showed the highest influence on the model Amorphous polysaccharides (Am) near 7000 cm-1 and lignin-polysaccharide overlapping band near 5800 cm-1 (Lg+Ps) also appeared A high content of volatile solids was predicted from pretreated straw sample which contained low lignin and xylan (Lg+Xy) content as well as lignin and polysaccharide overlapping (Lg+Ps) but high amount of crystalline (Cry II) semi-crystalline (Sc) and amorphous (Am) cellulose indicating the extraction of inorganic compounds during the pre-treatment
PEER-REVIEWED ARTICLE bioresourcescom
Krongtaew et al (2010) ldquoPart 2 Quantitative NIRrdquo BioResources 5(4) 2081-2096 2093
Fig 6 PLS loading spectra of partial least-squares regression models (A) lignin content and amount of reducing sugar (B) total solids (C) volatile solids and (D) biogas yield
PEER-REVIEWED ARTICLE bioresourcescom
Krongtaew et al (2010) ldquoPart 2 Quantitative NIRrdquo BioResources 5(4) 2081-2096 2094
The first PLS factor of PLS regression models (minimummaximum normaliza-tion pre-processing) of biogas accounted for only 1 of the data variance therefore the second PLS factors is discussed here (Fig 6(D)) PLS2 represented 31 of the data variance and showed the importance of amorphous (Am) polysaccharides for a high biogas yield Crystalline cellulose (Cry II) however had an adverse effect as indicated by a negative loading vector of PLS2 in the respective region In summary it can be seen from the PLS loading spectra that lignin xylan and both amorphous and crystalline moieties of cellulose were representative onto the PLS model for evaluating biogas yield based on straw chemical structure after different severities of various physico-chemical pre-treatment methods Thus biogas potential of physico-chemically pretreated straw can be predicted based on the chemical characteristics and composition by FT-NIR assisted by multivariate data analysis
CONCLUSIONS
Fourier transform near-infrared (FT-NIR) spectroscopy combined with multi-variate data analyses has potential as an analytical tool for not only qualitative characterization of lignocellulose after different pre-treatment methods through the vibration bands of FT-NIR spectra (Krongtaew et al 2010) but also quantitative assessment for key parameters of both pre-treatment and biomass-to-bioenergy production Total residual lignin content enzymatically released reducing sugars total solids (TS) volatile solids (VS) and biogas yield can be analysed This approach can be considered as an alternative process analytical technology (PAT) for assessment of biomass utilization and biomass-to-biogas production offering a powerful and low-budget technique for rapidly growing and bulk volume industries
Furthermore the descriptive information in the loading vectors confirmed the importance of delignification for successful enzymatic and microbial conversion of the structural polysaccharides as well as the adverse effect of high cellulose crystallinity ACKNOWLEDGEMENTS
The authors are grateful to the financial support from the Austrian Research Promotion Agency (FFG project number 81954914233SCKSAI) KF acknowledges the support of FWF the Austrian Science Fund (FWF project number V117-N17) REFERENCES CITED Ahring B K and Westermann P (2007) ldquoCoproduction of bioethanol with other
biofuelsrdquo Adv Biochem EnginBiotechnol 108 289-302 Angelidaki I Ellegaard L and Ahring B K (1992) ldquoCompact automated
displacement gas metering system for measurement of low gas rates from laboratory fermentorsrdquo Biotechnol Bioeng 39 351-353
PEER-REVIEWED ARTICLE bioresourcescom
Krongtaew et al (2010) ldquoPart 2 Quantitative NIRrdquo BioResources 5(4) 2081-2096 2095
Buswell A M and Mueller H F (1952) ldquoMechanism of methane fermentationrdquo Ind Engin Chem 44(3) 550-552
Chandra R P Bura R Mabee W Pan X Berlin A and Saddler J N (2007) ldquoSubstrate pretreatment The key to effective enzymatic hydrolysis of lignocellulosicsrdquo Adv Biochem EnginBiotechnol 108 67-93
Energy Efficiency amp Renewable Energy US Department of Energy (2009) lthttpwww1eereenergygovbiomassanalytical_procedureshtmlgt viewed in September 2009
Fackler K Schmutzer M Manoch L Schwanninger M Hinterstoisser B Ters T Messner K and Gradinger C (2007a) ldquoEvaluation of the selectivity of white rot isolates using near infrared spectroscopic techniquesrdquo Enzyme Microb Technol 41 881-887
Fackler K Schwanninger M Gradinger C Hinterstoisser B and Messner K (2007b) ldquoQualitative and quantitative changes of beech wood degraded by wood-rotting basidiomycetes monitored by Fourier transform infrared spectroscopic methods and multivariate data analysisrdquo FEMS Microbiol Lett 271(2) 162-169
Ghosh S and Rodgers J (2001) ldquoNIR analysis of textilesrdquo In Burns D A and Ciurczak E W (eds) Handbook of Near-Infrared Analysis 2nd Ed Marcel Dekker Inc New York 573-607
Himmel M E Ding S Y Johnson D K Adney W S Numlos M R Brady J W and Foust T D (2007) ldquoBiomass recalcitrance Engineering plants and enzymes for biofuels productionrdquo Science 315 804-807
Holm-Nielsen J B Dahl C K and Esbensen K H (2006) ldquoRepresentative sampling for process analytical characterization of heterogeneous bioslurry systemsmdasha reference study of sampling issues in PATrdquo Chemom Intell Lab Syst 83 114-126
Holm-Nielsen J B Andree H Lindorfer H and Esbensen K H (2007) ldquoTransflexive embedded near infrared monitoring for key process intermediates in anaerobic digestionbiogas productionrdquo J Near Infrared Spectrosc 15 123-135
Kaparaju P Serrano M Thomsen A B Kongjan P and Angelidaki I (2009) ldquoBioethanol biohydrogen and biogas production from wheat straw in a biorefinery conceptrdquo Biores Technol 100 2562-2568
Kong X Xie J Wu Y Huang Y and Bao J (2005) ldquoRapid prediction of acid detergent fiber neutral detergent fiber and acid detergent lignin of rice materials by near-infrared spectroscopyrdquo J Agric Food Chem 53 2843-2848
Krongtaew C Messner K Ters T and Fackler K (2010) ldquoCharacterization of key parameters for biotechnological lignocellulose conversion assessed by FT-NIR spectroscopy Part I Qualitative analysis of pretreated strawrdquo BioResources 5(4) 2063-2080
Kumar P Barrett D M Delwiche M J and Stroeve P (2009) ldquoMethods for pretreatment of lignocellulosic biomass for efficient hydrolysis and biofuel productionrdquo Ind Eng Chem Res 48 3713-3729
Ozaki Y McClure W F and Christy A A (2007) Near Infrared Spectroscopy in Food Science and Technology Wiley Interscience New Jersey
Savitzky A and Golay M J E (1964) ldquoSmoothing and differentiation of data by simplified least squares proceduresrdquo Anal Chem 36(8) 1627-1639
PEER-REVIEWED ARTICLE bioresourcescom
Krongtaew et al (2010) ldquoPart 2 Quantitative NIRrdquo BioResources 5(4) 2081-2096 2096
Shenk J S Workman J J and Westerhaus M O (2001) ldquoApplication of NIR spectroscopy to agricultural productsrdquo In Burns D A and Ciurczak E W (eds) Handbook of Near-Infrared Analysis 2nd Ed Marcel Dekker Inc New York 419-474
Siesler H W Ozaki Y Kawata S and Heise H M (2002) Near Infrared Spectroscopy Principles Instruments and Applications Wiley VCH Germany
Tsuchikawa S and Siesler H W (2003a) ldquoNear-infrared spectroscopic monitoring of the diffusion process of deuterium-labeled molecules in wood Part II Hardwoodrdquo Appl Spectrosc 57 675-681
Tsuchikawa S and Siesler H W (2003b) ldquoNear-infrared spectroscopic monitoring of the diffusion process of deuterium-labeled molecules in wood Part I Softwoodrdquo Appl Spectrosc 57 667-674
Tsuchikawa S Yonenobu H and Siesler H W (2005) ldquoNear-infrared spectroscopic observation of the ageing process in archaeological wood using a deuterium exchange methodrdquo Analyst 130 379-384
Watanabe A Morita S and Ozaki Y (2006) ldquoTemperature-dependent structural changes in hydrogen bonds in microcrystalline cellulose studied by infrared and near-infrared spectroscopy with perturbation-correlation moving-window two-dimensional correlation analysisrdquo Appl Spectrosc 60(6) 611-618
Wilkie A C Smith P H and Bordeaux F M (2004) ldquoAn economical bioreactor for evaluating biogas potential of particulate biomassrdquo Biores Technol 92 103-109
Yu C H (2003) ldquoResampling methods Concepts applications and justificationrdquo Practical Assessment Research amp Evaluation 8(19) Retrieved July 31 2010 from httpPAREonlinenetgetvnaspv=8ampn=19
Article submitted June 22 2010 Peer review completed July 18 2010 Revised version received and accepted August 5 2010 Published August 6 2010

PEER-REVIEWED ARTICLE bioresourcescom
Krongtaew et al (2010) ldquoPart 2 Quantitative NIRrdquo BioResources 5(4) 2081-2096 2090
Table 4 Correlation Matrix of Key Parameters for Biomass-to-Biogas Conversion of Wheat Straw
Lignin Reducing sugars
Weight loss Total solid Volatile solid
Biogas
Lignin R=10
R=-08
R=-09
R=-02
R=-04
R=-06 Reducing sugars
-
R=10
R=08
R=01
R=02
R=06
Weight loss -
-
R=10
R=00
R=04
R=01
Total solid
-
-
-
R=10
R=-04
R=03
Volatile solid
-
-
-
-
R=10
R=-02
Biogas -
-
-
-
-
R=10
Fig 4 Correlation between total lignin and biogas (A) and enzymatically released reducing sugars and biogas (B) where diams and represent data from 80-microm and 2-mm straw samples respectively
PEER-REVIEWED ARTICLE bioresourcescom
Krongtaew et al (2010) ldquoPart 2 Quantitative NIRrdquo BioResources 5(4) 2081-2096 2091
Fig 5 NIR-predicted and measured values of (A) total solid (B) volatile solids and (C) biogas yield from the cross validation of PLS regression models of pretreated wheat straw Black solid indicates the outlier
A recent study demonstrated the prediction of biological methane potential based on a number of parameters - carbohydrates proteins lipids acetate and propionate concentration of a digested sludge mixture (Kaparaju et al 2009) Some scientific work also demonstrated the potential application of NIR for predicting volatile solids total solids chemical oxygen demand (COD) and several volatile fatty acids (VFA) of digested sludge from the biogas pilot plant the models relied mainly on different process constraints and were designed as analytical techniques for online-process control (Holm-Nielsen et al 2006 2007) The present study in contrast demonstrates the assessment of biogas yield based on chemical structure and composition of the substrate by FT-NIR spectroscopy Biogas yield is based on the stoichiometric conversion of organic material to biogas as shown in equation (1) Volatile organic compounds in lignocelluloses are theoretically converted to methane (CH4) and carbon dioxide (CO2) which are collectively called biogas (Buswell and Mueller 1952) In most methanogenic fermentations the methane yield lies close to the theoretical maximum of 3 moles of methane per mole of glucose as calculated from the Buswell equation (1) (Ahring and Westermann 2007) Thus the theoretical methane yield of untreated wheat straw is approximately 105 mmol CH4 and 105 mmol CO2 per g straw as wheat straw contains 63 polysaccharides (glucose equivalence) These values were calculated to 2352 mL CH4 and 2352 mL CO2 as one mole of an ideal gas at STP occupies 224 L
242 48248224COcbaCHcbaOHcbaOHC cba ⎟⎠⎞
⎜⎝⎛ +minus+⎟
⎠⎞
⎜⎝⎛ minus+rarr⎟
⎠⎞
⎜⎝⎛ minusminus+ (1)
However due to the complex structure which is rather hard to attack lignocellulose leads to yields lower than this theoretical maximum The presence of organic recalcitrant compounds in straw eg lignin and crystalline cellulose influences the yield of anaerobic digestion These properties of the substrate are reflected in the FT-NIR spectra and can serve for the prediction of the potential biogas yield For instance it has been reported that some parts of the crystalline structure of cellulose are loosened and
PEER-REVIEWED ARTICLE bioresourcescom
Krongtaew et al (2010) ldquoPart 2 Quantitative NIRrdquo BioResources 5(4) 2081-2096 2092
converted to semi-crystalline structures after physico-chemical pre-treatment (Krongtaew et al 2010) This could lead to higher susceptibility of cellulose and provided higher biomass utilization efficiency PLS Loading Spectra
PLS loading spectra contain the descriptive information of FT-NIR absorption regions that influence the PLS regression models As shown in Fig 6(A) the first loading factor (PLS1 2nd derivative pre-processing) of lignin content represents 82 of the data variance and PLS1 of reducing sugar represents 75 of the data variance The major fraction of the spectral variance influencing these models is found between 7200 and 5500 cm-1 where lignin xylan and acetyl groups of polysaccharides absorb As shown by highest negative amplitudes near 5980 cm-1 the spectral position is attributed to the C-H stretch 1st overtone of aromatic rings and the prediction of the lignin content is mainly based on this band But a high lignin content is also correlated with a low xylan content as indicated by the negative PLS loading vectors of lignin+polysaccharides bands near 5800 cm-1 the overlapping band of C-H stretch 1st overtone of lignin and acetyl groups (Lg+Xy Fig 6A) and the broad band of amorphous polysaccharides near 7000 cm-1 Bands assigned to crystalline II (6280 cm-1) and semi-crystalline (6722 cm-1) cellulose however exhibit positive loading vectors indicating high cellulose content of the samples with low lignin content and vice versa It is known that lignin degradation of lignocellulosic substrates leads to better accessible and enzymatically hydrolysable polysaccharides and thus to a higher yield of reducing sugars In fact these two parameters showed a high negative correlation of R = -08 in the data set analysed here (Table 4) This correlation was also found in the first loading spectrum of the model for reducing sugars which is very much alike that of the lignin model but shows the opposite algebraic sign
The correlation matrix (Table 4) shows the low correlation of total solids with all other parameters determined Consequently PLS-loading spectra (Fig 6(B)) were not directly connected to the content of the straw constituents Nevertheless most of the data variance (62) was explained by the second and third PLS loading factor (PLS2 and PLS3 2nd derivative pre-processing) and the regression model showed good predictable results for total solid content (Table 3 and Fig 5(A))
For the PLS loading spectra (2nd derivative pre-processing) of volatile solids (Fig 6(C)) which is the content of combustible organic materials PLS1 and PLS3 contributed mostly to the PLS model In the PLS1 loading spectrum lignin and xylan overlapping band (Lg+Xy) showed the highest influence on the model Amorphous polysaccharides (Am) near 7000 cm-1 and lignin-polysaccharide overlapping band near 5800 cm-1 (Lg+Ps) also appeared A high content of volatile solids was predicted from pretreated straw sample which contained low lignin and xylan (Lg+Xy) content as well as lignin and polysaccharide overlapping (Lg+Ps) but high amount of crystalline (Cry II) semi-crystalline (Sc) and amorphous (Am) cellulose indicating the extraction of inorganic compounds during the pre-treatment
PEER-REVIEWED ARTICLE bioresourcescom
Krongtaew et al (2010) ldquoPart 2 Quantitative NIRrdquo BioResources 5(4) 2081-2096 2093
Fig 6 PLS loading spectra of partial least-squares regression models (A) lignin content and amount of reducing sugar (B) total solids (C) volatile solids and (D) biogas yield
PEER-REVIEWED ARTICLE bioresourcescom
Krongtaew et al (2010) ldquoPart 2 Quantitative NIRrdquo BioResources 5(4) 2081-2096 2094
The first PLS factor of PLS regression models (minimummaximum normaliza-tion pre-processing) of biogas accounted for only 1 of the data variance therefore the second PLS factors is discussed here (Fig 6(D)) PLS2 represented 31 of the data variance and showed the importance of amorphous (Am) polysaccharides for a high biogas yield Crystalline cellulose (Cry II) however had an adverse effect as indicated by a negative loading vector of PLS2 in the respective region In summary it can be seen from the PLS loading spectra that lignin xylan and both amorphous and crystalline moieties of cellulose were representative onto the PLS model for evaluating biogas yield based on straw chemical structure after different severities of various physico-chemical pre-treatment methods Thus biogas potential of physico-chemically pretreated straw can be predicted based on the chemical characteristics and composition by FT-NIR assisted by multivariate data analysis
CONCLUSIONS
Fourier transform near-infrared (FT-NIR) spectroscopy combined with multi-variate data analyses has potential as an analytical tool for not only qualitative characterization of lignocellulose after different pre-treatment methods through the vibration bands of FT-NIR spectra (Krongtaew et al 2010) but also quantitative assessment for key parameters of both pre-treatment and biomass-to-bioenergy production Total residual lignin content enzymatically released reducing sugars total solids (TS) volatile solids (VS) and biogas yield can be analysed This approach can be considered as an alternative process analytical technology (PAT) for assessment of biomass utilization and biomass-to-biogas production offering a powerful and low-budget technique for rapidly growing and bulk volume industries
Furthermore the descriptive information in the loading vectors confirmed the importance of delignification for successful enzymatic and microbial conversion of the structural polysaccharides as well as the adverse effect of high cellulose crystallinity ACKNOWLEDGEMENTS
The authors are grateful to the financial support from the Austrian Research Promotion Agency (FFG project number 81954914233SCKSAI) KF acknowledges the support of FWF the Austrian Science Fund (FWF project number V117-N17) REFERENCES CITED Ahring B K and Westermann P (2007) ldquoCoproduction of bioethanol with other
biofuelsrdquo Adv Biochem EnginBiotechnol 108 289-302 Angelidaki I Ellegaard L and Ahring B K (1992) ldquoCompact automated
displacement gas metering system for measurement of low gas rates from laboratory fermentorsrdquo Biotechnol Bioeng 39 351-353
PEER-REVIEWED ARTICLE bioresourcescom
Krongtaew et al (2010) ldquoPart 2 Quantitative NIRrdquo BioResources 5(4) 2081-2096 2095
Buswell A M and Mueller H F (1952) ldquoMechanism of methane fermentationrdquo Ind Engin Chem 44(3) 550-552
Chandra R P Bura R Mabee W Pan X Berlin A and Saddler J N (2007) ldquoSubstrate pretreatment The key to effective enzymatic hydrolysis of lignocellulosicsrdquo Adv Biochem EnginBiotechnol 108 67-93
Energy Efficiency amp Renewable Energy US Department of Energy (2009) lthttpwww1eereenergygovbiomassanalytical_procedureshtmlgt viewed in September 2009
Fackler K Schmutzer M Manoch L Schwanninger M Hinterstoisser B Ters T Messner K and Gradinger C (2007a) ldquoEvaluation of the selectivity of white rot isolates using near infrared spectroscopic techniquesrdquo Enzyme Microb Technol 41 881-887
Fackler K Schwanninger M Gradinger C Hinterstoisser B and Messner K (2007b) ldquoQualitative and quantitative changes of beech wood degraded by wood-rotting basidiomycetes monitored by Fourier transform infrared spectroscopic methods and multivariate data analysisrdquo FEMS Microbiol Lett 271(2) 162-169
Ghosh S and Rodgers J (2001) ldquoNIR analysis of textilesrdquo In Burns D A and Ciurczak E W (eds) Handbook of Near-Infrared Analysis 2nd Ed Marcel Dekker Inc New York 573-607
Himmel M E Ding S Y Johnson D K Adney W S Numlos M R Brady J W and Foust T D (2007) ldquoBiomass recalcitrance Engineering plants and enzymes for biofuels productionrdquo Science 315 804-807
Holm-Nielsen J B Dahl C K and Esbensen K H (2006) ldquoRepresentative sampling for process analytical characterization of heterogeneous bioslurry systemsmdasha reference study of sampling issues in PATrdquo Chemom Intell Lab Syst 83 114-126
Holm-Nielsen J B Andree H Lindorfer H and Esbensen K H (2007) ldquoTransflexive embedded near infrared monitoring for key process intermediates in anaerobic digestionbiogas productionrdquo J Near Infrared Spectrosc 15 123-135
Kaparaju P Serrano M Thomsen A B Kongjan P and Angelidaki I (2009) ldquoBioethanol biohydrogen and biogas production from wheat straw in a biorefinery conceptrdquo Biores Technol 100 2562-2568
Kong X Xie J Wu Y Huang Y and Bao J (2005) ldquoRapid prediction of acid detergent fiber neutral detergent fiber and acid detergent lignin of rice materials by near-infrared spectroscopyrdquo J Agric Food Chem 53 2843-2848
Krongtaew C Messner K Ters T and Fackler K (2010) ldquoCharacterization of key parameters for biotechnological lignocellulose conversion assessed by FT-NIR spectroscopy Part I Qualitative analysis of pretreated strawrdquo BioResources 5(4) 2063-2080
Kumar P Barrett D M Delwiche M J and Stroeve P (2009) ldquoMethods for pretreatment of lignocellulosic biomass for efficient hydrolysis and biofuel productionrdquo Ind Eng Chem Res 48 3713-3729
Ozaki Y McClure W F and Christy A A (2007) Near Infrared Spectroscopy in Food Science and Technology Wiley Interscience New Jersey
Savitzky A and Golay M J E (1964) ldquoSmoothing and differentiation of data by simplified least squares proceduresrdquo Anal Chem 36(8) 1627-1639
PEER-REVIEWED ARTICLE bioresourcescom
Krongtaew et al (2010) ldquoPart 2 Quantitative NIRrdquo BioResources 5(4) 2081-2096 2096
Shenk J S Workman J J and Westerhaus M O (2001) ldquoApplication of NIR spectroscopy to agricultural productsrdquo In Burns D A and Ciurczak E W (eds) Handbook of Near-Infrared Analysis 2nd Ed Marcel Dekker Inc New York 419-474
Siesler H W Ozaki Y Kawata S and Heise H M (2002) Near Infrared Spectroscopy Principles Instruments and Applications Wiley VCH Germany
Tsuchikawa S and Siesler H W (2003a) ldquoNear-infrared spectroscopic monitoring of the diffusion process of deuterium-labeled molecules in wood Part II Hardwoodrdquo Appl Spectrosc 57 675-681
Tsuchikawa S and Siesler H W (2003b) ldquoNear-infrared spectroscopic monitoring of the diffusion process of deuterium-labeled molecules in wood Part I Softwoodrdquo Appl Spectrosc 57 667-674
Tsuchikawa S Yonenobu H and Siesler H W (2005) ldquoNear-infrared spectroscopic observation of the ageing process in archaeological wood using a deuterium exchange methodrdquo Analyst 130 379-384
Watanabe A Morita S and Ozaki Y (2006) ldquoTemperature-dependent structural changes in hydrogen bonds in microcrystalline cellulose studied by infrared and near-infrared spectroscopy with perturbation-correlation moving-window two-dimensional correlation analysisrdquo Appl Spectrosc 60(6) 611-618
Wilkie A C Smith P H and Bordeaux F M (2004) ldquoAn economical bioreactor for evaluating biogas potential of particulate biomassrdquo Biores Technol 92 103-109
Yu C H (2003) ldquoResampling methods Concepts applications and justificationrdquo Practical Assessment Research amp Evaluation 8(19) Retrieved July 31 2010 from httpPAREonlinenetgetvnaspv=8ampn=19
Article submitted June 22 2010 Peer review completed July 18 2010 Revised version received and accepted August 5 2010 Published August 6 2010
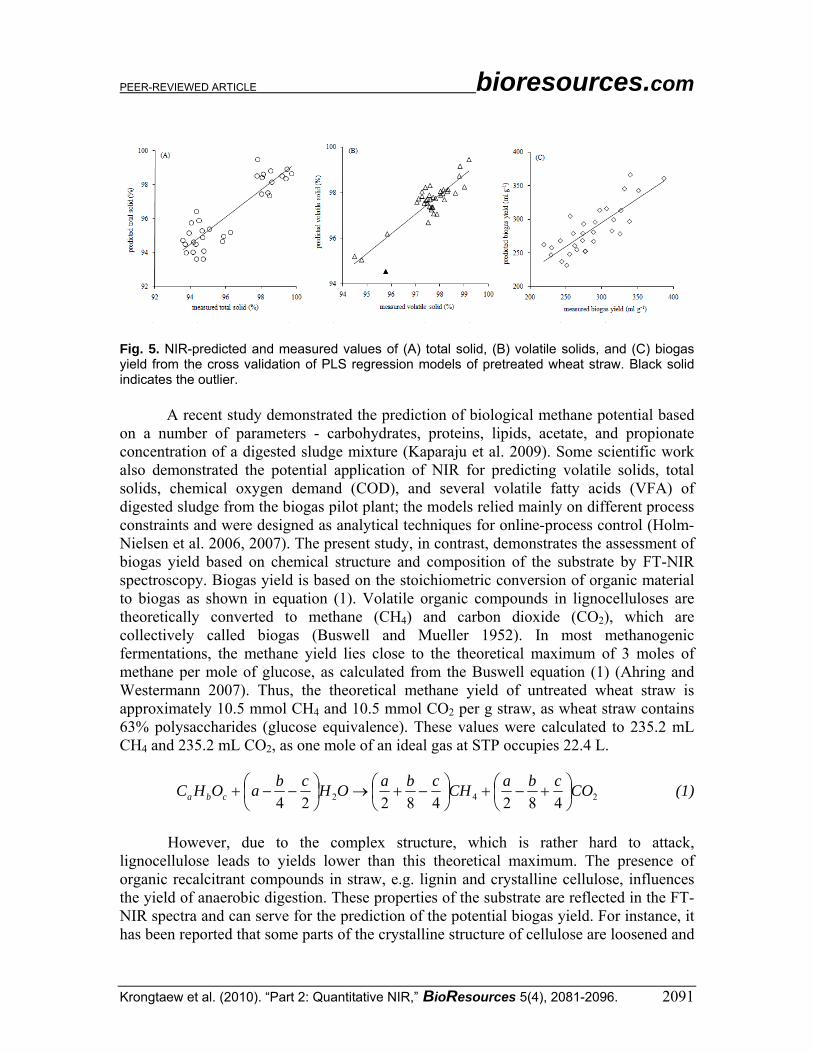
PEER-REVIEWED ARTICLE bioresourcescom
Krongtaew et al (2010) ldquoPart 2 Quantitative NIRrdquo BioResources 5(4) 2081-2096 2091
Fig 5 NIR-predicted and measured values of (A) total solid (B) volatile solids and (C) biogas yield from the cross validation of PLS regression models of pretreated wheat straw Black solid indicates the outlier
A recent study demonstrated the prediction of biological methane potential based on a number of parameters - carbohydrates proteins lipids acetate and propionate concentration of a digested sludge mixture (Kaparaju et al 2009) Some scientific work also demonstrated the potential application of NIR for predicting volatile solids total solids chemical oxygen demand (COD) and several volatile fatty acids (VFA) of digested sludge from the biogas pilot plant the models relied mainly on different process constraints and were designed as analytical techniques for online-process control (Holm-Nielsen et al 2006 2007) The present study in contrast demonstrates the assessment of biogas yield based on chemical structure and composition of the substrate by FT-NIR spectroscopy Biogas yield is based on the stoichiometric conversion of organic material to biogas as shown in equation (1) Volatile organic compounds in lignocelluloses are theoretically converted to methane (CH4) and carbon dioxide (CO2) which are collectively called biogas (Buswell and Mueller 1952) In most methanogenic fermentations the methane yield lies close to the theoretical maximum of 3 moles of methane per mole of glucose as calculated from the Buswell equation (1) (Ahring and Westermann 2007) Thus the theoretical methane yield of untreated wheat straw is approximately 105 mmol CH4 and 105 mmol CO2 per g straw as wheat straw contains 63 polysaccharides (glucose equivalence) These values were calculated to 2352 mL CH4 and 2352 mL CO2 as one mole of an ideal gas at STP occupies 224 L
242 48248224COcbaCHcbaOHcbaOHC cba ⎟⎠⎞
⎜⎝⎛ +minus+⎟
⎠⎞
⎜⎝⎛ minus+rarr⎟
⎠⎞
⎜⎝⎛ minusminus+ (1)
However due to the complex structure which is rather hard to attack lignocellulose leads to yields lower than this theoretical maximum The presence of organic recalcitrant compounds in straw eg lignin and crystalline cellulose influences the yield of anaerobic digestion These properties of the substrate are reflected in the FT-NIR spectra and can serve for the prediction of the potential biogas yield For instance it has been reported that some parts of the crystalline structure of cellulose are loosened and
PEER-REVIEWED ARTICLE bioresourcescom
Krongtaew et al (2010) ldquoPart 2 Quantitative NIRrdquo BioResources 5(4) 2081-2096 2092
converted to semi-crystalline structures after physico-chemical pre-treatment (Krongtaew et al 2010) This could lead to higher susceptibility of cellulose and provided higher biomass utilization efficiency PLS Loading Spectra
PLS loading spectra contain the descriptive information of FT-NIR absorption regions that influence the PLS regression models As shown in Fig 6(A) the first loading factor (PLS1 2nd derivative pre-processing) of lignin content represents 82 of the data variance and PLS1 of reducing sugar represents 75 of the data variance The major fraction of the spectral variance influencing these models is found between 7200 and 5500 cm-1 where lignin xylan and acetyl groups of polysaccharides absorb As shown by highest negative amplitudes near 5980 cm-1 the spectral position is attributed to the C-H stretch 1st overtone of aromatic rings and the prediction of the lignin content is mainly based on this band But a high lignin content is also correlated with a low xylan content as indicated by the negative PLS loading vectors of lignin+polysaccharides bands near 5800 cm-1 the overlapping band of C-H stretch 1st overtone of lignin and acetyl groups (Lg+Xy Fig 6A) and the broad band of amorphous polysaccharides near 7000 cm-1 Bands assigned to crystalline II (6280 cm-1) and semi-crystalline (6722 cm-1) cellulose however exhibit positive loading vectors indicating high cellulose content of the samples with low lignin content and vice versa It is known that lignin degradation of lignocellulosic substrates leads to better accessible and enzymatically hydrolysable polysaccharides and thus to a higher yield of reducing sugars In fact these two parameters showed a high negative correlation of R = -08 in the data set analysed here (Table 4) This correlation was also found in the first loading spectrum of the model for reducing sugars which is very much alike that of the lignin model but shows the opposite algebraic sign
The correlation matrix (Table 4) shows the low correlation of total solids with all other parameters determined Consequently PLS-loading spectra (Fig 6(B)) were not directly connected to the content of the straw constituents Nevertheless most of the data variance (62) was explained by the second and third PLS loading factor (PLS2 and PLS3 2nd derivative pre-processing) and the regression model showed good predictable results for total solid content (Table 3 and Fig 5(A))
For the PLS loading spectra (2nd derivative pre-processing) of volatile solids (Fig 6(C)) which is the content of combustible organic materials PLS1 and PLS3 contributed mostly to the PLS model In the PLS1 loading spectrum lignin and xylan overlapping band (Lg+Xy) showed the highest influence on the model Amorphous polysaccharides (Am) near 7000 cm-1 and lignin-polysaccharide overlapping band near 5800 cm-1 (Lg+Ps) also appeared A high content of volatile solids was predicted from pretreated straw sample which contained low lignin and xylan (Lg+Xy) content as well as lignin and polysaccharide overlapping (Lg+Ps) but high amount of crystalline (Cry II) semi-crystalline (Sc) and amorphous (Am) cellulose indicating the extraction of inorganic compounds during the pre-treatment
PEER-REVIEWED ARTICLE bioresourcescom
Krongtaew et al (2010) ldquoPart 2 Quantitative NIRrdquo BioResources 5(4) 2081-2096 2093
Fig 6 PLS loading spectra of partial least-squares regression models (A) lignin content and amount of reducing sugar (B) total solids (C) volatile solids and (D) biogas yield
PEER-REVIEWED ARTICLE bioresourcescom
Krongtaew et al (2010) ldquoPart 2 Quantitative NIRrdquo BioResources 5(4) 2081-2096 2094
The first PLS factor of PLS regression models (minimummaximum normaliza-tion pre-processing) of biogas accounted for only 1 of the data variance therefore the second PLS factors is discussed here (Fig 6(D)) PLS2 represented 31 of the data variance and showed the importance of amorphous (Am) polysaccharides for a high biogas yield Crystalline cellulose (Cry II) however had an adverse effect as indicated by a negative loading vector of PLS2 in the respective region In summary it can be seen from the PLS loading spectra that lignin xylan and both amorphous and crystalline moieties of cellulose were representative onto the PLS model for evaluating biogas yield based on straw chemical structure after different severities of various physico-chemical pre-treatment methods Thus biogas potential of physico-chemically pretreated straw can be predicted based on the chemical characteristics and composition by FT-NIR assisted by multivariate data analysis
CONCLUSIONS
Fourier transform near-infrared (FT-NIR) spectroscopy combined with multi-variate data analyses has potential as an analytical tool for not only qualitative characterization of lignocellulose after different pre-treatment methods through the vibration bands of FT-NIR spectra (Krongtaew et al 2010) but also quantitative assessment for key parameters of both pre-treatment and biomass-to-bioenergy production Total residual lignin content enzymatically released reducing sugars total solids (TS) volatile solids (VS) and biogas yield can be analysed This approach can be considered as an alternative process analytical technology (PAT) for assessment of biomass utilization and biomass-to-biogas production offering a powerful and low-budget technique for rapidly growing and bulk volume industries
Furthermore the descriptive information in the loading vectors confirmed the importance of delignification for successful enzymatic and microbial conversion of the structural polysaccharides as well as the adverse effect of high cellulose crystallinity ACKNOWLEDGEMENTS
The authors are grateful to the financial support from the Austrian Research Promotion Agency (FFG project number 81954914233SCKSAI) KF acknowledges the support of FWF the Austrian Science Fund (FWF project number V117-N17) REFERENCES CITED Ahring B K and Westermann P (2007) ldquoCoproduction of bioethanol with other
biofuelsrdquo Adv Biochem EnginBiotechnol 108 289-302 Angelidaki I Ellegaard L and Ahring B K (1992) ldquoCompact automated
displacement gas metering system for measurement of low gas rates from laboratory fermentorsrdquo Biotechnol Bioeng 39 351-353
PEER-REVIEWED ARTICLE bioresourcescom
Krongtaew et al (2010) ldquoPart 2 Quantitative NIRrdquo BioResources 5(4) 2081-2096 2095
Buswell A M and Mueller H F (1952) ldquoMechanism of methane fermentationrdquo Ind Engin Chem 44(3) 550-552
Chandra R P Bura R Mabee W Pan X Berlin A and Saddler J N (2007) ldquoSubstrate pretreatment The key to effective enzymatic hydrolysis of lignocellulosicsrdquo Adv Biochem EnginBiotechnol 108 67-93
Energy Efficiency amp Renewable Energy US Department of Energy (2009) lthttpwww1eereenergygovbiomassanalytical_procedureshtmlgt viewed in September 2009
Fackler K Schmutzer M Manoch L Schwanninger M Hinterstoisser B Ters T Messner K and Gradinger C (2007a) ldquoEvaluation of the selectivity of white rot isolates using near infrared spectroscopic techniquesrdquo Enzyme Microb Technol 41 881-887
Fackler K Schwanninger M Gradinger C Hinterstoisser B and Messner K (2007b) ldquoQualitative and quantitative changes of beech wood degraded by wood-rotting basidiomycetes monitored by Fourier transform infrared spectroscopic methods and multivariate data analysisrdquo FEMS Microbiol Lett 271(2) 162-169
Ghosh S and Rodgers J (2001) ldquoNIR analysis of textilesrdquo In Burns D A and Ciurczak E W (eds) Handbook of Near-Infrared Analysis 2nd Ed Marcel Dekker Inc New York 573-607
Himmel M E Ding S Y Johnson D K Adney W S Numlos M R Brady J W and Foust T D (2007) ldquoBiomass recalcitrance Engineering plants and enzymes for biofuels productionrdquo Science 315 804-807
Holm-Nielsen J B Dahl C K and Esbensen K H (2006) ldquoRepresentative sampling for process analytical characterization of heterogeneous bioslurry systemsmdasha reference study of sampling issues in PATrdquo Chemom Intell Lab Syst 83 114-126
Holm-Nielsen J B Andree H Lindorfer H and Esbensen K H (2007) ldquoTransflexive embedded near infrared monitoring for key process intermediates in anaerobic digestionbiogas productionrdquo J Near Infrared Spectrosc 15 123-135
Kaparaju P Serrano M Thomsen A B Kongjan P and Angelidaki I (2009) ldquoBioethanol biohydrogen and biogas production from wheat straw in a biorefinery conceptrdquo Biores Technol 100 2562-2568
Kong X Xie J Wu Y Huang Y and Bao J (2005) ldquoRapid prediction of acid detergent fiber neutral detergent fiber and acid detergent lignin of rice materials by near-infrared spectroscopyrdquo J Agric Food Chem 53 2843-2848
Krongtaew C Messner K Ters T and Fackler K (2010) ldquoCharacterization of key parameters for biotechnological lignocellulose conversion assessed by FT-NIR spectroscopy Part I Qualitative analysis of pretreated strawrdquo BioResources 5(4) 2063-2080
Kumar P Barrett D M Delwiche M J and Stroeve P (2009) ldquoMethods for pretreatment of lignocellulosic biomass for efficient hydrolysis and biofuel productionrdquo Ind Eng Chem Res 48 3713-3729
Ozaki Y McClure W F and Christy A A (2007) Near Infrared Spectroscopy in Food Science and Technology Wiley Interscience New Jersey
Savitzky A and Golay M J E (1964) ldquoSmoothing and differentiation of data by simplified least squares proceduresrdquo Anal Chem 36(8) 1627-1639
PEER-REVIEWED ARTICLE bioresourcescom
Krongtaew et al (2010) ldquoPart 2 Quantitative NIRrdquo BioResources 5(4) 2081-2096 2096
Shenk J S Workman J J and Westerhaus M O (2001) ldquoApplication of NIR spectroscopy to agricultural productsrdquo In Burns D A and Ciurczak E W (eds) Handbook of Near-Infrared Analysis 2nd Ed Marcel Dekker Inc New York 419-474
Siesler H W Ozaki Y Kawata S and Heise H M (2002) Near Infrared Spectroscopy Principles Instruments and Applications Wiley VCH Germany
Tsuchikawa S and Siesler H W (2003a) ldquoNear-infrared spectroscopic monitoring of the diffusion process of deuterium-labeled molecules in wood Part II Hardwoodrdquo Appl Spectrosc 57 675-681
Tsuchikawa S and Siesler H W (2003b) ldquoNear-infrared spectroscopic monitoring of the diffusion process of deuterium-labeled molecules in wood Part I Softwoodrdquo Appl Spectrosc 57 667-674
Tsuchikawa S Yonenobu H and Siesler H W (2005) ldquoNear-infrared spectroscopic observation of the ageing process in archaeological wood using a deuterium exchange methodrdquo Analyst 130 379-384
Watanabe A Morita S and Ozaki Y (2006) ldquoTemperature-dependent structural changes in hydrogen bonds in microcrystalline cellulose studied by infrared and near-infrared spectroscopy with perturbation-correlation moving-window two-dimensional correlation analysisrdquo Appl Spectrosc 60(6) 611-618
Wilkie A C Smith P H and Bordeaux F M (2004) ldquoAn economical bioreactor for evaluating biogas potential of particulate biomassrdquo Biores Technol 92 103-109
Yu C H (2003) ldquoResampling methods Concepts applications and justificationrdquo Practical Assessment Research amp Evaluation 8(19) Retrieved July 31 2010 from httpPAREonlinenetgetvnaspv=8ampn=19
Article submitted June 22 2010 Peer review completed July 18 2010 Revised version received and accepted August 5 2010 Published August 6 2010
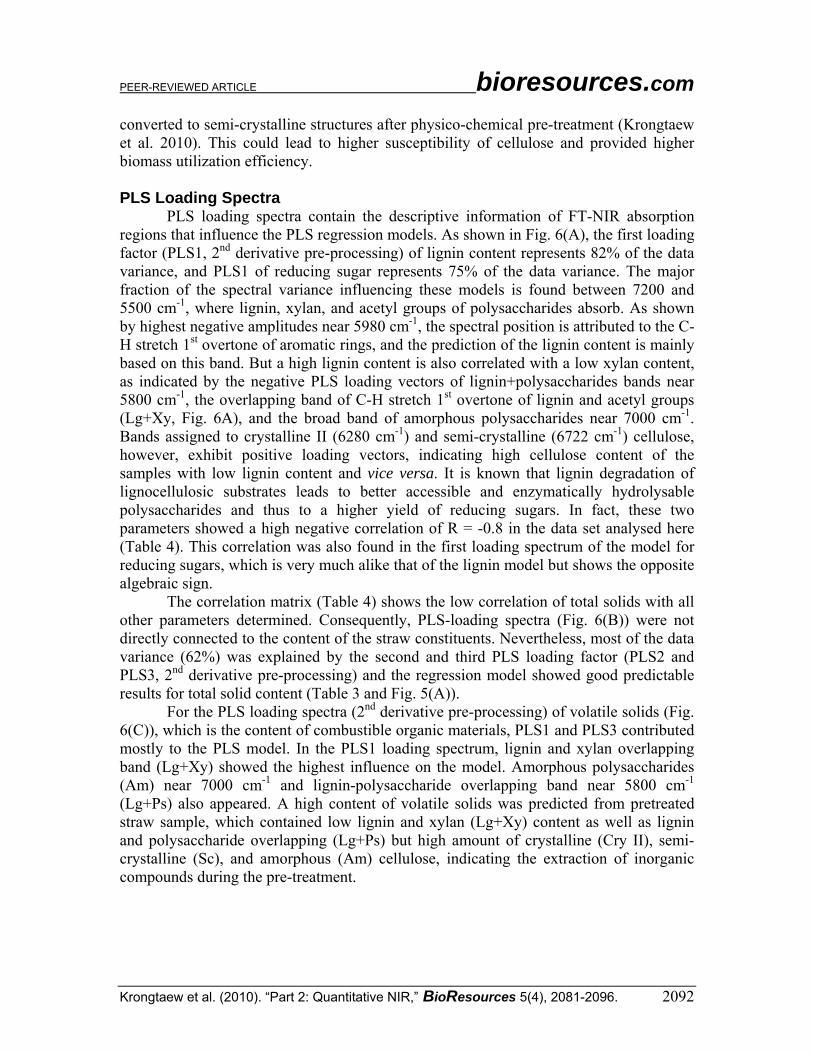
PEER-REVIEWED ARTICLE bioresourcescom
Krongtaew et al (2010) ldquoPart 2 Quantitative NIRrdquo BioResources 5(4) 2081-2096 2093
Fig 6 PLS loading spectra of partial least-squares regression models (A) lignin content and amount of reducing sugar (B) total solids (C) volatile solids and (D) biogas yield
PEER-REVIEWED ARTICLE bioresourcescom
Krongtaew et al (2010) ldquoPart 2 Quantitative NIRrdquo BioResources 5(4) 2081-2096 2094
The first PLS factor of PLS regression models (minimummaximum normaliza-tion pre-processing) of biogas accounted for only 1 of the data variance therefore the second PLS factors is discussed here (Fig 6(D)) PLS2 represented 31 of the data variance and showed the importance of amorphous (Am) polysaccharides for a high biogas yield Crystalline cellulose (Cry II) however had an adverse effect as indicated by a negative loading vector of PLS2 in the respective region In summary it can be seen from the PLS loading spectra that lignin xylan and both amorphous and crystalline moieties of cellulose were representative onto the PLS model for evaluating biogas yield based on straw chemical structure after different severities of various physico-chemical pre-treatment methods Thus biogas potential of physico-chemically pretreated straw can be predicted based on the chemical characteristics and composition by FT-NIR assisted by multivariate data analysis
CONCLUSIONS
Fourier transform near-infrared (FT-NIR) spectroscopy combined with multi-variate data analyses has potential as an analytical tool for not only qualitative characterization of lignocellulose after different pre-treatment methods through the vibration bands of FT-NIR spectra (Krongtaew et al 2010) but also quantitative assessment for key parameters of both pre-treatment and biomass-to-bioenergy production Total residual lignin content enzymatically released reducing sugars total solids (TS) volatile solids (VS) and biogas yield can be analysed This approach can be considered as an alternative process analytical technology (PAT) for assessment of biomass utilization and biomass-to-biogas production offering a powerful and low-budget technique for rapidly growing and bulk volume industries
Furthermore the descriptive information in the loading vectors confirmed the importance of delignification for successful enzymatic and microbial conversion of the structural polysaccharides as well as the adverse effect of high cellulose crystallinity ACKNOWLEDGEMENTS
The authors are grateful to the financial support from the Austrian Research Promotion Agency (FFG project number 81954914233SCKSAI) KF acknowledges the support of FWF the Austrian Science Fund (FWF project number V117-N17) REFERENCES CITED Ahring B K and Westermann P (2007) ldquoCoproduction of bioethanol with other
biofuelsrdquo Adv Biochem EnginBiotechnol 108 289-302 Angelidaki I Ellegaard L and Ahring B K (1992) ldquoCompact automated
displacement gas metering system for measurement of low gas rates from laboratory fermentorsrdquo Biotechnol Bioeng 39 351-353
PEER-REVIEWED ARTICLE bioresourcescom
Krongtaew et al (2010) ldquoPart 2 Quantitative NIRrdquo BioResources 5(4) 2081-2096 2095
Buswell A M and Mueller H F (1952) ldquoMechanism of methane fermentationrdquo Ind Engin Chem 44(3) 550-552
Chandra R P Bura R Mabee W Pan X Berlin A and Saddler J N (2007) ldquoSubstrate pretreatment The key to effective enzymatic hydrolysis of lignocellulosicsrdquo Adv Biochem EnginBiotechnol 108 67-93
Energy Efficiency amp Renewable Energy US Department of Energy (2009) lthttpwww1eereenergygovbiomassanalytical_procedureshtmlgt viewed in September 2009
Fackler K Schmutzer M Manoch L Schwanninger M Hinterstoisser B Ters T Messner K and Gradinger C (2007a) ldquoEvaluation of the selectivity of white rot isolates using near infrared spectroscopic techniquesrdquo Enzyme Microb Technol 41 881-887
Fackler K Schwanninger M Gradinger C Hinterstoisser B and Messner K (2007b) ldquoQualitative and quantitative changes of beech wood degraded by wood-rotting basidiomycetes monitored by Fourier transform infrared spectroscopic methods and multivariate data analysisrdquo FEMS Microbiol Lett 271(2) 162-169
Ghosh S and Rodgers J (2001) ldquoNIR analysis of textilesrdquo In Burns D A and Ciurczak E W (eds) Handbook of Near-Infrared Analysis 2nd Ed Marcel Dekker Inc New York 573-607
Himmel M E Ding S Y Johnson D K Adney W S Numlos M R Brady J W and Foust T D (2007) ldquoBiomass recalcitrance Engineering plants and enzymes for biofuels productionrdquo Science 315 804-807
Holm-Nielsen J B Dahl C K and Esbensen K H (2006) ldquoRepresentative sampling for process analytical characterization of heterogeneous bioslurry systemsmdasha reference study of sampling issues in PATrdquo Chemom Intell Lab Syst 83 114-126
Holm-Nielsen J B Andree H Lindorfer H and Esbensen K H (2007) ldquoTransflexive embedded near infrared monitoring for key process intermediates in anaerobic digestionbiogas productionrdquo J Near Infrared Spectrosc 15 123-135
Kaparaju P Serrano M Thomsen A B Kongjan P and Angelidaki I (2009) ldquoBioethanol biohydrogen and biogas production from wheat straw in a biorefinery conceptrdquo Biores Technol 100 2562-2568
Kong X Xie J Wu Y Huang Y and Bao J (2005) ldquoRapid prediction of acid detergent fiber neutral detergent fiber and acid detergent lignin of rice materials by near-infrared spectroscopyrdquo J Agric Food Chem 53 2843-2848
Krongtaew C Messner K Ters T and Fackler K (2010) ldquoCharacterization of key parameters for biotechnological lignocellulose conversion assessed by FT-NIR spectroscopy Part I Qualitative analysis of pretreated strawrdquo BioResources 5(4) 2063-2080
Kumar P Barrett D M Delwiche M J and Stroeve P (2009) ldquoMethods for pretreatment of lignocellulosic biomass for efficient hydrolysis and biofuel productionrdquo Ind Eng Chem Res 48 3713-3729
Ozaki Y McClure W F and Christy A A (2007) Near Infrared Spectroscopy in Food Science and Technology Wiley Interscience New Jersey
Savitzky A and Golay M J E (1964) ldquoSmoothing and differentiation of data by simplified least squares proceduresrdquo Anal Chem 36(8) 1627-1639
PEER-REVIEWED ARTICLE bioresourcescom
Krongtaew et al (2010) ldquoPart 2 Quantitative NIRrdquo BioResources 5(4) 2081-2096 2096
Shenk J S Workman J J and Westerhaus M O (2001) ldquoApplication of NIR spectroscopy to agricultural productsrdquo In Burns D A and Ciurczak E W (eds) Handbook of Near-Infrared Analysis 2nd Ed Marcel Dekker Inc New York 419-474
Siesler H W Ozaki Y Kawata S and Heise H M (2002) Near Infrared Spectroscopy Principles Instruments and Applications Wiley VCH Germany
Tsuchikawa S and Siesler H W (2003a) ldquoNear-infrared spectroscopic monitoring of the diffusion process of deuterium-labeled molecules in wood Part II Hardwoodrdquo Appl Spectrosc 57 675-681
Tsuchikawa S and Siesler H W (2003b) ldquoNear-infrared spectroscopic monitoring of the diffusion process of deuterium-labeled molecules in wood Part I Softwoodrdquo Appl Spectrosc 57 667-674
Tsuchikawa S Yonenobu H and Siesler H W (2005) ldquoNear-infrared spectroscopic observation of the ageing process in archaeological wood using a deuterium exchange methodrdquo Analyst 130 379-384
Watanabe A Morita S and Ozaki Y (2006) ldquoTemperature-dependent structural changes in hydrogen bonds in microcrystalline cellulose studied by infrared and near-infrared spectroscopy with perturbation-correlation moving-window two-dimensional correlation analysisrdquo Appl Spectrosc 60(6) 611-618
Wilkie A C Smith P H and Bordeaux F M (2004) ldquoAn economical bioreactor for evaluating biogas potential of particulate biomassrdquo Biores Technol 92 103-109
Yu C H (2003) ldquoResampling methods Concepts applications and justificationrdquo Practical Assessment Research amp Evaluation 8(19) Retrieved July 31 2010 from httpPAREonlinenetgetvnaspv=8ampn=19
Article submitted June 22 2010 Peer review completed July 18 2010 Revised version received and accepted August 5 2010 Published August 6 2010
PEER-REVIEWED ARTICLE bioresourcescom
Krongtaew et al (2010) ldquoPart 2 Quantitative NIRrdquo BioResources 5(4) 2081-2096 2096
Shenk J S Workman J J and Westerhaus M O (2001) ldquoApplication of NIR spectroscopy to agricultural productsrdquo In Burns D A and Ciurczak E W (eds) Handbook of Near-Infrared Analysis 2nd Ed Marcel Dekker Inc New York 419-474
Siesler H W Ozaki Y Kawata S and Heise H M (2002) Near Infrared Spectroscopy Principles Instruments and Applications Wiley VCH Germany
Tsuchikawa S and Siesler H W (2003a) ldquoNear-infrared spectroscopic monitoring of the diffusion process of deuterium-labeled molecules in wood Part II Hardwoodrdquo Appl Spectrosc 57 675-681
Tsuchikawa S and Siesler H W (2003b) ldquoNear-infrared spectroscopic monitoring of the diffusion process of deuterium-labeled molecules in wood Part I Softwoodrdquo Appl Spectrosc 57 667-674
Tsuchikawa S Yonenobu H and Siesler H W (2005) ldquoNear-infrared spectroscopic observation of the ageing process in archaeological wood using a deuterium exchange methodrdquo Analyst 130 379-384
Watanabe A Morita S and Ozaki Y (2006) ldquoTemperature-dependent structural changes in hydrogen bonds in microcrystalline cellulose studied by infrared and near-infrared spectroscopy with perturbation-correlation moving-window two-dimensional correlation analysisrdquo Appl Spectrosc 60(6) 611-618
Wilkie A C Smith P H and Bordeaux F M (2004) ldquoAn economical bioreactor for evaluating biogas potential of particulate biomassrdquo Biores Technol 92 103-109
Yu C H (2003) ldquoResampling methods Concepts applications and justificationrdquo Practical Assessment Research amp Evaluation 8(19) Retrieved July 31 2010 from httpPAREonlinenetgetvnaspv=8ampn=19
Article submitted June 22 2010 Peer review completed July 18 2010 Revised version received and accepted August 5 2010 Published August 6 2010

![PEER-REVIEWED ARTICLE Lignocelluloselignocellulose.sbu.ac.ir/Issue 03/[Ligno58]_ Chauhan and... · 2015-10-17 · PEER-REVIEWED ARTICLE Lignocellulose Chauhan and Bhardwaj (2012)](https://img.pdfslide.net/doc/110x75/5f0b23007e708231d42f07b5/peer-reviewed-article-lignocel-03ligno58-chauhan-and-2015-10-17-peer-reviewed.jpg)