Embed Size (px)
Citation preview
PEER-REVIEWED ARTICLE bioresources.com
Rathke et al. (2013). “Mechanical variation in HDF,” BioResources 8(3), 3982-3993. 3982
Analyzing Process Related, In-Plane Mechanical Variation of High Density Fiber Boards (HDF) Across the Feed Direction
Jörn Rathke,a* Martin Riegler,
a Martin Weigl,
a Ulrich Müller,
a and Gerhard Sinn
b
Mechanical properties of the core layer (in-plane) of high density fiberboards (HDF) were analyzed across the width of the board (i.e. across the feed direction). The tests were performed by means of a newly developed double cantilever I beam (DCIB) testing system, with analysis of internal bond strength and bending strength. The specimens were selected from a large-scale experiment in a central European HDF plant, including a completely different machine setting for each sample set. Homogeneous density and property distributions across the feed direction of the boards were generally assumed. During this trial the question arose as to whether processing leads to unequal mechanical properties across the feed direction. In total, 20 sample sets were tested longitudinally and laterally to the feed direction at eight measurement points, revealing 320 test specimens per testing procedure. In contrast to standard testing procedures, the specific fracture energy and the stress intensity factor revealed significant differences between the centre and the edge across the feed direction. This study revealed variations of mechanical properties across the width of the board using the DCIB approach.
Keywords: Bending strength; High density fiber board; Internal bond strength; Specific fracture energy;
Stress intensity factor; Mechanic variation
Contact information: a: Wood K plus – Competence Centre for Wood Composites and Wood Chemistry
Altenberger Straße 69, 4040 Linz, Austria; b: Department of Material Sciences and Process Engineering,
Institute of Physics and Material Sciences, BOKU – University of Natural Resources and Life Sciences,
Peter Jordan Straße 82, 1190 Vienna, Austria; *Corresponding author: [email protected]
INTRODUCTION
In general, wood is a highly heterogeneous and complex material. This includes
inhomogeneities such as fibers, knots, pores, pith, etc. In addition, processing parameters
highly influence its mechanical properties. To overcome this drawback, wood can be
fragmented into strands, particles, or fibers and reassembled by means of resin, pressure,
and heat to obtain relatively homogeneous wood-based panels with customized
properties. Besides the orientation and size of particles, the entire production process
highly influences the board properties. In recent decades, the continuous hot pressing
process has become the most widely used technology in the production of wood-based
panels (Pereira et al. 2006). Pressing parameters (i.e., temperature, time, press factor,
pressure) impact the hardening behavior of resin, the plastification of the wood structure
(Bouajila et al. 2005), and the density profile of the board (Dunky and Niemz 2002). In
medium density or high density fiberboard (MDF/HDF) production processes, coupled
physical, mechanical, and chemical phenomena influence the entire process and the final
product. Numerous investigations have been performed to describe the correlation
PEER-REVIEWED ARTICLE bioresources.com
Rathke et al. (2013). “Mechanical variation in HDF,” BioResources 8(3), 3982-3993. 3983
between mechanical properties of fiberboards and resin content (Maxwell et al. 1984;
Waters 1990; Roffael et al. 2003; Roffael et al. 2005), mat forming (Wang et al. 2001),
pressing (Park et al. 1999; Carvalho et al. 2001; Cao et al. 2007), heat transfer (Park et
al. 1999; Cao et al. 2007), and resin curing (Heinemann 2004; Walther 2006). To analyze
board properties, the selection and preparation of specimens have to follow a precise
procedure, regulated in EN 326-2. In particular, specimens have to be oriented
longitudinally and laterally to the production direction to take production-based strength
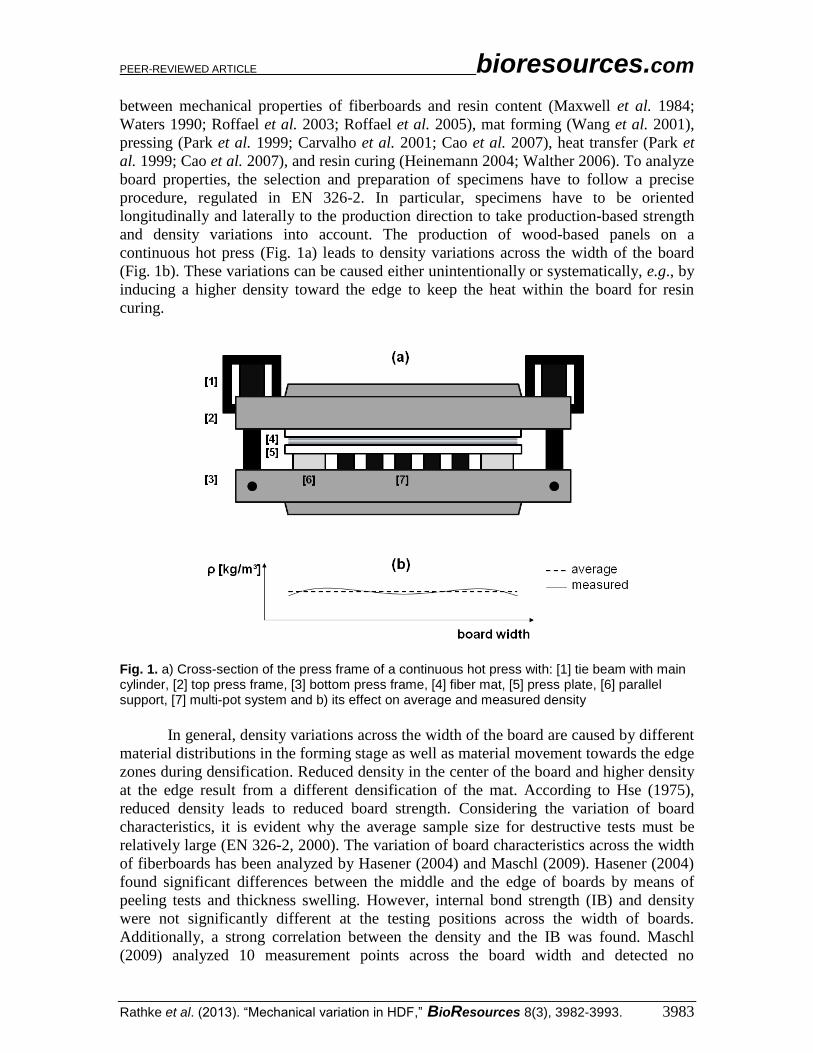
and density variations into account. The production of wood-based panels on a
continuous hot press (Fig. 1a) leads to density variations across the width of the board
(Fig. 1b). These variations can be caused either unintentionally or systematically, e.g., by
inducing a higher density toward the edge to keep the heat within the board for resin
curing.
Fig. 1. a) Cross-section of the press frame of a continuous hot press with: [1] tie beam with main cylinder, [2] top press frame, [3] bottom press frame, [4] fiber mat, [5] press plate, [6] parallel support, [7] multi-pot system and b) its effect on average and measured density
In general, density variations across the width of the board are caused by different
material distributions in the forming stage as well as material movement towards the edge
zones during densification. Reduced density in the center of the board and higher density
at the edge result from a different densification of the mat. According to Hse (1975),
reduced density leads to reduced board strength. Considering the variation of board
characteristics, it is evident why the average sample size for destructive tests must be
relatively large (EN 326-2, 2000). The variation of board characteristics across the width
of fiberboards has been analyzed by Hasener (2004) and Maschl (2009). Hasener (2004)
found significant differences between the middle and the edge of boards by means of
peeling tests and thickness swelling. However, internal bond strength (IB) and density
were not significantly different at the testing positions across the width of boards.
Additionally, a strong correlation between the density and the IB was found. Maschl
(2009) analyzed 10 measurement points across the board width and detected no
PEER-REVIEWED ARTICLE bioresources.com
Rathke et al. (2013). “Mechanical variation in HDF,” BioResources 8(3), 3982-3993. 3984
significant differences for thickness swelling, whereas the IB, the modulus of rupture
(MOR), and the modulus of elasticity (MOE) revealed significant differences between the
metering points across the board width.
The mechanical properties (e.g. bending strength) of wood-based panels in the
out-of-plane direction have been widely investigated using standard testing methods.
Fracture tests for the analysis of wood-based panels in out-of-plane orientation have been
performed by Ehart et al. (1996), Niemz and Diener (1999), Sinn et al. (2008), and
Matsumoto and Nairn (2009).
As the quality control for the resin curing of wood-based panels must be
performed in the core layer, the quality assurance tool has to ensure an in-plane
measurement. Differences in the in-plane board direction (i.e. longitudinal and lateral to
the feed direction) by means of fracture testing were analyzed by Matsumoto and Nairn
(2009) and Rathke et al. (2012b). Matsumoto and Nairn (2009) did not find any
differences in the in-plane orientation of MDF using extended compact tension speci-
mens. When investigating oriented strand boards and particleboards that contain recycled
wood chips, however, differences in the in-plane specimen orientation could be found by
using the double cantilever I-beam (DCIB) approach (Rathke et al. 2012a). Nevertheless,
no systematic trend was found as to whether longitudinal or lateral specimen orientation
shows better performance, which makes measurements in both directions necessary.
For the analysis of wood-based panels, the elongated specimen geometry of the
DCIB approach is well suited, as specimens are aligned either parallel or orthogonally to
the production orientation. Moreover, fracture energy testing yields a higher number of
parameters (e.g., initial slope, fracture toughness, and specific fracture energy) than
standard testing procedures. Therefore, this work investigates whether the DCIB
approach can characterize mechanical differences across the board width more precisely
than standard testing procedures.
MATERIALS AND METHODS Specimen Preparation
In a central European HDF plant, a trial was performed to analyze interactions
between raw material, resin, pressing temperature, various other process parameters, and
the quality of HDF boards. HDF boards had a final thickness of 7.95 mm and were
produced with a resin content of 15% (solid urea formaldehyde resin (UF) to oven dry
fibers) and a paraffin content of 1.4 % (solid paraffin to oven dry fibers). In total, 23
boards were produced using individual process configurations. Samples were cut into
specimen sets (i.e., DCIB samples, IB samples, and bending strength/stiffness (BS)
samples). Eight specimen sets, uniformly distributed over the board width, were cut from
each board (Fig. 2). The measurements included both in-plane orientations of the wood
based panels in production orientation (longitudinal) and across the production direction
(lateral).
The specimens were stored in standard climate (i.e., 20 °C and 65 % relative
humidity (RH)) for two weeks, until equilibrium moisture content was achieved. Before
further processing, the density of each specimen was determined by means of
dimensional and gravimetric measurements (EN 323, 1993c). The calculation of the
density ρ (in kg/m³) was performed according to Equation 1
PEER-REVIEWED ARTICLE bioresources.com
Rathke et al. (2013). “Mechanical variation in HDF,” BioResources 8(3), 3982-3993. 3985
(1)
where m reflects the measured specimen weight (in gram), b1 and b2 describe length and
width (in mm), respectively, while t stands for the specimen thickness (in mm).
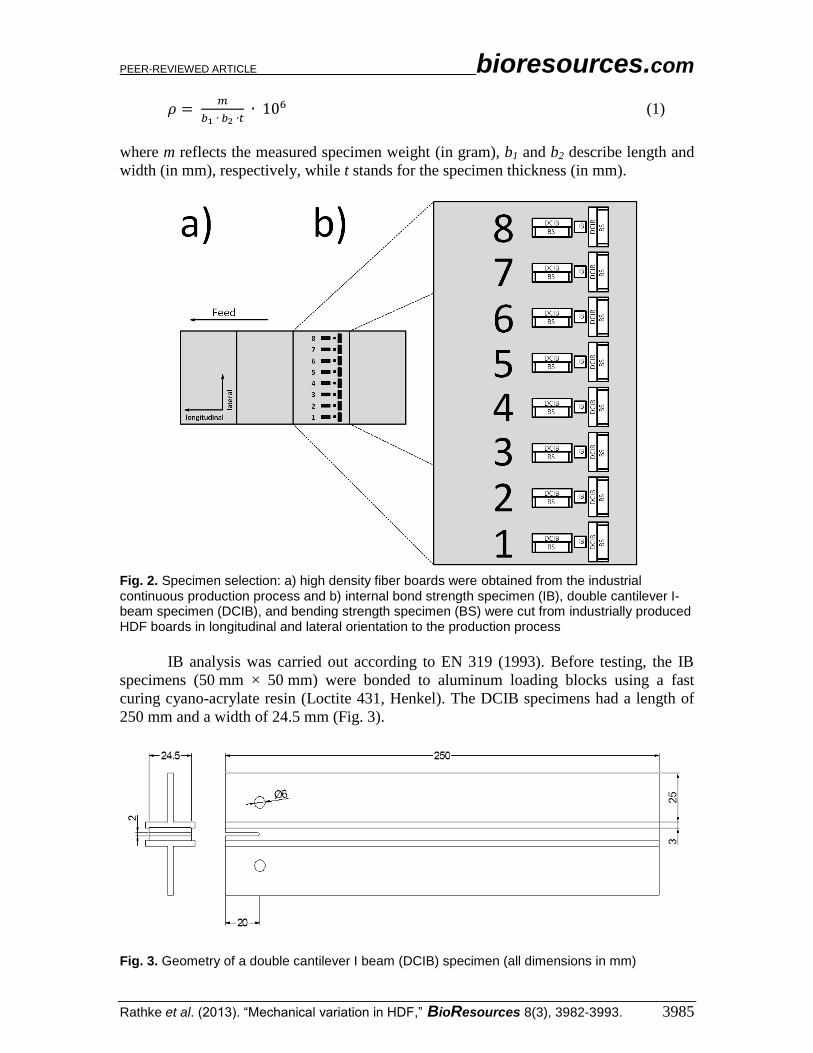
Fig. 2. Specimen selection: a) high density fiber boards were obtained from the industrial continuous production process and b) internal bond strength specimen (IB), double cantilever I-beam specimen (DCIB), and bending strength specimen (BS) were cut from industrially produced HDF boards in longitudinal and lateral orientation to the production process
IB analysis was carried out according to EN 319 (1993). Before testing, the IB
specimens (50 mm × 50 mm) were bonded to aluminum loading blocks using a fast
curing cyano-acrylate resin (Loctite 431, Henkel). The DCIB specimens had a length of
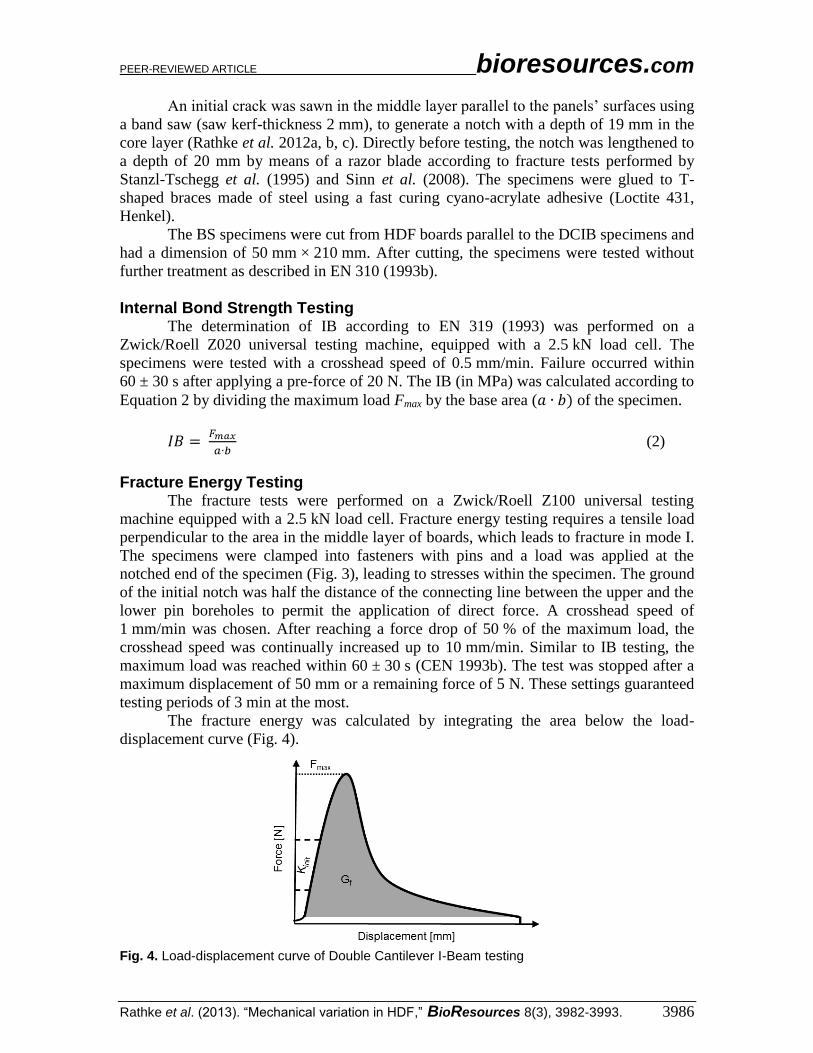
250 mm and a width of 24.5 mm (Fig. 3).
Fig. 3. Geometry of a double cantilever I beam (DCIB) specimen (all dimensions in mm)
PEER-REVIEWED ARTICLE bioresources.com
Rathke et al. (2013). “Mechanical variation in HDF,” BioResources 8(3), 3982-3993. 3986
An initial crack was sawn in the middle layer parallel to the panels’ surfaces using
a band saw (saw kerf-thickness 2 mm), to generate a notch with a depth of 19 mm in the
core layer (Rathke et al. 2012a, b, c). Directly before testing, the notch was lengthened to
a depth of 20 mm by means of a razor blade according to fracture tests performed by
Stanzl-Tschegg et al. (1995) and Sinn et al. (2008). The specimens were glued to T-
shaped braces made of steel using a fast curing cyano-acrylate adhesive (Loctite 431,
Henkel).
The BS specimens were cut from HDF boards parallel to the DCIB specimens and
had a dimension of 50 mm × 210 mm. After cutting, the specimens were tested without
further treatment as described in EN 310 (1993b).
Internal Bond Strength Testing The determination of IB according to EN 319 (1993) was performed on a
Zwick/Roell Z020 universal testing machine, equipped with a 2.5 kN load cell. The
specimens were tested with a crosshead speed of 0.5 mm/min. Failure occurred within
60 ± 30 s after applying a pre-force of 20 N. The IB (in MPa) was calculated according to
Equation 2 by dividing the maximum load Fmax by the base area ( of the specimen.
(2)
Fracture Energy Testing The fracture tests were performed on a Zwick/Roell Z100 universal testing
machine equipped with a 2.5 kN load cell. Fracture energy testing requires a tensile load
perpendicular to the area in the middle layer of boards, which leads to fracture in mode I.
The specimens were clamped into fasteners with pins and a load was applied at the
notched end of the specimen (Fig. 3), leading to stresses within the specimen. The ground
of the initial notch was half the distance of the connecting line between the upper and the
lower pin boreholes to permit the application of direct force. A crosshead speed of
1 mm/min was chosen. After reaching a force drop of 50 % of the maximum load, the
crosshead speed was continually increased up to 10 mm/min. Similar to IB testing, the
maximum load was reached within 60 ± 30 s (CEN 1993b). The test was stopped after a
maximum displacement of 50 mm or a remaining force of 5 N. These settings guaranteed
testing periods of 3 min at the most.
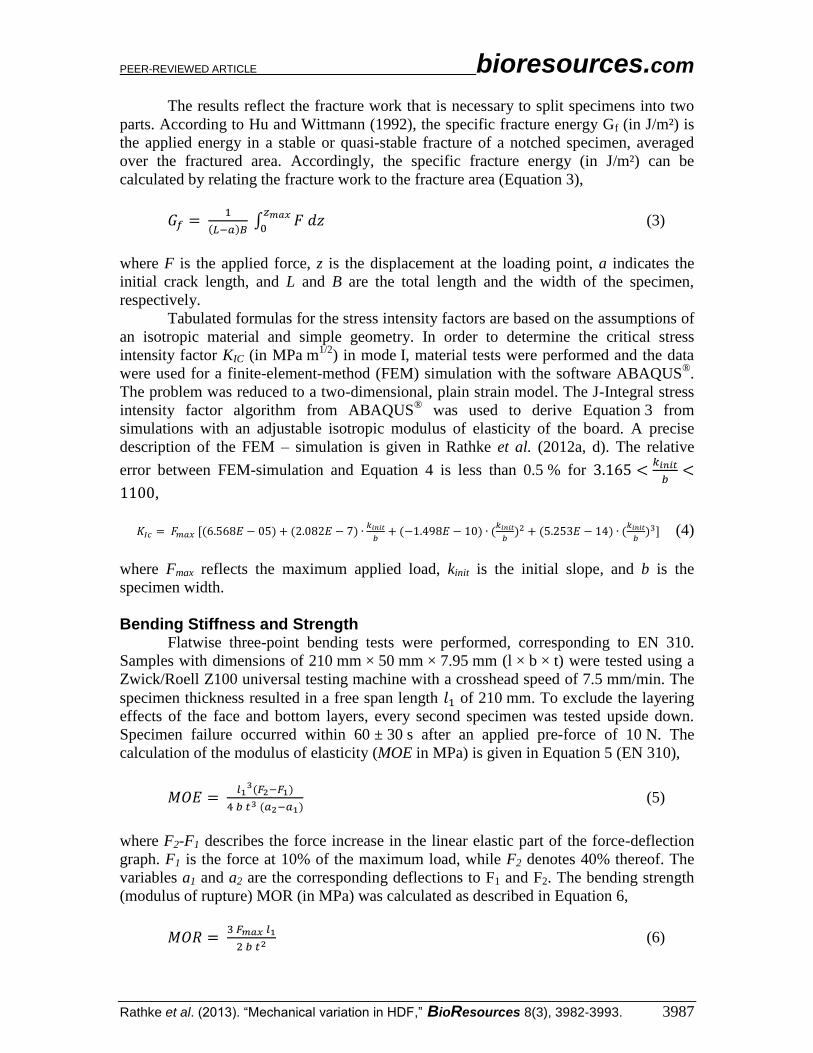
The fracture energy was calculated by integrating the area below the load-
displacement curve (Fig. 4).
Fig. 4. Load-displacement curve of Double Cantilever I-Beam testing
PEER-REVIEWED ARTICLE bioresources.com
Rathke et al. (2013). “Mechanical variation in HDF,” BioResources 8(3), 3982-3993. 3987
The results reflect the fracture work that is necessary to split specimens into two
parts. According to Hu and Wittmann (1992), the specific fracture energy Gf (in J/m²) is
the applied energy in a stable or quasi-stable fracture of a notched specimen, averaged
over the fractured area. Accordingly, the specific fracture energy (in J/m²) can be
calculated by relating the fracture work to the fracture area (Equation 3),
( ∫
(3)
where F is the applied force, z is the displacement at the loading point, a indicates the
initial crack length, and L and B are the total length and the width of the specimen,
respectively.
Tabulated formulas for the stress intensity factors are based on the assumptions of
an isotropic material and simple geometry. In order to determine the critical stress
intensity factor KIC (in MPa m1/2
) in mode I, material tests were performed and the data
were used for a finite-element-method (FEM) simulation with the software ABAQUS®.
The problem was reduced to a two-dimensional, plain strain model. The J-Integral stress
intensity factor algorithm from ABAQUS® was used to derive Equation 3 from
simulations with an adjustable isotropic modulus of elasticity of the board. A precise
description of the FEM – simulation is given in Rathke et al. (2012a, d). The relative
error between FEM-simulation and Equation 4 is less than 0.5 % for
,
( (
( (
( (
(4)
where Fmax reflects the maximum applied load, kinit is the initial slope, and b is the
specimen width.
Bending Stiffness and Strength
Flatwise three-point bending tests were performed, corresponding to EN 310.
Samples with dimensions of 210 mm × 50 mm × 7.95 mm (l × b × t) were tested using a
Zwick/Roell Z100 universal testing machine with a crosshead speed of 7.5 mm/min. The
specimen thickness resulted in a free span length of 210 mm. To exclude the layering
effects of the face and bottom layers, every second specimen was tested upside down.
Specimen failure occurred within 60 ± 30 s after an applied pre-force of 10 N. The
calculation of the modulus of elasticity (MOE in MPa) is given in Equation 5 (EN 310),
(
( (5)
where F2-F1 describes the force increase in the linear elastic part of the force-deflection
graph. F1 is the force at 10% of the maximum load, while F2 denotes 40% thereof. The
variables a1 and a2 are the corresponding deflections to F1 and F2. The bending strength
(modulus of rupture) MOR (in MPa) was calculated as described in Equation 6,
(6)
PEER-REVIEWED ARTICLE bioresources.com
Rathke et al. (2013). “Mechanical variation in HDF,” BioResources 8(3), 3982-3993. 3988
where Fmax stands for the maximum load. The variables l1, b, and t stand for the same
numbers as described in the calculation of the MOE in Equation 5.
RESULTS AND DISCUSSION
The results of the density determination and the IB testing are presented in Fig. 5.
Figure 6 shows the results of mechanical testing at eight positions across the width of the
board, both longitudinally and laterally to the production direction. For statistical
analysis, a one-way analysis of variance (ANOVA, p < 0.05) was performed, followed by
a subsequent multiple t-test with Bonferroni procedure, using SPSS®.
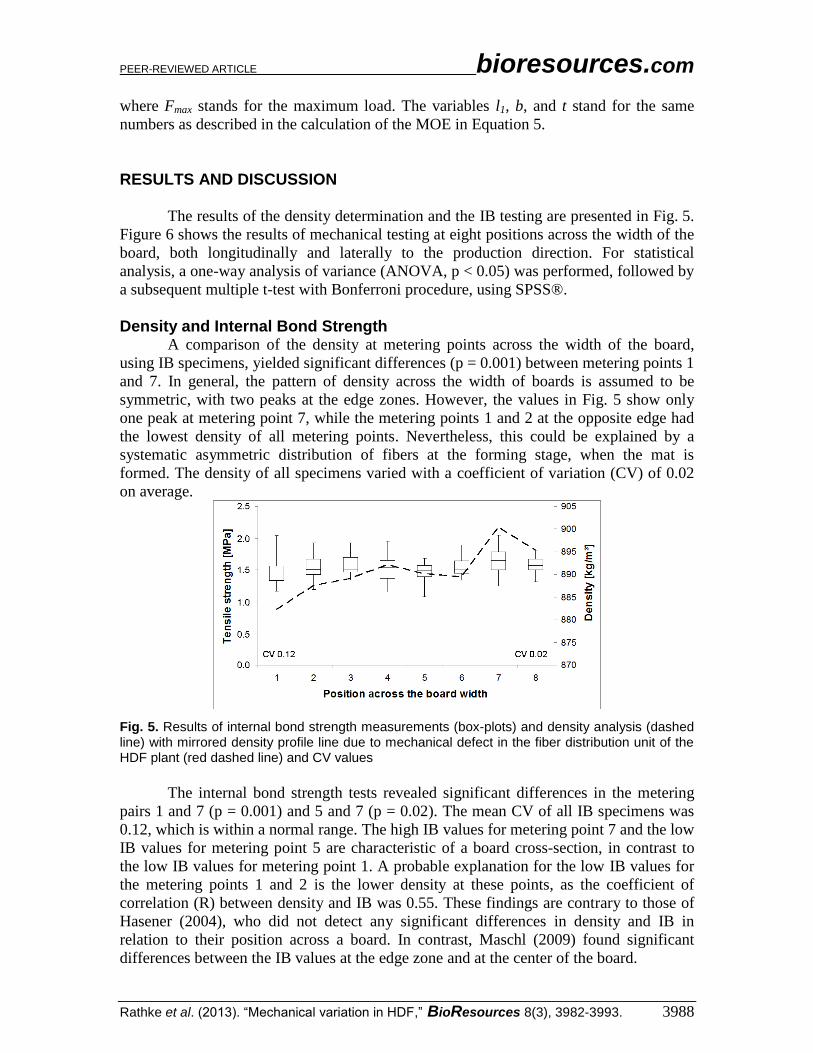
Density and Internal Bond Strength A comparison of the density at metering points across the width of the board,
using IB specimens, yielded significant differences (p = 0.001) between metering points 1
and 7. In general, the pattern of density across the width of boards is assumed to be
symmetric, with two peaks at the edge zones. However, the values in Fig. 5 show only
one peak at metering point 7, while the metering points 1 and 2 at the opposite edge had
the lowest density of all metering points. Nevertheless, this could be explained by a
systematic asymmetric distribution of fibers at the forming stage, when the mat is
formed. The density of all specimens varied with a coefficient of variation (CV) of 0.02
on average.
Fig. 5. Results of internal bond strength measurements (box-plots) and density analysis (dashed line) with mirrored density profile line due to mechanical defect in the fiber distribution unit of the HDF plant (red dashed line) and CV values
The internal bond strength tests revealed significant differences in the metering
pairs 1 and 7 (p = 0.001) and 5 and 7 (p = 0.02). The mean CV of all IB specimens was
0.12, which is within a normal range. The high IB values for metering point 7 and the low
IB values for metering point 5 are characteristic of a board cross-section, in contrast to
the low IB values for metering point 1. A probable explanation for the low IB values for
the metering points 1 and 2 is the lower density at these points, as the coefficient of
correlation (R) between density and IB was 0.55. These findings are contrary to those of
Hasener (2004), who did not detect any significant differences in density and IB in
relation to their position across a board. In contrast, Maschl (2009) found significant
differences between the IB values at the edge zone and at the center of the board.
PEER-REVIEWED ARTICLE bioresources.com
Rathke et al. (2013). “Mechanical variation in HDF,” BioResources 8(3), 3982-3993. 3989
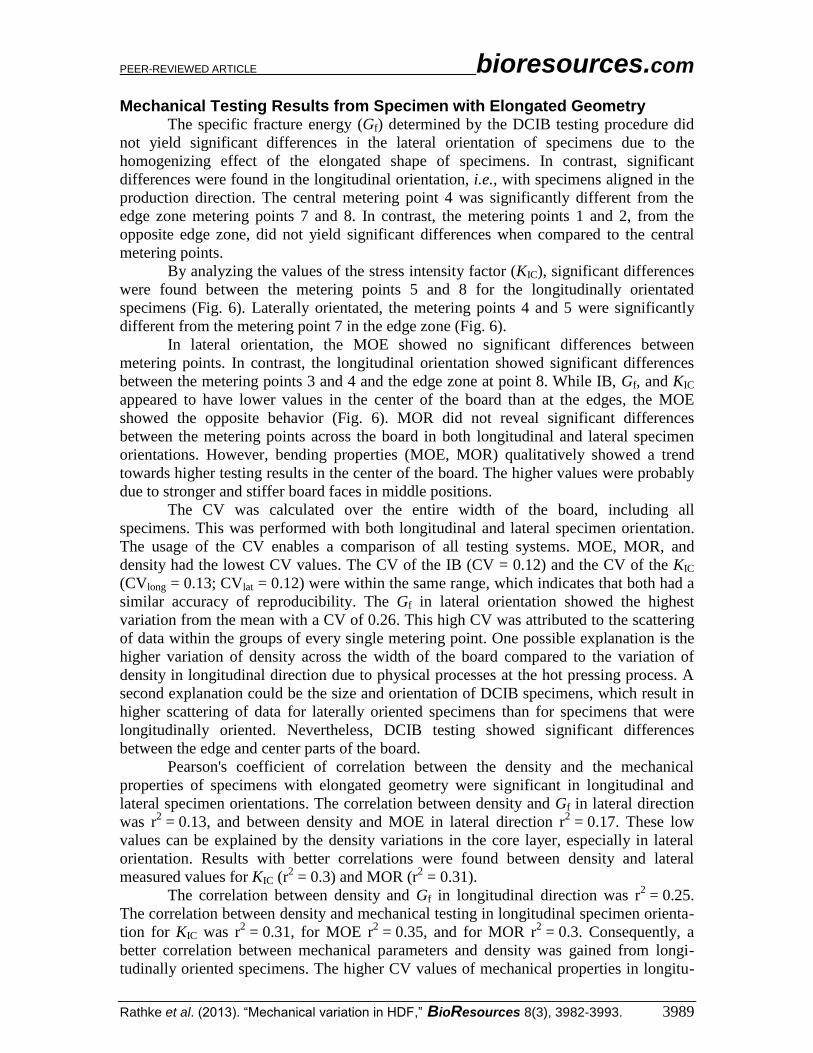
Mechanical Testing Results from Specimen with Elongated Geometry The specific fracture energy (Gf) determined by the DCIB testing procedure did
not yield significant differences in the lateral orientation of specimens due to the
homogenizing effect of the elongated shape of specimens. In contrast, significant
differences were found in the longitudinal orientation, i.e., with specimens aligned in the
production direction. The central metering point 4 was significantly different from the
edge zone metering points 7 and 8. In contrast, the metering points 1 and 2, from the
opposite edge zone, did not yield significant differences when compared to the central
metering points.
By analyzing the values of the stress intensity factor (KIC), significant differences
were found between the metering points 5 and 8 for the longitudinally orientated
specimens (Fig. 6). Laterally orientated, the metering points 4 and 5 were significantly
different from the metering point 7 in the edge zone (Fig. 6).
In lateral orientation, the MOE showed no significant differences between
metering points. In contrast, the longitudinal orientation showed significant differences
between the metering points 3 and 4 and the edge zone at point 8. While IB, Gf, and KIC
appeared to have lower values in the center of the board than at the edges, the MOE
showed the opposite behavior (Fig. 6). MOR did not reveal significant differences
between the metering points across the board in both longitudinal and lateral specimen
orientations. However, bending properties (MOE, MOR) qualitatively showed a trend
towards higher testing results in the center of the board. The higher values were probably
due to stronger and stiffer board faces in middle positions.
The CV was calculated over the entire width of the board, including all
specimens. This was performed with both longitudinal and lateral specimen orientation.
The usage of the CV enables a comparison of all testing systems. MOE, MOR, and
density had the lowest CV values. The CV of the IB (CV = 0.12) and the CV of the KIC
(CVlong = 0.13; CVlat = 0.12) were within the same range, which indicates that both had a
similar accuracy of reproducibility. The Gf in lateral orientation showed the highest
variation from the mean with a CV of 0.26. This high CV was attributed to the scattering
of data within the groups of every single metering point. One possible explanation is the
higher variation of density across the width of the board compared to the variation of
density in longitudinal direction due to physical processes at the hot pressing process. A
second explanation could be the size and orientation of DCIB specimens, which result in
higher scattering of data for laterally oriented specimens than for specimens that were
longitudinally oriented. Nevertheless, DCIB testing showed significant differences
between the edge and center parts of the board.
Pearson's coefficient of correlation between the density and the mechanical
properties of specimens with elongated geometry were significant in longitudinal and
lateral specimen orientations. The correlation between density and Gf in lateral direction
was r2 = 0.13, and between density and MOE in lateral direction r
2 = 0.17. These low
values can be explained by the density variations in the core layer, especially in lateral
orientation. Results with better correlations were found between density and lateral
measured values for KIC (r2 = 0.3) and MOR (r
2 = 0.31).
The correlation between density and Gf in longitudinal direction was r2 = 0.25.
The correlation between density and mechanical testing in longitudinal specimen orienta-
tion for KIC was r2 = 0.31, for MOE r
2 = 0.35, and for MOR r
2 = 0.3. Consequently, a
better correlation between mechanical parameters and density was gained from longi-
tudinally oriented specimens. The higher CV values of mechanical properties in longitu-
PEER-REVIEWED ARTICLE bioresources.com
Rathke et al. (2013). “Mechanical variation in HDF,” BioResources 8(3), 3982-3993. 3990
dinal specimen orientation (with the exception of Gf) indicate a higher explanatory power
in this orientation and should therefore be preferred.
Fig. 6. Results of specific fracture energy (Gf), stress intensity factor (KIC), modulus of rupture (MOR), and modulus of elasticity (MOE) for high density fiberboards across the width of the board with specimen orientation in production direction (longitudinal) on the left side and orthogonal to the production direction (lateral) on the right side
CONCLUSIONS
1. The in-plane layering effects (i.e. longitudinal and lateral) on the mechanical
properties across the width of HDF had no effect on the modulus of rupture, which
was uniform across the width of the board.
2. The internal bond strength and the modulus of elasticity, as well as the Gf and KIC
obtained from the newly developed double cantilever I-beam approach, revealed
PEER-REVIEWED ARTICLE bioresources.com
Rathke et al. (2013). “Mechanical variation in HDF,” BioResources 8(3), 3982-3993. 3991
significant differences between one of the edges and center parts of boards
(asymmetric behavior). Thus, the DCIB approach is appropriate for detecting differ-
ences across the width of HDF.
3. A comparison of the data in longitudinal and lateral orientation showed that a higher
explanatory power was achieved in production direction than orthogonal to it,
especially with the elongated DCIB specimen geometry.
4. With regard to quality assurance, it is assumed that if the variations across the width
of the board were taken into account, the number of samples needed per process
control step could be reduced.
REFERENCES CITED
Bouajila, J., Limare, A., Joly, C., and Dole, P. (2005). “Lignin plastification to improve
binderless fiberboard mechanical properties,” Polymer Engineering and Science
45(6), 809-816.
Cao, J., Zhang, X., and Liu, Y. (2007). “Fuzzy control of medium density fiberboard hot-
pressing,” Proceedings of the 2nd
IEEE Conference on Industrial Electronics and
Applications, ICIEA, Harbin, China, 2045-2048.
Carvalho, L. M. H., Costa, M. R. N., and Costa, C. A. V. (2001). “Modeling rheology in
the hot-pressing of MDF: Comparison of mechanical models,” Wood and Fiber
Science 33(3), 395-411.
CEN (1993a). “EN 310: Wood-based-panels – Determination of modulus of elasticity in
bending and of bending strength,” Österreichisches Normungsinstitut, Vienna,
Austria.
CEN (1993b). “EN 319: Particleboards and fiberboards – Determination of tensile
strength perpendicular to the plane of the board,” Österreichisches Normungsinstitut,
Vienna, Austria.
CEN (1993c). “EN 323: Wood-based-panels – Determination of density,”
Österreichisches Normungsinstitut, Vienna, Austria
CEN (2000). “EN 326-2: Wood-based-panels – Sampling, cutting and inspection,”
Österreichisches Normungsinstitut, Vienna, Austria.
Dunky, M., and Niemz, P. (2002). Holzwerkstoffe und Leime, Springer, Berlin,
Heidelberg, New York, 856.
Ehart, R. J. A., Stanzl-Tschegg, S. E., and Tschegg, E. K. (1996). “Characterization of
crack propagation in particleboard,” Wood Science and Technology 30(5), 307-321.
Hasener, J. (2004). “Statistische Methoden der industriellen Prozessmodellierung zur
Echtzeitqualitätskontrolle am Beispiel einer kontinuierlichen Produktion von
Faserplatten,” PhD Thesis, University Hamburg, Hamburg, Germany.
Heinemann, C. (2004). “Charakterisierung der Aushärtung von Aminoharzen in einer
Holzpartikelmatrix durch Evaluierung von Festigkeiten und Reaktionskinetik,” PhD
Thesis, University Hamburg, Department of Biology, Hamburg, Germany.
Hse, C.-Y. (1975). “Properties of flakeboards from hardwoods growing on southern pine
sites,” Forest Products Journal 25(3), 48-53.
Hu, X.-Z., and Wittmann, F. H. (1992). “Fracture energy and fracture process zone,”
Materials and Structures 25(6), 319-326.
PEER-REVIEWED ARTICLE bioresources.com
Rathke et al. (2013). “Mechanical variation in HDF,” BioResources 8(3), 3982-3993. 3992
Maschl, G. (2009). “Improvement of fiberboard manufacture through statistical process
analytics,” Master’s Thesis, University of Natural Resources and Life Sciences
Vienna, Department of Material Sciences and Process Engineering, Vienna, Austria.
Matsumoto, N., and Nairn, J. (2009). “The fracture toughness of medium density
fiberboard (MDF) including the effects of fiber bridging and crack-plane
interference,” Engineering Fracture Mechanics 76(18), 2748-2757.
Maxwell, J. W., Gran, G., and Waters, G. D. (1984). “Experiments with blowline
blending for MDF,” Proceedings of the Eighteenth Washington State University
International Particleboard/Composite Materials Series Symposium, Washington
State Univ., Pullman, Washington, USA, 117-143.
Niemz, P., and Diener, M. (1999). “Vergleichende Untersuchung zur Ermittlung der
Bruchzähigkeit an Holzwerkstoffen,” Holz als Roh-und Werkstoff 57(3), 222-224.
Park, B.-D., Riedl, B., Hsu, E. W., and Shields, J. (1999). “Hot-pressing process
optimization by response surface methodology,” Forest Products Journal 49(5), 62-
68.
Pereira, C., Carvalho, L. M. H., and Costa, C. A. V. (2006). “Modeling the continuous
hot-pressing MDF,” Wood Science and Technology 40(4), 308-326.
Rathke, J., Sinn, G., Weigl, M., and Müller, U. (2012a). “Analysing in-plane orthotropy
of wood based panels by means of fracture mechanics,” European Journal of Wood
and Wood Products 70(6), 851-856.
Rathke, J., Sinn, G., Harm, M., Teischinger, A., Weigl, M., Müller, U. (2012b). “Fracture
energy vs. internal bond strength—Mechanical characterization of wood-based
panels,” Wood Material Science and Engineering 7, 1-10.
Rathke, J., Sinn, G., Harm, M., Teischinger, A., Weigl, M., Müller, U. (2012c). “Effects
of raw material, particle geometry and resin content on mechanical properties of
particle board,” BioResources 7, 2970-2985.
Rathke, J., Sinn, G., Konnerth, J., Müller, U. (2012d). “Strain measurements within fibre
boards. Part III: Analysing the process zone at the crack tip of MDF Double
Cantilever I-Beam specimens,” Materials 5, 2190-2204
Roffael, E., Dix, B., Schneider, T., and Kraft, R. (2003). “Extractable urea in MDF
prepared using the blowline- and blender-technique,” Holz als Roh- und Werkstoff
61(1), 73-74.
Roffael, E., Schneider, T., and Dix, B. (2005). “On paraffin sizing of medium density
fiberboards (MDF) Part 2: Influence of resination process (blender and blowline
technique) and method of adding paraffin dispersion within the blender- and
blowline-process on paraffin sizing of medium density fibreboards (MDF),” Holz als
Roh- und Werkstoff 63(4), 272-277.
Sinn, G., Beer, P., Gindl, M., and Stanzl-Tschegg, S. (2008). “Wedge splitting
experiments on three-layered particleboard and consequences for cutting,” Holz als
Roh- und Werkstoff 66, 135-141.
Stanzl-Tschegg, S. E., Tan, D. M., and Tschegg, E. K. (1995). “New splitting method for
wood fracture characterization,” Wood Science and Technology 29, 31-50.
Walther, T. (2006). “Methoden zur qualitativen und quantitativen Analyse der
Mikrostruktur von Naturfaserwerkstoffen,” PhD Thesis, University Hamburg,
Department of Biology, Hamburg, Germany.
Wang, S., Winistorfer, P. M., Young, T. M., and Helton, C. (2001). “Step-closing
pressing of medium density fiberboard: Part 2. Influences on panel performance and
layer characteristics,” Holz als Roh- und Werkstoff 59(5), 311-318.
PEER-REVIEWED ARTICLE bioresources.com
Rathke et al. (2013). “Mechanical variation in HDF,” BioResources 8(3), 3982-3993. 3993
Waters, G. D. (1990). “Medium density fibreboard blowline blending theories in and
around the Black Box,” Proceedings of the NPA Resin and Blending Seminar, Irving
Texas, USA.
Article submitted: January 20, 2013; Peer review completed: April 25, 2013; Revised
version accepted: June 3, 2013; Published: June 5, 2013.