Embed Size (px)
Citation preview
PEER-REVIEWED ARTICLE bioresources.com
Feng et al. (2012). “Pyrolysis of UF wood panels,” BioResources 7(4), 4600-4613. 4600
THE INFLUENCE OF UREA FORMALDEHYDE RESINS ON PYROLYSIS CHARACTERISTICS AND PRODUCTS OF WOOD-BASED PANELS
Yongshun Feng, Jun Mu,* Shihua Chen, Zhiyi Huang, and Zhiming Yu
In China each year, large amounts of wood-based panels are consumed and abandoned. These are huge resources for energy recovery and materials reuse. In order to study the influence of urea formaldehyde resin (UF) resin on waste wood-based panels during pyrolysis, thermobalance experiments together with the evolution of main gaseous products of wood, wood-based panels, and UF resins were carried out and analyzed by TG-FTIR. Elementary and GC-MS analyses were also done to study the characteristics of solid and liquid products. Results from TG and DTG analyses indicated that UF resin used in wood-based panels accelerated the degradation rate of wood-based panels at lower temperature; however the resin inhibited the degradation of wood-based panels over the later stage at higher temperatures. Compared with solid wood, the higher intensity and earlier releasing time of HNCO and NH3 in wood board revealed that the release of nitric gases is mainly due to the presence of UF resin, especially between 180
oC and 320
oC. Mass loss
of hydrogen is significantly inhibited by UF resin, and nitrogen is quite stable in the char. The influence of UF resin on pyrolysis liquids of wood-based panels is mainly on nitrogen compounds and ketones rather than aldehydes and esters, which is probably due to the chemical reactions of UF resin with lignin constituent in wood.
Keywords: GC-MS; Pyrolysis; TG-FTIR; Urea formaldehyde resin; Wood-based panel
Contact information: College of Materials Science and Technology, Beijing Forestry University, Qinghua
Eastroad 35, Beijing, 100083, P. R. China; * Corresponding author: [email protected]
INTRODUCTION
Considering energy and resources, major conventional fossil energy resources are
non-renewable and face the problem of gradually becoming extinct (Goyal et al. 2008).
Biomass as a renewable resource has been explored as the substitute for conventional
energy and chemical resources. The collection and logistics of biomass sometimes make
its cost unacceptable, especially in China.
Waste wood-based panels are a kind of lignocellulosic bioresource and show
great potential to provide raw materials for the production of renewable fuels and
chemical feedstocks. The developing rate of wood-based panels in China is over 20%
year by year, and the production of wood-based panels first exceeded 100 million m3 in
2009 (Qian 2010). The large consumption makes nearly 10% of wood-based panels and
their relevant products abandoned each year, and these are huge energy resources for
recycle and reuse (He et al. 2008).

PEER-REVIEWED ARTICLE bioresources.com
Feng et al. (2012). “Pyrolysis of UF wood panels,” BioResources 7(4), 4600-4613. 4601
Nowadays, the main energy reuse of waste wood-based panels is through
incineration (Girods et al. 2009a). This is an effective way to convert waste wood-based
panels into energy. However, because waste wood-based panels contain formaldehyde-
based adhesives, the release of hazardous nitric gases in the course of combustion is
unavoidable and can do great harm to the environment.
Thermochemical conversion, including gasification and pyrolysis, has proven to
be a highly efficient process to utilize bioresources, including waste wood-based panels.
The products of pyrolysis or gasification can be classified into gases, char, and bio-oil,
which are distributed, flexible, and may be developed stage-wise (Windt and Meier
2010). Gases can be used as syngas to provide energy. Bio-oil can be upgraded into fuel
or used as value-added chemicals (Liu et al. 2012). Even tar has been shown to have
resistance to fungi (Mazela 2007). Char can be burnt for energy recovery or for the
feedstock of activated carbon.
Pyrolysis of adhesives and waste wood-based panels has already been studied by
some researchers, and many positive results have been obtained (Girods et al. 2008a-c).
Studies on pyrolysis of UF and melamine formaldehyde (MF) resins have suggested that
there are three reactions involved in the pyrolysis: initiation reactions, reactions splitting
off volatile fragments, and reactions forming stabilized structures (Hirata et al. 1991).
Comparison of UF resin during the pyrolysis and combustion process was studied
using TG-FTIR, and conclusions suggested that UF residues should be pyrolyzed at low
temperatures to remove the initial nitrogen. In terms of poisonous nitric gases, the
gaseous products during pyrolysis should be burnt in a high temperature furnace under
oxygen-rich conditions for control of pollutants (Jiang et al. 2010). Because of the
presence of UF resins, the characteristics and products of pyrolysis of wood-based panels
are much different from those of common bioresources, and the influence of resins
should be clarified.
Studies of pyrolysis of wood-based panels show that the degradation temperature
of UF resin is lower than that of wood, indicating selective pyrolysis between UF resin
and wood. Waste wood-based panels could be pre-treated to eliminate hazardous nitric
compounds so that “clean” feedstock could be prepared for the later energy recovery. A
two-step thermochemical process could thus be determined. Staged degasification has
also been studied (Zhang et al. 2007 and 2008; Wild et al. 2009) and results show
positive effects. Activated carbons prepared from particleboard wastes show a stronger
ability in absorbing acid gases and phenolic compounds because of their nitrogen-
containing surface groups (Girods et al. 2009b). Bio-oil prepared from low temperature
pyrolysis of UF-contained wood-based composites and high temperature pyrolysis of PF-
contained wood-based composites show excellent resistance to the fungi (Nakai et al.
2007).
Apart from research studies discussed above, published studies have seldom paid
attention to the influence of UF resin on waste wood-based panels during the pyrolysis
process. The purpose of the present study was to cast some light on the mechanism and
the influence of UF resin on thermal degradation of waste wood-based panels.

PEER-REVIEWED ARTICLE bioresources.com
Feng et al. (2012). “Pyrolysis of UF wood panels,” BioResources 7(4), 4600-4613. 4602
EXPERIMENTAL
TG-FTIR Analysis Samples used in this experiment were provided by Beijing Wood Factory. The
materials of study included particleboard (PB), medium density fiber board (MDF),
wood, and UF resin with the molar ratio F/U 1.08. Samples were crushed into a size
smaller than 0.2 mm and dried in an oven at 103 oC for 3 h before the experiments.
Figure 1 shows the typical UF resin unit and linkages in UF resin.
Fig. 1. Typical linkages in the structure of UF resin
The experiment was carried out with a Netzsch TG209 F1 thermo analyzer
coupled with a Nicolet 6700 FTIR device. The experiment was done at a linear heating
rate of 20 oC min
-1 from the ambient to 800
oC. The carrier gas was nitrogen set at 60 mL
min-1
in order to achieve an inert atmosphere. The tube and FTIR gas cell were
maintained at 200 oC in order to avoid any condensation of volatiles. The weight of
sample was around 5 mg for each experiment.
The spectrum scope of FTIR was in the range of 700 to 4000 cm-1
with the
resolution of 4 cm-1
, and each spectrum corresponded to the average of 20 scans. The
FTIR spectrometer recorded one spectrum during each 10 seconds. The characteristic
frequencies used for the qualitative and quantitative analysis were 2300 to 2400 cm-1
for
carbon dioxide (CO2), 2000 to 2250 cm-1
for carbon monoxide (CO), 800 to 1200 cm-1
for ammonia (NH3), and 2200 to 2300 cm-1
for isocyanic acid (HNCO). Gas analysis was
also done by matching the spectra against those from the spectrum library Nicolet TGA
Vapor Phase of the software Ominic together with the methods reported by literature (Liu
et al. 2008; Girods et al. 2008). According to the Lambert-Beer law (Liu et al. 2008), the
absorbance is linearly dependant on gas concentration. As a result, the tendency of the
product yield of each gas species was expressed and compared in the form of absorbance
at specific wavenumbers.
Pyrolysis Reactor Samples (around 500 g) were pyrolyzed in a laboratory-scale furnace. Heating
temperature was set from ambient to 500 oC in 2 h and maintained for 1 h. Pyrolysis
liquids were collected by using cold water to trap the condensable products. Thermo-
couples were used to detect the internal temperature of samples during the pyrolysis
process, as shown in Fig. 2.

PEER-REVIEWED ARTICLE bioresources.com
Feng et al. (2012). “Pyrolysis of UF wood panels,” BioResources 7(4), 4600-4613. 4603
Fig. 2. Pyrolysis method used in our experiment
Elemental Analysis In order to further explore the influence of UF resin on the pyrolysis of wood-
based panels, particleboards with different content of UF resins were made in our
laboratory, including particleboard with 6% UF resin (6%PB), particleboard with 9% UF
resin (9%PB), particleboard with 12% UF resin (12%PB), and particleboard with 15%
UF resin (15%PB). The particleboard samples were pyrolyzed in the static bed with the
temperature of 500 oC in 2h. Char and pyrolysis liquids were obtained for later analysis.
Samples used in this part included both virgin samples and the char of wood,
6%PB, 9%PB, 12%PB, 15%PB, and UF resin. Elemental analysis was done by
Elementar Vario EL III. Contents of C, H, and N were calculated by the mean value of
two tests. Content of O was obtained by the difference.
GC-MS Analysis Pyrolysis liquids were obtained from pyrolysis of wood, 6%PB, 9%PB, 12%PB,
15%PB, and UF resin by static bed. The components of the pyrolysis liquids were
analyzed by GC-MS (Shimadzu 2010). The RTX-5 column (30 m × 0.32 mm × 0.5μm)
was maintained at 50 oC for 2 min, then the temperature was raised to 250
oC at the
heating rate of 10 oC /min, and held at 250
oC for 5 min. Helium was used as the carrier
gas. The injection was performed at 250 oC in the split mode of (30:1). The mass
spectrometer was operated in the electron ionization (EI) mode with ionization energy of
70eV. The interface temperature was 250 oC. The scan interval was 0.5 s and the scan
range for m/z was 33 to 500.
RESULTS AND DISCUSSION
Pyrolysis Characteristics of Wood-based Panels by Thermobalance Analysis The TG and DTG curves obtained from different materials are displayed in Figs.
3 and 4. Wood, as the main component in the wood-based panels, resulted in the
similarity in TG and DTG curves between wood and wood-based panels, while still some

PEER-REVIEWED ARTICLE bioresources.com
Feng et al. (2012). “Pyrolysis of UF wood panels,” BioResources 7(4), 4600-4613. 4604
differences should not be neglected because of the presence of UF resin. Figures 3 and 4
show that the pyrolysis process could be divided into three main stages: from room
temperature to 200 oC for the first stage, 200 to 400
oC for the second stage, and 400 to
800 oC for the third stage.
Fig. 3. TG curves of different samples Fig. 4. DTG curves of different samples
Little weight loss could be found in the TG curves in the first stage, because
samples were pre-dried before thermal analysis. The second stage is the most significant
degradation stage during the whole process, with the weight loss of nearly 75% of the
total weight for all the samples. The temperature range extended from 200 oC to 400
oC,
where we could distinguish two peaks for UF resin and a small shoulder peak for wood,
PB, and MDF in DTG curves. The DTG curve of UF resin was generally in accordance
with the data of the literature (Jiang et al. 2010). According to Fig. 4, the two peaks of
UF resin were probably attributable to the two crucial reactions during the thermal
degradation. UF resin. Higher temperature enables the possibility of reactions involving
chain rupture in the UF molecule. The shoulder peak of wood and wood-based panels
might correlate to the decomposition of hemicellulose (Lee and Fasina 2009).
DTG curves reveal that the degradation of wood-based panels occurs at 175 oC,
while no significant weight loss was found for wood and UF resin at this temperature.
The degradation rates of PB and MDF gradually became slower than wood until 308 oC
and 361 oC, respectively. TG curves also show that the mass residue of wood-based
panels was less than wood until 380 oC. Conclusions could be made that the pyrolysis of
wood-based panels is not the independent decomposition of wood and UF resins, which
is in accordance with the literature (Peng et al. 2011). UF resin is more likely to
accelerate the chemical reactions of wood-based panels at a lower temperature; however
it inhibited the degradation of solid residue of wood-based panels at a higher temperature
during the global pyrolysis process.
The terminal mass residue for wood was 16.6%, PB was 20.5%, MDF was 19.1%,
and UF was 13.2%. At higher temperatures, the mass loss rate of wood was higher than
that of wood-based panels, resulting in less terminal mass residue of wood. The thermal

PEER-REVIEWED ARTICLE bioresources.com
Feng et al. (2012). “Pyrolysis of UF wood panels,” BioResources 7(4), 4600-4613. 4605
stability of UF resin is weaker than wood, however it enhanced the thermal stability of
wood-based panels, which confirms former conclusions.
FTIR Analysis of Gaseous Products and the Formation Mechanism The gaseous products of different samples during the thermal process were detected on-
line by FTIR. Because of this device, we could first distinguish main gaseous products
from the FTIR spectrum and then observe the evolution patterns of each gas from the
absorbance intensity curve. Figure 5 shows representative FTIR spectra of the four
samples when the total released gas reached its highest intensity value. From the
characteristic peak in the spectrum, main gaseous products and functional groups could
be determined. Characteristic peaks related to main gases of CO, CO2, HNCO, and NH3
could be easily distinguished in all the FTIR spectra. However, an evident absorbance
peak in wood at 1700 to 1800 cm-1
and 2750 to 3000 cm-1
appears in our experiment,
which could not be found in the literature. In comparison with the spectrum library, these
peaks are most likely responsible for the carboxyl and carbonyl absorbances. Such
specific peaks could also be found in PB and MDF, but are not so obvious. Absorbance
peaks in the range 3450 to 3600 cm-1
in the spectrum of UF resin represents the release of
HCN. Very little HCN was found in other samples, especially at low temperatures. It is
concluded that the degradation of urea function in UF resin generates HNCO and a
precursor of HCN, which will crack into HCN under 650 oC (Girods et al. 2009a). HCN
is therefore much more difficult to be detected during the pyrolysis process.
Fig. 5. Spectra of gases released at the highest intensity value for each sample

PEER-REVIEWED ARTICLE bioresources.com
Feng et al. (2012). “Pyrolysis of UF wood panels,” BioResources 7(4), 4600-4613. 4606
In the first stage, the absorbance at 3500 to 4000 cm-1
shows the release of water,
which is mainly attributable to hydroscopic water and chemical water in solid wood.
With the temperature rising in the first stage, some complex compounds including
aliphatic hydroxyl groups are going to crack to generate smaller chemical compounds.
From the absorbance curves of main gaseous products (see Figs. 6 to 9), small amounts
of CO and CO2 could also be detected gradually, which is primarily due to the breakdown
of oxygen-contained groups and aliphatic hydrocarbons in the lateral chains. According
to the literature (Rowell 1988), it is assumed that CO2 and CO are formed by decarboxyl-
ation and decarbonylation, respectively.
Fig. 6. Evolution patterns of CO2 Fig. 7. Evolution patterns of CO
Fig. 8. Evolution patterns of HNCO Fig. 9. Evolution patterns of NH3
When the second stage, which is the primary and most important stage, takes
place during the thermal process, almost all the gaseous products reached their highest
intensity values. Generally, the thermal degradation range for hemicellulose is between
200 and 300 oC, cellulose between 300 and 400
oC, and lignin between 250 and 500
oC
(Wild et al. 2009). The breakage of carboxyl in the lateral chains in furfural acid results
in the release of CO2. The less stable carbonyl in volatiles is more likely to be the

PEER-REVIEWED ARTICLE bioresources.com
Feng et al. (2012). “Pyrolysis of UF wood panels,” BioResources 7(4), 4600-4613. 4607
precursor of CO. The formation of CO is also largely influenced by secondary cracking
of volatiles during thermal process (Li et al. 2009).
Figure 6 shows that the evolution patterns of CO2 created by different samples
were similar to each other. The shoulder peak of the curve is in accordance with the
results obtained from DTG, which suggests the maximum degradation rate of
hemicellulose. The peak at around 300 oC reveals that the mass loss rate of hemicellulose,
cellulose, and lignin as a whole reached its highest value. Because CO2 originates mainly
from carboxyl and there is little carboxyl in UF resin, the influence of UF resin on CO2
yield of wood-based panels could thus be neglected. Figure 7 shows that the evolution
patterns of CO were much different from that of CO2. The carbonyl in UF resin led to a
large amount of CO during thermal process.
The two peaks of UF resin between 200 oC and 300
oC in the curve correspond to
that of the DTG curve. Carbonyl groups in UF resin go through reforming,
rearrangement, and isomerization at high temperature, resulting in the elimination of
unstable double bonds and carbonyl groups. More stable molecular structure is rapidly
formed during this process with the release of CO at the same time, resulting in the first
peak that could be observed in the curve (Li et al. 2009). The two peaks of UF resin here
may be attributed to the two crucial reactions during the thermal degradation, which is in
agreement with former DTG results. During this temperature range, the CO intensity of
PB and MDF was higher than that of wood for the reason of the existence of UF resin in
the wood-based panels.
As for one of the nitric gases HNCO shown in Fig. 8, it is interesting that the
evolution pattern of HNCO was similar to that of CO. Under thermal treatment, the
breakdown of the unstable azyl and methylol in UF resin would make chemical groups in
the circle in Fig. 1 an active group. Combined with an active hydrogen, large quantities of
HNCO would then be formed, reaching its highest intensity at 240oC. In regards to NH3,
Fig. 9 shows that there is mainly one peak, which is much higher than wood and wood-
based panels; conclusions could be made that the fragmentation of UF resin unit directly
leads to the formation of azyl functions within the narrow temperature range between
180 oC and 320
oC and then the formation of large quantities of NH3 with the highest
intensity at 210 oC.
During the third pyrolysis stage in the high temperature range between 400 and
800oC, the intensity of almost all the gases was relatively low and varied very little.
Lignin degradation plays an important role in this stage. Functional groups in the lateral
chains of phenyl propane are still cracking, and volatiles undergo further secondary
reactions. The higher CO release intensity in UF resin is due to the more carbonyl bonds
and the breakdown of C-N single bonds in UF resin, compared with wood and wood-
based panels.
The influence of UF resin on wood-based panels could be found mainly in the
release of nitric gases during the second stage. Intensity peaks of nitric gases of wood-
based panels are higher and occur earlier than that of wood. Together with the results of
evolution patterns of CO2 and CO, we could draw a conclusion that UF resin is the main
factor contributing to the nitric gases of the pyrolysis of waste wood-based panels, while
the influence on the CO2 was not obvious. Measures must be taken to deal with the
hazardous nitric gases especially in the temperature range between 180 and 320 oC.

PEER-REVIEWED ARTICLE bioresources.com
Feng et al. (2012). “Pyrolysis of UF wood panels,” BioResources 7(4), 4600-4613. 4608
Influence of UF Resin on the Elemental Distribution of Solid Samples The four main elemental components contained in the wood and PB are C, H, N,
and O. The elements C and O, with highest elemental content, account for 40.30wt% and
43.30wt% on average. Wood contains very little N, only 0.14wt%, while UF resin
contains 33.4 wt%.
Fig. 10. Content of C in the original sample and char Fig. 11. Content of H in the original
sample and char
Fig. 12. Content of N in the original sample and char Fig. 13. Content of O in the original sample and char
Figures 10 to 13 show the content of C, H, N, and O of different samples before
and after pyrolysis. The comparison of element content in the original sample and in the
char multiplied char yield could show the loss of the element.
The contents of C, H, and O in UF resin was the lowest of all samples, which
makes the content of C, H, and O in PB lower than that in wood. The content ratio of C in
each sample was relatively stable both before and after pyrolysis. Although large
amounts of C were lost, C was still the main element in the char, accounting for
91.59wt% in wood char and around 79.72 wt% in PB char. The influence of UF resin on
C was therefore not significant. The tendency of O is quite similar to that of C. The

PEER-REVIEWED ARTICLE bioresources.com
Feng et al. (2012). “Pyrolysis of UF wood panels,” BioResources 7(4), 4600-4613. 4609
content ratio of O in wood and PB are not obviously influenced by different content of
UF resin. However, the mass loss of O is the largest one, probably fixed in the form of
oxygenated compounds in pyrolysis liquids and CO and CO2 in gases during pyrolysis
process.
With the increase of UF resin contained in PB, the tendency of H content is much
different from that of C and O. In contrast to the content in original samples, the content
of H in the char of PB is notably higher than that of wood and UF. It could be concluded
that UF resin in PB inhibited the loss of H the most during pyrolysis; however concerning
the loss of H, no apparent relationships with different resin content could be found in PB.
N contained in PB with different UF resin content is mainly due to the UF resin, and the
content steadily increases by the increase of UF resin both before pyrolysis (from 2.76%
to 7.53%) and after pyrolysis (from 3.12% to 5.39%) with little changes for each sample.
This indicates that N stays stable even after high temperature thermal treatment, which is
in accordance with the literature (Girods et al. 2009a).
From elemental analysis results, it could be concluded that the main elements in
wood and PB are C and O, and the main elements in UF resin are N, C, and O. The
tendency of C and O distribution are similar to each other with little influence of UF
resin, while the mass loss of O is the most significant one of all elements. UF resin
inhibited mass loss of H in PB the most, while the most stable element is N contained in
all samples.
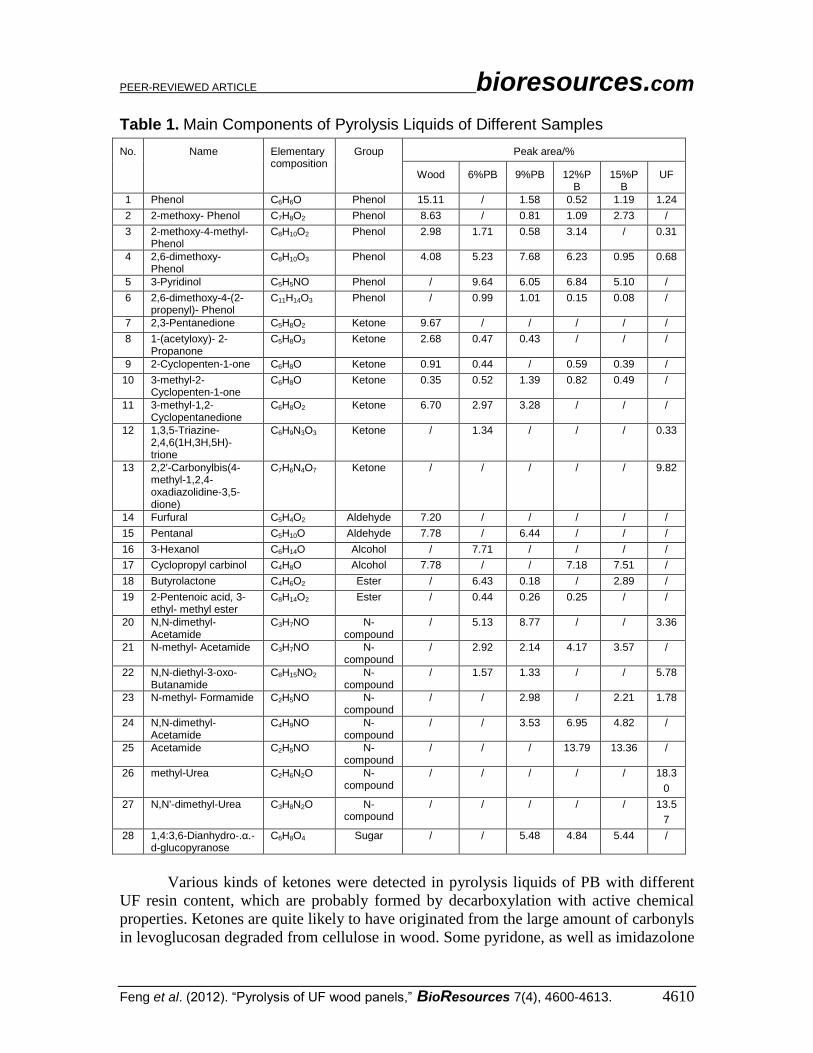
Influence of UF Resin on the Components of Pyrolysis Liquids of PB The main components of all the samples from GC-MS results are shown in Table
1, from which it can be found that almost all the compounds contain oxygen, which
meets the results from elemental analysis that the largest mass loss is oxygen. Because
the amount of acetic acid and formic acid were too high compared with other components
and these acids contained no nitrogen compounds, the peaks of such acids were removed
from the total ion current chromatograms in order to specifically clarify the influence of
UF resin on nitric compounds in pyrolysis liquids.
The influence of UF resin is mainly on the nitrogen compounds. Almost no nitric
compounds were detected in pyrolysis liquids of wood, but various types of amides were
found in pyrolysis liquids of PB and UF resin. The formation of nitric compounds in
pyrolysis liquids of PB is mainly through the conversion of urea in UF resins as applied
in wood-based panels.
The two most abundant components in pyrolysis liquids of UF resin were methyl-
urea and N, N'-dimethyl-urea, but in PB with 12% and 15% UF resin content the most
abundant compound was acetamide, indicating that the transformation of nitrogen-
containing compounds is influenced by the interactions between UF resins and wood
constituents.
Different resin content did not make a linear increase in relative abundance of
nitric compounds in pyrolysis liquids of PB, which is probably attributable to the
intricate structures in wood-based panels. Such specific characteristics of pyrolysis
liquids of PB might enable the multi-uses as new feedstock materials.
PEER-REVIEWED ARTICLE bioresources.com
Feng et al. (2012). “Pyrolysis of UF wood panels,” BioResources 7(4), 4600-4613. 4610
Table 1. Main Components of Pyrolysis Liquids of Different Samples
No. Name Elementary composition
Group Peak area/%
Wood 6%PB 9%PB 12%PB
15%PB
UF
1 Phenol C6H6O Phenol 15.11 / 1.58 0.52 1.19 1.24
2 2-methoxy- Phenol C7H8O2 Phenol 8.63 / 0.81 1.09 2.73 /
3 2-methoxy-4-methyl- Phenol
C8H10O2 Phenol 2.98 1.71 0.58 3.14 / 0.31
4 2,6-dimethoxy- Phenol
C8H10O3 Phenol 4.08 5.23 7.68 6.23 0.95 0.68
5 3-Pyridinol C5H5NO Phenol / 9.64 6.05 6.84 5.10 /
6 2,6-dimethoxy-4-(2-propenyl)- Phenol
C11H14O3 Phenol / 0.99 1.01 0.15 0.08 /
7 2,3-Pentanedione C5H8O2 Ketone 9.67 / / / / /
8 1-(acetyloxy)- 2-Propanone
C5H8O3 Ketone 2.68 0.47 0.43 / / /
9 2-Cyclopenten-1-one C6H8O Ketone 0.91 0.44 / 0.59 0.39 /
10 3-methyl-2-Cyclopenten-1-one
C6H8O Ketone 0.35 0.52 1.39 0.82 0.49 /
11 3-methyl-1,2-Cyclopentanedione
C6H8O2 Ketone 6.70 2.97 3.28 / / /
12 1,3,5-Triazine-2,4,6(1H,3H,5H)-trione
C6H9N3O3 Ketone / 1.34 / / / 0.33
13 2,2'-Carbonylbis(4-methyl-1,2,4-oxadiazolidine-3,5-dione)
C7H6N4O7 Ketone / / / / / 9.82
14 Furfural C5H4O2 Aldehyde 7.20 / / / / /
15 Pentanal C5H10O Aldehyde 7.78 / 6.44 / / /
16 3-Hexanol C6H14O Alcohol / 7.71 / / / /
17 Cyclopropyl carbinol C4H8O Alcohol 7.78 / / 7.18 7.51 /
18 Butyrolactone C4H6O2 Ester / 6.43 0.18 / 2.89 /
19 2-Pentenoic acid, 3-ethyl- methyl ester
C8H14O2 Ester / 0.44 0.26 0.25 / /
20 N,N-dimethyl- Acetamide
C3H7NO N-compound
/ 5.13 8.77 / / 3.36
21 N-methyl- Acetamide C3H7NO N-compound
/ 2.92 2.14 4.17 3.57 /
22 N,N-diethyl-3-oxo- Butanamide
C8H15NO2 N-compound
/ 1.57 1.33 / / 5.78
23 N-methyl- Formamide C2H5NO N-compound
/ / 2.98 / 2.21 1.78
24 N,N-dimethyl- Acetamide
C4H9NO N-compound
/ / 3.53 6.95 4.82 /
25 Acetamide C2H5NO N-compound
/ / / 13.79 13.36 /
26 methyl-Urea C2H6N2O N-compound
/ / / / / 18.3
0
27 N,N'-dimethyl-Urea C3H8N2O N-compound
/ / / / / 13.5
7
28 1,4:3,6-Dianhydro-.α.-d-glucopyranose
C6H8O4 Sugar / / 5.48 4.84 5.44 /
Various kinds of ketones were detected in pyrolysis liquids of PB with different
UF resin content, which are probably formed by decarboxylation with active chemical
properties. Ketones are quite likely to have originated from the large amount of carbonyls
in levoglucosan degraded from cellulose in wood. Some pyridone, as well as imidazolone

PEER-REVIEWED ARTICLE bioresources.com
Feng et al. (2012). “Pyrolysis of UF wood panels,” BioResources 7(4), 4600-4613. 4611
in the form of nitrogen heterocyclic compounds, are found in pyrolysis liquids of PB, but
little are found in UF resin, suggesting that nitrogen from UF resin is reformed and fixed
with chemical groups degraded from wood in the form of ketones in the pyrolysis liquids.
Phenol is the most abundant compound in pyrolysis liquids of wood, while
phenol, 2-methoxy-phenol, and 2,6-dimethoxy-phenol could be detected in almost all the
pyrolysis liquids. Phenolic compounds in pyrolysis liquids of PB mainly originated from
lignocelluloses; however, their structures might be influenced by UF resin in terms of
nitrogen during the thermal conversion process, resulting in a small amount of phenol
(peak area around 1.5%) in PB despite the large amount (peak area over 15%) detected in
pyrolysis liquids of wood. The influence of UF resin on other components including
aldehydes, alcohols, and esters is not significant, since these compounds are not the main
components in pyrolysis liquids of PB and not detected in pyrolysis liquids of UF resin.
As the main constituent in wood, cellulose will go through dehydration reactions
during pyrolysis process, forming levoglucosan and glycolaldehyde. Glucosyl groups will
then crack into smaller structures at high temperature. However, in our experiment,
1,4:3,6-dianhydro-.α.-d-glucopyranose was only detected in PB with resin content over
9%. The research showed that acids could catalyze the dehydration reactions (Wang et al.
2006), while UF resin introduces alkaline atmosphere during the pyrolysis, which inhibits
further cracking of glucosyl groups. Compared with cellulose, hemicelluloses are
inhomogeneous glycan species with weaker thermal stability. The pyrolysis of xylan in
hemicelluloses releases acid and aldehyde products, which are not significantly
influenced by UF resin. Lignin is the only aromatic constituent in wood with very
complicate structures, while in UF resin most structures are linear and network linkages.
However many detected nitrogen compounds show aromatic properties, such as pyridine
and pyrimidine. It could be concluded that concerted reactions between UF resin and
lignin occur in the pyrolysis process so that lignin is probably the mostly influenced
constituent by UF resin in wood.
CONCLUSIONS
1. Based on wood, wood-based panels, UF resin, and particleboards with different UF
resin content, the influence of UF resin on wood-based panels in pyrolysis was
studied by thermobalance, with elementary and components analysis. There are three
stages, with the second stage being the most rapid stage between the temperature
range of 200 to 400 oC for wood and wood-based panels. From TG and DTG results it
is found that UF resin in wood-based panels make them easier to degrade at the
beginning of thermal treatment, but that the presence of UF resin inhibits the
degradation of wood-based panels during the second and third stage.
2. For the pyrolysis solid products, the mass loss of O is the largest one; however it is
not significantly influenced by UF resin, while the mass loss of H is obviously
inhibited by UF resin during the pyrolysis process. There are around 3wt% of N
element in the char of wood-based panels, making the char of wood-based panels
different from that of biomass. The loss of the element could directly influence the
properties of pyrolysis gases and liquids.

PEER-REVIEWED ARTICLE bioresources.com
Feng et al. (2012). “Pyrolysis of UF wood panels,” BioResources 7(4), 4600-4613. 4612
3. The influence of UF resin on pyrolysis gases during the pyrolysis process of wood-
based panels is mainly on the release of HNCO and NH3 within a narrower tempera-
ture range than CO and CO2 between 180 oC and 320
oC corresponding to the second
stage in TG results.
4. For the pyrolysis liquids, the influence of UF resin is mainly on the nitrogen
compounds. Structures in phenols and ketones are also influenced by nitrogen in UF
resin; however influences of UF resin on aldehydes, alcohols, and esters were not
obvious. Based on the results of the influence of UF resin on the pyrolysis of wood-
based panels, further study is still needed to make clear the interactions of UF resin
with constituents of cellulose, hemicelluloses, and lignin in wood.
ACKNOWLEDGMENTS This study was funded by the National Natural Science Foundation of China (31170533).
REFERENCES CITED
Girods, P., Rogaume, Y., Dufour, A., Rogaume, C., and Zoulalian, A. (2008a). “Low-
temperature pyrolysis of wood waste containing urea-formaldehyde resin,”
Renewable Energy 33, 648-654.
Girods, P., Dufour, A., Rogaume, Y., Rogaume, C., and Zoulalian, A. (2008b).
“Pyrolysis of wood waste containing urea-formaldehyde and melamine-formaldehyde
resins,” J. Anal. App. Pyrol. 81, 113-120.
Girods, P., Dufour, A., Rogaume, Y., Rogaume, C., and Zoulalian, A. (2008c). “Thermal
removal of nitrogen species from wood waste containing urea formaldehyde and
melamine formaldehyde resins,” J. Hazard. Mater. 159, 210-221.
Girods, P., Dufour, A., Rogaume, Y., Rogaume, C., and Zoulalian, A. (2009a).
“Comparison of gasification and pyrolysis of thermal pre-treated wood board waste,”
J. Anal. App. Pyrol. 85, 171-183.
Girods, P., Dufour, A., Fierro, V., Rogaume, Y., Rogaume, C., Zoulalian, A., and
Celzard, A. (2009b). “Activated carbons prepared from wood particleboard waste:
Characterization and phenol adsorption capacities,” J. Hazard. Mater. 166, 491-501.
Goyal, H. B., Seal, D., and Saxena, R. C. (2008). “Bio-fuels from thermochemical
conversion of renewable resources: A review,” Renew Sust Energ Rev. 12, 504-517.
He, X. C., and Mu, Y. P. (2008). “Discussion on recycling and utilization of wasting
wood-based panels,” Wood Process Mach. 1, 50-53.
Hirata, T., Kawamoto, S., and Kouro, A. (1991). “Pyrolysis of melamine-formaldehyde
and urea-formaldehyde resins,” J. Appl. Polym. Sci. 42, 3147-3163.
Hu, R. Z. (2008). “Thermal analysis kinetics,” Sci. Press China, Beijing. 20-21, 50-55.
Jiang, X. G., Li, C. Y., Chi, Y., and Yan, J. H. (2010). “TG-FTIR study on urea-
formaldehyde resin residue during pyrolysis and combustion,” J. Hazard. Mater. 173,
205-210.
PEER-REVIEWED ARTICLE bioresources.com
Feng et al. (2012). “Pyrolysis of UF wood panels,” BioResources 7(4), 4600-4613. 4613
Lee, S. B., and Fasina, O. (2009). “TG-FTIR analysis of switchgrass pyrolysis,” J. Anal.
App. Pyrol. 86, 39-43.
Li, X. Y., and Ying, H. (2009). “Research advance on mechanism of biomass pyrolysis
and gasification,” Adv. Fine Petr. 10(10), 45-50.
Li, W. J., Zhang X. S., Qv, Y. C., Jiang, H., and Yu, H. Q. (2012). “Bio-oil upgrading at
ambient pressure and temperature using zero valent metals,” Green Chem. 8(14),
2226-2233.
Mazela, B. (2007). “Fungicidal value of wood tar from pyrolysis of treated wood,” Waste
Manage. 27, 461-465.
Nakai, T., Kartal, S. N., Hata, T., and Imamura, Y. (2007). “Chemical characterization of
pyrolysis liquids of wood-based composites and evaluation of their bio-efficiency,”
Build Environ. 42, 1236-1241.
Peng, Y. C., Shi, S. Q., and Ingram, L. (2011). “Chemical emissions from adhesive-
bonded wood products at elevated temperatures,” Wood Sci. Technol. 45, 627-644.
Qian, X. Y. (2010). “Current status and future challenges of wood-based panel industry
in China,” Chin. Wood Ind. 4(1), 15-18.
Rowell, R. (1988). The Chemistry of Solid Wood, Chin. Publ. House, Beijing, 350-384.
Wang, S. R., Liao, Y. F., Liu, Q., Luo, Z. Y., and Cen, K. F. (2006). “Experimental study
of the influence of acid wash on cellulose pyrolysis” J. Fuel Chem. Technol. 34(2),
179-183.
Wild, P. J., Uil, H. D., Reith, J. H., Kiel, J. H.A., and Heeres, H. J. (2009). “Biomass
valorisation by staged degasification. A new pyrolysis-based thermochemical
conversion option to produce value-added chemicals from lignocellulosic biomass,”
J. Anal. App. Pyrol. 85, 124-133.
Windt, M., and Meier D. (2010). “Pyrolysis oil as pre-product of biofuel production,” In:
New Biofuels 2010 Symposium, Berlin, 2010.
Zhang, W.W., Zeng, G. Y., Chen, X. L., and Yu, Z. H. (2007). “Characteristic of semi-
char from biomass pyrolysis,” J. East Chin. Univ. Sci. Technol. 33(5), 670-675.
Zhang, W. W., Chen, X. L., Zeng, G. Y., and Yu, Z. H. (2008). “Influence of slow
pyrolysis on physical properties of biomass powders,” Chen Eng. 36(3), 60-63.
Article submitted: May 29, 2012; Peer review completed: July 15, 2012; Revised version
received and accepted: July 30, 2012; Published: August 8, 2012.