Embed Size (px)
Citation preview

Peering Resiliency: Perspectives from a carrier-neutral IX
and co-location providerAndrew Oon
MENOG – Kuwait, April 2008
Overview
• About Equinix• Impact of cable system outages on
carriers & ISPs• Aftermath: capacity growth & drive
towards resiliency• Evolving Internet traffic trends in Asia• The drive towards more peering• Conclusion
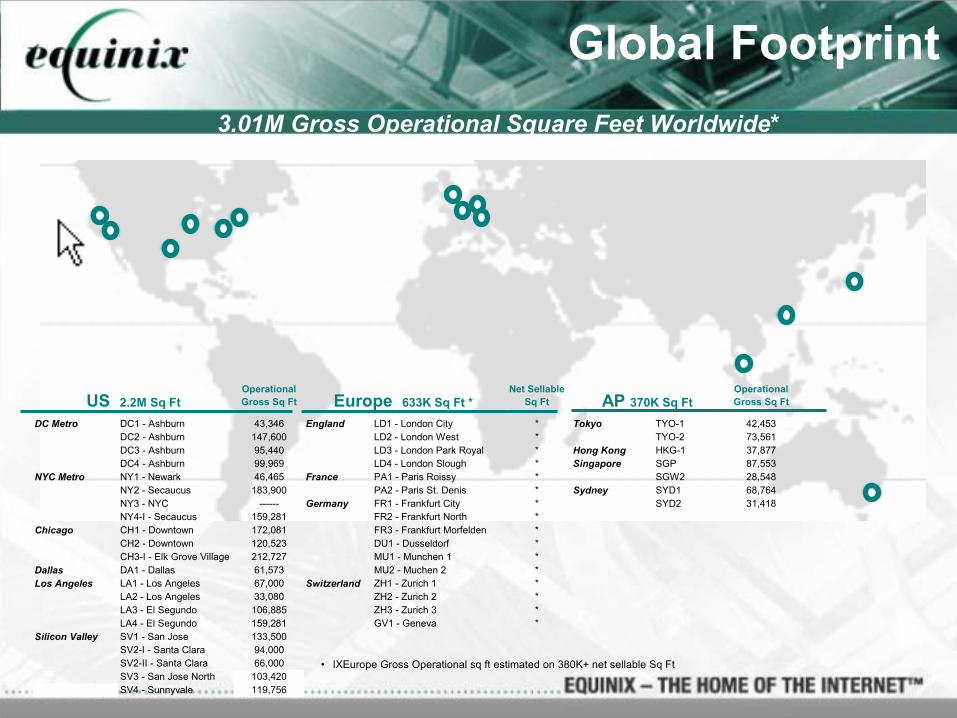
Global Footprint3.01M Gross Operational Square Feet Worldwide*
• IXEurope Gross Operational sq ft estimated on 380K+ net sellable Sq Ft
Operational Gross Sq Ft
Net Sellable Sq Ft
Operational Gross Sq Ft
DC Metro DC1 - Ashburn 43,346 England LD1 - London City * Tokyo TYO-1 42,453DC2 - Ashburn 147,600 LD2 - London West * TYO-2 73,561DC3 - Ashburn 95,440 LD3 - London Park Royal * Hong Kong HKG-1 37,877DC4 - Ashburn 99,969 LD4 - London Slough * Singapore SGP 87,553
NYC Metro NY1 - Newark 46,465 France PA1 - Paris Roissy * SGW2 28,548NY2 - Secaucus 183,900 PA2 - Paris St. Denis * Sydney SYD1 68,764NY3 - NYC ------ Germany FR1 - Frankfurt City * SYD2 31,418NY4-I - Secaucus 159,281 FR2 - Frankfurt North *
Chicago CH1 - Downtown 172,081 FR3 - Frankfurt Morfelden *CH2 - Downtown 120,523 DU1 - Dusseldorf *CH3-I - Elk Grove Village 212,727 MU1 - Munchen 1 *
Dallas DA1 - Dallas 61,573 MU2 - Muchen 2 *Los Angeles LA1 - Los Angeles 67,000 Switzerland ZH1 - Zurich 1 *
LA2 - Los Angeles 33,080 ZH2 - Zurich 2 *LA3 - El Segundo 106,885 ZH3 - Zurich 3 *LA4 - El Segundo 159,281 GV1 - Geneva *
Silicon Valley SV1 - San Jose 133,500SV2-I - Santa Clara 94,000SV2-II - Santa Clara 66,000SV3 - San Jose North 103,420SV4 - Sunnyvale 119,756
US 2.2M Sq Ft Europe 633K Sq Ft * AP 370K Sq Ft

Impact of cable system outages on carriers & ISPs

Disaster Strikes!
• Two major cable system outages in the past 18 months– Taiwan: Dec 2006– Mediterranean/Persian Gulf: Jan 2008
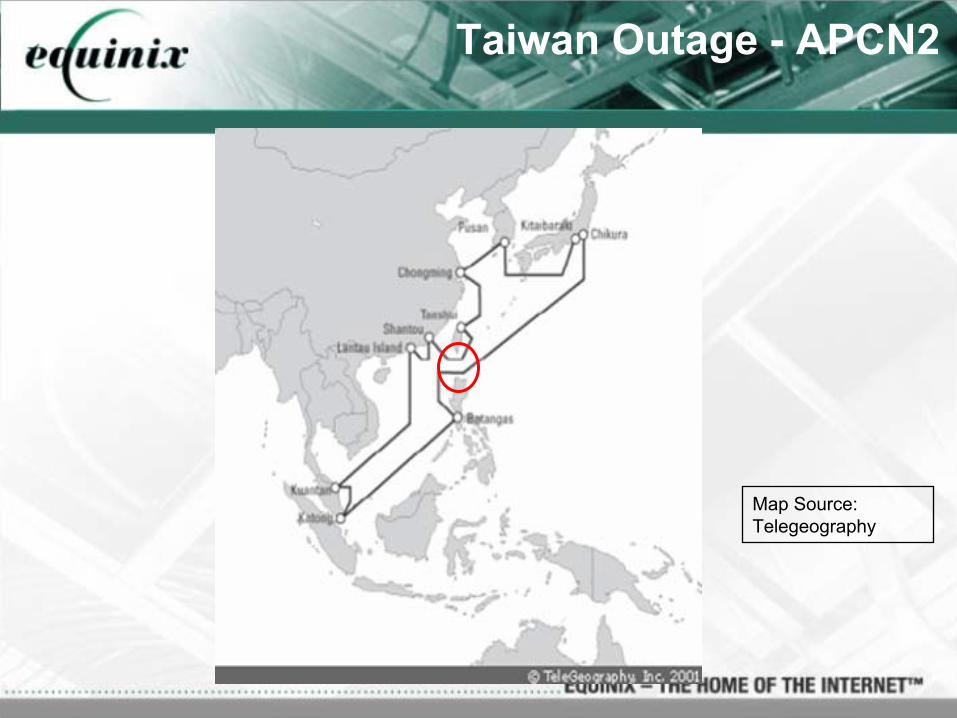
Taiwan Outage - APCN2
Map Source: Telegeography
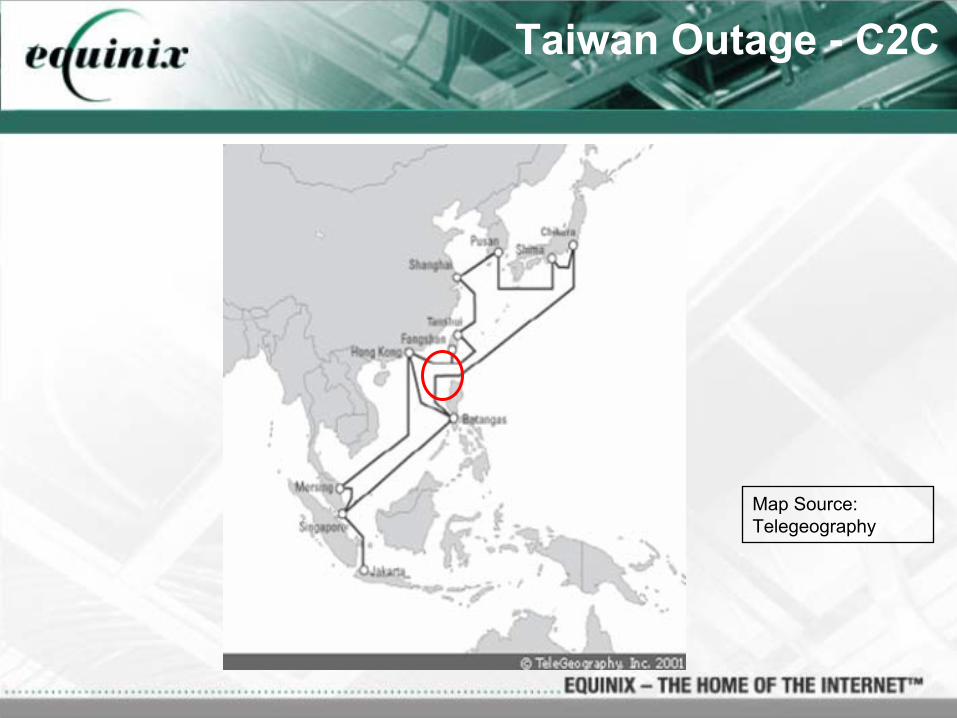
Taiwan Outage - C2C
Map Source: Telegeography
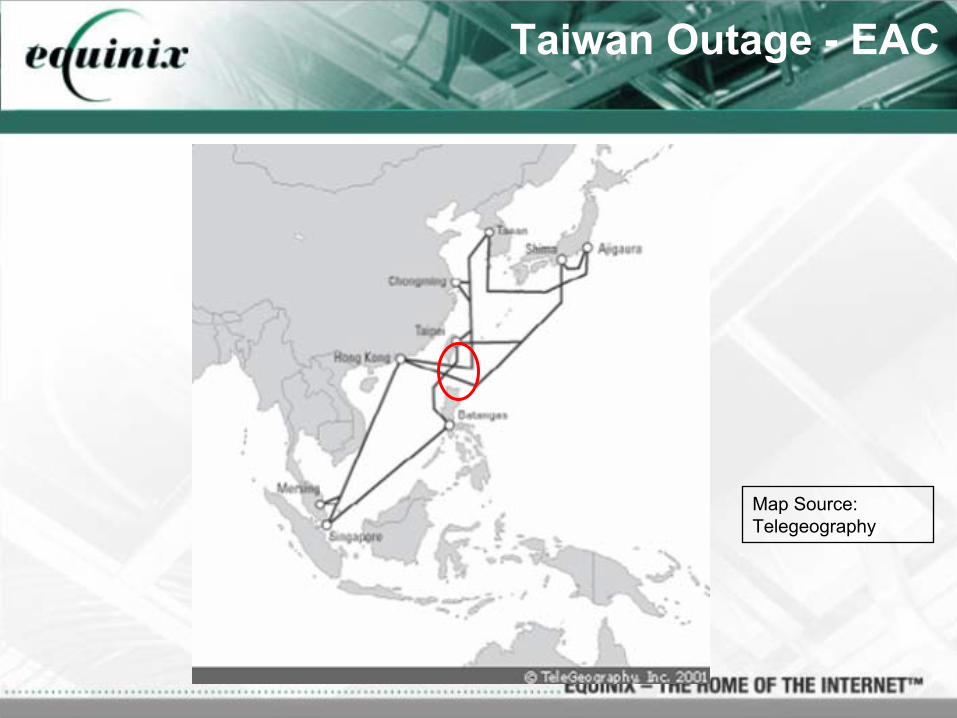
Taiwan Outage - EAC
Map Source: Telegeography

Taiwan Outage - FNAL
Map Source: FLAG
Taiwan - Major ISPs Impacted
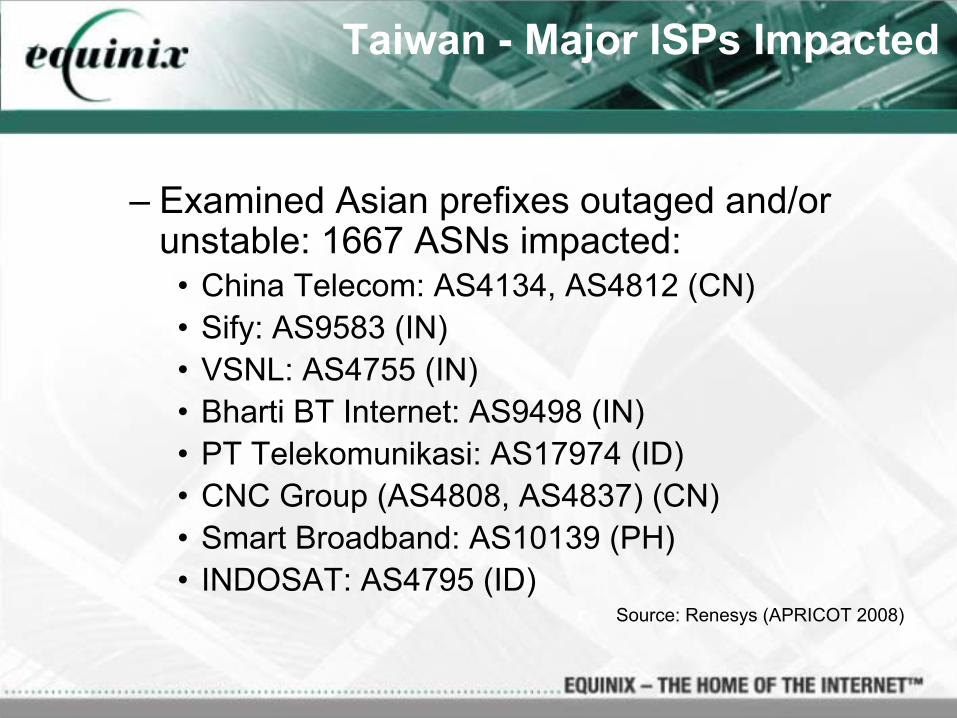
– Examined Asian prefixes outaged and/or unstable: 1667 ASNs impacted:
• China Telecom: AS4134, AS4812 (CN)• Sify: AS9583 (IN)• VSNL: AS4755 (IN)• Bharti BT Internet: AS9498 (IN)• PT Telekomunikasi: AS17974 (ID)• CNC Group (AS4808, AS4837) (CN)• Smart Broadband: AS10139 (PH)• INDOSAT: AS4795 (ID)
Source: Renesys (APRICOT 2008)
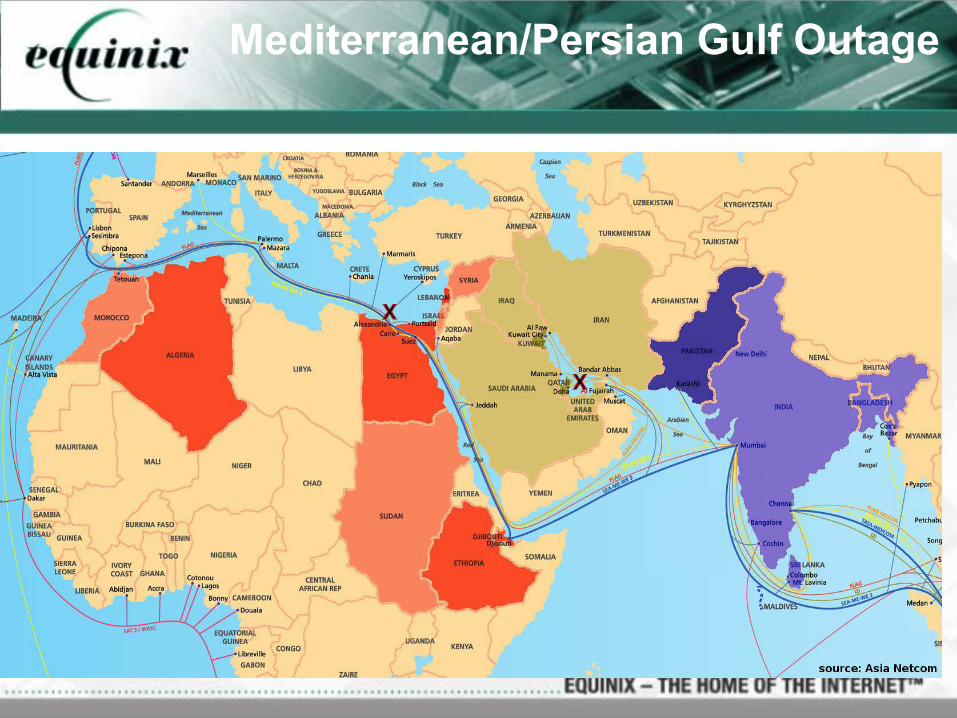
Mediterranean/Persian Gulf Outage

Impact of Med/Persian Gulf Outage
• Several cables in the Mediterranean and the Persian Gulf were damaged around 30 January 2008– 3 cables severed– SEA-ME-WE 4 (30 January: 04:30 UTC)– Flag (30 January: 08:00 UTC)– Flag-Falcon (2 February: 05:59 UTC)
• Impacted regions include:– Middle East / North Africa (approx 65% outaged networks)– Persian Gulf (approx 45% outaged networks)– Indian Subcontinent (approx 32% outaged networks)– 6856 networks from 23 countries suffered outages
Source: Renesys
Impact of Outages
• Major transport and transit providers impacted
• As a result, major regional & domestic ISPs impacted
• Regional/domestic ISPs experienced major bandwidth degradation, loss of routes

What Followed
• Mad scramble for “substitute” transit• Urgent connection requests in major
interconnection and exchange points• Regional ISPs who were overly reliant on 1 or
2 major transit providers were the worst affected
• As a result:– Drive to build better network resilience– New transit relationships– New peering relationships

Downstream Observations
• Transit providers with capacity in both directions won business– PCCW– Tata (VSNL/Teleglobe)
• ISPs with PoP diversity (in right locations) recovered fastest
• Regional ISPs - less dependency, more autonomy
Aftermath: capacity growth & drive towards resiliency
Carriers & Major Transit Providers
• Cable capacity upgrades• Build-out PoPs for better network resilience
– E.g. VSNL improve intra-Asia PoP-meshing (source: VSNL/Sylvie LaPerriere, NANOG 39)
– New PoPs in Singapore for:• Telkom• Excelcomindo• CS Loxinfo• Bharti• Etisalat• Maxis
• New cables
New Cable Systems in Asia
Asia to US• Unity
– Consortium of 6 companies including Bharti, Pacnet, KDDI and Google• Asia-America Gateway (AAG)
– Consortium including AT&T, Starhub, Bharti, CAT, Indosat, Telstra, Telkom, Saigon Postel, Telekom Malaysia
• TGN Intra-Asia (Singapore-HK-Japan)– VSNL, Globe, PCCW, EVN
Asia to Europe• TGN Eurasia (Mumbai, Egypt, London, Paris, Madrid)• I-ME-WE
– Includes VSNL, Telecom Italia, Telecom Egypt, Etisalat
And several more...NGN, TPE, etc.

Singapore Grows as Interconnection & Peering Hub
• End point for various major cable systems– SE-ME-WE4– TIC– Unity– TGN
• Uniquely positioned for traffic heading West (to Europe) and East (to North Asia and US)
• Conveniently located for content delivery to rapidly emerging markets, India and China
• De-regulated environment for interconnection and peering

Importance of Connecting to an IX/Major “Carrier Hotel”
• Availability of capacity for growth• Availability of providers for network recovery
& resilience• Access to peering
– Improve network/routing efficiency– Easy to make routing changes– Evolving traffic profiles
• Commercial considerations– Buying of services– Selling of services

Evolving Internet traffic trends in Asia

Traffic Trends
• Accelerated growth in broadband services in Asia
• Major content providers & CDN deployment in Asia: Yahoo, Google, Akamai, Limelight
• Localized content growth• 10G exchange deployments• Continued exponential growth in P2P Traffic• HD streaming video and VoIP• Mass market gaming

Traffic Trends
Content pushed to the edgeLocalised Content
Pull Content from USTraffic Profile
US$30-50 monthlyUS$30 monthlyTariff
VideoWebGames
WebEmail
Major Applications
10Mbps+ Broadband28.8k ModemTypical User Access Speed
70% HTTP
1997
70% P2P*Protocols
2007
* Source: http://www.ipoque.com/media/internet_studies/internet_study_2007* Source: http://www.ipoque.com/media/internet_studies/internet_study_2007

Telecommunications Deregulation
• Additional competition across the board– Cheaper access to international capacity
• Some countries only partially deregulate to protect domestic interests– China, India, Thailand, Malaysia, Philippines
• Others still have a high barrier to entry– Vietnam, Indonesia - cost of licenses, access, capacity
availability, etc• Where there is full deregulation, dominant carriers try
to protect their turf– Australia, Singapore, Taiwan
• Life is relatively easier in some places…– Japan, Hong Kong
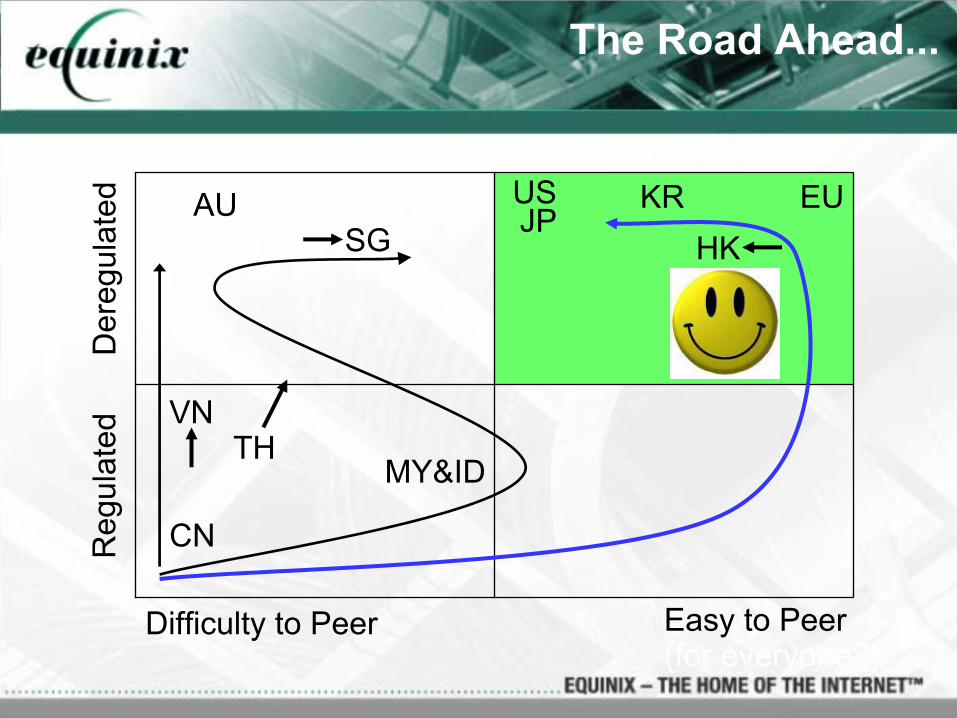
The Road Ahead...D
ereg
ulat
edR
egul
ated
Easy to PeerDifficulty to Peer
EUUSSG HK
TH
AU
VN
JP
MY&ID
CN
KR
(for everyone?)
Cost of International Capacity
• Cost of international capacity falling dramatically over the past 10 years– US$10,000/month for 64k IPLC Asia-US in 1996– US$10,000/month for STM1 IPLC Asia-US in
2006– Over 2000x!
• IRU capacity essentially “free” for some incumbent operators (backhaul swaps)
• Availability in developing countries– Indonesia, Vietnam, Thailand, Philippines
• Local peering was critical back then, now merely a convenience
Cost of Domestic Capacity
• Cost of domestic capacity has fallen, but at a slower pace than the international capacity– Right-of-way difficult to obtain– Usually the last thing to be deregulated
• For retail IPLC, over 50% of the circuit price goes to domestic transmission– Local loops from customer premise to POP x2– Carrier backhaul from POP to Cable station x2
• Domestic capacity to peering point might be more expensive than buying international IP transit from the same carrier!
• Dark fiber not generally available (except Japan)

The drive towards more peering

Catalyst to Peering
• Need for better resilience• More carrier-neutral facilities• Capacity & cost
– Capacity availability– Local dark fibre availability
• Find the right people• Find a win-win business model
– Value of Eyeballs vs. Content• ISP’s infrastructure cost, incremental revenue• Content Provider’s content, ISP saves on transit
The Internet vs Commercial Ethos
• The Internet Ethos– Sharing and collaboration– Efficiency– Elegant solutions
• The Commercial Ethos– Lower costs– Destroy the competition– Profit!
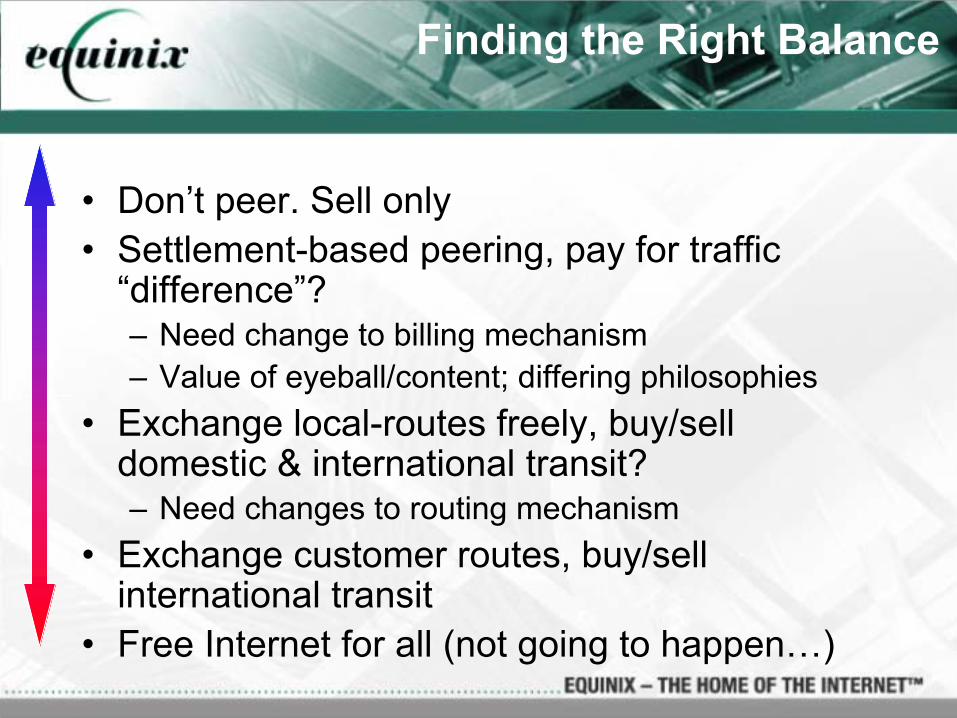
Finding the Right Balance
• Don’t peer. Sell only• Settlement-based peering, pay for traffic
“difference”?– Need change to billing mechanism– Value of eyeball/content; differing philosophies
• Exchange local-routes freely, buy/sell domestic & international transit?– Need changes to routing mechanism
• Exchange customer routes, buy/sell international transit
• Free Internet for all (not going to happen…)
Conclusion

Lessons to be Remembered
– Cable cuts illustrate fragility of today’s Internet• Asia and Middle East are particularly vulnerable
– Solutions revolve around:• Educated Internet consumers• New business relationships• International & local peering (IXs)• Allows individual countries/regions can retain
connectivity• New cable systems• Physical redundancy• Different submarine cables with different paths• Land-based systems where possible