Embed Size (px)
Citation preview
PEMBROLIZUMAB METHOD VALIDATION IN HUMAN SERUM: COMPARISON OF TRIPLE QUADRUPOLE AND HIGH RESOLUTION INSTRUMENT.23/11/2019/EBF-Barcelona
Jordane BIARC
EVERY STEP OF THE WAY
2 EVERY STEP OF THE WAY
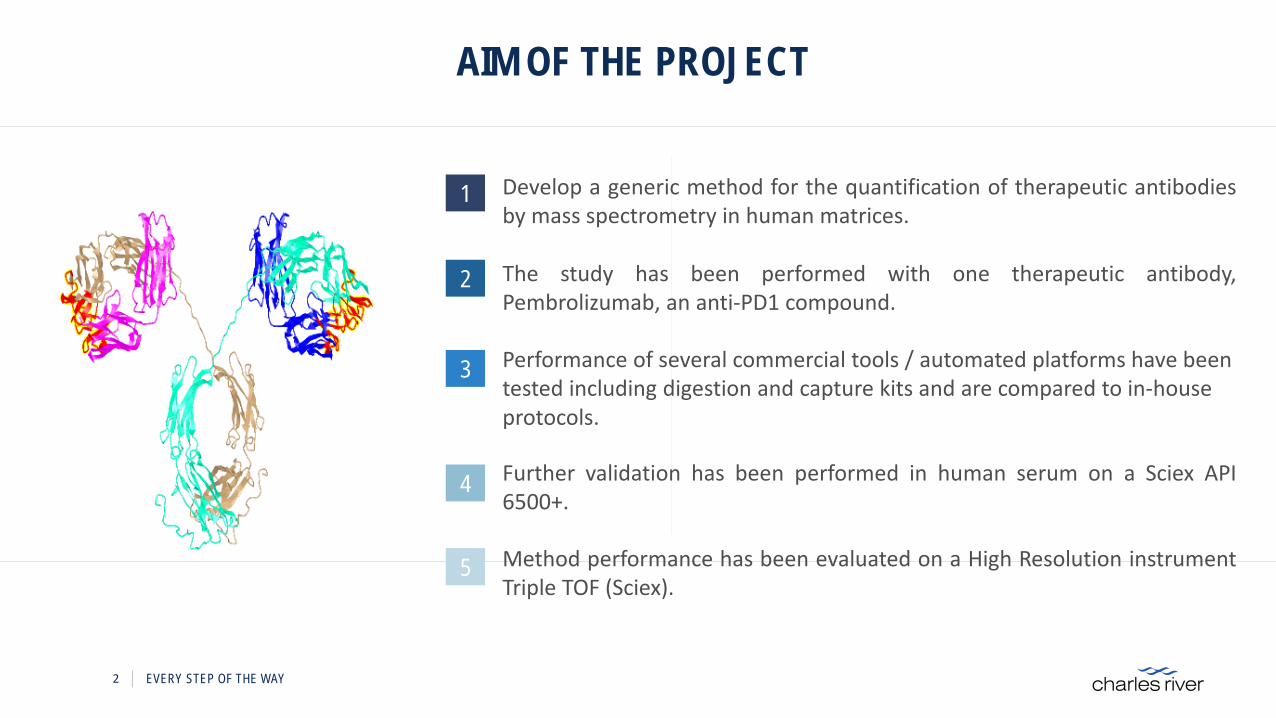
AIM OF THE PROJECT
1 Develop a generic method for the quantification of therapeutic antibodiesby mass spectrometry in human matrices.
2 The study has been performed with one therapeutic antibody,Pembrolizumab, an anti-PD1 compound.
3 Performance of several commercial tools / automated platforms have been tested including digestion and capture kits and are compared to in-house protocols.
4 Further validation has been performed in human serum on a Sciex API6500+.
5 Method performance has been evaluated on a High Resolution instrumentTriple TOF (Sciex).

DEVELOPMENT
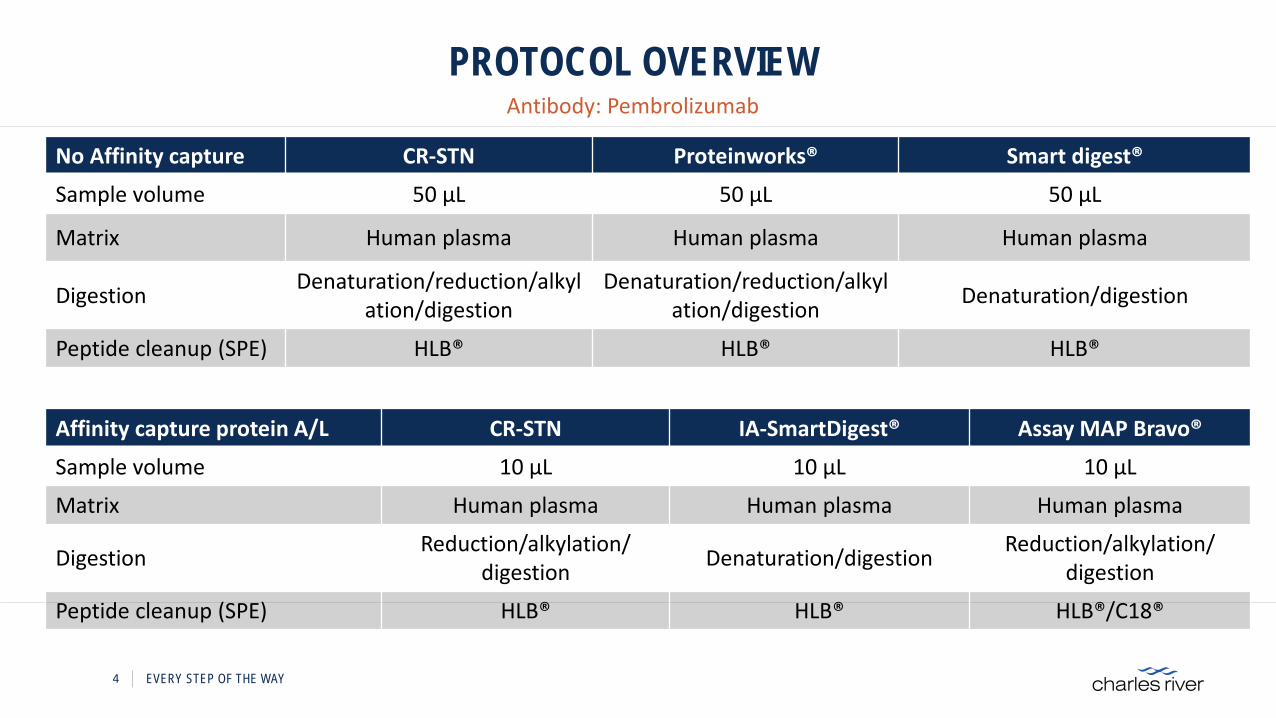
PROTOCOL OVERVIEWAntibody: Pembrolizumab
4 EVERY STEP OF THE WAY
No Affinity capture CR-STN Proteinworks® Smart digest®
Sample volume 50 µL 50 µL 50 µL
Matrix Human plasma Human plasma Human plasma
Digestion Denaturation/reduction/alkylation/digestion
Denaturation/reduction/alkylation/digestion Denaturation/digestion
Peptide cleanup (SPE) HLB® HLB® HLB®
Affinity capture protein A/L CR-STN IA-SmartDigest® Assay MAP Bravo®
Sample volume 10 µL 10 µL 10 µL
Matrix Human plasma Human plasma Human plasma
Digestion Reduction/alkylation/digestion Denaturation/digestion Reduction/alkylation/
digestion
Peptide cleanup (SPE) HLB® HLB® HLB®/C18®
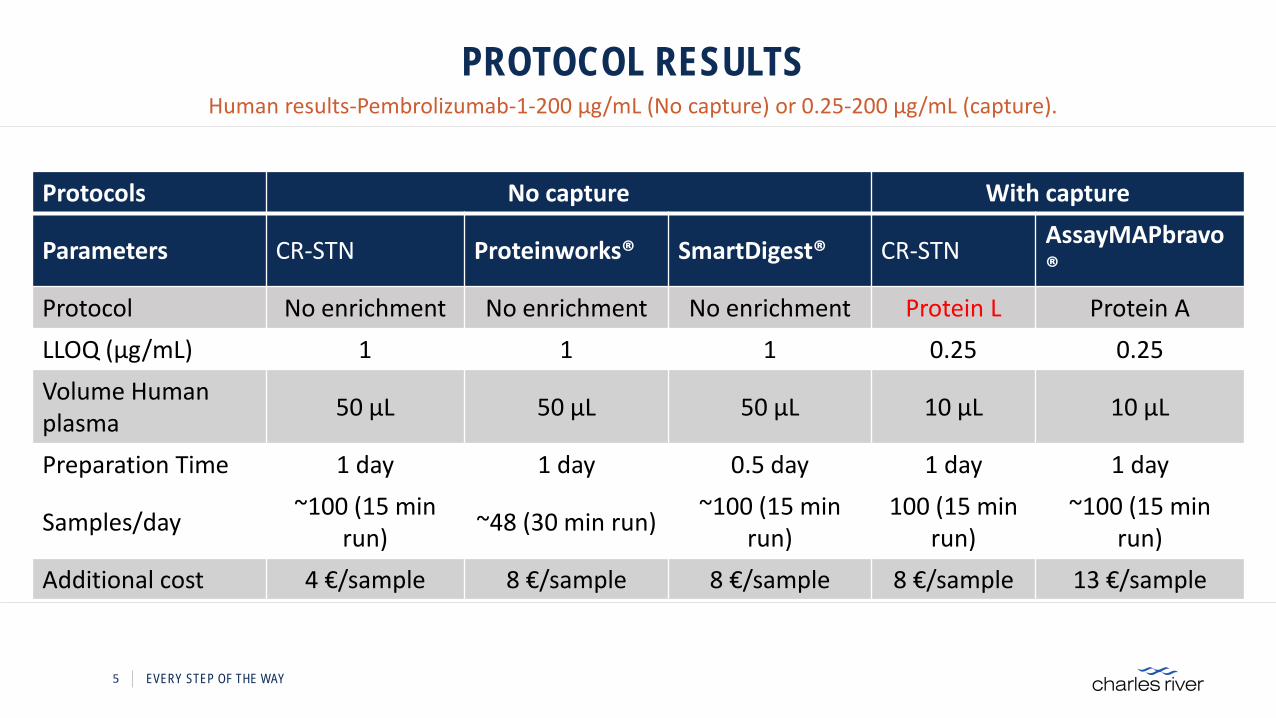
PROTOCOL RESULTS
5 EVERY STEP OF THE WAY
Protocols No capture With capture
Parameters CR-STN Proteinworks® SmartDigest® CR-STN AssayMAPbravo®
Protocol No enrichment No enrichment No enrichment Protein L Protein ALLOQ (µg/mL) 1 1 1 0.25 0.25Volume Human plasma 50 µL 50 µL 50 µL 10 µL 10 µL
Preparation Time 1 day 1 day 0.5 day 1 day 1 day
Samples/day ~100 (15 min run) ~48 (30 min run) ~100 (15 min
run)100 (15 min
run) ~100 (15 min
run) Additional cost 4 €/sample 8 €/sample 8 €/sample 8 €/sample 13 €/sample
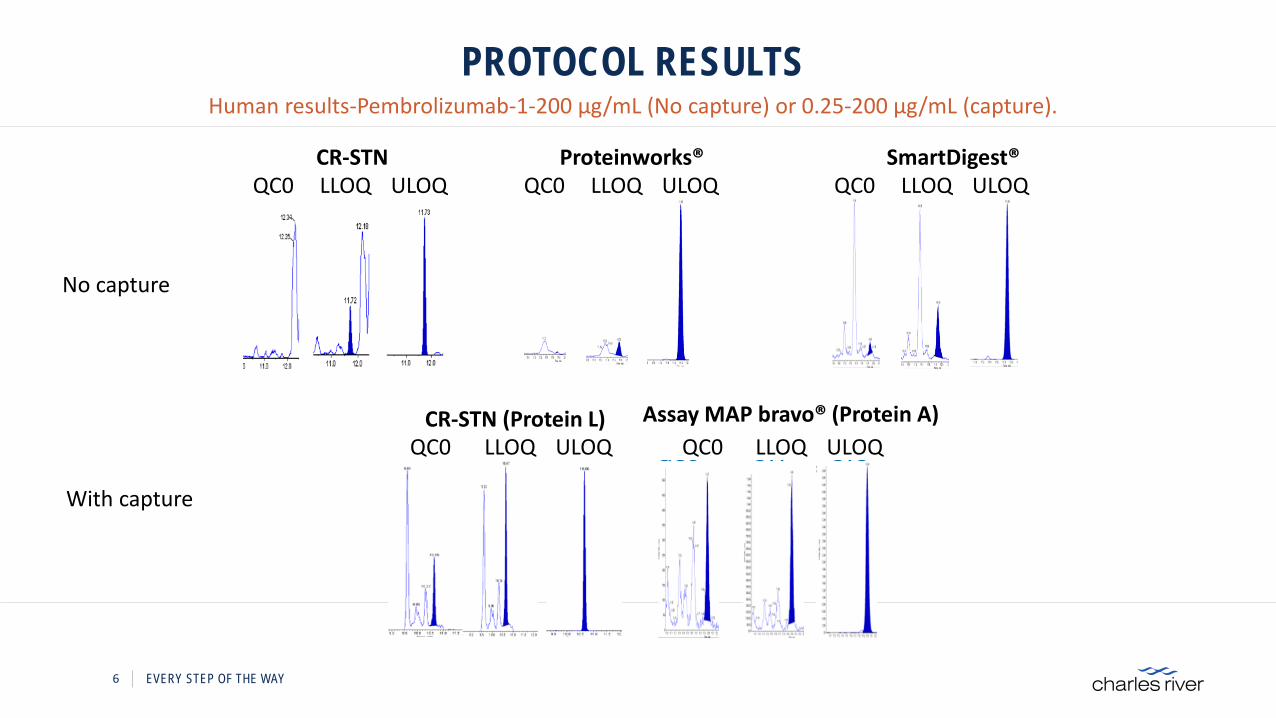
Human results-Pembrolizumab-1-200 µg/mL (No capture) or 0.25-200 µg/mL (capture).
PROTOCOL RESULTS
6 EVERY STEP OF THE WAY
CR-STN Proteinworks® SmartDigest®
CR-STN (Protein L) Assay MAP bravo® (Protein A)
QC0 LLOQ ULOQ QC0 LLOQ ULOQ QC0 LLOQ ULOQ
No capture
With capture
Human results-Pembrolizumab-1-200 µg/mL (No capture) or 0.25-200 µg/mL (capture).
QC0 LLOQ ULOQ QC0 LLOQ ULOQ
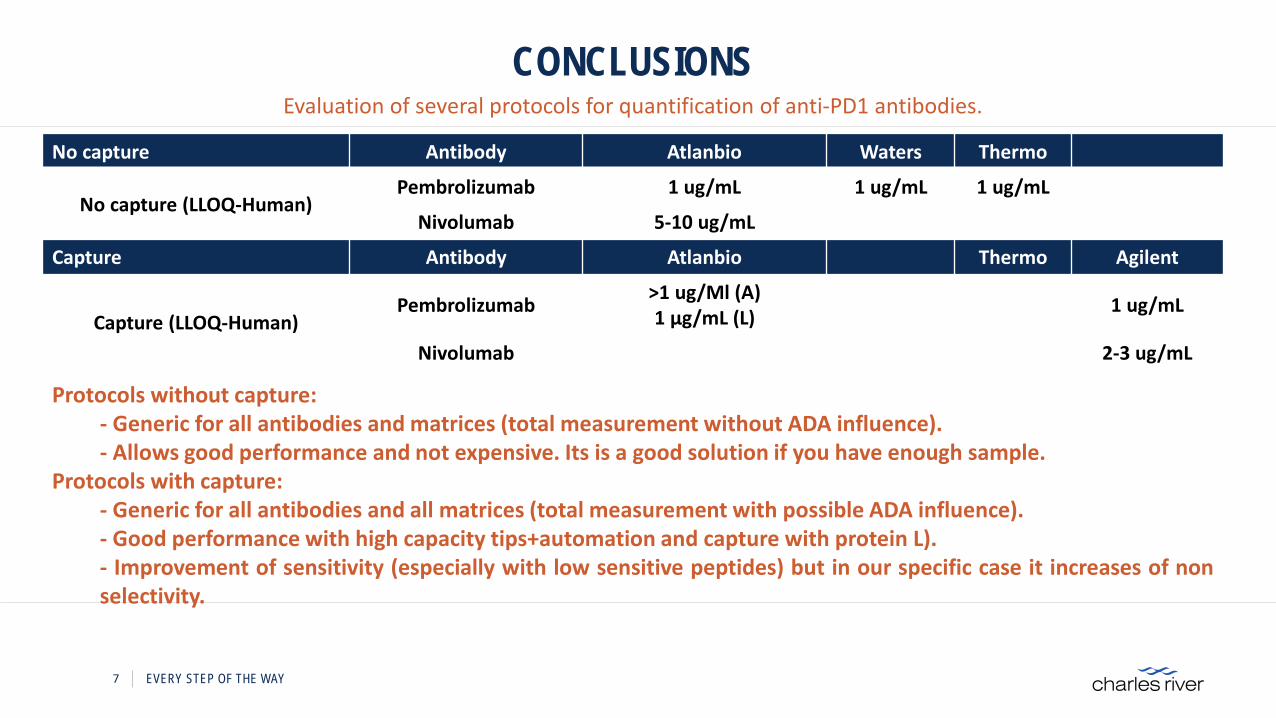
CONCLUSIONSEvaluation of several protocols for quantification of anti-PD1 antibodies.
7 EVERY STEP OF THE WAY
Protocols without capture:- Generic for all antibodies and matrices (total measurement without ADA influence).- Allows good performance and not expensive. Its is a good solution if you have enough sample.
Protocols with capture:- Generic for all antibodies and all matrices (total measurement with possible ADA influence).- Good performance with high capacity tips+automation and capture with protein L).- Improvement of sensitivity (especially with low sensitive peptides) but in our specific case it increases of nonselectivity.
No capture Antibody Atlanbio Waters Thermo
No capture (LLOQ-Human)Pembrolizumab 1 ug/mL 1 ug/mL 1 ug/mL
Nivolumab 5-10 ug/mL
Capture Antibody Atlanbio Thermo Agilent
Capture (LLOQ-Human)Pembrolizumab >1 ug/Ml (A)
1 µg/mL (L) 1 ug/mL
Nivolumab 2-3 ug/mL
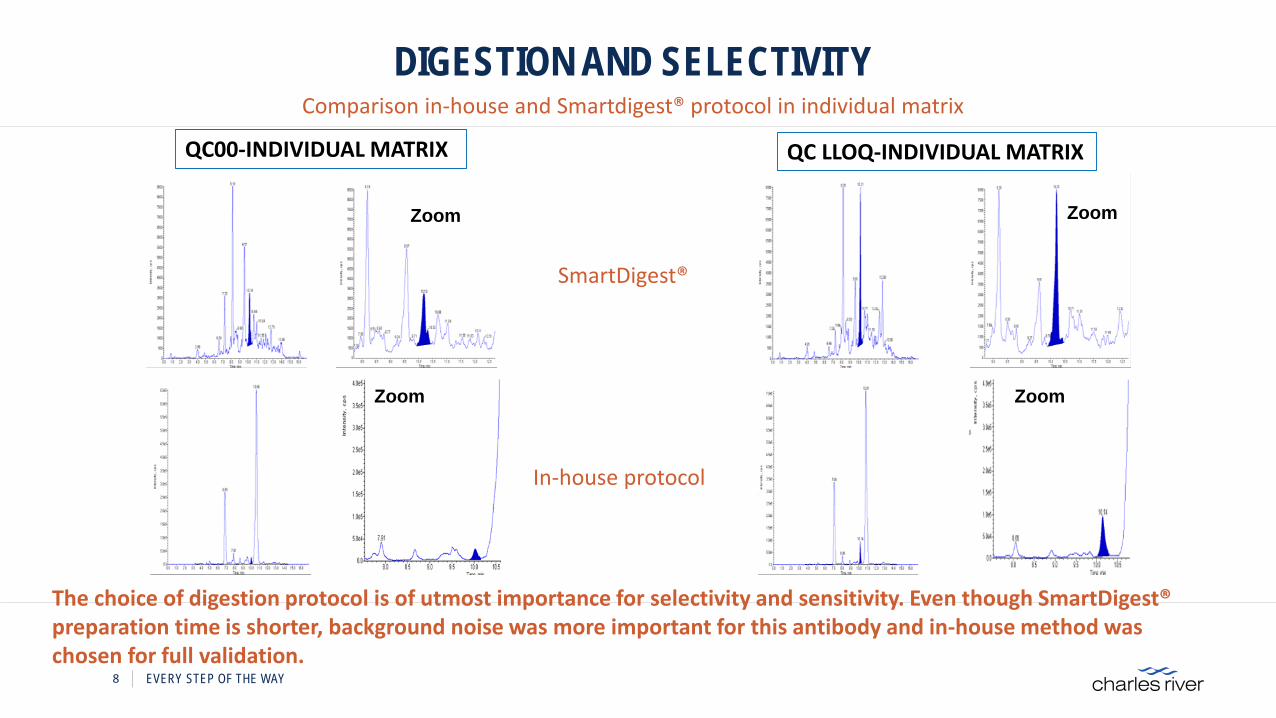
DIGESTION AND SELECTIVITYComparison in-house and Smartdigest® protocol in individual matrix
8 EVERY STEP OF THE WAY
QC00-INDIVIDUAL MATRIX QC LLOQ-INDIVIDUAL MATRIX
SmartDigest®
Zoom Zoom
In-house protocol
ZoomZoom
The choice of digestion protocol is of utmost importance for selectivity and sensitivity. Even though SmartDigest® preparation time is shorter, background noise was more important for this antibody and in-house method was chosen for full validation.

VALIDATION: TRIPLE QUADRIPOLE
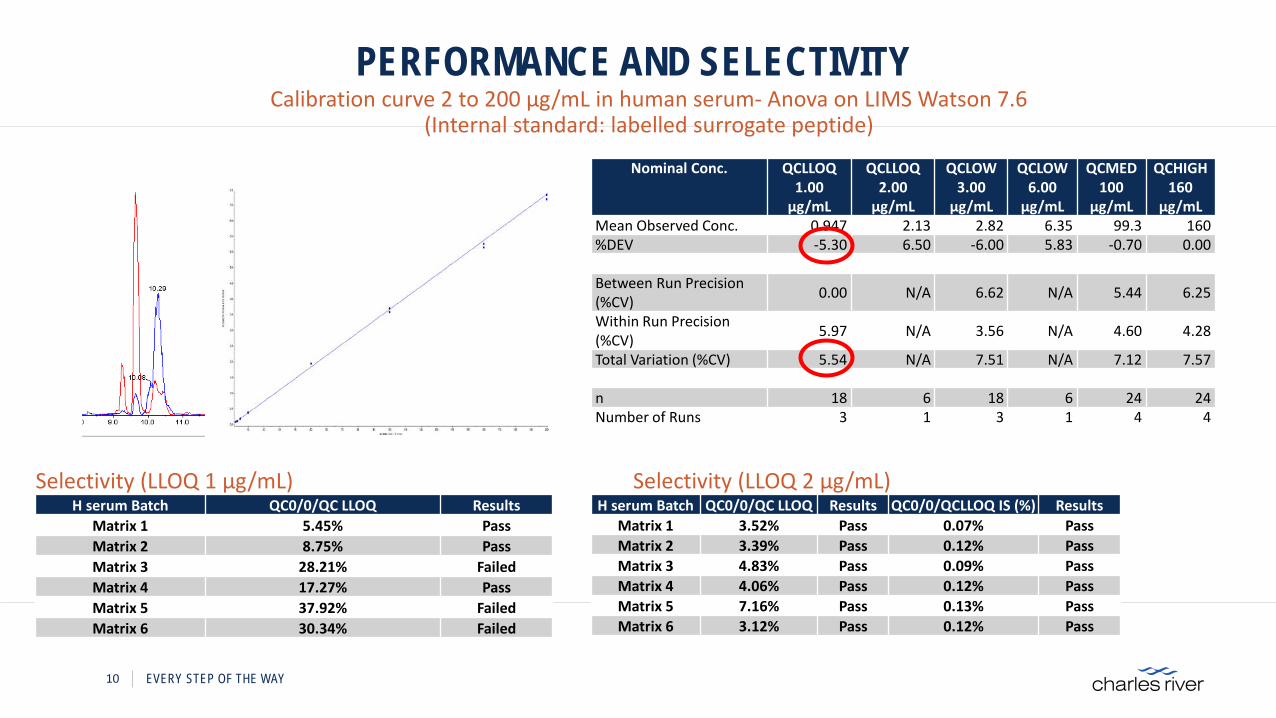
PERFORMANCE AND SELECTIVITY
10 EVERY STEP OF THE WAY
Nominal Conc. QCLLOQ 1.00
µg/mL
QCLLOQ 2.00
µg/mL
QCLOW 3.00
µg/mL
QCLOW 6.00
µg/mL
QCMED 100
µg/mL
QCHIGH 160
µg/mLMean Observed Conc. 0.947 2.13 2.82 6.35 99.3 160%DEV -5.30 6.50 -6.00 5.83 -0.70 0.00
Between Run Precision(%CV) 0.00 N/A 6.62 N/A 5.44 6.25
Within Run Precision(%CV) 5.97 N/A 3.56 N/A 4.60 4.28
Total Variation (%CV) 5.54 N/A 7.51 N/A 7.12 7.57
n 18 6 18 6 24 24Number of Runs 3 1 3 1 4 4
Selectivity (LLOQ 1 µg/mL)H serum Batch QC0/0/QC LLOQ Results
Matrix 1 5.45% PassMatrix 2 8.75% PassMatrix 3 28.21% FailedMatrix 4 17.27% PassMatrix 5 37.92% FailedMatrix 6 30.34% Failed
Selectivity (LLOQ 2 µg/mL)H serum Batch QC0/0/QC LLOQ Results QC0/0/QCLLOQ IS (%) Results
Matrix 1 3.52% Pass 0.07% PassMatrix 2 3.39% Pass 0.12% PassMatrix 3 4.83% Pass 0.09% PassMatrix 4 4.06% Pass 0.12% PassMatrix 5 7.16% Pass 0.13% PassMatrix 6 3.12% Pass 0.12% Pass
Calibration curve 2 to 200 µg/mL in human serum- Anova on LIMS Watson 7.6(Internal standard: labelled surrogate peptide)
STABILITY
11 EVERY STEP OF THE WAY
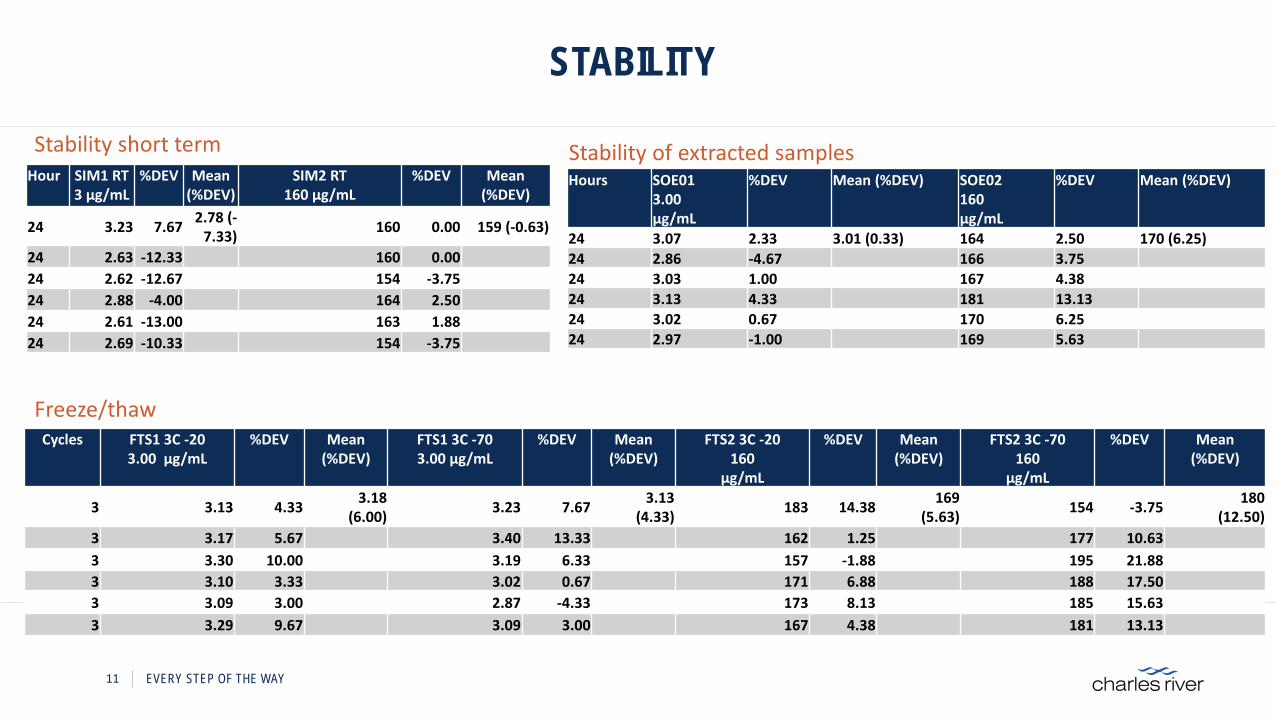
Hour SIM1 RT 3 µg/mL
%DEV Mean(%DEV)
SIM2 RT 160 µg/mL
%DEV Mean(%DEV)
24 3.23 7.67 2.78 (-7.33) 160 0.00 159 (-0.63)
24 2.63 -12.33 160 0.0024 2.62 -12.67 154 -3.7524 2.88 -4.00 164 2.5024 2.61 -13.00 163 1.8824 2.69 -10.33 154 -3.75
Hours SOE013.00 µg/mL
%DEV Mean (%DEV) SOE02160 µg/mL
%DEV Mean (%DEV)
24 3.07 2.33 3.01 (0.33) 164 2.50 170 (6.25)24 2.86 -4.67 166 3.7524 3.03 1.00 167 4.3824 3.13 4.33 181 13.1324 3.02 0.67 170 6.2524 2.97 -1.00 169 5.63
Stability of extracted samples Stability short term
Cycles FTS1 3C -20 3.00 µg/mL
%DEV Mean(%DEV)
FTS1 3C -70 3.00 µg/mL
%DEV Mean(%DEV)
FTS2 3C -20 160
µg/mL
%DEV Mean(%DEV)
FTS2 3C -70 160
µg/mL
%DEV Mean(%DEV)
3 3.13 4.33 3.18(6.00) 3.23 7.67 3.13
(4.33) 183 14.38 169(5.63) 154 -3.75 180
(12.50)3 3.17 5.67 3.40 13.33 162 1.25 177 10.633 3.30 10.00 3.19 6.33 157 -1.88 195 21.883 3.10 3.33 3.02 0.67 171 6.88 188 17.503 3.09 3.00 2.87 -4.33 173 8.13 185 15.633 3.29 9.67 3.09 3.00 167 4.38 181 13.13
Freeze/thaw
RECOVERY/MATRIX EFFECT
12 EVERY STEP OF THE WAY
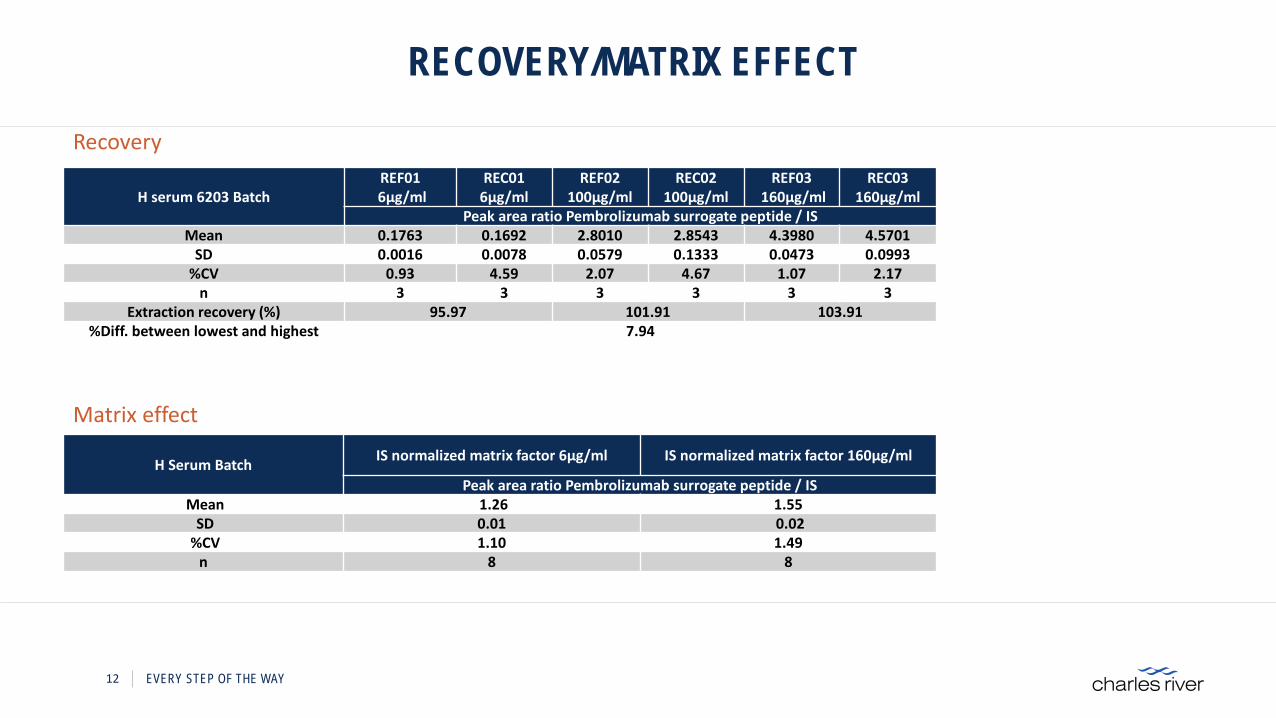
H serum 6203 BatchREF016µg/ml
REC01 6µg/ml
REF02 100µg/ml
REC02 100µg/ml
REF03160µg/ml
REC03 160µg/ml
Peak area ratio Pembrolizumab surrogate peptide / ISMean 0.1763 0.1692 2.8010 2.8543 4.3980 4.5701
SD 0.0016 0.0078 0.0579 0.1333 0.0473 0.0993%CV 0.93 4.59 2.07 4.67 1.07 2.17
n 3 3 3 3 3 3Extraction recovery (%) 95.97 101.91 103.91
%Diff. between lowest and highest 7.94
H Serum Batch IS normalized matrix factor 6µg/ml IS normalized matrix factor 160µg/ml
Peak area ratio Pembrolizumab surrogate peptide / ISMean 1.26 1.55
SD 0.01 0.02%CV 1.10 1.49
n 8 8
Recovery
Matrix effect

PERFORMANCE ON HIGH RES. INSTRUMENT
HIGH RESOLUTION INSTRUMENT: TRIPLE-TOF 6600 (SCIEX)
14 EVERY STEP OF THE WAY
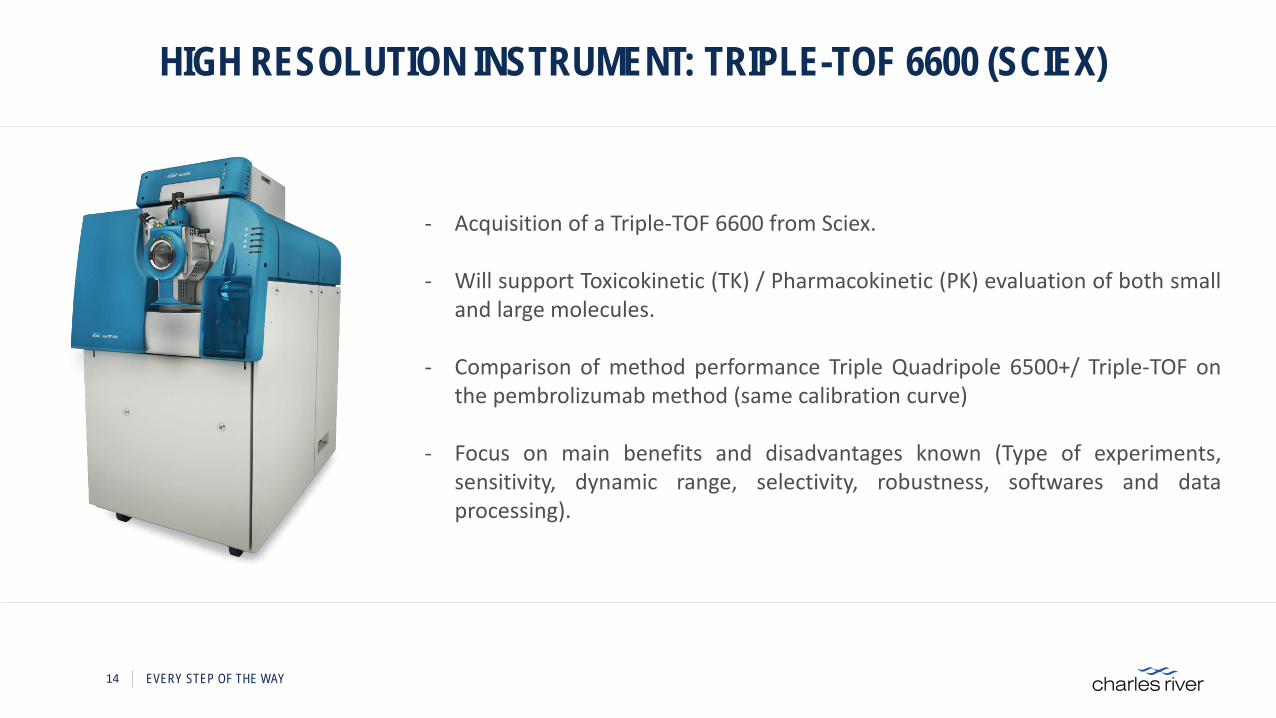
- Acquisition of a Triple-TOF 6600 from Sciex.
- Will support Toxicokinetic (TK) / Pharmacokinetic (PK) evaluation of both smalland large molecules.
- Comparison of method performance Triple Quadripole 6500+/ Triple-TOF onthe pembrolizumab method (same calibration curve)
- Focus on main benefits and disadvantages known (Type of experiments,sensitivity, dynamic range, selectivity, robustness, softwares and dataprocessing).
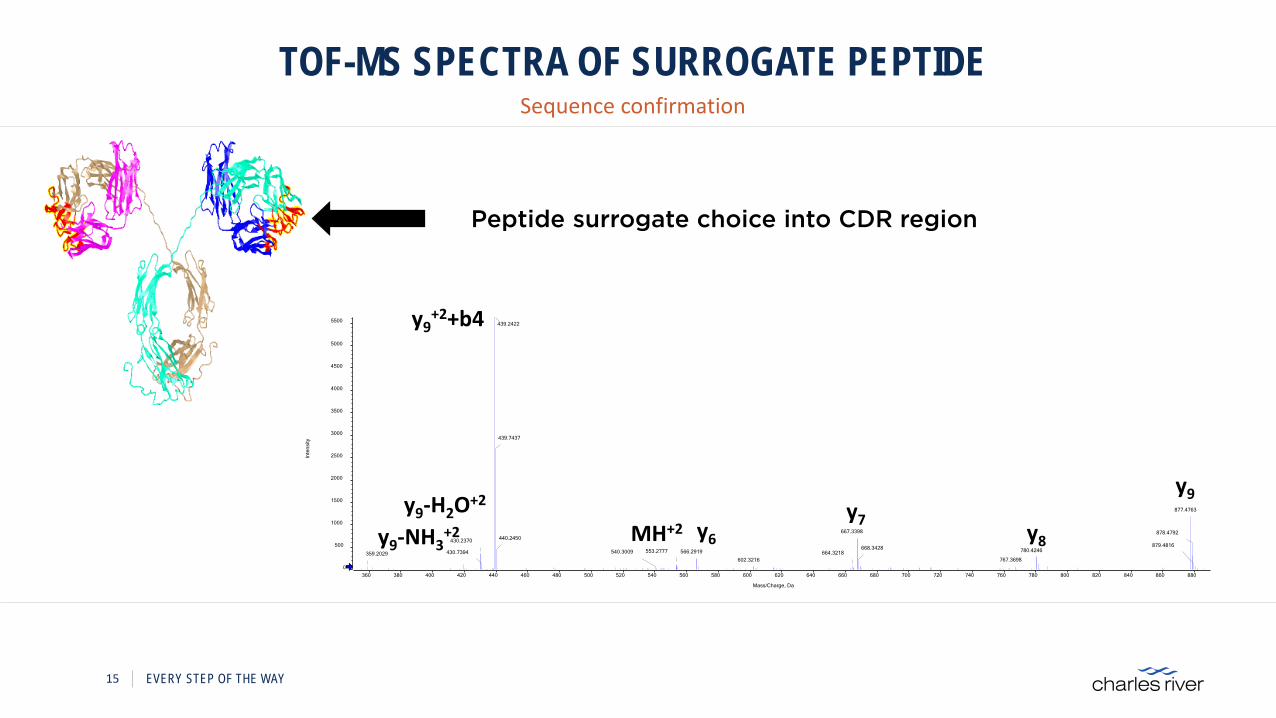
TOF-MS SPECTRA OF SURROGATE PEPTIDESequence confirmation
15 EVERY STEP OF THE WAY
360 380 400 420 440 460 480 500 520 540 560 580 600 620 640 660 680 700 720 740 760 780 800 820 840 860 880
Mass/Charge, Da
0
500
1000
1500
2000
2500
3000
3500
4000
4500
5000
5500
Inte
nsity
439.2422
439.7437
877.4763
667.3398 878.4792440.2450430.2370
780.4246566.2919668.3428 879.4816
430.7394 553.2777 664.3218767.3698
540.3009602.3216
359.2029
y9-H2O+2
y9-NH3+2
y9+2+b4
y7y6 y8
y9
MH+2
Peptide surrogate choice into CDR region
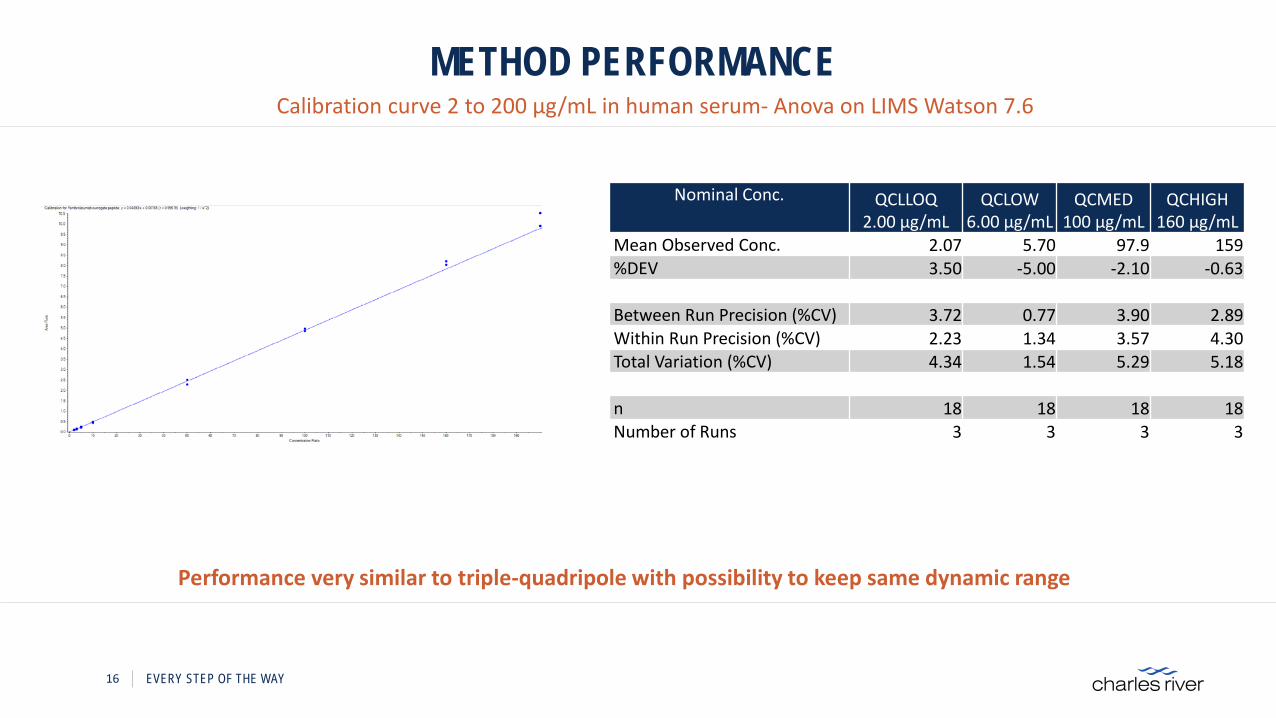
METHOD PERFORMANCECalibration curve 2 to 200 µg/mL in human serum- Anova on LIMS Watson 7.6
16 EVERY STEP OF THE WAY
Nominal Conc. QCLLOQ 2.00 µg/mL
QCLOW 6.00 µg/mL
QCMED 100 µg/mL
QCHIGH 160 µg/mL
Mean Observed Conc. 2.07 5.70 97.9 159%DEV 3.50 -5.00 -2.10 -0.63
Between Run Precision (%CV) 3.72 0.77 3.90 2.89Within Run Precision (%CV) 2.23 1.34 3.57 4.30Total Variation (%CV) 4.34 1.54 5.29 5.18
n 18 18 18 18Number of Runs 3 3 3 3
Performance very similar to triple-quadripole with possibility to keep same dynamic range
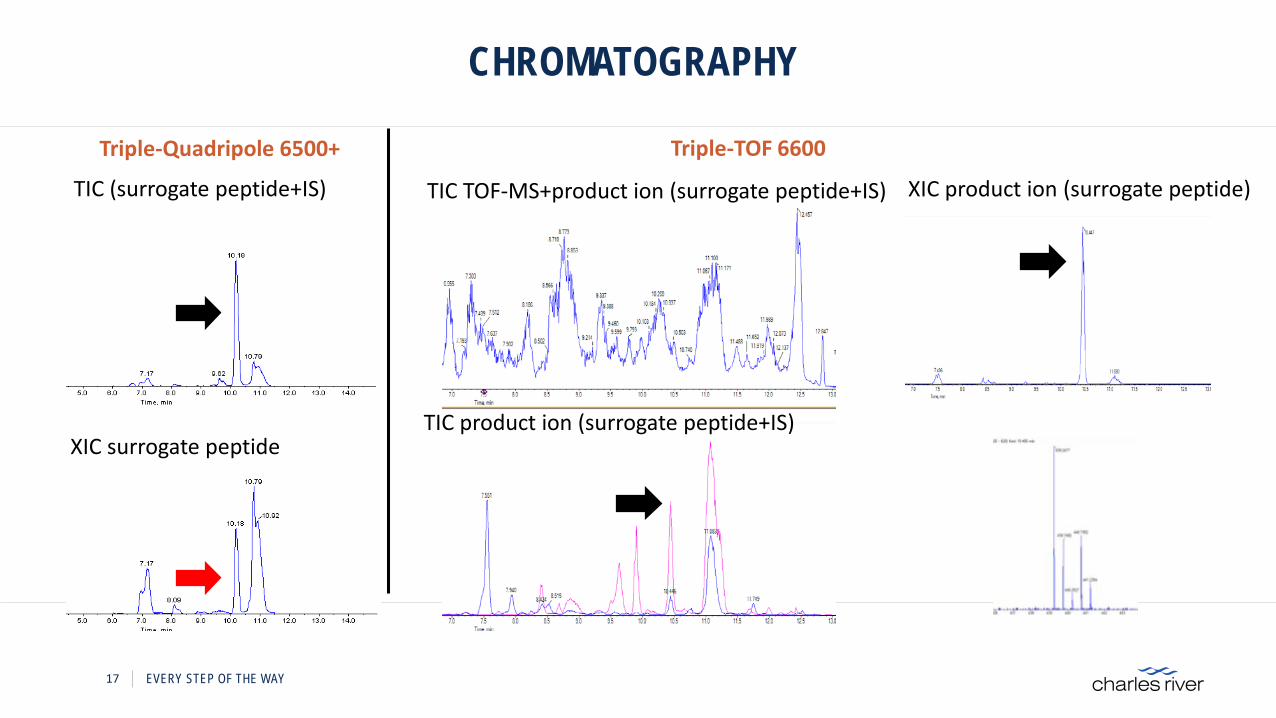
CHROMATOGRAPHY
17 EVERY STEP OF THE WAY
TIC TOF-MS+product ion (surrogate peptide+IS)
TIC product ion (surrogate peptide+IS)
XIC product ion (surrogate peptide)TIC (surrogate peptide+IS)
XIC surrogate peptide
Triple-Quadripole 6500+ Triple-TOF 6600
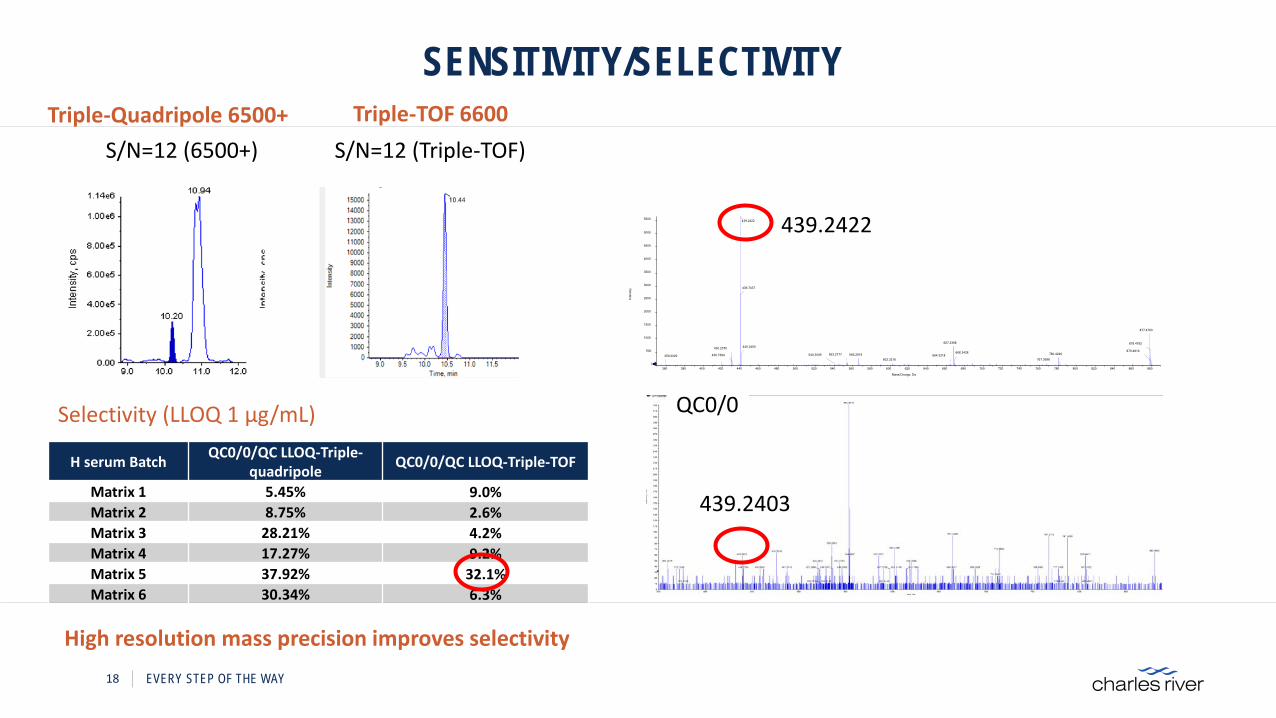
SENSITIVITY/SELECTIVITY
18 EVERY STEP OF THE WAY
S/N=12 (6500+) S/N=12 (Triple-TOF)
Selectivity (LLOQ 1 µg/mL)
H serum Batch QC0/0/QC LLOQ-Triple-quadripole QC0/0/QC LLOQ-Triple-TOF
Matrix 1 5.45% 9.0%Matrix 2 8.75% 2.6%Matrix 3 28.21% 4.2%Matrix 4 17.27% 9.2%Matrix 5 37.92% 32.1%Matrix 6 30.34% 6.3%
QC0/0
360 380 400 420 440 460 480 500 520 540 560 580 600 620 640 660 680 700 720 740 760 780 800 820 840 860 880
Mass/Charge, Da
0
500
1000
1500
2000
2500
3000
3500
4000
4500
5000
5500
Inte
nsity
439.2422
439.7437
877.4763
667.3398 878.4792440.2450430.2370
780.4246566.2919668.3428 879.4816
430.7394 553.2777 664.3218767.3698
540.3009602.3216
359.2029
439.2403
439.2422
High resolution mass precision improves selectivity
Triple-Quadripole 6500+ Triple-TOF 6600
0.00E+001.00E+042.00E+043.00E+044.00E+045.00E+046.00E+047.00E+048.00E+049.00E+04
1 2 3 4
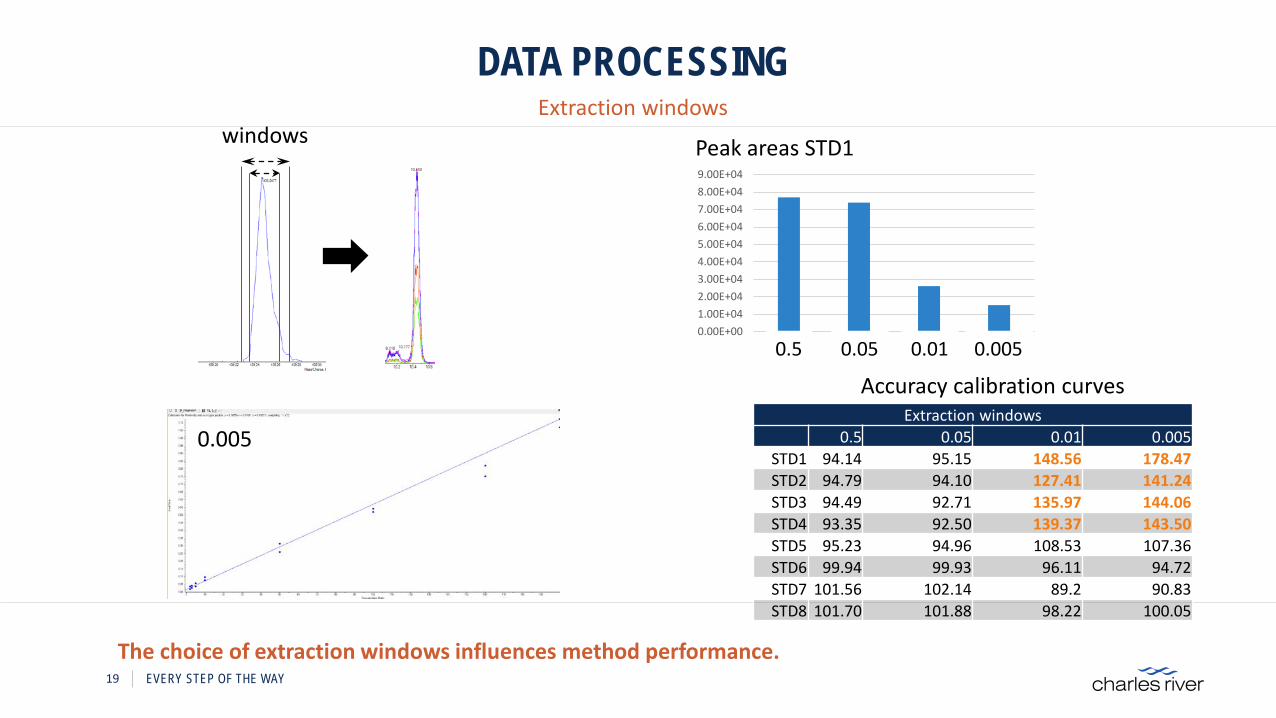
DATA PROCESSINGExtraction windows
19 EVERY STEP OF THE WAY
0.5 0.05 0.01 0.005
Extraction windows0.5 0.05 0.01 0.005
STD1 94.14 95.15 148.56 178.47STD2 94.79 94.10 127.41 141.24STD3 94.49 92.71 135.97 144.06STD4 93.35 92.50 139.37 143.50STD5 95.23 94.96 108.53 107.36STD6 99.94 99.93 96.11 94.72STD7 101.56 102.14 89.2 90.83STD8 101.70 101.88 98.22 100.05
0.005
Peak areas STD1
Accuracy calibration curves
The choice of extraction windows influences method performance.
windows
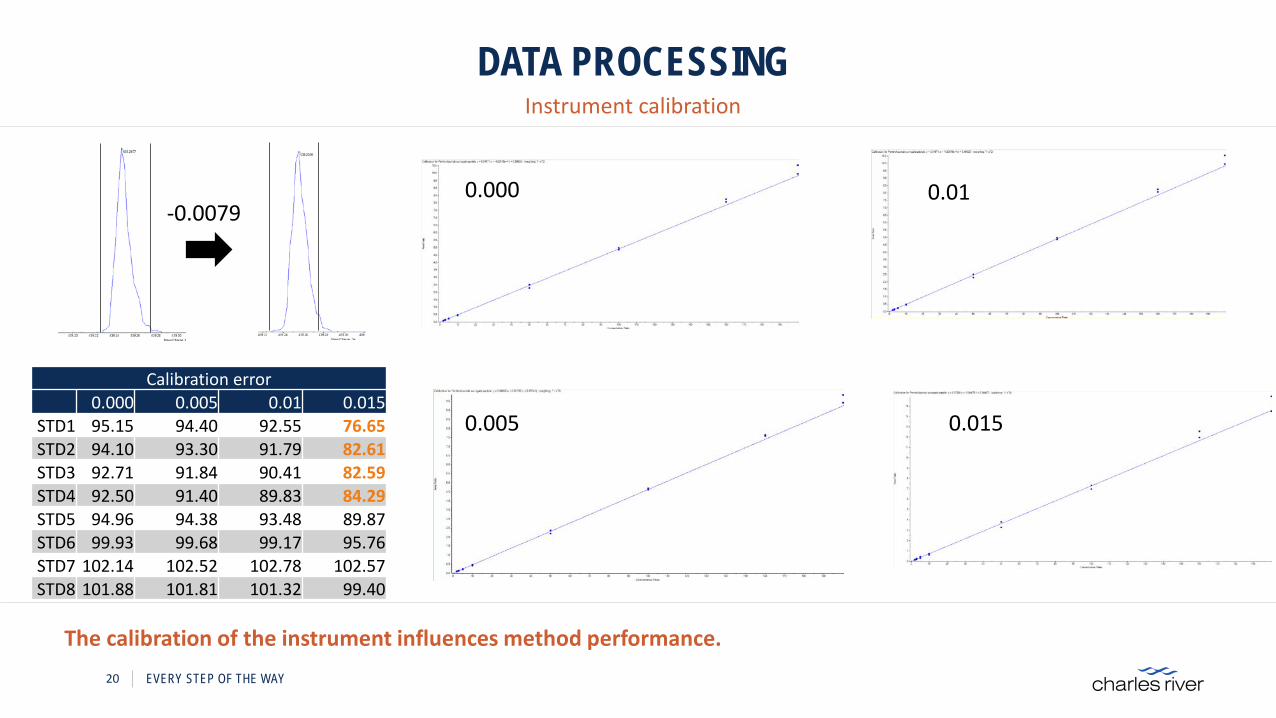
DATA PROCESSINGInstrument calibration
20 EVERY STEP OF THE WAY
Calibration error0.000 0.005 0.01 0.015
STD1 95.15 94.40 92.55 76.65STD2 94.10 93.30 91.79 82.61STD3 92.71 91.84 90.41 82.59STD4 92.50 91.40 89.83 84.29STD5 94.96 94.38 93.48 89.87STD6 99.93 99.68 99.17 95.76STD7 102.14 102.52 102.78 102.57STD8 101.88 101.81 101.32 99.40
0.000
0.005
0.01
0.015
The calibration of the instrument influences method performance.
-0.0079
CONCLUSIONS
21 EVERY STEP OF THE WAY
1 DEVELOPMENT AND VALIDATION OF PEMBROLIZUMAB IN HUMAN SERUM ON TRIPLE-QUADRIPOLE
2 SAME METHOD ON TRIPLE-TOF SHOWED SIMILAR SENSITIVITY AND IMPROVED SELECTIVITY MOST OF THE TIME
3 HIGH RESOLUTION INSTRUMENT ALLOWS RAPID CONFIRMATION OF PEPTIDE SEQUENCE AND INTERFERENCES
4 HIGH RESOLUTION INSTRUMENT NEEDS PERFECT CALIBRATION AND DATA PROCESSING CARE
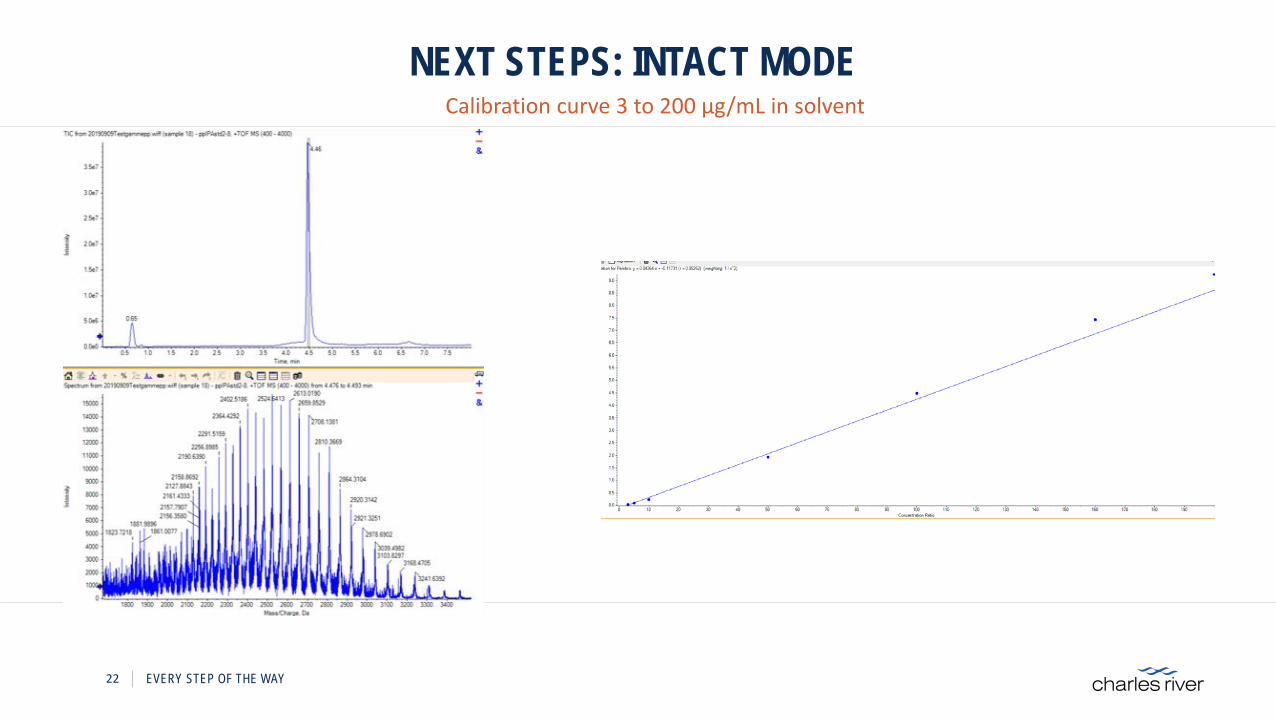
NEXT STEPS: INTACT MODE
22 EVERY STEP OF THE WAY
Calibration curve 3 to 200 µg/mL in solvent

ACKNOWLEDGMENTS
23 EVERY STEP OF THE WAY
CHARLES RIVER-SAINT NAZAIRE
Philippe Couerbe
Mark Warren
Benedicte Picot
Christelle Maccaigne
Ronan Pommereuil
THE SOLUTION FOR SMALL & LARGE MOLECULES
Xavier Rodriguez
Valerie Guilloteau
Serge Desmoulin
Shuai Wu
Alexander Schwahn
Yanaelle Le Pan
Denise Scherb
Kerstin Pohl
Yannick Thiriet