Embed Size (px)
Citation preview

CQ ALF4920.1
1
10
100
1,000*
IC 50
(µM
)
CQ ALF4920.01
0.1
1
10
100
1,000 *
IC 50
(µM
)Pena et al, Figure S1
a b

Supplementary Figure 1. ALF492 does not inhibit in vitro growth of P.
falciparum and P. berghei ANKA parasites.
Effect of ALF492 on in vitro cultures of P. falciparum clones 3D7 and P.
berghei ANKA GFP. Effectiveness of ALF492 was compared with chloroquine
(CQ). (A,B) IC50 of ALF492 in P. falciparum clone 3D7 and P. berghei ANKA
parasites in vitro cultures. Plots representative of 3-4 experiments for each set
of data.

Pena et al, Figure S2
Control ALF466 ALF492
Control ALF466 ALF492NI
I
I
a
b

Supplementary Figure 2. ALF492 reduced BBB disruption and
parenchymal brain hemorrhage in P. berghei ANKA-infected mice.
(A,B) Cranium and brains after BBB disruption assessment by Evans Blue
staining of non-infected (NI) versus P. berghei ANKA infected (control) and
infected ALF466-treated (I+ALF466) or ALF492-treated C57BL/6 mice
(I+ALF492). Images are representative of a total of 5 mice per group.

Supplemental Material
S1
1
A novel Carbon Monoxide-Releasing Molecule (CO-RM) fully protects mice
from Severe Malaria
Authors: Ana C. Pena, Nuno Penacho, Liliana Mancio-Silva, Rita Neres, João
D. Seixas, Afonso C. Fernandes, Carlos C. Romão, Maria M. Mota, Gonçalo
J. L. Bernardes and Ana Pamplona
Table of Contents
Page
IR Spectrum of ALF492 S2
1H-NMR Spectrum of ALF492 S3
Quantification of CO Release Using a Mb Assay S4
Protein Mass Spectrometry S6
General procedure for the reaction of Lysozyme with CORM-3
and Ru(CO)3Cl2(Gal-S-Me) ALF492
S7
References S10

Supplemental Material
S2
2
IR Spectrum of ALF492
Figure S1. IR spectrum (KBr) of RuCl2(CO)3(methyl β-D-
thiogalactopyranoside) (ALF492).

Supplemental Material
S3
3
1H-NMR Spectrum of ALF492
Figure S2. 1H-NMR spectrum of ALF492 in D2O.

Supplemental Material
S4
4
Quantitation of CO Release Using a Mb Assay (2)
A stock solution of Myoglobin (Mb) from equine skeletal muscle was prepared
by dissolving the protein in PBS7.4. From this solution aliquots were taken to
a cuvette (final concentration between 60-70 µM) and Na2S2O4 in PBS, pH 7.4
(10 mg/mL solution; 0.1% final concentration) was added to convert met-Mb
into deoxy-Mb. The reactions were done by mixing in the same cuvette and by
this order, the Mb stock solution, the Na2S2O4 solution, a calculated amount of
a solution of ALF492 and adding PBS to obtain the desired final volume.
Before adding the ALF492 solution a control spectrum was always acquired to
see if the protein had been properly reduced with sodium dithionite. Two
controls were done in duplicate, the negative control (0% CO-Mb), a deoxy-
Mb solution and the positive control (100% CO-Mb), obtained by bubbling
pure CO gas into the deoxy-Mb solution for 10-15 min. The experimental
spectrum was fitted as a weighted sum of the deoxy-Mb and the CO-Mb
spectra. Solver function in MS Excel was used to calculate the percentage of
CO-Mb by deconvolution of the spectra using both positive and negative
standards as controls. The absorbance spectrum was converted into a
percentage of CO-Mb and the amount of CO liberated was calculated as
molar equivalents of CO based on the initial concentration of ALF492.
Supplemental Material
S5
5
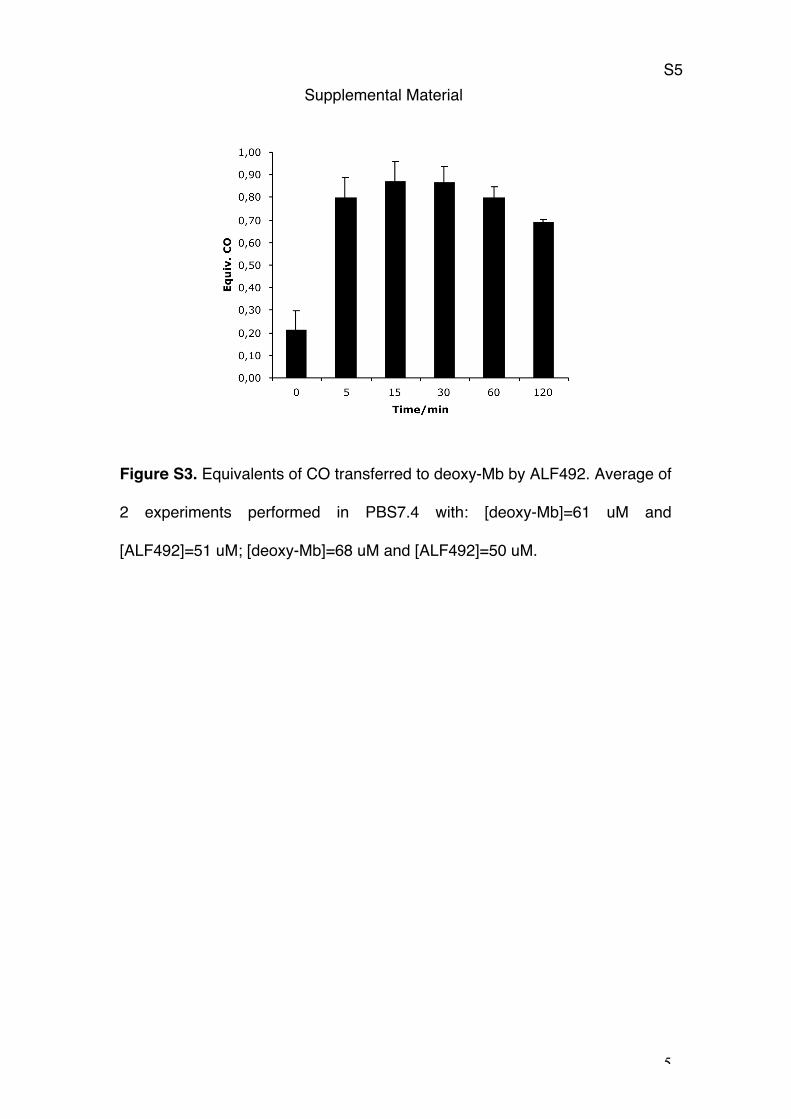
Figure S3. Equivalents of CO transferred to deoxy-Mb by ALF492. Average of
2 experiments performed in PBS7.4 with: [deoxy-Mb]=61 uM and
[ALF492]=51 uM; [deoxy-Mb]=68 uM and [ALF492]=50 uM.

Supplemental Material
S6
6
Protein Mass Spectrometry
Liquid chromatography-mass spectrometry (LC-MS) was performed on a
Micromass Quattro API instrument (ESI-TOF-MS) coupled to a Waters
Alliance 2795 HPLC using a MassPREP On-Line Desalting Cartridge.
Water:acetonitrile, 95:5 (solvent A) and acetonitrile (solvent B), with solvent A
containing 0.1% formic acid, were used as the mobile phase at a flow rate of
0.3 mL min-1. The gradient was programmed as follows: 95% A (0.5 min
isocratic) to 80% B after 1.5 min then isocratic for 1 min. After 4 min to 95% A
and then isocratic for 6 min. The electrospray source of LCT was operated
with a capillary voltage of 3.0 kV and a cone voltage of 20 V. Nitrogen was
used as the nebulizer and desolvation gas at a total flow of 600 L hr-1.
Proteins typically elute between 2 and 4 minutes using this method. Spectra
were calibrated using a calibration curve constructed from a minimum of 17
matched peaks from the multiply charged ion series of equine myoglobin,
which was also obtained at a cone voltage of 20 V. Total mass spectra were
reconstructed from the ion series using the MaxEnt algorithm preinstalled on
MassLynx software (v. 4.0 from Waters) according to manufacturerʼs
instructions.
Hen Egg White Lysozyme C(1) (PDB code 3b6l; UniProtKB/Swiss-Prot
code P00698)
Calculated average isotopic mass(4) = 14305.1
Supplemental Material
S7
7
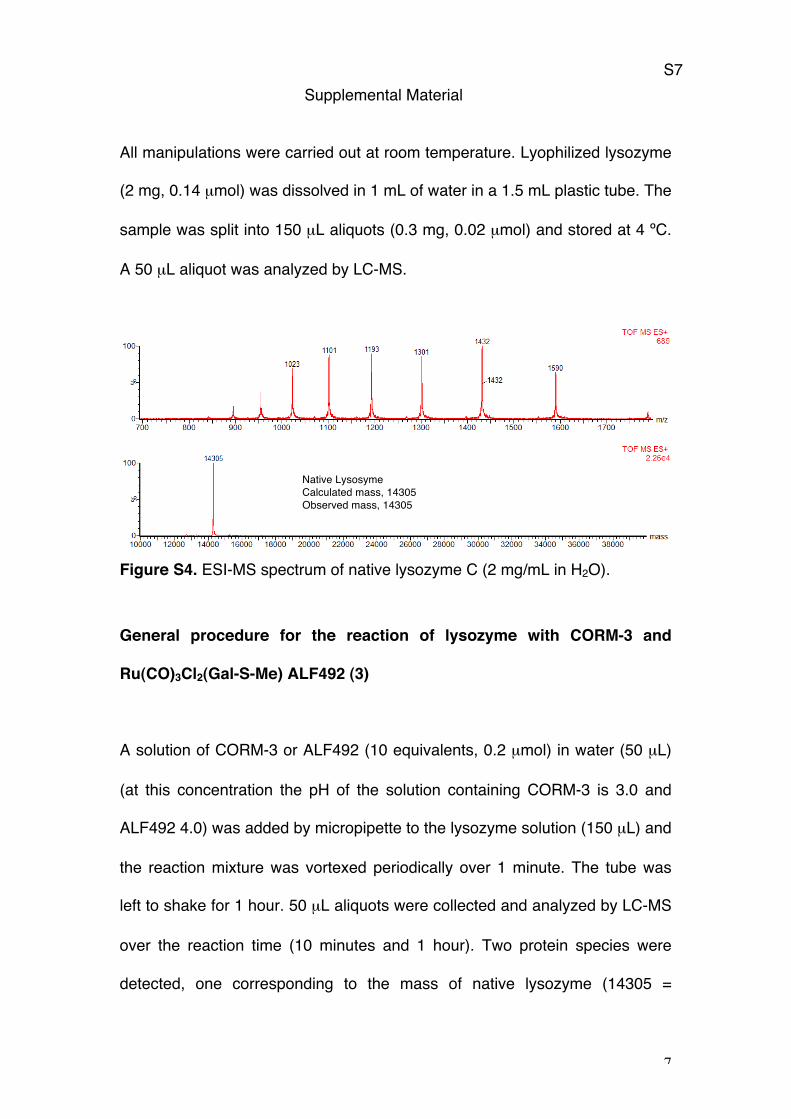
All manipulations were carried out at room temperature. Lyophilized lysozyme
(2 mg, 0.14 µmol) was dissolved in 1 mL of water in a 1.5 mL plastic tube. The
sample was split into 150 µL aliquots (0.3 mg, 0.02 µmol) and stored at 4 ºC.
A 50 µL aliquot was analyzed by LC-MS.
Figure S4. ESI-MS spectrum of native lysozyme C (2 mg/mL in H2O).
General procedure for the reaction of lysozyme with CORM-3 and
Ru(CO)3Cl2(Gal-S-Me) ALF492 (3)
A solution of CORM-3 or ALF492 (10 equivalents, 0.2 µmol) in water (50 µL)
(at this concentration the pH of the solution containing CORM-3 is 3.0 and
ALF492 4.0) was added by micropipette to the lysozyme solution (150 µL) and
the reaction mixture was vortexed periodically over 1 minute. The tube was
left to shake for 1 hour. 50 µL aliquots were collected and analyzed by LC-MS
over the reaction time (10 minutes and 1 hour). Two protein species were
detected, one corresponding to the mass of native lysozyme (14305 =
Native Lysosyme Calculated mass, 14305 Observed mass, 14305

Supplemental Material
S8
8
calculated mass) and another corresponding to the addition of a Ru(CO)2+ unit
(m/z 157.9) to the mass of lysozyme (14463 = calculated mass).
After 1 hour, small molecules were removed from the reaction mixture by
loading the sample onto a PD10 desalting column (GE Healthcare) previously
equilibrated with 10 column volumes of deionized water and eluting with 3.50
mL of deionized water. The collected sample (now diluted to 0.57 mg/mL) was
analyzed by LC-MS.
Figure S5. ESI-MS of lysozyme (2.0 mg/mL) when incubated with CORM-3
(10 equiv) in H2O for 10 minutes at room temperature.
Native Lysozyme Calculated mass, 14305 Observed mass, 14305
Calculated mass, 14463 Observed mass, 14462 ~ 15% conversion
Native Lysozyme Calculated mass, 14305 Observed mass, 14305
Calculated mass, 14463 Observed mass, 14462 ~ 50% conversion

Supplemental Material
S9
9
Figure S6. ESI-MS of lysozyme (2.0 mg/mL) when incubated with CORM-3
(10 equiv) in H2O for 1 hour at room temperature.
Figure S7. ESI-MS of lysozyme (2.0 mg/mL) when incubated with
Ru(CO)3Cl2(Gal-S-Me) (10 equiv) in H2O for 10 minutes at room temperature.
Figure S8. ESI MS of lysozyme (2.0 mg/mL) when incubated with
Ru(CO)3Cl2(Gal-S-Me) (10 equiv) in H2O for 1 hour at room temperature.
Native Lysozyme Calculated mass, 14305 Observed mass, 14304
Native Lysozyme Calculated mass, 14305 Observed mass, 14303
Calculated mass, 14463 Observed mass, 14460 ~ 10% conversion
Supplemental Material
S10
10
REFERENCES
1. Canfield, R. E. 1963. The Amino Acid Sequence of Egg White Lysozyme. J.
Biol. Chem. 238:2698-2707.
2. Clark, J. E., P. Naughton, S. Shurey, C. J. Green, T. R. Johnson, B. E.
Mann, R. Foresti, and R. Motterlini. 2003. Cardioprotective actions by a
water-soluble carbon monoxide-releasing molecule. Circ. Res. 93:e2-8.
3. Santos-Silva, T., A. Mukhopadhyay, J. D. Seixas, G. J. L. Bernardes, C.
C. Romão, and M. J. Romão. 2011. CORM-3 reactivity towards proteins:
The crystal structure of a Ru(II) dicarbonyl-lysozyme complex J. Am. Chem.
Soc. 133 1192-1195.
4. Veros, C. T., and N. J. Oldham. 2007. Quantitative determination of
lysozyme-ligand binding in the solution and gas phases by electrospray
ionisation mass spectrometry. Rapid Commun. Mass Spectrom. 21:3505-
3510.