Embed Size (px)
Citation preview

Penetration depth of photons inbiological tissues from hyperspectralimaging in shortwave infrared intransmission and reflection geometries
Hairong ZhangDaniel SaloDavid M. KimSergey KomarovYuan-Chuan TaiMikhail Y. Berezin
Hairong Zhang, Daniel Salo, David M. Kim, Sergey Komarov, Yuan-Chuan Tai, Mikhail Y. Berezin,“Penetration depth of photons in biological tissues from hyperspectral imaging in shortwaveinfrared in transmission and reflection geometries,” J. Biomed. Opt. 21(12), 126006 (2016),doi: 10.1117/1.JBO.21.12.126006.
Downloaded From: http://biomedicaloptics.spiedigitallibrary.org/ on 02/28/2017 Terms of Use: http://spiedigitallibrary.org/ss/termsofuse.aspx
Penetration depth of photons in biological tissuesfrom hyperspectral imaging in shortwave infraredin transmission and reflection geometries
Hairong Zhang, Daniel Salo, David M. Kim, Sergey Komarov, Yuan-Chuan Tai, and Mikhail Y. Berezin*Washington University School of Medicine, Department of Radiology, St. Louis, Missouri, United States
Abstract. Measurement of photon penetration in biological tissues is a central theme in optical imaging. A greatnumber of endogenous tissue factors such as absorption, scattering, and anisotropy affect the path of photons intissue, making it difficult to predict the penetration depth at different wavelengths. Traditional studies evaluatingphoton penetration at different wavelengths are focused on tissue spectroscopy that does not take into accountthe heterogeneity within the sample. This is especially critical in shortwave infrared where the individual vibra-tion-based absorption properties of the tissue molecules are affected by nearby tissue components. We haveexplored the depth penetration in biological tissues from 900 to 1650 nm using Monte–Carlo simulation anda hyperspectral imaging system with Michelson spatial contrast as a metric of light penetration. Chromaticaberration-free hyperspectral images in transmission and reflection geometries were collected with a spectralresolution of 5.27 nm and a total acquisition time of 3 min. Relatively short recording time minimized artifactsfrom sample drying. Results from both transmission and reflection geometries consistently revealed that thehighest spatial contrast in the wavelength range for deep tissue lies within 1300 to 1375 nm; however, in heavilypigmented tissue such as the liver, the range 1550 to 1600 nm is also prominent. © 2016 Society of Photo-Optical
Instrumentation Engineers (SPIE) [DOI: 10.1117/1.JBO.21.12.126006]
Keywords: shortwave infrared; extended NIR; deep tissue imaging; hyperspectral imaging; Michelson contrast; Monte–Carlosimulation.
Paper 160534PRR received Aug. 3, 2016; accepted for publication Nov. 11, 2016; published online Dec. 8, 2016.
1 Introduction
Achieving deep photon penetration is one of the main objectives
for in vivo optical imaging and treatment with light-based thera-
pies. The use of visible light is convenient but only feasible for
skin and other directly accessible tissues (i.e., esophagus and
colon1) and is not suitable for deep tissue penetration due to the
presence of strong absorption from endogenous chromophores
(blood)2 and scattering from tissue components. Near-infrared
(NIR) light is used to alleviate this scattering effect and is more
suitable for deep tissue samples. Two optical windows exist
within the NIR range: the first window ranges from 650 to
950 nm and is known as the traditional NIR or optical window
I, and the second window ranges from 950 to 2200 nm and is
referred to as shortwave infrared (SWIR), extended NIR, or opti-
cal windows II to IV.3,4 While photon penetration in the tradi-
tional NIR range is well studied5–7 due to the wide availability of
silicon-type detectors, light sources, and optical elements, the
field of SWIR is relatively less explored and demands different
types of instrumentation.8,9 Recent rapid developments in SWIR
optics, and especially efficient InGaAs sensors between 900 and
1650 nm and SWIR lasers, have made this spectral range attrac-
tive for a variety of deep tissue therapeutic applications10 and
deep tissue imaging.11,12
Recent studies have confirmed the feasibility of deep
tissue imaging beyond 1000 nm11 with different contrast agents
that emit in this wavelength such as quantum dots,13,14 carbon
nanotubes,15–17 and other emitters, including small molecules.18–20
A persistent challenge in SWIR imaging is identifying a set
of wavelengths where tissue has the highest transparency.
The answer for this question would allow the development of
deeper imaging techniques with optimized light penetration and
encourage the development of contrast agents that are optically
active at the specifically identified (absorption and emission)
wavelengths. The prediction of transparency at different wave-
lengths is complicated due to the contributions of several param-
eters, including Mie scattering,7 variations in absorption in
accordance to the Beer–Lambert law, and anisotropy of tissue
components.21 This complexity aggregates the demand for the
experimental evidence of tissue transparency and the wave-
length–depth relationship in SWIR.
Traditional studies evaluating photon penetration at different
wavelengths have mostly focused on tissue spectroscopy that
does not take into account the heterogeneity within the sample.
Addressing heterogeneity is especially critical in SWIR where
the individual vibration-based absorption properties of the tissue
molecules such as water and lipids are affected by ions and
nearby tissue components.22
We have previously demonstrated with the use of tissue-
mimicking phantoms (intralipid/India ink) that the wave-
length-depth relationship can be evaluated via hyperspectral
approaches using quantitative measurements of spatial Michelson
contrast as a function of wavelength and depth.23 We also dem-
onstrated that at low thicknesses of the phantom a reasonable con-
trast of the objects can be achieved at any wavelength between
*Address all correspondence to: Mikhail Y. Berezin, E-mail: [email protected] 1083-3668/2016/$25.00 © 2016 SPIE
Journal of Biomedical Optics 126006-1 December 2016 • Vol. 21(12)
Journal of Biomedical Optics 21(12), 126006 (December 2016)
Downloaded From: http://biomedicaloptics.spiedigitallibrary.org/ on 02/28/2017 Terms of Use: http://spiedigitallibrary.org/ss/termsofuse.aspx

700 and 1400 nm and between 1500 and 1600 nm in a trans-
mission geometry.23 Such contrast can be achieved mostly
between 1300 and 1350 nm at larger thicknesses. This previous
study relied on a point-to-point scanning process that was inher-
ently slow (up to 30 min for a scan), which prevented the inves-
tigation of a freshly excised, unfixed biological tissue. In this
study, we have modified the hyperspectral imaging (HSI) sys-
tem to enhance image acquisition speed. With the new system,
we were able to investigate the tissue in 3 min or less, thus pre-
venting imaging from many artifacts such as drying while main-
taining high spatial and spectral resolution.
The goal of this work was to identify the wavelengths in
SWIR at which the tissue has the highest transparency; there-
fore, we selected Michelson spatial contrast as a metric of light
penetration. First, we designed and calibrated an HSI micro-
scope to generate images free of chromatic aberrations. Second,
we optimized the imaging conditions to record the data within
3 min to minimize the destruction of the biological tissue. We
then investigated contrast as a function of the wavelength in
phantoms and several types of tissue in transmission and reflec-
tion geometry. We also performed simulation studies to validate
our experimental data.
2 Materials and Methods
2.1 Instrument Design
The design of the HSI system shown in Fig. 1 featured an SWIR
sensitive two-dimensional (2-D) charge-coupled device (CCD)
InGaAs camera NIRvana 640 (Princeton Instruments) for image
acquisition mounted on the top of an Olympus BX51 micro-
scope equipped with a triaxis PC-controlled stage (Marzhauser
Wetzlar). A standard 100-W halogen microscope lamp (Olympus)
with the IR filter removed was placed in front of the entrance
imaging spectrograph iHR320 (Horiba Inc.) as the light source.
Continuous broadband light passed through a 600-grove∕mm,
blazed at 1000 nm grating, which dispersed light from 900 to
1650 nm into narrow bands. Narrow-band light was further
delivered to the sample through a liquid light guide (Newport
Corp.) with high transmission in the 420 to 2000 nm range.
The design also included a calibration setup composed from
a xenon lamp, double grating monochromator, liquid nitro-
gen-cooled InGaAs diode array CCD camera Symphony II, and
a cuvette holder with a standard made from Spectralon with high
reflection (all components from Horiba Inc.).
Both transmission and reflection geometries were used for
data acquisition. In the transmission geometry, the light deliv-
ered by the light guide passed through a microscope condenser
and onto the sample. In the reflection geometry, the light deliv-
ered by the light guide projected onto the sample passed through
a beamsplitter and a chromatic aberration-free 15× reflective
objective (Beck) attached to the microscope through a set of
adapters (Thorlabs) (Fig. 1). The transmitted or reflected light
was collected with the same objective and channeled into the
2-D camera. Integration time, slit size, and wavelength incre-
ments were set in the FluorEssence software (Horiba). Image
acquisition was collected through the LightField software
(Princeton Instruments) and was synchronized with the wave-
length selection.
2.2 Objective Selection for ChromaticAberration-Free Imaging
The imaging system was corrected for chromatic aberrations,
which is a known problem in HSI.24 In the visible and NIR
ranges, chromatically corrected objectives such as apochromats
can mitigate the image distortion caused by chromatic aberra-
tions. These objectives accommodate low dispersion glass ele-
ments to neutralize the difference in refracting indices at variable
wavelengths; however, apochromatic objectives fully corrected
in SWIR are not commercially available. One noticeable excep-
tion exists and is collectively known as a reflective objective.
These types of objectives, first developed by Schwarzchild
(circa 1904),25 are based on a mirror system with no glass ele-
ments. Due to the all-reflecting optics, the objectives are chro-
matic aberration-free in the very broad spectral range from UV
Fig. 1 Schematic of the HSI system for contrast measurement in phantoms in the spectral range 900 to1650 nm.
Journal of Biomedical Optics 126006-2 December 2016 • Vol. 21(12)
Zhang et al.: Penetration depth of photons in biological tissues from hyperspectral imaging in shortwave infrared. . .
Downloaded From: http://biomedicaloptics.spiedigitallibrary.org/ on 02/28/2017 Terms of Use: http://spiedigitallibrary.org/ss/termsofuse.aspx

(<300 nm) nm to IR (>10 μm). In the current work, we used
a 15× reflective objective (working distance 23.5 mm and
NA ¼ 0.28, Beck) for all image acquisitions.
2.3 Spectral Calibration and Spectral Resolution
Spectral calibration was performed to ensure the correct spectral
response of the HSI system. First, the detector Symphony II was
calibrated using a neodymium doped glass that emits at 1052 nm
when excited at 575 nm. Second, a xenon lamp emission was
recorded using the calibrated Symphony II detector with a high
spectral resolution (increment 0.25 nm, integration time 5 ms,
emission slit 1 nm) to set the position of a reference peak at
994 nm (Fig. 2). Finally, the HSI was spectrally calibrated
with a 994-nm emission line from the xenon lamp (increment
1.0 nm, emission slit 1 nm).
Spectral resolution has an important effect on HSI perfor-
mance, and determining optimal resolution is critical in HSI
measurements. Low spectral resolution (>20 nm bandwidth)
limits the ability of the method to resolve closely spaced spectral
features, while high spectral resolution (<3 nm) requires signifi-
cant increases in the integration time, which lowers output.
Spectral resolution in the presented HSI system was adjusted
by the width of the slits in the monochromator and the selection
of the wavelength increment. The influence of both parameters
on the broadening of the signal measured as full-width-at-half-
maximum (FWHM) from a narrow linewidth 1064 nm laser is
illustrated in Figs. 3 and 4. The results demonstrate a strong
outcome of the slit width on FWHM, with fourfold FWHM
increase from 1 nm slit to 8 nm (Fig. 3). The effect of the wave-
length increment was somewhat less significant (1.5-fold
increase FWHM from 1 nm increment to 4 nm, Fig. 4). The
optimized image acquisition parameters were set to 5 nm slit
and 5.27 nm increment.
2.4 Sample Preparation
The phantom’s stock solution was composed of 18.75 mL intra-
lipid (20% fat emulsion, Fresenius Kabi), 0.62 mL India ink (2%
in water, Speedball), and 300 mL water.26 Total amount of lipid
was 1.1 w. %, which is similar to the amount typically seen in
freshly excised chicken breast (0.98� 0.23%).27 The absorption
coefficients for individual components such as water and lipids
in SWIR have been measured in our previous work.3 Based on
the literature data, the μa values of intralipid phantoms are within
0.15 to 0.17 at 1100 nm and depend strongly on the wavelength
following the shape of the absorption spectra.28 The values μ 0a
decrease monotonically on average from 4 cm−1 at 1100 nm to
1 cm−1 at 1700 nm.
The phantom assembly utilized a grid made from a stainless
steel card (Fotofab Inc.) perforated with evenly spaced holes of
about 230 μm diameter attached beneath a plastic polystyrene
Fig. 2 Spectral profiles of the xenon lamp as measured by the high-resolution calibrated spectrophotometer and HSI. Similar appearanceof the spectra collected from the imager and from the high-resolutionspectrophotometer indicated spectrally calibrated HSI system andalso demonstrate sufficient spectral resolution. All peaks are within�2 nm of each other.
Fig. 3 Effect of slits on the HSI spectral resolution. FWHM of the recorded laser line at 1064 nm showslinear broadening of the signal at larger slits. Laser line (true line) was recorded with a high spectralresolution spectrophotometer. The spectra are normalized and plotted with an offset.
Journal of Biomedical Optics 126006-3 December 2016 • Vol. 21(12)
Zhang et al.: Penetration depth of photons in biological tissues from hyperspectral imaging in shortwave infrared. . .
Downloaded From: http://biomedicaloptics.spiedigitallibrary.org/ on 02/28/2017 Terms of Use: http://spiedigitallibrary.org/ss/termsofuse.aspx

petri-dish (35 mm × 10 mm) that was filled with the phantom
stock solution (Fig. 5). The stock ranged from about 2 to
7 mL, corresponding to depths of 3.0 to 6.5 mm in the middle
of the petri-dish, where the meniscus effect is minimal.
2.5 Tissue Preparation
Fresh chicken tissues including thigh, breast, and liver were
obtained from a local supermarket (Whole Foods, St. Louis,
Missouri), cut in small pieces and placed between two 25-mm-
diameter cover glasses (Deckglaser) to ensure uniform distribu-
tion of thickness and prevent from drying. The thickness of the
tissue was determined by measuring the distance between the
two cover glasses using a digital caliper. The tissue was then
placed on a 230-μm-diameter grid for contrast measurement.
2.6 Data Acquisition
The focus was adjusted manually prior to image sequence
acquisition using a PC-controlled stage (Marzhauser Wetzlar) at
1300 nm to achieve the best visual contrast of the grid. A num-
ber of 180 collected frames corresponded to the spectral reso-
lution of 5.27 nm. Dispersed light was coupled with a light
guide with the distal end connected to either a transmission or
a reflection port of the microscope. The power of the lamp, the
slit width on the spectrograph, and the integration time of the
camera for each image captured were optimized to achieve
an adequate signal strength (>1000 counts, with the noise
level <100 counts). Using these optimized conditions, the inte-
gration time was set to 1 s, which brought the total time of
recording to 3 min.
2.7 Data Processing
The set of collected frames were analyzed with ImageJ using the
OpenSPE extension for direct export of frames. Regions of inter-
est (ROIs) in the light and dark areas in the image (holes or the
metal parts) were selected as shown in Fig. 6. Approximate
maximum and minimum light intensities were obtained for each
frame (wavelength) by averaging the light intensities in the ROIs
selected with the plot Z-axis profile function. The Michelson
contrast29 was then calculated according
EQ-TARGET;temp:intralink-;e001;326;197contrastðλÞ ¼ ðIlight − IdarkÞ∕ðIlight þ IdarkÞ; (1)
where Ilight and Idark correspond to the average light and dark
intensities of the selected areas. A contrast value of 0 corre-
sponds to no contrast and a contrast value of 1 corresponds to
maximal contrast.
3 Results and Discussion
HSI-SWIR is a relatively established technique. Historically,
satellite-based remote sensing was the first large-scale applica-
tion of HSI-SWIR.30 In the last decade, with the advances in
Fig. 4 Effect of the wavelength increment on the HSI spectral resolution. FWHM of the recorded laserline at 1064 nm shows broadening of the signal at larger increments. The outlier at 5 nm was due to lowsampling rate below Nyquist value. The spectra are normalized and plotted with an offset.
Fig. 5 (a) Phantom/tissue setup (closed-up view), (b) phantom/tissue placement, (c) principle of phan-tom and tissue setup for contrast measurements with hyperspectral imaging showing transmission(A and B) and reflection (C) mode.
Journal of Biomedical Optics 126006-4 December 2016 • Vol. 21(12)
Zhang et al.: Penetration depth of photons in biological tissues from hyperspectral imaging in shortwave infrared. . .
Downloaded From: http://biomedicaloptics.spiedigitallibrary.org/ on 02/28/2017 Terms of Use: http://spiedigitallibrary.org/ss/termsofuse.aspx

InGaAs technology, the applications of HSI-SWIR have been
significantly broadened and currently cover a variety of research
fields such as security,4 plant science,31,32 agriculture,33 and food
analysis.34 The latter includes characterization of the food prod-
ucts,35 detection of contaminants,36 and quality control.37 Given
the better penetration of SWIR photons in scattering media,
SWIR-HSI has also been recognized as a viable tool to monitor
objects through thick smoke,38 detect hidden damages in
fruits,39 and diagnose and demarcate deep bruises in humans.40
In this work, we employ HSI-SWIR to measure the wavelength-
dependent photon penetration in phantoms and different bio-
logical tissues.
Our method of measuring penetration depth was based on the
quantitative evaluation of the spatial Michelson contrast intro-
duced in our earlier publications.23,41 In this method, a sample
of interest was placed on top of a grid, as shown schematically in
Fig. 5, and the contrast was measured (as shown in the previous
section and Fig. 6). Image contrast was independent of wave-
length for a blank sample provided that the system was corrected
for chromatic aberrations and the wavelength of detection was
within detector sensitivity. The blank sample refers to the mea-
surements from the Fotofab card without any of the intralipid/
India stock solution. The contrast of the blank grid sample under
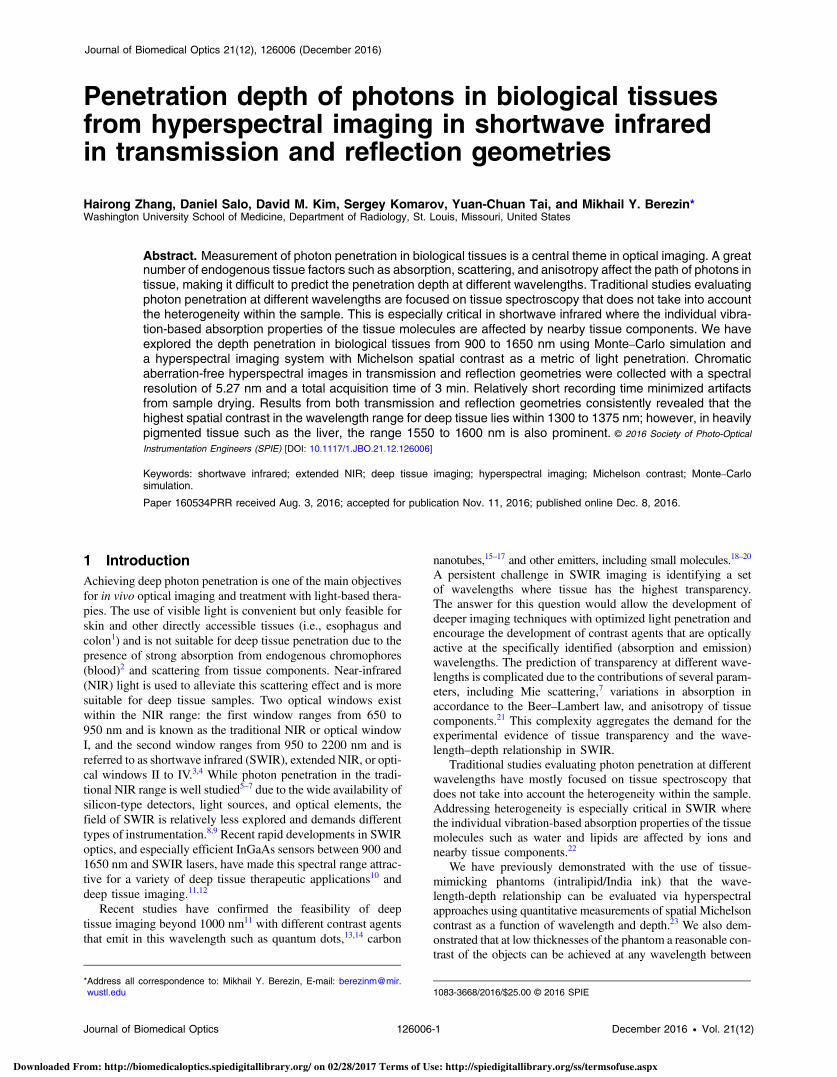
transmission geometry in Fig. 7(a) shows this independence by
exhibiting a steady contrast within the 0.88 to 0.91 range (1.0
under ideal conditions) from 935 to 1625 nm. The contrast
substantially decreases at the margins due to the drop in sensi-
tivity of the InGaAs sensor at these wavelengths, which makes
the measurements below 535 and above 1625 nm no longer
reliable. The value of the measured contrast was a little lower
(less than 10%) than the expected value of 1.0 under ideal
conditions.
The data for the transmission and reflection modes presented
in Figs. 7(a) and 7(b) show general trends between contrast and
wavelength consistent for both geometries. Significantly lower
depth penetration in the reflection geometry when compared to
the transmission geometry was due in part to an average dou-
bling in path length within the tissue. The increased photon
path length of the reflection geometry leads to relatively more
absorption events, which results in a lower Ilight. Fresnel reflec-
tion also contributed to the lower depth penetration of the reflec-
tion geometry because of the involvement of a greater number of
surfaces with different refractive indices.42,43 The lowest con-
trast within the studied spectral range was at 1400 to 1500 nm
due to the strong water absorption at these wavelengths. The
contrast at other wavelengths depended on sample thickness. At
lower thickness, the highest contrasts were centered at two spec-
tral bands: 1300 to 1375 nm and 1575 to 1625 nm. As the thick-
ness of the phantoms increased, the contrast at the 1300 nm band
became much more prominent than at 1600 nm [Fig. 7(c)].
These results reflect a compromise between the absorption
properties of the chromophores and scattering. While the
absorption coefficients vary greatly over the SWIR spectrum,
the scattering coefficient of tissue decreases monotonically
according to the Mie theory.44 At 1600 nm, the absorption
coefficient of water, the dominant chromophore, is an order
of magnitude higher than that at 1300 nm 5.7 cm−1 versus
77.5 cm−1;45 however, the scattering at 1600 nm is expected to
be substantially lower than at 1300 nm. Under ideal Rayleigh
scattering conditions, scattering is proportional to λ−4.33 With
particles size similar to the wavelength of the incident electro-
magnetic radiation (Mie conditions), the scattering in SWIR is
less wavelength-dependent and proportional from λ−1.5 to λ−0.6
depending on the type of tissue and often method of measure-
ments.8,46 Based on this evaluation, thick tissue is expected to
have the highest transparency at 1300 and 1600 nm, and this
result is confirmed by our experimental data [Fig. 7(c)] and sim-
ulation (see Figs. 9 and 10).
Fig. 6 Calculation of the Michelson contrast from the datacube and ROIs corresponding to the light anddark areas in the image. (a) Representative frame of a grid covered with a tissue-mimicking phantom.(b) Average intensity of the dark ROI over the spectral range from 900 to 1650 nm. (c) Average intensityof the ROI inside the hole over the spectral range from 900 to 1650 nm.
Journal of Biomedical Optics 126006-5 December 2016 • Vol. 21(12)
Zhang et al.: Penetration depth of photons in biological tissues from hyperspectral imaging in shortwave infrared. . .
Downloaded From: http://biomedicaloptics.spiedigitallibrary.org/ on 02/28/2017 Terms of Use: http://spiedigitallibrary.org/ss/termsofuse.aspx
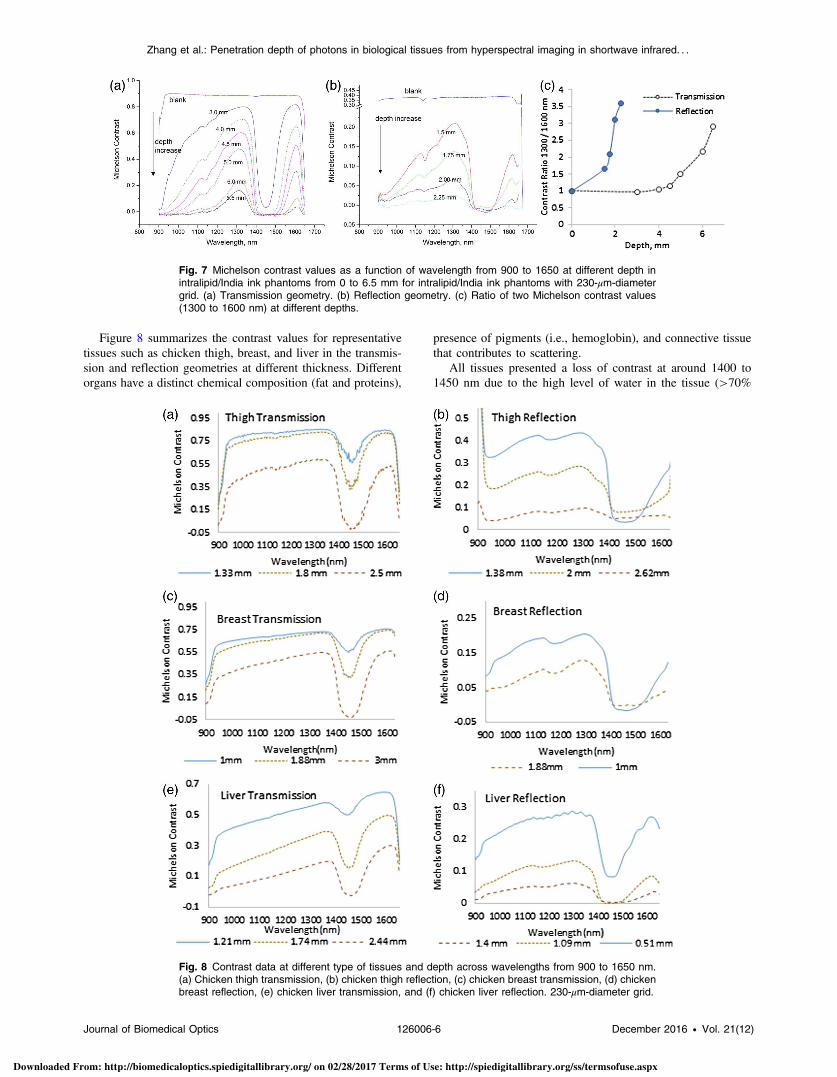
Figure 8 summarizes the contrast values for representative
tissues such as chicken thigh, breast, and liver in the transmis-
sion and reflection geometries at different thickness. Different
organs have a distinct chemical composition (fat and proteins),
presence of pigments (i.e., hemoglobin), and connective tissue
that contributes to scattering.
All tissues presented a loss of contrast at around 1400 to
1450 nm due to the high level of water in the tissue (>70%
Fig. 7 Michelson contrast values as a function of wavelength from 900 to 1650 at different depth inintralipid/India ink phantoms from 0 to 6.5 mm for intralipid/India ink phantoms with 230-μm-diametergrid. (a) Transmission geometry. (b) Reflection geometry. (c) Ratio of two Michelson contrast values(1300 to 1600 nm) at different depths.
Fig. 8 Contrast data at different type of tissues and depth across wavelengths from 900 to 1650 nm.(a) Chicken thigh transmission, (b) chicken thigh reflection, (c) chicken breast transmission, (d) chickenbreast reflection, (e) chicken liver transmission, and (f) chicken liver reflection. 230-μm-diameter grid.
Journal of Biomedical Optics 126006-6 December 2016 • Vol. 21(12)
Zhang et al.: Penetration depth of photons in biological tissues from hyperspectral imaging in shortwave infrared. . .
Downloaded From: http://biomedicaloptics.spiedigitallibrary.org/ on 02/28/2017 Terms of Use: http://spiedigitallibrary.org/ss/termsofuse.aspx

in most of the soft tissues47), which correlated with the trend
observed with the intralipid/India ink phantoms. The contrast
steadily increased with the wavelength, providing the largest
contrast at 1300 to 1375 and 1575 to 1625 nm, which also cor-
related with the trend observed with the phantoms. These two
bands showed similar contrast in the transmission geometry,
which is important for light-based therapies. The contrast at
1300 to 1375 nm was consistently higher and particularly evi-
dent at larger depths in the reflection geometry, which is more
practical for medical imaging. Freshly excised chicken tissue
retains most of its interstitial fluid from the lymphatic system
(>70% moisture27) but, in general, contains a reduced amount
of blood. We expect that the presence of blood will increase the
absorption coefficient due to the increased level of oxygenated
hemoglobin that is still significantly absorbing in this spectral
range (although less than in the NIR and visible).3,48
To explain the results, we performed a Monte–Carlo simu-
lation. Because of a lack of optical data in the studied tissues
(chicken breast, thigh, and liver), Monte–Carlo simulation was
performed using literature data on absorption and reduced scat-
tering coefficients in rat skin.49 Scattering was modeled using
the standard Henyey–Greenstein phase function.50 In this sim-
ulation, two parallel beams of photons at different wavelengths
(each beam ¼ 1 × 10⁷ photons) entered the tissue perpendicu-
lar to the surface. Reflection/transmission coefficients were
calculated using the known Fresnel equation for nonpolarized
photons through infinite XY surface of 10-mm thickness. The
results of such simulations in the transmission geometry are
shown in Fig. 9. The resolution between two peaks was calcu-
lated as R ¼ Imax∕Ioverlap and presented in Fig. 10 as a function
of wavelength. The trend of resolution versus wavelength was
quite similar to what we measured experimentally in the trans-
mission geometry with maximums at 1350 and 1550 nm. Beams
were set 10 mm apart, 1 × 10⁷ photons in each beam. Thickness
of the tissue was set to 10 mm. For simplification, the values of
the refractive index n and anisotropy g were considered to be
independent from the wavelength in the 900 to 1600 nm
range and equal to n ¼ 1.4 (typical values of n for the tissue
from 1.35 to 1.418 and reviewed in Ref. 51), and anisotropy fac-
tor g ¼ 0.9 (typical values 0.80 to 0.9552). The upper panel
shows the distribution of the photon from the bottom view
(entrance) and top view. The lower panel shows the histogram
of photons number from the middle position between the
two beams.
Analysis of the tissue-based data revealed the difference
between the types of the tissue. While thigh and breast showed
similar contrast apparently due to the similarity in their tissue
composition, the liver presented a significantly lower contrast
(Fig. 11). This difference became especially noticeable at larger
thickness. The liver is highly vascularized compared to the thigh
and the breast tissues and is therefore richer in red cells and
hemoglobin. Hemoglobin is strongly absorbing in the visible
but also absorbing at longer wavelengths with the absorption
coefficient at 1300 nm comparable to that of water.3 Thus,
despite the known low scattering coefficient of the liver com-
pared to other tissues,6 the liver is substantially less transparent
in the SWIR than other soft tissues such as breast and thigh.
Fig. 9 Representative Monte–Carlo simulation of two parallel photon beam distributions in biologicaltissue in transmission geometry. (a) 900 nm: μa ¼ 0.07 cm−1, μ 0
s ¼ 1.3 cm−1; (b) 1300 nm: μa ¼0.8 cm−1, μ 0
s ¼ 1.07 cm−1; (c) 1500 nm: μa ¼ 13 cm−1, μ 0s ¼ 0.95 cm−1; (d) 1600 nm: μa ¼ 5 cm−1,
μ 0s ¼ 0.85 cm−1.
Fig. 10 Calculated resolution of two-peak histograms: R ¼ Imax∕Ioverlap.
Fig. 11 Michelson contrast of biological tissues at different depth at1300 nm. Values in the columns show the actual thickness of the tis-sue in mm.
Journal of Biomedical Optics 126006-7 December 2016 • Vol. 21(12)
Zhang et al.: Penetration depth of photons in biological tissues from hyperspectral imaging in shortwave infrared. . .
Downloaded From: http://biomedicaloptics.spiedigitallibrary.org/ on 02/28/2017 Terms of Use: http://spiedigitallibrary.org/ss/termsofuse.aspx

There are a growing number of publications that explore the
SWIR range as a new optical window II.13,53,54 This optical
range has been explored quite recently for the diagnostics of
middle ear pathologies55 and arthritis.56 In this regard, our
study confirms that light penetration in certain spectral ranges
within the SWIR range is higher than in the more traditional
NIR range. In this work, we have experimentally demonstrated
that the highest transparency lies in a narrow range of 1300 to
1375 nm and in some cases (i.e., transmission geometry) in the
range of 1575 to 1625 nm.
Since tissue lipids have a distinct absorption profile, HSI-
SWIR can be applied to identify a lipid-based plaque in the
in vivo and in vitro models of atherosclerosis.57,58 As the detec-
tion of the coronary plaque is often identified with an optical
fiberscope catheter, the outcome of the study will depend not
only on the depth penetration but also on the contrast between
the plaque and the blood vessel. This contrast can be signifi-
cantly improved using our HSI-SWIR imaging approach as
we have presented elsewhere.59
The presented contrast versus wavelength data obtained from
the HSI approach contain the combined information about scat-
tering, absorption, and other optical parameters. In general, the
observed trend follows the light penetration patterns reported in
the literature.8 In the NIR (<900 nm) range, the scattering in
general dominates the absorption μ 0s > μa, providing relatively
low contrast. At longer wavelengths (<1000 nm), where the
scattering values are comparable to those of absorption
(μ 0s ≈ μa), the contrast increases with the decrease of scattering.
Higher values of absorption (μa ≫ μ 0s) even in combination with
relatively low scattering, as observed in the 1400- to 1500-nm
range, block the light penetration and consequently lead to a
weak contrast. Such variability in light penetration in SWIR
has been observed in a number of studies.8,28,49,60
4 Conclusions and Future Work
Using HSI, we investigated the transparency of the tissue at dif-
ferent wavelengths in SWIR. We focused on a spectral range
from 900 to 1650 nm measuring the depth penetration in bio-
logical tissues using a Michelson spatial contrast as a metric of
light penetration. Chromatic aberration-free hyperspectral
images in transmission and reflection geometries were collected
with a spectral resolution of 5.27 nm and a total acquisition time
of 3 min. Relatively short recording time minimized artifacts
from sample drying. Results from both transmission and reflec-
tion geometries in phantoms and biological tissues consistently
revealed the highest spatial contrast within 1300 to 1375 nm in
deep tissues. The most critical parameters affecting depth pen-
etration in soft tissue were water and hemoglobin absorptions. In
heavily pigmented tissue such as liver, the depth penetration was
significantly lower than for other studied tissues such as the
breast and the thigh. The presented data opens up the possibility
for the rational design of fluorescent probes and light-based
therapies for deeper penetration, which could have potential
applications in clinical settings. We have recently identified QDs
with the high quantum yield in the desired optical range at about
1300 nm.61
Our finding suggests that 1300 to 1375 nm is the best optical
band for deep tissue imaging within the tested range; however,
the poor sensitivity of the commercial InGaAs detector beyond
1650 nm did not allow us to measure the contrast at longer
wavelengths. It has been recently reported that light penetration
is increasing up to 1800 nm.4,11 The measurement of the
Michelson contrast in these longer wavelength would require
a different type of detector with sufficient sensitivity.
As part of our long-term interest in SWIR imaging, we are
currently developing a computational model of SWIR light pen-
etration in a variety of biological media. This theoretical model
requires reliable quantitative values of absorption and reduced
scattering coefficients in SWIR, as well as other wavelength-
related parameters, such as anisotropy and refractive index.
Although these parameters are available for some tissues, such
as skin, they cannot be directly applied to the studied type of
tissues. We are currently developing a method to extract light-
tissue penetration parameters in SWIR using the generated con-
trast-wavelength dependence. A related work is currently being
conducted in our lab and will be reported in a separate paper.
Disclosures
The authors have nothing to disclose.
Acknowledgments
Dr. Berezin reports grants from NIH, grants from NSF, during
the conduct of the study: the NCI/NIH CA198419, the NSF
Research Infrastructure Improvement Award # IIA-1355406,
and the Washington University Optical Spectroscopy Core
Facility (NIH 1S10RR031621-01).
References
1. A. N. G. Bashkatov et al., “Optical properties of human colon tissues in
the 350–2500 nm spectral range,” Quant. Electron. 44(8), 779–784
(2014).
2. M. Friebel et al., “Influence of oxygen saturation on the optical scatter-
ing properties of human red blood cells in the spectral range 250 to 2,
000 nm,” J. Biomed. Opt. 14(3), 034001 (2009).
3. Q. Cao et al., “Multispectral imaging in the extended near-infrared win-
dow based on endogenous chromophores,” J. Biomed. Opt. 18(10),
101318 (2013).
4. L. Shi et al., “Transmission in near-infrared optical windows for deep
brain imaging,” J. Biophotonics 9(1–2), 38–43 (2016).
5. J. V. Frangioni, “In vivo near-infrared fluorescence imaging,” Curr.
Opin. Chem. Biol. 7(5), 626–634 (2003).
6. S. L. Jacques, “Optical properties of biological tissues: a review,” Phys.
Med. Biol. 58(11), R37–R61 (2013).
7. V. Ntziachristos et al., “Looking and listening to light: the evolution of
whole-body photonic imaging,” Nat. Biotechnol. 23(3), 313–320
(2005).
8. T. L. Troy and S. N. Thennadil, “Optical properties of human skin in the
near infrared wavelength range of 1000 to 2200 nm,” J. Biomed. Opt.
6(2), 167–176 (2001).
9. A. N. Bashkatov et al., “Optical properties of human skin, subcutaneous
and mucous tissues in the wavelength range from 400 to 2000 nm,”
J. Phys. D Appl. Phys. 38, 2543–2555 (2005).
10. A. Mester, “Laser biostimulation,” Photomed. Laser Surg. 31(6), 237–
239 (2013).
11. L. A. Sordillo et al., “Deep optical imaging of tissue using the second
and third near-infrared spectral windows,” J. Biomed. Opt. 19(5),
056004 (2014).
12. X. Gao et al., “In vivo cancer targeting and imaging with semiconductor
quantum dots,” Nat. Biotechnol. 22(8), 969–976 (2004).
13. C. Li et al., “In vivo real-time visualization of tissue blood flow and
angiogenesis using Ag2S quantum dots in the NIR-II window,”
Biomaterials 35(1), 393–400 (2014).
14. Y. Kong et al., “Highly fluorescent ribonuclease-a-encapsulated lead
sulfide quantum dots for ultrasensitive fluorescence in vivo imaging
in the second near-infrared window,” Chem. Mater. 28(9), 3041–3050
(2016).
15. N. Won et al., “Imaging depths of near-infrared quantum dots in first
and second optical windows,” Mol. Imaging 11(4), 338–352 (2012).
Journal of Biomedical Optics 126006-8 December 2016 • Vol. 21(12)
Zhang et al.: Penetration depth of photons in biological tissues from hyperspectral imaging in shortwave infrared. . .
Downloaded From: http://biomedicaloptics.spiedigitallibrary.org/ on 02/28/2017 Terms of Use: http://spiedigitallibrary.org/ss/termsofuse.aspx

16. Y. Jung et al., “Quantum dot imaging in the second near-infrared optical
window: studies on reflectance fluorescence imaging depths by effec-
tive fluence rate and multiple image acquisition,” J. Biomed. Opt. 20(4),
046012 (2015).
17. K. Welsher, S. P. Sherlock, and H. Dai, “Deep-tissue anatomical imag-
ing of mice using carbon nanotube fluorophores in the second near-
infrared window,” Proc. Natl. Acad. Sci. U. S. A. 108(22), 8943–8948
(2011).
18. D. R. Klaus et al., “1D polymeric platinum cyanoximate: a strategy
toward luminescence in the near-infrared region beyond 1000 nm,”
Inorg. Chem. 54(4), 1890–1900 (2015).
19. Z. Tao et al., “Biological imaging using nanoparticles of small organic
molecules with fluorescence emission at wavelengths longer than
1000 nm,” Angew. Chem. Int. Ed. Engl. 52(49), 13002–13006 (2013).
20. A. L. Antaris et al., “A small-molecule dye for NIR-II imaging,” Nat.
Mater. 15(2), 235–242 (2016).
21. A. M. Smith, M. C. Mancini, and S. Nie, “Bioimaging: second window
for in vivo imaging,” Nat. Nanotechnol. 4(11), 710–711 (2009).
22. R. Rottgers, D. McKee, and C. Utschig, “Temperature and salinity cor-
rection coefficients for light absorption by water in the visible to infrared
spectral region,” Opt. Express 22(21), 25093–25108 (2014).
23. D. Salo et al., “Multispectral measurement of contrast in tissue-mimick-
ing phantoms in near-infrared spectral range of 650 to 1600 nm,”
J. Biomed. Opt. 19(8), 086008 (2014).
24. J. Amako, K. Nagasaka, and N. Kazuhiro, “Chromatic-distortion
compensation in splitting and focusing of femtosecond pulses by use
of a pair of diffractive optical elements,” Opt. Lett. 27(11), 969–971
(2002).
25. D. S. Grey, “A new series of microscope objectives: II. Preliminary
investigation of catadioptric Schwarzschild systems,” J. Opt. Soc. Am.
39(9), 723–728 (1949).
26. A. Q. Bauer et al., “Quantitative photoacoustic imaging: correcting for
heterogeneous light fluence distributions using diffuse optical tomogra-
phy,” J. Biomed. Opt. 16(9), 096016 (2011).
27. S. Mudalal et al., “Quantity and functionality of protein fractions in
chicken breast fillets affected by white striping,” Poultr. Sci. 93(8),
2108–2116 (2014).
28. I. Bargigia et al., “Time-resolved diffuse optical spectroscopy up to
1700 nm by means of a time-gated InGaAs/InP single-photon avalanche
diode,” Appl. Spectrosc. 66(8), 944–950 (2012).
29. G. E. Legge et al., “Psychophysics of reading. XI. Comparing color
contrast and luminance contrast,” J. Opt. Soc. Am. A 7(10), 2002–
2010 (1990).
30. A. F. H. Goetz, “Three decades of hyperspectral remote sensing of the
Earth: a personal view,” Remote Sens. Environ. 113(Suppl. 1), S5–S16
(2009).
31. D. M. Kim et al., “Highly sensitive image-derived indices of water-
stressed plants using hyperspectral imaging in SWIR and histogram
analysis,” Sci. Rep. 5, 15919 (2015).
32. J. Xing et al., “Comparison of short-wavelength infrared (SWIR) hyper-
spectral imaging system with an FT-NIR spectrophotometer for predict-
ing alpha-amylase activities in individual Canadian western red spring
(CWRS) wheat kernels,” Biosyst. Eng. 108(4), 303–310 (2011).
33. C. Riccioli et al., “Pixel selection for near-infrared chemical imaging
(NIR-CI) discrimination between fish and terrestrial animal species
in animal protein by-product meals,” Appl. Spectrosc. 65(7), 771–781
(2011).
34. M. S. Kim et al., “Visible to SWIR hyperspectral imaging for produce
safety and quality evaluation,” Sens. Instrum. Food Qual. Saf. 5(5),
155–164 (2011).
35. J. Burger and P. Geladi, “Hyperspectral NIR imaging for calibration and
prediction: a comparison between image and spectrometer data for
studying organic and biological samples,” Analyst 131(10), 1152–1160
(2006).
36. X. Fu et al., “Investigation of NIR hyperspectral imaging for discrimi-
nating melamine in milk powder,” Proc. SPIE 8721, 87210F (2013).
37. H. Huang, L. Liu, and M. Ngadi, “Recent developments in hyperspec-
tral imaging for assessment of food quality and safety,” Sensors 14(4),
7248–7276 (2014).
38. M. K. Griffin et al., “Characterization and delineation of plumes, clouds
and fires in hyperspectral images,” in IEEE Proc. Int. Geoscience and
Remote Sensing Symp. (IGARSS), pp. 809–812 (2000).
39. J. C. Keresztes, M. Goodarzi, and W. Saeys, “Real-time pixel based
early apple bruise detection using short wave infrared hyperspectral im-
aging in combination with calibration and glare correction techniques,”
Food Control 66, 215–226 (2016).
40. L. L. Randeberg and J. Hernandez-Palacios, “Hyperspectral imaging of
bruises in the SWIR spectral region,” Proc. SPIE 8207, 82070N (2012).
41. H. Zhang et al., “Penetration depth in tissue-mimicking phantoms from
hyperspectral imaging in SWIR in transmission and reflection geom-
etry,” Proc. SPIE 9703, 970311 (2016).
42. C. Chen et al., “A primary method for determination of optical param-
eters of turbid samples and application to intralipid between 550 and
1630 nm,” Opt. Express 14(16), 7420–7435 (2006).
43. L. A. Sordillo et al., “Imaging of tissue using a NIR supercontinuum
laser light source with wavelengths in the second and third NIR optical
windows,” Proc. SPIE 9319, 93191Y (2015).
44. J. L. Sandell and T. C. Zhu, “A review of in-vivo optical properties of
human tissues and its impact on PDT,” J. Biophotonics 4(11–12), 773–
787 (2011).
45. R. Röttgers et al., “Pure water spectral absorbtion, scattering, and real
part of refractive index model,” in ESA Algorithm Technical Basis
Document, pp. 1–18, ESA STSE WaterRadiance Project, Helmholtz-
Zentrum Geesthacht, Geesthacht, Germany (2010).
46. R. Nachabé et al., “Estimation of biological chromophores using diffuse
optical spectroscopy: benefit of extending the UV-VIS wavelength
range to include 1000 to 1600 nm,” Biomed. Opt. Express 1(5),
1432–1442 (2010).
47. H. H. Mitchell et al., “The chemical composition of the adult human
body and its bearing on the biochemistry of growth,” J. Biol. Chem.
158(3), 625–637 (1945).
48. E. Salomatina and A. Yaroslavsky, “Evaluation of the in vivo and
ex vivo optical properties in a mouse ear model,” Phys. Med. Biol.
53(11), 2797–2807 (2008).
49. R. H. Wilson et al., “Quantitative short-wave infrared multispectral im-
aging of in vivo tissue optical properties,” J. Biomed. Opt. 19(8), 086011
(2014).
50. L. G. Henyey and J. L. Greenstein, “Diffuse radiation in the galaxy,”
Astrophys. J. 93, 70–83 (1941).
51. P. Giannios et al., “Visible to near-infrared refractive properties of
freshly-excised human-liver tissues: marking hepatic malignancies,”
Sci. Rep. 6, 27910 (2016).
52. A. Roggan et al., “Medizinphysik: diagnostik und therapie mit dem
laser,” Phys. J. 55(3), 25–30 (1999).
53. G. Hong et al., “Near-infrared II fluorescence for imaging hindlimb ves-
sel regeneration with dynamic tissue perfusion measurement,” Circ.
Cardiovasc. Imaging 7(3), 517–525 (2014).
54. E. C. Ximendes et al., “LaF3 core/shell nanoparticles for subcutaneous
heating and thermal sensing in the second biological-window,” Appl.
Phys. Lett. 108(25), 253103 (2016).
55. J. A. Carr et al., “Using the shortwave infrared to image middle ear
pathologies,” Proc. Natl. Acad. Sci. U. S. A. 113(36), 9989–9994 (2016).
56. L. A. Paluchowski et al., “Identification of inflammation sites in arthritic
joints using hyperspectral imaging,” Proc. SPIE 8947, 89470H (2014).
57. J. Wang et al., “Near-infrared spectroscopic characterization of human
advanced atherosclerotic plaques,” J. Am. Coll. Cardiol. 39(8), 1305–
1313 (2002).
58. T. Hasegawa, I. Sogawa, and H. Suganuma, “A near infrared angioscope
visualizing lipid within arterial vessel wall based on multi-spectral
image in 1.7 μm wavelength band,” Proc. SPIE 8575, 857506 (2013).
59. D. Salo et al., “Extended near-infrared: a new window on in vivo bio-
imaging,” BioOptics World 7(1), (2014).
60. X. Ma et al., “Bulk optical parameters of porcine skin dermis at eight
wavelengths from 325 to 1557 nm,” Opt. Lett. 30(4), 412–414 (2005).
61. A. P. Aydt et al., “Synthesis and spectroscopic evaluation of PbS quan-
tum dots emitting at 1300 nm for optimized imaging in optical window
II,” Proc. SPIE 9723, 97230Z (2016).
Hairong Zhang received her BS degree from Washington Universityin 2016. She worked in Mikhail Berezin’s lab at the Department ofRadiology at Washington University School of Medicine from 2013to 2016. Her primary research interest included developing hyper-spectral optical imaging systems as well as image processing algo-rithms. She is currently a PhD candidate at Columbia University.
Journal of Biomedical Optics 126006-9 December 2016 • Vol. 21(12)
Zhang et al.: Penetration depth of photons in biological tissues from hyperspectral imaging in shortwave infrared. . .
Downloaded From: http://biomedicaloptics.spiedigitallibrary.org/ on 02/28/2017 Terms of Use: http://spiedigitallibrary.org/ss/termsofuse.aspx

Daniel Salo is a graduate student at Duke University. He spent hissummer as an amgen scholar in the laboratory of Mikhail Berezin andhas since received his MS in biomedical engineering from DukeUniversity. He has an interest in computational modeling and its appli-cation to cutting-edge healthcare technologies.
David M. Kim received his BS degree from Washington University in2016. He worked in Mikhail Berezin’s lab at the Department of Radiol-ogy at Washington University School of Medicine from 2012 to 2015.
Sergey Komarov, PhD, is a senior scientist at Washington UniversitySchool of Medicine in St. Louis. His research interests includesnuclear and plasma physics, positron emission tomography, imagereconstruction, Cherenkov luminescence imaging, gamma spectros-copy and the spectroscopy of highly ionized atoms.
Yuan-Chuan Tai is the associate professor of radiology and bio-medical engineering at Washington University School of Medicine inSt. Louis. He is focusing on positron-emission technology for high-resolution preclinical and human imaging applications.
Mikhail Y. Berezin, PhD, is the assistant professor at WashingtonUniversity School of Medicine in St. Louis. His research interestsinclude optical spectroscopy, hyperspectral optical imaging, anddesign of contrast agents in near- and shortwave infrared for tissueimaging and medical diagnostics. He is the author of more than 60peer-reviewed papers, books and book chapters in this field. He isa senior member of SPIE.
Journal of Biomedical Optics 126006-10 December 2016 • Vol. 21(12)
Zhang et al.: Penetration depth of photons in biological tissues from hyperspectral imaging in shortwave infrared. . .
Downloaded From: http://biomedicaloptics.spiedigitallibrary.org/ on 02/28/2017 Terms of Use: http://spiedigitallibrary.org/ss/termsofuse.aspx