Embed Size (px)
Citation preview

PENNSYLVANIA RESIDENTS’ OPINIONS ON AND ATTITUDES TOWARD NONGAME WILDLIFE
Conducted for the Pennsylvania Game Commission
by Responsive Management
2014

PENNSYLVANIA RESIDENTS’ OPINIONS ON AND ATTITUDES TOWARD NONGAME WILDLIFE
2014
Responsive Management National Office Mark Damian Duda, Executive Director
Martin Jones, Senior Research Associate Tom Beppler, Research Associate Sarah Butzen, Research Associate
Steven J. Bissell, Ph.D., Qualitative Research Associate Andrea Criscione, Research Associate Patrick Doherty, Research Associate
Gregory L. Hughes, P.E., Research Associate Eva Meadows, Survey Center Manager
Alison Lanier, Business Manager
130 Franklin Street Harrisonburg, VA 22801
Phone: 540/432-1888 Fax: 540/432-1892 E-mail: [email protected]
www.responsivemanagement.com

Acknowledgments
Responsive Management would like to thank Catherine Haffner, Calvin DuBrock, Joshua
Johnson, Nathan Zalik, Joseph Neville, Coren Jagnow, Stephen Smith, and Daniel Brauning of
the Pennsylvania Game Commission and Diana Day, Timothy Schaeffer, Stephen Kralik, Devin
DeMario, and Christopher Urban of the Pennsylvania Fish and Boat Commission for their input,
support, and guidance on this project.
Funding for this project was provided by a State & Tribal Wildlife Grant (T2-18-R-1) in
cooperation with the U.S. Fish and Wildlife Service, Wildlife and Sport Fish Restoration
Program. The project was administered by the Pennsylvania Game Commission and Responsive
Management.
Suggested Citation
Responsive Management. 2014. “Pennsylvania Residents’ Opinions on and Attitudes Toward
Nongame Wildlife.” A report to the Pennsylvania Game Commission, Harrisburg, PA. 125 pp.


Pennsylvania Residents’ Opinions on and Attitudes Toward Nongame Wildlife i
EXECUTIVE SUMMARY
INTRODUCTION AND METHODOLOGY
This study was conducted for the Pennsylvania Game Commission, in cooperation with the
Pennsylvania Fish and Boat Commission, to determine Pennsylvania residents’ opinions on and
attitudes toward nongame wildlife, activities and priorities of the Commissions, and funding for
the Commissions. Additionally, there are questions pertaining to residents’ attitudes toward
hunting, fishing, and game species. The study entailed a telephone survey of Pennsylvania
residents 18 years old and older.
For the survey, telephones were selected as the preferred sampling medium because of the
almost universal ownership of telephones among the general population of Pennsylvania.
Additionally, telephone surveys, relative to mail or Internet surveys, allow for more scientific
sampling and data collection, provide higher quality data, obtain higher response rates, are more
timely, and are more cost-effective. Telephone surveys also have fewer negative effects on the
environment than do mail surveys because of reduced use of paper and reduced energy
consumption for delivering and returning the questionnaires.
The telephone survey questionnaire was developed cooperatively by Responsive Management
and the Commissions. Responsive Management conducted pre-tests of the questionnaire to
ensure proper wording, flow, and logic in the survey.
The sample of Pennsylvania residents was obtained from Survey Sampling International, a firm
that specializes in providing scientifically valid samples for surveys. The sample was developed
to allow for stratifying by Congressional Districts. The sample was stratified to ensure that at
least 200 interviews would be obtained in each of Pennsylvania’s 18 Congressional Districts,
allowing statistically valid data to be obtained at the District level. Each District sample was
representative of the population in that District. The calling effort included both landline and
cell phones. For overall results, the districts were properly weighted so that the statewide results
reflected the state as a whole.

ii Responsive Management
Telephone surveying times are Monday through Friday from 9:00 a.m. to 9:00 p.m., Saturday
from noon to 5:00 p.m., and Sunday from 5:00 p.m. to 9:00 p.m., local time. The survey was
conducted in 2014. The software used for data collection was Questionnaire Programming
Language. Responsive Management obtained a total of 3,660 completed interviews.
The analysis of data was performed using Statistical Package for the Social Sciences as well as
proprietary software developed by Responsive Management. Throughout this report, findings of
the telephone survey are reported at a 95% confidence interval. For the entire sample of
Pennsylvania residents on statewide analyses, the sampling error is at most +/- 1.62 percentage
points. Sampling error was calculated with a sample size of 3,660 and a population size of
9,910,224 Pennsylvania residents 18 years old and older.
PERCEIVED THREATS TO NONGAME WILDLIFE IN PENNSYLVANIA
� Pennsylvania residents were asked to name the single most important issue or concern facing
nongame wildlife in Pennsylvania today. The top concern is habitat loss/fragmentation/
degradation (named by 16%) followed by the somewhat related concerns of urban
sprawl/over-development (6%) and population growth (6%).
• Other important issues include pollution in general (5%), polluted water specifically
(5%), and management of threatened or endangered wildlife (4%).
IMPORTANCE OF COMMISSIONS’ FUNCTIONS
� The survey presented a list of five functions of the Commissions: providing opportunities for
(1) fishing, (2) hunting, and (3) wildlife viewing, as well as managing and conserving
(4) nongame wildlife and (5) threatened and endangered species. For each function,
respondents rated its importance.
• Large majorities think that each function is very important (ranging from 59% to 75%),
with managing and conserving threatened and endangered species topping the ranking
(75% think this is very important). Also note that the percentages of very important and
somewhat important combined range from 84% to 92%.

Pennsylvania Residents’ Opinions on and Attitudes Toward Nongame Wildlife iii
IMPORTANCE OF COMMISSIONS’ ACTIVITIES
� The survey presented a list of 11 activities of the Commissions and asked respondents to rate
the importance of each. In looking at the results together, the activities fall into three tiers.
The top activities in importance are addressing wildlife diseases (80% rate this as very
important) and enforcing wildlife laws (79%). In the second tier, four more activities all
have two-thirds or more saying that they are very important: restoring and improving habitat
(73%), addressing invasive species (72%), conservation actions for nongame species at risk
(68%), and educating the public about nongame wildlife (67%).
PERCEIVED PRIORITIES OF THE COMMISSIONS
� Four questions asked about whether more, the same, or less effort should be directed to
managing and conserving four types of nongame wildlife: birds, small mammals,
reptiles/amphibians, and fish.
• For birds such as birds of prey, songbirds, and shorebirds, the most common response
was “more” (37.1%—rounds to 37%), just ahead of “the same” (36.6%—rounds to 37%).
For the other three types of wildlife (mammals, reptiles/amphibians, and fish), the most
common response was “the same” (ranging from 37% to 39%). For all types of wildlife,
the percentage saying “more” effort should be directed to managing and conserving it
(24% to 37%) exceeded the percentage saying “less” (8% to 16%).
• In comparing the four types of wildlife, the most concern is for birds: 37% want more
effort directed to managing and conserving birds, compared to 24% to 30% for the other
types.
OPINIONS ON PENNSYLVANIA’S STATE WILDLIFE ACTION PLAN
� When asked if they had heard of Pennsylvania’s State Wildlife Action Plan, 12% of
Pennsylvania residents indicate having heard of it.
• Following this question, respondents were informed that the Plan contains information
pertaining to four main areas: species of greatest conservation need, habitat conditions
where those species live, threats to species and habitats, and conservation actions to
lessen those threats.

iv Responsive Management
• After this information was given to respondents, they were asked to say which area they
thought was the most important. Although responses were distributed among all four
areas, the top two were conservation actions to lessen threats (30% chose this) and habitat
conditions where species of greatest need live (29%).
RATINGS OF THE PERFORMANCE OF THE COMMISSIONS
� Ratings are consistently positive regarding the Commissions’ efforts at managing and
conserving Pennsylvania’s nongame wild birds and mammals; nongame fish, reptiles,
amphibians, and other aquatic wildlife; threatened and endangered wild birds and mammals;
and threatened and endangered reptiles, amphibians, and other aquatic wildlife. For each of
these, ratings of excellent or good (the top half of the scale) far exceeded ratings of fair or
poor (the lower half of the scale).
PERCEPTIONS ON FUNDING FOR THE COMMISSIONS
� An open-ended question asked Pennsylvania residents to name the Commissions’ sources of
funding, and multiple responses were allowed. While the top two responses are important
funding sources (hunting licenses and fishing licenses—named, respectively, by 35% and
34% of residents), the third and fourth responses, “taxes” and “general state taxes,” both
being somewhat vague, demonstrate a lack of real knowledge about funding sources.
• Interestingly, three very important sources were named by no more than 3% of residents:
excise taxes on hunting equipment (3%), excise taxes on fishing equipment (2%), and
taxes on motorboat fuel (1%).
� The Survey asked questions about ten possible funding sources for fish and wildlife
management and conservation.
• In looking at the ranking by the percentage who strongly or moderately support, there
appear to be two tiers of funding sources. At the top are five sources, all with
approximately two-thirds or more in support: a collector’s conservation stamp, funds
from fishing license fees, a “small percentage” of revenue from gaming, funds from
hunting license fees, and a fee on the consumptive use and degradation of water. It is
interesting to note that all these sources would not directly apply to the general

Pennsylvania Residents’ Opinions on and Attitudes Toward Nongame Wildlife v
population (one could say that the fee on consumptive use and degradation of water
would apply to the general population, but only indirectly as passed-on costs from
business, utilities, and industry).
• The lower tier in support are those funding sources that would apply to more of the
general population (with the exception of the tax on energy development, which, like the
water fee, would only indirectly apply to the general population as passed-on costs).
These in the lower tier, in addition to the tax on energy development, include an increase
in the tipping fee for trash services (applying to much of the general population), a fee for
those using Game Lands (a true “user fee”), a portion of the state’s sales tax (applying to
all of the general population), and a federal excise tax on outdoor equipment (also a user
fee of sorts).
SOURCES OF INFORMATION ABOUT NONGAME FISH AND WILDLIFE
� An open-ended question asked Pennsylvania residents to indicate where they get information
about nongame fish and wildlife, and they could name multiple sources. The top sources are
friends and family (22%), the Internet (21%), magazines (19%), and television (17%).
PARTICIPATION IN WILDLIFE-RELATED ACTIVITIES
� The survey asked residents if they had participated in ten natural resource-related activities in
Pennsylvania in the past 2 years. There are six activities in which more than a third of
Pennsylvania residents have participated in the past 2 years: birdwatching and wildlife
watching (52% did this activity), hiking (49%), maintaining areas around home to benefit
fish and wildlife (49%), fishing (43%), boating, canoeing, or kayaking (38%), and
photographing wildlife (38%).
• Note that, for some of these activities, “participation” can be loosely defined by
respondents. For instance, a person who went along with a group on a fishing expedition
but did not personally hold a rod and fish may, nonetheless, answer affirmatively that
he/she fished. This may also be true of hunting.

vi Responsive Management
CONTRIBUTIONS TO AND MEMBERSHIP IN NATURAL RESOURCES-RELATED
ORGANIZATIONS
� Approximately 1 in 5 Pennsylvania residents (21%) are members of, or have donated to, a
sportsmen’s, conservation, environmental, or recreation organization.
APPROVAL OR DISAPPROVAL OF HUNTING AND FISHING
� Approval of hunting and fishing among the general population of Pennsylvania is quite high:
85% approve of legal hunting, and 94% approve of legal fishing. Most of that support is
strong support. Opposition stands at 9% against hunting and 4% against fishing.

Pennsylvania Residents’ Opinions on and Attitudes Toward Nongame Wildlife vii
TABLE OF CONTENTS
Introduction and Methodology ........................................................................................................1
Use of Telephones for the Survey ...........................................................................................1
Questionnaire Design ..............................................................................................................1
Survey Sample .........................................................................................................................1
Telephone Interviewing Facilities ...........................................................................................2
Interviewing Dates and Times .................................................................................................3
Telephone Survey Data Collection and Quality Control .........................................................3
Data Analysis ...........................................................................................................................4
Sampling Error ........................................................................................................................6
Additional Information About the Presentation of Results in the Report ...............................6
Perceived Threats to Nongame Wildlife in Pennsylvania ...............................................................8
Perceived Importance of the Commissions’ Functions and Activities ..........................................11
Importance of Commissions’ Functions ................................................................................11
Importance of Commissions’ Activities ................................................................................23
Perceived Priorities of the Commissions ...............................................................................32
Opinions on Pennsylvania’s State Wildlife Action Plan .......................................................36
Ratings of the Performance of the Commissions ...........................................................................42
Perceptions on Funding for the Commissions ...............................................................................54
Sources of Information About Nongame Fish and Wildlife ..........................................................95
Participation in Wildlife-Related Activities ...................................................................................98
Contributions to and Membership in Natural Resources-Related Organizations ........................101
Approval or Disapproval of Hunting and Fishing .......................................................................105
Demographic Information ............................................................................................................110
Appendix: Survey Instrument .....................................................................................................115
About Responsive Management ..................................................................................................124

Pennsylvania Residents’ Opinions on and Attitudes Toward Nongame Wildlife 1
INTRODUCTION AND METHODOLOGY
This study was conducted for the Pennsylvania Game Commission, in cooperation with the
Pennsylvania Fish and Boat Commission, to determine Pennsylvania residents’ opinions on and
attitudes toward nongame wildlife, activities and priorities of the Commissions, and funding for
the Commissions. Additionally, there are questions pertaining to residents’ attitudes toward
hunting, fishing, and game species. The study entailed a telephone survey of Pennsylvania
residents 18 years old and older. Specific aspects of the research methodology are discussed
below.
USE OF TELEPHONES FOR THE SURVEY
For the survey, telephones were selected as the preferred sampling medium because of the
almost universal ownership of telephones among the general population of Pennsylvania.
Additionally, telephone surveys, relative to mail or Internet surveys, allow for more scientific
sampling and data collection, provide higher quality data, obtain higher response rates, are more
timely, and are more cost-effective. Telephone surveys also have fewer negative effects on the
environment than do mail surveys because of reduced use of paper and reduced energy
consumption for delivering and returning the questionnaires.
QUESTIONNAIRE DESIGN
The telephone survey questionnaire was developed cooperatively by Responsive Management
and the Game Commission, based on the research team’s familiarity with wildlife and natural
resources. The survey questionnaire was based, in part, on previous surveys that have been
administered in Pennsylvania about these issues. Responsive Management conducted pre-tests
of the questionnaire to ensure proper wording, flow, and logic in the survey. The survey is
shown in the Appendix.
SURVEY SAMPLE
The sample of Pennsylvania residents was obtained from Survey Sampling International, a firm
that specializes in providing scientifically valid samples for surveys. The sample was developed
to allow for stratifying by Congressional Districts. The sample was stratified to ensure that at
least 200 interviews would be obtained in each of Pennsylvania’s 18 Congressional Districts,

2 Responsive Management
allowing statistically valid data to be obtained at the District level. Each District sample was
representative of the population in that District. The calling effort included both landline and
cell phones. For overall results, the districts were properly weighted so that the statewide results
reflected the state as a whole.
Map is in color; may not be legible in black-and-white prints of the report.
TELEPHONE INTERVIEWING FACILITIES
A central polling site at the Responsive Management office allowed for rigorous quality control
over the interviews and data collection. Responsive Management maintains its own in-house
telephone interviewing facilities. These facilities are staffed by interviewers with experience
conducting computer-assisted telephone interviews on the subjects of outdoor recreation and
natural resources.

Pennsylvania Residents’ Opinions on and Attitudes Toward Nongame Wildlife 3
To ensure the integrity of the telephone survey data, Responsive Management has interviewers
who have been trained according to the standards established by the Council of American Survey
Research Organizations. Methods of instruction included lecture and role-playing. The Survey
Center Managers and other professional staff conducted a project briefing with the interviewers
prior to the administration of this survey. Interviewers were instructed on type of study, study
goals and objectives, handling of survey questions, interview length, termination points and
qualifiers for participation, interviewer instructions within the survey questionnaire, reading of
the survey questions, skip patterns, and probing and clarifying techniques necessary for specific
questions on the survey questionnaire.
INTERVIEWING DATES AND TIMES
Telephone surveying times are Monday through Friday from 9:00 a.m. to 9:00 p.m., Saturday
from noon to 5:00 p.m., and Sunday from 5:00 p.m. to 9:00 p.m., local time. A five-callback
design was used to maintain the representativeness of the sample, to avoid bias toward people
easy to reach by telephone, and to provide an equal opportunity for all to participate. When a
respondent could not be reached on the first call, subsequent calls were placed on different days
of the week and at different times of the day. The survey was conducted in May through
September 2014.
TELEPHONE SURVEY DATA COLLECTION AND QUALITY CONTROL
The software used for data collection was Questionnaire Programming Language (QPL). The
survey data were entered into the computer as each interview was being conducted, eliminating
manual data entry after the completion of the survey and the concomitant data entry errors that
may occur with manual data entry. The survey questionnaire was programmed so that QPL
branched, coded, and substituted phrases in the survey based on previous responses to ensure the
integrity and consistency of the data collection.
The Survey Center Managers and statisticians monitored the data collection, including
monitoring of the actual telephone interviews without the interviewers’ knowledge, to evaluate
the performance of each interviewer and ensure the integrity of the data. The survey
questionnaire itself contains error checkers and computation statements to ensure quality and

4 Responsive Management
consistent data. After the surveys were obtained by the interviewers, the Survey Center
Managers and/or statisticians checked each completed survey to ensure clarity and completeness.
Responsive Management obtained a total of 3,660 completed interviews. For each
Congressional District, the tabulation that follows shows the number of completed interviews
obtained.
Congressional District Number of Completed
Interviews Congressional District
Number of Completed
Interviews
1 200 10 201
2 208 11 200
3 202 12 202
4 201 13 205
5 201 14 200
6 216 15 202
7 202 16 206
8 201 17 201
9 200 18 212
Total Statewide 3,660
DATA ANALYSIS
The analysis of data was performed using Statistical Package for the Social Sciences as well as
proprietary software developed by Responsive Management. The results were weighted by
demographic characteristics and by Congressional District so that the sample was representative
of residents of Pennsylvania as a whole.
In addition to statewide results, the data analysis includes tabulations of results among the
Congressional Districts, as well as some trends graphs. The trends are based on a 1996 survey
about nongame fish and wildlife in Pennsylvania conducted by Responsive Management. Only
those questions that have the same wording can be compared in the trends.
Another set of tabulations compares various demographic groups on some questions. On these
comparison tabulations, the statewide results are in the middle of the tabulation (in a shaded
row), and the various demographic groups are compared to that statewide result. An excerpt
from one of the tabulations is shown on the next page to illustrate the way this analysis was done
and should be interpreted. This tabulation shows how various demographic (as well as

Pennsylvania Residents’ Opinions on and Attitudes Toward Nongame Wildlife 5
behavioral) characteristics compare on thinking that managing and conserving nongame wildlife
is an important function of the Commissions.
First off, the overall statewide results found that 86.9% of the general population of Pennsylvania
responded that managing and conserving nongame wildlife is a very or somewhat important
function of the Commissions. This is shown in the shaded row in the middle of the tabulation.
Each other row in the tabulation shows the percent of a demographic (or behavioral) group that
responded with very or somewhat important on this question. Those groups above the shaded
row have a greater rate of thinking this is an important function than residents statewide; those
groups below the shaded row have a lower rate than residents statewide thinking this is an
important function.
For instance, at the top of the tabulation is the group made up of residents of Congressional
District 8—94.9% of them think this is an important function of the Commissions, considerably
higher than the general population as a whole. Also, women have a greater percentage than the
population as a whole thinking this is an important function of the Commissions (89.2% of them
think so). On the other hand, males have a lower rate than the population as a whole thinking
this is an important function (84.3% of them think so). At the bottom of the tabulation, residents
of Congressional District 3 have a lower rate (79.8%) than residents statewide. (As indicated,
this is an excerpt from the full tabulation, which can be found in the second section of this report,
“Perceived Importance of Commissions’ Functions and Activities.”) In all, the analysis
compares 36 demographic and behavioral groups.
Characteristic: Thinks that managing and conserving nongame wildlife is an important function of the Commissions
Percent of those with that characteristic
who think this is an important function
Resident of Congressional District 8 94.9 Resident of Congressional District 13 92.3 Female 89.2 Education level is at least a bachelor's degree 89.1 Statewide 86.9 Education level is less than bachelor's degree 85.8 Male 84.3 Resident of Congressional District 2 83.5 Resident of Congressional District 3 79.8
Excerpt from the full tabulation. The full tabulation can be found in the section of the report titled “Perceived
Importance of the Commissions’ Functions and Activities.”

6 Responsive Management
SAMPLING ERROR
Throughout this report, findings of the telephone survey are reported at a 95% confidence
interval. For the entire sample of Pennsylvania residents on statewide analyses, the sampling
error is at most plus or minus 1.62 percentage points. This means that if the survey were
conducted 100 times on different samples that were selected in the same way, the findings of 95
out of the 100 surveys would fall within plus or minus 1.62 percentage points of each other.
Sampling error was calculated using the formula described below, with a sample size of 3,660
and a population size of 9,910,224 Pennsylvania residents 18 years old and older.
Sampling Error Equation
( )
( )96.11
25.25.
−
−
=p
s
p
N
N
N
B
Derived from formula: p. 206 in Dillman, D. A. 2000. Mail and Internet Surveys. John Wiley & Sons, NY.
Note: This is a simplified version of the formula that calculates the maximum sampling error using a 50:50
split (the most conservative calculation because a 50:50 split would give maximum variation).
For each of the Congressional Districts, the sampling error is shown in the tabulation below.
Congressional
District Sampling error
Congressional
District Sampling error
Congressional
District Sampling error
1 6.93 7 6.89 13 6.84
2 6.79 8 6.91 14 6.93
3 6.89 9 6.93 15 6.89
4 6.91 10 6.91 16 6.83
5 6.91 11 6.93 17 6.91
6 6.67 12 6.89 18 6.73
ADDITIONAL INFORMATION ABOUT THE PRESENTATION OF RESULTS IN THE REPORT
In examining the results, it is important to be aware that the questionnaire included several types
of questions:
• Open-ended questions are those in which no answer set is read to the respondents; rather,
they can respond with anything that comes to mind from the question.
• Closed-ended questions have an answer set from which to choose.
Where: B = maximum sampling error (as decimal)
NP = population size (i.e., total number who could be surveyed)
NS = sample size (i.e., total number of respondents surveyed)

Pennsylvania Residents’ Opinions on and Attitudes Toward Nongame Wildlife 7
• Single or multiple response questions: Some questions allow only a single response,
while other questions allow respondents to give more than one response or choose all that
apply. Those that allow more than a single response are indicated on the graphs with the
label, “Multiple Responses Allowed.”
• Scaled questions: Many closed-ended questions (but not all) are in a scale, such as
excellent-good-fair-poor.
• Series questions: Many questions are part of a series, and the results are primarily
intended to be examined relative to the other questions in that series (although results of
the questions individually can also be valuable). Typically, results of all questions in a
series are shown together.
Most graphs show results rounded to the nearest integer; however, all data are stored in decimal
format, and all calculations are performed on unrounded numbers. For this reason, some results
may not sum to exactly 100% because of this rounding on the graphs. Additionally, rounding
may cause apparent discrepancies of 1 percentage point between the graphs and the reported
results of combined responses (e.g., when “strongly support” and “moderately support” are
summed to determine the total percentage in support).

8 Responsive Management
PERCEIVED THREATS TO NONGAME WILDLIFE IN PENNSYLVANIA
� In an open-ended question, in which no answer set is presented (i.e., respondents can say
anything that comes to mind), Pennsylvania residents were asked to name the single most
important issue or concern facing nongame wildlife in Pennsylvania today. The top concern
is habitat loss/fragmentation/degradation (named by 16%) followed by the somewhat related
concerns of urban sprawl/over-development (6%) and population growth (6%). (These
together account for more than a quarter of responses.)
• Other important issues include pollution in general (5%), polluted water specifically
(5%), and management of threatened or endangered wildlife (4%). (Note that the two
pollution-related responses, along with air pollution, named by a little less than 1%,
account for 10% of the responses.)
o Following the graph of the statewide results is a tabulation of the results for the
Congressional Districts.

Pennsylvania Residents’ Opinions on and Attitudes Toward Nongame Wildlife 9
16
6
6
5
5
4
2
2
2
1
1
9
8
32
0 20 40 60 80 100
Habitat loss / fragmentation / degradation
Urban sprawl / over-development
Population growth
Pollution in general
Polluted water / water quality
Management of threatened orendangered species
Climate change
Invasive species
Diseases
Not enough water / water quantity
Air pollution / air quality
Other
There is no important issue
Don't know
Percent (n=3660)
Q8/Q9. In your opinion, what is the most important issue or concern facing nongame
wildlife in Pennsylvania today? (Open-ended; only one response allowed.)

10 Responsive Management
Q8/Q9. In your opinion, what is the most important issue or concern facing nongame wildlife in
Pennsylvania today? (Percent giving response; only one response allowed.) D
istr
ict
Hab
itat
loss
/ f
rag
men
tati
on
/
deg
rad
ati
on
Urb
an
sp
raw
l / o
ver-
develo
pm
en
t
Po
pu
lati
on
gro
wth
Po
llu
tio
n in
gen
era
l
Po
llu
ted
wate
r / w
ate
r q
uality
Man
ag
em
en
t o
f th
reate
ne
d o
r en
dan
gere
d s
pec
ies
Clim
ate
ch
an
ge
Invasiv
e s
pecie
s
Dis
ea
ses
No
t en
ou
gh
wate
r / w
ate
r q
uan
tity
Air
po
llu
tio
n / a
ir q
ua
lity
Oth
er
Do
n't
kn
ow
1 n=200
14 8 6 6 9 6 5 0 2 3 1 7 27
2 n=208
21 4 5 12 3 4 1 1 0 2 0 5 31
3 n=202
11 7 3 4 3 10 1 3 3 0 0 9 33
4 n=201
20 5 6 7 7 3 2 2 1 1 0 12 20
5 n=201
13 7 6 2 4 3 1 3 3 1 0 9 41
6 n=216
24 4 8 3 3 3 6 1 0 3 0 5 33
7 n=202
21 7 8 5 7 2 1 1 2 0 2 13 23
8 n=201
17 8 10 4 4 1 2 1 1 3 0 8 34
9 n=200
9 7 7 4 2 2 3 2 4 0 0 13 42
10 n=201
16 4 6 4 5 1 1 2 2 1 1 5 32
11 n=200
12 3 6 5 2 4 4 1 6 1 1 12 32
12 n=202
12 8 4 5 7 3 2 1 1 1 2 14 32
13 n=205
17 8 11 7 6 6 2 1 2 0 0 5 25
14 n=200
12 7 4 4 2 7 1 9 2 1 1 8 33
15 n=202
11 10 13 3 3 2 1 2 1 2 4 7 34
16 n=206
19 5 3 6 8 2 2 1 1 1 0 8 35
17 n=201
20 4 2 7 3 3 4 1 1 0 0 14 31
18 n=212
14 7 2 4 4 4 0 4 2 1 1 10 39

Pennsylvania Residents’ Opinions on and Attitudes Toward Nongame Wildlife 11
PERCEIVED IMPORTANCE OF THE COMMISSIONS’ FUNCTIONS AND ACTIVITIES
IMPORTANCE OF COMMISSIONS’ FUNCTIONS
� The survey presented a list of five functions of the Commissions: providing opportunities for
(1) fishing, (2) hunting, and (3) wildlife viewing, as well as managing and conserving
(4) nongame wildlife and (5) threatened and endangered species. For each function,
respondents rated its importance.
• Large majorities think that each function is very important (ranging from 59% to 75%),
with managing and conserving threatened and endangered species topping the ranking
(75% think this is very important). Also note that the percentages of very important and
somewhat important combined range from 84% to 92%.
• Providing hunting opportunities has the highest percentage saying that it is a very or
somewhat unimportant function: 12% think this is an unimportant function.
o Four graphs are shown of the statewide results: the percentages saying each function
is very important, the percentages saying very or somewhat important, the percentages
saying very unimportant, and the percentages saying very or somewhat unimportant.
o Following the graphs of the statewide results are tabulations of the results for the
Congressional Districts.
o Another tabulation in this section shows how various demographic and behavioral
characteristics compare on thinking that managing and conserving nongame wildlife
is an important function of the Commissions.
o Trends graphs are shown for those questions that had the same wording in a 1996
survey and the current survey.

12 Responsive Management
75
67
64
62
59
0 20 40 60 80 100
Managing andconserving threatened
and endangeredspecies (bothCommissions)
Providing opportunitiesfor fishing (Fish and
Boat Comm.)
Providing opportunitiesfor viewing wildlife in anatural setting (Game
Comm.)
Managing andconserving nongame
wildlife (bothCommissions)
Providing opportunitiesfor hunting (Game
Comm.)
Percent
Q13-Q16, Q19. Percent of respondents who think that each of the following is a very
important function for the respective Commission:

Pennsylvania Residents’ Opinions on and Attitudes Toward Nongame Wildlife 13
92
92
90
87
84
0 20 40 60 80 100
Providing opportunitiesfor fishing (Fish and
Boat Comm.)
Managing andconserving threatened
and endangeredspecies (bothCommissions)
Providing opportunitiesfor viewing wildlife in anatural setting (Game
Comm.)
Managing andconserving nongame
wildlife (bothCommissions)
Providing opportunitiesfor hunting (Game
Comm.)
Percent
Q13-Q16, Q19. Percent of respondents who think that each of the following is a very or
somewhat important function for the respective Commission:

14 Responsive Management
6
3
3
2
2
0 20 40 60 80 100
Providing opportunitiesfor hunting (Game
Comm.)
Managing andconserving nongame
wildlife (bothCommissions)
Providing opportunitiesfor viewing wildlife in anatural setting (Game
Comm.)
Providing opportunitiesfor fishing (Fish and
Boat Comm.)
Managing andconserving threatened
and endangeredspecies (bothCommissions)
Percent
Q13-Q16, Q19. Percent of respondents who think that each of the following is a very unimportant function for the respective
Commission:

Pennsylvania Residents’ Opinions on and Attitudes Toward Nongame Wildlife 15
12
8
8
5
4
0 20 40 60 80 100
Providing opportunitiesfor hunting (Game
Comm.)
Managing andconserving nongame
wildlife (bothCommissions)
Providing opportunitiesfor viewing wildlife in anatural setting (Game
Comm.)
Providing opportunitiesfor fishing (Fish and
Boat Comm.)
Managing andconserving threatened
and endangeredspecies (bothCommissions)
Percent
Q13-Q16, Q19. Percent of respondents who think that each of the following is a very or
somewhat unimportant function for the respective Commission:

16 Responsive Management
Q13-Q16, Q19. Percent of respondents who think that each of the following is a very important
function of the respective Commission:
District
Managing and conserving nongame
wildlife (Both Commissions)
Managing and conserving
threatened and endangered
species (Both Commissions)
Providing opportunities
for fishing (Fish and Boat Comm.)
Providing opportunities for hunting
(Game Comm.)
Providing opportunities for viewing wildlife in a
natural setting (Game Comm.)
District 1 (n=200)
63 77 49 44 78
District 2 (n=208)
68 81 60 36 74
District 3 (n=202)
60 74 67 74 67
District 4 (n=201)
62 73 71 62 65
District 5 (n=201)
67 75 71 69 63
District 6 (n=216)
61 76 61 56 57
District 7 (n=202)
60 84 71 66 68
District 8 (n=201)
56 73 60 52 50
District 9 (n=200)
57 62 71 67 59
District 10 (n=201)
57 75 71 58 62
District 11 (n=200)
66 84 72 68 64
District 12 (n=202)
60 75 73 70 65
District 13 (n=205)
64 76 51 36 63
District 14 (n=200)
62 76 61 55 58
District 15 (n=202)
65 70 72 67 64
District 16 (n=206)
61 66 68 54 67
District 17 (n=201)
69 86 77 63 74
District 18 (n=212)
53 67 71 67 61

Pennsylvania Residents’ Opinions on and Attitudes Toward Nongame Wildlife 17
Q13-Q16, Q19. Percent of respondents who think that each of the following is a very or
somewhat important function of the respective Commission:
District
Managing and conserving nongame
wildlife (Both Commissions)
Managing and conserving
threatened and endangered
species (Both Commissions)
Providing opportunities
for fishing (Fish and Boat Comm.)
Providing opportunities for hunting
(Game Comm.)
Providing opportunities for viewing wildlife in a
natural setting (Game Comm.)
District 1 (n=200)
81 91 89 60 94
District 2 (n=208)
83 90 82 60 92
District 3 (n=202)
80 87 94 93 87
District 4 (n=201)
88 86 95 87 85
District 5 (n=201)
92 96 92 92 87
District 6 (n=216)
85 91 92 78 81
District 7 (n=202)
86 95 90 87 91
District 8 (n=201)
95 94 92 83 84
District 9 (n=200)
86 86 92 88 89
District 10 (n=201)
87 95 96 90 94
District 11 (n=200)
89 95 94 90 89
District 12 (n=202)
85 92 95 90 90
District 13 (n=205)
92 96 90 74 93
District 14 (n=200)
83 91 92 76 93
District 15 (n=202)
86 93 97 91 92
District 16 (n=206)
90 92 90 88 90
District 17 (n=201)
88 96 97 86 93
District 18 (n=212)
86 92 93 91 86

18 Responsive Management
Q13-Q16, Q19. Percent of respondents who think that each of the following is a very
unimportant function of the respective Commission:
District
Managing and conserving nongame
wildlife (Both Commissions)
Managing and conserving
threatened and endangered
species (Both Commissions)
Providing opportunities
for fishing (Fish and Boat Comm.)
Providing opportunities for hunting
(Game Comm.)
Providing opportunities for viewing wildlife in a
natural setting (Game Comm.)
District 1 (n=200)
2 1 4 23 2
District 2 (n=208)
8 3 5 16 2
District 3 (n=202)
2 2 1 3 1
District 4 (n=201)
4 2 1 4 2
District 5 (n=201)
1 2 1 3 4
District 6 (n=216)
7 2 2 6 10
District 7 (n=202)
3 2 4 7 2
District 8 (n=201)
1 1 3 3 7
District 9 (n=200)
3 5 3 5 2
District 10 (n=201)
1 0 0 4 0
District 11 (n=200)
1 1 0 1 2
District 12 (n=202)
3 1 1 3 2
District 13 (n=205)
1 1 1 8 1
District 14 (n=200)
2 0 0 6 2
District 15 (n=202)
4 2 1 3 1
District 16 (n=206)
3 1 0 4 2
District 17 (n=201)
3 1 1 6 1
District 18 (n=212)
3 1 2 3 5

Pennsylvania Residents’ Opinions on and Attitudes Toward Nongame Wildlife 19
Q13-Q16, Q19. Percent of respondents who think that each of the following is a very or
somewhat unimportant function of the respective Commission:
District
Managing and conserving nongame
wildlife (Both Commissions)
Managing and conserving
threatened and endangered
species (Both Commissions)
Providing opportunities
for fishing (Fish and Boat Comm.)
Providing opportunities for hunting
(Game Comm.)
Providing opportunities for viewing wildlife in a
natural setting (Game Comm.)
District 1 (n=200)
6 3 8 37 5
District 2 (n=208)
10 5 13 32 5
District 3 (n=202)
15 4 5 5 6
District 4 (n=201)
8 6 2 6 12
District 5 (n=201)
5 4 3 5 12
District 6 (n=216)
10 3 6 17 16
District 7 (n=202)
12 3 7 12 8
District 8 (n=201)
3 3 5 13 15
District 9 (n=200)
10 7 5 10 7
District 10 (n=201)
10 2 3 7 5
District 11 (n=200)
6 2 2 6 8
District 12 (n=202)
9 5 2 6 7
District 13 (n=205)
4 2 5 19 6
District 14 (n=200)
6 2 2 10 4
District 15 (n=202)
9 3 2 6 4
District 16 (n=206)
6 3 4 8 8
District 17 (n=201)
7 2 3 12 5
District 18 (n=212)
10 4 6 7 9

20 Responsive Management
This table shows how various demographic and behavioral characteristics compare on thinking
that managing and conserving nongame wildlife is an important function of the Commissions.
Statewide, 86.9% think this is an important function. This shows that, for instance, residents of
Congressional District 8 have a greater rate of thinking this is an important function (94.9%) than
do residents statewide. On the other hand, residents of Congressional District 3 have a lower rate
(79.8%) than residents statewide. (The statewide percentage is in the shaded row; characteristics
above the shaded row have a greater rate of thinking this is an important function than residents
statewide; characteristics below the shaded row have a lower rate than residents statewide.)
Characteristic: Thinks that managing and conserving nongame wildlife is an important function of the Commissions
Percent of those with that characteristic
who think this is an important function
Congressional District 8 94.9
Congressional District 13 92.3
Congressional District 5 91.5
Participated in photographing wildlife 90.6
Congressional District 16 90.3
Female 89.2
Participated in maintaining areas around your home to benefit fish and wildlife 89.1
Education level is at least a bachelor's degree 89.1
Congressional District 11 89.0
Participated in birdwatching or wildlife watching 89.0
Participated in hiking 88.8
Participated in searching for amphibians or reptiles 88.7
Congressional District 4 88.5
Participated in boating, canoeing, or kayaking 88.1
Participated in backpacking 88.0
Congressional District 17 87.9
Participated in car camping 87.8
Participated in fishing 87.3
Younger than the median age (48) 87.2
Lives in a large city or urban area 87.2
Median age (48) or older 87.2
Congressional District 10 87.1 Statewide 86.9 Lives in a small city / town or rural area 86.9
Congressional District 9 86.4
Congressional District 15 86.1
Congressional District 7 85.9
Congressional District 18 85.8
Education level is less than bachelor's degree 85.8
Congressional District 12 85.4
Congressional District 6 85.0
Participated in hunting 84.3
Male 84.3
Congressional District 2 83.5
Congressional District 14 83.3
Congressional District 1 80.8
Congressional District 3 79.8

Pennsylvania Residents’ Opinions on and Attitudes Toward Nongame Wildlife 21
49
33
49
5
63
26
2 5 3
0
20
40
60
80
100
Very important Somewhatimportant
Neither Somewhatunimportant
Veryunimportant
Pe
rce
nt
Q16. Do you think managing and conserving nongame wildlife is an important or unimportant function of the
Fish and Boat and Game Commissions?
1996
2014

22 Responsive Management
52
28
5 8 7
60
25
36 6
0
20
40
60
80
100
Very important Somewhatimportant
Neither / Don'tknow
Somewhatunimportant
Veryunimportant
Pe
rce
nt
Q13. Do you think providing opportunities for hunting is an important or unimportant function of the Game
Commission?
1996
2014
64
27
3 4 2
67
26
2 3 20
20
40
60
80
100
Veryimportant
Somewhatimportant
Neither / Don'tknow
Somewhatunimportant
Veryunimportant
Pe
rce
nt
Q14. Do you think providing opportunities for fishing is an important or unimportant function of the Fish
and Boat Commission?
1996
2014

Pennsylvania Residents’ Opinions on and Attitudes Toward Nongame Wildlife 23
IMPORTANCE OF COMMISSIONS’ ACTIVITIES
� The survey presented a list of 11 activities of the Commissions and asked respondents to rate
the importance of each. In looking at the results together, the activities fall into three tiers.
The top activities in importance are addressing wildlife diseases (80% rate this as very
important) and enforcing wildlife laws (79%). In the second tier, four more activities all
have two-thirds or more saying that they are very important: restoring and improving habitat
(73%), addressing invasive species (72%), conservation actions for nongame species at risk
(68%), and educating the public about nongame wildlife (67%).
• At the bottom are reintroducing nongame species that once existed in Pennsylvania and
addressing wildlife damage.
o Four graphs are shown of the statewide results: the percentages thinking each activity
is very important, the percentages saying very or somewhat important, and graphs for
very unimportant and very or somewhat unimportant. Note that the ranking for very
important is nearly identical to the ranking for very and somewhat important.
o Following the graphs of the statewide results are tabulations of the results for the
Congressional Districts.

24 Responsive Management
80
79
73
72
68
67
59
53
49
47
38
0 20 40 60 80 100
Addressing wildlife diseases
Enforcing wildlife laws
Restoring and improving habitat for wildlife
Addressing invasive species, that is, species thatmay adversely affect or disrupt habitats or other
wildlife
Conservation actions, such has habitat protectionor improvement, for nongame species that are at
risk before they become endangered
Educating the public about Pennsylvania'snongame wildlife
Purchasing land for the purpose of protectingspecies that are declining or in need of
conservation
Monitoring nongame wildlife populations
Managing for a variety of nongame wildlifespecies as compared to managing for a particular
species
Addressing problems and damage caused bynongame wild birds and mammals
Reintroducing nongame species that once existedin Pennsylvania
Percent
Q29-Q39. Percent of respondents who think that each of the following is a very important activity
for the Commissions:

Pennsylvania Residents’ Opinions on and Attitudes Toward Nongame Wildlife 25
96
96
94
92
91
90
85
82
81
76
69
0 20 40 60 80 100
Enforcing wildlife laws
Addressing wildlife diseases
Restoring and improving habitat for wildlife
Addressing invasive species, that is, species thatmay adversely affect or disrupt habitats or other
wildlife
Conservation actions, such has habitat protectionor improvement, for nongame species that are at
risk before they become endangered
Educating the public about Pennsylvania'snongame wildlife
Monitoring nongame wildlife populations
Purchasing land for the purpose of protectingspecies that are declining or in need of
conservation
Managing for a variety of nongame wildlifespecies as compared to managing for a particular
species
Addressing problems and damage caused bynongame wild birds and mammals
Reintroducing nongame species that once existedin Pennsylvania
Percent
Q29-Q39. Percent of respondents who think that each of the following is a very or somewhat
important activity for the Commissions:

26 Responsive Management
10
9
6
3
3
3
2
2
2
1
1
0 20 40 60 80 100
Reintroducing nongame species that once existedin Pennsylvania
Addressing problems and damage caused bynongame wild birds and mammals
Purchasing land for the purpose of protectingspecies that are declining or in need of
conservation
Monitoring nongame wildlife populations
Educating the public about Pennsylvania'snongame wildlife
Managing for a variety of nongame wildlifespecies as compared to managing for a particular
species
Conservation actions, such has habitat protectionor improvement, for nongame species that are at
risk before they become endangered
Addressing invasive species, that is, species thatmay adversely affect or disrupt habitats or other
wildlife
Restoring and improving habitat for wildlife
Enforcing wildlife laws
Addressing wildlife diseases
Percent
Q29-Q39. Percent of respondents who think that each of the following is a very unimportant
activity for the Commissions:

Pennsylvania Residents’ Opinions on and Attitudes Toward Nongame Wildlife 27
21
18
12
10
9
7
5
4
3
2
2
0 20 40 60 80 100
Reintroducing nongame species that once existedin Pennsylvania
Addressing problems and damage caused bynongame wild birds and mammals
Purchasing land for the purpose of protectingspecies that are declining or in need of
conservation
Monitoring nongame wildlife populations
Managing for a variety of nongame wildlifespecies as compared to managing for a particular
species
Educating the public about Pennsylvania'snongame wildlife
Conservation actions, such has habitat protectionor improvement, for nongame species that are at
risk before they become endangered
Addressing invasive species, that is, species thatmay adversely affect or disrupt habitats or other
wildlife
Restoring and improving habitat for wildlife
Addressing wildlife diseases
Enforcing wildlife laws
Percent
Q29-Q39. Percent of respondents who think that each of the following is a very or somewhat unimportant activity for the Commissions:

28 Responsive Management
Q29-Q39. Percent of respondents who think that each of the following is a very important
activity of the Commissions: D
istr
ict
Ad
dre
ss
ing
in
vas
ive s
pec
ies
, th
at
is,
sp
ec
ies
th
at
may
ad
ve
rse
ly a
ffec
t o
r d
isru
pt
hab
ita
ts
or
oth
er
wil
dli
fe
Ad
dre
ss
ing
pro
ble
ms
an
d d
am
ag
e c
au
se
d b
y
no
ng
am
e w
ild
bir
ds
an
d m
am
ma
ls
Ad
dre
ss
ing
wil
dli
fe d
isea
ses
Co
ns
erv
ati
on
ac
tio
ns
, s
uch
ha
s h
ab
ita
t p
rote
cti
on
or
imp
rov
em
en
t, f
or
no
ng
am
e
sp
ec
ies
th
at
are
at
ris
k b
efo
re t
he
y b
ec
om
e
en
da
ng
ere
d
Ed
uc
ati
ng
th
e p
ub
lic a
bo
ut
Pe
nn
sy
lva
nia
's
no
ng
am
e w
ild
life
En
forc
ing
wil
dlife
la
ws
Ma
na
gin
g f
or
a v
ari
ety
of
no
ng
am
e w
ild
life
s
pe
cie
s a
s c
om
pa
red
to
man
ag
ing
fo
r a
p
art
icu
lar
sp
ecie
s
Mo
nit
ori
ng
no
ng
am
e w
ild
life
po
pu
lati
on
s
Pu
rch
as
ing
la
nd
fo
r th
e p
urp
os
e o
f p
rote
cti
ng
s
pe
cie
s t
ha
t a
re d
ec
lin
ing
or
in n
eed
of
co
ns
erv
ati
on
Re
intr
od
uc
ing
no
ng
am
e s
pec
ies
th
at
on
ce
e
xis
ted
in
Pen
ns
ylv
an
ia
Re
sto
rin
g a
nd
im
pro
vin
g h
ab
ita
t fo
r w
ild
life
1 n=200
70 49 84 76 68 78 55 56 73 47 76
2 n=208
74 59 86 83 84 85 66 70 75 45 81
3 n=202
78 55 86 68 63 77 41 54 52 29 76
4 n=201
76 43 82 65 66 84 49 51 56 34 76
5 n=201
72 47 84 66 69 77 52 52 52 36 73
6 n=216
79 40 80 71 60 79 43 59 66 37 77
7 n=202
82 44 75 68 67 85 51 54 58 37 79
8 n=201
71 41 71 68 66 73 43 45 53 36 68
9 n=200
60 46 81 60 58 75 47 47 50 40 69
10 n=201
72 47 89 62 71 91 44 52 55 40 82
11 n=200
69 48 79 67 74 83 49 56 61 49 74
12 n=202
69 44 81 64 65 77 51 49 56 39 72
13 n=205
66 30 75 69 66 74 43 55 61 42 70
14 n=200
76 55 79 68 65 77 60 60 63 29 63
15 n=202
68 46 69 63 63 79 41 51 58 37 77
16 n=206
69 44 67 50 55 72 35 38 48 29 61
17 n=201
74 51 85 80 74 90 58 56 72 40 82
18 n=212
72 52 81 68 69 73 52 53 52 41 65

Pennsylvania Residents’ Opinions on and Attitudes Toward Nongame Wildlife 29
Q29-Q39. Percent of respondents who think that each of the following is a very or somewhat
important activity of the Commissions: D
istr
ict
Ad
dre
ss
ing
in
vas
ive s
pec
ies
, th
at
is,
sp
ec
ies
th
at
may
ad
ve
rse
ly a
ffec
t o
r d
isru
pt
hab
ita
ts o
r o
the
r w
ild
life
Ad
dre
ss
ing
pro
ble
ms
an
d d
am
ag
e c
au
se
d b
y
no
ng
am
e w
ild
bir
ds
an
d m
am
ma
ls
Ad
dre
ss
ing
wil
dli
fe d
isea
ses
Co
ns
erv
ati
on
ac
tio
ns
, s
uch
ha
s h
ab
ita
t p
rote
cti
on
or
imp
rov
em
en
t, f
or
no
ng
am
e
sp
ec
ies
th
at
are
at
ris
k b
efo
re t
he
y b
ec
om
e
en
da
ng
ere
d
Ed
uc
ati
ng
th
e p
ub
lic a
bo
ut
Pe
nn
sy
lva
nia
's
no
ng
am
e w
ild
life
En
forc
ing
wil
dlife
la
ws
Ma
na
gin
g f
or
a v
ari
ety
of
no
ng
am
e w
ild
life
s
pe
cie
s a
s c
om
pa
red
to
man
ag
ing
fo
r a
p
art
icu
lar
sp
ecie
s
Mo
nit
ori
ng
no
ng
am
e w
ild
life
po
pu
lati
on
s
Pu
rch
as
ing
la
nd
fo
r th
e p
urp
os
e o
f p
rote
cti
ng
s
pe
cie
s t
ha
t a
re d
ec
lin
ing
or
in n
eed
of
co
ns
erv
ati
on
Re
intr
od
uc
ing
no
ng
am
e s
pec
ies
th
at
on
ce
e
xis
ted
in
Pen
ns
ylv
an
ia
Re
sto
rin
g a
nd
im
pro
vin
g h
ab
ita
t fo
r w
ild
life
1 n=200
94 70 97 90 90 94 82 80 87 73 93
2 n=208
90 76 92 92 91 91 76 90 88 66 92
3 n=202
93 77 96 89 79 89 77 79 78 59 93
4 n=201
91 75 97 87 90 96 82 83 80 68 92
5 n=201
92 83 98 93 92 98 87 86 80 68 94
6 n=216
95 65 97 96 93 96 74 90 85 70 95
7 n=202
94 73 94 91 93 97 86 85 84 73 94
8 n=201
92 72 94 94 93 95 81 89 81 67 96
9 n=200
91 72 97 86 87 96 82 78 76 68 93
10 n=201
92 80 98 92 92 98 84 86 78 76 97
11 n=200
91 79 94 93 92 98 76 84 82 71 95
12 n=202
91 74 97 87 86 97 82 83 79 67 95
13 n=205
89 72 93 90 92 91 81 86 84 68 93
14 n=200
94 86 99 92 90 97 83 91 81 68 92
15 n=202
91 79 95 88 90 98 80 76 85 67 97
16 n=206
94 78 95 93 91 97 83 86 83 73 94
17 n=201
94 76 97 93 92 98 81 92 88 73 97
18 n=212
94 78 92 88 89 98 81 84 78 70 91

30 Responsive Management
Q29-Q39. Percent of respondents who think that each of the following is a very unimportant
activity of the Commissions: D
istr
ict
Ad
dre
ss
ing
in
vas
ive s
pec
ies
, th
at
is,
sp
ec
ies
th
at
may
ad
ve
rse
ly a
ffec
t o
r d
isru
pt
hab
ita
ts o
r o
the
r w
ild
life
Ad
dre
ss
ing
pro
ble
ms
an
d d
am
ag
e c
au
se
d b
y
no
ng
am
e w
ild
bir
ds
an
d m
am
ma
ls
Ad
dre
ss
ing
wil
dli
fe d
isea
ses
Co
ns
erv
ati
on
ac
tio
ns
, s
uch
ha
s h
ab
ita
t p
rote
cti
on
or
imp
rov
em
en
t, f
or
no
ng
am
e
sp
ec
ies
th
at
are
at
ris
k b
efo
re t
he
y b
ec
om
e
en
da
ng
ere
d
Ed
uc
ati
ng
th
e p
ub
lic a
bo
ut
Pe
nn
sy
lva
nia
's
no
ng
am
e w
ild
life
En
forc
ing
wil
dlife
la
ws
Ma
na
gin
g f
or
a v
ari
ety
of
no
ng
am
e w
ild
life
s
pe
cie
s a
s c
om
pa
red
to
man
ag
ing
fo
r a
p
art
icu
lar
sp
ecie
s
Mo
nit
ori
ng
no
ng
am
e w
ild
life
po
pu
lati
on
s
Pu
rch
as
ing
la
nd
fo
r th
e p
urp
os
e o
f p
rote
cti
ng
s
pe
cie
s t
ha
t a
re d
ec
lin
ing
or
in n
eed
of
co
ns
erv
ati
on
Re
intr
od
uc
ing
no
ng
am
e s
pec
ies
th
at
on
ce
e
xis
ted
in
Pen
ns
ylv
an
ia
Re
sto
rin
g a
nd
im
pro
vin
g h
ab
ita
t fo
r w
ild
life
1 n=200
2 7 0 3 2 1 4 1 4 7 1
2 n=208
6 9 0 5 3 4 7 3 6 17 4
3 n=202
2 11 2 2 12 0 2 4 6 8 1
4 n=201
1 9 0 4 5 1 4 4 10 12 2
5 n=201
2 7 1 2 4 1 3 5 8 13 2
6 n=216
1 17 0 1 1 1 2 2 3 10 1
7 n=202
1 9 2 4 2 2 2 4 4 8 2
8 n=201
1 9 1 2 1 0 3 3 5 10 1
9 n=200
2 9 0 3 2 0 6 5 12 13 1
10 n=201
0 7 0 2 4 1 3 4 8 8 1
11 n=200
2 8 2 2 1 0 3 2 4 7 1
12 n=202
2 7 1 3 5 0 2 5 5 12 1
13 n=205
1 10 1 1 1 2 1 2 2 7 1
14 n=200
0 5 0 1 1 0 2 2 2 5 1
15 n=202
2 12 1 4 5 1 4 6 6 10 2
16 n=206
2 5 1 2 3 1 2 3 3 7 3
17 n=201
2 8 0 1 1 1 3 2 4 9 1
18 n=212
1 8 1 3 5 0 4 4 7 10 2
Pennsylvania Residents’ Opinions on and Attitudes Toward Nongame Wildlife 31
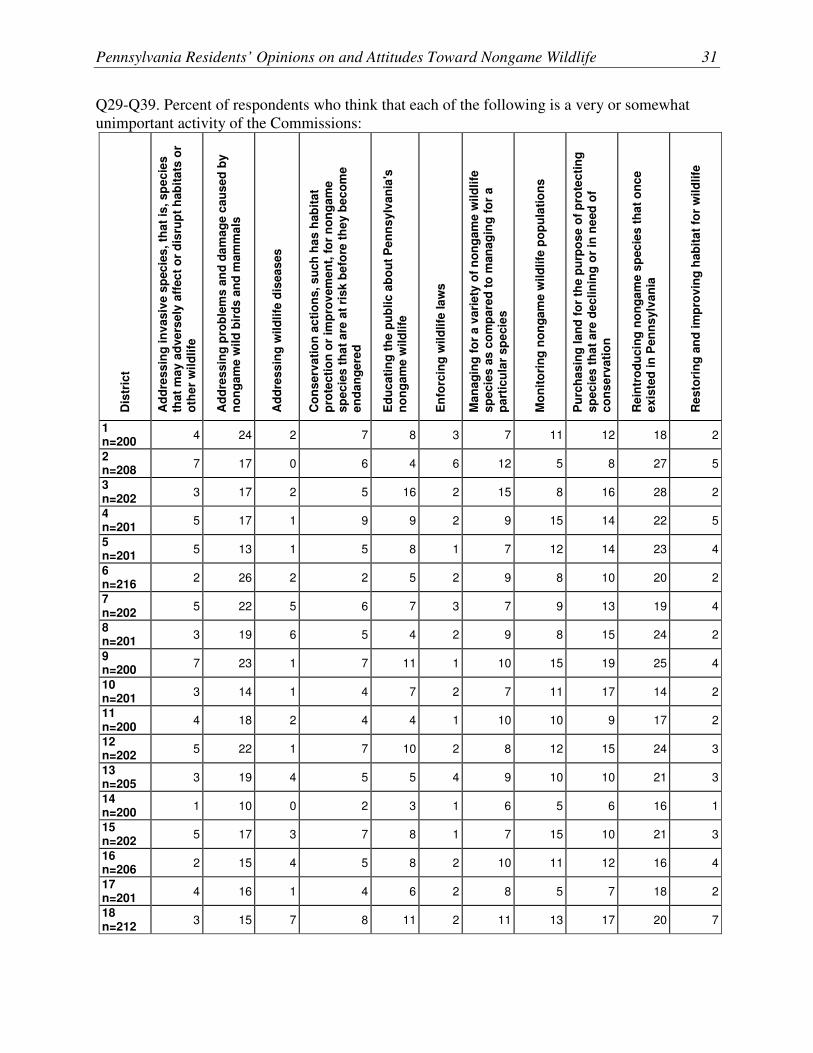
Q29-Q39. Percent of respondents who think that each of the following is a very or somewhat
unimportant activity of the Commissions: D
istr
ict
Ad
dre
ss
ing
in
vas
ive s
pec
ies
, th
at
is,
sp
ec
ies
th
at
may
ad
ve
rse
ly a
ffec
t o
r d
isru
pt
hab
ita
ts o
r o
the
r w
ild
life
Ad
dre
ss
ing
pro
ble
ms
an
d d
am
ag
e c
au
se
d b
y
no
ng
am
e w
ild
bir
ds
an
d m
am
ma
ls
Ad
dre
ss
ing
wil
dli
fe d
isea
ses
Co
ns
erv
ati
on
ac
tio
ns
, s
uch
ha
s h
ab
ita
t p
rote
cti
on
or
imp
rov
em
en
t, f
or
no
ng
am
e
sp
ec
ies
th
at
are
at
ris
k b
efo
re t
he
y b
ec
om
e
en
da
ng
ere
d
Ed
uc
ati
ng
th
e p
ub
lic a
bo
ut
Pe
nn
sy
lva
nia
's
no
ng
am
e w
ild
life
En
forc
ing
wil
dlife
la
ws
Ma
na
gin
g f
or
a v
ari
ety
of
no
ng
am
e w
ild
life
s
pe
cie
s a
s c
om
pa
red
to
man
ag
ing
fo
r a
p
art
icu
lar
sp
ecie
s
Mo
nit
ori
ng
no
ng
am
e w
ild
life
po
pu
lati
on
s
Pu
rch
as
ing
la
nd
fo
r th
e p
urp
os
e o
f p
rote
cti
ng
s
pe
cie
s t
ha
t a
re d
ec
lin
ing
or
in n
eed
of
co
ns
erv
ati
on
Re
intr
od
uc
ing
no
ng
am
e s
pec
ies
th
at
on
ce
e
xis
ted
in
Pen
ns
ylv
an
ia
Re
sto
rin
g a
nd
im
pro
vin
g h
ab
ita
t fo
r w
ild
life
1 n=200
4 24 2 7 8 3 7 11 12 18 2
2 n=208
7 17 0 6 4 6 12 5 8 27 5
3 n=202
3 17 2 5 16 2 15 8 16 28 2
4 n=201
5 17 1 9 9 2 9 15 14 22 5
5 n=201
5 13 1 5 8 1 7 12 14 23 4
6 n=216
2 26 2 2 5 2 9 8 10 20 2
7 n=202
5 22 5 6 7 3 7 9 13 19 4
8 n=201
3 19 6 5 4 2 9 8 15 24 2
9 n=200
7 23 1 7 11 1 10 15 19 25 4
10 n=201
3 14 1 4 7 2 7 11 17 14 2
11 n=200
4 18 2 4 4 1 10 10 9 17 2
12 n=202
5 22 1 7 10 2 8 12 15 24 3
13 n=205
3 19 4 5 5 4 9 10 10 21 3
14 n=200
1 10 0 2 3 1 6 5 6 16 1
15 n=202
5 17 3 7 8 1 7 15 10 21 3
16 n=206
2 15 4 5 8 2 10 11 12 16 4
17 n=201
4 16 1 4 6 2 8 5 7 18 2
18 n=212
3 15 7 8 11 2 11 13 17 20 7

32 Responsive Management
PERCEIVED PRIORITIES OF THE COMMISSIONS
� Four questions asked about whether more, the same, or less effort should be directed to
managing and conserving four types of nongame wildlife: birds, small mammals,
reptiles/amphibians, and fish.
• For birds such as birds of prey, songbirds, and shorebirds, the most common response
was “more” (37.1%—rounds to 37%), just ahead of “the same” (36.6%—rounds to 37%).
For the other three types of wildlife, the most common response was “the same” (ranging
from 37% to 39%). For all types of wildlife, the percentage saying “more” effort should
be directed to managing and conserving it (24% to 37%) exceeded the percentage saying
“less” (8% to 16%).
• In comparing the four types of wildlife, the most concern is for birds: 37% want more
effort directed to managing and conserving birds, compared to 24% to 30% for the other
types.
o Following the graph of the statewide results are tabulations of the results for the
Congressional Districts.

Pennsylvania Residents’ Opinions on and Attitudes Toward Nongame Wildlife 33
37
37
8
18
28
38
16
18
30
39
11
20
24
37
12
27
0 20 40 60 80 100
More
Same
Less
Don't know
Percent (n=3660)
Q23-Q26. Do you think the Game Commission / Fish and Boat Commission should direct more,
the same, or less effort to managing and conserving nongame:
Birds such as birds ofprey, songbirds, andshorebirds
Mammals, such aschipmunks, bats, andflying squirrels
Reptiles and amphibians,such as salamanders andturtles
Fish such as darters,chubs, and shiners

34 Responsive Management
Q23. Do you think the Game Commission should direct more, the same, or less effort to
managing and conserving nongame birds such as birds of prey, songbirds, and shorebirds? This
does not include game birds like turkeys, pheasants, or grouse.
District More Same Less Don't know
District 1 (n=200) 48 28 6 18
District 2 (n=208) 52 20 9 18
District 3 (n=202) 30 42 9 19
District 4 (n=201) 27 39 11 22
District 5 (n=201) 33 47 9 10
District 6 (n=216) 36 33 13 18
District 7 (n=202) 48 32 5 15
District 8 (n=201) 38 37 5 20
District 9 (n=200) 31 39 10 21
District 10 (n=201) 33 38 13 16
District 11 (n=200) 37 39 7 17
District 12 (n=202) 34 38 13 14
District 13 (n=205) 47 26 2 24
District 14 (n=200) 31 48 3 18
District 15 (n=202) 37 42 5 15
District 16 (n=206) 32 42 6 21
District 17 (n=201) 38 38 6 18
District 18 (n=212) 35 31 9 25
Q24. Do you think the Game Commission should direct more, the same, or less effort to
managing and conserving nongame mammals, such as chipmunks, bats, and flying squirrels?
This does not include bear, groundhogs, or porcupines and other game animals.
District More Same Less Don't know
District 1 (n=200) 39 37 8 16
District 2 (n=208) 47 18 17 18
District 3 (n=202) 17 44 25 14
District 4 (n=201) 18 45 18 19
District 5 (n=201) 29 40 15 16
District 6 (n=216) 28 36 17 18
District 7 (n=202) 34 38 13 14
District 8 (n=201) 31 39 12 18
District 9 (n=200) 26 32 23 18
District 10 (n=201) 28 45 13 14
District 11 (n=200) 28 42 13 17
District 12 (n=202) 25 37 21 17
District 13 (n=205) 36 27 13 24
District 14 (n=200) 21 45 13 22
District 15 (n=202) 22 45 16 17
District 16 (n=206) 24 43 9 24
District 17 (n=201) 28 43 13 16
District 18 (n=212) 22 34 25 20

Pennsylvania Residents’ Opinions on and Attitudes Toward Nongame Wildlife 35
Q25. Do you think the Fish and Boat Commission should direct more, the same, or less effort to
managing and conserving nongame reptiles and amphibians, such as salamanders and turtles?
This does not include bullfrogs.
District More Same Less Don't know
District 1 (n=200) 38 36 9 17
District 2 (n=208) 40 31 9 19
District 3 (n=202) 21 38 20 21
District 4 (n=201) 22 45 11 22
District 5 (n=201) 23 46 14 17
District 6 (n=216) 33 35 14 18
District 7 (n=202) 35 38 8 19
District 8 (n=201) 33 38 10 19
District 9 (n=200) 20 41 15 24
District 10 (n=201) 27 44 10 19
District 11 (n=200) 34 37 8 21
District 12 (n=202) 26 41 16 17
District 13 (n=205) 41 27 4 28
District 14 (n=200) 28 46 6 20
District 15 (n=202) 30 43 9 17
District 16 (n=206) 23 40 9 28
District 17 (n=201) 30 44 8 17
District 18 (n=212) 27 36 14 23
Q26. Do you think the Fish and Boat Commission should direct more, the same, or less effort to
managing and conserving nongame fish such as darters, chubs, and shiners? This does not
include game fish like bass or trout.
District More Same Less Don't know
District 1 (n=200) 37 27 7 30
District 2 (n=208) 37 31 8 24
District 3 (n=202) 20 36 16 28
District 4 (n=201) 18 42 13 27
District 5 (n=201) 21 48 10 22
District 6 (n=216) 25 29 20 26
District 7 (n=202) 32 34 13 21
District 8 (n=201) 25 34 8 33
District 9 (n=200) 17 38 17 29
District 10 (n=201) 26 38 8 28
District 11 (n=200) 27 36 12 26
District 12 (n=202) 20 38 18 24
District 13 (n=205) 32 30 6 32
District 14 (n=200) 18 49 5 28
District 15 (n=202) 19 43 11 27
District 16 (n=206) 22 40 7 30
District 17 (n=201) 24 38 13 25
District 18 (n=212) 17 34 19 30

36 Responsive Management
OPINIONS ON PENNSYLVANIA’S STATE WILDLIFE ACTION PLAN
� When asked if they had heard of Pennsylvania’s State Wildlife Action Plan, 12% of
Pennsylvania residents indicate having heard of it. This is about 1 in 8 residents.
• Following this question, respondents were informed that the Plan contains information
pertaining to four main areas: species of greatest conservation need, habitat conditions
where those species live, threats to species and habitats, and conservation actions to
lessen those threats.
• After this information was given to respondents, they were asked to say which area they
thought was the most important. Although responses were distributed among all four
areas, the top two were conservation actions to lessen threats (30% chose this) and habitat
conditions where species of greatest conservation need live (29%).
o Following each graph of the statewide results is a tabulation of the results for the
Congressional Districts.
o Another tabulation shows a comparison of demographic and behavioral groups on
whether they had heard of the Plan.

Pennsylvania Residents’ Opinions on and Attitudes Toward Nongame Wildlife 37
12
86
2
0 20 40 60 80 100
Yes
No
Don't know
Percent (n=3660)
Q40. Have you heard of Pennsylvania's State Wildlife Action Plan?

38 Responsive Management
Q40. Have you heard of Pennsylvania's State Wildlife Action Plan?
District Yes No Don't know
District 1 (n=200) 7 92 0
District 2 (n=208) 12 87 1
District 3 (n=202) 12 78 10
District 4 (n=201) 15 83 3
District 5 (n=201) 16 81 3
District 6 (n=216) 16 82 2
District 7 (n=202) 18 81 1
District 8 (n=201) 8 91 1
District 9 (n=200) 7 92 1
District 10 (n=201) 11 85 4
District 11 (n=200) 11 88 1
District 12 (n=202) 11 88 1
District 13 (n=205) 8 89 3
District 14 (n=200) 15 83 1
District 15 (n=202) 11 86 2
District 16 (n=206) 13 84 3
District 17 (n=201) 16 83 0
District 18 (n=212) 12 87 1

Pennsylvania Residents’ Opinions on and Attitudes Toward Nongame Wildlife 39
This table shows how various demographic and behavioral characteristics compare on having
heard of Pennsylvania’s State Wildlife Action Plan. Statewide, 12.2% have heard of the Plan.
This shows that, for instance, residents of Congressional District 7 have a greater rate of having
heard about the Plan (17.6%) than do residents statewide. On the other hand, residents of
Congressional District 9 have a lower rate (7.4%) than residents statewide. (The statewide
percentage is in the shaded row; characteristics above the shaded row have a higher rate of
having heard of the Plan than residents statewide; characteristics below the shaded row have a
lower rate than residents statewide.)
Characteristic: Has heard of Pennsylvania’s State Wildlife Action Plan
Percent of those with that characteristic
who have heard of the Plan
Participated in backpacking 20.9
Participated in hunting 20.3
Participated in car camping 18.6
Congressional District 7 17.6
Participated in boating, canoeing, or kayaking 17.0
Participated in fishing 16.8
Congressional District 5 16.4
Congressional District 17 16.3
Participated in searching for amphibians or reptiles 15.9
Congressional District 6 15.7
Participated in hiking 15.6
Male 15.2
Congressional District 14 15.1
Participated in photographing wildlife 14.8
Participated in birdwatching or wildlife watching 14.8
Congressional District 4 14.8
Participated in maintaining areas around your home to benefit fish and wildlife 14.3
Lives in a small city / town or rural area 13.6
Younger than the median age (48) 13.4
Education level is at least a bachelor's degree 13.1
Congressional District 16 12.8 Statewide 12.2
Congressional District 18 12.2
Congressional District 2 12.1
Education level is less than bachelor's degree 11.7
Congressional District 3 11.6
Congressional District 15 11.3
Congressional District 10 11.2
Median age (48) or older 11.0
Congressional District 12 11.0
Lives in a large city or urban area 10.5
Congressional District 11 10.5
Female 9.4
Congressional District 8 8.2
Congressional District 13 7.7
Congressional District 1 7.4
Congressional District 9 7.4

40 Responsive Management
10
29
17
30
14
0 20 40 60 80 100
Species of greatestconservation need
Habitat conditionwhere those species
live
Threats to species andhabitats
Conservation actionsto lessen those threats
Don't know
Percent (n=3660)
Q42. In general, which one of the four main areas addressed in the State Wildlife Action
Plan do you think is the most important? (The four areas were explained to the respondent
prior to the question.)
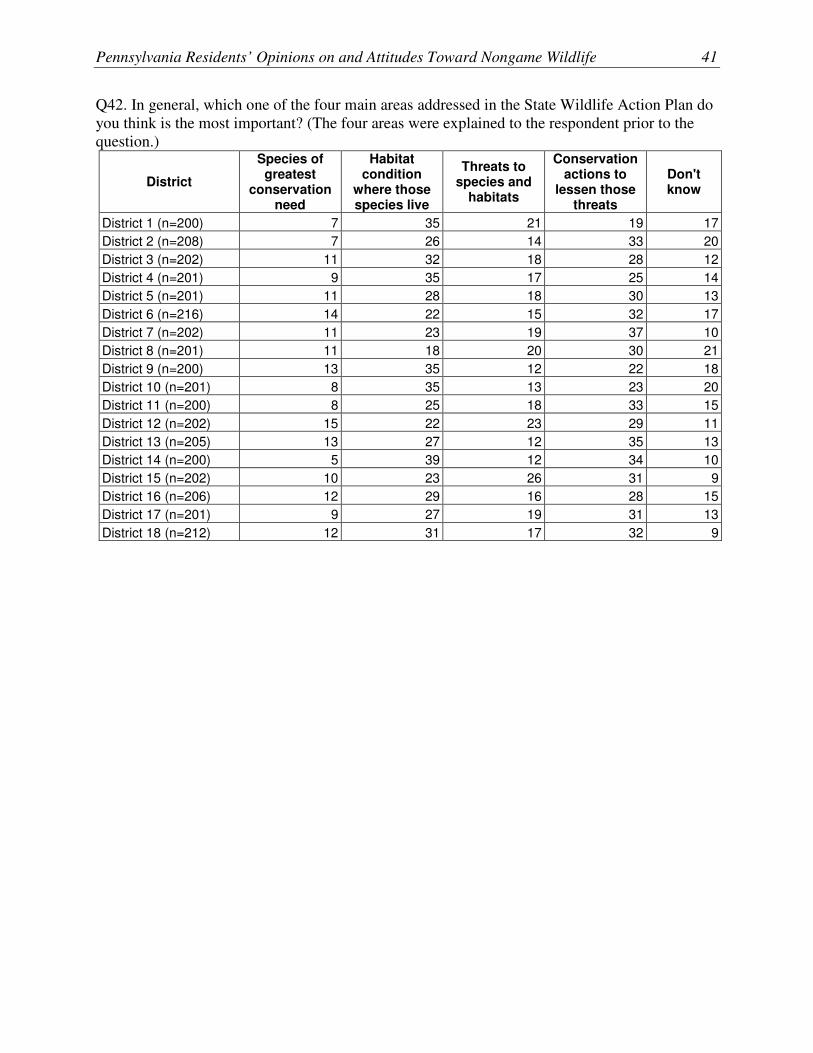
Pennsylvania Residents’ Opinions on and Attitudes Toward Nongame Wildlife 41
Q42. In general, which one of the four main areas addressed in the State Wildlife Action Plan do
you think is the most important? (The four areas were explained to the respondent prior to the
question.)
District
Species of greatest
conservation need
Habitat condition
where those species live
Threats to species and
habitats
Conservation actions to
lessen those threats
Don't know
District 1 (n=200) 7 35 21 19 17
District 2 (n=208) 7 26 14 33 20
District 3 (n=202) 11 32 18 28 12
District 4 (n=201) 9 35 17 25 14
District 5 (n=201) 11 28 18 30 13
District 6 (n=216) 14 22 15 32 17
District 7 (n=202) 11 23 19 37 10
District 8 (n=201) 11 18 20 30 21
District 9 (n=200) 13 35 12 22 18
District 10 (n=201) 8 35 13 23 20
District 11 (n=200) 8 25 18 33 15
District 12 (n=202) 15 22 23 29 11
District 13 (n=205) 13 27 12 35 13
District 14 (n=200) 5 39 12 34 10
District 15 (n=202) 10 23 26 31 9
District 16 (n=206) 12 29 16 28 15
District 17 (n=201) 9 27 19 31 13
District 18 (n=212) 12 31 17 32 9

42 Responsive Management
RATINGS OF THE PERFORMANCE OF THE COMMISSIONS
� Ratings are consistently positive regarding the Commissions’ efforts at managing and
conserving Pennsylvania’s nongame wild birds and mammals; nongame fish, reptiles,
amphibians, and other aquatic wildlife; threatened and endangered wild birds and mammals;
and threatened and endangered reptiles, amphibians, and other aquatic wildlife. For each of
these, ratings of excellent or good (the top half of the scale) far exceeded ratings of fair or
poor (the lower half of the scale).
• In each question, the most common response was don’t know; however, other than this,
the most common response for each was good. All four questions are shown on one
graph.
o Following the graph of the statewide results are tabulations of the results for the
Congressional Districts.
o Tabulations are also included showing the comparison of demographic and behavioral
groups on these questions.

Pennsylvania Residents’ Opinions on and Attitudes Toward Nongame Wildlife 43
9
31
11
3
47
8
30
10
2
49
13
30
9
2
46
10
29
10
2
49
0 20 40 60 80 100
Excellent
Good
Fair
Poor
Don't know
Percent (n=3660)
Q17, Q18, Q20, Q21. How would you rate the Game Commission / Fish and Boat
Commission at managing and conserving Pennsylvania's:
Nongame wild birds andmammals (GameComm.)
Nongame fish, reptiles,amphibians, and otheraquatic animals (Fishand Boat Comm.)
Threatened andendangered wild birdsand mammals (GameComm.)
Threatened andendangered fish,reptiles, amphibians, andother aquatic animals(Fish and Boat Comm.)
40%
38%
43%
39%
14%
12%
11%
12%

44 Responsive Management
Q17. In general, would you rate the performance of the Game Commission in managing and
conserving Pennsylvania's nongame wild birds and mammals as excellent, good, fair, or poor?
Excellent Good Fair Poor Don't know
District 1 (n=200) 8 22 13 2 55
District 2 (n=208) 8 17 11 3 61
District 3 (n=202) 16 30 12 8 34
District 4 (n=201) 13 31 9 2 45
District 5 (n=201) 14 38 14 3 31
District 6 (n=216) 3 32 11 1 52
District 7 (n=202) 7 35 7 0 51
District 8 (n=201) 6 22 6 2 64
District 9 (n=200) 7 28 10 3 52
District 10 (n=201) 9 35 7 2 47
District 11 (n=200) 8 32 12 6 42
District 12 (n=202) 8 38 15 3 36
District 13 (n=205) 4 17 15 0 64
District 14 (n=200) 9 24 19 1 48
District 15 (n=202) 13 35 5 2 45
District 16 (n=206) 6 36 6 1 50
District 17 (n=201) 8 43 9 5 35
District 18 (n=212) 15 39 8 2 38
Q18. In general, would you rate the performance of the Fish and Boat Commission in managing
and conserving Pennsylvania's nongame fish, reptiles, amphibians, and other aquatic animals as
excellent, good, fair, or poor?
Excellent Good Fair Poor Don't know
District 1 (n=200) 9 22 9 3 57
District 2 (n=208) 5 17 12 3 64
District 3 (n=202) 9 32 11 2 45
District 4 (n=201) 13 25 9 3 51
District 5 (n=201) 14 35 11 4 36
District 6 (n=216) 3 34 14 2 46
District 7 (n=202) 5 37 10 1 47
District 8 (n=201) 5 25 6 3 60
District 9 (n=200) 6 31 8 2 53
District 10 (n=201) 6 34 14 2 44
District 11 (n=200) 10 29 16 3 43
District 12 (n=202) 7 34 13 2 43
District 13 (n=205) 3 20 9 1 67
District 14 (n=200) 6 30 17 1 46
District 15 (n=202) 16 34 7 2 41
District 16 (n=206) 7 30 9 3 50
District 17 (n=201) 9 43 4 4 40
District 18 (n=212) 13 30 6 1 49

Pennsylvania Residents’ Opinions on and Attitudes Toward Nongame Wildlife 45
Q20. In general, would you rate the performance of the Game Commission in managing and
conserving Pennsylvania's threatened and endangered wild birds and mammals as excellent,
good, fair, or poor?
Excellent Good Fair Poor Don't know
District 1 (n=200) 7 26 11 2 54
District 2 (n=208) 9 20 10 7 54
District 3 (n=202) 21 27 13 2 37
District 4 (n=201) 16 30 8 1 44
District 5 (n=201) 14 39 11 2 34
District 6 (n=216) 7 30 10 1 51
District 7 (n=202) 12 29 8 2 49
District 8 (n=201) 8 27 5 1 59
District 9 (n=200) 12 31 6 6 46
District 10 (n=201) 14 30 13 1 42
District 11 (n=200) 17 33 3 3 44
District 12 (n=202) 14 35 12 1 38
District 13 (n=205) 6 19 12 1 62
District 14 (n=200) 15 31 8 0 45
District 15 (n=202) 16 28 8 3 45
District 16 (n=206) 12 34 5 3 45
District 17 (n=201) 11 43 6 3 36
District 18 (n=212) 18 33 9 2 38
Q21. In general, would you rate the performance of the Fish and Boat Commission in managing
and conserving Pennsylvania's threatened and endangered fish, reptiles, amphibians, and other
aquatic animals as excellent, good, fair, or poor?
Excellent Good Fair Poor Don't know
District 1 (n=200) 9 26 7 3 54
District 2 (n=208) 7 20 11 2 60
District 3 (n=202) 17 25 13 3 42
District 4 (n=201) 8 27 8 2 56
District 5 (n=201) 10 40 10 2 38
District 6 (n=216) 3 34 12 1 50
District 7 (n=202) 8 31 12 1 48
District 8 (n=201) 8 26 6 1 59
District 9 (n=200) 8 34 6 4 47
District 10 (n=201) 15 28 6 2 49
District 11 (n=200) 14 24 7 3 52
District 12 (n=202) 7 37 11 2 43
District 13 (n=205) 7 17 10 2 63
District 14 (n=200) 6 28 19 1 47
District 15 (n=202) 17 29 7 3 45
District 16 (n=206) 11 30 7 2 49
District 17 (n=201) 9 40 8 3 40
District 18 (n=212) 13 25 11 2 49
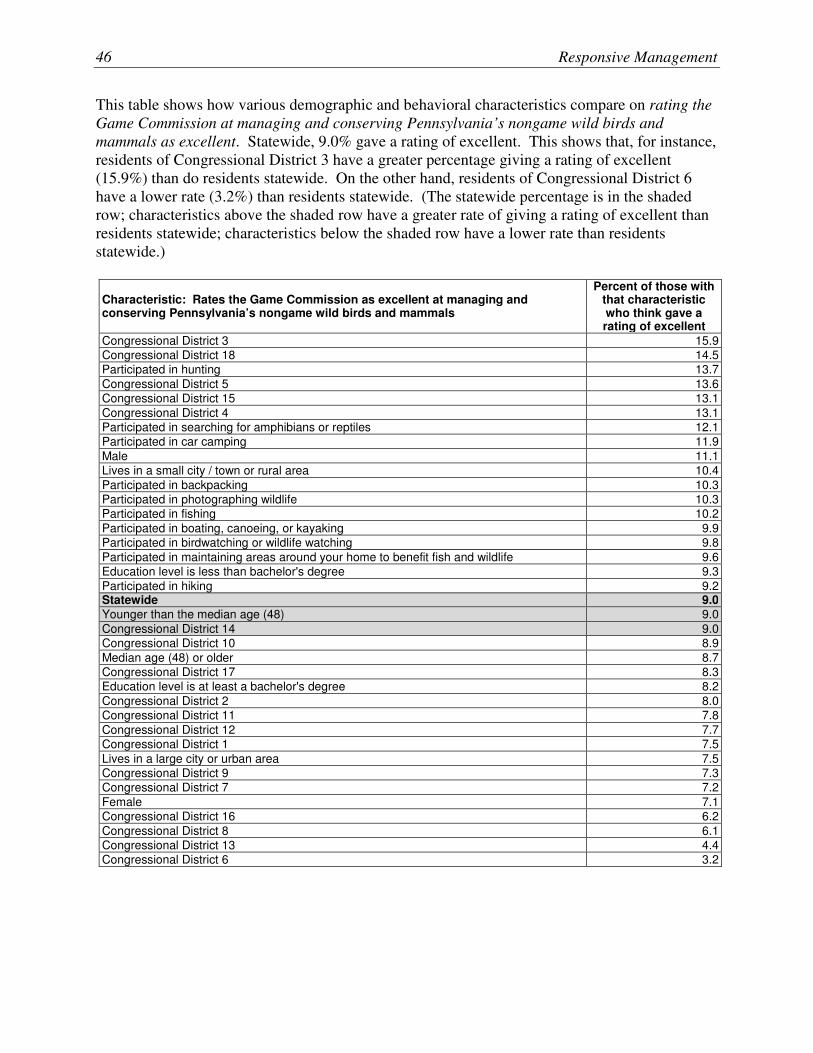
46 Responsive Management
This table shows how various demographic and behavioral characteristics compare on rating the
Game Commission at managing and conserving Pennsylvania’s nongame wild birds and
mammals as excellent. Statewide, 9.0% gave a rating of excellent. This shows that, for instance,
residents of Congressional District 3 have a greater percentage giving a rating of excellent
(15.9%) than do residents statewide. On the other hand, residents of Congressional District 6
have a lower rate (3.2%) than residents statewide. (The statewide percentage is in the shaded
row; characteristics above the shaded row have a greater rate of giving a rating of excellent than
residents statewide; characteristics below the shaded row have a lower rate than residents
statewide.)
Characteristic: Rates the Game Commission as excellent at managing and conserving Pennsylvania’s nongame wild birds and mammals
Percent of those with that characteristic who think gave a rating of excellent
Congressional District 3 15.9
Congressional District 18 14.5
Participated in hunting 13.7
Congressional District 5 13.6
Congressional District 15 13.1
Congressional District 4 13.1
Participated in searching for amphibians or reptiles 12.1
Participated in car camping 11.9
Male 11.1
Lives in a small city / town or rural area 10.4
Participated in backpacking 10.3
Participated in photographing wildlife 10.3
Participated in fishing 10.2
Participated in boating, canoeing, or kayaking 9.9
Participated in birdwatching or wildlife watching 9.8
Participated in maintaining areas around your home to benefit fish and wildlife 9.6
Education level is less than bachelor's degree 9.3
Participated in hiking 9.2 Statewide 9.0 Younger than the median age (48) 9.0
Congressional District 14 9.0
Congressional District 10 8.9
Median age (48) or older 8.7
Congressional District 17 8.3
Education level is at least a bachelor's degree 8.2
Congressional District 2 8.0
Congressional District 11 7.8
Congressional District 12 7.7
Congressional District 1 7.5
Lives in a large city or urban area 7.5
Congressional District 9 7.3
Congressional District 7 7.2
Female 7.1
Congressional District 16 6.2
Congressional District 8 6.1
Congressional District 13 4.4
Congressional District 6 3.2

Pennsylvania Residents’ Opinions on and Attitudes Toward Nongame Wildlife 47
This table shows how various demographic and behavioral characteristics compare on rating the
Game Commission at managing and conserving Pennsylvania’s nongame wild birds and
mammals as poor. Statewide, 2.7% gave a rating of poor. This shows that, for instance,
residents of Congressional District 3 have a greater percentage giving a rating of poor (8.3%)
than do residents statewide. On the other hand, residents of Congressional District 7 have a
lower rate (0.3%) than residents statewide. (The statewide percentage is in the shaded row;
characteristics above the shaded row have a greater rate of giving a rating of poor than residents
statewide; characteristics below the shaded row have a lower rate than residents statewide.)
Characteristic: Rates the Game Commission as poor at managing and conserving Pennsylvania’s nongame wild birds and mammals
Percent of those with that characteristic who think gave a
rating of poor
Congressional District 3 8.3
Congressional District 11 5.9
Congressional District 17 4.7
Participated in hunting 4.0
Congressional District 5 3.4
Lives in a small city / town or rural area 3.4
Congressional District 9 3.3
Congressional District 2 3.2
Congressional District 12 3.2
Participated in fishing 3.1
Median age (48) or older 3.1
Education level is less than bachelor's degree 2.9
Participated in maintaining areas around your home to benefit fish and wildlife 2.8
Participated in boating, canoeing, or kayaking 2.8 Statewide 2.7
Male 2.7
Female 2.7
Congressional District 10 2.4
Congressional District 4 2.4
Congressional District 8 2.3
Participated in birdwatching or wildlife watching 2.2
Participated in hiking 2.2
Younger than the median age (48) 2.1
Participated in backpacking 2.1
Education level is at least a bachelor's degree 1.9
Participated in car camping 1.9
Congressional District 18 1.8
Lives in a large city or urban area 1.8
Participated in searching for amphibians or reptiles 1.7
Congressional District 15 1.7
Participated in photographing wildlife 1.6
Congressional District 1 1.6
Congressional District 16 1.3
Congressional District 6 1.1
Congressional District 14 0.7
Congressional District 13 0.5
Congressional District 7 0.3

48 Responsive Management
This table shows how various demographic and behavioral characteristics compare on rating the
Game Commission at managing and conserving Pennsylvania’s threatened and endangered
wildlife as excellent. Statewide, 12.9% gave a rating of excellent. This shows that, for instance,
hunters have a greater percentage giving a rating of excellent (21.6%) than do residents
statewide. On the other hand, residents of Congressional District 13 have a lower rate (6.2%)
than residents statewide. (The statewide percentage is in the shaded row; characteristics above
the shaded row have a greater rate of giving a rating of excellent than residents statewide;
characteristics below the shaded row have a lower rate than residents statewide.)
Characteristic: Rates the Game Commission as excellent at managing and conserving Pennsylvania’s threatened and endangered wildlife
Percent of those with that characteristic who think gave a rating of excellent
Participated in hunting 21.6
Congressional District 3 21.1
Congressional District 18 17.9
Congressional District 11 17.1
Participated in car camping 16.6
Participated in searching for amphibians or reptiles 16.2
Congressional District 4 16.2
Congressional District 15 15.8
Participated in boating, canoeing, or kayaking 15.8
Male 15.7
Participated in photographing wildlife 15.6
Lives in a small city / town or rural area 15.3
Participated in fishing 15.2
Congressional District 14 15.1
Participated in maintaining areas around your home to benefit fish and wildlife 15.1
Participated in backpacking 14.8
Participated in birdwatching or wildlife watching 14.7
Congressional District 5 14.4
Congressional District 12 14.3
Congressional District 10 13.8
Education level is less than bachelor's degree 13.7
Participated in hiking 13.4
Younger than the median age (48) 13.1 Statewide 12.9 Median age (48) or older 12.7
Congressional District 16 12.4
Congressional District 7 12.2
Congressional District 9 11.8
Congressional District 17 11.3
Education level is at least a bachelor's degree 11.3
Lives in a large city or urban area 10.3
Female 10.2
Congressional District 2 9.2
Congressional District 8 7.8
Congressional District 1 7.0
Congressional District 6 7.0
Congressional District 13 6.2

Pennsylvania Residents’ Opinions on and Attitudes Toward Nongame Wildlife 49
This table shows how various demographic and behavioral characteristics compare on rating the
Game Commission at managing and conserving Pennsylvania’s threatened and endangered
wildlife as poor. Statewide, 2.3% gave a rating of poor. This shows that, for instance, residents
of Congressional District 2 have a greater percentage giving a rating of poor (7.2%) than do
residents statewide. On the other hand, residents of Congressional District 14 have a lower rate
(0.2%) than residents statewide. (The statewide percentage is in the shaded row; characteristics
above the shaded row have a greater rate of giving a rating of poor than residents statewide;
characteristics below the shaded row have a lower rate than residents statewide.)
Characteristic: Rates the Game Commission as poor at managing and conserving Pennsylvania’s threatened and endangered wildlife
Percent of those with that characteristic who think gave a
rating of poor
Congressional District 2 7.2
Congressional District 9 5.5
Participated in backpacking 3.4
Participated in hunting 3.1
Participated in fishing 3.1
Participated in searching for amphibians or reptiles 3.0
Participated in boating, canoeing, or kayaking 3.0
Congressional District 17 3.0
Congressional District 11 2.9
Congressional District 15 2.8
Congressional District 16 2.8
Participated in birdwatching or wildlife watching 2.7
Participated in car camping 2.6
Median age (48) or older 2.6
Participated in photographing wildlife 2.5
Congressional District 1 2.4 Statewide 2.3
Participated in hiking 2.3
Female 2.3
Congressional District 5 2.3
Participated in maintaining areas around your home to benefit fish and wildlife 2.3
Male 2.3
Lives in a small city / town or rural area 2.3
Education level is at least a bachelor's degree 2.3
Lives in a large city or urban area 2.2
Education level is less than bachelor's degree 2.0
Congressional District 18 1.9
Younger than the median age (48) 1.9
Congressional District 3 1.6
Congressional District 7 1.5
Congressional District 8 1.4
Congressional District 4 1.3
Congressional District 6 1.3
Congressional District 13 1.3
Congressional District 10 0.9
Congressional District 12 0.8
Congressional District 14 0.2

50 Responsive Management
This table shows how various demographic and behavioral characteristics compare on rating the
Fish and Boat Commission at managing and conserving Pennsylvania’s nongame fish, reptiles,
amphibians, and other aquatic animals as excellent. Statewide, 8.1% gave a rating of excellent.
This shows that, for instance, residents of Congressional District 15 have a greater percentage
giving a rating of excellent (16.3%) than do residents statewide. On the other hand, residents of
Congressional District 13 have a lower rate (2.7%) than residents statewide. (The statewide
percentage is in the shaded row; characteristics above the shaded row have a greater rate of
giving a rating of excellent than residents statewide; characteristics below the shaded row have a
lower rate than residents statewide.)
Characteristic: Rates the Fish and Boat Commission excellent at managing and conserving Pennsylvania’s nongame fish, reptiles, amphibians, and other aquatic animals
Percent of those with that characteristic who think gave a rating of excellent
Congressional District 15 16.3
Congressional District 5 13.9
Congressional District 18 13.1
Congressional District 4 12.7
Participated in hunting 12.3
Participated in car camping 11.9
Participated in fishing 10.3
Participated in photographing wildlife 10.1
Congressional District 11 9.9
Participated in boating, canoeing, or kayaking 9.8
Lives in a small city / town or rural area 9.7
Participated in searching for amphibians or reptiles 9.5
Male 9.5
Participated in maintaining areas around your home to benefit fish and wildlife 9.1
Congressional District 3 9.1
Participated in birdwatching or wildlife watching 9.0
Congressional District 17 9.0
Participated in backpacking 8.9
Participated in hiking 8.7
Congressional District 1 8.7
Younger than the median age (48) 8.5
Education level is less than bachelor's degree 8.5 Statewide 8.1 Median age (48) or older 7.7
Education level is at least a bachelor's degree 7.6
Congressional District 16 7.3
Female 6.9
Congressional District 12 6.6
Congressional District 14 6.4
Lives in a large city or urban area 6.2
Congressional District 9 6.0
Congressional District 10 5.7
Congressional District 8 5.4
Congressional District 7 5.2
Congressional District 2 4.6
Congressional District 6 3.3
Congressional District 13 2.7

Pennsylvania Residents’ Opinions on and Attitudes Toward Nongame Wildlife 51
This table shows how various demographic and behavioral characteristics compare on rating the
Fish and Boat Commission at managing and conserving Pennsylvania’s nongame fish, reptiles,
amphibians, and other aquatic animals as poor. Statewide, 2.4% gave a rating of poor. This
shows that, for instance, residents of Congressional District 5 have a greater percentage giving a
rating of poor (4.0%) than do residents statewide. On the other hand, residents of Congressional
District 7 have a lower rate (0.6%) than residents statewide. (The statewide percentage is in the
shaded row; characteristics above the shaded row have a greater rate of giving a rating of poor
than residents statewide; characteristics below the shaded row have a lower rate than residents
statewide.)
Characteristic: Rated the Fish and Boat Commission as poor at managing and conserving Pennsylvania’s nongame fish, reptiles, amphibians, and other aquatic animals
Percent of those with that characteristic who think gave a
rating of poor
Congressional District 5 4.0
Congressional District 17 3.6
Congressional District 1 3.5
Congressional District 16 3.4
Congressional District 8 3.2
Participated in hunting 3.1
Male 3.1
Congressional District 4 3.1
Median age (48) or older 2.8
Congressional District 2 2.7
Congressional District 11 2.6
Education level is less than bachelor's degree 2.6
Participated in maintaining areas around your home to benefit fish and wildlife 2.5 Statewide 2.4 Lives in a small city / town or rural area 2.4
Participated in hiking 2.4
Congressional District 12 2.4
Participated in fishing 2.4
Congressional District 9 2.4
Congressional District 3 2.3
Participated in birdwatching or wildlife watching 2.3
Lives in a large city or urban area 2.2
Participated in boating, canoeing, or kayaking 2.2
Participated in car camping 2.2
Participated in backpacking 2.1
Congressional District 10 2.0
Congressional District 6 2.0
Congressional District 15 1.9
Participated in photographing wildlife 1.9
Younger than the median age (48) 1.8
Education level is at least a bachelor's degree 1.8
Female 1.7
Participated in searching for amphibians or reptiles 1.6
Congressional District 13 1.1
Congressional District 18 1.0
Congressional District 14 0.7
Congressional District 7 0.6

52 Responsive Management
This table shows how various demographic and behavioral characteristics compare on rating the
Fish and Boat Commission at managing and conserving Pennsylvania’s threatened and
endangered fish, reptiles, amphibians, and other aquatic animals as excellent. Statewide, 9.8%
gave a rating of excellent. This shows that, for instance, residents of Congressional District 3
have a greater percentage giving a rating of excellent (17.5%) than do residents statewide. On
the other hand, residents of Congressional District 6 have a lower rate (2.8%) than residents
statewide. (The statewide percentage is in the shaded row; characteristics above the shaded row
have a greater rate of giving a rating of excellent than residents statewide; characteristics below
the shaded row have a lower rate than residents statewide.)
Characteristic: Rates the Fish and Boat Commission as excellent at managing and conserving Pennsylvania’s threatened and endangered fish, reptiles, amphibians, and other aquatic animals
Percent of those with that characteristic who think gave a rating of excellent
Congressional District 3 17.5
Congressional District 15 16.5
Participated in hunting 15.4
Congressional District 10 15.2
Congressional District 11 14.0
Congressional District 18 13.1
Participated in searching for amphibians or reptiles 12.2
Participated in fishing 12.1
Participated in photographing wildlife 12.1
Participated in backpacking 12.1
Male 12.0
Lives in a small city / town or rural area 11.7
Participated in maintaining areas around your home to benefit fish and wildlife 11.7
Congressional District 16 11.4
Participated in car camping 11.4
Participated in hiking 11.1
Participated in boating, canoeing, or kayaking 11.0
Education level is less than bachelor's degree 10.8
Younger than the median age (48) 10.5
Participated in birdwatching or wildlife watching 10.5
Congressional District 5 10.1 Statewide 9.8
Congressional District 1 9.4
Median age (48) or older 9.1
Congressional District 17 9.0
Education level is at least a bachelor's degree 8.6
Congressional District 9 8.2
Congressional District 8 8.0
Lives in a large city or urban area 7.8
Female 7.8
Congressional District 7 7.7
Congressional District 4 7.7
Congressional District 2 7.0
Congressional District 13 7.0
Congressional District 12 6.5
Congressional District 14 5.9
Congressional District 6 2.8

Pennsylvania Residents’ Opinions on and Attitudes Toward Nongame Wildlife 53
This table shows how various demographic and behavioral characteristics compare on rating the
Fish and Boat Commission at managing and conserving Pennsylvania’s threatened and
endangered fish, reptiles, amphibians, and other aquatic animals as poor. Statewide, 2.1% gave
a rating of poor. This shows that, for instance, residents of Congressional District 9 have a
greater percentage giving a rating of poor (4.2%) than do residents statewide. On the other hand,
residents of Congressional District 7 have a lower rate (0.8%) than residents statewide. (The
statewide percentage is in the shaded row; characteristics above the shaded row have a greater
rate of giving a rating of poor than residents statewide; characteristics below the shaded row
have a lower rate than residents statewide.)
Characteristic: Rates the Fish and Boat Commission as poor at managing and conserving Pennsylvania’s threatened and endangered fish, reptiles, amphibians, and other aquatic animals
Percent of those with that characteristic who think gave a
rating of poor
Congressional District 9 4.2
Participated in backpacking 3.1
Participated in hunting 3.1
Participated in car camping 3.1
Participated in searching for amphibians or reptiles 3.0
Median age (48) or older 2.9
Male 2.8
Congressional District 11 2.7
Congressional District 1 2.7
Congressional District 17 2.6
Participated in boating, canoeing, or kayaking 2.6
Congressional District 3 2.5
Congressional District 15 2.5
Participated in birdwatching or wildlife watching 2.5
Congressional District 10 2.5
Congressional District 13 2.4
Participated in fishing 2.4
Congressional District 16 2.3
Participated in hiking 2.3
Participated in maintaining areas around your home to benefit fish and wildlife 2.2 Statewide 2.1 Lives in a small city / town or rural area 2.1
Education level is less than bachelor's degree 2.1
Participated in photographing wildlife 2.1
Congressional District 12 2.0
Congressional District 4 2.0
Lives in a large city or urban area 2.0
Congressional District 2 1.9
Congressional District 5 1.9
Education level is at least a bachelor's degree 1.8
Congressional District 18 1.5
Female 1.5
Congressional District 6 1.3
Congressional District 8 1.3
Younger than the median age (48) 1.2
Congressional District 14 1.0
Congressional District 7 0.8

54 Responsive Management
PERCEPTIONS ON FUNDING FOR THE COMMISSIONS
� An open-ended question asked Pennsylvania residents to name the Commissions’ sources of
funding, and multiple responses were allowed. While the top two responses are important
funding sources (hunting licenses and fishing licenses—named, respectively, by 35% and
34% of residents), the third and fourth responses, “taxes” and “general state taxes,” both
being somewhat vague, demonstrate a lack of real knowledge about funding sources.
• Interestingly, three very important sources were named by no more than 3% of residents:
excise taxes on hunting equipment (3%), excise taxes on fishing equipment (2%), and
taxes on motorboat fuel (1%). These taxes are part of the Federal Aid in Wildlife
Restoration Act (known as the Pittman-Robertson Act) and the Federal Aid in Sport Fish
Restoration Act (known as the Dingell-Johnson Act), including the latter Act’s
amendment, the Aquatic Resources Trust Fund (known as the Wallop-Breaux
Amendment).
o Following the graph of the statewide results is a tabulation of the results for the
Congressional Districts.
� The Survey asked questions about ten possible funding sources for fish and wildlife
management and conservation.
• In looking at the ranking by the percentage who strongly or moderately support, there
appear to be two tiers of funding sources. At the top, all with approximately two-thirds
or more in support, are five sources: a collector’s conservation stamp, funds from fishing
license fees, a “small percentage” of revenue from gaming, funds from hunting license
fees, and a fee on the consumptive use and degradation of water. It is interesting to note
that all these sources would not directly apply to the general population (one could say
that the fee on consumptive use and degradation of water would apply to the general
population, but only indirectly as passed-on costs from business, utilities, and industry).
• The lower tier in support are those funding sources that would apply to more of the
general population (with the exception of the tax on energy development, which, like the
water fee, would only indirectly apply to the general population as passed-on costs).
These in the lower tier, in addition to the tax on energy development, include an increase
in the tipping fee for trash services (applying to much of the general population), a fee for

Pennsylvania Residents’ Opinions on and Attitudes Toward Nongame Wildlife 55
those using Game Lands (a true “user fee”), a portion of the state’s sales tax (applying to
all of the general population), and a federal excise tax on outdoor equipment (also a user
fee of sorts).
o Note that what was to be funded differed slightly in some of the questions in this
series and may have had an effect on support for or opposition to each source. Most
sources were to fund “nongame wildlife conservation,” but the lowest in support—the
federal excise tax on outdoor equipment—was to help fund “fish and wildlife
management and conservation” (emphasis added). It may be that the term
“management” negatively influenced some respondents.
o Following the graphs of the statewide results are tabulations of the results for the
Congressional Districts.
o A series of graphs are also included showing how those with a valid hunting license
or a valid fishing license compare to the overall results. (Note that hunters and
anglers are included in the overall results each time.) Hunters and anglers show less
support than respondents overall for using some funds from hunting or fishing license
fees to fund the conservation of nongame wildlife, and both groups show more
support for the establishment of a fee for use of Game Lands by those who are not
hunting or fishing. Hunters and anglers also show more support than respondents
overall for a tax on energy development activities to help fund nongame wildlife
conservation activities.
o One graph shows the trend in support of a Conservation Stamp (the only funding
question that had identical wording in a 1996 survey and the current survey).

56 Responsive Management
35
34
28
10
8
6
4
3
3
2
1
1
5
27
0 20 40 60 80 100
Hunting licenses
Fishing licenses
Taxes
General state taxes
State income tax check-off / nongamedonations
General federal taxes
State Wildlife Grants
Fines
Excise taxes on hunting equipment
Excise taxes on fishing equipment
Taxes on motorboat fuel
Portion of dedicated state sales tax
Other
Don't know
Percent (n=3660)
Mu
ltip
le R
es
po
ns
es
All
ow
ed
Q45. How do you think the Pennsylvania Game Commission and the Pennsylvania Fish and
Boat Commission are funded?

Pennsylvania Residents’ Opinions on and Attitudes Toward Nongame Wildlife 57
Q45. How do you think the Pennsylvania Game Commission and the Pennsylvania Fish and
Boat Commission are funded? (Percent giving response; multiple responses allowed.) D
istr
ict
Hu
nti
ng
lic
en
se
s
Fis
hin
g lic
en
ses
Taxes
Gen
era
l sta
te t
axes
Sta
te in
co
me t
ax c
hec
k-o
ff /
no
ng
am
e d
on
ati
on
s
Gen
era
l fe
dera
l ta
xes
Sta
te W
ild
life
Gra
nts
Fin
es
Excis
e t
axes
on
hu
nti
ng
eq
uip
men
t
Excis
e t
axes
on
fis
hin
g
eq
uip
men
t
Taxes o
n m
oto
rbo
at
fuel
Po
rtio
n o
f d
ed
icate
d s
tate
sale
s t
ax
Oth
er
Do
n't
kn
ow
1 n=200
13 14 35 5 13 4 7 1 3 3 1 2 4 33
2 n=208
19 19 38 7 18 5 4 1 5 6 1 3 4 24
3 n=202
45 43 23 7 7 7 3 4 3 2 1 2 4 30
4 n=201
39 39 25 15 11 4 5 3 2 1 1 0 2 22
5 n=201
45 43 23 15 11 7 5 6 3 3 1 1 5 18
6 n=216
42 40 26 15 3 7 1 7 2 2 2 1 3 22
7 n=202
31 28 35 8 10 6 7 1 3 2 1 0 9 25
8 n=201
26 28 24 19 5 13 6 2 6 6 2 1 7 29
9 n=200
40 40 26 10 5 3 2 2 1 0 2 1 4 26
10 n=201
43 42 22 11 5 8 4 6 3 3 2 2 3 31
11 n=200
41 40 27 8 4 4 2 3 2 2 1 1 5 30
12 n=202
44 42 28 7 8 5 1 2 3 0 1 0 3 25
13 n=205
18 16 30 12 7 11 3 3 4 1 4 1 6 30
14 n=200
35 35 19 5 8 3 1 2 2 1 1 0 2 38
15 n=202
41 41 35 13 5 6 3 1 4 4 1 0 7 24
16 n=206
30 29 38 9 9 8 3 2 1 0 1 1 3 24
17 n=201
35 36 22 6 11 4 4 3 1 1 2 1 5 32
18 n=212
43 42 33 18 12 10 4 2 1 1 2 1 7 17

58 Responsive Management
55
48
43
42
42
41
33
30
26
20
0 20 40 60 80 100
A collector's conservation stamp
A small percentage of revenue fromgaming
Funds from hunting license fees
A fee on the consumptive use anddegradation of water used for…
Funds from fishing license fees
A tax on energy development activities
A small increase in the "tipping fee" ongarbage taken to landfills
A fee for people who do not hunt or trapbut use the Pennsylvania Game…
A small portion of the state's sales taxbeing reapportioned
A federal excise tax on outdoorequipment related to nongame…
Percent
Q48-Q61. Percent of respondents who strongly support each of the following as a funding
source for nongame wildlife conservation in Pennsylvania:
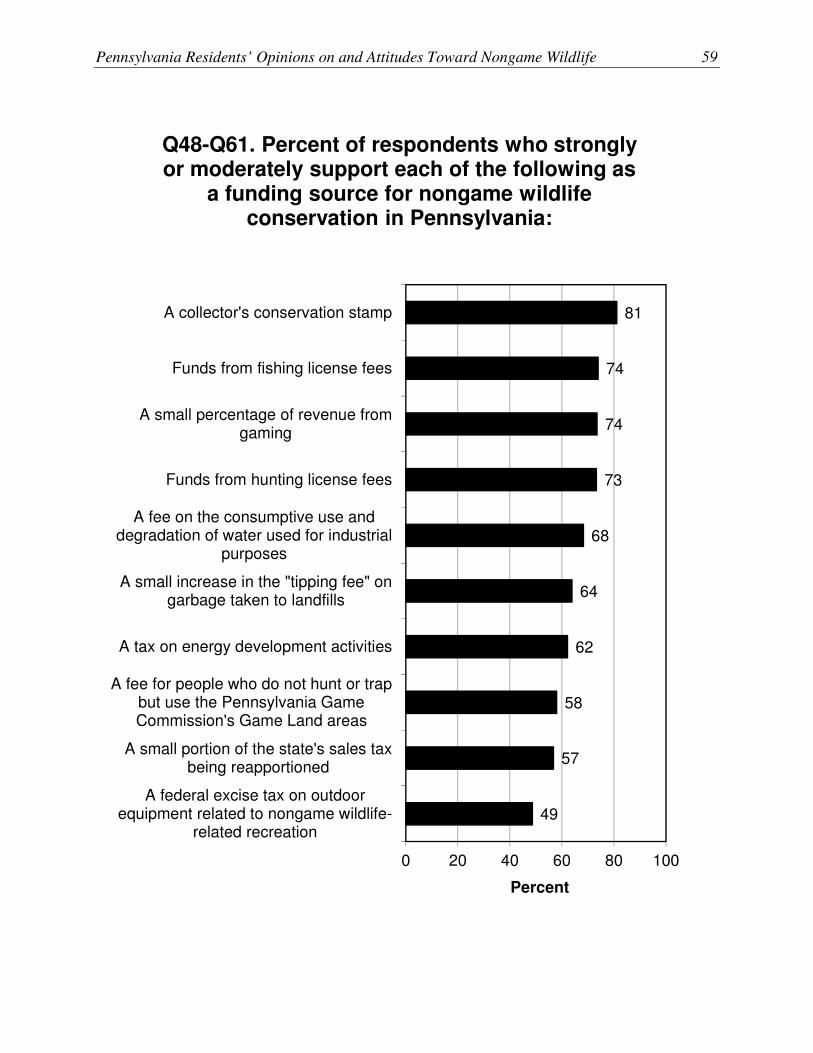
Pennsylvania Residents’ Opinions on and Attitudes Toward Nongame Wildlife 59
81
74
74
73
68
64
62
58
57
49
0 20 40 60 80 100
A collector's conservation stamp
Funds from fishing license fees
A small percentage of revenue fromgaming
Funds from hunting license fees
A fee on the consumptive use anddegradation of water used for industrial
purposes
A small increase in the "tipping fee" ongarbage taken to landfills
A tax on energy development activities
A fee for people who do not hunt or trapbut use the Pennsylvania GameCommission's Game Land areas
A small portion of the state's sales taxbeing reapportioned
A federal excise tax on outdoorequipment related to nongame wildlife-
related recreation
Percent
Q48-Q61. Percent of respondents who strongly or moderately support each of the following as
a funding source for nongame wildlife conservation in Pennsylvania:

60 Responsive Management
27
22
21
19
17
14
13
12
11
7
0 20 40 60 80 100
A federal excise tax on outdoorequipment related to nongame wildlife-…
A small portion of the state's sales taxbeing reapportioned
A fee for people who do not hunt or trapbut use the Pennsylvania Game…
A tax on energy development activities
A small increase in the "tipping fee" ongarbage taken to landfills
A small percentage of revenue fromgaming
A fee on the consumptive use anddegradation of water used for industrial…
Funds from hunting license fees
Funds from fishing license fees
A collector's conservation stamp
Percent
Q48-Q61. Percent of respondents who strongly oppose each of the following as a funding
source for nongame wildlife conservation in Pennsylvania:

Pennsylvania Residents’ Opinions on and Attitudes Toward Nongame Wildlife 61
42
34
34
30
27
21
21
20
19
12
0 20 40 60 80 100
A federal excise tax on outdoorequipment related to nongame wildlife-
related recreation
A small portion of the state's sales taxbeing reapportioned
A fee for people who do not hunt or trapbut use the Pennsylvania GameCommission's Game Land areas
A tax on energy development activities
A small increase in the "tipping fee" ongarbage taken to landfills
A small percentage of revenue fromgaming
A fee on the consumptive use anddegradation of water used for industrial
purposes
Funds from hunting license fees
Funds from fishing license fees
A collector's conservation stamp
Percent
Q48-Q61. Percent of respondents who strongly or moderately oppose each of the following as a
funding source for nongame wildlife conservation in Pennsylvania:

62 Responsive Management
Q48-Q61. Percent of respondents who strongly support each of the following as a funding source
for nongame wildlife conservation in Pennsylvania: D
istr
ict
A c
olle
cto
r's c
on
serv
ati
on
sta
mp
A f
ed
era
l ex
cis
e t
ax o
n o
utd
oo
r eq
uip
men
t re
late
d t
o n
on
gam
e
wild
life
-rela
ted
re
cre
ati
on
A f
ee f
or
peo
ple
wh
o d
o n
ot
hu
nt
or
trap
bu
t u
se
th
e P
en
ns
ylv
an
ia
Gam
e C
om
mis
sio
n's
Ga
me L
an
d
are
as
A f
ee o
n t
he c
on
su
mp
tive
use a
nd
d
eg
rad
ati
on
of
wate
r u
se
d f
or
ind
ustr
ial p
urp
oses
A s
mall
in
cre
as
e in
th
e "
tip
pin
g
fee"
on
ga
rbag
e t
aken
to
lan
dfi
lls
A s
mall
perc
en
tag
e o
f re
ven
ue
fro
m g
am
ing
A s
mall
po
rtio
n o
f th
e s
tate
's
sale
s t
ax b
ein
g r
eap
po
rtio
ned
A t
ax o
n e
nerg
y d
evelo
pm
en
t acti
vit
ies
Fu
nd
s f
rom
fis
hin
g lic
en
se f
ees
Fu
nd
s f
rom
hu
nti
ng
lic
en
se f
ee
s
District 1 (n=200)
55 24 31 41 32 50 27 39 47 49
District 2 (n=208)
52 32 40 47 37 43 37 43 49 51
District 3 (n=202)
52 18 27 42 28 48 30 51 40 41
District 4 (n=201)
56 23 24 40 32 40 28 45 44 43
District 5 (n=201)
52 14 33 48 33 49 29 40 37 37
District 6 (n=216)
61 14 29 47 35 56 25 40 32 31
District 7 (n=202)
63 23 37 49 38 49 35 45 54 52
District 8 (n=201)
61 17 27 41 30 48 25 33 38 39
District 9 (n=200)
49 16 27 33 22 43 23 32 24 27
District 10 (n=201)
58 16 27 42 29 54 23 40 42 44
District 11 (n=200)
56 17 33 44 34 49 24 41 37 42
District 12 (n=202)
46 20 34 43 29 44 25 42 37 39
District 13 (n=205)
55 19 25 40 35 46 21 36 42 45
District 14 (n=200)
49 21 36 37 43 57 23 50 53 44
District 15 (n=202)
59 23 25 40 35 41 24 33 43 45
District 16 (n=206)
43 16 20 30 24 41 14 29 40 45
District 17 (n=201)
65 26 29 49 38 59 34 49 49 49
District 18 (n=212)
59 15 37 45 34 50 21 45 46 46

Pennsylvania Residents’ Opinions on and Attitudes Toward Nongame Wildlife 63
Q48-Q61. Percent of respondents who strongly or moderately support each of the following as a
funding source for nongame wildlife conservation in Pennsylvania: D
istr
ict
A c
olle
cto
r's c
on
serv
ati
on
sta
mp
A f
ed
era
l ex
cis
e t
ax o
n o
utd
oo
r eq
uip
men
t re
late
d t
o n
on
gam
e
wild
life
-rela
ted
re
cre
ati
on
A f
ee f
or
peo
ple
wh
o d
o n
ot
hu
nt
or
trap
bu
t u
se
th
e P
en
ns
ylv
an
ia
Gam
e C
om
mis
sio
n's
Ga
me L
an
d
are
as
A f
ee o
n t
he c
on
su
mp
tive
use a
nd
d
eg
rad
ati
on
of
wate
r u
se
d f
or
ind
ustr
ial p
urp
oses
A s
mall
in
cre
as
e in
th
e "
tip
pin
g
fee"
on
ga
rbag
e t
aken
to
lan
dfi
lls
A s
mall
perc
en
tag
e o
f re
ven
ue
fro
m g
am
ing
A s
mall
po
rtio
n o
f th
e s
tate
's
sale
s t
ax b
ein
g r
eap
po
rtio
ned
A t
ax o
n e
nerg
y d
evelo
pm
en
t acti
vit
ies
Fu
nd
s f
rom
fis
hin
g lic
en
se f
ees
Fu
nd
s f
rom
hu
nti
ng
lic
en
se f
ee
s
District 1 (n=200)
84 55 64 66 67 81 63 68 72 75
District 2 (n=208)
75 59 64 70 59 67 63 60 75 76
District 3 (n=202)
71 49 55 68 58 74 53 69 66 60
District 4 (n=201)
80 48 55 65 58 64 52 67 75 74
District 5 (n=201)
77 46 56 73 63 76 61 64 68 71
District 6 (n=216)
86 48 55 73 72 79 62 58 75 73
District 7 (n=202)
85 54 63 78 75 75 67 67 75 75
District 8 (n=201)
87 45 51 65 63 78 51 48 76 79
District 9 (n=200)
74 41 59 57 56 66 57 52 61 58
District 10 (n=201)
84 49 55 69 64 69 54 61 76 76
District 11 (n=200)
81 48 57 72 64 71 60 66 77 75
District 12 (n=202)
79 41 63 66 57 71 52 59 69 68
District 13 (n=205)
82 56 59 73 71 78 50 62 82 84
District 14 (n=200)
82 41 60 65 66 79 50 72 82 77
District 15 (n=202)
83 49 53 69 62 76 45 53 74 73
District 16 (n=206)
84 45 58 67 71 70 59 65 79 77
District 17 (n=201)
82 55 54 68 64 76 63 65 79 76
District 18 (n=212)
86 47 63 65 61 72 59 65 71 73

64 Responsive Management
Q48-Q61. Percent of respondents who strongly oppose each of the following as a funding source
for nongame wildlife conservation in Pennsylvania: D
istr
ict
A c
olle
cto
r's c
on
serv
ati
on
sta
mp
A f
ed
era
l ex
cis
e t
ax o
n o
utd
oo
r eq
uip
men
t re
late
d t
o n
on
gam
e
wild
life
-rela
ted
re
cre
ati
on
A f
ee f
or
peo
ple
wh
o d
o n
ot
hu
nt
or
trap
bu
t u
se
th
e P
en
ns
ylv
an
ia
Gam
e C
om
mis
sio
n's
Ga
me L
an
d
are
as
A f
ee o
n t
he c
on
su
mp
tive
use a
nd
d
eg
rad
ati
on
of
wate
r u
se
d f
or
ind
ustr
ial p
urp
oses
A s
mall
in
cre
as
e in
th
e "
tip
pin
g
fee"
on
ga
rbag
e t
aken
to
lan
dfi
lls
A s
mall
perc
en
tag
e o
f re
ven
ue
fro
m g
am
ing
A s
mall
po
rtio
n o
f th
e s
tate
's
sale
s t
ax b
ein
g r
eap
po
rtio
ned
A t
ax o
n e
nerg
y d
evelo
pm
en
t acti
vit
ies
Fu
nd
s f
rom
fis
hin
g lic
en
se f
ees
Fu
nd
s f
rom
hu
nti
ng
lic
en
se f
ee
s
District 1 (n=200)
9 26 18 15 17 9 18 15 12 11
District 2 (n=208)
7 20 21 10 15 21 23 23 11 15
District 3 (n=202)
4 30 24 13 22 16 22 16 14 21
District 4 (n=201)
8 30 25 18 16 23 25 18 11 11
District 5 (n=201)
8 32 25 11 20 13 25 23 15 15
District 6 (n=216)
3 27 20 8 11 12 20 20 9 11
District 7 (n=202)
8 28 14 9 15 13 16 16 13 14
District 8 (n=201)
3 28 24 14 20 12 28 18 7 5
District 9 (n=200)
13 35 25 20 23 18 25 31 19 19
District 10 (n=201)
8 31 29 13 17 18 27 22 13 13
District 11 (n=200)
6 28 20 12 22 11 19 18 10 12
District 12 (n=202)
8 30 19 14 21 13 24 22 15 15
District 13 (n=205)
5 22 16 9 11 8 22 15 6 6
District 14 (n=200)
7 16 21 10 13 8 18 11 7 7
District 15 (n=202)
6 34 19 12 19 13 24 25 16 15
District 16 (n=206)
3 21 14 9 9 12 16 13 6 6
District 17 (n=201)
7 25 26 11 20 11 20 17 8 14
District 18 (n=212)
6 23 21 17 21 15 24 20 11 12

Pennsylvania Residents’ Opinions on and Attitudes Toward Nongame Wildlife 65
Q48-Q61. Percent of respondents who strongly or moderately oppose each of the following as a
funding source for nongame wildlife conservation in Pennsylvania: D
istr
ict
A c
olle
cto
r's c
on
serv
ati
on
sta
mp
A f
ed
era
l ex
cis
e t
ax o
n o
utd
oo
r eq
uip
men
t re
late
d t
o n
on
gam
e
wild
life
-rela
ted
re
cre
ati
on
A f
ee f
or
peo
ple
wh
o d
o n
ot
hu
nt
or
trap
bu
t u
se
th
e P
en
ns
ylv
an
ia
Gam
e C
om
mis
sio
n's
Ga
me L
an
d
are
as
A f
ee o
n t
he c
on
su
mp
tive
use a
nd
d
eg
rad
ati
on
of
wate
r u
se
d f
or
ind
ustr
ial p
urp
oses
A s
mall
in
cre
as
e in
th
e "
tip
pin
g
fee"
on
ga
rbag
e t
aken
to
lan
dfi
lls
A s
mall
perc
en
tag
e o
f re
ven
ue
fro
m g
am
ing
A s
mall
po
rtio
n o
f th
e s
tate
's
sale
s t
ax b
ein
g r
eap
po
rtio
ned
A t
ax o
n e
nerg
y d
evelo
pm
en
t acti
vit
ies
Fu
nd
s f
rom
fis
hin
g lic
en
se f
ees
Fu
nd
s f
rom
hu
nti
ng
lic
en
se f
ee
s
District 1 (n=200)
13 36 29 24 26 16 31 24 21 18
District 2 (n=208)
13 35 27 15 29 27 33 29 18 19
District 3 (n=202)
17 42 36 23 35 21 39 23 22 30
District 4 (n=201)
10 42 37 25 33 30 38 26 21 22
District 5 (n=201)
11 43 35 19 29 22 32 31 24 23
District 6 (n=216)
7 43 37 17 21 16 32 32 15 18
District 7 (n=202)
13 39 29 12 21 20 26 23 21 20
District 8 (n=201)
6 43 39 24 30 18 43 42 18 15
District 9 (n=200)
18 51 36 31 36 25 36 41 29 30
District 10 (n=201)
10 47 40 19 24 24 38 33 20 20
District 11 (n=200)
9 46 35 18 29 20 30 24 15 21
District 12 (n=202)
12 52 31 24 35 24 38 33 25 25
District 13 (n=205)
11 35 32 16 20 17 37 26 12 10
District 14 (n=200)
13 48 31 16 22 15 39 20 12 12
District 15 (n=202)
13 45 32 20 25 17 35 38 23 25
District 16 (n=206)
11 38 30 26 20 24 29 33 14 16
District 17 (n=201)
13 36 41 19 27 15 28 26 13 18
District 18 (n=212)
10 39 31 26 31 22 34 32 23 21

66 Responsive Management
This table shows how various demographic and behavioral characteristics compare on support of
a collector’s conservation stamp to help fund nongame wildlife conservation in Pennsylvania.
Statewide, 81.1% support. This shows that, for instance, those who participated in hiking have
more support (87.2%) than do residents statewide. On the other hand, residents of Congressional
District 3 have less support (71.2%) than residents statewide. (The statewide percentage is in the
shaded row; characteristics above the shaded row have more support than residents statewide;
characteristics below the shaded row have less support than residents statewide.)
Characteristic: Would support a collector’s conservation stamp to help fund nongame wildlife conservation in Pennsylvania
Percent of those with that characteristic
who support Participated in hiking 87.2
Congressional District 8 87.1
Participated in photographing wildlife 87.0
Education level is at least a bachelor's degree 86.8
Participated in searching for amphibians or reptiles 86.8
Participated in backpacking 86.7
Congressional District 18 85.8
Congressional District 6 85.6
Participated in maintaining areas around your home to benefit fish and wildlife 85.1
Congressional District 7 84.9
Participated in birdwatching or wildlife watching 84.6
Participated in boating, canoeing, or kayaking 84.4
Participated in car camping 84.1
Congressional District 10 84.0
Congressional District 16 83.8
Congressional District 1 83.7
Lives in a large city or urban area 83.5
Female 83.3
Congressional District 15 83.0
Younger than the median age (48) 82.8
Participated in fishing 81.8
Congressional District 13 81.8
Congressional District 14 81.7
Congressional District 17 81.7 Statewide 81.1
Median age (48) or older 81.1
Congressional District 11 80.6
Lives in a small city / town or rural area 80.3
Congressional District 4 80.0
Education level is less than bachelor's degree 79.4
Congressional District 12 78.7
Male 78.7
Congressional District 5 77.4
Participated in hunting 77.0
Congressional District 2 75.4
Congressional District 9 73.7
Congressional District 3 71.2

Pennsylvania Residents’ Opinions on and Attitudes Toward Nongame Wildlife 67
This table shows how various demographic and behavioral characteristics compare on support of
using some funds from hunting license fees to help fund nongame wildlife conservation in
Pennsylvania. Statewide, 73.3% of Pennsylvania residents support. This shows that, for
instance, residents of Congressional District 13 have much greater support for this (83.8%) than
do residents statewide. On the other hand, those residing in Congressional District 9 (58.1%)
have less support than residents statewide. (The statewide percentage is in the shaded row;
characteristics above the shaded row have more support than residents statewide; characteristics
below the shaded row have less support than residents statewide.)
Characteristic: Would support using some funds from hunting license fees to help fund nongame wildlife conservation in Pennsylvania
Percent of those with that characteristic
who support Congressional District 13 83.8
Participated in searching for amphibians or reptiles 81.3
Participated in backpacking 79.2
Congressional District 8 79.0
Education level is at least a bachelor's degree 78.9
Participated in photographing wildlife 78.7
Participated in hiking 77.7
Lives in a large city or urban area 77.7
Younger than the median age (48) 77.2
Congressional District 14 76.8
Congressional District 16 76.7
Congressional District 10 76.5
Female 76.3
Congressional District 2 76.2
Congressional District 17 76.0
Participated in boating, canoeing, or kayaking 75.8
Participated in birdwatching or wildlife watching 75.6
Participated in maintaining areas around your home to benefit fish and wildlife 75.3
Congressional District 11 74.9
Congressional District 1 74.7
Congressional District 7 74.7
Congressional District 4 73.8
Congressional District 6 73.4 Statewide 73.3 Participated in car camping 73.2
Congressional District 18 73.2
Congressional District 15 72.6
Participated in fishing 71.8
Education level is less than bachelor's degree 71.4
Congressional District 5 71.1
Lives in a small city / town or rural area 70.4
Median age (48) or older 70.3
Male 70.1
Congressional District 12 67.5
Participated in hunting 63.8
Congressional District 3 60.4
Congressional District 9 58.1

68 Responsive Management
This table shows how various demographic and behavioral characteristics compare on support of
using a small percentage of gaming revenues to help fund nongame wildlife conservation in
Pennsylvania. Statewide, 73.5% support. This shows that, for instance, those who participated
in searching for amphibians and reptiles have more support (82.2%) than do residents statewide.
On the other hand, residents of Congressional District 4 have less support (64.3%) than residents
statewide. (The statewide percentage is in the shaded row; characteristics above the shaded row
have more support than residents statewide; characteristics below the shaded row have less
support than residents statewide.)
Characteristic: Would support using a small percentage of gaming revenues to help fund nongame wildlife conservation in Pennsylvania
Percent of those with that characteristic
who support Participated in searching for amphibians or reptiles 82.2
Congressional District 1 81.3
Participated in backpacking 80.0
Congressional District 6 79.0
Congressional District 14 78.6
Younger than the median age (48) 78.4
Congressional District 13 78.2
Participated in photographing wildlife 77.9
Congressional District 8 77.9
Participated in car camping 77.7
Participated in boating, canoeing, or kayaking 77.3
Participated in maintaining areas around your home to benefit fish and wildlife 76.4
Participated in hiking 76.4
Congressional District 5 76.3
Participated in birdwatching or wildlife watching 76.0
Congressional District 17 76.0
Congressional District 15 75.8
Congressional District 7 75.5
Lives in a large city or urban area 75.1
Participated in fishing 74.9
Participated in hunting 74.7
Education level is less than bachelor's degree 74.6
Female 74.5
Education level is at least a bachelor's degree 74.1
Congressional District 3 73.6 Statewide 73.5
Lives in a small city / town or rural area 73.1
Male 72.5
Congressional District 18 72.4
Congressional District 11 71.5
Congressional District 12 70.6
Median age (48) or older 70.6
Congressional District 16 69.9
Congressional District 10 69.2
Congressional District 2 67.2
Congressional District 9 66.1
Congressional District 4 64.3

Pennsylvania Residents’ Opinions on and Attitudes Toward Nongame Wildlife 69
This table shows how various demographic and behavioral characteristics compare on support of
using some funds from fishing license fees to help fund nongame wildlife conservation in
Pennsylvania. Statewide, 74.0% support. This shows that, for instance, residents of
Congressional District 13 have more support (82.5%) than do residents statewide. On the other
hand, residents of Congressional District 9 have less support (61.0%) than residents statewide.
(The statewide percentage is in the shaded row; characteristics above the shaded row have more
support than residents statewide; characteristics below the shaded row have less support than
residents statewide.)
Characteristic: Would support using some funds from fishing license fees to help fund nongame wildlife conservation in Pennsylvania
Percent of those with that characteristic
who support Congressional District 13 82.5
Participated in searching for amphibians or reptiles 82.2
Participated in backpacking 82.0
Congressional District 14 82.0
Participated in photographing wildlife 79.8
Congressional District 17 78.8
Congressional District 16 78.8
Younger than the median age (48) 78.7
Participated in hiking 78.3
Education level is at least a bachelor's degree 78.3
Lives in a large city or urban area 77.4
Participated in boating, canoeing, or kayaking 77.2
Congressional District 11 77.0
Female 77.0
Participated in birdwatching or wildlife watching 76.7
Participated in car camping 76.5
Congressional District 10 76.4
Participated in maintaining areas around your home to benefit fish and wildlife 76.0
Congressional District 8 75.9
Congressional District 6 74.8
Congressional District 2 74.8
Congressional District 4 74.7
Congressional District 7 74.6
Congressional District 15 74.2 Statewide 74.0
Education level is less than bachelor's degree 72.9
Participated in fishing 72.8
Lives in a small city / town or rural area 71.9
Congressional District 1 71.8
Congressional District 18 71.2
Male 70.7
Median age (48) or older 70.3
Congressional District 12 68.6
Congressional District 5 68.2
Congressional District 3 66.3
Participated in hunting 65.4
Congressional District 9 61.0

70 Responsive Management
This table shows how various demographic and behavioral characteristics compare on support of
a fee on the consumptive use and degradation of water used for industrial purposes to help fund
nongame wildlife conservation in Pennsylvania. Statewide, 68.3% support. This shows that, for
instance, residents of Congressional District 7 have more support (77.7%) than do residents
statewide. On the other hand, residents of Congressional District 9 have less support (56.9%)
than residents statewide. (The statewide percentage is in the shaded row; characteristics above
the shaded row have more support than residents statewide; characteristics below the shaded row
have less support than residents statewide.)
Characteristic: Would support a fee on the consumptive use and degradation of water used for industrial purposes to help fund nongame wildlife conservation in Pennsylvania
Percent of those with that characteristic
who support Congressional District 7 77.7
Participated in searching for amphibians or reptiles 75.3
Participated in backpacking 75.2
Congressional District 13 73.3
Participated in hiking 73.3
Congressional District 6 73.0
Congressional District 5 72.8
Participated in maintaining areas around your home to benefit fish and wildlife 72.7
Education level is at least a bachelor's degree 71.9
Participated in photographing wildlife 71.8
Congressional District 11 71.5
Younger than the median age (48) 71.5
Lives in a large city or urban area 71.3
Participated in birdwatching or wildlife watching 71.0
Congressional District 2 70.1
Participated in boating, canoeing, or kayaking 70.0
Congressional District 15 69.2
Congressional District 10 69.1
Participated in fishing 69.0
Female 68.9
Participated in car camping 68.4 Statewide 68.3 Congressional District 3 67.7
Education level is less than bachelor's degree 67.6
Male 67.6
Congressional District 17 67.6
Congressional District 16 67.4
Lives in a small city / town or rural area 66.6
Median age (48) or older 66.2
Congressional District 1 65.9
Congressional District 12 65.6
Congressional District 18 65.4
Congressional District 8 65.4
Participated in hunting 65.3
Congressional District 4 65.2
Congressional District 14 65.2
Congressional District 9 56.9

Pennsylvania Residents’ Opinions on and Attitudes Toward Nongame Wildlife 71
This table shows how various demographic and behavioral characteristics compare on support of
a tax on energy development to help fund nongame wildlife conservation in Pennsylvania.
Statewide, 62.2% support. This shows that, for instance, residents of Congressional District 14
have more support (71.8%) than do residents statewide. On the other hand, residents of
Congressional District 8 have less support (47.6%) than residents statewide. (The statewide
percentage is in the shaded row; characteristics above the shaded row have more support than
residents statewide; characteristics below the shaded row have less support than residents
statewide.)
Characteristic: Would support a tax on energy development to help fund nongame wildlife conservation in Pennsylvania
Percent of those with that characteristic
who support Congressional District 14 71.8
Participated in backpacking 70.8
Participated in car camping 68.7
Congressional District 3 68.6
Congressional District 1 68.3
Participated in photographing wildlife 68.2
Congressional District 4 67.2
Congressional District 7 67.2
Participated in maintaining areas around your home to benefit fish and wildlife 67.1
Participated in birdwatching or wildlife watching 66.6
Participated in hiking 66.5
Participated in searching for amphibians or reptiles 66.2
Congressional District 11 66.1
Participated in boating, canoeing, or kayaking 65.7
Younger than the median age (48) 65.7
Education level is at least a bachelor's degree 65.6
Congressional District 18 65.4
Lives in a large city or urban area 65.1
Congressional District 17 64.8
Participated in hunting 64.6
Congressional District 16 64.6
Participated in fishing 64.0
Congressional District 5 63.5
Male 62.5 Statewide 62.2
Female 61.9
Congressional District 13 61.6
Education level is less than bachelor's degree 61.5
Congressional District 10 61.3
Lives in a small city / town or rural area 60.5
Median age (48) or older 59.7
Congressional District 2 59.6
Congressional District 12 58.8
Congressional District 6 57.8
Congressional District 15 53.2
Congressional District 9 51.5
Congressional District 8 47.6

72 Responsive Management
This table shows how various demographic and behavioral characteristics compare on support of
charging a fee to people who do not hunt or trap but use the Pennsylvania Game Commission’s
lands to help fund nongame wildlife conservation in Pennsylvania. Statewide, 58.0% support.
This shows that, for instance, hunters have more support (64.4%) than do residents statewide.
On the other hand, residents of Congressional District 8 have less support (51.5%) than residents
statewide. (The statewide percentage is in the shaded row; characteristics above the shaded row
have more support than residents statewide; characteristics below the shaded row have less
support than residents statewide.)
Characteristic: Would support charging a fee to people who do not hunt or trap but use the Pennsylvania Game Commission’s lands to help fund nongame wildlife conservation in Pennsylvania
Percent of those with that characteristic who would support
Participated in backpacking 66.3
Participated in hunting 64.4
Congressional District 2 63.9
Congressional District 1 63.9
Congressional District 12 63.1
Congressional District 18 62.9
Participated in fishing 62.6
Congressional District 7 62.6
Participated in searching for amphibians or reptiles 62.6
Participated in car camping 62.3
Participated in hiking 62.2
Male 62.1
Participated in photographing wildlife 62.0
Lives in a large city or urban area 61.4
Participated in boating, canoeing, or kayaking 61.2
Participated in birdwatching or wildlife watching 61.0
Participated in maintaining areas around your home to benefit fish and wildlife 60.8
Education level is at least a bachelor's degree 60.6
Younger than the median age (48) 60.5
Congressional District 14 60.1
Congressional District 13 58.8
Congressional District 9 58.7
Congressional District 16 58.1 Statewide 58.0 Education level is less than bachelor's degree 57.6
Median age (48) or older 57.5
Congressional District 11 56.9
Congressional District 5 56.2
Lives in a small city / town or rural area 55.9
Congressional District 10 55.2
Congressional District 6 55.2
Congressional District 4 55.1
Congressional District 3 54.6
Female 54.2
Congressional District 17 53.9
Congressional District 15 52.5
Congressional District 8 51.5

Pennsylvania Residents’ Opinions on and Attitudes Toward Nongame Wildlife 73
This table shows how various demographic and behavioral characteristics compare on support of
using a small portion of the state’s sales tax to help fund nongame wildlife conservation in
Pennsylvania. Statewide, 56.7% support. This shows that, for instance, residents of
Congressional District 7 have more support (67.0%) than do residents statewide. On the other
hand, residents of Congressional District 15 have less support (45.0%) than residents statewide.
(The statewide percentage is in the shaded row; characteristics above the shaded row have more
support than residents statewide; characteristics below the shaded row have less support than
residents statewide.)
Characteristic: Would support using a small portion of the state’s sales tax to help fund nongame wildlife conservation in Pennsylvania
Percent of those with that characteristic
who support Congressional District 7 67.0
Participated in searching for amphibians or reptiles 66.2
Participated in backpacking 64.2
Congressional District 2 63.4
Participated in car camping 62.8
Congressional District 17 62.7
Congressional District 1 62.5
Congressional District 6 61.9
Younger than the median age (48) 61.9
Congressional District 5 61.5
Participated in hiking 61.1
Participated in photographing wildlife 60.6
Participated in birdwatching or wildlife watching 59.9
Participated in maintaining areas around your home to benefit fish and wildlife 59.9
Participated in boating, canoeing, or kayaking 59.6
Education level is less than bachelor's degree 59.6
Congressional District 11 59.5
Congressional District 16 59.4
Congressional District 18 59.1
Participated in fishing 58.4
Female 57.3
Lives in a large city or urban area 57.0
Congressional District 9 57.0
Lives in a small city / town or rural area 56.9 Statewide 56.7
Participated in hunting 56.4
Male 56.1
Congressional District 10 54.4
Congressional District 3 53.4
Education level is at least a bachelor's degree 53.4
Median age (48) or older 53.4
Congressional District 12 52.1
Congressional District 4 51.8
Congressional District 8 50.8
Congressional District 14 50.0
Congressional District 13 49.9
Congressional District 15 45.0

74 Responsive Management
22
28
2
13
32
2
20
29
4
15
27
5
0 20 40 60 80 100
Strongly support
Moderately support
Neither
Moderately oppose
Strongly oppose
Don't know
Percent
Hunting License Holders(n=623)
Overall Results (n=3660)
Q48. Would you support or oppose a similar federal excise tax on outdoor equipment related to nongame wildlife-related recreation, such as items used while
birding or wildlife watching like backpacks and binoculars? (The current excise taxes on fishing and sporting equipment were explained to the respondent
prior to the question.)
50
49
46*
42
* Rounding on graph causes
apparent discrepancy in sum; calculation made on unrounded numbers.

Pennsylvania Residents’ Opinions on and Attitudes Toward Nongame Wildlife 75
22
28
3
16
26
4
20
29
4
15
27
5
0 20 40 60 80 100
Strongly support
Moderately support
Neither
Moderately oppose
Strongly oppose
Don't know
Percent
Fishing License Holders(n=755)
Overall Results (n=3660)
Q48. Would you support or oppose a similar federal excise tax on outdoor equipment related to nongame wildlife-related recreation, such as items used while
birding or wildlife watching like backpacks and binoculars? (The current excise taxes on fishing and sporting equipment were explained to the respondent
prior to the question.)
51*
49
* Rounding on graph causes
apparent discrepancy in sum; calculation made on unrounded numbers.
42
42
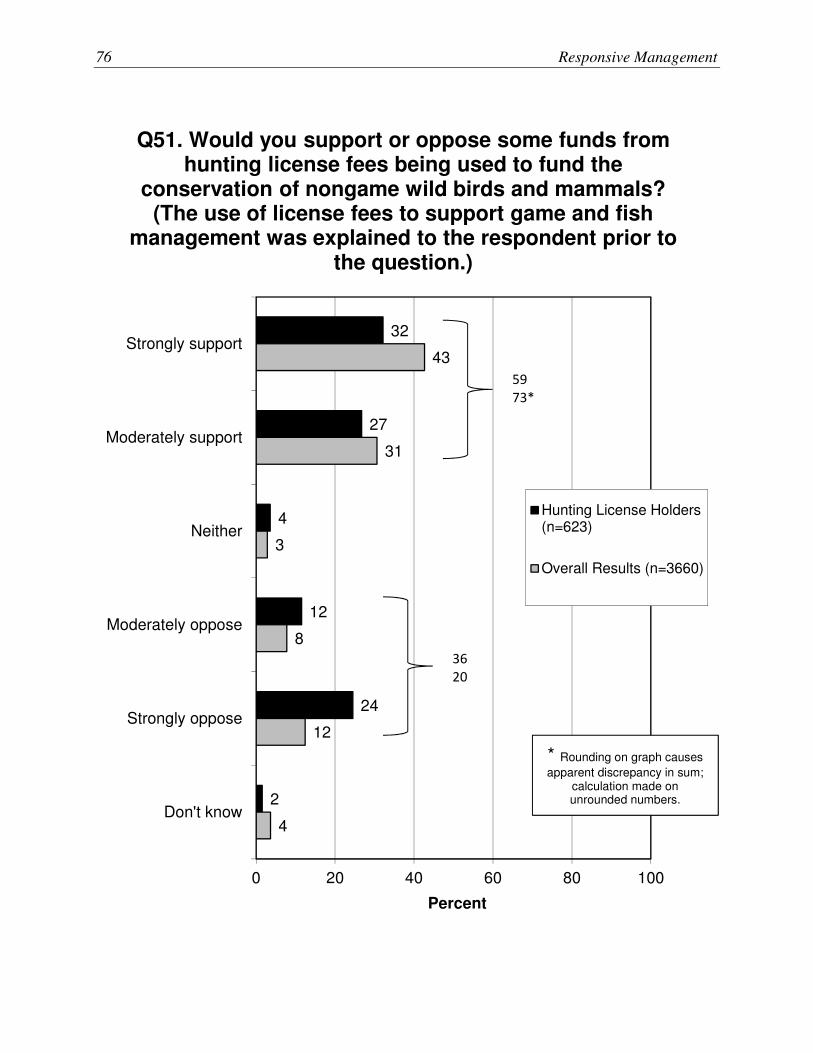
76 Responsive Management
32
27
4
12
24
2
43
31
3
8
12
4
0 20 40 60 80 100
Strongly support
Moderately support
Neither
Moderately oppose
Strongly oppose
Don't know
Percent
Hunting License Holders(n=623)
Overall Results (n=3660)
Q51. Would you support or oppose some funds from hunting license fees being used to fund the
conservation of nongame wild birds and mammals? (The use of license fees to support game and fish
management was explained to the respondent prior to the question.)
59
73*
36
20
* Rounding on graph causes
apparent discrepancy in sum; calculation made on unrounded numbers.

Pennsylvania Residents’ Opinions on and Attitudes Toward Nongame Wildlife 77
34
32
2
10
20
2
43
31
3
8
12
4
0 20 40 60 80 100
Strongly support
Moderately support
Neither
Moderately oppose
Strongly oppose
Don't know
Percent
Fishing License Holders(n=755)
Overall Results (n=3660)
Q51. Would you support or oppose some funds from hunting license fees being used to fund the
conservation of nongame wild birds and mammals? (The use of license fees to support game and fish
management was explained to the respondent prior to the question.)
66
73*
30
20
* Rounding on graph causes
apparent discrepancy in sum; calculation made on unrounded numbers.

78 Responsive Management
31
30
4
12
21
2
42
32
3
8
11
4
0 20 40 60 80 100
Strongly support
Moderately support
Neither
Moderately oppose
Strongly oppose
Don't know
Percent
Hunting License Holders(n=623)
Overall Results (n=3660)
Q52. Would you support or oppose some funds from fishing license fees being used to fund the conservation of nongame fish, reptiles, amphibians, and other aquatic animals? (The use of license fees to support game and fish management was explained to the respondent prior
to the question.)
61
74
33
19

Pennsylvania Residents’ Opinions on and Attitudes Toward Nongame Wildlife 79
37
31
2
11
17
2
42
32
3
8
11
4
0 20 40 60 80 100
Strongly support
Moderately support
Neither
Moderately oppose
Strongly oppose
Don't know
Percent
Fishing License Holders(n=755)
Overall Results (n=3660)
Q52. Would you support or oppose some funds from fishing license fees being used to fund the conservation of nongame fish, reptiles, amphibians, and other aquatic animals? (The use of license fees to support game and fish management was explained to the respondent prior
to the question.)
68
74
* Rounding on graph causes
apparent discrepancy in sum; calculation made on unrounded numbers.
27*
19

80 Responsive Management
33
31
2
12
20
3
33
31
3
10
17
5
0 20 40 60 80 100
Strongly support
Moderately support
Neither
Moderately oppose
Strongly oppose
Don't know
Percent
Q53. Currently, a portion of a "tipping fee" on garbage taken to landfills funds land and water conservation initiatives in Pennsylvania. Would you support or oppose a small increase in this
fee to fund nongame fish and wildlife conservation?
Hunting License Holders(n=623)
Overall Results (n=3660)
64
64
32
27

Pennsylvania Residents’ Opinions on and Attitudes Toward Nongame Wildlife 81
37
28
2
11
17
5
33
31
3
10
17
5
0 20 40 60 80 100
Strongly support
Moderately support
Neither
Moderately oppose
Strongly oppose
Don't know
Percent
Q53. Currently, a portion of a "tipping fee" on garbage taken to landfills funds land and water conservation initiatives in Pennsylvania. Would you support or oppose a small increase in this
fee to fund nongame fish and wildlife conservation?
Fishing License Holders(n=755)
Overall Results (n=3660)
* Rounding on graph causes
apparent discrepancy in sum; calculation made on unrounded numbers.
66*
64
27*
27

82 Responsive Management
52
23
2
7
11
5
55
26
2
5
7
5
0 20 40 60 80 100
Strongly support
Moderately support
Neither
Moderately oppose
Strongly oppose
Don't know
Percent
Q56. Do you support or oppose a collector's conservation stamp as a way to fund nongame
wildlife conservation in Pennsylvania?
Hunting License Holders(n=623)
Overall Results (n=3660)
* Rounding on graph causes
apparent discrepancy in sum; calculation made on unrounded numbers.
75
81
19*
12

Pennsylvania Residents’ Opinions on and Attitudes Toward Nongame Wildlife 83
51
28
2
7
8
5
55
26
2
5
7
5
0 20 40 60 80 100
Strongly support
Moderately support
Neither
Moderately oppose
Strongly oppose
Don't know
Percent
Q56. Do you support or oppose a collector's conservation stamp as a way to fund nongame
wildlife conservation in Pennsylvania?
Fishing License Holders(n=755)
Overall Results (n=3660)
79
81
15
12

84 Responsive Management
41
25
4
9
16
5
42
26
3
8
13
8
0 20 40 60 80 100
Strongly support
Moderately support
Neither
Moderately oppose
Strongly oppose
Don't know
Percent
Q57. Do you support or oppose a fee on the consumptive use and degradation of water used for industrial purposes to fund nongame wildlife
conservation in Pennsylvania?
Hunting License Holders(n=623)
Overall Results (n=3660)
66
68
25
21

Pennsylvania Residents’ Opinions on and Attitudes Toward Nongame Wildlife 85
39
28
4
9
14
5
42
26
3
8
13
8
0 20 40 60 80 100
Strongly support
Moderately support
Neither
Moderately oppose
Strongly oppose
Don't know
Percent
Q57. Do you support or oppose a fee on the consumptive use and degradation of water used for industrial purposes to fund nongame wildlife
conservation in Pennsylvania?
Fishing License Holders(n=755)
Overall Results (n=3660)
67
68
23
21
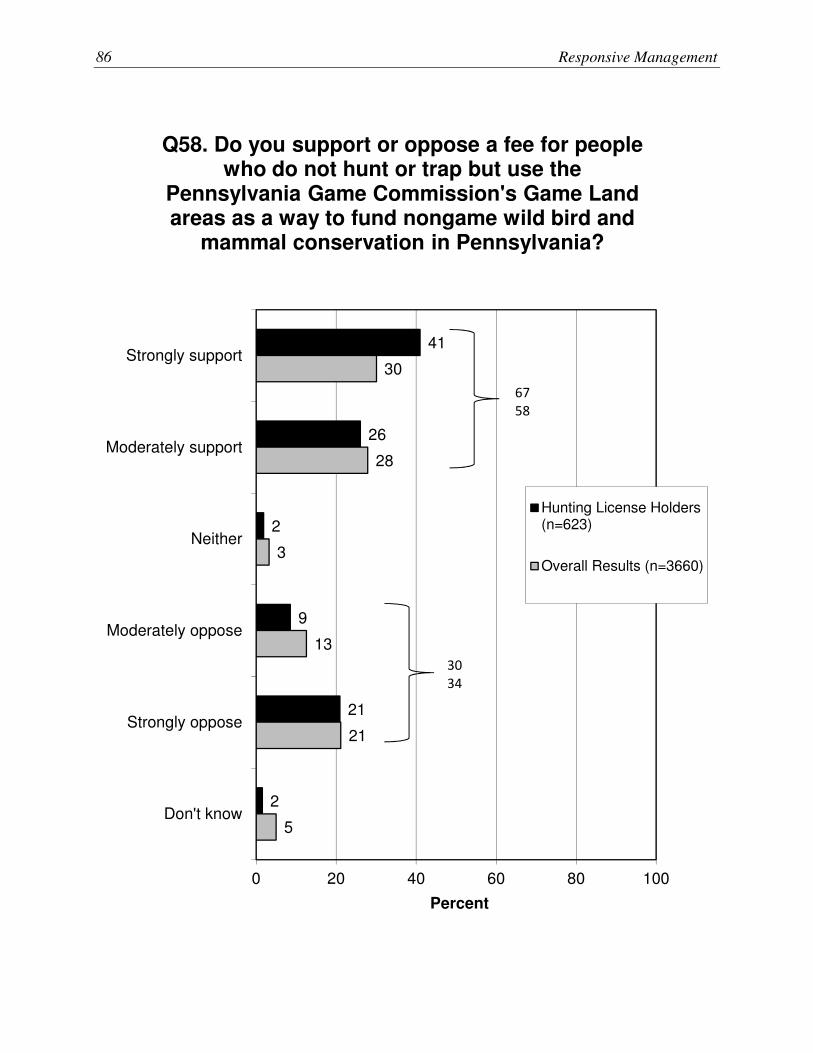
86 Responsive Management
41
26
2
9
21
2
30
28
3
13
21
5
0 20 40 60 80 100
Strongly support
Moderately support
Neither
Moderately oppose
Strongly oppose
Don't know
Percent
Q58. Do you support or oppose a fee for people who do not hunt or trap but use the
Pennsylvania Game Commission's Game Land areas as a way to fund nongame wild bird and
mammal conservation in Pennsylvania?
Hunting License Holders(n=623)
Overall Results (n=3660)
67
58
30
34

Pennsylvania Residents’ Opinions on and Attitudes Toward Nongame Wildlife 87
42
23
2
9
21
2
30
28
3
13
21
5
0 20 40 60 80 100
Strongly support
Moderately support
Neither
Moderately oppose
Strongly oppose
Don't know
Percent
Q58. Do you support or oppose a fee for people who do not hunt or trap but use the
Pennsylvania Game Commission's Game Land areas as a way to fund nongame wild bird and
mammal conservation in Pennsylvania?
Fishing License Holders(n=755)
Overall Results (n=3660)
65
58
30
34

88 Responsive Management
50
16
2
10
20
2
41
21
3
11
19
5
0 20 40 60 80 100
Strongly support
Moderately support
Neither
Moderately oppose
Strongly oppose
Don't know
Percent
Q59. Do you support or oppose a tax on energy development activities to help fund nongame
wildlife conservation in Pennsylvania?
Hunting License Holders(n=623)
Overall Results (n=3660)
66
62
30
30

Pennsylvania Residents’ Opinions on and Attitudes Toward Nongame Wildlife 89
53
15
3
10
16
2
41
21
3
11
19
5
0 20 40 60 80 100
Strongly support
Moderately support
Neither
Moderately oppose
Strongly oppose
Don't know
Percent
Q59. Do you support or oppose a tax on energy development activities to help fund nongame
wildlife conservation in Pennsylvania?
Fishing License Holders(n=755)
Overall Results (n=3660)
68
62
26
30

90 Responsive Management
50
22
2
9
16
3
48
25
2
7
14
4
0 20 40 60 80 100
Strongly support
Moderately support
Neither
Moderately oppose
Strongly oppose
Don't know
Percent
Hunting License Holders(n=623)
Overall Results (n=3660)
Q60. In Pennsylvania, revenue from gaming, that is, gambling on horse races and in casinos, is used to help fund school property and wage tax relief in the state as well as Pennsylvania's general budget fund and local
and county governments. Would you support or oppose a small percentage of revenue from gaming being used to fund nongame wildlife conservation in Pennsylvania?
* Rounding on graph causes
apparent discrepancy in sum; calculation made on unrounded numbers.
71*
74*
24*
21

Pennsylvania Residents’ Opinions on and Attitudes Toward Nongame Wildlife 91
49
24
2
6
16
3
48
25
2
7
14
4
0 20 40 60 80 100
Strongly support
Moderately support
Neither
Moderately oppose
Strongly oppose
Don't know
Percent
Fishing License Holders(n=755)
Overall Results (n=3660)
Q60. In Pennsylvania, revenue from gaming, that is, gambling on horse races and in casinos, is used to help fund school property and wage tax relief in the state as
well as Pennsylvania's general budget fund and local and county governments. Would you support or oppose a
small percentage of revenue from gaming being used to fund nongame wildlife conservation in Pennsylvania?
* Rounding on graph causes
apparent discrepancy in sum; calculation made on unrounded numbers.
73
74*
22
21

92 Responsive Management
25
29
2
14
27
3
26
31
4
12
22
5
0 20 40 60 80 100
Strongly support
Moderately support
Neither
Moderately oppose
Strongly oppose
Don't know
Percent
Q61. Do you support or oppose a small portion of the state's sales tax being reapportioned as a
way to fund nongame wildlife conservation in Pennsylvania?
Hunting License Holders(n=623)
Overall Results (n=3660)
* Rounding on graph causes
apparent discrepancy in sum; calculation made on unrounded numbers.
55*
57
41
34

Pennsylvania Residents’ Opinions on and Attitudes Toward Nongame Wildlife 93
29
28
3
15
22
4
26
31
4
12
22
5
0 20 40 60 80 100
Strongly support
Moderately support
Neither
Moderately oppose
Strongly oppose
Don't know
Percent
Q61. Do you support or oppose a small portion of the state's sales tax being reapportioned as a
way to fund nongame wildlife conservation in Pennsylvania?
Fishing License Holders(n=755)
Overall Results (n=3660)
57
57
37
34

94 Responsive Management
64
25
4 4 5
58
28
2 5 7
0
20
40
60
80
100
Stronglysupport
Moderatelysupport
Neither / Don'tknow
Moderatelyoppose
Stronglyoppose
Pe
rce
nt
Q56. Do you support or oppose a collector's conservation stamp as a way to fund nongame wildlife
conservation in Pennsylvania?
1996
2014

Pennsylvania Residents’ Opinions on and Attitudes Toward Nongame Wildlife 95
SOURCES OF INFORMATION ABOUT NONGAME FISH AND WILDLIFE
� An open-ended question asked Pennsylvania residents to indicate where they get information
about nongame fish and wildlife, and they could name multiple sources. The top sources are
friends and family (22%), the Internet (21%), magazines (19%), and television (17%). The
graph shows the complete listing.
• Following the graph of the statewide results is a tabulation of the results for the
Congressional Districts.

96 Responsive Management
22
21
19
17
14
14
9
3
3
2
2
2
2
16
17
0 20 40 60 80 100
From friends / family
Internet / website other than GameCommission website
Magazines
TV
Word-of-mouth
Personal experience
Brochures or pamphlets
PA Game Commission website
Social media
PA Game Commission employee /office
PA Fish and Boat Commissionwebsite
PA Fish and Boat Commissionemployee / office
Other
Don't know
Percent (n=3660)
Mu
ltip
le R
es
po
ns
es
All
ow
ed
Q66. Where do you get your information about nongame fish and wildlife?

Pennsylvania Residents’ Opinions on and Attitudes Toward Nongame Wildlife 97
Q66. Where do you get your information about nongame fish and wildlife? (Percent giving
response; the question was open-ended and allowed multiple responses.) D
istr
ict
Inte
rnet
/ w
eb
sit
e o
ther
than
Gam
e
Co
mm
issio
n w
eb
sit
e
Fro
m f
rien
ds
/ f
am
ily
Mag
azin
es
TV
Wo
rd-o
f-m
ou
th
Pers
on
al
exp
eri
en
ce
Bro
ch
ure
s o
r p
am
ph
lets
PA
Gam
e C
om
mis
sio
n w
eb
sit
e
So
cia
l m
ed
ia
PA
Gam
e C
om
mis
sio
n e
mp
loyee /
o
ffic
e
PA
Fis
h a
nd
Bo
at
Co
mm
issio
n
web
sit
e
PA
Fis
h a
nd
Bo
at
Co
mm
issio
n
em
plo
yee
/ o
ffic
e
Em
ail
Oth
er
Do
n't
kn
ow
1 n=200
15 21 16 17 16 11 8 3 1 2 3 2 1 10 29
2 n=208
23 14 11 18 11 6 4 0 8 0 1 0 2 23 26
3 n=202
19 19 32 15 12 12 13 5 1 5 1 1 1 17 13
4 n=201
18 25 18 12 13 22 7 2 1 2 2 3 1 13 11
5 n=201
26 22 24 15 17 11 12 5 4 1 2 2 7 13 12
6 n=216
20 21 19 26 10 12 9 3 3 2 2 0 3 16 17
7 n=202
27 21 23 22 19 18 10 7 4 6 3 2 0 23 7
8 n=201
25 27 18 17 17 15 9 6 1 0 4 2 1 18 16
9 n=200
23 17 18 18 11 8 12 4 3 1 0 2 2 14 18
10 n=201
21 27 17 21 25 13 11 2 2 2 1 2 2 9 10
11 n=200
25 24 23 13 11 19 10 3 2 2 2 2 1 16 18
12 n=202
24 26 22 16 11 11 4 3 3 1 0 2 1 13 18
13 n=205
16 16 12 19 11 16 5 3 2 3 3 4 2 25 16
14 n=200
20 29 16 19 28 12 7 1 2 6 2 1 1 14 17
15 n=202
18 25 16 13 17 12 9 1 3 3 1 1 2 20 22
16 n=206
21 15 23 12 7 19 10 4 2 1 2 2 0 12 25
17 n=201
24 22 19 21 11 17 9 4 2 2 2 0 0 15 15
18 n=212
21 20 21 16 10 14 8 3 5 1 0 1 1 14 15

98 Responsive Management
PARTICIPATION IN WILDLIFE-RELATED ACTIVITIES
� The survey asked residents if they had participated in ten natural resource-related activities in
Pennsylvania in the past 2 years. There are six activities in which more than a third of
Pennsylvania residents have participated in the past 2 years: birdwatching and wildlife
watching (52% did this activity), hiking (49%), maintaining areas around home to benefit
fish and wildlife (49%), fishing (43%), boating, canoeing, or kayaking (38%), and
photographing wildlife (38%).
• Note that, for some of these activities, “participation” can be loosely defined by
respondents. For instance, a person who went along with a group on a fishing expedition
but did not personally hold a rod and fish may, nonetheless, answer affirmatively that
he/she fished. This may also be true of hunting.
• An additional caveat to the rates of participation in these activities is that some
“telescoping” may have taken place based on the 2-year timeframe of the question. In
this scenario, a person who went hiking, for instance, 3 years previous may “remember”
the event as having occurred more recently (i.e., within the 2-year timeframe). Therefore,
the actual rates of participation may be just slightly lower than as shown, but the results
are, nonetheless, fairly accurate, and certainly the ranking of activities is accurate.
o Following each graph of the statewide results is a tabulation of the results for the
Congressional Districts.
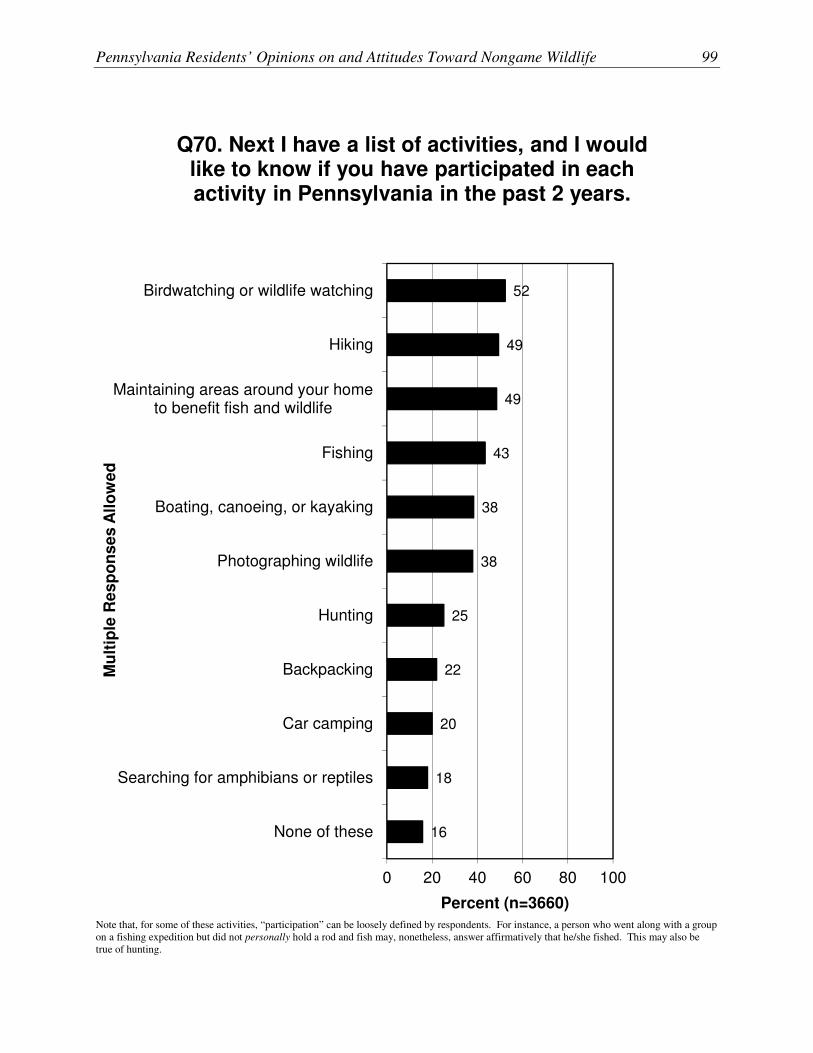
Pennsylvania Residents’ Opinions on and Attitudes Toward Nongame Wildlife 99
Note that, for some of these activities, “participation” can be loosely defined by respondents. For instance, a person who went along with a group
on a fishing expedition but did not personally hold a rod and fish may, nonetheless, answer affirmatively that he/she fished. This may also be
true of hunting.
52
49
49
43
38
38
25
22
20
18
16
0 20 40 60 80 100
Birdwatching or wildlife watching
Hiking
Maintaining areas around your hometo benefit fish and wildlife
Fishing
Boating, canoeing, or kayaking
Photographing wildlife
Hunting
Backpacking
Car camping
Searching for amphibians or reptiles
None of these
Percent (n=3660)
Mu
ltip
le R
es
po
ns
es
All
ow
ed
Q70. Next I have a list of activities, and I would like to know if you have participated in each activity in Pennsylvania in the past 2 years.

100 Responsive Management
Q70. Next I have a list of activities, and I would like to know if you have participated in each
activity in Pennsylvania in the past 2 years. (Percent giving response; multiple responses
allowed.) D
istr
ict
Bir
dw
atc
hin
g o
r w
ild
life
w
atc
hin
g
Main
tain
ing
are
as a
rou
nd
h
om
e t
o b
en
efi
t fi
sh
an
d
wild
life
Hik
ing
Fis
hin
g
Ph
oto
gra
ph
ing
wild
life
Bo
ati
ng
, can
oein
g,
or
kaya
kin
g
Hu
nti
ng
Backp
ackin
g
Car
cam
pin
g
Sea
rch
ing
fo
r am
ph
ibia
ns
o
r re
pti
les
No
ne o
f th
ese
District 1 (n=200)
35 26 34 21 22 21 6 13 11 8 38
District 2 (n=208)
45 30 43 33 25 32 10 28 19 15 29
District 3 (n=202)
59 63 41 50 39 43 45 22 19 17 7
District 4 (n=201)
62 60 63 47 44 48 30 34 27 25 11
District 5 (n=201)
58 52 50 51 43 42 43 20 23 26 9
District 6 (n=216)
53 52 51 42 35 41 24 27 20 17 15
District 7 (n=202)
60 61 62 50 41 50 26 28 22 19 11
District 8 (n=201)
40 40 52 47 36 39 14 21 18 14 14
District 9 (n=200)
55 49 45 49 35 38 41 23 26 17 14
District 10 (n=201)
54 52 45 49 39 35 33 21 18 19 17
District 11 (n=200)
58 59 62 46 46 46 31 20 20 22 9
District 12 (n=202)
49 45 45 49 38 38 26 16 19 14 16
District 13 (n=205)
36 34 42 26 27 28 11 13 11 11 30
District 14 (n=200)
46 39 44 46 38 42 23 26 30 18 19
District 15 (n=202)
70 59 58 44 54 40 16 33 16 29 10
District 16 (n=206)
54 56 54 36 38 34 22 13 20 14 13
District 17 (n=201)
51 51 49 37 41 31 21 15 14 24 14
District 18 (n=212)
57 47 48 57 41 44 29 25 23 13 8
Note that, for some of these activities, “participation” can be loosely defined by respondents. For instance, a person who went along with a group
on a fishing expedition but did not personally hold a rod and fish may, nonetheless, answer affirmatively that he/she fished. This may also be
true of hunting.

Pennsylvania Residents’ Opinions on and Attitudes Toward Nongame Wildlife 101
CONTRIBUTIONS TO AND MEMBERSHIP IN NATURAL RESOURCES-RELATED ORGANIZATIONS
� Approximately 1 in 5 Pennsylvania residents (21%) are members of or have donated to a
sportsmen’s, conservation, environmental, or recreation organization, most commonly a
sportsmen’s organization.
• Following the graph of the statewide results is a tabulation of the results for the
Congressional Districts.
• A final graph shows trends, based on a 1996 survey that asked this question.

102 Responsive Management
11
7
5
3
79
0 20 40 60 80 100
Sportsmen's
Conservation
Environmental
Recreation
No groups
Percent (n=3660)
Mu
ltip
le R
es
po
ns
es
All
ow
ed
Q75. Do you contribute to or are you a member of a conservation, sportsmen, recreation, or
environmental club or group?

Pennsylvania Residents’ Opinions on and Attitudes Toward Nongame Wildlife 103
Q75. Do you contribute to or are you a member of a conservation, sportsmen, recreation, or
environmental club or group? (Percent giving response; multiple responses allowed.)
Sportsmen's Conservation Environmental Recreation
No; not a member, don’t
contribute
District 1 (n=200) 3 5 6 2 89
District 2 (n=208) 6 8 8 2 81
District 3 (n=202) 15 4 3 2 78
District 4 (n=201) 12 15 5 4 72
District 5 (n=201) 14 10 4 3 79
District 6 (n=216) 10 9 7 5 74
District 7 (n=202) 15 14 10 4 66
District 8 (n=201) 7 7 10 3 78
District 9 (n=200) 19 3 3 3 77
District 10 (n=201) 12 3 4 1 82
District 11 (n=200) 14 5 5 2 78
District 12 (n=202) 12 7 3 1 80
District 13 (n=205) 4 8 9 3 80
District 14 (n=200) 12 5 3 4 81
District 15 (n=202) 11 10 7 8 76
District 16 (n=206) 13 7 4 2 79
District 17 (n=201) 11 6 2 3 83
District 18 (n=212) 11 6 3 1 82

104 Responsive Management
76
13 126
3
79
117
3 5
0
20
40
60
80
100
No groups Sportsmen's Conservation Environmental Recreation
Pe
rce
nt
Multiple Responses Allowed
Q75. Do you contribute to or are you a member of a conservation, sportsmen, recreation, or environmental
club or group?
1996
2014

Pennsylvania Residents’ Opinions on and Attitudes Toward Nongame Wildlife 105
APPROVAL OR DISAPPROVAL OF HUNTING AND FISHING
� Approval of hunting and fishing among the general population of Pennsylvania is quite high:
85% approve of legal hunting, and 94% approve of legal fishing. Most of that support is
strong support. Opposition stands at 9% against hunting and 4% against fishing (rounding
on the graphs causes the apparent discrepancy in the sums).
• The questions use the terms “legal hunting” and “legal fishing” to distinguish these
activities from illegal poaching, for which there would presumably be very little support.
o Following the graphs of the statewide results are tabulations of the results for the
Congressional Districts.
o Graphs show the trend in approval/disapproval of hunting and fishing since a 1996
survey that asked about these activities.

106 Responsive Management
66
19
3
3
7
2
0 20 40 60 80 100
Strongly approve
Moderately approve
Neither
Moderatelydisapprove
Strongly disapprove
Don't know
Percent (n=3660)
Q62. In general, do you approve or disapprove of legal hunting?

Pennsylvania Residents’ Opinions on and Attitudes Toward Nongame Wildlife 107
75
18
2
1
2
1
0 20 40 60 80 100
Strongly approve
Moderately approve
Neither
Moderatelydisapprove
Strongly disapprove
Don't know
Percent (n=3660)
Q63. In general, do you approve or disapprove of legal fishing?

108 Responsive Management
Q62. In general, do you approve or disapprove of legal hunting?
District Strongly approve
Moderately approve
Neither Moderately disapprove
Strongly disapprove
Don't know
District 1 (n=200) 40 24 4 4 19 9
District 2 (n=208) 40 23 8 11 17 1
District 3 (n=202) 80 11 0 1 5 2
District 4 (n=201) 69 20 4 1 4 2
District 5 (n=201) 77 14 3 3 2 0
District 6 (n=216) 68 18 4 2 6 2
District 7 (n=202) 66 19 1 3 9 0
District 8 (n=201) 54 34 3 2 7 0
District 9 (n=200) 74 14 1 3 5 2
District 10 (n=201) 82 11 3 1 3 0
District 11 (n=200) 72 17 5 1 4 1
District 12 (n=202) 70 22 3 0 3 1
District 13 (n=205) 43 28 4 9 11 6
District 14 (n=200) 64 22 4 3 6 1
District 15 (n=202) 79 14 1 0 4 1
District 16 (n=206) 66 19 6 1 2 5
District 17 (n=201) 67 20 4 1 6 0
District 18 (n=212) 76 17 0 2 4 1
Q63. In general, do you approve or disapprove of legal fishing?
District Strongly approve
Moderately approve
Neither Moderately disapprove
Strongly disapprove
Don't know
District 1 (n=200) 56 33 2 1 7 1
District 2 (n=208) 64 23 4 3 4 1
District 3 (n=202) 88 8 1 2 0 2
District 4 (n=201) 79 18 0 0 2 1
District 5 (n=201) 82 13 1 2 1 1
District 6 (n=216) 78 14 2 1 3 1
District 7 (n=202) 75 18 1 3 3 0
District 8 (n=201) 65 28 1 1 5 0
District 9 (n=200) 79 14 0 5 2 0
District 10 (n=201) 86 12 1 1 1 0
District 11 (n=200) 80 16 1 0 1 1
District 12 (n=202) 80 17 1 0 1 1
District 13 (n=205) 58 31 2 3 1 5
District 14 (n=200) 73 21 2 1 2 1
District 15 (n=202) 80 17 0 0 2 1
District 16 (n=206) 71 21 5 1 1 1
District 17 (n=201) 81 14 2 2 2 0
District 18 (n=212) 82 14 0 2 1 1
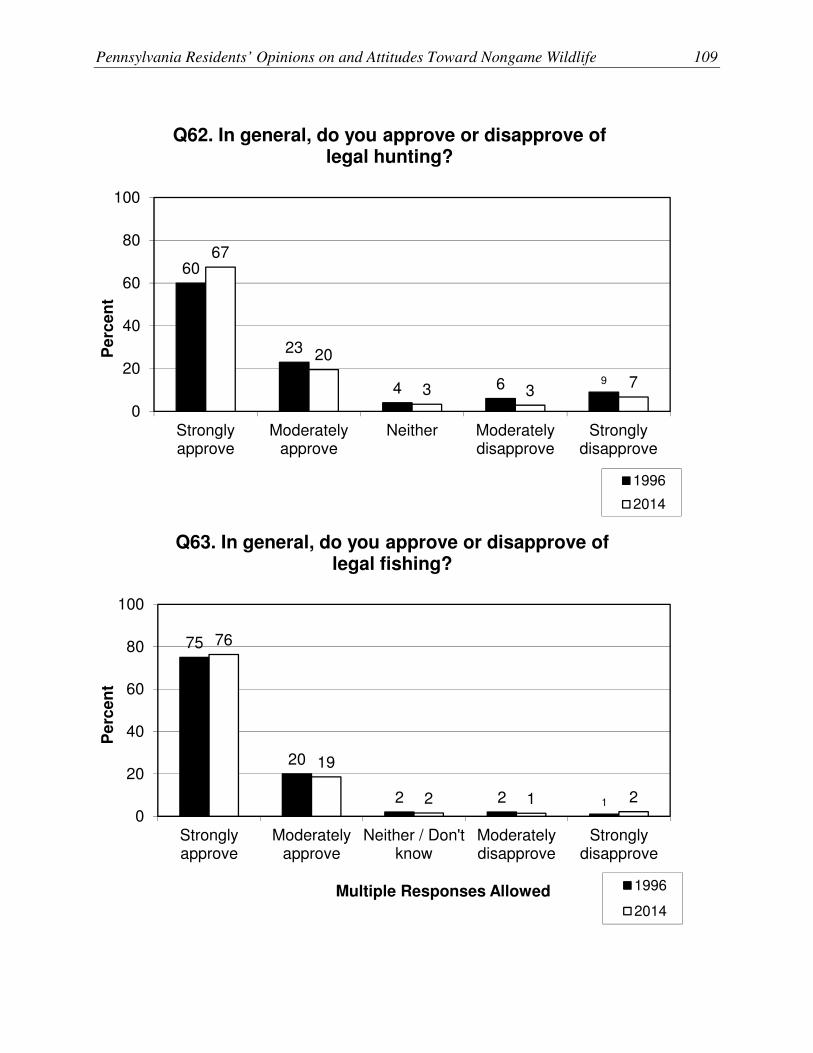
Pennsylvania Residents’ Opinions on and Attitudes Toward Nongame Wildlife 109
60
23
4 6 9
67
20
3 37
0
20
40
60
80
100
Stronglyapprove
Moderatelyapprove
Neither Moderatelydisapprove
Stronglydisapprove
Pe
rce
nt
Q62. In general, do you approve or disapprove of legal hunting?
1996
2014
75
20
2 2 1
76
19
2 1 20
20
40
60
80
100
Stronglyapprove
Moderatelyapprove
Neither / Don'tknow
Moderatelydisapprove
Stronglydisapprove
Pe
rce
nt
Multiple Responses Allowed
Q63. In general, do you approve or disapprove of legal fishing?
1996
2014

110 Responsive Management
DEMOGRAPHIC INFORMATION
� The following demographic data were gathered:
• Gender and age: these were used to weight the data to closely match the Pennsylvania
general population as a whole.
• Education: 61% have some post-high school experience.
• Residency: about a third are rural, about a quarter are small city/town dwellers, and the
rest are large city/urban or suburban.

Pennsylvania Residents’ Opinions on and Attitudes Toward Nongame Wildlife 111
48
52
0 20 40 60 80 100
Male
Female
Percent (n=3660)
Q87. Respondent's gender (not asked; observed by respondent).

112 Responsive Management
34
25
18
10
5
3
2
3
0 20 40 60 80 100
65 years old orolder
55-64 years old
45-54 years old
35-44 years old
25-34 years old
18-24 years old
Don't know
Refused
Percent (n=3660)
Q81. May I ask your age?
Mean = 47.64Median = 48

Pennsylvania Residents’ Opinions on and Attitudes Toward Nongame Wildlife 113
4
32
18
9
20
11
3
1
3
0 20 40 60 80 100
Not a high schoolgraduate
High school graduateor equivalent
Some college or tradeschool, no degree
Associate's or tradeschool degree
Bachelor's degree
Master's degree
Professional ordoctorate degree
Don't know
Refused
Percent (n=3660)
Q78. What is the highest level of education you have completed?
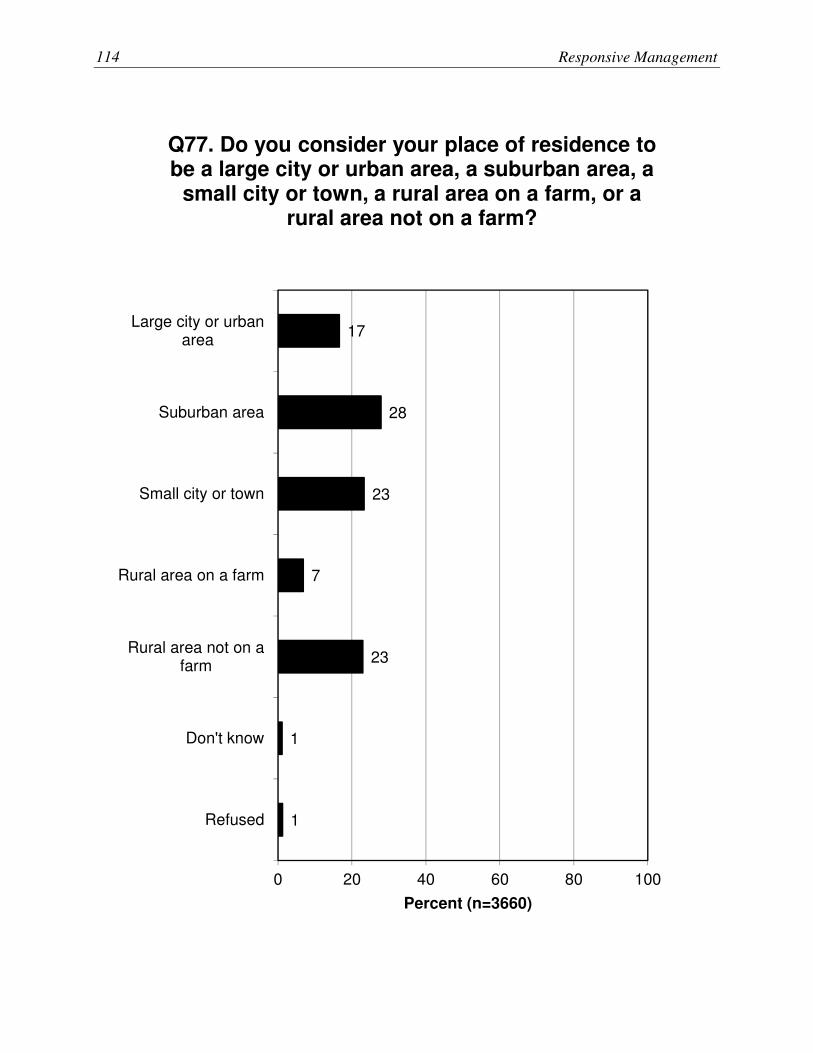
114 Responsive Management
17
28
23
7
23
1
1
0 20 40 60 80 100
Large city or urbanarea
Suburban area
Small city or town
Rural area on a farm
Rural area not on afarm
Don't know
Refused
Percent (n=3660)
Q77. Do you consider your place of residence to be a large city or urban area, a suburban area, a
small city or town, a rural area on a farm, or a rural area not on a farm?

Pennsylvania Residents’ Opinions on and Attitudes Toward Nongame Wildlife 115
APPENDIX: SURVEY INSTRUMENT
Pennsylvania Nongame Survey 2014
[Abridged version of the survey; proprietary code to check for errors and ensure consistent interviewer data entry
has been removed to improve readability.]
4. Hello, my name is ____________, and I'm calling on behalf of the Pennsylvania Game Commission and the
Pennsylvania Fish and Boat Commission to ask your opinion on fish and wildlife conservation programs. We are not
selling anything, and your opinions are entirely confidential. Do you have some time to help us out?
7. The Pennsylvania Game Commission and the Pennsylvania Fish and Boat Commission manage all wildlife in
Pennsylvania. The Game Commission manages all wild birds and mammals while the Fish and Boat Commission
manages all fish, reptiles, amphibians, and other aquatic animals.
8. NONGAME wildlife are wild birds, mammals, fish, reptiles, amphibians, and other aquatic animals that are NOT
hunted or fished. In your opinion, what is the most important issue or concern facing NONGAME wildlife in
Pennsylvania today? (DO NOT READ LIST; CHECK ONLY ONE ANSWER)
|__| 2. There is no important issue
|__| 3. Urban sprawl / over-development
|__| 4. Population growth (humans)
|__| 5. Habitat loss / fragmentation / degradation
|__| 6. Climate change
|__| 7. Management of threatened or endangered species
|__| 8. Invasive species
|__| 9. Diseases (rabies, CWD, EHD, WNS)
|__| 10. Not enough water / water quantity
|__| 11. (DNR) None on this page, more on next screen (GO TO QUESTION 9)
SKIP TO QUESTION 12
9. (CONTINUED FROM PREVIOUS SCREEN)
In your opinion, what is the most important issue or concern facing NONGAME wildlife in Pennsylvania today? |__| 2. Polluted water / water quality
|__| 3. Air pollution / air quality
|__| 4. Pollution in general (non-specific)
|__| 5. Energy development
|__| 6. Lack of funding / no dedicated funding
|__| 7. Other [DATA CAPTURED AT QUESTION 10.]
|__| 8. (DNR) Don't know
12. The Fish and Boat and Game Commissions support a variety of program areas that include nongame and game
wildlife. I am going to list some of the areas, and I would like for you to tell me if you think each is an important or
unimportant area for the Commission I mention to focus their efforts.
13. Do you think providing opportunities for hunting is an important or unimportant function of the Game
Commission? |__| 2. Very important
|__| 3. Somewhat important
|__| 4. Neither
|__| 5. Somewhat unimportant
|__| 6. Very unimportant
|__| 7. (DNR) Don't know
14. Do you think providing opportunities for fishing is an important or unimportant function of the Fish and Boat
Commission? |__| 2. Very important
|__| 3. Somewhat important
|__| 4. Neither
|__| 5. Somewhat unimportant
|__| 6. Very unimportant
|__| 7. (DNR) Don't know

116 Responsive Management
15. Do you think providing opportunities for viewing wildlife in a natural setting is an important or unimportant
function of the Game Commission? |__| 2. Very important
|__| 3. Somewhat important
|__| 4. Neither
|__| 5. Somewhat unimportant
|__| 6. Very unimportant
|__| 7. (DNR) Don't know
16. Do you think managing and conserving NONGAME wildlife is an important or unimportant function of the Fish
and Boat and Game Commissions?
(IF ASKED: Nongame wildlife are species that are not hunted or fished.) |__| 2. Very important
|__| 3. Somewhat important
|__| 4. Neither
|__| 5. Somewhat unimportant
|__| 6. Very unimportant
|__| 7. (DNR) Don't know
17. In general, would you rate the performance of the GAME COMMISSION in managing and conserving
Pennsylvania's NONGAME wild birds and mammals as excellent, good, fair, poor, or don't know? |__| 2. Excellent
|__| 3. Good
|__| 4. Fair
|__| 5. Poor
|__| 6. (DNR) Don't know
18. In general, would you rate the performance of the FISH AND BOAT COMMISSION in managing and
conserving Pennsylvania's NONGAME fish, reptiles, amphibians, and other aquatic animals as excellent, good, fair,
poor, or don't know? |__| 2. Excellent
|__| 3. Good
|__| 4. Fair
|__| 5. Poor
|__| 6. (DNR) Don't know
19. Do you think managing and conserving threatened and endangered species is an important or unimportant
function of the Fish and Boat and Game Commissions?
(IF ASKED: By threatened I mean wildlife populations that are threatened by changes to the environment or habitat,
and by endangered I mean wildlife populations in danger of becoming extinct.)
(IF ASKED FOR EXAMPLES: Bog Turtle, Peregrine Falcon.) |__| 2. Very important
|__| 3. Somewhat important
|__| 4. Neither
|__| 5. Somewhat unimportant
|__| 6. Very unimportant
|__| 7. (DNR) Don't know
20. In general, would you rate the performance of the GAME COMMISSION in managing and conserving
Pennsylvania's threatened and endangered wild birds and mammals as excellent, good, fair, poor, or don't know? |__| 2. Excellent
|__| 3. Good
|__| 4. Fair
|__| 5. Poor
|__| 6. (DNR) Don't know

Pennsylvania Residents’ Opinions on and Attitudes Toward Nongame Wildlife 117
21. In general, would you rate the performance of the FISH AND BOAT COMMISSION in managing and
conserving Pennsylvania's threatened and endangered fish, reptiles, amphibians, and other aquatic animals as
excellent, good, fair, poor, or don't know? |__| 2. Excellent
|__| 3. Good
|__| 4. Fair
|__| 5. Poor
|__| 6. (DNR) Don't know
==================================================================================
============================================ 22. Choose a random starting question
|__| 1. raptor (GO TO QUESTION 23)
|__| 2. smamm (GO TO QUESTION 24)
|__| 3. reptile (GO TO QUESTION 25)
|__| 4. fish (GO TO QUESTION 26)
[Answer set for all these questions.]
|__| 2. More
|__| 3. Same
|__| 4. Less
|__| 5. (DNR) Don't know
23. Do you think the Game Commission should direct more, the same, or less effort to managing and conserving
NONGAME birds such as birds of prey, songbirds, and shorebirds? This does NOT include game birds like turkeys,
pheasants, or grouse. IF (#22 = 2) GO TO #27
24. Do you think the Game Commission should direct more, the same, or less effort to managing and conserving
NONGAME mammals, such as chipmunks, bats, and flying squirrels? This does NOT include bear, ground hogs, or
porcupines and other game animals. IF (#22 = 3) GO TO #27
25. Do you think the Fish and Boat Commission should direct more, the same, or less effort to managing and
conserving NONGAME reptiles and amphibians, such as salamanders and turtles? This does NOT include bullfrogs.
(IF ASKED FOR EXAMPLES: Green Salamander, Red-bellied Turtle) IF (#22 = 4) GO TO #27
26. Do you think the Fish and Boat Commission should direct more, the same, or less effort to managing and
conserving NONGAME fish such as darters, chubs, and shiners?
This does NOT include game fish like bass or trout. IF (#22 = 1) GO TO #27
SKIP TO QUESTION 23
============================================
==================================================================================

118 Responsive Management
==================================================================================
============================================
27. In the next few questions, we will present you with a few Fish and Boat and Game Commission programs. We
need for you to rate each program as important or unimportant.
28. Choose a random starting question
|__| 1. diversit (GO TO QUESTION 29)
|__| 2. educat (GO TO QUESTION 30)
|__| 3. buyland (GO TO QUESTION 31)
|__| 4. nongres (GO TO QUESTION 32)
|__| 5. reintro (GO TO QUESTION 33)
|__| 6. enforce (GO TO QUESTION 34)
|__| 7. habitat (GO TO QUESTION 35)
|__| 8. damage (GO TO QUESTION 36)
|__| 9. disease (GO TO QUESTION 37)
|__| 10. invspec (GO TO QUESTION 38)
|__| 11. precons (GO TO QUESTION 39)
[Answer set for all these questions.]
|__| 2. Very important
|__| 3. Somewhat important
|__| 4. Neither
|__| 5. Somewhat unimportant
|__| 6. Very unimportant
|__| 7. (DNR) Don't know
29. Do you think managing for a VARIETY of NONGAME wildlife species as compared to managing for a
particular species is an important or unimportant activity for the Commissions? IF (#28 = 2) GO TO #40
30. Do you think educating the public about Pennsylvania's NONGAME wildlife is an important or unimportant
activity for the Commissions? IF (#28 = 3) GO TO #40
31. Do you think purchasing land for the purpose of protecting species that are declining or in need of conservation
is an important or unimportant activity for the Commissions?
(IF ASKED FOR EXAMPLES: Buying caves to protect bats or buying wetlands to protect turtles) IF (#28 = 4) GO TO #40
32. Do you think monitoring NONGAME wildlife populations is an important or unimportant activity for the
Commissions?
(IF ASKED FOR EXAMPLES: Monitoring to identify or understand the locations of different animals; monitoring
to determine the impacts of disease, habitat changes, and more) IF (#28 = 5) GO TO #40
33. Do you think reintroducing NONGAME species that once existed in Pennsylvania is an important or
unimportant activity for the Commissions?
(IF ASKED FOR AN EXAMPLE: Fisher) IF (#28 = 6) GO TO #40
34. Do you think enforcing wildlife laws is an important or unimportant activity for the Commissions? IF (#28 = 7) GO TO #40
35. Do you think restoring and improving habitat for wildlife is an important or unimportant activity for the
Commissions? IF (#28 = 8) GO TO #40
36. Do you think addressing problems and damage caused by NONGAME wild birds and mammals is an important
or unimportant activity for the Game Commission?
(IF ASKED FOR EXAMPLES: Bats in the attic, woodpecker on the house, blackbirds roosting in the fields) IF (#28 = 9) GO TO #40
Pennsylvania Residents’ Opinions on and Attitudes Toward Nongame Wildlife 119
37. Do you think addressing wildlife diseases is an important or unimportant activity for the Commissions?
(IF ASKED FOR EXAMPLES: Wildlife diseases such as White Nose Syndrome in bats and chytrid fungus in
amphibians like frogs and salamanders) IF (#28 = 10) GO TO #40
38. Do you think addressing invasive species, that is, species that may adversely affect or disrupt habitats or other
wildlife, is an important or unimportant activity of the Commissions?
(IF ASKED FOR EXAMPLES: Feral Swine, Zebra mussels) IF (#28 = 11) GO TO #40
39. Do you think conservation actions, such has habitat protection or improvement, for NONGAME species that are
at risk BEFORE they become endangered is an important or unimportant activity of the Commissions? IF (#28 = 1) GO TO #40
SKIP TO QUESTION 29
============================================
==================================================================================
40. Have you heard of Pennsylvania's State Wildlife Action Plan? |__| 2. Yes
|__| 3. No
|__| 4. (DNR) Don't know
41. The State Wildlife Action Plan contains information pertaining to four main areas:
1) Species of greatest conservation need
2) Habitat condition where those species live
3) Threats to species and habitats
(and) 4) Conservation actions to lessen those threats
42. In general, which ONE of the four main areas addressed in the plan do you think is the most important? |__| 2. Species of greatest conservation need
|__| 3. Habitat condition where those species live
|__| 4. Threats to species and habitats
|__| 5. Conservation actions to lessen those threats
|__| 6. (DNR) Don't know
45. Now I'd like to talk about funding. How do you think the Pennsylvania Game Commission and the Pennsylvania
Fish and Boat Commission are funded? (DO NOT READ LIST; CHECK ALL THAT APPLY)
|__| 1. Taxes (nothing specific)
|__| 2. Hunting licenses
|__| 3. Fishing licenses
|__| 4. Excise taxes on hunting equipment
|__| 5. Excise taxes on fishing equipment
|__| 6. Taxes on motorboat fuel
|__| 7. General state taxes
|__| 8. General federal taxes
|__| 9. State income tax check-off/nongame donations
|__| 10. Portion of dedicated state sales tax
|__| 11. Fines
|__| 12. State Wildlife Grants
|__| 13. Other [DATA CAPTURED AT QUESTION 46.]
|__| 14. (DNR) Don't know
47. The Pennsylvania Game Commission and the Pennsylvania Fish and Boat Commission are funded by a variety
of sources, including federal excise taxes on hunting and fishing equipment, motorboat fuel, and hunting and fishing
license fees. The excise taxes come from a federal tax on sporting firearms, handguns, ammunition, archery
equipment, fishing equipment, and boating fuel. These taxes have been in place and helping to fund fish and wildlife
management and conservation, primarily for game species, for 75 years.
(IF ASKED: The manufacturers pay the tax, but the cost is most likely passed on to the customer in the retail price
of the equipment.)

120 Responsive Management
48. Would you support or oppose a similar federal excise tax on outdoor equipment related to nongame wildlife-
related recreation, such as items used while birding or wildlife watching like backpacks and binoculars? |__| 2. Strongly support
|__| 3. Moderately support
|__| 4. Neither
|__| 5. Moderately oppose
|__| 6. Strongly oppose
|__| 7. (DNR) Don't know
==================================================================================
============================================
49. When listing the sources that fund the Commissions, I also mentioned hunting and fishing license fees.
Typically, hunting license fees help fund game management and fishing license fees help fund fisheries
management.
50. Choose a random starting question
|__| 1. huntfund (GO TO QUESTION 51)
|__| 2. fishfund (GO TO QUESTION 52)
51. Would you support or oppose some funds from HUNTING license fees being used to fund the conservation of
NONGAME wild birds and mammals? |__| 2. Strongly support
|__| 3. Moderately support
|__| 4. Neither
|__| 5. Moderately oppose
|__| 6. Strongly oppose
|__| 7. (DNR) Don't know
IF (#50 = 2) GO TO #53
52. Would you support or oppose some funds from FISHING license fees being used to fund the conservation of
NONGAME fish, reptiles, amphibians, and other aquatic animals? |__| 2. Strongly support
|__| 3. Moderately support
|__| 4. Neither
|__| 5. Moderately oppose
|__| 6. Strongly oppose
|__| 7. (DNR) Don't know
IF (#50 = 1) GO TO #53
SKIP TO QUESTION 51
============================================
==================================================================================
53. Currently, a portion of a "tipping fee" on garbage taken to landfills funds land and water conservation initiatives
in Pennsylvania. Would you support or oppose a small increase in this fee to fund nongame fish and wildlife
conservation? |__| 2. Strongly support
|__| 3. Moderately support
|__| 4. Neither
|__| 5. Moderately oppose
|__| 6. Strongly oppose
|__| 7. (DNR) Don't know
Pennsylvania Residents’ Opinions on and Attitudes Toward Nongame Wildlife 121
==================================================================================
============================================
54. Several different ways are being used or considered in other states to fund nongame wildlife conservation. Please
tell me if you support or oppose each funding mechanism as a way to fund nongame wildlife conservation in
Pennsylvania.
55. Choose a random starting question
|__| 1. stamp (GO TO QUESTION 56)
|__| 2. water (GO TO QUESTION 57)
|__| 3. gameland (GO TO QUESTION 58)
|__| 4. energy (GO TO QUESTION 59)
|__| 5. gaming (GO TO QUESTION 60)
|__| 6. sales (GO TO QUESTION 61)
[Answer set for all these questions.]
|__| 2. Strongly support
|__| 3. Moderately support
|__| 4. Neither
|__| 5. Moderately oppose
|__| 6. Strongly oppose
|__| 7. Don't know
56. Do you support or oppose a collector's conservation stamp as a way to fund nongame wildlife conservation in
Pennsylvania?
(IF ASKED: Totally voluntary)
(IF ASKED: Not a postage stamp, but a collector stamp) IF (#55 = 2) GO TO #62
57. Do you support or oppose a fee on the consumptive use and degradation of water used for industrial purposes to
fund nongame wildlife conservation in Pennsylvania?
(IF ASKED: Does not tax well water). IF (#55 = 3) GO TO #62
58. Do you support or oppose a fee for people who do not hunt or trap but use the Pennsylvania Game Commission's
Game Land areas as a way to fund nongame wild bird and mammal conservation in Pennsylvania? IF (#55 = 4) GO TO #62
59. Do you support or oppose a tax on energy development activities to help fund nongame wildlife conservation in
Pennsylvania?
(IF ASKED FOR EXAMPLE: An example of energy development activities in Pennsylvania is shale gas
extraction.) IF (#55 = 5) GO TO #62
60. In Pennsylvania, revenue from gaming, that is, gambling on horse races and in casinos, is used to help fund
school property and wage tax relief in the state as well as Pennsylvania's general budget fund and local and county
governments. Would you support or oppose a small percentage of revenue from gaming being used to fund
NONGAME wildlife conservation in Pennsylvania? IF (#55 = 6) GO TO #62
61. Do you support or oppose a small portion of the state's sales tax being reapportioned as a way to fund
NONGAME wildlife conservation in Pennsylvania? IF (#55 = 1) GO TO #62
SKIP TO QUESTION 56
============================================
==================================================================================

122 Responsive Management
62. In general, do you approve or disapprove of legal hunting? |__| 2. Strongly approve
|__| 3. Moderately approve
|__| 4. Neither
|__| 5. Moderately disapprove
|__| 6. Strongly disapprove
|__| 7. (DNR) Don't know
63. In general, do you approve or disapprove of legal fishing? |__| 2. Strongly approve
|__| 3. Moderately approve
|__| 4. Neither
|__| 5. Moderately disapprove
|__| 6. Strongly disapprove
|__| 7. (DNR) Don't know
66. Where do you get your information about nongame fish and wildlife? (DO NOT READ ANSWER SET; CHECK ALL THAT APPLY)
|__| 1. From friends / family
|__| 2. Word-of-mouth
|__| 3. Personal experience
|__| 4. PA Game Commission employee / office
|__| 5. PA Game Commission website
|__| 6. PA Fish and Boat Commission employee / office
|__| 7. PA Fish and Boat Commission website
|__| 8. Internet / website other than PGC website (not social media)
|__| 9. Social media (e.g., Facebook, Twitter, YouTube)
|__| 10. Email
|__| 11. Magazines
|__| 12. Brochures or pamphlets
|__| 13. TV
|__| 14. Other [DATA CAPTURED AT QUESTION 67.]
|__| 15. (DNR) Don't know
70. Next I have a list of activities, and I would like to know if you have participated in each activity in Pennsylvania
in the past 2 years. (READ LIST AND CHECK IF YES)
|__| 1. Car camping?
|__| 2. Backpacking?
|__| 3. Birdwatching or wildlife watching?
|__| 4. Photographing wildlife?
|__| 5. Fishing?
|__| 6. Hiking?
|__| 7. Boating, canoeing, or kayaking?
|__| 8. Searching for amphibians or reptiles?
|__| 9. Maintaining areas around your home to benefit fish and wildlife?
|__| 10. Hunting?
|__| 11. (DNR) None of these
71. Do you currently have a valid Pennsylvania HUNTING license?
(IF ASKED: This includes annual, multi-year, and lifetime licenses that are valid for the calendar year 2014.) |__| 2. Yes
|__| 3. No
|__| 4. (DNR) Don't know
72. Do you currently have a valid Pennsylvania FISHING license?
(IF ASKED: This includes annual, multi-year, and lifetime licenses that are valid for the calendar year 2014.) |__| 2. Yes
|__| 3. No
|__| 4. (DNR) Don't know

Pennsylvania Residents’ Opinions on and Attitudes Toward Nongame Wildlife 123
75. Do you contribute to or are you a member of a conservation, sportsmen, recreation, or environmental club or
group? (LOOK TO LIST FOR ORGANIZATION; CHECK ALL THAT APPLY)
|__| 1. NO GROUPS
|__| 2. Sportsmen
|__| 3. Conservation
|__| 4. Recreation
|__| 5. Environmental
76. Great, we are just about through, the final few questions are for background information and help us analyze the
results.
77. Do you consider your place of residence to be a large city or urban area, a suburban area, a small city or town, a
rural area on a farm, or a rural area NOT on a farm? |__| 2. Large city or urban area
|__| 3. Suburban area
|__| 4. Small city or town
|__| 5. Rural area on a farm
|__| 6. Rural area NOT on a farm
|__| 7. (DNR) Don't know
|__| 8. (DNR) Refused
78. What is the highest level of education you have completed? |__| 2. Not a high school graduate
|__| 3. High school graduate or equivalent
|__| 4. Some college or trade school, no degree
|__| 5. Associate's or trade school degree
|__| 6. Bachelor's degree
|__| 7. Master's degree
|__| 8. Professional or doctorate degree (e.g., M.D. or Ph.D.)
|__| 9. (DNR) Don't know
|__| 10. (DNR) Refused
79. What county do you currently live in? |__|__|
80. What is your Zip Code? |__|__|__|__|__|
81. May I ask your age? |__|__|__| years old
85. That's the end of our survey, thank you very much for your time and cooperation. You have been very helpful.
86. (ENTER ANYTHING RESPONDENT HAS TO ADD; 80 CHARACTERS) ___________________________________________________________
87. OBSERVE AND RECORD RESPONDENT'S GENDER. |__| 2. Male
|__| 3. Female
88. ENTER DISTRICT CODE FROM CALL SHEET |__|__| (district)
91. ENTER THE AREA CODE AND TELEPHONE NUMBER OF NUMBER DIALED. |__|__|__|-|__|__|__|-|__|__|__|__|
92. ENTER RM CASE NUMBER. |__|__|__|__|__|__|

124 Responsive Management
ABOUT RESPONSIVE MANAGEMENT
Responsive Management is an internationally recognized public opinion and attitude survey research
firm specializing in natural resource and outdoor recreation issues. Our mission is to help natural
resource and outdoor recreation agencies and organizations better understand and work with their
constituents, customers, and the public.
Utilizing our in-house, full-service telephone, mail, and web-based survey center with 50
professional interviewers, we have conducted more than 1,000 telephone surveys, mail surveys,
personal interviews, and focus groups, as well as numerous marketing and communication plans,
needs assessments, and program evaluations.
Clients include the federal natural resource and land management agencies, most state fish and
wildlife agencies, state departments of natural resources, environmental protection agencies, state
park agencies, tourism boards, most of the major conservation and sportsmen’s organizations, and
numerous private businesses. Responsive Management also collects attitude and opinion data for
many of the nation’s top universities.
Specializing in research on public attitudes toward natural resource and outdoor recreation issues,
Responsive Management has completed a wide range of projects during the past 24 years, including
dozens of studies of hunters, anglers, wildlife viewers, boaters, park visitors, historic site visitors,
hikers, birdwatchers, campers, and rock climbers. Responsive Management has conducted studies
on endangered species; waterfowl and wetlands; and the reintroduction of large predators such as
wolves, grizzly bears, and the Florida panther.
Responsive Management has assisted with research on numerous natural resource ballot initiatives
and referenda and has helped agencies and organizations find alternative funding and increase their
membership and donations. Additionally, Responsive Management has conducted major
organizational and programmatic needs assessments to assist natural resource agencies and
organizations in developing more effective programs based on a solid foundation of fact.

Pennsylvania Residents’ Opinions on and Attitudes Toward Nongame Wildlife 125
Responsive Management has conducted research on public attitudes toward natural resources and
outdoor recreation in almost every state in the United States, as well as in Canada, Australia, the
United Kingdom, France, Germany, and Japan. Responsive Management has also conducted focus
groups and personal interviews with residents of the African countries of Algeria, Cameroon,
Mauritius, Namibia, South Africa, Tanzania, Zambia, and Zimbabwe.
Responsive Management routinely conducts surveys in Spanish and has conducted surveys in
Chinese, Korean, Japanese and Vietnamese and has completed numerous studies with specific target
audiences, including Hispanics; African-Americans; Asians; women; children; senior citizens; urban,
suburban, and rural residents; large landowners; and farmers.
Responsive Management’s research has been upheld in U.S. District Courts; used in peer-reviewed
journals; and presented at major natural resource, fish and wildlife, and outdoor recreation
conferences across the world. Company research has been featured in most of the nation’s major
media, including CNN, The New York Times, The Wall Street Journal, and on the front pages of USA
Today and The Washington Post. Responsive Management’s research has also been highlighted in
Newsweek magazine.
Visit the Responsive Management website at:
www.responsivemanagement.com