Embed Size (px)
Citation preview
Pension Patterns and Challenges in
Sub-Saharan Africa
World Bank Pensions Core CourseApril 30, 2015
Mark C. Dorfman
Pensions Global Solutions Group
The World Bank
Organization
1. Pension Patterns & Challenges
a. Scheme Design
b. Enabling conditions: Demographics, household composition, poverty and growth
c. Coverage
d. Adequacy and affordability
e. Sustainability
2. Questions for discussion

Scheme Design
3
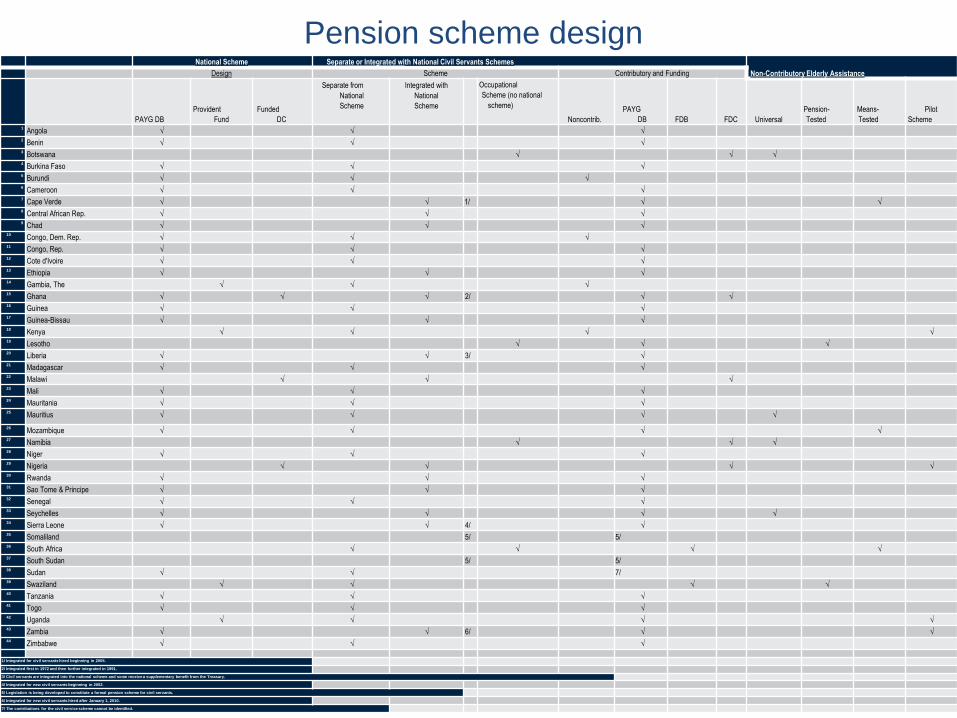
National Scheme Separate or Integrated with National Civil Servants Schemes
Non-Contributory Elderly AssistanceDesign Scheme Contributory and Funding
PAYG DB
Provident
Fund
Funded
DC
Separate from
National
Scheme
Integrated with
National
Scheme
Occupational
Scheme (no national
scheme)
Noncontrib.
PAYG
DB FDB FDC Universal
Pension-
Tested
Means-
Tested
Pilot
Scheme1
Angola √ √ √2
Benin √ √ √3
Botswana √ √ √4
Burkina Faso √ √ √5
Burundi √ √ √6
Cameroon √ √ √7
Cape Verde √ √ 1/ √ √8
Central African Rep. √ √ √9
Chad √ √ √10
Congo, Dem. Rep. √ √ √11
Congo, Rep. √ √ √12
Cote d'Ivoire √ √ √13
Ethiopia √ √ √14
Gambia, The √ √ √15
Ghana √ √ √ 2/ √ √16
Guinea √ √ √17
Guinea-Bissau √ √ √18
Kenya √ √ √ √19
Lesotho √ √ √20
Liberia √ √ 3/ √21
Madagascar √ √ √22
Malawi √ √ √23
Mali √ √ √24
Mauritania √ √ √25
Mauritius √ √ √ √
26Mozambique √ √ √ √
27Namibia √ √ √
28Niger √ √ √
29Nigeria √ √ √ √
30Rwanda √ √ √
31Sao Tome & Principe √ √ √
32Senegal √ √ √
33Seychelles √ √ √ √
34Sierra Leone √ √ 4/ √
35Somaliland 5/ 5/
36South Africa √ √ √ √
37South Sudan 5/ 5/
38Sudan √ √ 7/
39Swaziland √ √ √ √
40Tanzania √ √ √
41Togo √ √ √
42Uganda √ √ √ √
43Zambia √ √ 6/ √ √
44Zimbabwe √ √ √
1/ Integrated for civil servants hired beginning in 2005.
2/ Integrated first in 1972 and then further integrated in 1991.
3/ Civil servants are integrated into the national scheme and some receive a supplementary benefit from the Treasury.
4/ Integrated for new civil servants beginning in 2002.
5/ Legislation is being developed to constitute a formal pension scheme for civil servants.
6/ Integrated for new civil servants hired after January 1, 2010.
7/ The contributions for the civil service scheme cannot be identified.
Pension scheme design
Enabling Conditions: Demographics, Household
Composition, Poverty & Growth
5
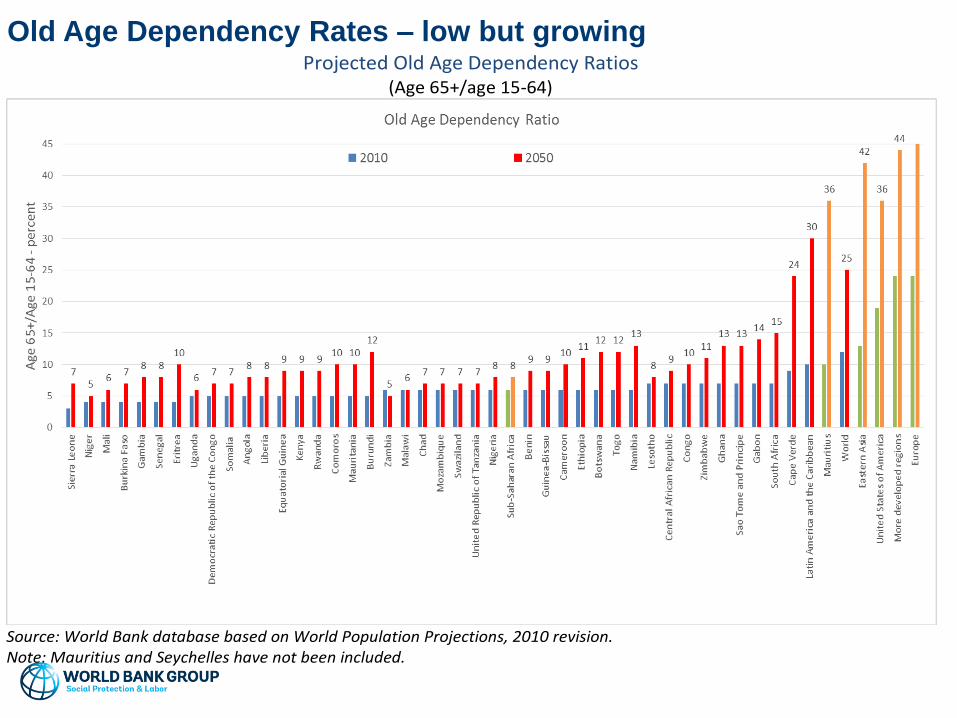
Old Age Dependency Rates – low but growingProjected Old Age Dependency Ratios
(Age 65+/age 15-64)
Source: World Bank database based on World Population Projections, 2010 revision. Note: Mauritius and Seychelles have not been included.
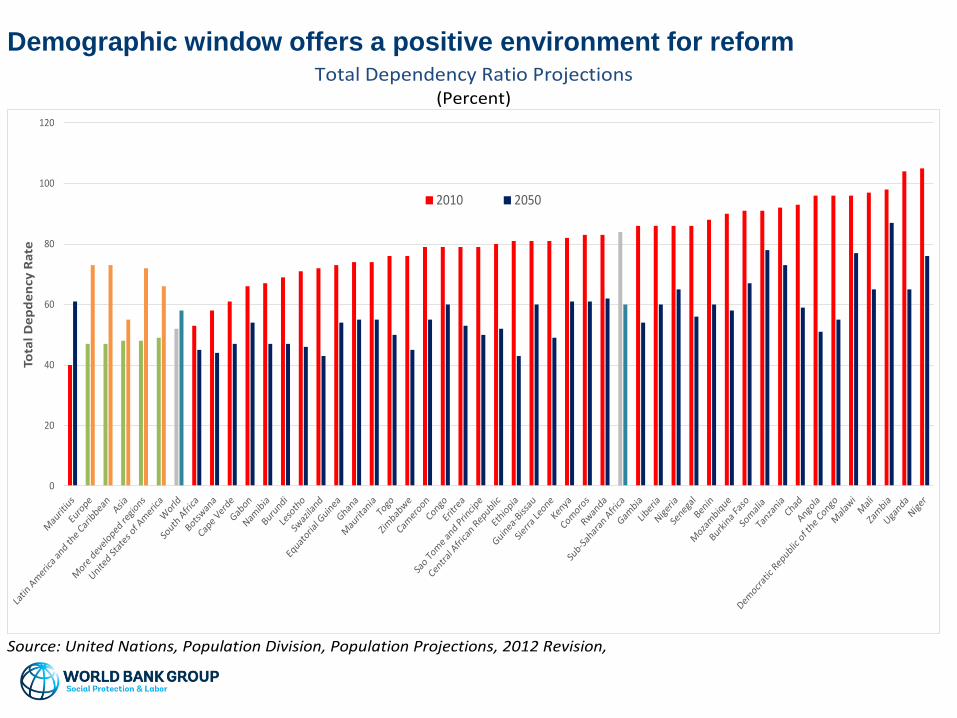
Demographic window offers a positive environment for reformTotal Dependency Ratio Projections
(Percent)
Source: United Nations, Population Division, Population Projections, 2012 Revision,
0
20
40
60
80
100
120
Tota
l D
ep
de
ncy
Ra
te
2010 2050
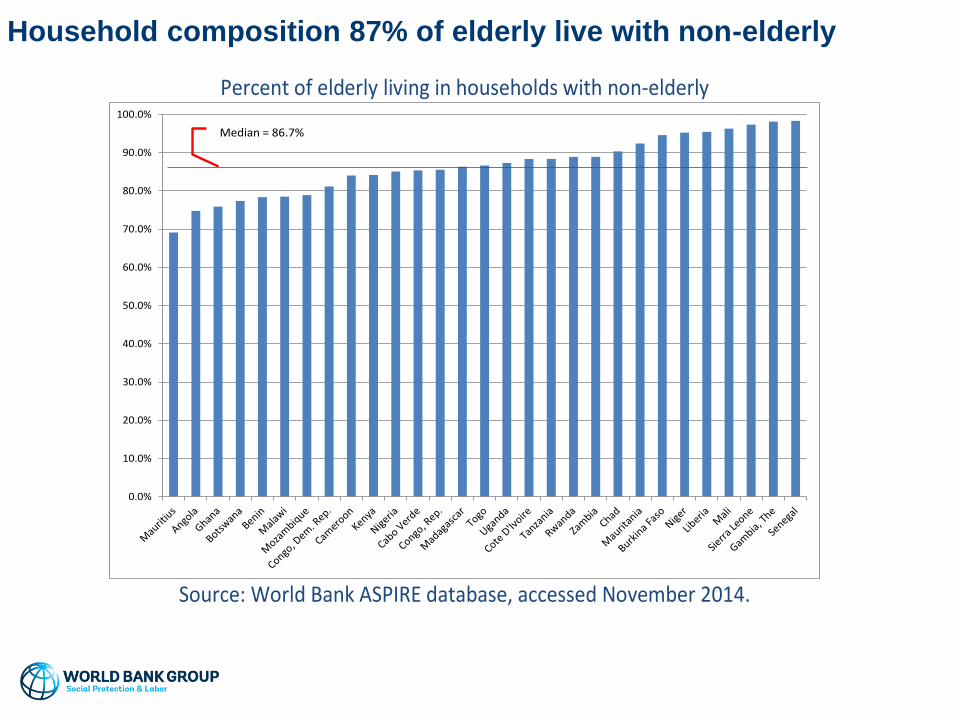
Household composition 87% of elderly live with non-elderly
Percent of elderly living in households with non-elderly
Source: World Bank ASPIRE database, accessed November 2014.
0.0%
10.0%
20.0%
30.0%
40.0%
50.0%
60.0%
70.0%
80.0%
90.0%
100.0%
Median = 86.7%
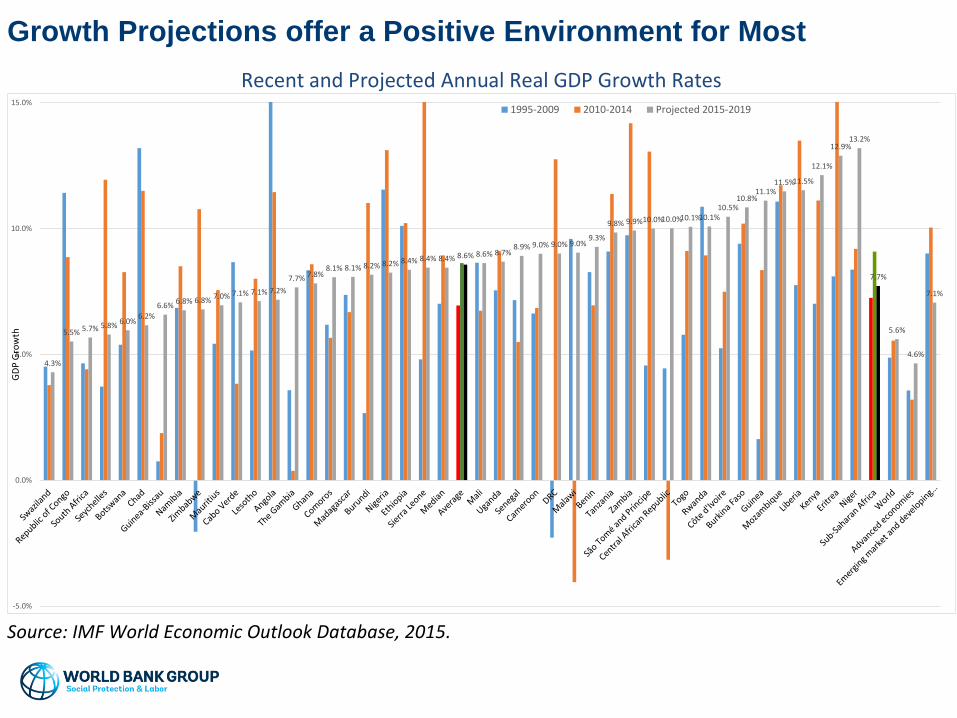
Growth Projections offer a Positive Environment for Most
Recent and Projected Annual Real GDP Growth Rates
Source: IMF World Economic Outlook Database, 2015.
4.3%
5.5% 5.7% 5.8%6.0%
6.2%
6.6%6.8% 6.8% 7.0% 7.1% 7.1% 7.2%
7.7% 7.8%8.1% 8.1% 8.2% 8.2% 8.4% 8.4% 8.4% 8.6% 8.6% 8.7%
8.9% 9.0% 9.0% 9.0%9.3%
9.8% 9.9%10.0%10.0%10.1%10.1%10.5%
10.8%11.1%
11.5%11.5%
12.1%
12.9%13.2%
7.7%
5.6%
4.6%
7.1%
-5.0%
0.0%
5.0%
10.0%
15.0%
GD
P G
row
th
1995-2009 2010-2014 Projected 2015-2019
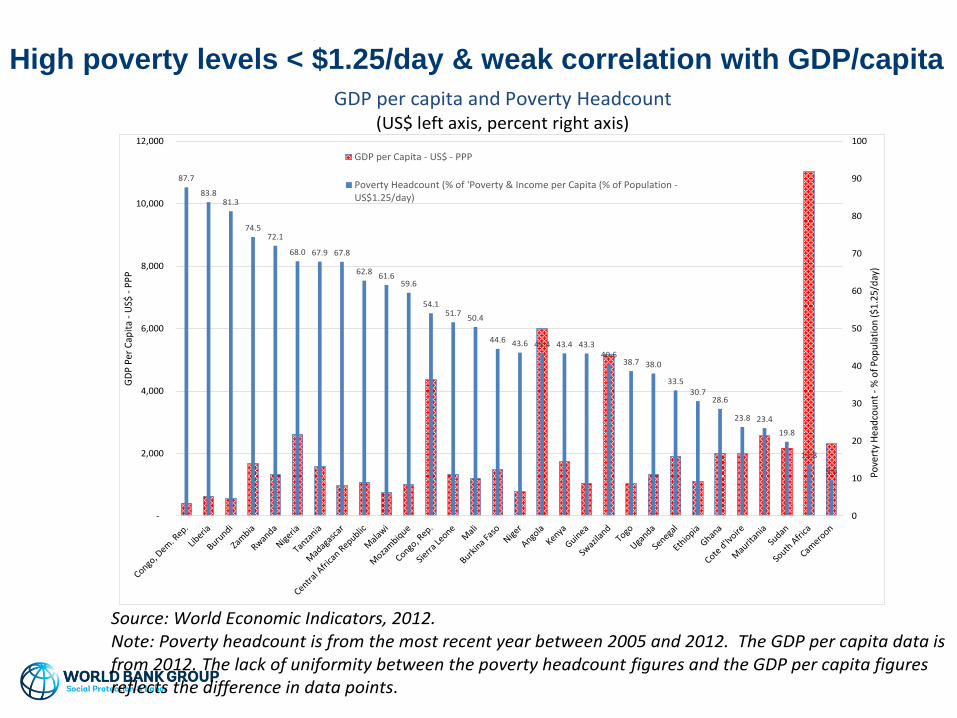
High poverty levels < $1.25/day & weak correlation with GDP/capita
GDP per capita and Poverty Headcount (US$ left axis, percent right axis)
Source: World Economic Indicators, 2012. Note: Poverty headcount is from the most recent year between 2005 and 2012. The GDP per capita data is from 2012. The lack of uniformity between the poverty headcount figures and the GDP per capita figures reflects the difference in data points.
87.7
83.881.3
74.572.1
68.0 67.9 67.8
62.861.6
59.6
54.151.7
50.4
44.6 43.6 43.4 43.4 43.340.6
38.7 38.0
33.530.7
28.6
23.8 23.4
19.8
13.8
9.6
0
10
20
30
40
50
60
70
80
90
100
-
2,000
4,000
6,000
8,000
10,000
12,000
Pove
rty
Hea
dco
un
t -
% o
f Po
pu
lati
on
($1.
25/d
ay)
GD
P P
er C
apit
a -
US$
-P
PP
GDP per Capita - US$ - PPP
Poverty Headcount (% of 'Poverty & Income per Capita (% of Population -US$1.25/day)

Coverage
11
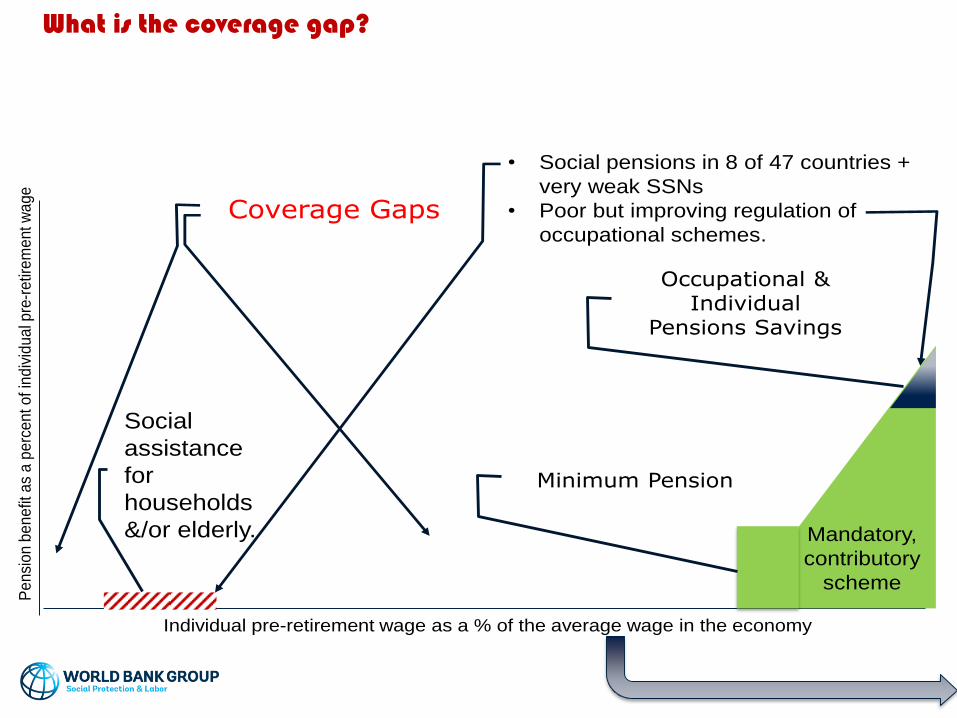
Mandatory,
contributory
scheme
Social
assistance
for
households
&/or elderly.
Occupational & Individual
Pensions Savings
Individual pre-retirement wage as a % of the average wage in the economy
Pe
nsi
on b
en
efit
as
a p
erc
en
t o
f in
div
idu
al p
re-r
etir
em
ent w
age
Minimum Pension
Coverage Gaps
• Social pensions in 8 of 47 countries +
very weak SSNs
• Poor but improving regulation of
occupational schemes.
What is the coverage gap?
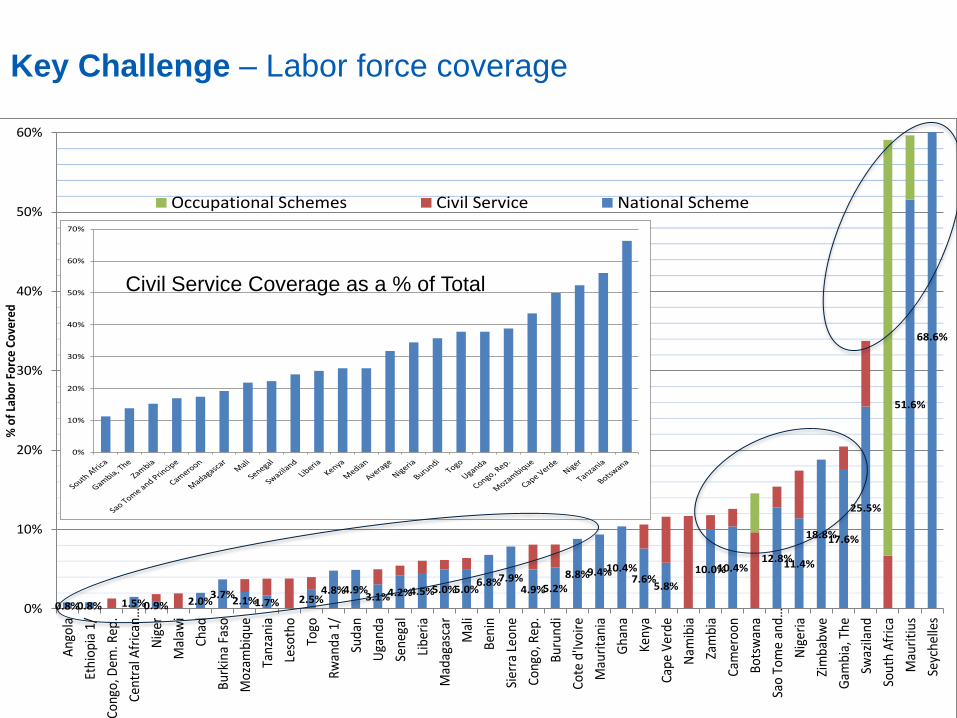
Key Challenge – Labor force coverage
0.8%0.8% 1.5%0.9% 2.0%3.7%
2.1%1.7% 2.5%4.8%4.9%
3.1%4.2%4.5%5.0%5.0%6.8%7.9%
4.9%5.2%
8.8%9.4%10.4%7.6%
5.8%
10.0%10.4%12.8%11.4%
18.8%17.6%
25.5%
51.6%
68.6%
0%
10%
20%
30%
40%
50%
60%
Ang
ola
Ethi
opia
1/
Cong
o, D
em. R
ep.
Cent
ral A
fric
an…
Nig
er
Mal
awi
Chad
Bur
kina
Fas
o
Moz
ambi
que
Tanz
ania
Leso
tho
Togo
Rw
anda
1/
Suda
n
Uga
nda
Sene
gal
Libe
ria
Mad
agas
car
Mal
i
Ben
in
Sier
ra L
eone
Cong
o, R
ep.
Bur
undi
Cote
d'Iv
oire
Mau
rita
nia
Gha
na
Keny
a
Cape
Ver
de
Nam
ibia
Zam
bia
Cam
eroo
n
Bot
swan
a
Sao
Tom
e an
d…
Nig
eria
Zim
babw
e
Gam
bia,
The
Swaz
iland
Sout
h A
fric
a
Mau
riti
us
Seyc
helle
s
% o
f La
bor
Forc
e Co
vere
d
Occupational Schemes Civil Service National Scheme
0%
10%
20%
30%
40%
50%
60%
70%
Civil Service Coverage as a % of Total
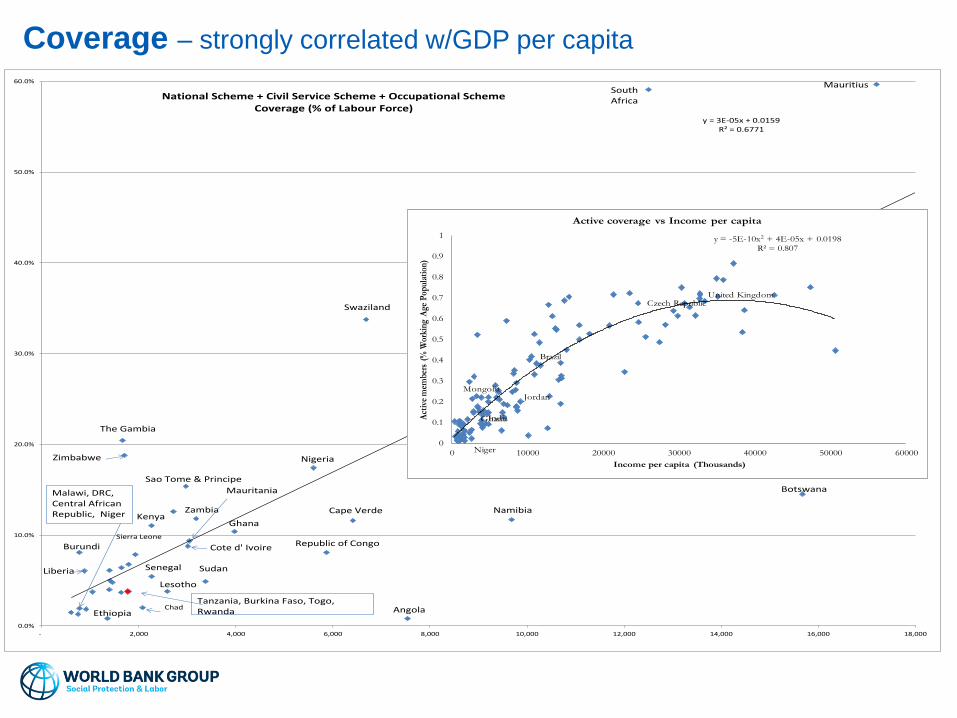
Coverage – strongly correlated w/GDP per capita
y = 3E-05x + 0.0159R² = 0.6771
0.0%
10.0%
20.0%
30.0%
40.0%
50.0%
60.0%
- 2,000 4,000 6,000 8,000 10,000 12,000 14,000 16,000 18,000
National Scheme + Civil Service Scheme + Occupational Scheme Coverage (% of Labour Force)
Botswana
Angola
Swaziland
Namibia
Sierra Leone
Kenya
Burundi
Ghana
Sudan
South Africa
Zambia
Sao Tome & Principe
The Gambia
Nigeria
Republic of Congo
Cape Verde
Mauritius
Ethiopia
Lesotho
Chad
Zimbabwe
Liberia
Cote d' Ivoire
MauritaniaMalawi, DRC, Central African Republic, Niger
Tanzania, Burkina Faso, Togo, Rwanda
Senegal
Mongolia
Czech RepublicUnited Kingdom
Brazil
Jordan
IndiaGhana
Niger
y = -5E-10x2 + 4E-05x + 0.0198R² = 0.807
0
0.1
0.2
0.3
0.4
0.5
0.6
0.7
0.8
0.9
1
0 10000 20000 30000 40000 50000 60000
Act
ive
mem
bers
(%
Wor
king
Age
Pop
ulat
ion)
Income per capita (Thousands)
Active coverage vs Income per capita
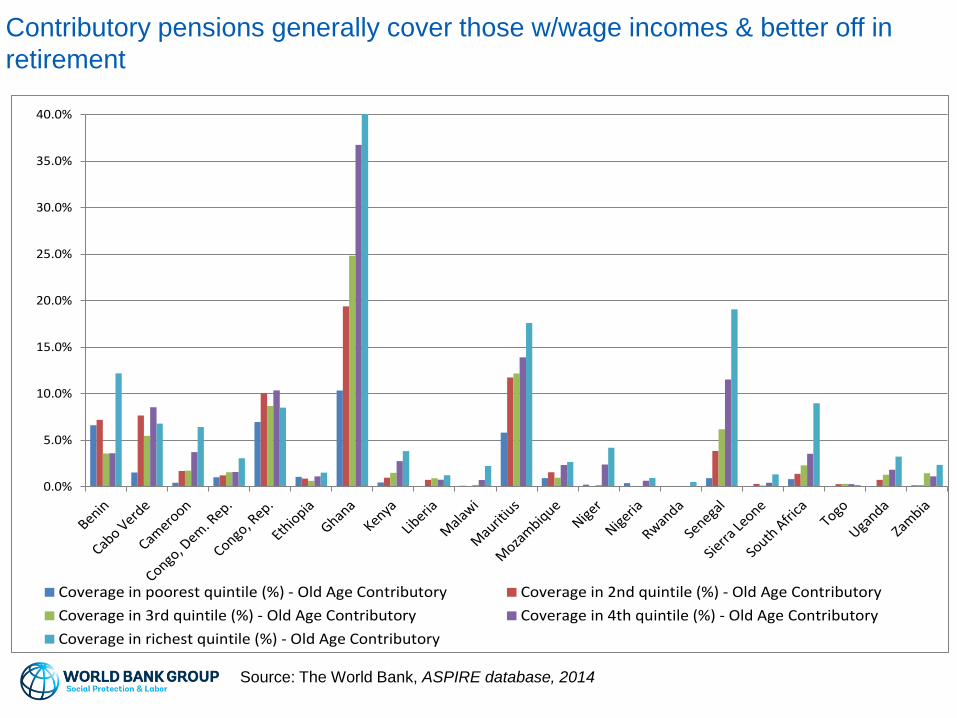
Contributory pensions generally cover those w/wage incomes & better off in
retirement
Source: The World Bank, ASPIRE database, 2014
0.0%
5.0%
10.0%
15.0%
20.0%
25.0%
30.0%
35.0%
40.0%
Coverage in poorest quintile (%) - Old Age Contributory Coverage in 2nd quintile (%) - Old Age Contributory
Coverage in 3rd quintile (%) - Old Age Contributory Coverage in 4th quintile (%) - Old Age Contributory
Coverage in richest quintile (%) - Old Age Contributory
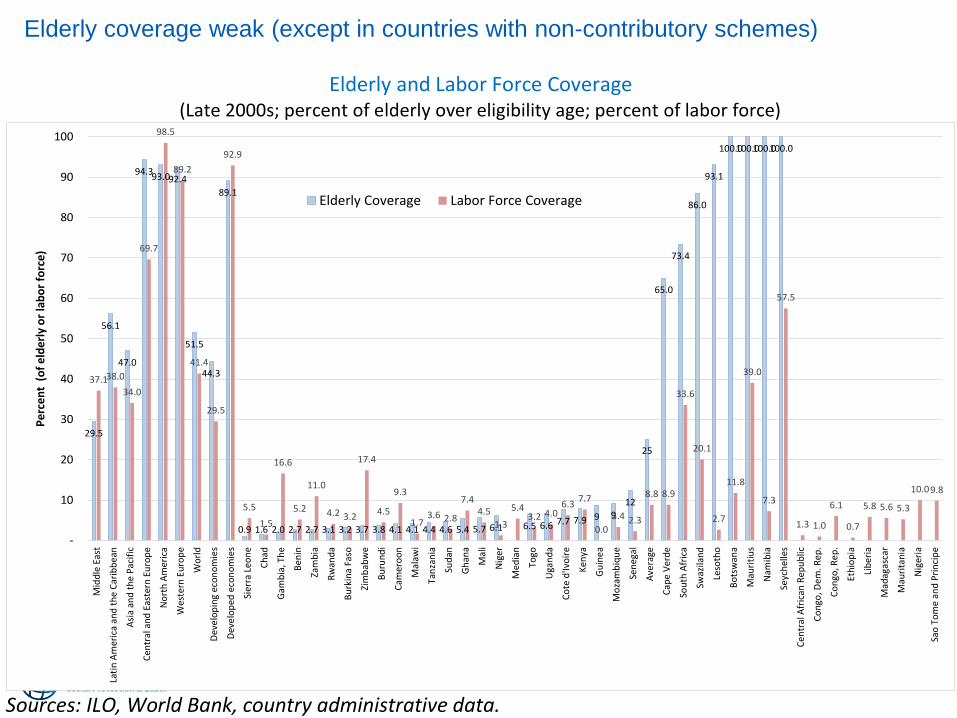
Elderly and Labor Force Coverage (Late 2000s; percent of elderly over eligibility age; percent of labor force)
Sources: ILO, World Bank, country administrative data.
29.5
56.1
47.0
94.393.092.4
51.5
44.3
89.1
0.9 1.6 2.0 2.7 2.7 3.1 3.2 3.7 3.8 4.1 4.1 4.4 4.6 5.4 5.7 6.1 6.5 6.6 7.7 7.9 9 9
12
25
65.0
73.4
86.0
93.1
100.0100.0100.0100.0
37.138.0
34.0
69.7
98.5
89.2
41.4
29.5
92.9
5.5
1.5
16.6
5.2
11.0
4.2 3.2
17.4
4.5
9.3
1.73.6 2.8
7.44.5
1.3
5.43.2 4.0
6.37.7
0.0
3.4 2.3
8.8 8.9
33.6
20.1
2.7
11.8
39.0
7.3
57.5
1.3 1.0
6.1
0.7
5.8 5.6 5.3
10.09.8
-
10
20
30
40
50
60
70
80
90
100
Mid
dle
Eas
t
Lati
n A
mer
ica
and
th
e C
arib
bea
n
Asi
a an
d t
he
Pac
ific
Cen
tral
an
d E
aste
rn E
uro
pe
No
rth
Am
eric
a
Wes
tern
Eu
rop
e
Wo
rld
Dev
elo
pin
g ec
on
om
ies
Dev
elo
ped
eco
no
mie
s
Sier
ra L
eon
e
Ch
ad
Gam
bia
, Th
e
Ben
in
Zam
bia
Rw
and
a
Bu
rkin
a Fa
so
Zim
bab
we
Bu
run
di
Cam
ero
on
Mal
awi
Tan
zan
ia
Sud
an
Gh
ana
Mal
i
Nig
er
Med
ian
Togo
Uga
nd
a
Co
te d
'Ivo
ire
Ken
ya
Gu
inea
Mo
zam
biq
ue
Sen
egal
Ave
rage
Cap
e V
erd
e
Sou
th A
fric
a
Swaz
ilan
d
Leso
tho
Bo
tsw
ana
Mau
riti
us
Nam
ibia
Seyc
hel
les
Cen
tral
Afr
ican
Rep
ub
lic
Co
ngo
, Dem
. Rep
.
Co
ngo
, Rep
.
Eth
iop
ia
Lib
eria
Mad
agas
car
Mau
rita
nia
Nig
eria
Sao
To
me
and
Pri
nci
pe
Per
cen
t (
of
eld
erly
or
lab
or
forc
e)
Elderly Coverage Labor Force Coverage
Elderly coverage weak (except in countries with non-contributory schemes)
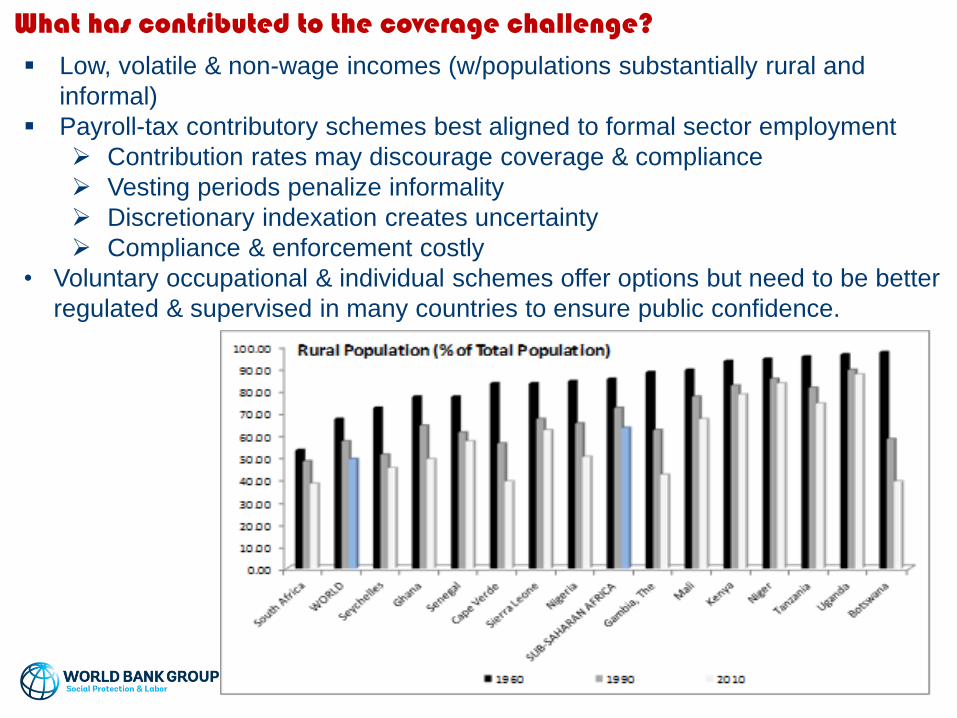
What has contributed to the coverage challenge?
Low, volatile & non-wage incomes (w/populations substantially rural and
informal)
Payroll-tax contributory schemes best aligned to formal sector employment
Contribution rates may discourage coverage & compliance
Vesting periods penalize informality
Discretionary indexation creates uncertainty
Compliance & enforcement costly
• Voluntary occupational & individual schemes offer options but need to be better
regulated & supervised in many countries to ensure public confidence.

Adequacy & Affordability
18
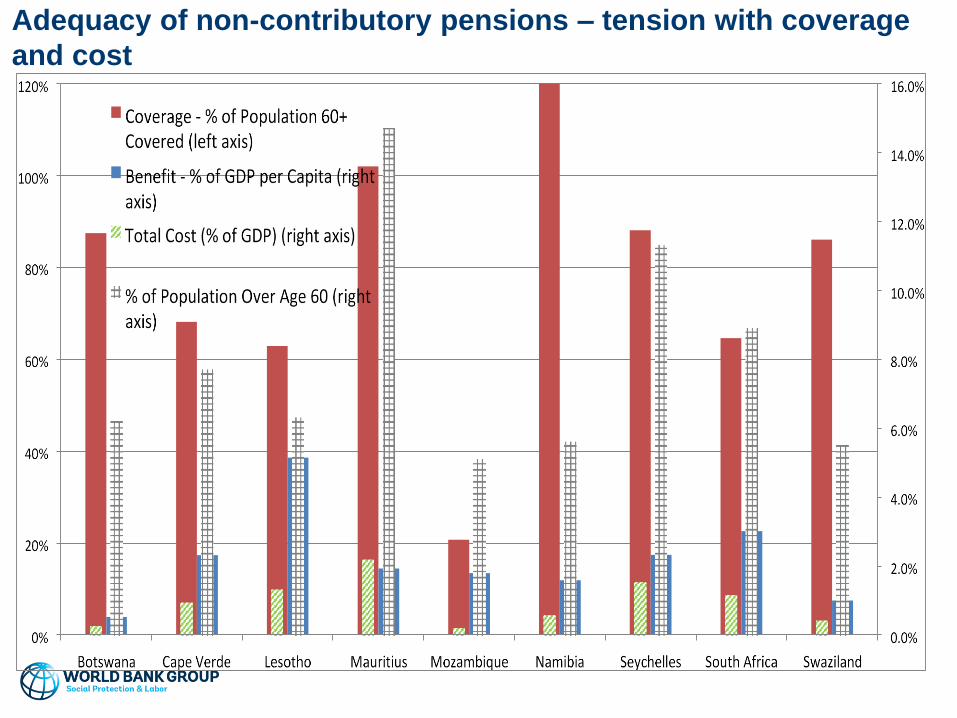
Adequacy of non-contributory pensions – tension with coverage
and cost
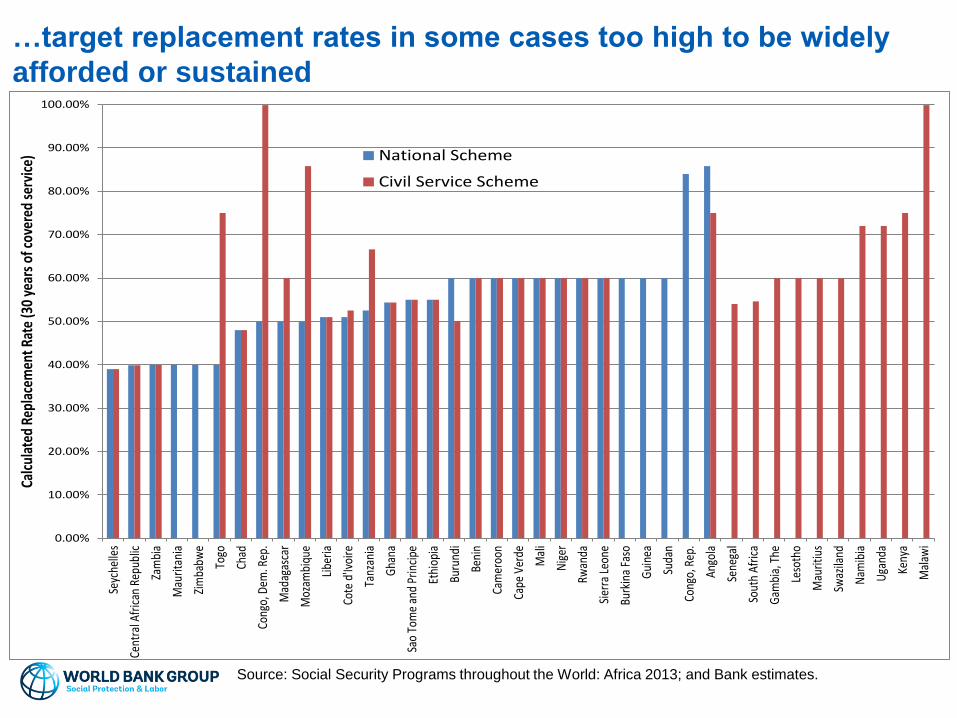
…target replacement rates in some cases too high to be widely
afforded or sustained
Simulated Replacement Rates
0.00%
10.00%
20.00%
30.00%
40.00%
50.00%
60.00%
70.00%
80.00%
90.00%
100.00%Se
yche
lles
Cent
ral A
fric
an R
epub
lic
Zam
bia
Mau
ritan
ia
Zim
babw
e
Togo
Chad
Cong
o, D
em. R
ep.
Mad
agas
car
Moz
ambi
que
Libe
ria
Cote
d'Iv
oire
Tanz
ania
Gha
na
Sao
Tom
e an
d Pr
inci
pe
Ethi
opia
Buru
ndi
Beni
n
Cam
eroo
n
Cape
Ver
de
Mal
i
Nig
er
Rwan
da
Sier
ra L
eone
Burk
ina
Faso
Gui
nea
Suda
n
Cong
o, R
ep.
Ango
la
Sene
gal
Sout
h Af
rica
Gam
bia,
The
Leso
tho
Mau
ritiu
s
Swaz
iland
Nam
ibia
Uga
nda
Keny
a
Mal
awi
Calc
ulat
ed R
epla
cem
ent R
ate
(30
year
s of
cov
ered
ser
vice
) National Scheme
Civil Service Scheme
Source: Social Security Programs throughout the World: Africa 2013; and Bank estimates.
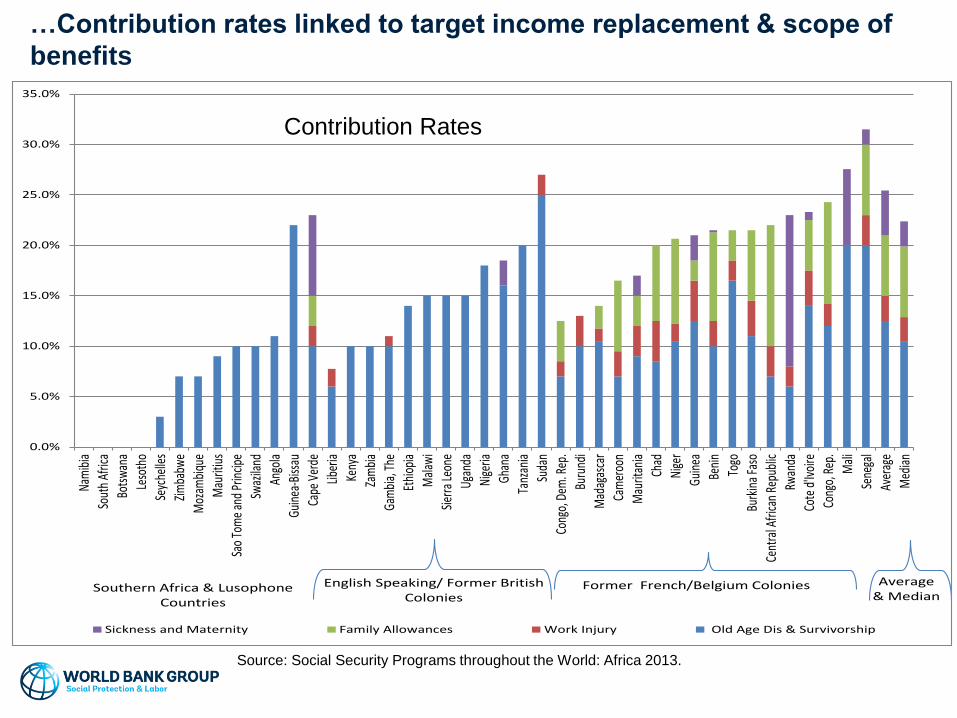
…Contribution rates linked to target income replacement & scope of
benefits
0.0%
5.0%
10.0%
15.0%
20.0%
25.0%
30.0%
35.0%Na
mib
ia
Sout
h Af
rica
Bots
wan
a
Leso
tho
Seyc
helle
s
Zim
babw
e
Moz
ambi
que
Mau
ritiu
s
Sao
Tom
e an
d Pr
incip
e
Swaz
iland
Ango
la
Guin
ea-B
issau
Cape
Ver
de
Liber
ia
Keny
a
Zam
bia
Gam
bia,
The
Ethi
opia
Mal
awi
Sier
ra Le
one
Ugan
da
Nige
ria
Ghan
a
Tanz
ania
Suda
n
Cong
o, D
em. R
ep.
Buru
ndi
Mad
agas
car
Cam
eroo
n
Mau
ritan
ia
Chad
Nige
r
Guin
ea
Beni
n
Togo
Burk
ina
Faso
Cent
ral A
frica
n Re
publ
ic
Rwan
da
Cote
d'Iv
oire
Cong
o, R
ep.
Mal
i
Sene
gal
Aver
age
Med
ian
Sickness and Maternity Family Allowances Work Injury Old Age Dis & Survivorship
English Speaking/ Former British Colonies
Southern Africa & Lusophone Countries
Former French/Belgium Colonies Average& Median
Contribution Rates
Source: Social Security Programs throughout the World: Africa 2013.
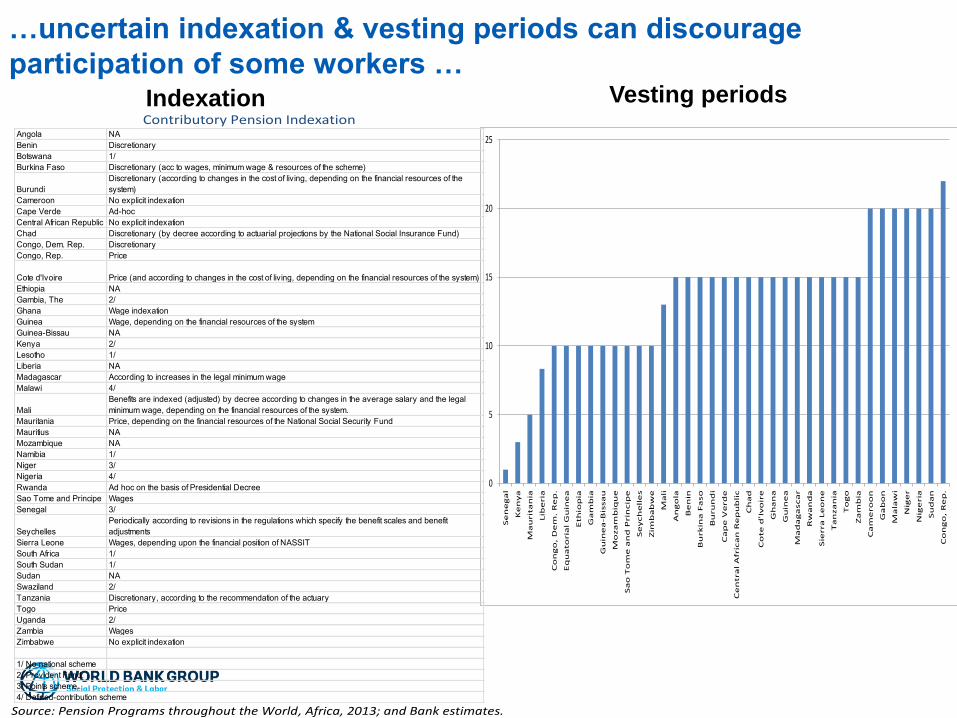
…uncertain indexation & vesting periods can discourage
participation of some workers …Indexation Vesting periods
0
5
10
15
20
25
Se
ne
ga
l
Ke
nya
Ma
urit
an
ia
Lib
eria
Co
ng
o,
De
m.
Re
p.
Eq
ua
to
ria
l G
uin
ea
Eth
iop
ia
Ga
mb
ia
Gu
ine
a-B
issa
u
Mo
za
mb
iqu
e
Sa
o T
om
e a
nd
Prin
cip
e
Se
ych
ell
es
Zim
ba
bw
e
Ma
li
An
go
la
Be
nin
Bu
rk
ina
Fa
so
Bu
ru
nd
i
Ca
pe
Ve
rd
e
Ce
ntra
l A
fric
an
Re
pu
bli
c
Ch
ad
Co
te
d'I
vo
ire
Gh
an
a
Gu
ine
a
Ma
da
ga
sca
r
Rw
an
da
Sie
rra
Le
on
e
Ta
nza
nia
To
go
Za
mb
ia
Ca
me
ro
on
Ga
bo
n
Ma
law
i
Nig
er
Nig
eria
Su
da
n
Co
ng
o,
Re
p.
Contributory Pension Indexation
Source: Pension Programs throughout the World, Africa, 2013; and Bank estimates.
Angola NA
Benin Discretionary
Botswana 1/
Burkina Faso Discretionary (acc to wages, minimum wage & resources of the scheme)
Burundi
Discretionary (according to changes in the cost of living, depending on the financial resources of the
system)
Cameroon No explicit indexation
Cape Verde Ad-hoc
Central African Republic No explicit indexation
Chad Discretionary (by decree according to actuarial projections by the National Social Insurance Fund)
Congo, Dem. Rep. Discretionary
Congo, Rep. Price
Cote d'Ivoire Price (and according to changes in the cost of living, depending on the financial resources of the system)
Ethiopia NA
Gambia, The 2/
Ghana Wage indexation
Guinea Wage, depending on the financial resources of the system
Guinea-Bissau NA
Kenya 2/
Lesotho 1/
Liberia NA
Madagascar According to increases in the legal minimum wage
Malawi 4/
Mali
Benefits are indexed (adjusted) by decree according to changes in the average salary and the legal
minimum wage, depending on the financial resources of the system.
Mauritania Price, depending on the financial resources of the National Social Security Fund
Mauritius NA
Mozambique NA
Namibia 1/
Niger 3/
Nigeria 4/
Rwanda Ad hoc on the basis of Presidential Decree
Sao Tome and Principe Wages
Senegal 3/
Seychelles
Periodically according to revisions in the regulations which specify the benefit scales and benefit
adjustments
Sierra Leone Wages, depending upon the financial position of NASSIT
South Africa 1/
South Sudan 1/
Sudan NA
Swaziland 2/
Tanzania Discretionary, according to the recommendation of the actuary
Togo Price
Uganda 2/
Zambia Wages
Zimbabwe No explicit indexation
1/ No national scheme
2/ Provident Fund.
3/ Points scheme.
4/ Defined-contribution scheme
Sustainability
23
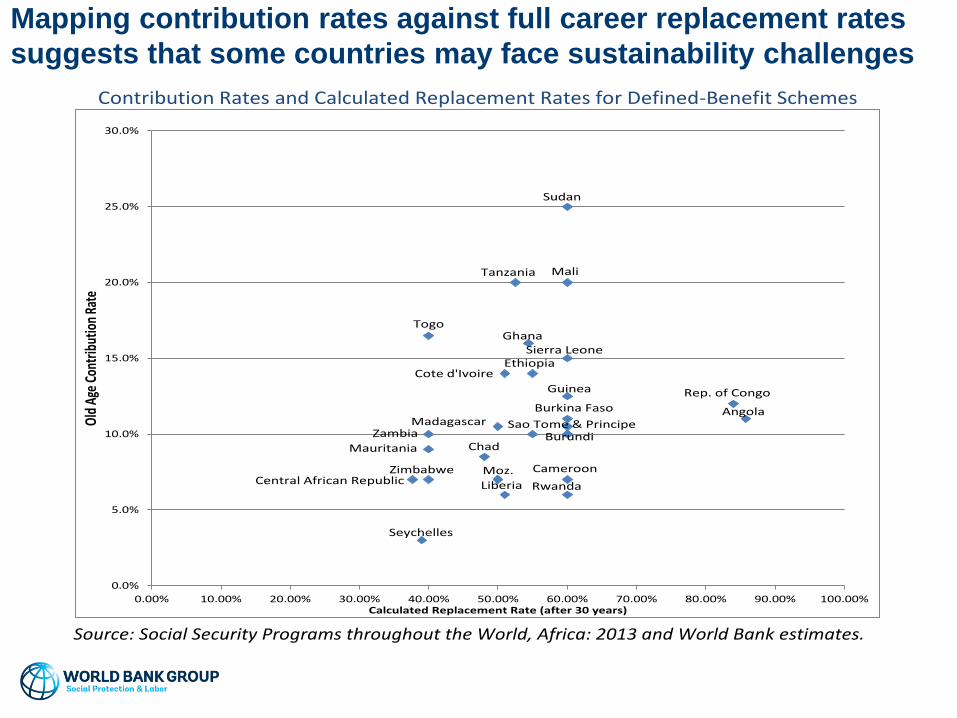
Mapping contribution rates against full career replacement rates
suggests that some countries may face sustainability challenges
Contribution Rates and Calculated Replacement Rates for Defined-Benefit Schemes
Source: Social Security Programs throughout the World, Africa: 2013 and World Bank estimates.
0.0%
5.0%
10.0%
15.0%
20.0%
25.0%
30.0%
0.00% 10.00% 20.00% 30.00% 40.00% 50.00% 60.00% 70.00% 80.00% 90.00% 100.00%
Old
Age
Con
trib
utio
n Ra
te
Calculated Replacement Rate (after 30 years)
Sudan
Tanzania Mali
TogoGhana
Rep. of Congo
Angola
Seychelles
Central African Republic
Zambia
Mauritania
Cote d'Ivoire
Sierra Leone
Madagascar
Liberia Rwanda
Guinea
Burkina Faso
Chad
Moz. CameroonZimbabwe
Ethiopia
Sao Tome & PrincipeBurundi
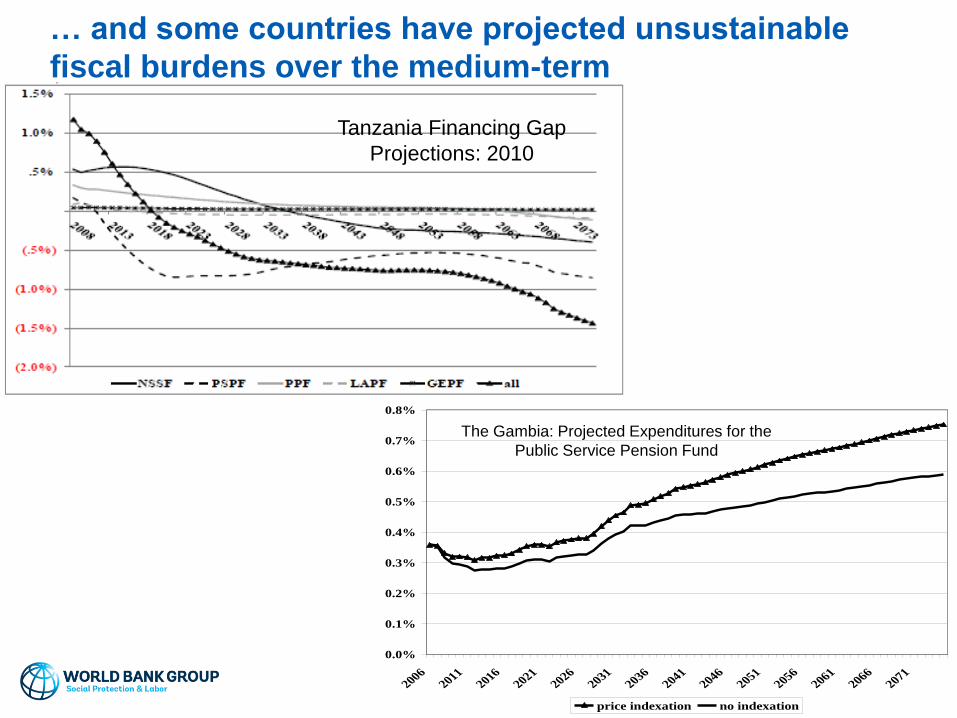
… and some countries have projected unsustainable
fiscal burdens over the medium-term
Tanzania: Pension Financing Gaps
Tanzania Financing Gap
Projections: 2010
0.0%
0.1%
0.2%
0.3%
0.4%
0.5%
0.6%
0.7%
0.8%
20062011
20162021
20262031
20362041
20462051
20562061
20662071
price indexation no indexation
The Gambia: Projected Expenditures for the
Public Service Pension Fund
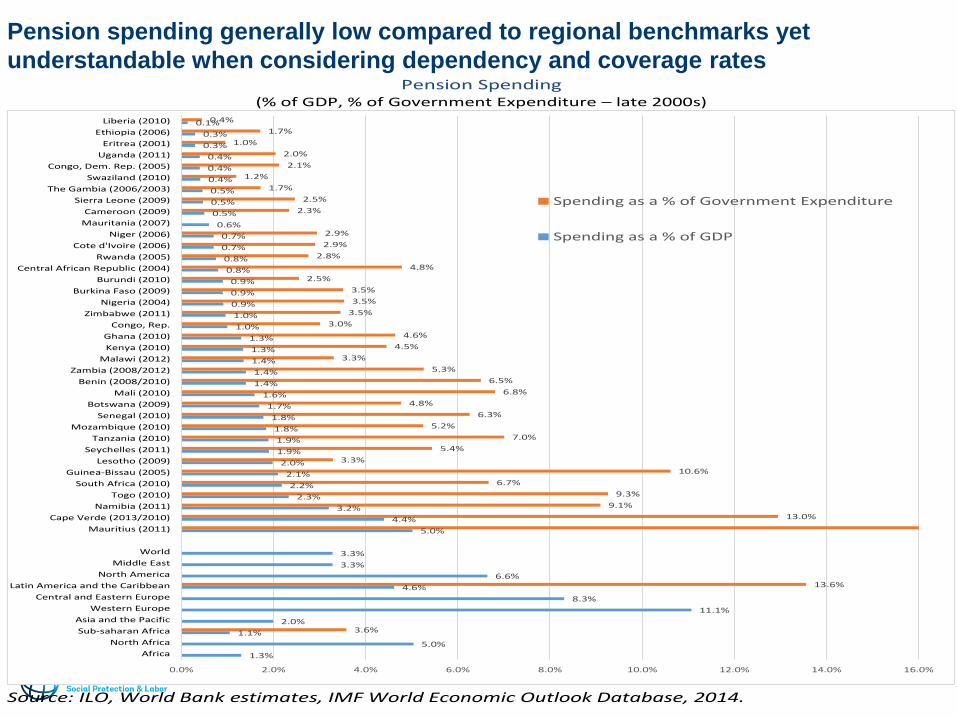
Pension spending generally low compared to regional benchmarks yet
understandable when considering dependency and coverage ratesPension Spending
(% of GDP, % of Government Expenditure – late 2000s)
Source: ILO, World Bank estimates, IMF World Economic Outlook Database, 2014.
1.3%
5.0%
1.1%
2.0%
11.1%
8.3%
4.6%
6.6%
3.3%
3.3%
5.0%
4.4%
3.2%
2.3%
2.2%
2.1%
2.0%
1.9%
1.9%
1.8%
1.8%
1.7%
1.6%
1.4%
1.4%
1.4%
1.3%
1.3%
1.0%
1.0%
0.9%
0.9%
0.9%
0.8%
0.8%
0.7%
0.7%
0.6%
0.5%
0.5%
0.5%
0.4%
0.4%
0.4%
0.3%
0.3%
0.1%
3.6%
13.6%
13.0%
9.1%
9.3%
6.7%
10.6%
3.3%
5.4%
7.0%
5.2%
6.3%
4.8%
6.8%
6.5%
5.3%
3.3%
4.5%
4.6%
3.0%
3.5%
3.5%
3.5%
2.5%
4.8%
2.8%
2.9%
2.9%
2.3%
2.5%
1.7%
1.2%
2.1%
2.0%
1.0%
1.7%
0.4%
0.0% 2.0% 4.0% 6.0% 8.0% 10.0% 12.0% 14.0% 16.0%
Africa
North Africa
Sub-saharan Africa
Asia and the Pacific
Western Europe
Central and Eastern Europe
Latin America and the Caribbean
North America
Middle East
World
Mauritius (2011)
Cape Verde (2013/2010)
Namibia (2011)
Togo (2010)
South Africa (2010)
Guinea-Bissau (2005)
Lesotho (2009)
Seychelles (2011)
Tanzania (2010)
Mozambique (2010)
Senegal (2010)
Botswana (2009)
Mali (2010)
Benin (2008/2010)
Zambia (2008/2012)
Malawi (2012)
Kenya (2010)
Ghana (2010)
Congo, Rep.
Zimbabwe (2011)
Nigeria (2004)
Burkina Faso (2009)
Burundi (2010)
Central African Republic (2004)
Rwanda (2005)
Cote d'Ivoire (2006)
Niger (2006)
Mauritania (2007)
Cameroon (2009)
Sierra Leone (2009)
The Gambia (2006/2003)
Swaziland (2010)
Congo, Dem. Rep. (2005)
Uganda (2011)
Eritrea (2001)
Ethiopia (2006)
Liberia (2010)
Spending as a % of Government Expenditure
Spending as a % of GDP
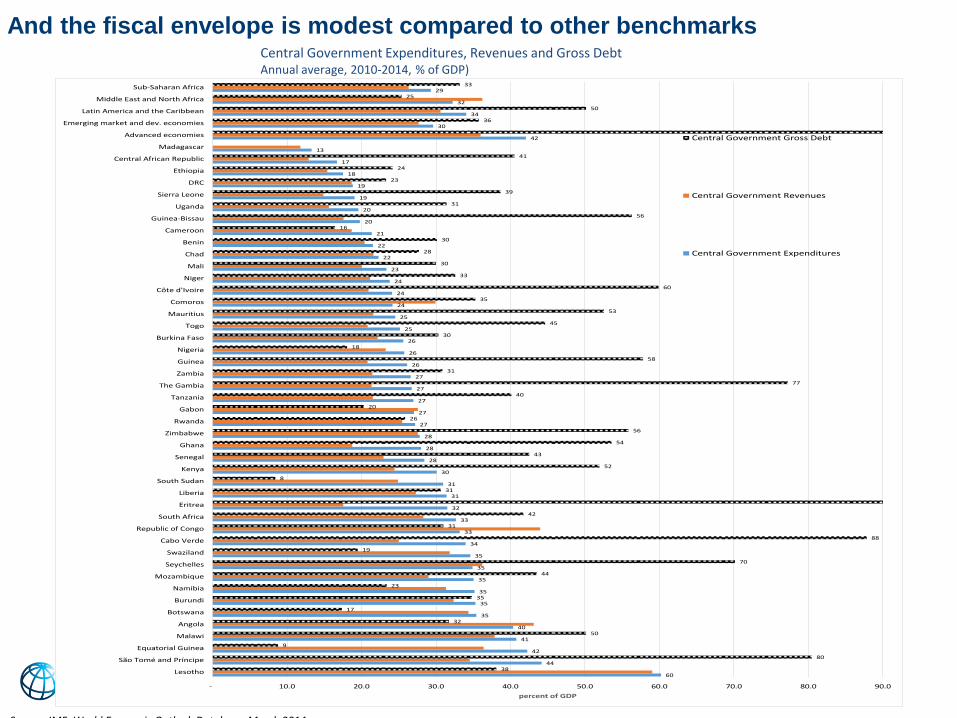
Central Government Expenditures, Revenues and Gross DebtAnnual average, 2010-2014, % of GDP)
60
44
42
41
40
35
35
35
35
35
35
34
33
33
32
31
31
30
28
28
28
27
27
27
27
27
26
26
26
25
25
24
24
24
23
22
22
21
20
20
19
19
18
17
13
42
30
34
32
29
38
80
9
50
32
17
35
23
44
70
19
88
31
42
31
8
52
43
54
56
26
20
40
77
31
58
18
30
45
53
35
60
33
30
28
30
16
56
31
39
23
24
41
36
50
25
33
- 10.0 20.0 30.0 40.0 50.0 60.0 70.0 80.0 90.0
Lesotho
São Tomé and Príncipe
Equatorial Guinea
Malawi
Angola
Botswana
Burundi
Namibia
Mozambique
Seychelles
Swaziland
Cabo Verde
Republic of Congo
South Africa
Eritrea
Liberia
South Sudan
Kenya
Senegal
Ghana
Zimbabwe
Rwanda
Gabon
Tanzania
The Gambia
Zambia
Guinea
Nigeria
Burkina Faso
Togo
Mauritius
Comoros
Côte d'Ivoire
Niger
Mali
Chad
Benin
Cameroon
Guinea-Bissau
Uganda
Sierra Leone
DRC
Ethiopia
Central African Republic
Madagascar
Advanced economies
Emerging market and dev. economies
Latin America and the Caribbean
Middle East and North Africa
Sub-Saharan Africa
percent of GDP
Central Government Gross Debt
Central Government Revenues
Central Government Expenditures
Source: IMF: World Economic Outlook Database, March 2014.
And the fiscal envelope is modest compared to other benchmarks
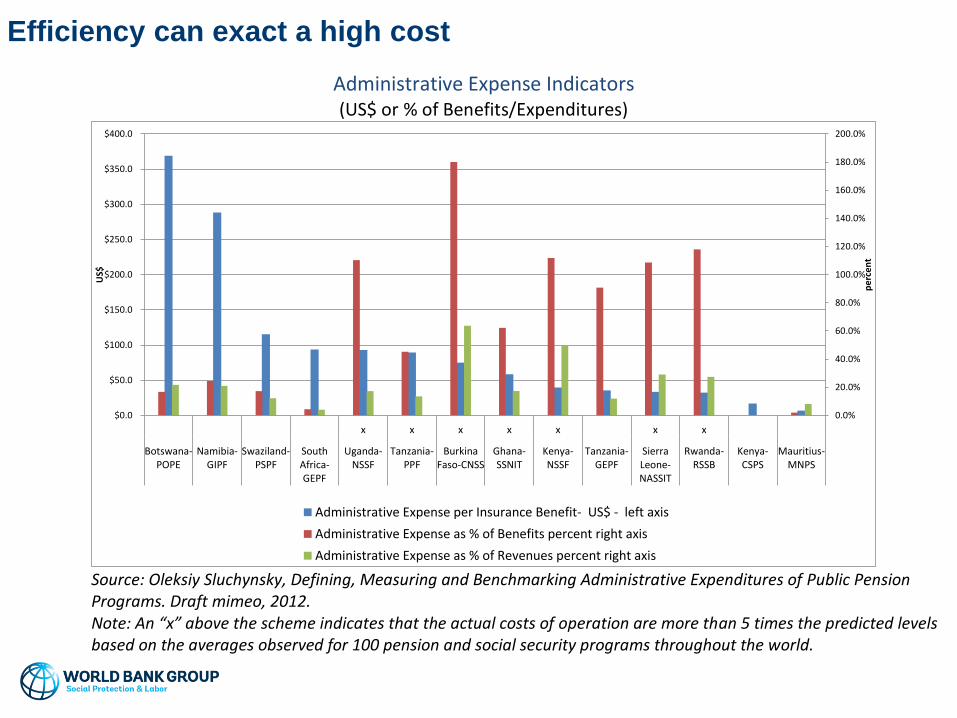
Efficiency can exact a high cost
Administrative Expense Indicators (US$ or % of Benefits/Expenditures)
Source: Oleksiy Sluchynsky, Defining, Measuring and Benchmarking Administrative Expenditures of Public Pension Programs. Draft mimeo, 2012. Note: An “x” above the scheme indicates that the actual costs of operation are more than 5 times the predicted levels based on the averages observed for 100 pension and social security programs throughout the world.
0.0%
20.0%
40.0%
60.0%
80.0%
100.0%
120.0%
140.0%
160.0%
180.0%
200.0%
$0.0
$50.0
$100.0
$150.0
$200.0
$250.0
$300.0
$350.0
$400.0
x x x x x x x
Botswana-POPE
Namibia-GIPF
Swaziland-PSPF
SouthAfrica-GEPF
Uganda-NSSF
Tanzania-PPF
BurkinaFaso-CNSS
Ghana-SSNIT
Kenya-NSSF
Tanzania-GEPF
SierraLeone-NASSIT
Rwanda-RSSB
Kenya-CSPS
Mauritius-MNPS
pe
rce
nt
US$
Administrative Expense per Insurance Benefit- US$ - left axis
Administrative Expense as % of Benefits percent right axis
Administrative Expense as % of Revenues percent right axis
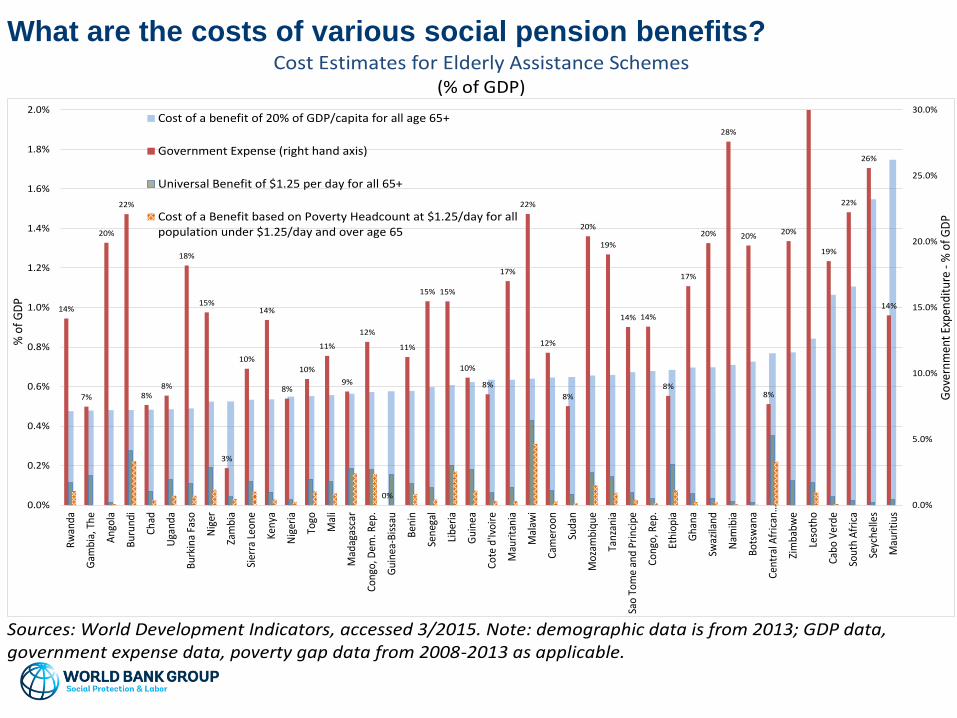
What are the costs of various social pension benefits?Cost Estimates for Elderly Assistance Schemes
(% of GDP)
Sources: World Development Indicators, accessed 3/2015. Note: demographic data is from 2013; GDP data, government expense data, poverty gap data from 2008-2013 as applicable.
14%
7%
20%
22%
8%8%
18%
15%
3%
10%
14%
8%
10%
11%
9%
12%
0%
11%
15% 15%
10%
8%
17%
22%
12%
8%
20%
19%
14% 14%
8%
17%
20%
28%
20%
8%
20%
19%
22%
26%
14%
0.0%
5.0%
10.0%
15.0%
20.0%
25.0%
30.0%
0.0%
0.2%
0.4%
0.6%
0.8%
1.0%
1.2%
1.4%
1.6%
1.8%
2.0%
Rw
anda
Gam
bia,
The
Ang
ola
Bur
undi
Chad
Uga
nda
Bur
kina
Fas
o
Nig
er
Zam
bia
Sier
ra L
eone
Keny
a
Nig
eria
Togo
Mal
i
Mad
agas
car
Cong
o, D
em. R
ep.
Gui
nea-
Bis
sau
Ben
in
Sene
gal
Libe
ria
Gui
nea
Cote
d'Iv
oire
Mau
rita
nia
Mal
awi
Cam
eroo
n
Suda
n
Moz
ambi
que
Tanz
ania
Sao
Tom
e an
d Pr
inci
pe
Cong
o, R
ep.
Ethi
opia
Gha
na
Swaz
iland
Nam
ibia
Bot
swan
a
Cent
ral A
fric
an…
Zim
babw
e
Leso
tho
Cabo
Ver
de
Sout
h A
fric
a
Seyc
helle
s
Mau
riti
us
Gov
ernm
ent E
xpen
ditu
re -
% o
f GD
P
% o
f GD
P
Cost of a benefit of 20% of GDP/capita for all age 65+
Government Expense (right hand axis)
Universal Benefit of $1.25 per day for all 65+
Cost of a Benefit based on Poverty Headcount at $1.25/day for allpopulation under $1.25/day and over age 65
What contributes to potentially growing fiscal costs?
• National schemes – maturing
• Early stage in demographic transition, but possibly more
advanced in covered workforce
• Contr. rates & benefit formulas inconsistent w/long-run
balances
• Administrative costs
• Civil servant schemes - Growth in system dependency ratios
& some with inconsistent parameters.
• Transition costs for civil servant schemes adopting funding.
• Social pension costs increase w/growth in elderly populations
& scheme expansion

Reform Principles
31
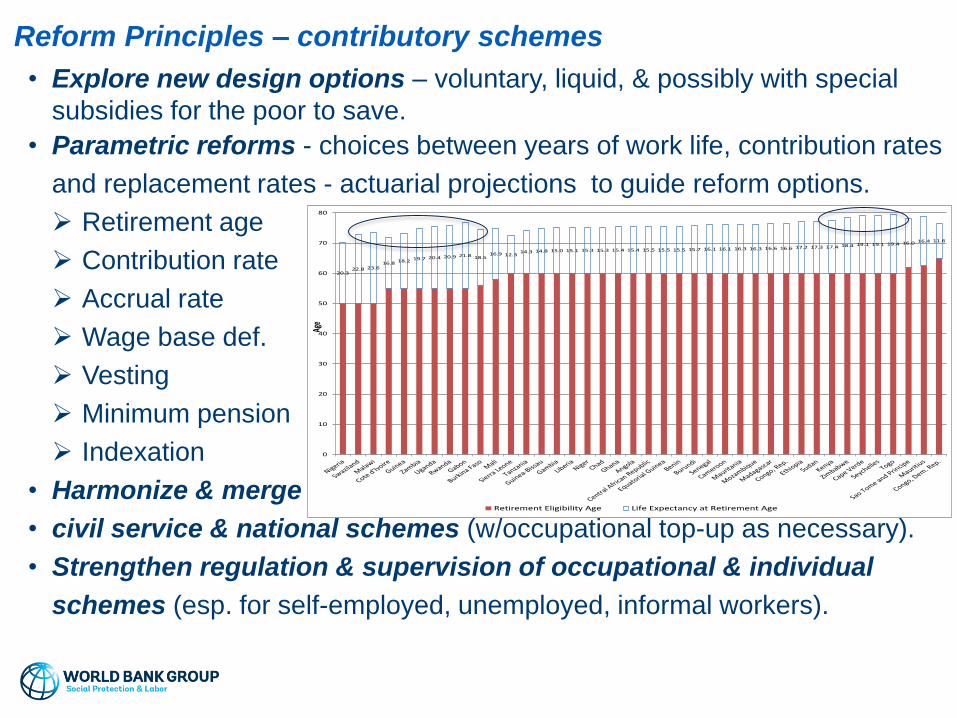
Reform Principles – contributory schemes
• Explore new design options – voluntary, liquid, & possibly with special
subsidies for the poor to save.
• Parametric reforms - choices between years of work life, contribution rates
and replacement rates - actuarial projections to guide reform options.
Retirement age
Contribution rate
Accrual rate
Wage base def.
Vesting
Minimum pension
Indexation
• Harmonize & merge
• civil service & national schemes (w/occupational top-up as necessary).
• Strengthen regulation & supervision of occupational & individual
schemes (esp. for self-employed, unemployed, informal workers).
20.322.8 23.6
16.8 18.2 19.7 20.4 20.9 21.8 18.516.9 12.3
14.3 14.8 15.0 15.1 15.3 15.3 15.4 15.4 15.5 15.5 15.5 15.7 16.1 16.1 16.3 16.3 16.6 16.6 17.2 17.3 17.4 18.4 19.1 19.1 19.4 16.0 16.4 11.6
0
10
20
30
40
50
60
70
80
Age
Retirement Eligibility Age Life Expectancy at Retirement Age
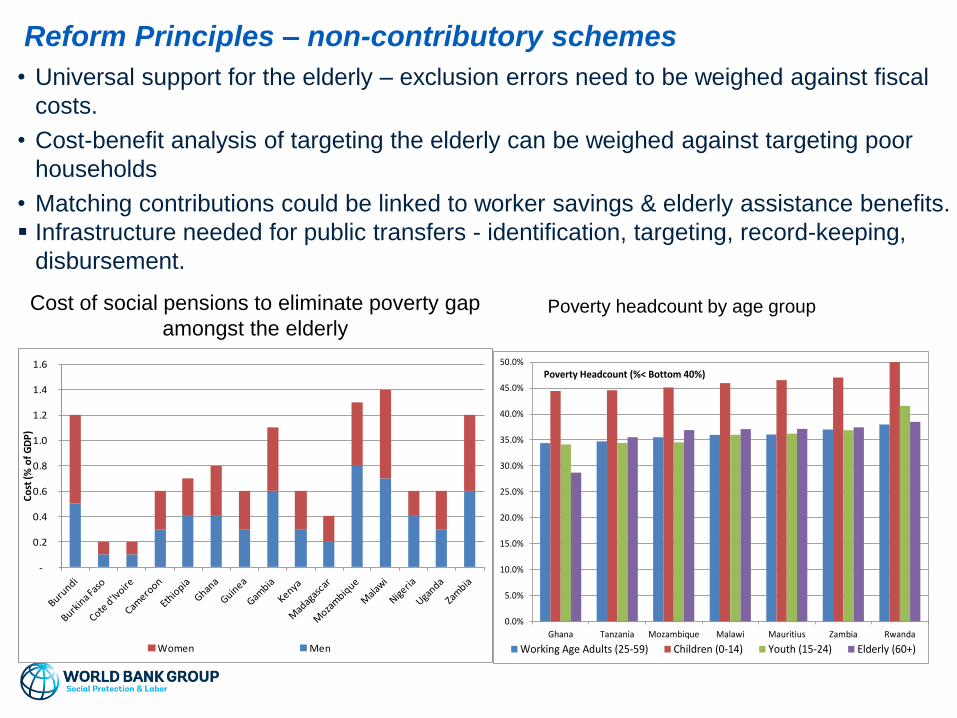
Reform Principles – non-contributory schemes
• Universal support for the elderly – exclusion errors need to be weighed against fiscal
costs.
• Cost-benefit analysis of targeting the elderly can be weighed against targeting poor
households
• Matching contributions could be linked to worker savings & elderly assistance benefits.
Infrastructure needed for public transfers - identification, targeting, record-keeping,
disbursement.
0.0%
5.0%
10.0%
15.0%
20.0%
25.0%
30.0%
35.0%
40.0%
45.0%
50.0%
Ghana Tanzania Mozambique Malawi Mauritius Zambia Rwanda
Working Age Adults (25-59) Children (0-14) Youth (15-24) Elderly (60+)
Poverty Headcount (%< Bottom 40%)
Poverty headcount by age group
-
0.2
0.4
0.6
0.8
1.0
1.2
1.4
1.6
Co
st (%
of
GD
P)
Women Men
Cost of social pensions to eliminate poverty gap
amongst the elderly

Questions for Discussion
34
Closing the coverage gap• Should a core focus of social security be oriented towards increasing the
coverage of elderly poverty protection?
• What contributory designs and non-contributory support offer the strongest
potential for scalability?
Focusing on the poorest• Should cash transfers target the poorest, including elderly in poor households?
• Alternatively, should universal support for the elderly be offered to avoid
exclusion errors and labor market effects (or cases with a legacy schemes)?
Aligning pensions to needs and enabling conditions • Should payroll-based PAYG DB schemes in SSA depart from the scaled-
premium approach adopting lower benefit levels where needed consistent with
affordable long-term contributions and sustainable balances?
• Where in the region might the risks of pre-funding outweigh the benefits due to
insufficient enabling conditions (incl. fiscal capacity to support transition costs,
regulatory & institutional infrastructure)?
• What are some of the tradeoffs involved in coordinating or merging civil service
and national schemes?