Embed Size (px)
Citation preview

EUROPEAN COMMISSION
Pension schemes and pension projections in the EU-27 Member States — 2008-2060
Volume I — Report
Economic Policy Committee (AWG) and Directorate-General for Economic and Financial Affairs
Occasional Papers 56| October 2009
EUROPEAN ECONOMY

Occasional Papers are written by the Staff of the Directorate-General for Economic and Financial Affairs, or by experts working in association with them. The “Papers” are intended to increase awareness of the technical work being done by the staff and cover a wide spectrum of subjects. Views expressed do not necessarily reflect the official views of the European Commission. Comments and enquiries should be addressed to: European Commission Directorate-General for Economic and Financial Affairs Publications B-1049 Brussels Belgium E-mail: mailto:[email protected] This paper exists in English only and can be downloaded from the website http://ec.europa.eu/economy_finance/publications A great deal of additional information is available on the Internet. It can be accessed through the Europa server (http://europa.eu ) ISBN 978-92-79-11270-6 DOI: 10.2765/54270 © European Communities, 2009

European Commission Directorate-General for Economic and Financial Affairs
PENSION SCHEMES AND PENSION PROJECTIONS
IN THE EU-27 MEMBER STATES 2008-2060
Volume I Report
EUROPEAN ECONOMY Occasional Papers No. 56

Acknowledgements This paper reviews the public pension schemes and the pension models used for the projections carried out by the European Commission and the Economic Policy Committee of age-related expenditure included in the 2009 Ageing Report. The paper aims at contributing to the comparability of the pension projections across Member States and to make the projections transparent and better understandable through country-specific descriptions of the pension systems and the models used for the projection exercise. Moreover, it provides a detailed account by Member State on the projection results. The report was prepared under the supervision of Gert Jan Koopman (Director of DG ECFIN), Christian Kastrop (Chair of the EPC), Henri Bogaert (Chair of the AWG) and Giuseppe Carone (Head of Unit, DG ECFIN). It was edited by Per Eckefeldt and Kamil Dybczak. The individual country fiches were prepared by experts in the Member States under the supervision of the members of the AWG. Editorial assistance by Agnieszka Budzińska and Etienne Sail is gratefully acknowledged. The EPC and the Directorate-General for Economic and Financial Affairs would like to thank all those concerned. Comments on the report would be gratefully received at the following addresses: DG ECFIN - Unit B3 Directorate-General for Economic and Financial Affairs European Commission Giuseppe Carone Rue de la Loi 200 B-1049 Brussels E-mail: [email protected] Secretariat of the Economic Policy Committee European Commission Jens Matthiessen Rue de la Loi 200 B-1049 Brussels E-mail: [email protected]
1

Members of the Ageing Working Group CHAIRMAN Mr Henri BOGAERT, Commissaire au Plan Bureau fédéral du Plan, Belgique - Federaal
Planbureau, Belgïe BELGIQUE-BELGÏE Mr Michel ENGLERT Bureau fédéral du Plan - Federaal Planbureau Mme Micheline LAMBRECHT Bureau fédéral du Plan - Federaal Planbureau BULGARIA Mr Dimitar VASSILEV Agency for Economic Analysis and Forecasting Ms Tsvetelina DIMITROVA Agency for Economic Analysis and Forecasting Ms Antoaneta GANCHEVA National Social Security Institute CZECH REPUBLIC Mr Zbynek STORK Ministry of Finance Mr Jindrich MARVAL Ministry of Finance DANMARK Mr Benn VESTERGAARD Ministry of Finance Ms Vibe MUSAEUS MADSEN Ministry of Finance Mr Jorgen Sloth Bjerre HANSEN Ministry of Finance BUNDESREPUBLIK DEUTSCHLAND Ms Britta VELLEUER Bundesministerium der Finanzen Mr Konrad HAKER Bundesministerium für Arbeit und Soziales ESTONIA Mr Tanel STEINBERG Ministry of Finance Ms Pille MIHKELSON Ministry of Finance ELLAS Ms Marianna PAPAMICHAIL National Actuarial Authority Mr Dimitris PAPAOIKONOMOU Ministry of Economy and Finance Ms Charitini KARAKOULAKI Ministry of Economy and Finance ESPAÑA Ms Virginia ALONSO Ministerio de Economia y Hacienda Mr Juan VARELA Ministerio de Economia y Hacienda Mr Francisco DE CASTRO Bank of Spain FRANCE Mr Thibault GUYON Ministère de l'économie, de l'industrie, et de
l’emploi Mr Falilou FALL Ministère de l'économie, de l'industrie, et de
l’emploi Mr Franck ARNAUD Ministère de l'économie, de l'industrie, et de
l’emploi IRELAND Ms Loretta O’SULLIVAN Department of Finance Mr Shane ENRIGHT Department of Finance
2

ITALIA Mr Rocco APRILE Ministry of Economy and Finance - Department of
General Accounts Ms Manuela NENNA Ministry of Economy and Finance CYPRUS Ms Maria MATSI Ministry of Finance Mr Zenon KONTOLEMIS Ministry of Finance Mr Costas STAVRAKIS Ministry of Labour and Social Insurance LATVIA Mr Ilmārs ŠŅUCINS Ministry of Finance Ms Sandra STABINA Ministry of Welfare LITHUANIA Ms Vidija PASTUKIENE Ministry of Social Security and Labour Ms Rasa SLIOGERIENE Ministry of Finance LUXEMBOURG Mr Tom DOMINIQUE Inspection Générale de la Securité Sociale Mr Raymond WAGENER Inspection Générale de la Securité Sociale Ms Laurence WEBER Inspection Générale de la Sécurité Sociale Mr Jean LANGERS STATEC HUNGARY Ms Edit LENDVAI Ministry of Finance Mr Marton SZILI Ministry of Finance MALTA Mr Godwin MIFSUD Ministry of Finance, the Economy and Investment Ms Moira CATANIA Ministry of Finance, the Economy and Investment NEDERLAND Mr Harry TER RELE Centraal Planbureau Mr Bart BOON Ministry of Finance ÖSTERREICH Ms Caroline HABERFELLNER Bundesministerium für Finanzen Mr Peter PART Bundesministerium für Finanzen POLAND Ms Joanna STACHURA Ministry of Economy, Labour and Social Policy Ms Agnieszka CHŁOŃ-DOMIŃCZAK Ministry of Economy, Labour and Social Policy Mr Paweł STRZELECKI National Bank of Poland PORTUGAL Ms Vanda GERALDES DA CUNHA Ministry of Finance and of Public Administration Mr Hélder REIS Ministry of Finance and of Public Administration ROMANIA Ms Iuliana DASCALU Ministry of Public Finance Ms Mihaela RUNCAN National Commission for Economic Forecasting
3

SLOVENIA Mr Dusan KIDRIC Institute of Macroeconomic Analysis and
Development Mr Tomaz KRAIGHER Institute of Macroeconomic Analysis and
Development Mr Slaven MICKOVIC Ministry of Finance SLOVAKIA Mr Viktor NOVYSEDLAK Ministry of Finance Mr Marek PORUBSKY Ministry of Finance SUOMI FINLAND Mr Jorma TUUKKANEN Ministry of Finance Mr Jussi HUOPANIEMI Ministry of Finance Ms Marja TUOVINEN Ministry of Finance SVERIGE Ms Anna KLEEN Ministry of Finance Mr Olle SUNDBERG Ministry of Finance Mr Joakim HUSSENIUS Ministry of Finance UNITED KINGDOM Ms Kerstin GREB HM Treasury Ms Geraldine KOH HM Treasury NORWAY (observer) Mr Yngvar DYVI Ministry of Finance Mr Per-Mathis KONGSRUD Ministry of Finance OECD Mr Joaquim OLIVEIRA Economics Department Mr Mark PEARSON Economics Department EUROPEAN CENTRAL BANK Ms Nadine LEINER-KILLINGER EUROSTAT Ms Bettina KNAUTH WORLD BANK Mr Hermann von GERSDORFF INTERNATIONAL MONETARY FUND Mr Emmanuel VAN DER MENSBRUGGHE Bruxelles Mr Luc LERUTH Paris EPC SECRETARIAT Ms Odile RENAUD-BASSO Mr Jens MATTHIESSEN EUROPEAN COMMISSION Mr Giuseppe CARONE Mr Per ECKEFELDT Mr Lucio PENCH
4

Contents Abstract......................................................................................................................................................23 Summary and main findings ....................................................................................................................24
1. Introduction 24 2. Overview of pension systems 27
2.1. Coverage of the pension projections 27 2.2. Summary of pension systems' main characteristics 28 2.3. Indexation rules and sustainability factors 31 2.4. Retirement and exit age from the labour market 33
3. Pension expenditure projections 34 3.1. Public pensions 34 3.2. Private pensions 37 3.3. Drivers of pension expenditure 37 3.4. Sensitivity of the projection results 39 3.5. Comparison with the 2006 round of projections 41
Belgium......................................................................................................................................................44 1. Overview of the pension system 44
1.1. Description of the Belgian pension system 44 1.2. Reforms of the pension system included in the projections 48 1.3. Unchanged legislation and/or unchanged policy 49
2. Pension expenditure projections 49 2.1. Overview of projection results 49 2.2. Description of the main driving forces behind the projection results 51 2.3. Sensitivity analysis 55 2.4. Description of the changes in comparison with the 2001 and 2006 projections 57
Bulgaria......................................................................................................................................................59 1. Overview of the pension system 59
1.1. The public system of mandatory pension schemes of pay-as-you-go type (I pillar) 59 1.2. Supplementary mandatory pension insurance (II pillar) 63 1.3. Supplementary voluntary pension insurance (III pillar) 64
2. Pension expenditure projections 65 2.1. Extent of the coverage of the pension schemes in the projections 66 2.2. Overview of projection results 68 2.3. Description of main driving forces behind the projection results and their implications for main
items from a pension questionnaire 69 2.4. Sensitivity analysis 73
Czech Republic .........................................................................................................................................75 1. Overview of the pension system 75
1.1. Mandatory PAYG system 75 1.2. Pension calculations 76 1.3. Main recent reform measures 77 1.4. Voluntary fully funded private system 78
2. Pension expenditure projections 79 2.1. Extent of the coverage of the pension schemes 79 2.2. Overview of projection results 79 2.3. Main driving forces behind the projection results 80 2.4. Sensitivity analysis 82 2.5. Comparison with the 2006 projections 83
Denmark.....................................................................................................................................................85 1. Overview of the pension system 85
1.1. First Pillar Pensions 85 1.2. Second Pillar Pensions 86
5

1.3. Third Pillar Pensions 87 1.4. Taxation of pensions 87 1.5. Recent reforms of the pension system 88
2. Pension expenditure projections 90 2.1. Extent of the coverage of the pension schemes in the projections 90 2.2. Overview of projection results 90 2.3. Description of the main driving forces behind the projection results 91 2.4. Sensitivity analysis 94 2.5. Description of the changes in comparison with the 2001 and 2006 projections 95
Germany.....................................................................................................................................................96 1. Overview of the pension system 96
1.1. Introduction 96 1.2. Calculation of pension and indexation of pensions 96 1.3. Contribution rate 97 1.4. Latest reforms 98
2. Pension expenditure projections 98 2.1. Extent of the coverage of pension schemes in the projection 98 2.2. Overview of the projection results 98 2.3. Description of main driving forces 99 2.4. Sensitivity analysis 102 2.5. Description of the changes in comparison with the 2001 and 2006 projections 102
Estonia .....................................................................................................................................................104 1. Overview of the pension system 104 2. Pension expenditure projections 106
2.1. Extent of the coverage of the pension schemes in the projections 106 2.2. Overview of projection results 107 2.3. Description of main driving forces behind the projection results and their implications for main
items from a pension questionnaire 107 2.4. Sensitivity analysis 109 2.5. Description of the changes in comparison with the 2001 and 2006 projections 110
Ireland ......................................................................................................................................................112 1. Overview of the pension system 112
1.1. Introduction 112 1.2. Overview of the Irish Pension System 112 1.3. Social Security Pensions 113 1.4. Public Service Pensions 113 1.5. National Pensions Reserve Fund (NPRF) 114
2. Pension expenditure projections 114 2.1. Coverage of the Projections Exercise 114 2.2. Overview of the Projection Results 115 2.3. Driving Forces behind the Projection Results 116 2.4. Sensitivity Analysis 118 2.5. Description of changes in comparison with the 2001 and 2006 Pension Projection Exercises
119 Greece......................................................................................................................................................121
1. Overview of the pension system 121 1.1. Introduction 121 1.2. Overview of the pension system 121
2. Pension expenditure projections 127 2.1. Extent of the coverage of the pension schemes in the projections 127 2.2. Overview of projection results 127 2.3. Description of main driving forces behind the projection results and their implications for main
items from a pension questionnaire 130 2.4. Sensitivity analysis 133 2.5. Description of the changes in comparison with the 2001 projection 134
6

Spain ........................................................................................................................................................135
1. Overview of the pension system 135 1.1. Description 135 1.2. Main pension formulas (old-age, disability and survivors’ pensions). Indexation. 136 1.3. Recent reforms of the pension system included in the projections 138 1.4. Description of the effective constant policy in the projection 140
2. Pension expenditure projections 140 2.1. Coverage of the pension schemes in the projections 140 2.2. Contributory Public Pensions (including minimum pensions) 140 2.3. Non-contributory Public Pensions 141 2.4. Private pensions 141 2.5. Overview of projection results 141 2.6. Description of main driving forces behind the projection results 143 2.7. Sensitivity analysis 147 2.8. Description of the changes in comparison with the 2001 and 2006 projections 148
France ......................................................................................................................................................153 1. Overview of the pension system 153
1.1. Key characteristics of the French pensions system 153 2. Pension expenditure projections 157
2.1. Extent of the coverage of the pensions schemes in the projections 158 2.2. Overview of projection results 158 2.3. Further description of main driving forces between 2007-2060 161 2.4. Sensitivity analysis 162 2.5. Changes in comparison with past projections 163 2.6. Projection of the assets of the pension funds 164
Italy … ......................................................................................................................................................166 1. Overview of the pension system 166
1.1. The legal and institutional framework of the Italian pension system - an overview 166 1.2. The public pension system 167 1.3. Funded component of the pension system 171
2. Pension expenditure projections 175 2.1. Extent of the coverage of pension schemes 175 2.2. Overview of projection results 176 2.3. Description of the main driving forces behind pension projections 178 2.4. Sensitivity analysis 183 2.5. Comparison with the previous AWG baseline projections 186
Cyprus......................................................................................................................................................200 1. Overview of the pension system 200
1.1. Introduction 200 2. Pension expenditure projections 205
2.1. Sensitivity analysis 209 Latvia........................................................................................................................................................212
1. Overview of the pension system 212 1.1. Pension system in Latvia 212
2. Pension expenditure projections 217 2.1. Extent of the coverage of the pension schemes in the projections 217 2.2. Overview of projection results 217 2.3. Description of main driving forces behind the projection results and their implications for main
items from a pension questionnaire 218 2.4. Sensitivity analysis 221 2.5. Description of the changes in comparison with the 2001 and 2006 projections 222
7

Lithuania ..................................................................................................................................................224
1. Overview of the pension system 224 1.1. Key Features of the Pension System 224 1.2. Recent Reforms 227 1.3. Description of the currently effective constant policy 228
2. Pension expenditure projections 228 2.1. Coverage of the pension schemes 228 2.2. Overview of projection results 228 2.3. Description of main driving forces behind the projection results 229 2.4. Sensitivity analysis 232 2.5. Description of the changes in comparison with 2006 projections 233
Luxembourg ............................................................................................................................................235 1. Overview of the pension system 235
1.1. The general pension scheme of the private sector 235 1.2. Special pension schemes for the public sector 236 1.3. Supplementary pension schemes 237 1.4. Individual pension plans 237 1.5. Social assistance 237 1.6. The pension fund of the general pension scheme of the private sector 238 1.7. Indexation of pensions and social assistance 239 1.8. Pension system financing 239
2. Pension expenditure projections 240 2.1. Extent of the coverage of the pension schemes in the projections 240 2.2. Overview of projection results 240 2.3. Description of main driving forces behind the projection results and their implications for main
items from a pension questionnaire 240 2.4. Sensitivity analysis 243 2.5. Description of the changes in comparison with the 2001 and 2006 projections 245
Hungary....................................................................................................................................................247 1. Overview of the pension system 247
1.1. Structure of the pension system 247 1.2. Eligibility requirements 248 1.3. Method of benefit calculation 248
2. Pension expenditure projections 249 2.1. Definition of certain lines of the reporting sheet 249 2.2. Overview of the projection results – Baseline scenario 250 2.3. Description of main driving forces behind the projection results 251 2.4. Sensitivity analysis 254 2.5. Description of the changes in comparison with the 2006 projections 255
Malta.........................................................................................................................................................265 1. Overview of the pension system 265
1.1. Introduction 265 1.2. Overview of the Pension System in Malta 265
2. Pension expenditure projections 272 2.1. Overview of projection results 272 2.2. Expenditure decomposition 273 2.3. Sensitivity Analysis 274 2.4. Changes in comparison to 2006 projections 275
Netherlands .............................................................................................................................................279 1. Overview of the pension system 279
1.1. Structure of the Dutch pension system 279 1.2. The role of the government 283
2. Pension projections 285 2.1. The projections 285
8
Austria......................................................................................................................................................292 1. Overview of the pension system 292
1.1. Overview of the Austrian pension system 292 2. Pension expenditure projections 295
2.1. Sensitivity tests 306 2.2. Comparison with previous projections rounds 308
Poland ......................................................................................................................................................310 1. Overview of the pension system 310
1.1. Description 310 1.2. Recent reforms of the pension system 312
2. Pension expenditure projections 314 2.1. Extent of the coverage of the pension schemes 314 2.2. Overview of projection results 314 2.3. Main driving forces behind the projection results 315 2.4. Sensitivity analysis 318 2.5. Comparison with the 2006 projections 319
Portugal....................................................................................................................................................321 1. Overview of the pension system 321
1.1. Public pension systems 321 1.2. Occupational private systems 323
2. Pension expenditure projections 323 2.1. Coverage 323 2.2. Projection results 324 2.3. Description of main driving forces behind the projection results 325 2.4. Sensitivity analysis 328 2.5. Description of the changes in comparison with previous projections 329
Romania...................................................................................................................................................331 1. Overview of the pension system 331
1.1. Description of the pension system 331 1.2. Other insurance forms that are not included in Social Insurance System 341
2. Pension expenditure projections 345 2.1. Extent of the coverage of pension schemes in the projection 345 2.2. Overview of the projection results 345 2.3. Description of main driving forces 348
Slovenia ...................................................................................................................................................351 1. Overview of the pension system 351
1.1. Description of the pension and invalidity insurance 351 1.2. Recent reforms of the pension system included in the projections 356
2. Pension expenditure projections 356 2.1. Extent of the coverage of the pension schemes in the projections 356 2.2. Overview of projection results 357 2.3. Description of main driving forces behind the projection results and their implications for main
items from a pension questionnaire 358 2.4. Sensitivity analysis 361 2.5. Description of the changes in comparison with the 2001 and 2006 projections 363
Slovakia....................................................................................................................................................364 1. Overview of the pension system 364
1.1. Pension contributions 364 1.2. Statutory retirement age and early retirement 365 1.3. Pension benefit calculation 366 1.4. Pension indexation 367 1.5. Summary of main legislative changes compared to 2006 projection round 367
2. Pension expenditure projections 368 2.1. The extent of the coverage of the pension schemes in the projections 368
9

2.2. Overview of projection results 368 2.3. Description of the main driving forces behind the projection results and their implications for
the main items from the pension questionnaire 370 2.4. Sensitivity analysis 372 2.5. Description of the changes in comparison with the 2001 and 2006 projections 373
Finland .....................................................................................................................................................375 1. Overview of the pension system 375
1.1. The Finnish pension system: an overview 375 2. Pension expenditure projections 377
2.1. Coverage of the pension schemes in the projections 377 2.2. Overview of projection results 378 2.3. Main driving forces behind the projection results 380 2.4. Sensitivity tests 383
Sweden.....................................................................................................................................................386 1. Overview of the pension system 386
1.1. The Swedish public pension system 386 1.2. Occupational pensions 389 1.3. Private pensions 389
2. Pension expenditure projections 390 2.1. Extent of the coverage of the pension schemes in the projections 390 2.2. Overview of the projection results 390 2.3. Description of main driving forces 391 2.4. Sensitivity analysis 395 2.5. Description of the changes in comparison with the 2001 and 2006 projections 396
United Kingdom ......................................................................................................................................399 1. Overview of the pension system 399
1.1. The UK Pension System 399 2. Pension expenditure projections 401
Norway .....................................................................................................................................................405 1. Overview of the pension system 405
1.1. Elements in the Norwegian old age pension system 405 2. Pension expenditure projections 406
2.1. Extent of the coverage of the pension schemes in the projections 406 2.2. Overview of projection results 406 2.3. Description of main driving forces behind the projection results and their implications for main
items from a pension questionnaire 407 2.4. Sensitivity analysis 409 2.5. Description of the changes in comparison with the 2001 and 2006 projections 409
10

List of tables
Summary and main findings ....................................................................................................................24 Table 1: Pension schemes in EU Member States 29 Table 2: Legal indexation rules in EU Member States 32 Table 3: Statutory retirement age and average exit age from labour market 34 Table 4: Projected trough and peak years for pension expenditure (% of GDP) 36 Table 5: Decomposition of the public pension spending to GDP ratio over 2007 – 2060 (% of GDP) 39 Table 6: Decomposition of the public pension/GDP ratio over 2007–50 in the 2006 and 2009 projections (in
percentage points) 43 Belgium......................................................................................................................................................44
Table 1: Relative weight of the various pension “pillars”, including some characteristics of the first pillar, in 2007 (unless otherwise stated) 47
Table 2: Projected gross pension spending, tax on pension and contributions (% of GDP) 50 Table 3 : Projected gross public pension spending: by scheme (% of GDP) 50 Table 4: Factors behind public pension expenditure between 2007 and 2060 51
Table 5: Replacement rate and coverage by pension scheme (in %) 53 Table 6: Replacement rate by scheme (in %) 53 Table 7 : Number of pensions and contributors in the Social security scheme (in thousands), population
over 65 and total employment (in thousands) and related ratios (%) 54 Table 8 : Assets of pension funds and reserves (% of GDP) 55 Table 9: Total and public pension expenditures under different scenarios (deviation from baseline scenario)
-% of GDP 55 Table 10: Breakdown of the change in public pension expenditure (in % of GDP) between 2007 and 2050
under the 2001, 2006 and 2009 projection exercises 57 Bulgaria......................................................................................................................................................59
Table 1: Indexation rules in more detail 62 Table 2: Requirement for attainment of pension benefits 63 Table 3: Schemes included and not included in 2008 AWG projections 67 Table 4: Projected gross pension spending, tax on pension and contributions (% of GDP) 68 Table 5: Factors behind the public pension expenditures between 2007 and 2060 (in percentage points of
GDP) 69 Table 6: Replacement rate and coverage by pension scheme (in %) 70 Table 7: Number of pensioners and contributors in the Social Insurance scheme (in 1000), population over
65 and total employment (in 1000) and related ratios (%) 71 Table 8: Assets of pension funds and reserves, (% of GDP) 72 Table 9: Public pension expenditures under different scenarios 74 Table 10: Decomposition of the change (in %) in public pension expenditure to GDP between 2007 and
2050 under the 2001, 2006 and 2009 projection exercises 74 Czech Republic .........................................................................................................................................75
Table 1: Projected gross pension spending, tax on pension and contributions (% of GDP) 80 Table 2: Factors behind the public pension expenditures between 2007 and 2060 (in percentage points of
GDP) 81
11

Table 3: Replacement rate and coverage by pension scheme (in %)' 81 Table 4: Number of pensioners and contributors in the Social security scheme (in 1000), population over 65
and total employment (in 1000) and related ratios (%) 81 Table 5: Assets of pension funds and reserves, (% of GDP)' 82 Table 6: Total and public pension expenditures under different scenarios 83 Table 7: Decomposition of the change (in %) in public pension expenditure to GDP between 2007 and 2050
under the 2001, 2006 and 2009 projection exercises 84 Table 8: Illustrative decomposition of the difference between 2006 and 2009 public pension projection
(%GDP) 84 Denmark.....................................................................................................................................................85
Table 1: Change in the retirement age for VERP and old age pension 89 Table 2: Projected gross spending, tax on spending and contributions, percent of GDP 91 Table 3: Factors behind the public pension expenditures between 2007 and 2060 (in percentage points of
GDP) 92 Table 4: Gross replacement rate and coverage by pension scheme (in %) 93 Table 5: Number of pensioners and contributors in the Social security scheme (in 1000), population over 65
and total employment (in 1000) and related ratios (%) 93 Table 6: Assets of pension funds and reserves (% of GDP) 94 Table 7: Total and public pension expenditures under different scenarios 95 Table 8: Decomposition of the change (in %) in public pension expenditure to GDP between 2007 and 2050
under the 2001, 2006 and 2009 projection exercises 95 Germany.....................................................................................................................................................96
Table 1: Increase of the legal retirement age 98 Table 2: Projected gross pension spending, tax on pension and contributions (% of GDP) 99 Table 3: Projected gross public pension spending: by scheme (as % of GDP) 99 Table 4: Factors behind the public pension expenditures between 2007 and 2060 (in percentage points of
GDP) 101 Table 5: Number of pensioners and contributors in the Social security scheme (in 1000), population over 65
and total employment (in 1000) and related ratios (%) 101 Table 6: Assets of pension funds and reserves, (% of GDP) 102 Table 7: Total and public pension expenditures under different scenarios 102 Table 8: Decomposition of the change (in %) in public pension expenditure to GDP between 2007 and 2050
under the 2001, 2006 and 2009 projection exercises 103 Estonia .....................................................................................................................................................104
Table 1: Projected gross pension spending, tax on pension and contributions (% of GDP) 107 Table 2: Factors behind the public pension expenditures between 2007 and 2060 (in percentage points of
GDP) 108 Table 3: Replacement rate and coverage by pension scheme (in %)' 108 Table 4: Number of pensioners and contributors in the Social security scheme (in 1000), population over 65
and total employment (in 1000) and related ratios (%) 109 Table 5: Assets of pension funds and reserves, (% of GDP) 109 Table 6: Total and public pension expenditures under different scenarios 110 Table 7: Decomposition of the change (in %) in public pension expenditure to GDP between 2007 and 2050
under the 2001, 2006 and 2009 projection exercises 111
12

Ireland ......................................................................................................................................................112 Table 1: Overview of Schemes 115 Table 2: Projected gross public pension spending (% of GDP) 116 Table 3: Factors underlying Social Security pension spending (percentage points of GDP)' 117 Table 4: Number of pensioners and contributors in the Social security scheme (000’s), population over 65,
employment (000’s) and related ratios (%) 117 Table 5: Assets of pension funds and reserves (% of GDP) 118 Table 6: Public pension expenditure under different scenarios' 119 Table 7: Decomposition of the change in public pension expenditure (% of GDP) between 2007 and 2050
under the 2001, 2006 and 2009 projection exercises 119 Greece......................................................................................................................................................121
Table 1: Historical and assumed indexations for IKA-ETAM, OGA and OAEE 124 Table 2: Historical and assumed indexations for the Public Sector Employees 125 Table 3: Projected gross pension spending, tax on pension and contributions (% of GDP) 128 Table 4: Projected gross public pension spending: by scheme, as a % of GDP 129 Table 5: Assumptions and differences in the driving forces for the various projected groups 130 Table 6: Statistics of Inflation, Real and Nominal GDP growth 131 Table 7: Factors behind the public pension expenditures between 2007 and 2060 131 (in percentage points of GDP) 131 Table 8: Replacement rate and coverage by pension scheme (in %) 132 Table 9: Number of pensioners and contributors in the Social security scheme (in 1000), population over 65
and total employment (in 1000) and related ratios (%) 133 Table 10: Assets of pension funds and reserves, (% of GDP) 133 Table 11: Total and public pension expenditures under different scenarios 134 (Deviation from baseline scenario) 134 Table 12: Decomposition of the change (in %) in public pension expenditure to GDP between 2007 and
2050 under the 2001 and 2009 projection exercises 134 Spain ........................................................................................................................................................135
Table 1: Projected gross pension spending and tax on pension (% of GDP) 142 Table 2: Projected gross public pension spending by scheme (as % of GDP) 143 Table 3: Factors behind the increase in public pension expenditures between 2007 and 2060 (in percentage
points of GDP) 145 Table 4: Number of pensioners and contributors in the Social security and CPE scheme (in 1000),
population over 65 and total employment (in 1000) and related ratios (%) 146 Table 5: Assets of pension funds and reserves, (% of GDP) 147 Table 6: Total and public pension expenditures under different scenarios 148 Table 7: Decomposition of the change (in %) in public pension expenditure to GDP between base year and
2050 under the 2001, 2006 and 2009 projection exercises 151 Table 8: Decomposition of the difference between 2006 and 2009 public pension projection (%GDP) 152
France ......................................................................................................................................................153 Table 1: Shortfall coefficient applicable to the complementary schemes 156 Table 2: Expenses of the main pension schemes 158 Table 3: Projected gross pension spending, tax on pension and contributions (% of GDP) 159 Table 4: Projected gross public pension spending: by scheme (as % of GDP) 159
13

Table 5: Contributions to public pensions to GDP ratio, 2007-2060 (in percent of GDP) 162 Table 6: Number of pensioners and contributors in the Social security scheme (in 1000), population over 65
and total employment (in 1000) and related ratios (%) 162 Table 7: Total and public expenditures under different scenario (deviation from baseline) 163 Table 8: Decomposition of the change (in %) in public pension expenditure to GDP between 2007 and 2050
under the 2006 and 2009 projection exercises 163 Table 9: Increase in public pension expenditure to GDP between 2007 and peak year, under the 2006 and
2009 projections exercises 164 Table 10: Assets of pension funds and reserves, % of GDP 165 Table 11: Projection of the assets of the pension funds 165
Italy ..........................................................................................................................................................166 Table 1: Public pension system: calculation rules 173 Table 2: Public pension system: eligibility requirements 174 Table 3: Eurostat vs. national definition of public pension expenditure (% of GDP) 175 Table 4: Private component of the Italian pension system: historical data 2000-2007 176 Table 5: Projected gross pension spending, tax on pension and contributions (% of GDP) 177 Table 6: Projected gross public pension spending: by scheme (% of GDP) 178 Table 7: Factors behind public pension expenditure between 2007 and 2060 (% of GDP) 178 Table 8: Replacement rate and coverage by pension scheme (in %) 181 Table 9: Number of pensioners and contributors in the social security scheme (in 1000’s), population over
65, and total employment (in 1000) and related ratios (%) 181 Table 10: Public pension expenditure under different scenarios (deviation from baseline scenario) 184 Table 11: Decomposition of the change (in %) in public pension expenditure to GDP between 2007 and
2050 under the 2001, 2006 and 2009 projection exercises 187 Table 12: Decomposition of the difference between 2006 and 2009 public pension projection (% of GDP)
189 Table 13: 2009-AWG baseline pension projection - Ratio between the average amount of direct,
contributive pensions(1) of the age class and GDP per capita 199 Cyprus......................................................................................................................................................200
Table 1: Projected gross pension spending (% of GDP) 206 Table 2: Factors behind the public pension expenditures between 2007 and 2060 (in percentage points of
GDP) 207 Table 3: Number of pensions and contributors in the Social security scheme (in 1000), population over 65
and total employment (in 1000) and related ratios (%) 208 Table 4: Assets of pension funds and reserves, (% of GDP) 208 Table 5: Total and public pension expenditures under different scenarios 209 Table 6: Decomposition of the change (in %) in public pension expenditure to GDP between 2007 and 2050
under the 2001, 2006 and 2009 projection exercises 211 Latvia........................................................................................................................................................212
Table 1: Projected gross pension spending, tax on pension and contributions (% of GDP) 218 Table 2: Factors behind the public pension expenditures between 2007 and 2060 (in percentage points of
GDP) 219 Table 3: Replacement rate and coverage by pension scheme (in %) 220 Table 4: Number of pensioners and contributors in the Social security scheme (in 1000), population over 65
and total employment (in 1000) and related ratios (%) 221 Table 5: Assets of pension funds and reserves, (% of GDP) 221
14
Table 6: Total and public pension expenditures under different scenarios 222 Table 7: Decomposition of the change (in %) in public pension expenditure to GDP between 2007 and 2050
under the 2001, 2006 and 2009 projection exercises 223 Lithuania ..................................................................................................................................................224
Table 1: Projected gross pension spending, tax on pension and contributions (% of GDP) 229 Table 2: Factors behind the public pension expenditures between 2007 and 2060 (in percentage points of
GDP) 230 Table 3: Replacement rate and coverage by pension scheme (in %) 231 Table 4: Number of pensioners and contributors in the Social security scheme (in 1000), population over 65
and total employment (in 1000) and related ratios (%) 231 Table 5: Assets of pension funds and reserves, (% of GDP) 232 Table 6: Total and public pension expenditures under different scenarios 233 Table 7: Decomposition of the change (in %) in public pension expenditure to GDP between 2007 and 2050
under the 2001, 2006 and 2009 projection exercises 234 Luxembourg ............................................................................................................................................235
Table 1: Projected gross pension spending, tax on pension and contributions (% of GDP) 240 Table 2: Projected gross public pension spending: by scheme (as % of GDP) 240 Table 3: Factors behind the public pension expenditures between 2007 and 2060 (in percentage points of
GDP) 241 Table 4: Factors behind the public pension expenditures between 2007 and 2060: 'reduced form' with
components are given in terms of the (inverse of) the support ratio and the benefit ratio (in percentage points of GDP) 241
Table 5: Replacement rate and coverage by pension scheme (in %) 242 Table 6: Number of pensioners and contributors in the Social security scheme (in 1000), population over 65
and total employment (in 1000) and related ratios (%) 242 Table 7: Number of pensioners and contributors in the Social security scheme (in 1000), by residency 242 Table 8: Assets of pension funds and reserves (% of GDP) 243 Table 9: Assets portfolio 243 Table 10: Total and public pension expenditures under different scenarios (% of GDP) 244 Table 11: Results for the different scenarios (deviation from baseline scenario) 244 Table 12: Decomposition of the change (in %) in public pension expenditure to GDP between 2007 and
2050 under the 2001, 2006 and 2009 projection exercises 245 Table 13: Difference between 2001, 2005 and 2008 public pension projection exercise 245 Table 14: Comparison for major aggregates 245
Hungary....................................................................................................................................................247 Table 1: Projected gross pension spending, tax on pension and contributions (% of GDP) 251 Table 2: Factors behind the public pension expenditures between 2007 and 2060 (in percentage points of
GDP) 252 Table 3: Replacement rate and coverage by pension scheme (in %) 252 Table 4: Number of pensioners and contributors in the Social security scheme (in 1000), population over 65
and total employment (in 1000) and related ratios (%) 253 Table 5: Assets of pension funds and reserves, (% of GDP) 253 Table 6: Total and public pension expenditure under different scenarios (deviation from baseline,
percentage points) 254 Table 7: Total and public pension expenditure under different scenarios (% of GDP) 255
15
Table 8: Decomposition of the change (in %) in public pension expenditure to GDP between 2007 and 2050 under the 2001, 2006 and 2009 projection exercises 255
Table 9: Decomposition of the difference between 2006 and 2009 public pension projection (%GDP) 256 Table 10: The results of different projections 256 Table 11: Computed income tax rates at different income levels 260 Table 12: Computed income tax rates at different income levels (2) 260 Table 13: The effect of the pension measures in 2050 as a percentage of GDP 261 Table 14: Decomposition of difference between 2008 and 2005 projections due to policy related changes, in
per cent of GDP (gross expenditures) 261 Table 15: List of benefits covered in the projection exercise 263
Malta.........................................................................................................................................................265 Table 1: pension reform measures 269 Table 2: Projected gross pension spending, social security contributions (as % of GDP) 272 Table 3: Factors behind the public pension expenditure between 2007 and 2060 (in p.p. of GDP) 273 Table 4: Number of pensioners and contributors in the Social Security scheme (in 1000), population over 65
and total employment (in 1000) and related ratios (%) 274 Table 5: Public pension expenditures as a % of GDP under different scenarios 274 Table 6: Decomposition of the change (in %) in public expenditure to GDP between 2007 and 2050 under
the 2006 and 2009 pension projections 275 Table 7: Sensitivity to assumptions – Impact of adopting the 2006 AWG assumptions 276 Table 8: Contributory schemes 277 Table 9: Non-contributory schemes 277 Table 10: Family allowance & Maternity Benefits (Also 'Non-Contributory' Benefits) 278
Netherlands .............................................................................................................................................279 Table 1: Gross pension payments and income tax revenues of pensions (% GDP) 279 Table 2: Survey of Dutch Pension Funds 280 Table 3: Projected gross pension spending, tax on pension and contributions (% of GDP) 287 Table 4: Factors behind the public pension expenditures between 2007 and 2060 (in percentage points of
GDP) 287 Table 5: Number of pensioners and contributors in the Social security scheme (in 1000), population over 65
and total employment (in 1000) and related ratios (%) 288 Table 6: Assets of pension funds and reserves, (% of GDP) 288 Table 7: Decomposition of the change (in %) in public pension expenditure to GDP between 2007 and 2050
under the 2001, 2006 and 2009 projection exercises 289 Table 8: Total and public pension expenditures under different scenarios 290
Austria......................................................................................................................................................292 Table 1: Projected gross pension spending, tax on pension and contributions (% of GDP) 300 Table 2: Projected gross public pension spending: by scheme (as % of GDP) 300 Table 3: Benefit ratio and gross replacement rate for social security pension sector (in %) 303 Table 4: Factors driving public pension expenditures between 2007 and 2060 304 Table 5: Number of pensioners and contributors in the social security scheme (in 1,000), population over 65
and total employment (in 1,000) and related ratios (%) 305 Table 6: Total and public pension expenditures under different scenarios 307
16

Table 7: Decomposition of the change (in %) in public pension expenditure to GDP between 2007 and 2050 under the 2001, 2006 and 2009 projection exercises 309
Poland ......................................................................................................................................................310 Table 1: Projected gross pension spending, tax on pension and contributions (% of GDP) 315 Table 2: Projected gross public pension spending: by scheme (as % of GDP) 315 Table 3: Factors behind the public pension expenditures between 2007 and 2060 (in percentage points of
GDP) 316 Table 4: Number of pensioners and contributors in the Social security scheme (in 1000), population over 65
and total employment (in 1000) and related ratios (%) 317 Table 5: Assets of pension funds and reserves, (% of GDP) 318 Table 6: Total and public pension expenditures under different scenarios 318 Table 7: Decomposition of the change (in p.p.) in public pension expenditure to GDP between 2007 and
2050 under the 2001, 2006 and 2009 projection exercises 320 Portugal....................................................................................................................................................321
Table 1: Projected gross pension spending, tax on pension and contributions (% of GDP) 325 Table 2: Projected gross public pension spending: by scheme (as % of GDP) 325 Table 3: Factors behind the public pension expenditures between 2007 and 2060 (in percentage points of
GDP) 326 Table 4: Replacement rate and coverage by pension scheme (in %) 327 Table 5: Number of pensioners and contributors in the Social security scheme (in 1000), population over 65
and total employment (in 1000) and related ratios (%) 327 Table 6: Assets of pension funds and reserves (% of GDP) 328 Table 7: Total and public pension expenditures under different scenarios 328 Table 8: Decomposition of the change (in p.p.) in public pension expenditure to GDP between 2007 and
2050 under the 2001, 2006 and 2009 projection exercises 329 Table 9: Decomposition of the difference between 2006 and 2009 public pension projection (% of GDP)330
Romania...................................................................................................................................................331 Table 1: Projected gross pension spending, tax on pension and contributions (% of GDP) 346 Table 2: Projected gross public pension spending: by scheme (as % of GDP) 347 Table 3: Factors behind the public pension expenditures between 2007 and 2060 (in percentage points of
GDP) 348 Table 4: Replacement rate and coverage by pension scheme (in %) 349 Table 5: Number of pensioners and contributors in the Social security scheme (in 1000), population over 65
and total employment (in 1000) and related ratios (%) 349 Slovenia ...................................................................................................................................................351
Table 1: Projected gross pension spending, tax on pension and contributions (% of GDP) 358 Table 2: Factors behind the public pension expenditures between 2007 and 2060 (in percentage points of
GDP) 359 Table 3: Replacement rate and coverage by pension scheme (in %) 359 Table 4: Number of pensioners and contributors in the Social security scheme (in 1000), population over 65
and total employment (in 1000) and related ratios (%) 360 Table 5: Assets of pension funds and reserves, (% of GDP) 361 Table 6: Assets of pension funds and reserves, (GDP IN MILLIONS €) 361 Table 7: Total and public pension expenditures under different scenarios (% of GDP) 362 Table 8: Total and public pension expenditures under different scenarios (in millions €) 362
17

Table 9: Decomposition of the change (in %) in public pension expenditure to GDP between 2007 and 2050 under the 2001, 2006 and 2009 projection exercises 363
Slovakia....................................................................................................................................................364 Table 1: Three pillars of the Slovak pension system 364 Table 2: Pension contributions (% of gross wage) 365 Table 3: Projected gross pension spending, tax on pension and contributions (% of GDP) 369 Table 4: Factors behind the public pension expenditures between 2007 and 2060 (in percentage points of
GDP) 371 Table 5: Replacement rate and coverage by pension scheme (in %) 371 Table 6: Number of pensioners and contributors in the Social security scheme (in 1000), population over 65
and total employment (in 1000) and related ratios (%) 372 Table 7: Assets of pension funds and reserves, (% of GDP) 372 Table 8: Total and public pension expenditures under different scenarios 373 Table 9: Decomposition of the change (in %) in public pension expenditure to GDP between 2007 and 2050
under the 2001, 2006 and 2009 projection exercises 373 Finland .....................................................................................................................................................375
Table 1: Projected gross pension spending, tax on pension and contributions (% of GDP) 379 Table 2: Projected gross public pension spending: by scheme (as % of GDP) 380 Table 3: Factors behind the public pension expenditures between 2007 and 2060 (in percentage points of
GDP) 381 Table 4: Replacement rate and coverage by pension scheme (in %) 381 Table 5: Number of pensioners and contributors in the Social security scheme (in 1000), population over 65
and total employment (in 1000) and related ratios (%) 382 Table 6: Pension expenditure and contributions in the earnings-related pension schemes, % of wages382 Table 7: Assets of pension funds and reserves, (% of GDP) 383 Table 8: Pension contributions in earnings-related pension schemes, % of wages 384 Table 9: Total and public pension expenditures under different scenarios 384 Table 10: Decomposition of the change (in %) in public pension expenditure to GDP between 2007 and
2050 under the 2001, 2006 and 2009 projection exercises 384 Table 11: Decomposition of the difference between 2006 and 2009 public pension projection (%GDP) 385
Sweden.....................................................................................................................................................386 Table 1: Projected gross pension spending, tax on pension and contributions (% of GDP) 391 Table 2: Projected gross public pension spending: by scheme (as % of GDP) 391 Table 3: Factors behind the public pension expenditures between 2007 and 2060 (in percentage points of
GDP) 392 Table 4: Replacement rate and coverage by pension scheme (in %) 394 Table 5: Number of pensioners and contributors in the Social security scheme (in 1000), population over 65
and total employment (in 1000) and related ratios (%) 394 Table 6: Assets of pension funds and reserves, (% of GDP) 395 Table 7: Total and public pension expenditures under different scenarios 396 Table 8: Decomposition of the change (in %) in public pension expenditure to GDP between 2007 and 2050
under the 2001, 2006 and 2009 projection exercises 397 Table 9: Decomposition of the difference between 2006 and 2009 public pension projection (%GDP) 397 Table 10: Decomposition of the difference between 2006 and 2008 public pension projections (%GDP),
(Current prices and SEK) 398
18
United Kingdom ......................................................................................................................................399 Table 1: Projected gross pension spending, tax on pension and contributions (% of GDP) 401 Table 2: Projected gross public pension spending: by scheme (as % of GDP) 402 Table 3: Factors behind the public pension expenditures between 2007 and 2060 (in percentage points of
GDP) 402 Table 4: Number of pensioners and contributors in the Social security scheme (in 1000), population over 65
and total employment (in 1000) and related ratios (%) 402 Table 5: Total and public pension expenditures under different scenarios 403 Table 6: Comparison of 2006 and 2009 baseline pension projections 403 Table 7: Old-age dependency ratio in the 2006 and 2009 projection exercises 404
Norway .....................................................................................................................................................405 Table 1: General government transfers to households, 2007 406 Table 2: Projected gross pension spending, tax on pension and contributions (% of mainland GDP) 407 Table 3: Factors behind the public pension expenditures between 2007 and 2060 (in percentage points of
mainland GDP) 407 Table 4: Replacement rate and coverage by pension scheme (in %) 408 Table 5: Number of pensioners and contributors in the Social security scheme (in 1000), population over 65
and total employment (in 1000) and related ratios (%) 408 Table 6: Assets of pension funds and reserves, (% of GDP) 409 Table 7: Total and public pension expenditures under different scenarios 409 Table 8: Decomposition of the change (in %) in public pension expenditure to GDP between 2007 and 2050
under the 2001, 2006 and 2009 projection exercises 410
19
List of graphs
Summary and main findings ....................................................................................................................24 Graph 1: Overview of the 2009 projection of age-related expenditure 25 Graph 2: Gross old-age and other public pension expenditure in 2007 and 2060 (% of GDP) 35 Graph 3: Decomposition of the public pension spending to GDP ratio over sub periods for EU27 38 (in percentage points) 38 Graph 4: Difference between the alternative and baseline scenario (in percentage points), 2007-60 40
Belgium......................................................................................................................................................44 Bulgaria......................................................................................................................................................59
Graph 1: Factors behind public pension expenditures in 2007-2060 (in p.p. of GDP) 69 Czech Republic .........................................................................................................................................75
Graph 1: Retirement age by the year of birth 78 Denmark.....................................................................................................................................................85
Graph 1: Mean remaining life expectancy for a 60-year old 89 Graph 2: Age thresholds for VERP and public old-age pension 89
Germany.....................................................................................................................................................96 Estonia .....................................................................................................................................................104 Ireland ......................................................................................................................................................112 Greece......................................................................................................................................................121
Graph 1: Pensioners, Contributors and Support ratio 128 Graph 2: Pension expenditure and Deficit as % of GDP and Benefit ratio 129
Spain ........................................................................................................................................................135 Graph 1: Evolution of thresholds 1996-2007 138 Graph 2: Total public pension expenditure by type of pension 143 Graph 3: Coverage ratio by group of ages 144 Graph 4: Old-age dependency ratio 150 Graph 5: Macroeconomic assumptions (2005/2008 projections) 151
France ......................................................................................................................................................153 Graph 1: Movements in the pensions to GDP ratio 160 Graph 2: Demographic and financial projections of the pension schemes 161
Italy ..........................................................................................................................................................166 Graph 1: Pension expenditure as a percentage of GDP and its decomposition AWG 2009 baseline
projection 179 Graph 2: Analysis of the ratio between pension and people of 65 and over 182 Graph 3: Ratio of pensions to population of 65 and over and its decomposition 183 Graph 4: pension expenditure as a percentage of GDP and its decomposition – A comparison between two
hypotheses on life expectancy 190 Graph 5: Pension expenditure as a percentage of GDP and its decomposition – A comparison between two
hypotheses on migration flows 191
20

Graph 6: Pension expenditure as a percentage of GDP and its decomposition – A comparison between two hypotheses on productivity 192
Graph 7: Pension expenditure as a percentage of GDP and its decomposition – A comparison between two hypotheses on participation rate 193
Graph 8: Pension expenditure as a percentage of GDP and its decomposition – A comparison between two hypotheses on unemployment rate 194
Graph 9: Comparison between 2001 and 2006 AWG baseline scenarios 195 Graph 10: Pension expenditure as a percentage of GDP – Decomposition of the differences between 2006
and 2009 AWG baseline projections 196 Graph 11: gross and net replacement rates(1) 199
Cyprus......................................................................................................................................................200 Graph 1: Projected Pension Expenditure (as % GDP): General Social Insurance Scheme vs Government
Employees Pension Scheme 206 Graph 2: Factors behind the change in pension expenditure between 2007 and 2060 207 Graph 3: Evolution of GSIS Reserve Ratio 209 Graph 4: Change in expenditure (as % GDP) in 2060: Deviation from baseline scenario 210 Graph 5: Pension expenditure (as % GDP): AWG 2006 vs 2009 Exercise 210 Graph 6: Old-age Dependency Rate: AWG 2006 vs 2009 Exercise 211
Latvia........................................................................................................................................................212 Graph 1: Population developments 219
Lithuania ..................................................................................................................................................224 Luxembourg ............................................................................................................................................235
Graph 1: Evolution of major aggregates over the projection period for the 2005 and 2008 projection exercise 246 Hungary....................................................................................................................................................247
Graph 1: Projected pension spending (% of GDP) 250 Graph 2: Employment development in Hungary 1980-2006 258
Malta.........................................................................................................................................................265 Netherlands .............................................................................................................................................279 Austria......................................................................................................................................................292
Graph 1: Austrian population projections – by age cohorts 296 Graph 2: Labour force and employment developments until 2060 298 Graph 3: Driving factors of future GDP growth 299 Graph 4: Social security pensions expenditures: private and civil service sector, gross, in % of GDP 301 Graph 5: Total pension expenditures, gross vs. net, in % of GDP 302 Graph 6: Number of pensions, private and civil service sector, in 1,000 303 Graph 7: Total contributions and total number of contributors 305 Graph 8: Deficit, contributions minus expenditures, in % of GDP 306 Graph 9: Total gross pension expenditures: sensitivity scenarios 308 Graph 10: Comparison of old and new total pension expenditures, in % of GDP 309
Poland ......................................................................................................................................................310 Portugal....................................................................................................................................................321
21

Romania...................................................................................................................................................331 Slovenia ...................................................................................................................................................351
Graph 1: Pension system in Slovenia 353 Graph 2: Periods, which are relevant for pension calculation 354 Graph 3: Periods below (pre–early retirement) and above (postponed retirement) full pensionable age355
Slovakia....................................................................................................................................................364 Graph 1: Statutory retirement age in Slovakia 366 Graph 2: Pension expenditure as % of GDP – first and second pillar 369 Graph 3 : Transformation costs and benefits in particular year 370 Graph 4: Cumulative impact of introduction fully funded pension pillar 370 Graph 5: Life expectancy at birth 374 Graph 6: Employment rate 374
Finland .....................................................................................................................................................375 Sweden.....................................................................................................................................................386 United Kingdom ......................................................................................................................................399 Norway .....................................................................................................................................................405
22

Abstract This report presents the country fiches for each Member State on the pension projection -being the largest public expenditure item covered by the projection exercise released in the 2009 Ageing Report - prepared by the AWG members and by the Directorate-General for Economic and Financial Affairs on the basis of a harmonised structure. The 2009 Ageing Report was the third update since 2001 of the long-term economic and budgetary projections aimed at assessing the impact of ageing population. This projection exercise builds on, updates and further improves the previous exercises so as to enhance comparability across countries, consistency across expenditure items and the economic basis for the underlying assumptions. The country fiches follow the same structure and the same set of figures is provided by all countries. The first part of the country fiches provides a description of the pension system in the country. The second part provides and discusses expected development on the basis of the main projection outcomes. The pension projections were carried out on the basis of legislation and policies in the field of pension as of July 2008. In addition, this section addresses main drivers behind the pension projection and discusses the impact these factors have on expected development of pension expenditure. Finally, the technical characteristics of the pension models used by Member States were collected in an Annex to this report. Key words: ageing population, pension reforms, long-term projections, ageing report, EU Member States. JEL Classification: J10, J11, J18, J21, J26, I0, O4, H55
23

Summary and main findings
1. Introduction
In 2001, the Stockholm European Council emphasised the need for the Council to “regularly review the long term sustainability of public finances, including the expected strains caused by the demographic changes ahead”. In 2006, the ECOFIN Council gave a mandate to the Economic Policy Committee (EPC) to update and further deepen its common exercise of age-related expenditure projections by autumn 2009, on the basis of a new population projection by Eurostat, which was released in April 2008. In light of this mandate, the EPC developed a work programme with broad arrangements to organise the budgetary projection and reach agreement on its assumptions and methodologies. The projections of all expenditure items are made on the basis of common macroeconomic assumptions endorsed by the EPC and of a 'no policy change' assumption, i.e. reflecting only already enacted legislation (see Graph 1). The work was carried out by the EPC Working Group on Ageing Populations (AWG), which gathered experts from the 27 Member States and Norway and the European Commission represented by the Directorate-General for Economic and Financial Affairs (DG ECFIN). DG ECFIN has provided analysis and calculations. The European Central Bank, the OECD and IMF have also contributed. Eurostat has played a central role by preparing demographic projections (EUROPOP2008). The 2009 Ageing Report was released on 29 April 2009.1 It was the third update since 2001 of the long-term economic and budgetary projections aimed at assessing the impact of ageing population. This projection exercise builds on, updates and further improves the previous exercises so as to enhance comparability across countries, consistency across expenditure items and the economic basis for the underlying assumptions. The work has been guided by the principles of simplicity, comparability, consistency, prudence and transparency. The projections feed into a variety of policy debates at EU level. In particular, they are used in the annual assessment of the sustainability of public finances carried out as part of the Stability and Growth Pact; in the context of the open method of co-ordination on pensions; and in the analysis on the impact of ageing populations on the labour market and potential growth. They are also of great relevance for the renewed Lisbon strategy.
1 See European Commission (DG ECFIN) and the Economic Policy Committee (AWG) (2009), "2009 Ageing Report: Economic and budgetary projections for the EU-27 Member States (2008-2060)", European Economy, No.2.
24
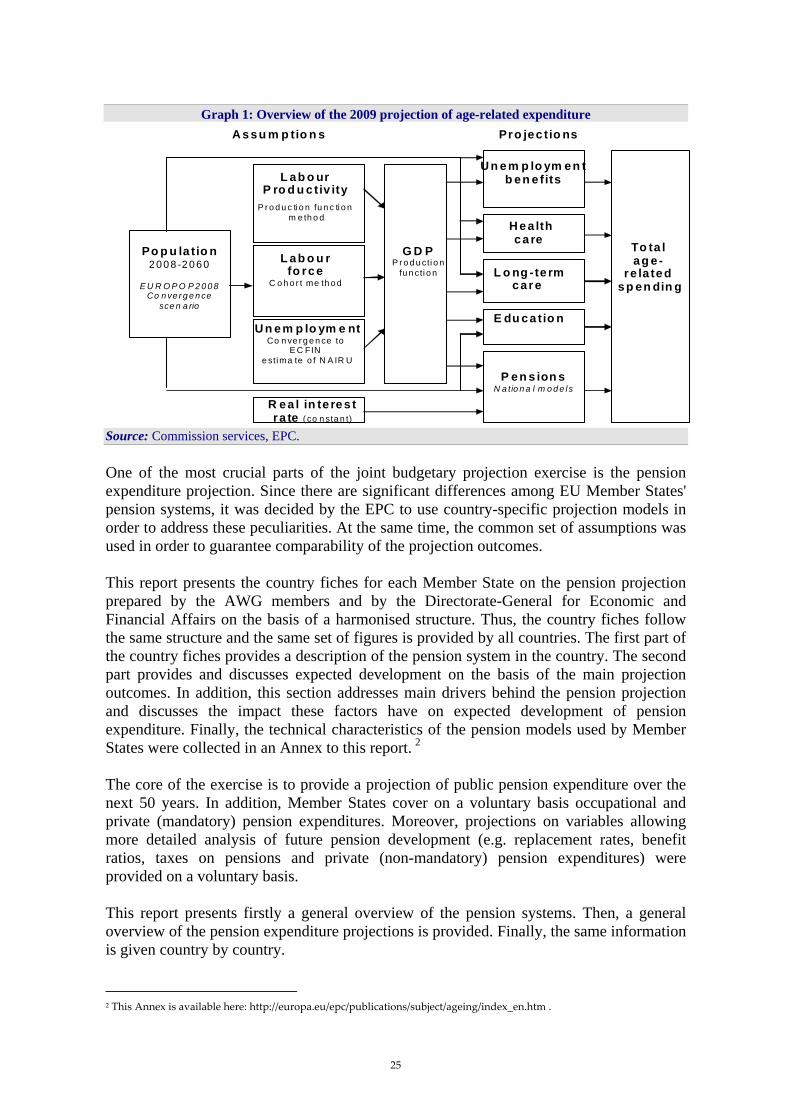
Graph 1: Overview of the 2009 projection of age-related expenditure
Source: Commission services, EPC. One of the most crucial parts of the joint budgetary projection exercise is the pension expenditure projection. Since there are significant differences among EU Member States' pension systems, it was decided by the EPC to use country-specific projection models in order to address these peculiarities. At the same time, the common set of assumptions was used in order to guarantee comparability of the projection outcomes. This report presents the country fiches for each Member State on the pension projection prepared by the AWG members and by the Directorate-General for Economic and Financial Affairs on the basis of a harmonised structure. Thus, the country fiches follow the same structure and the same set of figures is provided by all countries. The first part of the country fiches provides a description of the pension system in the country. The second part provides and discusses expected development on the basis of the main projection outcomes. In addition, this section addresses main drivers behind the pension projection and discusses the impact these factors have on expected development of pension expenditure. Finally, the technical characteristics of the pension models used by Member States were collected in an Annex to this report. 2 The core of the exercise is to provide a projection of public pension expenditure over the next 50 years. In addition, Member States cover on a voluntary basis occupational and private (mandatory) pension expenditures. Moreover, projections on variables allowing more detailed analysis of future pension development (e.g. replacement rates, benefit ratios, taxes on pensions and private (non-mandatory) pension expenditures) were provided on a voluntary basis. This report presents firstly a general overview of the pension systems. Then, a general overview of the pension expenditure projections is provided. Finally, the same information is given country by country.
A ssu m p tio n s Pro jec tio ns
Po p u la t io n 2 0 0 8 -2 0 6 0
E U R O P O P 2 0 0 8
Co n ve r g e n ce sce n a rio
2 This Annex is available here: http://europa.eu/epc/publications/subject/ageing/index_en.htm .
L ab o ur
P ro d u c tiv ity
P r o d u c tio n fu n c ti o n m e th o d
L ab o u rfo rce
C o h o r t me th o d
U n em p lo ym e ntCo n ve r g e n ce to
E C FIN e stima te o f N A IR U
R ea l in te res t ra te ( co n sta n t)
G D PP r o d u cti o n
fu n cti o n
U n em p lo ym en t b en e fits
H ea lth ca re
L o ng -te rm
care
E du ca tio n
To ta lag e -
re la ted sp en din g
P en s ion s N a tio n a l m o d e l s
25

The pension projections were carried out on the basis of legislation and policies in the field of pension as of July 2008. In some countries reforms to the pension system have been introduced after that date (see the Box 'Recent pension reforms enacted after July 2008' for details).
BOX: Recent pension reforms enacted after July 2008
The projections in this report were carried out on the basis of legislation and policies in place by July 2008. In some countries, reforms have been implemented after that date and are thus not incorporated in the projections. A brief description of recent reforms in Member States is provided here.
Bulgaria*
Since October 1, 2008 all old-age pensions, assigned before December 31, 2007, were recalculated, using a different base which is now the 2007 average insurance income (EUR 203.6). The recalculation was made to unify pension-determining parameters (individual coefficient and length of service), and to overcome their different size. As of 1 January 2009 the insurance contribution rate to the State Social Insurance Pensions Fund was reduced from 22% to 18%. The contribution rate of the employers was set at 10% and that of the employees - at 8%. In addition to the employers and employees, the state entered as a third party providing 12% of the overall amount of the annual contributions to the State Social Insurance Pensions Fund. Following the change in the insurance contribution rate the total social security burden was reduced by 2.4pps for employers, while for employees it remained at the same level. Not taking into account the health insurance contribution, the social security burden dropped by 3.6pps for employers and by 0.8pps for employees. As of January 1, 2009 the minimum pensions were increased by 10.0%. The old-age pensions were raised as of April 1, 2009 by increasing the weight of each insurance year in the pension formula from 1 to 1.1. In addition starting from 1 April, the maximum pension amount (excluding bonuses thereto) was increased to EUR 357.9, from EUR 250.5.
As of July 1, 2009 pensions were updated by 9.0% following the so called Swiss rule.
* Changes have been incorporated in the Law on the Budget of the State Social Security for 2009 (SG N 109/23.12.2008) and the amendments in the Code of social insurance (SG.N 42/05.06.2009).
Italy
According to the Law no. 102/2009 (conversion in law, with amendments and integrations, of the Decree Law no. 78/2009) the statutory retirement age of women in the public sector (currently 60) is foreseen to increase by one year every two, starting from 2010, in order to equalise the statutory retirement age of men (currently 65) by 2018. Such intervention has been adopted to implement the sentence of the European Court of Justice imposing the elimination of any gender difference in the retirement age in the public sector.
Latvia
Since July 2008, the Latvian authorities have introduced the following policy changes:
Decrease of old age pensions and service pensions by 10% (from 1 July, 2009 till 31 December, 2012); Decrease of old age pensions and service pensions by 70% for working pensioners (from 1 July, 2009 till 31 December, 2012); The amount of early retirement pension is 50% from calculated pension (till 30 June, 2009 it was 80%); Establishing pure CPI-based indexation (before: CPI + 50% of the real growth of contribution
26
wage sum) and do not index pensions in 2009; Reduction of contribution rates to 2nd tier: 2009- from 8% to 2% starting from 1 May; 2010 -2%; 2011 -4%; 2012 and for all next years -6% (before: 2009 -8%; 2010 -9%; 2011 and for all next years -10%).
Portugal
Within the scope of the 2006 Agreement on the Social Security Reform, the new legislation on the financing (contributive) system of the Social Security General Regime was published in September 2009 (Law no. 110/2009 of 16 September) and is in force from 1 January 2010. The main elements of the new contributive code, impacting on the financial sustainability of the social security system, through the expected increase in revenue, are the following.
i) In relation to wage earners:
Enlargement of the contributive base to fringe benefits previously not considered (travel expenses, participation in enterprise profits,…) in a progressive way (33% in 2010, 66% in 2011 and 100% from 2012 on); Differentiation of the employers’ contribution rate (23.75%) according to the labour contract type by decreasing 1 percentage points (p.p.) in the case of permanent contracts and increasing it 3 p.p. for temporary contracts; Incentives to postpone retirement by reducing further the contributory rate for those who are eligible to a full pension (the reduction applies to employer and employee).
ii) Concerning self-employees:
Entities that contract self-employees’ services have to contribute to Social Security, with the contribution base being 70% of the service paid. The contribution rate is 2.5% in 2010 and 5% from 2011 on; Employees contributive base is now determined by the Social Security services taken into account tax declared earnings and it is foreseen a progressive (yearly) adjustment of the contributive base; Employees contributive rate is now harmonised (29.6% over 20% of the sales amount or 24.6% over 70% of the value of services provided).
iii) For all workers:
Harmonization of the contribution rates according to the risks covered, reducing the number of special regimes.
Slovakia
• Opening of the second pillar in 2009: For the second time, from 15 November 2008 to 30 June 2009, all pension savers were again (as in the year 2008) given the chance to leave the 2nd pillar while, at the same time, those individuals who have not entered yet were allowed to join in. During this period 66 thousand people left the 2nd pillar and 14,6 thousand people joined the 2nd pillar. Because of this measure, the number of savers in the 2nd pillar declined by 3,5%.
In order to ensure high quality and comparability of the pension projection results, a series of in-depth peer reviews of the country fiches were carried out when preparing the projections. Above all, projection results were discussed and revised where deemed necessary by the AWG and the European Commission.
2. Overview of pension systems
2.1. Coverage of the pension projections
27

The projection exercise covers all public pension schemes, with the exception of some specific public pension schemes for some countries, highlighted in grey in Table 1. In particular, 9 countries (Germany, Spain, Cyprus, Luxembourg, Malta, the Netherlands, Austria, Poland and Slovenia) do not include projections of minimum pension and/or social allowance expenditure for different reasons. However, all the countries provided at least a rough estimate of the current and future expenditure of this part of the public pension scheme. In addition, only few countries (notably France and the UK) do not fully cover disability pensions as they are partly covered by the projections of health care expenditure. Pension projections for the voluntary pension schemes (occupational and private pension schemes) have been provided only by few countries. As the participation in these schemes is voluntary and they have been set up quite recently, there is a lack of data that has not allowed a majority of the Member States to provide historical and/or expected values of pension expenditure for such schemes. However, the country coverage of the projection of the mandatory private and occupational pension schemes seems to be satisfactory.
2.2. Summary of pension systems' main characteristics Pension arrangements are very diverse in the EU Member States, due to both different traditions on how to provide retirement income, and to different phases of the reform process of pension systems.
The large majority of pension systems in the EU 27 Member States are public pension systems. Still, several Member States have introduced occupational pension schemes and/or private mandatory and voluntary schemes. As documented by Table 1, pension arrangements are very diverse in the EU. The importance of occupational and private pension provisions varies across countries.
Regarding the type of pension benefit paid out by public earnings-related schemes, most Members States provide defined-benefit pensions, i.e. pension rights are defined in terms of earnings and service years, without a direct link to contributions. But recently, a number of Member States, including Sweden and some new Member States such as Bulgaria, Estonia, Latvia, Lithuania, Hungary, Poland and Slovakia, have switched part of their public pension schemes into private funded schemes. Typically, this provision is statutory but the insurance policy is made between the individual and the pension fund.
28

Table 1: Pension schemes in EU Member States
Occupational
pension scheme
Old-age pensions
Early retirement pensions
Disability pensions
Survivors' pensions
Mandatory private scheme
Voluntary Pension scheme
BE ER ER
ER (wage earner); FR (self-
employed)
ER V* X V*
M young (1960)
M* (prof)
CZ ER ER ER ER X X V*DK FR & MT V FR FR* V X VDE ER ER ER ER V* X V*
EE
FR (before
1999); ER (after)
X
FR (before
1999); ER (after)
FR (before
1999); ER (after)
X M - young (1983) V - old*
EL ER ER ER ER X X V*
ES MT - SA*ER – priv ;
FRw - pub.
ER – priv ; FRw - pub.
ER - priv; FRw - pub.
ER - priv; FRw - pub.
V - priv; M - pub. - V
FR ER ER ER - HC ER V - V*
IE FR MT – FR & SA
SA: MT – FR;
Contributory: FR
SA: MT – FR;
Contributory: FR
M - pub; V* - priv X V*
IT ER ER ER ER V* X V*
CY ER ER ER ER M - pub; V* - priv X X
LV ER ER ER ER XM - young (1971); V -
oldV*
LT ER ER ER FR or ER X V V*LU FR - SA* ER ER ER ER V* X V*
HU ER ER ER ER X M - new (1998) V*
MT ER - FR ERExists only to a minor
extent*X V*
NL FR - ER FR M X V*AT ER ER ER ER M* X V*PL ER ER ER ER V* M/V V*
PT ER ER ER ER M - prof; V - others X V*
RO ER ER ER ER - M -
SI ER ER ER ER M * - prof; V* - others X V
SK ER ER ER ER X M/V V*FI ER ER ER ER V* X V*SE ER ER ER ER V M VUK ER X ER HC* - V* X V*NO ER X* ER ER M* X* V*
V*ER / FR ER / FR V*BG MT-SA ER / FR
ER (before
end 2010 pensions)
COVERAGE
Public pensionsPrivate pension
scheme
Minimum pension / social allowance
MT - SA
FRFR & MT MT - SA*
FR
MT
MT
MT - FR & SA
MT & SA
SA*
SA
SA
MT - SA
MT - FR*
SA*MT - SA*
MT*
MT - SA
SA
FR & MT - SAFR
MT*
MT - SAMTMT
Source: Commission services, EPC. Note: Full information concerning the different pension schemes in the EU Member States is provided country by country after this introduction. Cells highlighted in grey indicate the schemes not covered by the projection.
29

Key:MT … Means testedFR … Flat rateFRw … Flat rate by wage categoriesER … Earnings relatedHC … Partly covered by health care expenditureSA … Social allowance/assistanceX … Does not existV … Voluntary participation in the schemeM … Mandatory participation in the scheme* … Is not covered by the projectionpublic … Public sector employeesprivate … Private sector employeesnew … New labour market entrantsprof … Only for selected professionsother … Other than selected professionsyoung(X) … Only for people born in year X and afterold … Only for people other than young
In most Member States, the core of the pension system is based on the statutory earnings-related old-age pension schemes. At the same time, the public pension system often provides also a minimum-guaranteed pension to those who do not qualify for the earnings-related scheme or have accrued only a small earnings-related pension. Minimum-guarantee pensions are usually means-tested and are provided either by a specific minimum pension scheme or through a general social assistance scheme. In a few Member States, notably in Denmark, the Netherlands and Ireland, the public pension system provides in the first instance a flat-rate pension, which can be supplemented by earnings-related private occupational pension schemes.
The type of benefits provided by the public pension systems diverge across countries. Most pension schemes provide not only old-age pensions but also early retirement, disability and survivors’ pensions. Some countries, however, have specific schemes for some of these benefit types; in particular, some do not consider disability benefits as pensions (despite the fact that they are granted for long periods), and in some cases they are covered by the sickness insurance scheme.
The financing method of the pension systems also differ across countries. Most public pension schemes are financed on a pay-as-you-go (PAYG) basis, whereby contribution revenues are used for the payments of current pensions. In most countries, minimum guarantee pensions are covered by general taxes. Earnings-related schemes are often subsidised to varying degrees from general government funds. Some specific schemes, notably public sector employees’ pensions sometime do not constitute a well identified pension scheme but, instead, disbursements for pensions appear directly as expenditure in the government budget. On the other hand, some predominantly PAYG pension schemes have statutory requirements for partial pre-funding and, in view of the increasing pension expenditure, many governments have started to collect reserve funds for their public pension schemes.
While occupational and private pension schemes are usually funded, the degree of their funding relative to the pension promises may differ, due to the fact that future pension benefits can be related either to the salary and career length (defined-benefit system) or to paid contributions (defined-contribution system).
30

2.3. Indexation rules and sustainability factors A key determinant of pension expenditure dynamics is the indexation rule. A majority of countries (18) in the EU relies on indexation rules for pensions that do not fully reflect development in nominal wages; in some cases due to indexation to prices (Spain, France, Italy and Austria), in others due to a mix of wages and prices (Belgium, Bulgaria, the Czech Republic, Estonia, Cyprus, Latvia, Luxembourg, Hungary, Malta, Poland, Slovakia, Finland and Sweden) or due to a mix of GDP growth and prices (Portugal). Table 2 provides an overview of the indexation rules in each Member State. A few Member States that reformed their pension systems in the recent past have formally introduced a 'sustainability factor' and/or other 'reduction coefficients' into the specification that determines the amount of pension benefit at retirement (Germany, Slovenia, Finland, Italy, Portugal and Sweden). This approach introduces a component that changes the size of the pension benefit depending on expected demographic changes such as the life expectancy at the time of retirement.
31

Table 2: Legal indexation rules in EU Member States
Occupational pension scheme
Old-age pensions
Early retirement pensions
Disability pensions
Survivors' pensions
Mandatory private
scheme
Voluntary Pension scheme
BE CPI + LSA CPI + LSA CPI + LSA CPI + LSA - - -
BG 50%CPI + 50% NI
50%CPI + 50% NI
(before end 2010
pensions). NR (after
2010 pensions)
50%CPI + 50% NI
50%CPI + 50% NI NR NR NR
CZ CPI + min 1/3 RI
CPI + min 1/3 RI
CPI + min 1/3 RI
CPI + min 1/3 RI - - -
DK NI NI NI NI - - -
DE NI + sust NI + sust NI + sust NI + sust - - -
EE 80% CPI + 20% NI
80% CPI + 20% NI
80% CPI + 20% NI
80% CPI + 20% NI - - -
EL NR NR NR NR - - -ES CPI CPI CPI CPI - - -FR CPI CPI CPI CPI - - -IE NR NR NR NR NR - pub - -
IT CPI - size CPI - size CPI - size CPI - size - - -
CY Basic: NI; Suppl.: CPI
Basic: NI; Suppl.: CPI
Basic: NI; Suppl.: CPI
Basic: NI; Suppl.: CPI NI - pub - -
LV CPI + 50% RI CPI + 50% RI CPI + 50% RI CPI + 50% RI - - -
LT NR NR NR NR - - NR
LU
CPI if CPI>2.5% &
RI re-exam(2)
CPI if CPI>2.5% &
RI re-exam(2)
CPI if CPI>2.5% &
RI re-exam(2)
CPI if CPI>2.5% &
RI re-exam(2)
- - -
HU 50% CPI + 50% NI
50% CPI + 50% NI
50% CPI + 50% NI
50% CPI + 50% NI - At least 50%
CPI + 50% NI -
MT
COLA + NI (born before 1962); 70%
NI + 30% CPI (born after
1962)
- COLA
COLA + NI (born before 1962); 70%
NI + 30% CPI (born after
1962)
- - -
NL NI - NI NI 70% NI & 30% CPI - -
AT CPI CPI CPI CPI - - -
PL CPI + 20% RI CPI + 20% RI CPI + 20% RI CPI + 20% RI - NR NR
PTCPI + GDP
partially (size and GDP)
CPI + GDP partially (size
and GDP)
CPI + GDP partially (size
and GDP)
CPI + GDP partially (size
and GDP)
CPI for DB 1st pillar and re-exam(1) for the other
plans
- -
RO RI RI RI RI - NR -
SI NI and sust NI and sust NI and sust NI and sust NR NR NR
SK 50% CPI + 50% NI
50% CPI + 50% NI
50% CPI + 50% NI
50% CPI + 50% NI - NR -
FI 80% CPI + 20%NI + sust
80% CPI + 20%NI + sust
80% CPI + 20%NI + sust
80% CPI + 20%NI + sust - - -
SE NI + sust NI + sust NI + CPI NI + CPI - - -
UK CPI; NI as of 2012 - - CPI - - -
NO NI - NI NI - - -
CPI
CPI
NI
NI
CPI + GDP partially (GDP)
RIIn line with pensions
NR
2/3 COLA
NI
CPI
CPI + 20% RI
CPI + 50% RI
NRCPI if
CPI>2.5% & RI re-
exam(2)
-
CPINR
CPI or fixed in nominal
terms
NI
Minimum pension /
social allowance CPI + LSA
NR
LEGAL INDEXATION
Public pensions Private pension scheme
50%CPI + 50% NI
NR
NI
In line with pensions & re-
exam(5)
80% CPI + 20% NI
CPI
Source: Commission services, EPC.
32

Key:NR … No rule existsRI … Real income growthNI … Nominal income growth
GDP … GDP growthCPI … CPI inflationLE … Adjustment to life expectancy.
LSA … Living standard adjustmentCOLA … Adjustmentd to cost of livingsize … Adjusted by a pension sizesust … Additional adjustment due to other mechanisms such as a sustainability factor,
balancing mechanism, life expectancy, value of a pension point,maintenance of relativity between means-tested and contributory pension, etc.
re-exam(X) … Reexamination of pension value every X yearsmin … At least
2.4. Retirement and exit age from the labour market In the large majority of countries, the average exit age is lower than the statutory retirement age, as shown in Table 3. Mostly, this is due to the existence of early retirement schemes and/or other government programmes that provide income support to older people before they reach the official retirement age. Also, in a number of countries (like Finland and Sweden) the retirement age is flexible, with built-in incentives to remain active in the labour market.
33

Table 3: Statutory retirement age and average exit age from labour market
MALE FEMALE2001 2007 2001 2007 2001 2007 2008 2008
BE 56.8 61.6 57.8 61.2 55.9 61.9 65 64BG 58.4 61.2 62.5 64.1 56.8 59.7 63 59y 6 mCZ 58.9 60.7 60.7 62 57.3 59.4 61y 10m 56 - 60DK 61.6 60.6 62.1 61.4 61 59.7 65 65DE 60.6 62 60.9 62.6 60.4 61.5 65 65EE 61.1 62.5 63 60y 6mIE 63.2 64.1* 63.4 63.5* 63 64.7* 66 66EL 61 61.6 60.5 65 60ES 60.3 62.1 60.6 61.8 60 62.4 65 65FR 58.1 59.4 58.2 59.5 58 59.4 60 60IT 59.8 60.4 59.9 61 59.8 59.8 65 60CY 62.3 63.5 65 65LV 62.4 63.3 62 62LT 58.9 59.9* 62.5 60LU 56.8 65 65HU 57.6 59.8** 58.4 61.2** 57 58.7** 62 62MT 57.6 58.5* 61 60NL 60.9 63.9 61.1 64.2 60.8 63.6 65 65AT 59.2 60.9 59.9 62.6 58.5 59.4 65 60PL 56.6 59.3 57.8 61.4 55.5 57.5 65 60PT 61.9 62.6 62.3 62.9 61.6 62.3 65 65RO 59.8 64.3* 60.5 65.5* 59.2 63.2* 63 58SI 59.8* 63 61SK 57.5 58.7 59.3 59.7 56 57.8 62 55 - 59FI 61.4 61.6 61.5 62 61.3 61.3 62 -68 62 - 68SE 62.1 63.9 62.3 64.2 61.9 63.6 61-67 61- 67UK 62 62.6 63 63.6 61 61.7 65 60NO 63.3 64.4 63 64.1 63.6 64.7 62 62EU27 59.9 61.2 60.4 61.9 59.4 60.5 : :EA 59.9 61.3 60.2 61.6 59.6 60.9 : :EA12 59.9 61.3 60.2 61.6 59.6 60.9 : :EU15 60.3 61.5 60.7 62 59.9 61.1 : :EU10 57.6 59.6 58.8 61.3 56.6 58.3 : :EU25 59.9 61.2 60.4 61.9 59.4 60.6 : :Source: Average Exit age from the labour market (Eurostat), information provided by AWG delegates,Joint Commission-Council report on SPSI (2009)Note: * represents 2006 and ** represents 2005
Exit age from the labour market Statutory retirement ageTOTAL MALE FEMALE
Note: The average exit age from the labour force by gender is shown here, as defined by Eurostat's Structural Indicators (see http://epp.eurostat.ec.europa.eu/portal/page/portal/eurostat/home/ ). This indicator gives the average age at which active persons definitely withdraw from the labour market. It is based on a probability model considering the relative changes of activity rates from one year to another at a specific age. The activity rate represents the labour force (employed and unemployed population) as a percentage of the total population for a given age. The indicator is based on the EU Labour Force Survey. The survey covers the entire population living in private households. The definitions used follow the guidelines of the International Labour Office. Source: Eurostat Structural indicators, Commission services, EPC.
3. Pension expenditure projections
3.1. Public pensions
34

The projections of public pension expenditure show an increase of 2.4 p.p. of GDP over the period 2007-2060 in the EU. As regards the projected change in public pension expenditure, there is a very large diversity across Member States, ranging from a decline of 2.8 p.p. of GDP (Poland) to an increase of 15.2 p.p. of GDP (Luxembourg) as shown in Graph 2.3
Graph 2: Gross old-age and other public pension expenditure in 2007 and 2060 (% of GDP)
0.0
5.0
10.0
15.0
20.0
25.0
2007
2060
2007
2060
2007
2060
2007
2060
2007
2060
2007
2060
2007
2060
2007
2060
2007
2060
2007
2060
2007
2060
2007
2060
2007
2060
2007
2060
2007
2060
2007
2060
2007
2060
2007
2060
2007
2060
2007
2060
2007
2060
2007
2060
2007
2060
2007
2060
2007
2060
2007
2060
2007
2060
2007
2060
IE LV EE UK CY RO NL LT SK MT CZ BG ES LU NO DK SE SI BE FI DE HU PT PL EL AT FR IT
Old age pensions Other pensions Source: Commission services, EPC. Country-specific definitions used in the projections: France: Disability pensions for individuals below the retirement age are included in health-care expenditure. After the minimum retirement age (60) disability pensions are covered by the public pension scheme. Survivors' pensions for all age are covered by the public pension expenditures. UK: Benefits paid to disabled persons below state pension age are not included in the projection, but disability benefits for persons above state pension age are included in public pension expenditure. The UK does not have survivor pensions. Ireland: "Old-age and other public pension expenditure" includes also the pension expenditure of public service occupational pension schemes. Hungary: the projection of old-age and early pensions include an estimation of the old-age allowance (a minimum pension in Hungary), which is not a part of Hungarian pension model at this stage. This projection contributes with 0.4 p.p. of GDP to the increase in old-age and early pensions ratio over the period 2007-2060. In addition, a part of the increase in gross pension expenditures from 2007 to 2060 in Hungary is explained by the introduction of pension taxation as of 2013 and so does not reflect an increase in expenditures effectively burdening the budget. Taxes on public pensions in 2060 are calculated to be 0.7% of GDP. The lion’s share of the projected increase in public pension expenditure is due to old-age and early pensions. Old-age and early pensions are projected to increase by 2.4% of GDP between 2007 and 2060 in the EU. In the euro area, the increase is projected to be slightly higher (2.6% of GDP). A smaller increase is projected for other pension expenditure, mainly disability and survivor pensions, increasing only slightly (0.1% of GDP) in the euro area.
3 In the case of Luxembourg, the pension projection is affected by the considerable number of cross-border workers who will in future years receive a pension from the Luxembourg social security scheme, but at the same time will not be registered as Luxembourg inhabitants. Due to this peculiar circumstance, Luxembourg can not be, in same cases, strictly compared with other Member States.
35

At the individual country level, three Member States (Greece, Cyprus and Luxembourg) projected the public pension expenditure to increase by more than 10 p.p. of GDP. In other five Member States (Malta, Spain, Romania, Ireland and Slovenia) spending to GDP will grow between 5 to 10 p.p. For the majority of the Member States the projected increase is below 5%. Only few countries are prospecting a decrease over the entire period of projections (Poland, Estonia, Denmark, Italy and Latvia), although this masks an increasing pattern over part of the projections period (such as in the case of Italy). As regards spending on disability and survivor pensions, they are projected to decrease in the majority of countries. Only in 8 Member States (Portugal, Romania, Slovenia, Slovakia, Finland, Sweden, the UK and Norway) is it projected to increase, although only slightly. Dynamics of the pension expenditure in different sub periods differs among Member States as well. Over the coming two decades, the public pension to GDP ratio in 10 countries (the Czech Republic, Germany, Greece, Latvia, Lithuania, Luxembourg, Hungary, the Netherlands, Austria and Slovakia) is projected to temporarily decrease, reaching the lowest level in the period before 2030, but then it increases to reach a peak at the end of the projection period in 7 of them (the Czech Republic, Germany, Lithuania, Hungary, the Netherlands, Slovakia, Luxembourg) or before in 3 of them (Greece, Austria and Latvia). In 12 other countries (Belgium, Denmark, Estonia, Spain, France, Italy, Latvia, Poland, Portugal, Slovenia, Finland, Sweden), the public pension ratio peaks before the end of the projection period. In the remaining 7 countries (Bulgaria, Ireland, Cyprus, Malta, Norway, Romania, and the UK) the public pension ratio increases over the entire projection period.
Table 4: Projected trough and peak years for pension expenditure (% of GDP)
Start year 2007
Trough year (before peak)
Trough value
Decreas from 2007 to trough
Peak year
Peak value
Increase from trough to peak
End year 2060
Change 2007 - 2060
BE 10.0 2056 14.8 14.7 4.8BG 8.3 11.3 3.0CZ 7.8 2016 6.8 -1.0 11.0 3.3DK 9.1 2020 10.6 9.2 0.1DE 10.4 2013 10.0 -0.5 12.8 2.3EE 5.6 2009 6.5 4.9 -0.7IE 4.0 8.6 4.6EL 11.7 2009 11.6 -0.1 2055 24.3 12.7 24.1 12.4ES 8.4 2053 15.6 15.1 6.7FR 13.0 2036 14.5 14.0 1.0IT 14.0 2041 15.6 13.6 -0.4CY 6.3 17.7 11.4LV 5.4 2013 4.7 -0.7 2038 6.1 1.4 5.1 -0.4LT 6.8 2012 6.5 -0.3 11.4 4.6LU 8.7 2010 8.6 -0.1 2059 24.2 15.6 23.9 15.2HU 10.9 13.8 3.0MT 7.2 13.4 6.2NL 6.6 2008 6.3 -0.2 10.5 4.0AT 12.8 2010 12.7 -0.1 2046 14.0 1.3 13.6 0.9PL 11.6 2008 11.8 8.8 -2.8PT 11.4 2053 13.6 13.4 2.1RO 6.6 15.8 9.2SI 9.9 2058 18.6 18.6 8.8SK 6.8 2020 6.3 -0.5 10.2 3.4FI 10.0 2033 14.0 13.4 3.3SE 9.5 2009 9.7 9.4 -0.1UK 6.6 9.3 2.7NO 8.9 2008 8.8 -0.1 13.6 4.7
EU27 10.1 12.5 2.4EA 11.0 2053 13.9 13.8 2.8
Source: Commission services, EPC.
36

3.2. Private pensions In light of fiscal pressures arising from demographic trends, many countries have taken steps to encourage the creation of occupational and private pension schemes. As a result, the role of these schemes has recently increased. Still, the role of privately managed pension schemes is currently rather limited, as the major part of pension income is provided by public pension schemes. In general, net contributions to occupational and private pension funds are increasing over time and the most of occupational and private funds are still “a long way” from being mature funds. In other words, at this moment there are only few countries with large numbers of pensioners or people who will retire soon and rely to a substantial part on funded pensions.
3.3. Drivers of pension expenditure Over the projection horizon (2007-2060) important differences in the evolution of the pension-to-GDP ratio are projected. In individual Member States different factors lie behind the overall development of pension expenditure (Graph 3).4 In general, at the EU27 level, the effect of demographic factor – as captured by the dependency ratio (the ratio between persons aged 65 and over and persons aged 15-64)- is the most relevant in pushing up spending, although it is decreasing over time as from 2030 (Graph 3). The largest contribution is envisaged for the periods 2007-2030, reaching +2.3 p.p. At the end of the projection (2050-2060), the contribution of demographic factors levels down to +0.7 p.p. of GDP. Significant differences can be found among Member States. Especially, idiosyncratic demographic developments are expected for EU10 and EU15 countries. The contribution of the coverage ratio (the ratio between te number of pensioners and presons aged 65 and over) at EU27 level is expected to fade away over the projection
4 In order to analyse dynamics and the factors of pension-to-GDP ratio, the following decomposition is used:
44444444 344444444 21
4444 84444 764444 84444 76
4444 84444 76444 8444 76
residual
EffectRatioBenefitEffectRateEmployment
effectRatioCoverageEffectRatioDependency
effectnInteractioWorkedHours
PeopleWorkingdHoursWorke
GDPPensionAverage
PeopleWorkingPopulation
PopulationPensionersofNumber
PopulationPopulation
GDPExpPension
×−−×
−
×−
−×
+×
−+=
71156415
71156415
6415
65641565.
The overall percentage change can be expressed as a sum of the contribution of the four main factors, i.e. the dependency ratio contribution, the coverage ratio contribution, the employment rate contribution and the benefit ratio contribution.
37

horizon. The initial downward contribution (-1.1 p.p.) of the 2007-2020 period is estimated to subsequently fall down over the projection period towards zero (- 0.2 p.p.). The contribution of the employment effect is noticeable during the period 2007-20, contributing to limit the increase by -0.5 p.p., and its contribution subsequently vanishes in the period 2020-30. Finally, the contribution of the benefit ratio development at the EU27 level to containing spending is envisaged to increase in absolute terms from the initial level (-0.1 p.p.) in 2007-2020 to its maximum value in 2030-2040 (-0.7 p.p.).
Graph 3: Decomposition of the public pension spending to GDP ratio over sub periods for EU27 (in percentage points)
2030-40
2007-20 2020-30
2040-50
2050-60
-1.5
-1.0
-0.5
0.0
0.5
1.0
1.5
2.0
2.5
P/GDP Dependency ratio Coverage ratioEmployment effect Benefit ratio
Source: Commission services, EPC.
38

Table 5: Decomposition of the public pension spending to GDP ratio over 2007 – 2060 (% of GDP)
2007 level Dependency ratio contribution
Coverage ratio contribution
Employment effect
contribution
Benefit ratio contribution Interaction effect 2060 level
BE 10.0 7.4 -0.9 -0.5 -1.0 -0.3 14.7BG 8.3 9.1 -3.0 -0.5 -1.8 -0.8 11.3CZ 7.8 9.5 -3.5 -0.5 -1.2 -1.1 11.0DK 9.1 6.5 -4.9 -0.1 -0.5 -0.7 9.2DE 10.4 7.9 -1.9 -0.8 -2.2 -0.8 12.8EE 5.6 4.6 -1.6 -0.2 -3.1 -0.4 4.9IE 4.0 5.9 -1.5 -0.2 0.7 -0.3 8.6EL 11.7 12.7 -0.4 -0.6 0.8 -0.1 24.1ES 8.4 10.7 -0.9 -0.9 -1.7 -0.5 15.1FR 13.0 8.4 -2.2 -0.5 -4.0 -0.7 14.0IT 14.0 10.4 -3.2 -1.1 -5.5 -1.0 13.6CY 6.3 10.8 1.6 -0.5 -0.3 -0.2 17.7LV 5.4 5.7 -1.6 -0.2 -3.9 -0.4 5.1LT 6.8 9.6 -2.4 0.0 -1.8 -0.8 11.4LU 8.7 8.4 5.2 0.0 1.2 0.3 23.9HU 10.9 11.3 -5.4 -0.7 -1.1 -1.0 13.8MT 7.2 11.3 -3.1 -0.7 -0.5 -0.8 13.4NL 6.6 6.6 -1.5 -0.2 -0.6 -0.4 10.5AT 12.8 9.9 -2.6 -0.5 -5.0 -1.0 13.6PL 11.6 13.4 -6.3 -1.0 -7.1 -1.8 8.8PT 11.4 9.8 -1.7 -0.6 -4.5 -0.9 13.4RO 6.6 13.6 -4.9 0.3 1.7 -1.5 15.8SI 9.9 13.7 -3.5 -0.1 -0.7 -0.7 18.6SK 6.8 11.7 -3.9 -0.6 -2.4 -1.4 10.2FI 10.0 8.7 -3.1 -0.6 -0.9 -0.7 13.4SE 9.5 5.6 -0.4 -0.4 -4.3 -0.6 9.4UK 6.6 4.2 -1.4 -0.3 0.5 -0.3 9.3NO 8.9 8.2 -1.2 0.3 -2.4 -0.2 13.6EU27 10.1 8.7 -2.6 -0.7 -2.5 -0.6 12.5EA 11.0 9.0 -2.0 -0.7 -2.9 -0.7 13.8EA12 11.1 8.8 -1.9 -0.7 -2.9 -0.7 13.8EU15 10.2 7.7 -1.8 -0.6 -2.3 -0.6 12.6EU10 9.7 11.8 -4.9 -0.7 -3.9 -1.3 10.7EU25 10.2 8.5 -2.4 -0.7 -2.5 -0.6 12.5
Source: Commission services, EPC.
3.4. Sensitivity of the projection results In order to verify the robustness of the pension projection with respect to changes in key variables, a series of sensitivity tests were carried out. Specifically, changes to the demographic (assumptions on life expectancy and migration flows) and macro-economic (productivity growth, employment rates and the interest rate) variables were applied. Compared to the baseline assumptions, a higher life expectancy (of 1 year at birth by 2060) would lead to higher public expenditure on pensions. Eventually, this drop in mortality at all ages leads to a larger labour force, and therefore higher contributions. The increase of the pension to GDP ratio in the EU27 on average would be above +0.3 p.p. The impact is however not uniform across countries, ranging from +0.1 p.p. by Latvia to +0.6 p.p. by Slovenia.
39

Graph 4: Difference between the alternative and baseline scenario (in percentage points), 2007-60
EEPL IT SEDK DE
CZEU27LT NL SK EL HUBGBEUK MT LU PT FRATRO
SI
LV
ESEACYFI
IE NO
0.0
0.2
0.4
0.6
0.8
1.0
Higher life expectancy
EL
ATES BE
PTMTIT PLEU27HUBGLV CZ SESK LU EEUK
DK RONL LT NO IE DESI
FIEAFR CY
-2.5
-1.5
-0.5
0.5
1.5
Higher labour productivity
AT FR RO
HU SE LTEU27LU NL FI DK UK IE SK MT PL DECY ES
LV EE IT SI BG
CZ
PT
BE
EAEL
-0.8
-0.4
0.0
0.4
0.8
1.2
Higher employment of older w orkers
BGNOROATBE FR
LT EU27NL IE DK UK SE DE PL MTSK IT HULV LU
EE
PTCYFI
CZES
ELSI
EA
-0.5
-0.4
-0.2
-0.1
0.1
Higher employment
LT
LV EE PL ROSK IE DK NOHU EA DEBE IT MTUK PT ES SIEL
AT
CYLU
EU27CZFRSEBG FI NL
-3.0
0.0
3.0
6.0
9.0
12.0
Zero migration
Source: Commission services, EPC.
40
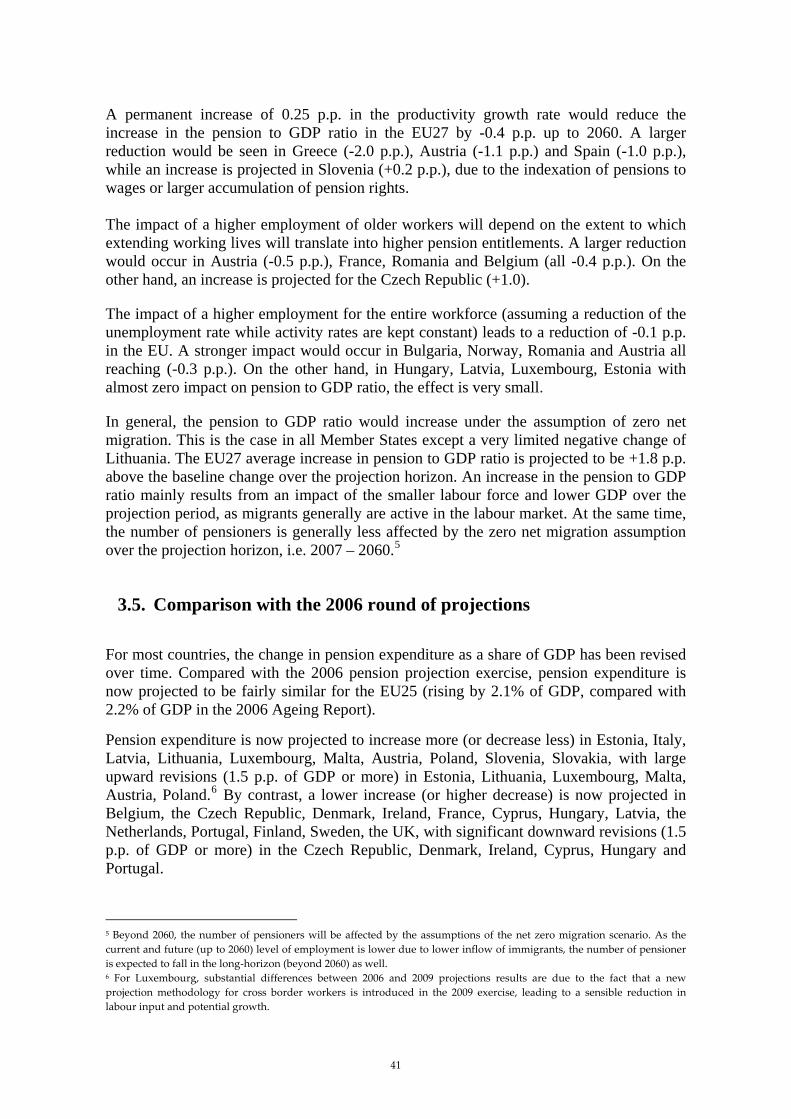
A permanent increase of 0.25 p.p. in the productivity growth rate would reduce the increase in the pension to GDP ratio in the EU27 by -0.4 p.p. up to 2060. A larger reduction would be seen in Greece (-2.0 p.p.), Austria (-1.1 p.p.) and Spain (-1.0 p.p.), while an increase is projected in Slovenia (+0.2 p.p.), due to the indexation of pensions to wages or larger accumulation of pension rights. The impact of a higher employment of older workers will depend on the extent to which extending working lives will translate into higher pension entitlements. A larger reduction would occur in Austria (-0.5 p.p.), France, Romania and Belgium (all -0.4 p.p.). On the other hand, an increase is projected for the Czech Republic (+1.0).
The impact of a higher employment for the entire workforce (assuming a reduction of the unemployment rate while activity rates are kept constant) leads to a reduction of -0.1 p.p. in the EU. A stronger impact would occur in Bulgaria, Norway, Romania and Austria all reaching (-0.3 p.p.). On the other hand, in Hungary, Latvia, Luxembourg, Estonia with almost zero impact on pension to GDP ratio, the effect is very small.
In general, the pension to GDP ratio would increase under the assumption of zero net migration. This is the case in all Member States except a very limited negative change of Lithuania. The EU27 average increase in pension to GDP ratio is projected to be +1.8 p.p. above the baseline change over the projection horizon. An increase in the pension to GDP ratio mainly results from an impact of the smaller labour force and lower GDP over the projection period, as migrants generally are active in the labour market. At the same time, the number of pensioners is generally less affected by the zero net migration assumption over the projection horizon, i.e. 2007 – 2060.5
3.5. Comparison with the 2006 round of projections For most countries, the change in pension expenditure as a share of GDP has been revised over time. Compared with the 2006 pension projection exercise, pension expenditure is now projected to be fairly similar for the EU25 (rising by 2.1% of GDP, compared with 2.2% of GDP in the 2006 Ageing Report).
Pension expenditure is now projected to increase more (or decrease less) in Estonia, Italy, Latvia, Lithuania, Luxembourg, Malta, Austria, Poland, Slovenia, Slovakia, with large upward revisions (1.5 p.p. of GDP or more) in Estonia, Lithuania, Luxembourg, Malta, Austria, Poland.6 By contrast, a lower increase (or higher decrease) is now projected in Belgium, the Czech Republic, Denmark, Ireland, France, Cyprus, Hungary, Latvia, the Netherlands, Portugal, Finland, Sweden, the UK, with significant downward revisions (1.5 p.p. of GDP or more) in the Czech Republic, Denmark, Ireland, Cyprus, Hungary and Portugal.
5 Beyond 2060, the number of pensioners will be affected by the assumptions of the net zero migration scenario. As the current and future (up to 2060) level of employment is lower due to lower inflow of immigrants, the number of pensioner is expected to fall in the long-horizon (beyond 2060) as well. 6 For Luxembourg, substantial differences between 2006 and 2009 projections results are due to the fact that a new projection methodology for cross border workers is introduced in the 2009 exercise, leading to a sensible reduction in labour input and potential growth.
41

The revisions of projected changes in pension expenditure over the long-term are due to several factors, notably but not exclusively due to recent reforms of pension systems. Also other factors can have an effect, such as changes in the demographic and macro-economic assumptions, changes in modelling pension expenditure over the long-term and changes in the coverage of the projection (data on pension schemes covered in the projection).
The main factor behind the projected increase in pension expenditure is the demographic transition to an older population. The dependency effect has decreased in a majority of countries (Portugal, Ireland, Cyprus, the Czech Republic, Austria, Spain, the UK, Italy, Hungary, Denmark, Belgium, Finland, France, Slovenia, Germany and Sweden), and it has increased only in few the Netherlands, Luxembourg, Slovakia, Estonia, Poland, Latvia, Lithuania and Malta.
In the 2009 projection exercise, the fall in coverage is more accentuated, thus offsetting the upward pressure coming from demographic trends to a greater extent than in the 2006 projection exercise in a majority of countries. This reflects changes in pension policies that have aimed at increasing the effective retirement age either through increases in the statutory retirement age and/or through tightening access to early and disability pension schemes. Compared with the 2006 projection exercise, the largest reductions in the coverage ratio are projected in Malta, Denmark and the UK. By contrast, it increases in Austria, Spain and Luxembourg. An increase in the coverage effect may be due to a higher take-up of pensions by women, thanks to their increasing participation in the labour market even if there is a lower take-up of pensions by men due to reforms undertaken.
The employment effect contributes to offset the dependency effect too, but its effect is rather small in most countries and it generally offsets less in the current exercise compared with the 2006 projection. This partly follows from the fact that employment rates have generally risen in the period since the previous projection was carried out and that the structural unemployment rates have not been reduced to the same extent.
The benefit effect shows the extent to which average pensions increase at a different pace than average income (proxied by output per worker). It helps to offset the dependency effect in almost all countries, reflecting in many cases reforms that have been introduced so as to make the public pension systems more robust to demographic changes. In the Czech Republic, Denmark, Ireland, Spain, France, Cyprus, Latvia, Lithuania, Luxembourg, Hungary, the Netherlands, Portugal, Sweden, the offsetting impact of the relative benefit reduction has increased compared with the previous 2006 projection and in particular for Hungary, Cyprus, Luxembourg, Sweden, Lithuania, Portugal and the Czech Republic.
In sum, EU Member States are reducing the generosity of public pension schemes so as to make these programmes financially more sustainable in view of the demographic trends. The statutory retirement age is gradually pushed up over the long-term for old-age pensions. The access to early retirement schemes has been restricted and the incentives to prolong working lives have been strengthened. Also, the projections show no increase in disability and survivor pensions, embodying an assumption of lower take-up rates of these transfers over the projection period.
42
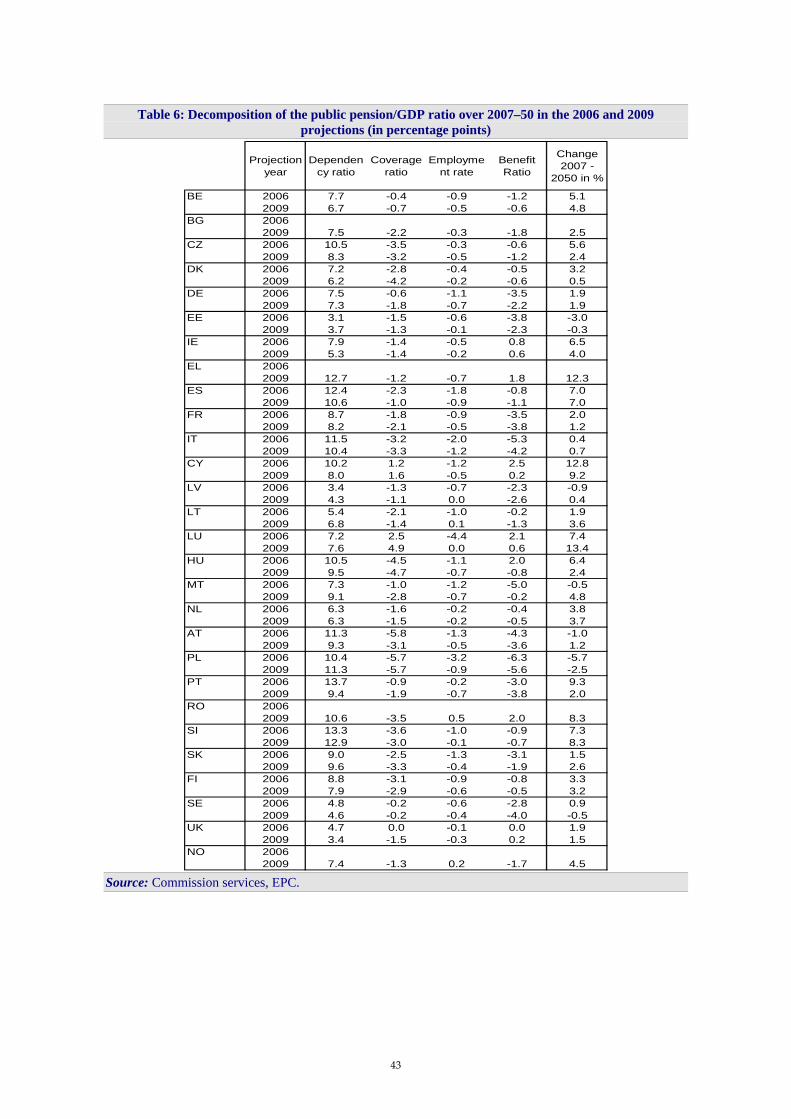
Table 6: Decomposition of the public pension/GDP ratio over 2007–50 in the 2006 and 2009 projections (in percentage points)
Projection year
Dependency ratio
Coverage ratio
Employment rate
Benefit Ratio
Change 2007 -
2050 in %
BE 2006 7.7 -0.4 -0.9 -1.2 5.12009 6.7 -0.7 -0.5 -0.6 4.8
BG 20062009 7.5 -2.2 -0.3 -1.8 2.5
CZ 2006 10.5 -3.5 -0.3 -0.6 5.62009 8.3 -3.2 -0.5 -1.2 2.4
DK 2006 7.2 -2.8 -0.4 -0.5 3.22009 6.2 -4.2 -0.2 -0.6 0.5
DE 2006 7.5 -0.6 -1.1 -3.5 1.92009 7.3 -1.8 -0.7 -2.2 1.9
EE 2006 3.1 -1.5 -0.6 -3.8 -3.02009 3.7 -1.3 -0.1 -2.3 -0.3
IE 2006 7.9 -1.4 -0.5 0.8 6.52009 5.3 -1.4 -0.2 0.6 4.0
EL 20062009 12.7 -1.2 -0.7 1.8 12.3
ES 2006 12.4 -2.3 -1.8 -0.8 7.02009 10.6 -1.0 -0.9 -1.1 7.0
FR 2006 8.7 -1.8 -0.9 -3.5 2.02009 8.2 -2.1 -0.5 -3.8 1.2
IT 2006 11.5 -3.2 -2.0 -5.3 0.42009 10.4 -3.3 -1.2 -4.2 0.7
CY 2006 10.2 1.2 -1.2 2.5 12.82009 8.0 1.6 -0.5 0.2 9.2
LV 2006 3.4 -1.3 -0.7 -2.3 -0.92009 4.3 -1.1 0.0 -2.6 0.4
LT 2006 5.4 -2.1 -1.0 -0.2 1.92009 6.8 -1.4 0.1 -1.3 3.6
LU 2006 7.2 2.5 -4.4 2.1 7.42009 7.6 4.9 0.0 0.6 13.4
HU 2006 10.5 -4.5 -1.1 2.0 6.42009 9.5 -4.7 -0.7 -0.8 2.4
MT 2006 7.3 -1.0 -1.2 -5.0 -0.52009 9.1 -2.8 -0.7 -0.2 4.8
NL 2006 6.3 -1.6 -0.2 -0.4 3.82009 6.3 -1.5 -0.2 -0.5 3.7
AT 2006 11.3 -5.8 -1.3 -4.3 -1.02009 9.3 -3.1 -0.5 -3.6 1.2
PL 2006 10.4 -5.7 -3.2 -6.3 -5.72009 11.3 -5.7 -0.9 -5.6 -2.5
PT 2006 13.7 -0.9 -0.2 -3.0 9.32009 9.4 -1.9 -0.7 -3.8 2.0
RO 20062009 10.6 -3.5 0.5 2.0 8.3
SI 2006 13.3 -3.6 -1.0 -0.9 7.32009 12.9 -3.0 -0.1 -0.7 8.3
SK 2006 9.0 -2.5 -1.3 -3.1 1.52009 9.6 -3.3 -0.4 -1.9 2.6
FI 2006 8.8 -3.1 -0.9 -0.8 3.32009 7.9 -2.9 -0.6 -0.5 3.2
SE 2006 4.8 -0.2 -0.6 -2.8 0.92009 4.6 -0.2 -0.4 -4.0 -0.5
UK 2006 4.7 0.0 -0.1 0.0 1.92009 3.4 -1.5 -0.3 0.2 1.5
NO 20062009 7.4 -1.3 0.2 -1.7 4.5
Source: Commission services, EPC.
43

Belgium (Report prepared by Michel Englert and Micheline Lambrecht)
1. Overview of the pension system
1.1. Description of the Belgian pension system
In Belgium, the pension system is mainly based on statutory public schemes (first pillar), which include three main pension schemes: the general scheme for wage earners, the scheme for self-employed workers and the one for civil servants. Besides those three schemes, the pension expenditure covered in the AWG results also feature the so-called “prepensions”, the disability benefits and the assistance scheme (guaranteed income for the elderly). Occupational pension schemes (second pillar) and voluntary individual pension schemes (third pillar) also exist but are of minor importance. They are not included in the model of pension projections because of a lack of data. The following box presents the characteristics of the various schemes of public pension (main pension formulas, legal age of retirement, indexation) asked by the AWG.
Pension scheme for wage earners Formula for old age pension: P = 75% or 60% x reference wage with reference wage =
The pension is computed as 75% of the reference wage for the head of a household with a dependent spouse and 60% in all other cases. The reference wage is calculated on the basis of the wage really earned during the career up to a wage ceiling (44994.88 euro for the year 2007).* This wage is adjusted to current prices by the CPI. The sum of those adjusted wages over the career is weighted by 1/45th (a full career is 45 years). Periods of unemployment, early retirement, disability, etc. are valued at the last corresponding earned wage. The survivors pension is calculated as 80% of the deceased person’s retirement pension, computed at the family rate (which means 80% of 75%), that is 60% of the reference wage. A guaranteed minimum pension exists for the pensions acquired over a full career or a career which at least equals two thirds of a full career in the wage earner scheme (1126.28 euro per month for the head of a household with a dependent spouse and 901.13 euro per month in all other cases, in December 2007 for a full career). * In 2006, the wage of 17% of full-time wage earners of the private sector was higher than the ceiling.
n
t = 1 ∑ × price index n
price index t wage in t up to the wage ceiling × 1---
45
44

A minimum claim per working year also exists (18028.21 euro per year in December 2007), as long as the beneficiary can prove he/she has worked at least 15 years in the wage earner scheme, and providing his/her job was at least one third of a full-time job. In December 2007, for new pensioners meeting those requirements, as if their adjusted wage in a full time employment of one year of career was lower than 18028.21 euro, their pension was calculated for this year of career on basis of this amount of the minimum claim per working year. Since 2007, a pension bonus has been granted for each working day after the age of 62 or to those who have a career of 44 years (see 1.2.2. below). Legal age retirement: 65 for men; currently 64 for women, 65 in 2009. Retirement age flexible from 60, provided a minimum career length of 35 years. Pension benefits are automatically adjusted to price index and partially adjusted to living standards following the “Generation Pact” (see 1.2.2. below). Pension scheme for the self-employed Formula for old age pension: P = 75% or 60% x reference wage with reference wage =
The pension is computed as 75% of the reference wage for the head of a household with a dependent spouse and 60% in all other cases, just like in the wage earner scheme. For the reference wage, the working years before 1984 are valued at a fixed income, while for the working years as from 1984 (during which a self-employed professional activity was exercised), it is calculated on the basis of the business income used to compute social security contributions and income tax, up to an income ceiling. The correction coefficients (reduction coefficients) reflect the discrepancy between the contributions paid by the wage earners and by the self-employed workers. Penalties in case of early retirement before 65 (for instance the penalty is 25% of the pension at the age of 60) except when the career is at least 43 years long. A minimum pension exists, which is granted in proportion to the career fraction and for at least two thirds of a full career as a self-employed and/or wage earner (1060.67 euro per month for the head of a household with a dependent spouse and 798.03 euro per month in other cases, in December 2007 for a full career). When pensions (from the wage-earner scheme and the self-employed scheme) are cumulated, the total amount of the pension can’t exceed a ceiling. No minimum claim per year. Survivor’s pension, pension bonus, legal age retirement, adjustments to price index and living standards: similar to the wage earner scheme.
1---45
t = 1 ∑
n
price index nprice index t
income × x correction coefficients ×
45

Pension scheme for civil servants Formula for old age pension and disability pension (civil servants declared permanently unfit to continue their career, regardless of their age or seniority): P = maximum 75% x reference wage with
The reference wage is the average wage over the last five years of work, on the basis of the wage brackets. The maximum replacement rate of 75% of the reference wage is obtained with a numerator of a maximum career length of 45 years and a denominator of 60 (tantième). Some have a preferential denominator (55 in teaching and less for other specific categories like magistrates and academic services). To benefit from a civil servants pension, a career length of at least 5 years is required. To benefit from a minimum pension, a career of 20 years is required. The survivor’s pension is calculated as 60% of the reference wage (of the deceased person). Legal retirement age: 65 (there are some exceptions) for men and women. Retirement possible from 60. Pension benefit is automatically adjusted to the CPI and to the real wage increases of the working civil servants. Early retirement scheme embedded in the unemployment scheme: “prepensions” (only for wage earners) The full “prepension” consists of an unemployment benefit, paid by the public authorities (National Employment Office), which amounts to 60% of the last gross wage earned, limited by a ceiling (different from that used in the pension scheme). The beneficiaries also receive an extra allowance, paid by the employer, which is not taken into account in the model. Legal age: 60 from 2008 onwards, provided the career length as a wage earner is minimum 30 years for men (35 years in 2012) en 26 years for women (afterwards increased with 2 years every four years till 35 years). Exemptions (age 58) still possible (heavy jobs, night work). Prepension benefit is automatically adjusted to the CPI and partially adapted to living standards following the Generation Pact (see 1.2.2. below). Disability If a person’s disability prevents him/her from working for more than one year (if less than one year, it is called “primary disability”, which is not taken into account in the results of pension expenditure), a disability benefit is paid. In the wage earner scheme, disability benefits are calculated at 65% of the limited lost remuneration for beneficiaries head of a household, 53% for single persons, and 40% for cohabitants.
75% = considered service years (max 45 years) - - - -- - --- --- --- -- - ---60 (tantieme)
46

In the self-employed workers’ scheme, the disability benefits are fixed but differ according to whether the beneficiary is in charge of a family or not. Disability benefit is automatically adjusted to the CPI and partially adapted to living standards following the Generation Pact (see 1.2.2. below). Assistance scheme: guaranteed income for elderly persons (GIEP) The elderly people with no income or an insufficient income (pension) can receive the so-called guaranteed income for elderly persons (GIEP). In December 2007, the maximum amount of the GIEP is 811.38 euro per month for a single person and 540.92 euro per month for cohabitants (for each person). Before granting the GIEP, the financial means of the person are checked. Legal age: 64 or more, 65 by 2009. GIEP benefit is automatically adjusted to the CPI and partially adapted to living standards following the Generation Pact (see 1.2.2. below).
The table below shows the relative weight of the various pension “pillars” in Belgium, as well as several striking characteristics of some schemes within the first pillar. These characteristics are useful in order to better understand the results of the pension expenditure projections.
Table 1: Relative weight of the various pension “pillars”, including some characteristics of the first pillar, in 2007 (unless otherwise stated)
Pension spending (in % of GDP)
Number of beneficiaries (in thousands)
First pillar 10.0
- Wage-earner scheme 4.9 1472.87
% of beneficiaries entitled to the guaranteed minimum pension 20% (October 2008)
- Self-employed scheme 0.7 284.58
% of beneficiaries entitled to the guaranteed minimum pension 60%
- civil servants’ scheme 3.1 344.5
- assistance scheme (GIEP) 0.1 89.19
- « prepension » 0.4 113.6
% of beneficiaries reaching the ceiling 96%
- disability 0.8 243.4
% of beneficiaries entitled to the minimum allowance in the wage-earner scheme
56%
Second pillar 1.1 187.7
of which sectoral schemes instated by the Law of 2003 0 .03 (2004-2005 estimate)
N/A
Third pillar N/A N/A
7 Doubling counting of pensioners receiving benefits from the wage-earner and self-employed schemes are avoided. When pensioners receive a pension from both schemes, it is classified either in the wage-earner scheme or in the self-employed scheme depending on the level of the pension. 8 See footnote 2 above. 9 For more than 80% of the beneficiaries, the GIEP is a complement to their pension.
47

In 2007, pension expenditure within the first pillar, including “prepension” and disability allowances, amounts to 10% of GDP, whereas pension expenditure within the second pillar only amounts to 1,1% of GDP. No estimate is available at this stage for pension expenditure in the third pillar. It has to be noted that concerning the pensions of the second pillar, a new law was voted in 2003, i.e. the Law on additional pensions of 28 April 2003. The law is centred on sectoral pension schemes and is aimed at stepping up the development of these pensions by improving the access to them and by giving more guarantees to workers. The scheme only starts to develop. For the time being, there is not enough data available regarding the second pillar to model it and to make relevant pension expenditure projections.
1.2. Reforms of the pension system included in the projections
1.2.1. Reforms already included in the projections of 2006 – The Pension Reform of 1997 for wage earners and self-employed workers will continue
up to 2009. Its implementation aimed mainly at gradually increasing the retirement age of women (from 60 to 65 by 2009). At the same time, the career length giving access to a full pension was increased from 40 to 45 years, while the women’s age limit for getting access to the other forms of replacement income was raised to the legal retirement age. Early retirement (from the age of 60) was submitted to a career condition of 35 years as from 2005. A "minimum claim per working year" was introduced in the wage-earner scheme.
– Act of 12 August 2000: introduction of age bonuses in the civil servants’ scheme for those retiring after the age of 60.
– The minimum old age pension and the minimum survivor’s pension were raised several times in the general schemes for wage earners and for the self-employed from 2003.
– The scheme of guaranteed income for elderly persons (GIEP) was reformed on 1 June 2001. Before 2001, the amount of the allowance depended mainly on the marital status (married or not). Since 2001, the allowance has been individualized and cohabitants are distinguished from single persons on the basis of their place of residence (shared or not). The basic amount of the guaranteed income has been increased significantly since the reform of 2001.
– Several adjustments to living standards were done between 2000 and 2005, and the projection of 2006 had already anticipated the Generation Pact in that respect (see 1.2.2. below).
1.2.2. The Generation Pact (December 2005)
Incentives:
– The conventional “prepension” age has been raised from 58 to 60 years as from 2008 and the career condition has also been raised for men en women (see table at 1.1. above).
– In the pension scheme for wage earners, the wage ceiling has been split in two as from 2007: the first ceiling is applied to the wages and to the allowances received for illness and disability periods. The second ceiling applies to other allowances received in case of unemployment, prepension and full-time and part-time career breaks. Only the first ceiling will be adapted every two years according to the Law on Pension Reform
48

passed in 1996. When the difference between the two ceilings reaches a certain level, the second ceiling is adapted.
– As from 2007, a pension bonus is granted for each working day after the age of 62 or to those who have a full career of 44 years, both in the wage earner and the self-employed scheme.
– Adjustment of the “penalty” in the scheme for self-employed workers: instead of losing 5% per year of early retirement between the age of 60 and 64, the self-employed worker will lose 25% when retiring at the age of 60, 18% at 61, 12% at 62, 7% at 63 and 3% at 64. Workers whose career is at least 43 years long are not penalized.
– Easing of the conditions that allow pensioners to work after the legal retirement age, but tightening of the conditions for working during early retirement.
Adaptation to living standards
From 2008 onwards, the government must provide for a budget covering an annual growth of 1.25% for the wage ceilings and the minimum claim per working year, an adjustment to living standards of 0.5% for the non lump-sum allowances and a real growth of 1% for the lump-sum allowances. Note that the 0.5% adjustment to living standards is applied to wage-related benefits and that wage developments have a significant impact on the growth of these benefits. The parameters for the adaptation to living standards as stated in the Generation Pact were introduced in the projection, and the benefits were adjusted accordingly. However, in practice, various types of adaptations to living standards can be implemented.
1.3. Unchanged legislation and/or unchanged policy
The long-term modelling of the social expenditure has been carried out under the hypothesis that the legislation remains unchanged. However, all reforms mentioned above were incorporated in the modelling.
2. Pension expenditure projections
The Belgian model covers the statutory public scheme (first pillar), comprises three main pension schemes: the general scheme for wage earners, the scheme for self-employed workers and the one for civil servants. The model also includes the “prepensions”, the disability benefits and the assistance scheme (guaranteed income for elderly persons), as they also are included in the AWG projection for pension expenditure. The second and the third pillars have not been introduced yet into the model as, on the one hand, there is a lack of reliable and detailed data, and, on the other hand, because the importance of those schemes is still relatively marginal (see Table 1).
2.1. Overview of projection results
The next table presents the results of the projection for public pension expenditure, as well as an estimate of the tax on public pension, expressed as a percentage of GDP.
49

Table 2: Projected gross pension spending, tax on pension and contributions (% of GDP) 2000 2007 2020 2030 2040 2050 2060 Peak year
* Public pension expenditure 10.0 10.0 11.8 13.9 14.6 14.7 14.7 2056 Old-age and early pensions
9.3 9.2 11.0 13.1 13.9 14.0 14.0 2056
Other Pensions 0.7 0.8 0.8 0.8 0.7 0.7 0.7 2018 Occupational pensions : : : : : : : : Private pensions : : : : : : : : Mandatory private 0.0 0.0 0.0 0.0 0.0 0.0 0.0 : Non-Mandatory private : : : : : : : : Total pension expenditure 10.0 10.0 11.8 13.9 14.6 14.7 14.7 2056 Taxes on public pensions : 1.3 1.5 1.9 2.0 2.0 2.0 2057 Taxes on private pensions : : : : : : : :
Public pension expenditure increases by 3.9 percentage points of GDP between 2007 and 2030. After this period, between 2030 and 2060, pension expenditure increases only by 0.9 percentage point of GDP. The old age (including survivors’) pension and early retirement pension are jointly responsible for those rises; the other pensions, i.e. the disability allowances, remain stable or decline slightly. The tax on public pension is comprises the contributions and the personal income tax paid by the pensioners. The assumption is made that the contribution rate and the income tax rate remain constant over the whole period. As a result of the rising old age pensions, tax on public pension also increases from 1.3% of GDP in 2007 up to 2.0% of GDP in 2060. To have a more detailed view of the results for pension expenditure, Table 3 shows them by scheme in percentage of GDP. For Belgium, the following breakdown is relevant: the wage earner scheme, the self-employed scheme, the civil servants scheme, the assistance scheme, the “prepension” and the disability benefits.
Table 3 : Projected gross public pension spending: by scheme (% of GDP) 2000 2007 2020 2030 2040 2050 2060 Peak
year Total public pensions 10.0 10.0 11.8 13.9 14.6 14.7 14.7 2056 of which
- wage earner scheme 5.1 4.9 5.9 7.1 7.6 7.7 7.7 2057 - self-employed scheme 0.7 0.7 0.8 0.8 0.8 0.8 0.7 2035 - civil servants’ scheme 2.9 3.1 4.0 4.8 5.0 5.1 5.2 2060 - assistance scheme 0.1 0.1 0.1 0.1 0.1 0.1 0.1 2036 - prepension 0.5 0.4 0.3 0.3 0.3 0.3 0.3 2000 - disability 0.7 0.8 0.8 0.8 0.7 0.7 0.7 2018
Together, the wage earner scheme and the civil servants scheme make up 80% of the total public pension expenditure and this proportion goes up to 87% in 2060. Indeed, the expenditure within those two schemes are increasing by 5.0 percentage points of GDP between 2007 and 2060, while the other schemes are slightly decreasing by 0.2 percentage points of GDP. The pension expenditure in the wage earners’ scheme (more than 50% of the total expenditure) are rising by 2.9 percentage points of GDP between 2007 and 2060, of which 2.2 percentage points between 2007 and 2030, whereas the pension expenditure within the civil servants’ scheme (35% of the total expenditure in 2060) is increasing fast up to 2030 (+1.6 percentage points of GDP), and then at the slower pace of 0.5 percentage points of GDP.
50

The breakdown of old age pensioners by scheme is driven by the evolution of employment by scheme (see the Annex on model description). The employment breakdown by scheme (wage earners, self-employed and civil servants) is made according to the following hypotheses. Until 2013, the model uses medium-term national projections10 for self-employment and the civil servants. In the long run, the evolution of public sector employment is the result of two developments: the development of the active population as far as it comes to the administration and the evolution of the school population in the education sector. The growth of self-employment is also driven by the active population. Over the whole projection period, employment growth in the wage-earner scheme is thus higher (0.2% annual average growth rate) than in the public sector (0.1%). The evolution of self-employment is even less dynamic (0.05%). The pension expenditurein the other schemes remain stable more often than not, some even showing a light decrease, such as the prepension system (because of a reducing number of beneficiaries and of the gap between wage ceiling adjustment and wage growth) and the disability scheme. After a slight increase up to round about 2020 due to the rising number of beneficiaries, the expenditure within this latter scheme decreases until 2060.
2.2. Description of the main driving forces behind the projection results
To have a better understanding of the evolution of projection results for pension expenditure, the standard breakdown of the ratio of pension expenditure to GDP into four explanatory factors is very useful: the dependency ratio (ratio of the population aged 65 and more to the population aged between 15 and 64), the coverage ratio (number of pensioners to population aged 65 and more), the reversed employment rate (population aged 15-64 to the people in work) and the benefit ratio (average pension to labour productivity). Table 4 shows the contribution of those four driving factors to the evolution of pension expenditure.
Table 4: Factors behind public pension expenditure between 2007 and 2060 (in percentage points of GDP)
2007-20 2020-30 2030-40 2040-50 2050-60 2007-60 Public pensions to GDP 1.8 2.0 0.8 0.1 0.0 4.8
Dependency ratio 1.8 2.7 1.7 0.6 0.7 7.4 Coverage ratio 0.1 -0.5 -0.4 0.1 -0.2 -0.9
1/Employment rate -0.5 0.1 -0.1 0.0 0.0 -0.5 Benefit ratio 0.5 -0.1 -0.5 -0.5 -0.5 -1.0
Over the whole projection period (2007-2060), the overall rise in public pension expenditure (+4.8 % of GDP) results from the evolution of the dependency coefficient (+7.4 %), while the other factors negatively contribute to the result. Indeed, the employment rate slightly increases (+0.5 %), whereas both the benefit ratio and the coverage ratio11 recede (-1 % and -0.9 % respectively). 10 Federal Planning Bureau, Perspectives économiques 2008-2013, May 2008 11 Note that if the coverage ratio (defined as the ratio between the number of pensioners and the population older than 64) decreases, it mainly reflects changes in the structure of the population aged 55 and more and the fact that retirement is quite important before 65. The coverage ratio for the 55-64 population (pensioners of the 55-64 years group divided by population between 55 and 64 years old) is more or less constant (around 39%) and the strictly defined coverage ratio for
51

The analysis of the contributing factors on the basis of shorter periods of time does not differ in any fundamental way from the general analysis. However, as we have already mentioned, the rise in pension expenditure mainly occurs before 2040, in the wake of the fast growth of the dependency coefficient, which is partly compensated by the increasing employment rate (between 2007 and 2020) and the decreasing coverage ratio. At the start of the projection period, from 2007 to 2020, the benefit ratio positively contributes to the rise in pension expenditure due to different factors: – the temporary increase in the percentage of young retirees due to the baby-boom
generations in a context where new retirees benefit from higher pensions than old retirees as far as pension benefit grow slower than productivity and wages. The percentage of retirees aged 70 and more is 69.4% in 2007, 62.2% in 2020 and 72.3% in 2060.
– The growing number of female pensioners also contributes to the increase in the percentage of young retirees.
– The temporary increase in the percentage of civil servants retirees due to the demographic structure of public employment. The percentage of civil servants retirees compared with the total retired population is 16.4% in 2007, 17.4% in 2020 and 16.4% in 2060.
– The introduction of systematic partial adaptation to living standards since 2007 (see 1.2.2.) has a positive impact on the benefit ratio as long as the system has not reached maturity (around 2020).
– The lower growth rate of wage and productivity at the beginning of the simulation period.
As from 2020, the negative influence of the benefit ratio begins to show. Between 2040 and 2060, the positive contribution of the dependency coefficient is almost completely compensated by the negative contribution of the benefit ratio. Nevertheless, the overall benefit ratio is strongly influenced by the benefit ratio in the wage-earner scheme, which is structurally decreasing as a result of several factors: the wage ceiling has only been adapted to the evolution of prices between 1982 and 1998, and not to the evolution of the living standard, which has an influence on the pension of the new generations of pensioners; in the projection, a difference remains between the adjustment of the wage ceiling by 1.25 % of real growth and the evolution of productivity; in the projection, the (0.5 %) adjustment to living standards is only partial as compared to the evolution of salaries; more and more households get two pensions at the single rate (60% of the reference wage) instead of one pension at the family rate (75% of the reference wage); and, finally, the increasing percentage of female pensioners with lower pension benefits. In addition, the evolution of the gross average replacement rate of the first pension (only old-age and early retirement pensions) of those who retire in a given year over an economy-wide average wage in the same year is given in Table 5 for the public pension expenditure.
the 65 and more (ratio between the number of pensioners older than 64 and the population older than 64) is increasing, from 103% in 2007 to 110% in 2060, reflecting mainly increasing female labour market participation. However the weight of the 55-64 population in the 55 and more population is decreasing: from 41% in 2007 to 30% in 2060. It explains the decrease of the coverage ratio.
52

Table 5: Replacement rate and coverage by pension scheme (in %) 2000 2007 2020 2030 2040 2050 2060
Public pension expenditure : 44.7 45.5 44.2 42.8 42.4 41.7 Coverage 100.0 100.0 100.0 100.0 100.0 100.0 100.0
Occupational scheme : : : : : : : Coverage : : : : : : :
Private scheme : : : : : : : Coverage : : : : : : :
Up to 2025, the gross average replacement rate remains relatively stable (round 45 %) and then steadily decreases until 2060. In order to explain both the level and the evolution of this overall gross average replacement rate, it is worth breaking it down by scheme.
Table 6: Replacement rate by scheme (in %) 2000 2007 2020 2030 2040 2050 2060
Wage earner scheme 30.8 35.5 36.1 34.6 32.8 32.2 31.3
Self-employed scheme : 25.9 23.8 21.8 20.7 19.5 18.3
Civil servants scheme : 67.9 67.2 65.6 64.1 63.8 63.0
The overall gross average replacement rate is an average, but the level of the various replacement rates in each scheme varies enormously: it is highest in the civil servants’ scheme (around 68 % at the start of the projection period) and lowest in the self-employed's (at about 26 %), with the wage-earner somewhere in between (at around 35 %). These discrepancies are no surprise as they are linked to the way pensions are calculated in the various schemes. As a reminder, pensions in the civil servants’ scheme are calculated on the basis of wages earned over the last five working years, whereas in the wage-earner and self-employed schemes, they are calculated on the basis of the income (possibly up to a ceiling) earned over the whole career. Besides, many pensioners in the self-employed scheme are only entitled to the minimum pension. In the projection, the gross average replacement rate decreases in each scheme, but at a different pace: between 2007 and 2060, it decreases from 67.9% to 63% in the civil servants’ scheme (-4.9 percentage points) and from 35.5% to 31.3% in the wage-earner scheme (-4.3 percentage points) for the abovementioned reasons, whereas the strongest decrease is expected in the self-employed scheme from 25.9% to 18.3% (-7.6 percentage points). Table 7 presents the number of pensions and contributors in the social security scheme. Note that the Belgian projection model provides the number of pensions and not the number of pensioners because there is still some double counting in the database between the general scheme (wage earners and self-employed) and the civil servants scheme.
53

Table 7 : Number of pensions and contributors in the Social security scheme (in thousands), population over 65 and total employment (in thousands) and related ratios (%)
2000 2007 2020 2030 2040 2050 2060 Number of pensions (I) 2423 2548 3126 3655 3992 4180 4303 Number of people aged 65+ (II) 1715 1810 2209 2686 3012 3134 3260 Ratio of (I) and (II) 141 141 142 136 133 133 132 Number of contributors (III) 4142 4406 4817 4785 4783 4786 4780 Employment(IV) 4093 4346 4723 4653 4662 4669 4652 Ratio of (III) and (IV) 101 101 102 103 103 103 103 Ratio of (III) and (I) 'support ratio' 171 173 154 131 120 114 111
The number of pensions consists, on the one hand, of early retirement, old-age and survivor’s pensions (86% of the total in 2007) and, on the other hand, of “prepension” and disability allowances (14% of the total in 2007). In projection, the number of the first type of pensions is increasing at the same growth rate as the population aged 65 and more: 1.1% annual average growth between 2007 and 2060. While the second type of pensions, “prepension” and disability, is only rising with an average growth of 0.15% per year (the number of “prepensions” is even decreasing). On the whole, the number of pensions increases on average with 1.0% per year in the projection period. As a consequence, the ratio of the number of pensions to the number of people aged 65 and more slowly decreases until 2038 and remains almost stable afterwards. We have already noted that this decrease can be explained by a change in the structure of the 55 and older population (ageing decreases the weight of the 55-64 years old in this population) and the fact that retirement is quite important before 65. The number of pensioners of 65 and more is increasing with an average growth of 1.2% per year, mainly reflecting the increasing female labour market participation. In the Belgian model, as the number of contributors is the number of working people (administrative concept – see the Annex), the ratio of the number of contributors to the total employment has no use. The number of contributors presents an annual average wage growth of 0.2% between 2007 and 2060. The last ratio of Table 7 is called the support ratio and is defined as the number of contributors relative to the number of pensions. This ratio declines from 173% in 2007 to 111% in 2060 as a result of the greater rise of the number of pensions than that of the contributors. Still, the number of contributors remains higher than the number of pensions. Finally, Table 8 shows the evolution of the assets of the Ageing Fund in percentage of GDP. This Fund was established in 2001 by the Law guaranteeing a continuous reduction in public debt and the setting up of the Ageing Fund. The goal of the Fund is to build up a demographic reserve to finance the supplementary expenses pertaining to the public pension schemes due to ageing during the period 2010-2030, as long as the public debt has been reduced to 60% of GDP. As the assets of the Ageing Fund must be invested in public debt securities, investing in the Ageing Fund in fact means decreasing the public debt. This virtual construction is important, however, in terms of commitment of the Federal government to increasing the transfers to social security according to the budgetary cost of ageing for pensions, while ensuring sustainability of public finances as a whole.
54
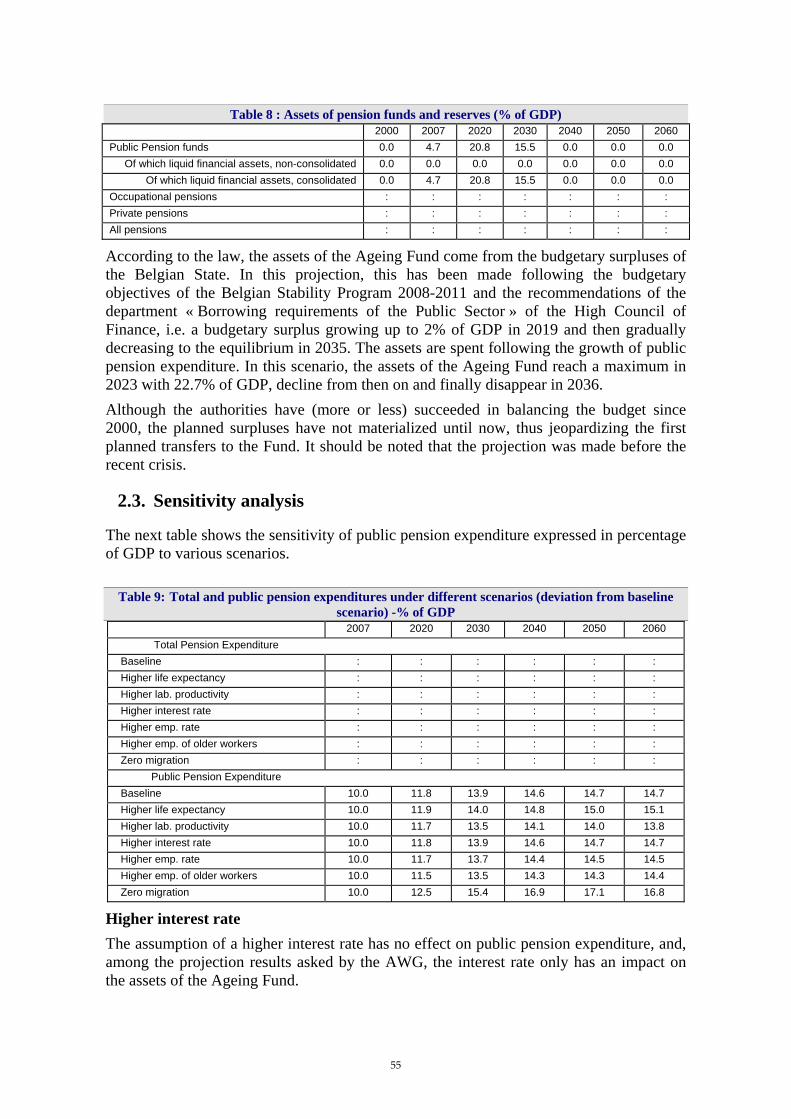
Table 8 : Assets of pension funds and reserves (% of GDP) 2000 2007 2020 2030 2040 2050 2060
Public Pension funds 0.0 4.7 20.8 15.5 0.0 0.0 0.0 Of which liquid financial assets, non-consolidated 0.0 0.0 0.0 0.0 0.0 0.0 0.0
Of which liquid financial assets, consolidated 0.0 4.7 20.8 15.5 0.0 0.0 0.0 Occupational pensions : : : : : : : Private pensions : : : : : : : All pensions : : : : : : :
According to the law, the assets of the Ageing Fund come from the budgetary surpluses of the Belgian State. In this projection, this has been made following the budgetary objectives of the Belgian Stability Program 2008-2011 and the recommendations of the department « Borrowing requirements of the Public Sector » of the High Council of Finance, i.e. a budgetary surplus growing up to 2% of GDP in 2019 and then gradually decreasing to the equilibrium in 2035. The assets are spent following the growth of public pension expenditure. In this scenario, the assets of the Ageing Fund reach a maximum in 2023 with 22.7% of GDP, decline from then on and finally disappear in 2036. Although the authorities have (more or less) succeeded in balancing the budget since 2000, the planned surpluses have not materialized until now, thus jeopardizing the first planned transfers to the Fund. It should be noted that the projection was made before the recent crisis.
2.3. Sensitivity analysis
The next table shows the sensitivity of public pension expenditure expressed in percentage of GDP to various scenarios.
Table 9: Total and public pension expenditures under different scenarios (deviation from baseline scenario) -% of GDP
2007 2020 2030 2040 2050 2060 Total Pension Expenditure
Baseline : : : : : : Higher life expectancy : : : : : : Higher lab. productivity : : : : : : Higher interest rate : : : : : : Higher emp. rate : : : : : : Higher emp. of older workers : : : : : : Zero migration : : : : : :
Public Pension Expenditure Baseline 10.0 11.8 13.9 14.6 14.7 14.7 Higher life expectancy 10.0 11.9 14.0 14.8 15.0 15.1 Higher lab. productivity 10.0 11.7 13.5 14.1 14.0 13.8 Higher interest rate 10.0 11.8 13.9 14.6 14.7 14.7 Higher emp. rate 10.0 11.7 13.7 14.4 14.5 14.5 Higher emp. of older workers 10.0 11.5 13.5 14.3 14.3 14.4 Zero migration 10.0 12.5 15.4 16.9 17.1 16.8
Higher interest rate The assumption of a higher interest rate has no effect on public pension expenditure, and, among the projection results asked by the AWG, the interest rate only has an impact on the assets of the Ageing Fund.
55

Higher productivity scenario
In this scenario, with productivity gains higher than 0.25 percentage point and with unchanged parameters regarding the adjustment mechanisms to living standards, public pension expenditure in percentage of GDP is lower than in the baseline (up to -0.9 percentage point of GDP in 2060). Expenditure for public sector pensions remains constant in percentage of GDP. Indeed, higher wages are directly mirrored in pensions because of the calculation mode (the reference wage for the people recently retired is the average wage over the last five working years) and of the indexation of pensions to salaries. On the other hand, pension expenditure in the wage-earner scheme is calculated on the basis of the income earned over the whole career, which means it only progressively reflects the effect of the higher productivity, whereas GDP grows immediately. As a result, the weight of these pensions expressed in percentage of GDP is reduced. The phenomenon also applies to the pensions in the self-employed scheme, but to a lesser extent because of the high number of people receiving a guaranteed minimum pension. The decrease in the pension expenditure for the self-employed workers, expressed as a percentage of GDP, is mainly due to the difference between the growth of the guaranteed minimum pension (1% real growth) and the economic growth.
Higher life expectancy scenario
This scenario generates higher public pension expenditure compared to the baseline scenario (+0.4 percentage point of GDP in 2060), because of the higher number of pensioners. The higher dependency coefficient wholly explains this evolution.
Zero-migration scenario
Public pension spending rises very significantly in the “zero-migration scenario”, up to a maximum rise of 2.4 percentage point of GDP in 2046 compared to the baseline. This discrepancy is due to the growing importance of the demographic dependency coefficient, as the working-age population (between 15 and 64 years) is markedly reduced by the total absence of migration. The lower working-age population generates in turn a heavy cut in employment, hence a much lower economic growth, which increases the relative weight of pension expenditure in percentage of GDP. As from 2046, the discrepancy in % of GDP with the baseline slowly decreases to reach 2.1 percentage point of GDP by 2060, as a result of the lower number of pensioners, itself a consequence of the absence of migration.
Higher employment rate scenario
A higher employment rate leads to a decrease in pension expenditure by 0.2 percentage point of GDP by 2060 in comparison with the baseline, because of a higher GDP.
Higher employment rate of older workers scenario
The scenario with a higher employment rate of the older workers leads to a decrease by 0.4 percentage point of GDP by 2060 in comparison with the baseline because of a higher economic growth and a strong cut in the number of prepensions.
56

2.4. Description of the changes in comparison with the 2001 and 2006 projections
Table 10 compares the evolution of the ratio of public pension expenditures to GDP in the period 2007-2050 between the three sets of projections (2001, 2006 and 2009). It also shows the variation of the four driving factors behind this evolution.
Table 10: Breakdown of the change in public pension expenditure (in % of GDP) between 2007 and 2050 under the 2001, 2006 and 2009 projection exercises
% Change to 2050
Dependence ratio
Coverage ratio
Employment effect
Benefit ratio
Pension/GDP - 2001 3.3 5.2 0.9 -0.9 -2.0 Pension/GDP - 2006 5.1 7.7 -0.4 -0.9 -1.2 Pension/GDP - 2009 4.8 6.7 -0.7 -0.5 -0.7
In the 2001 exercise, public pension expenditure underwent an increase of 3.3 percentage points of GDP between 2007 and 2050, owing to a 5.2 % growth of the dependency coefficient, partially compensated by a 2 % decrease of the benefit ratio. In the 2006 projection, the increase was 5.1 percentage points over the same period. There are two main reasons for this marked rise compared to 2001: firstly, a demographic factor, with an increase in life expectancy and in the old age dependency ratio and, secondly, an increase in adjustments to living standards (see the benefit ratio in Table 10). Indeed, in 2001, adjustments to living standards were based on historical trends which were showing a difference of 1.75 percentage points with wage growth. With respect to this difference, the adjustment to living standards of the non lump-sum allowances was null in the 2001 projection (and only 0.5% growth for the lump-sum benefits), while the 2006 projection exercise had already anticipated the Generation Pact and introduced parameters for adjustments to living standards (0.5% growth for the non lump-sum benefits and 1% growth for the lump-sum benefits). In the current projection, the variation of public pension expenditure is 4.8 percentage points of GDP, i.e. a slightly smaller variation than in the preceding exercise. This is mainly due to a more limited positive contribution of the dependency coefficient, while the downward contributions of both the inverted employment rate and the benefit ratio are less marked than in the preceding exercise. As far as adjustments of the benefits to living standards are concerned (benefit ratio), these are based on the Generation Pact. By comparison with the 2006 exercise, this implies a difference in the adjustment level of wage ceilings: in the 2009 exercise, these ceilings evolve on the basis of a real growth of 1.25 % irrespective of wage growth, whereas in the preceding exercise, wage ceilings would evolve at a growth rate which was 0.5 % inferior to productivity growth. Moreover the Generation Pact implies an increase in the pension benefits of wage earner and self-employed schemes after the age of 62 (pension bonus). Both factors explain the less downward contribution of the benefit ratio in the 2009 projection. The coverage ratio contributes downward a little bit faster in this exercise. The reform of the prepension’s scheme and the pension bonus explain it. The new modelling of the
57

number of female pension beneficiaries (see the description of the pension model in the Annex) also contributes to this difference.
58
Bulgaria (Report prepared by Dimitar Vassilev, Tsvetelina Dimitrova and Antoaneta Gancheva)
1. Overview of the pension system
The three-pillar pension system in Bulgaria is based on the principle of security through diversity and includes the following main elements:
1.1. The public system of mandatory pension schemes of pay-as-you-go type (I pillar)
It represents a substantial modification of the former mandatory PAYG scheme. It introduces the single concept of insurance income as a base for the monthly calculation of social insurance contributions referring to the Law on the Public Social Insurance (PSI) Budget, where the minimum and maximum monthly amounts of the insurance income in the course of the calendar year are defined (for part-time workers the minimum insurance income is defined proportionally to legal working hours or days). The law also has provisions defining the amount of social insurance contributions that have to be paid by insured persons, employers and self-insured persons on annual basis for each fund. The categories of insured persons are differentiated depending on the number and types of social insurance risks against which they must be insured depending on the activity pursued by the persons - mandatory public social insurance for all social risks; mandatory public social insurance for disability, old age, death, accidents at work and occupational disease; mandatory public social insurance for disability due to general disease, old age and death. One of the key new elements in the first pillar was the division of the social insurance contributions by type of insurance event and the establishment of separate funds, namely Pensions Fund, Accidents at work and Occupational Disease Fund, General Disease and Maternity Fund, Unemployment Fund. These funds are financed mainly by the contributions for the respective type of insurance risk. Social insurance contributions of civil servants, military and police servants are at the expense of the state. Self-insured persons pay the whole contributions amount at their own expense. In 2008 the rate of social insurance contributions12 is as follows: – for the Pensions Fund is 22% (for the persons born after 1.1.1960 5% of these 22% are
transferred to the 2nd pillar); – for the Accidents at work and Occupational Disease Fund the rate is between 0.4 and
1.1% (0.65% on average; differentiated by the type and degree of risks for main groups of economic activities; these contributions are only at the employers expense);
– for the General Disease and Maternity Fund it is 3.5%; for the Unemployment Fund it is 1%.
The deficit of the Pension’ Fund is covered by subsidy from the government budget on an annual basis The fifth fund - for pensions not related to labour activities, is financed by transfer from the government budget. The revenues from the social insurance contributions are used for the pension benefits not only for the pensions for periods of insurance and old age, but also for the all other 12 To the annual social insurance income.
59

contributory pensions (general disease pensions and survivors’ pensions). Not all pensions are paid out by the Pensions Fund. Pensions for accidents at work and occupational disease are disbursed by the Accidents at work and Occupational Disease Fund. All non-contributory pensions are paid by the Pensions not related to the labour Activity Fund. This pillar is managed by the National Social Security Institute (NSSI) whose Governor and Deputy Governor are elected by the National Assembly. There is also a three-party supervision body that is composed of representatives of workers, employers and the government. The NSSI is responsible for the calculation and disbursements of pension benefits, as well as the other social insurance benefits as temporary disability benefits, unemployment benefits, maternity indemnifications, etc., paid by the PSI. Since 1 January 2006 mandatory social insurance contributions are collected by the National Revenue Agency. This structure was established in order to promote better collection of tax and contributions revenues. This reform brought amendments to the tax and social insurance legislation. This pillar introduces a close link between the amount of benefits received and the financial contribution of each insured persons. It also provides for optimal distribution of the insurance burden among the insured persons, and the employers. Last but not least, it ensures new and more restrictive requirements for eligibility of pensioners to receive pensions for periods of insurance and old-age. This pillar also creates legal mechanisms and stimuli for increased collectability of social insurance contributions, while at the same time it strengthens current control over insurance revenues and payments. Following the principle of mandatory participation and universality, the first pillar covers all economically active persons (III labour category13). The terms and conditions for access to the public social insurance are universal and do not depend on the form of activity of the insured people. On the other hand, there is a differentiation among the categories of insured people, depending on the already mentioned above number and types of social insurance risks for which they must be covered. The first group of insured persons14 includes persons working under labour contracts or equivalent – people hired for more than 5 days or 40 hours per calendar month, civil servants and employees; judges; public prosecutors; examining magistrates; persons on military service; cooperative society members; persons working under second or supplementary labour contract; executors on management and control contracts for trade companies; etc. This is the largest group of insured persons; they are mandatorily insured for all social risks. The second group includes persons insured only for disability, old age, death, accidents at work and occupational disease, covering workers and employees hired for less than 5 days or 40 hours per calendar month. Till 1 January 2002, these persons were insured at the employers’ expense, but only for accidents at work and occupational disease risks. With the amendments in the Social Insurance Code (SIC) as of 1.1.2002 this group was given the opportunity to attain pension rights.
13 In Bulgaria three labour categories were determined: first, second and third. Workers working under conditions of first and second labour categories are miners, pilots, metal-workers and so on, their work is called ‘labour at risk’. Workers not included in the labour categories first and second work under conditions of third labour category. The last category comprises around 90% of working people in Bulgaria. Source: Ordinance for Categorization of Labour at the Time of Retirement – promulgated in SG issue 123/23.10.1998. 14 Groups of insured persons and respective risks are defined in more detail in the Social Insurance Code (SIC).
60
The third group of insured persons includes only disability due to general disease, old age and death, covering self-insured persons (liberal professions; artisans; owners or partners of trade companies; agricultural producers) and persons working without labour contracts. Self-insured persons may broaden their social insurance coverage through inclusion of the all social insurance risks with the exception of accidents at work, unemployment and occupational disease risks. A person that attains the right of “full” pension for periods of insurance and old-age (a person that has obtained a full period of insurance and has reached the statutory retirement age), but with lower income during social insurance periods is entitled to receive a minimal pension for periods of insurance and old age. As of 1 July 2006, minimal pension for periods of insurance and old age and minimal survivors’ pension have been de-linked from the social pension for old-age. Since 1.7.2006, the size of these types of pensions has been linked to the “full” pension for periods of insurance and old age. According to Bulgarian legislation, only contributive pensions are inheritable. Thus the legislation also allows a combination between pension benefits - some pensions for periods of insurance and old age could be coupled with pensions not related to labour activity (non-contributory pensions) under the condition that the person chooses to receive the full amount of one of the pensions. The other pensions are received at half of their full size (the only exception is the social disability pension that could be received at 25% of its full size). Persons with at least 15 years of insurance have a right to receive pension benefits at the age of 65; the amount of the benefit can not be lower than 85% of minimal pension for periods of insurance and old-age. Persons at the age of 70 or above are eligible to social pension for old age if the average income of their family is lower than the guaranteed minimal income for the respective year as well as if no other pension has been granted.
1.1.1. Indexations
As of 1 July 2007 the pensions have been indexed under the so-called “golden Swiss rule”. The amendments to the Social Insurance Code (SIC)15, which entered into force at the beginning of 2007, put into effect the decision that pensions’ indexation will be carried out in the middle of the year. They will be calculated according to a formula that comprises 50% of the increase in the national consumer price index (CPI) and 50% of the insurance income growth during the previous calendar year.
15 Amendments in the SIC promulgated in SG issue 104/27.12.2005.
61

Table 1: Indexation rules in more detail Period Indexation rule % increase
2006 75% of Insurance income growth + 25% of CPI growth 5% as of 1 January 2006
2006 4.5% as of 1 July 200616
2007 50% of Insurance income growth + 50% of CPI growth 10% as of 1 July 2007
2007 10% as of 1 October 2007
2008 50% of Insurance income growth + 50% of CPI growth 10.35% as of 1 July 2008
Source: SIC, Law on the Public Social Insurance Budget 2007
Besides, pension indexation during the period 2005-2007 was based on discretionary decisions of the government. The pensions were indexed twice in 2007 – first, in line with the schedule on 1 July 2007 (by 10%, or 1.5 percentage points more than in the original plans), and on 1 October 2007 by another 10% due to over performance on the revenue side of the PSI budget, as well as due to the expectations for realised savings in the PSI budget. The amount of the pension benefit depends on the social insurance period, the individual pension coefficient and the average monthly insurance income in the country. The size of the individual coefficient depends on the insurance income for the period after 1996. For the period before 1997 the three best years (with highest insurance income) are also taken for the calculation. The following formula17 for calculating the pension for periods of insurance and old-age is used:
P = AMII * IPC * SIP * 1%,
where:
P – Individual pension; AMII – Average monthly insurance income for 12 months before attainment of pension rights; IPC – Individual pension coefficient SIP - Social insurance period or equivalent; The weight of 1 year of payments of contributions/ periods of insurance is 1%.
1.1.2. Retirement age
In 2000 a new system was introduced, according to which the right to retire depends on acquiring certain amount of years covering periods of insurance and the required retirement age. In 2008 this sum was increased by one for women reaching 94, 100 points for men were attained in 2002.
16 Only for the pension benefits up to BGN 150 (EUR 77). 17 In force as of 1 January 2000, SIC SG issue 110/17.12.1999.
62

Table 2: Requirement for attainment of pension benefits Sum of required age and years covering periods of
insurance Years of age
All labour categories I labour category II labour category III labour category Year
Men Women Men Women Men Women Men Women
2000 98 88 52 47 57 52 60.5 55.5
2001 99 89 52 47 57 52 61 56
2002 100 90 52 47 57 52 61.5 56.5
2003 100 90 52 47 57 52 62 57
2004 100 90 52 47 57 52 62.5 57.5
2005 100 91 52 47 57 52 63 58
2006 100 92 52 47 57 52 63 58.5
2007 100 93 52 47 57 52 63 59
2008 100 94 52 47 57 52 63 59.5
2009 100 94 52 47 57 52 63 60
Source: National Social Security Institute (NSSI)
Since 2000 the third category labour workers retirement age has been consecutively raised by 6 months per calendar year, until reaching 63 for men in 2005, and 60 for women in 2009. If the requirements above are not met, workers will not be able to retire until they reach age of 65 unless they have at least 15 years of insurance length of service, 12 of them real.
1.2. Supplementary mandatory pension insurance (II pillar)
The supplementary mandatory pension insurance is capital-based with defined contributions, which are accumulated and capitalized in individual accounts. They are organized and administered by pension insurance companies (joint-stock companies), which have been issued pension licenses. The regulation of their activities and the supervision is executed by the Financial Supervision Commission (FSC). The supplementary mandatory pension insurance supplements the first pillar and creates opportunities for increasing the replacement ratio. It also allows for increasing the labour income replacement coefficient without increasing the social insurance burden. This pillar is composed of 2 types of funds: universal pension funds (UPF) and professional pension funds (PPF). The supplementary mandatory pension insurance is based on monthly contributions to a universal and/or professional pension fund with the value of the contributions being defined in the Social Insurance Code. The contribution to PPF is 7 % for II labour category and 12 % for I labour category, with the entire contribution being only at the expense of the employer. Under the provisions governing the second pillar(Title II of the SIC), the persons insured under conditions of I labour category may receive benefits 8 years before they reach the statutory retirement age. For the second labour category this option is available 3 years before reaching the statutory retirement age. Pursuant to the SIC the insured in a universal pension fund persons may retire 5 years before they reach the statutory retirement age in case that the resources accrued in their individual accounts are enough for covering the monthly minimum old-age and periods of insurance pension.
63

Pursuant to the Social Insurance Code, the distribution of the contributions paid by the employers and the insured persons for I and II pillars for the respective years is following: for 2000 and 2001 – 80 to 20; for 2002, 2003 and 2004 – 75 to 25; for 2005 – 70 to 30; for 2006 and 2007 – 65 to 35; for 2008 – 60 to 40; for 2009 – 55 to 45 and for 2010 – 50 to 50. The main reason for this change was to reduce the employers’ incentive to report lower wages in order to pay smaller social insurance contributions. The personal scope of the second pillar is narrower than that of the first pillar and it covers only the old age and death risks. The personal scope is more limited too because it covers two categories of persons: – Persons subject to mandatory social insurance in a universal pension fund (UPF), where
all persons insured under the 1st pillar, which were born after 31 December 1959 are included.
– Persons subject to mandatory social insurance in a Professional Pension Fund (PPF), where only persons working under the conditions of I and II labour categories (labour ‘at risk’) are included. The objective is to provide for possibility for them to attain right to a professional time-limited pension for early retirement, which precedes the pension based on the periods of insurance and old-age, without any cumulative effect of the two pensions.
1.3. Supplementary voluntary pension insurance (III pillar)
The supplementary voluntary pension insurance is, like the second pillar, capital-based, and represents the third element of the Bulgarian pension system. It comprises voluntary contributions paid either on one’s own or jointly with the employer or only by the employer without the participation of the insured person in order to provide a life-long or time limited pension for old age or disability, as well as a survivor pension in case of death of the insured person or respectively the person receiving a voluntary pension. The supplementary voluntary pension insurance is based on social insurance contributions paid in cash in the agreed amounts. They are organized and administered by pension insurance companies (joint-stock companies), which have been issued pension licenses. The regulation of their activities and the supervision is executed by the Financial Supervision Commission. As of 1 January 2007 into this pillar were introduced occupational pension schemes, according to the EU legislation. The contributions paid by employers (at the amount of up to 60 BGN) and insured persons(up to 10 % of the taxable income) are tax exempt, while the benefits to be paid may differ between life-long pension, time-limited pension or lump sum.
1.3.1. Recent reforms
In January-September 2007 the rate of the insurance contribution for the Pensions Fund of the Public Social Insurance was 23%. As of October 2007 it was reduced to 22% for the insured persons born before 1 January 1960 and to 17% for the persons born after this date. In addition, since October 2007 the insurance contribution to Unemployment Fund was reduced from 3% to 1%. At present the contribution rate for the Pensions Fund is 22%. A “Silver” Demographic Reserve Fund was established with a view to improve the financial sustainability of the first pillar of the pension system of Bulgaria. The first funds
64

were transferred to it within the deadlines set in the Law on the State Budget for 200718. A Draft Law on the Silver Demographic Reserve Fund is under preparation and is included in the legislative agenda of the National Assembly. The draft law envisages a new mechanism for using the privatisation receipts aimed to strengthen the public pension insurance and to ensure resources for the Silver Fund. Under this new mechanism, except for privatisation receipts, the fund will also be financed by 25% of the budget revenues from concession fees and licenses, but not less than 10% of the budget surplus for the respective year. As of 1 January 2007 the persons that postpone their retirement and do not receive pension have a right to an increase of the weight of their periods of insurance (acquired after reaching of statutory retirement age) in the pension formula. For the 2007 the coefficient in the pension formula was 1.5%, but as of 1 January 2008 it was raised to 3% in order to promote higher employment of persons at the age above statutory retirement age and periods of insurance (37 years for men and 34 years for women). One indexation of the pensions was implemented in 2008. The indexation was made on 1 July, under which all pensions were raised by 10.35% as compared to the originally planned 9.5% increase. As of 1st of October all contributory pensions (pension for labour activity) shall be recalculated on the basis of the average insurance income for 2007 – BGN 398 (EUR 203.58). The amendments to the SIC19 also further liberalize the investment regime for the assets of the pension funds (second and third pillars). The investment instruments, where the supplementary pension funds are allowed to invest their assets were additionally specified, while the investment restrictions have been amended in order to provide for better diversification of funds’ portfolios.
2. Pension expenditure projections
These projections examine the long-term status of the Pension Funds of Public Social Insurance and the Universal Pension Funds for the period 2008-2060. The objective of the analysis is to determine the influence of demographic and economic factors over the sustainability of the Bulgarian pension system. The public social insurance pension scheme and the private (supplementary) mandatory pension funds (UPF) were explicitly introduced in the NSSI pension model. When defining the NSSI pension model it was decided that it should cover only the first and the second pension pillar of Bulgarian pension system. Because of the provisions in the national legislation and the lack of long-term model of forecasting the development of private non-mandatory (third) pension pillar, for the time being it is not possible to make projections of the future developments in this pillar. The actuarial model for long-term projection of development of PSI Budget of the NSSI is used for producing these projections. It adequately reflects the most recent (until August 2008) amendments to the Bulgarian legislation concerning the PSI and the Supplementary Mandatory Pension Funds. It is also in line with the most recent parameters of the Medium-Term Fiscal Framework 2009-2011, which is elaborated by the Ministry of Finance. These parameters include an 8-percentage point increase of the social insurance contribution to the Pensions Fund of PSI, as well as a recalculation of all pensions for 18 By end May 2007. 19 Amendments to the SIC promulgated in SG issue 17/24.2.2006.
65

periods of insurance and old age as of 1 October 2008 using the average insurance income for 2007.
2.1. Extent of the coverage of the pension schemes in the projections
NSSI actuarial model projects the status of the mandatory pension funds – PSI Funds and UPF of Supplementary Mandatory Pension Funds. The schemes covered and not covered in the 2008 AWG projections are described in the table below.
66

Table 3: Schemes included and not included in 2008 AWG projections Schemes covered in the 2008 AWG projections Schemes not covered in the 2008 AWG projections
I. SOCIAL SECURITY PENSIONS I. SOCIAL SECURITY PENSIONS
Old Age Pensions Teachers Pension Fund 1.Old Age and Periods of Insurance Pensions (including
farmers, COOP, military officials) II. SUPPLEMENTARY MANDATORY PENSION INSURANCE
Disability Pensions Professional Pension Funds (PPF)
1.Disability (including farmers, COOP, military officials) - Professional early retirement pension for a limited period for
people working under the conditions of 1st and 2nd labour category;
2. Disability due to Work Injury and Professional Disease (including farmers, COOP, military officials)
- a lump sum payment amounting to up to 50% of the amount accrued in the individual account in case of permanently lost
working capacity over 70.99%;
Pensions not related to labour activity: III. SUPPLEMENTARY VOLUNTARY PENSION FUNDS (VPF)
1.Veterans of War Pensions - Personal old-age pension – life long or time limited;
2.Military Disability Pensions - Personal disability pension - life long or time limited, according to the period of disability;
3.Special Merits Pension (art.28 - abolished) - Survivor’s pension - life long or time-limited
4.Special Merits Pension (art.30A - abolished) IV. SUPPLEMENTARY VOLUNTARY PENSION FUNDS UNDER OCCUPATIONAL SCHEMES
5.Pension for Special Merits - Bulgarian occupational scheme – time limited pension, programmed withdrawal or lump sum.
6.Civil Disability Pensions
- Cross border occupational scheme of foreign sponsoring undertaking, managed by Bulgarian institution – can provide
also coverage for biometrical risks, rate of return and pension benefits level.
7.Private Farmers Pensions
8.Pensions by Decree
9.Social Pensions invalidity
10.Personal Pensions
11.Social Pensions old age SURVIVORS PENSIONS ACCORDING TO RELATIONSHIP
WITH THE DECEASED
1.Widows
2.Child
3.Widows aged 50/60
4.Non-working Widows
5.Disabled Children
6.Non-working Parents
7.Parents
8.Other Survivor II. SUPPLEMENTARY MANDATORY PENSION INSURANCE - UNIVERSAL PENSION FUNDS
1. supplementary life-long old-age pension 2. a lump sum payment amounting to up to 50% of the
amount accrued in the individual account in case of permanently lost capacity over 70.99%;
Source: NSSI
The following pension schemes are not included in these projections:
– Professional Pension Funds of Supplementary Mandatory second pillar, managed by private pension insurance companies. These are mandatory funds for early retirement for persons working under conditions of first and second labour category (labour ‘at
67

risk’). Pension for early retirement from these pensions’ funds will be paid as of 2011, up to this year these pensions are part of PSI first pillar and they are included as such in the pension projections.
– Supplementary Voluntary Pension Funds. These funds include individual pension insurance and insurance under conditions of occupational pension schemes. Individual pension insurance has very narrow scope (only about 2 000 Pensioners are included in it), which makes the projections too problematic. The Supplementary Voluntary Pension Insurance based on occupational pension schemes is still a legal possibility, but these schemes are not operational at present. So far only 2 out of 9 pension insurance companies have applied and have been granted license for managing voluntary pension funds under occupational schemes.
– Teachers Pension Fund – managed by NSSI. This fund will exist at its present form until 2009.
– Supplementary voluntary pension funds under occupational schemes.
2.2. Overview of projection results Table 4: Projected gross pension spending, tax on pension and contributions (% of GDP)
2000 2007 2020 2030 2040 2050 2060 Peak year
Social security pensions 9.4% 8.3% 8.4% 8.6% 9.5% 10.8% 11.3% 2060
Old-age and early pensions 8.3% 6.8% 6.9% 7.1% 8.1% 9.4% 10.0% 2060
Other Pensions (disabl.,surv.,social) 1.1% 1.4% 1.5% 1.5% 1.4% 1.4% 1.3% 2060
Private pensions 0.0% 0.0% 0.0% 0.3% 0.8% 1.4% 1.7% 2060
Mandatory private 0.0% 0.0% 0.0% 0.3% 0.8% 1.4% 1.7% 2060
Non-Mandatory private 0.0% 0.0% 0.0% 0.0% 0.0% 0.0% 0.0%
Total pension expenditure 6.5% 8.3% 8.4% 8.9% 10.3% 12.2% 13.0% 2060
Source: NSSI
The total expenditures for pensions of the Public Social Insurance, as a percentage of GDP, for the whole projection period are increasing. Until 2035 the growth of expenditures is moderate, but in the following years it accelerates. This development reflects the adverse effects of the expected demographic changes in the structure of Bulgarian population. The expenditures for other types of pensions paid by the PSI Budget (as a percentage of GDP) are declining in 2008-2060 mirroring the introduction of more stringent requirements for receiving disability pensions for general disease aimed to limit the number of new pensioners. The pension expenditures of the UPF (as a percentage of GDP) are steadily growing during the whole projection period following the increasing number of pensioners. The number of pensioners will also grow because of the acquisition of pension rights of next generations. The first pensions from UPF will be paid in 202120.
20 According to the Bulgarian pension legislation the first pensions from UPF will be paid in 2015 for female and in 2018 for male, which reaches the early retirement age (5 years before statutory retirement age), otherwise in 2020 for the female and 2023 for the male.
68

2.3. Description of main driving forces behind the projection results and their implications for main items from a pension questionnaire
As shown in Table 5 below, the pension expenditures to GDP ratio increases due to ageing. The sharper growth in 2030-2040 reflects a particularity in Bulgarian demographic structure, namely no baby boomer generation and a peak of births in the 1970s, leading to a higher number of retiring people in the 2030s. These factors are also reflected by the main driving factor behind the development of the public pension expenditures to GDP ratio for the period under review - the dependency ratio contributing 9.2 p.p. The coverage ratio has a negative contribution due to the phasing-out of early retirement schemes through their transfer to the 2nd pillar as of 2011 and the increase of the statutory retirement age. The impact of employment seems minor. The benefit ratio has also a negative contribution due to the regular functioning of the second pillar as of 2021.
Table 5: Factors behind the public pension expenditures between 2007 and 2060 (in percentage points of GDP)
Contributions to percentage change in pension to GDP ratio
2007-20 2020-30 2030-40 2040-50 2050-60 2007-60 Public pensions to
GDP 0.1 0.2 0.9 1.3 0.5 3.0 Dependency ratio 2.1 1.3 1.7 2.5 1.6 9.2
Coverage ratio -1.2 -0.4 -0.1 -0.6 -0.8 -3.1
1/Employment rate -0.6 0.2 0.1 0.0 -0.2 -0.5
Benefit ratio21 0.0 -0.8 -0.7 -0.5 0.0 -2.0
Source: DG ECFIN, NSSI.
Graph 1: Factors behind public pension expenditures in 2007-2060 (in p.p. of GDP)
-4
-2
0
2
4
6
8
10
2007-20 2020-30 2030-40 2040-50 2050-60 2007-60
Dependence ratio Coverage ratio 1/Employment rate Benefit ratio
Source: DG ECFIN, NSSI.
21 Calculated according to the formula in the Suggested Structure of the Pension Fiche on p. 5.
69

Table 6: Replacement rate and coverage by pension scheme (in %) 2000 2007 2020 2030 2040 2050 2060
Social security scheme 0.0% 0.0% 41.8% 38.3% 37.0% 36.2% 35.8%
Coverage 100.0% 100.0% 100.0% 100.0% 100.0% 100.0% 100.0%
Occupational scheme 0.0% 0.0% 0.0% 0.0% 0.0% 0.0% 0.0%
Coverage 0.0% 0.0% 0.0% 0.0% 0.0% 0.0% 0.0%
Universal pension funds (Private mandatory pension insurance)
0.0%
0.0%
0.0% 7.0% 10.0% 12.8% 13.0%
Coverage 0.0% 0.0% 0.0% 30.4% 58.3% 73.4% 77.9%
Source: DG ECFIN, NSSI.
The projections for the pensions’ expenditures reflect the current legislation, which does not foresee changes of the formula for the pension calculation or of the statutory retirement age. Because of the specificity in the allocation of the PSI pensions, there is no historical data on the amount of first pension of each pensioner. This is due to the fact that the first pension received by one person is the minimum pension for the respective year. After several months, when the real amount of pension has been determined (on the basis of accrual rights and periods of insurance), the pension is not anymore counted as a new pension. Historical data for the gross average replacement rate also cannot be presented. The NSSI actuarial model projects a gradual decrease of the replacement rate. It is expected that the replacement rates of newly allocated pensions will also gradually decline as the new pension formula takes into account not only the last period of social insurance contributions, but also their average for the whole periods of insurance for the calculation of individual coefficient for each person. After 2020 this decline will be more obvious as the pension for periods of insurance and old age will be reduced with the percentage transferred to the second pillar of the pension system, and each person born after 31 December 1959 will receive two pensions (from first and second pension pillars). For the whole projection period a right to pension from the PSI Pensions Fund have all insured persons, as well as the persons that has a right to social pension for old age, in case that they have not acquired the right of pension for periods of insurance. The replacement rate of new pensions from the UPF of second pension pillar will increase through the whole projection period. These funds are capital-based and the resources for each insured person are differentiated in their individual accounts. The longer the periods of insurance and the higher payments of insurance contribution, the higher the pension will be. A right to pension from the UPF have the insured persons that have fulfilled all the requirements for attainment of pension for periods of insurance and old age, born after 31 December 1959 and have enough resources on their individual accounts. The coverage of these pensions will increase along with the attainment of pension rights of the new cohorts of pensioners after 2020.
70

Table 7: Number of pensioners and contributors in the Social Insurance scheme (in 1000), population over 65 and total employment (in 1000) and related ratios (%)
2000 2007 2020 2030 2040 2050 2060 Number of pensioners (I) 2375 2234 2160 2205 2346 2412 2271
Number of people aged 65+ (II) 1331 1325 1462 1572 1690 1852 1876 Ratio of (I) and (II) 178 169 148 140 139 130 121
Number of contributors (III) 2304 2864 2837 2622 2389 2121 1857 Employment(IV) 3272 3307 3148 2848 2513 2160 1949
Ratio of (III) and (IV) 70 87 90 92 95 98 95 Ratio of (III) and (I) 'support
ratio' 97 128 131 119 102 88 82
Source: DG ECFIN, NSSI
The current trend of decrease of the number of pensioners is expected to continue up to 2022, afterwards the number of pensioners will increase due to attainment of pension rights of the bigger cohorts born after 1962. The decrease of the number of pensioners up to 2022 reflects the started in 2000 pension reform and the new, stricter rules for attainment of pension rights. At present the number of contributors of Bulgarian pension system is around 2.9 million. It is expected that in 2008-2011 their number will increase to 2.977 million. This development reflects the expected increase in employment and participation rates in Bulgaria. As of 2012 until the end of projections’ period the number of contributors will go down due to natural migration and population ageing. The number of pensioners receiving pensions from the first pension pillar declines until 2021 when this number is 2.160 million, after that goes up to 2.412 million people in 2050. As projected, the pension reform for the public pension pillar will be completed in 2010 and for the whole projection period the projections are based on current legislation and the change in number of pensioners is a result of demographic dynamics of Bulgarian population. The ratio between the number of pensioners and population over 65 years of age (I/II) is gradually decreasing due to the ageing of Bulgarian population. There are other reasons as well. Up to 2011 there is a transition period for early retirement for those working under labour in risk conditions (1st and 2nd labour category), allowing them to retire early under the 1st pillar. Besides, the statutory retirement age for both men and women is still below 65. Moreover, since 2000 the number of disability pensions has almost doubled due to increased share of older population within the labour force in consequence of the pension reform which also changes the LF profile in terms of increased disability. The number of insured people for the PSI Funds and the number of employed persons will increase during the first few years of the projected period, but afterwards they will decrease due to decreasing population at working age. The insured persons-to-working people ratio increases until 2010 to 88 and after that it remains broadly unchanged. The support ratio, i.e. the ratio between the number of insured persons and the number of pensioners from the PSI is around 1.3 until 2020 and by 2060 it gradually decreases to 0.8.
71
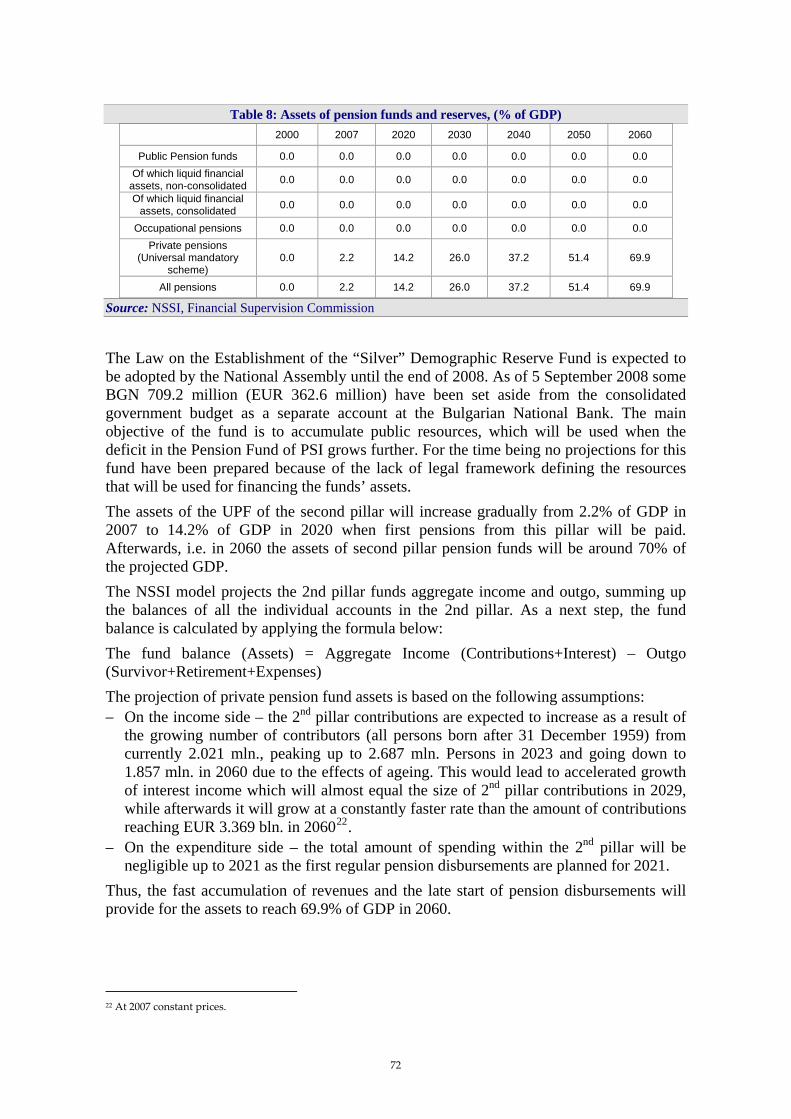
Table 8: Assets of pension funds and reserves, (% of GDP) 2000 2007 2020 2030 2040 2050 2060
Public Pension funds 0.0 0.0 0.0 0.0 0.0 0.0 0.0 Of which liquid financial
assets, non-consolidated 0.0 0.0 0.0 0.0 0.0 0.0 0.0
Of which liquid financial assets, consolidated 0.0 0.0 0.0 0.0 0.0 0.0 0.0
Occupational pensions 0.0 0.0 0.0 0.0 0.0 0.0 0.0 Private pensions
(Universal mandatory scheme)
0.0 2.2 14.2 26.0 37.2 51.4 69.9
All pensions 0.0 2.2 14.2 26.0 37.2 51.4 69.9
Source: NSSI, Financial Supervision Commission
The Law on the Establishment of the “Silver” Demographic Reserve Fund is expected to be adopted by the National Assembly until the end of 2008. As of 5 September 2008 some BGN 709.2 million (EUR 362.6 million) have been set aside from the consolidated government budget as a separate account at the Bulgarian National Bank. The main objective of the fund is to accumulate public resources, which will be used when the deficit in the Pension Fund of PSI grows further. For the time being no projections for this fund have been prepared because of the lack of legal framework defining the resources that will be used for financing the funds’ assets. The assets of the UPF of the second pillar will increase gradually from 2.2% of GDP in 2007 to 14.2% of GDP in 2020 when first pensions from this pillar will be paid. Afterwards, i.e. in 2060 the assets of second pillar pension funds will be around 70% of the projected GDP. The NSSI model projects the 2nd pillar funds aggregate income and outgo, summing up the balances of all the individual accounts in the 2nd pillar. As a next step, the fund balance is calculated by applying the formula below: The fund balance (Assets) = Aggregate Income (Contributions+Interest) – Outgo (Survivor+Retirement+Expenses) The projection of private pension fund assets is based on the following assumptions: – On the income side – the 2nd pillar contributions are expected to increase as a result of
the growing number of contributors (all persons born after 31 December 1959) from currently 2.021 mln., peaking up to 2.687 mln. Persons in 2023 and going down to 1.857 mln. in 2060 due to the effects of ageing. This would lead to accelerated growth of interest income which will almost equal the size of 2nd pillar contributions in 2029, while afterwards it will grow at a constantly faster rate than the amount of contributions reaching EUR 3.369 bln. in 206022.
– On the expenditure side – the total amount of spending within the 2nd pillar will be negligible up to 2021 as the first regular pension disbursements are planned for 2021.
Thus, the fast accumulation of revenues and the late start of pension disbursements will provide for the assets to reach 69.9% of GDP in 2060.
22 At 2007 constant prices.
72

2.4. Sensitivity analysis
The sensitivity tests allow for a quantitative assessment of the sensitivity of the PSI pension expenditures to economic and demographic changes. We will analyze how higher life expectancy, zero migration, higher employment rate and higher labour productivity change the main indicators in the PSI pension projections (See Table 9): – A higher life expectancy by 1 year in comparison with the baseline scenario implies
higher pension expenditures due to the increase of the number of years a pensioner receives a pension. The test results show a gradual increase of pension expenditures up to 2040 and a more significant change afterwards, amounting to 0.34 p.p. of GDP in 2060 in comparison with the baseline scenario.
– Higher labour productivity in comparison with the baseline scenario implies higher GDP and social insurance income and consequently lower PSI Pensions Fund deficits and lower pension expenditures. Due to the pension formula specifics23 the rise of pensions lags behind the rise of social insurance income inflation excluded. Pension expenditures gradually decrease from 0.06 p.p. in 2020 to 0.27 p.p. of GDP in 2060 in comparison with the baseline scenario.
– The baseline scenario implies a constant, albeit small level of immigration almost throughout the whole projection period. The effect of zero migration is similar to higher life expectancy. The test results show a gradual increase of pension expenditures up to 2040 and a more significant change afterwards, amounting to 0.25p.p. of GDP in 2060 in comparison with the baseline scenario.
– Higher employment rate in comparison with the baseline scenario implies reduced PSI Pensions Fund deficits. The increase of the number of employed people implies more revenues in the PSI Pensions Fund and has positive impact (decreases) pension expenditures. Pension expenditures decrease from 0.19 p.p. in 2020 to 0.27 p.p. of GDP in 2060 in comparison with the baseline scenario.
– Higher employment rate of older workers in comparison with the baseline scenario implies reduced PSI Pensions Fund deficits. The increase of the number of employed people implies more revenues in the PSI Pensions Fund and has positive impact (decreases) pension expenditures. Pension expenditures decrease from 0.12 p.p. in 2020 to 0.25 p.p. of GDP in 2040 in comparison with the baseline scenario. Staying longer on the labour market, people acquire higher pension rights - longer social insurance period and higher individual coefficient, leading to higher pension and cumulative increase of pension expenditures with 0.17 p.p. in 2060 in comparison with the baseline scenario.
The NSSI model can not project the changes in the number of contributors, contributions and the assets of private pension funds as they are not included as option for the sensitivity tests. Regarding sensitivity test connected with higher interest rate – our model do not use interest rate as a parameter for long term projections of the state of the Public Social Insurance Funds. The results for this scenario are in practice the same as the results for baseline scenario. We have to use this parameter only for projecting the state of the private mandatory pension funds, but our model could not do that. 23 The so-called Swiss rule.
73

Table 9: Public pension expenditures under different scenarios 2007 2020 2030 2040 2050 2060
Public Pension Expenditure (% of GDP)
Baseline 8.3% 8.4% 8.6% 9.5% 10.8% 11.3% Higher interest rate 8.3% 8.4% 8.6% 9.5% 10.8% 11.3%
Higher life expectancy 8.3% 8.4% 8.6% 9.6% 11.0% 11.6% Higher lab. productivity 8.3% 8.3% 8.4% 9.3% 10.6% 11.0%
Zero migration 8.3% 8.4% 8.6% 9.6% 11.0% 11.5% Higher emp. rate 8.3% 8.2% 8.4% 9.2% 10.5% 11.0%
Higher emp. Of older workers 8.3% 8.3% 8.3% 9.2% 10.7% 11.5%
Source: NSSI
Table 10: Decomposition of the change (in %) in public pension expenditure to GDP between 2007 and 2050 under the 2001, 2006 and 2009 projection exercises
% Change to 2050
Dependence ratio
Coverage ratio
Employment effect
Benefit ratio
Pension/GDP – 2001 * #N/A #N/A #N/A #N/A #N/A Pension/GDP – 2006 ** #N/A #N/A #N/A #N/A #N/A Pension/GDP - 2009 *** 2.5 7.7 -2.3 -0.3 -2.0
Source: DG ECFIN
74

Czech Republic (Report prepared by Zbynek Stork and Jindrich Marval)
1. Overview of the pension system
The Czech pension system consists of two pillars – main mandatory PAYG state system and voluntary fully funded private system. There is no occupational pension scheme.
1.1. Mandatory PAYG system
The first pillar is a mandatory basic pension insurance scheme, based on the pay-as-you-go financing and defined benefits (DB). It covers all economically active persons and it does not contain any special pension scheme for any economic sector. The only exceptions are so-called armed forces (e.g. soldiers, policemen, fire fighters), whose pension insurance is administered by the respective ministries in charge. All others are administered by Czech Social Security Administration. The basic pension insurance covers the whole population (except the ones in the period of education which is not covered) regardless of the actual economic activity of a person. A wide range of so-called non-contributory periods allows gaining pension entitlement at the time of person’s non-activity at the labour market (one does not have any income from which the contribution is derived). Thus the system does not exclude those, whose career has been interrupted for many reasons (unemployment, childcare period etc.) Besides this mentioned solidarity of economically active persons with non-active ones, there is another type of solidarity within a generation – income solidarity. This solidarity is achieved through the formulae used to calculate pension benefits.24 It leads to higher replacement rates for lower-income persons compared to those with higher income. The pension insurance contributions are the only receipts of this scheme. It is calculated by multiplying the assessment base by a contributory rate. The assessment base for employees consists of all taxable income paid by employer to the employee, which are also subject to personal income tax. There is, however, an upper limit set amounting to 48 times the monthly wage per calendar year. This limit is valid for employees as well as for self-employed persons. The contributory rate for pension insurance is 28%, which is paid partly by employee (6.5%) and partly by employer (21.5%). Self-employed persons have their own assessment base amounting to 50% of the difference between incomes and expenses. Minimum base is, however, 50% of the average gross monthly wage in the national economy. Maximum base is the same as for employees. The contributory rate for self-employed persons is 28%. The state pension system covers three main benefits – old-age pension, disability pension and survivor’s pensions: – To be entitled to an old age pension a person has to reach an insurance period of at least
35 years and a retirement age specified by a law; or at least 20 years of insurance and the age of 70. Non-contributory periods are also included in the insurance period.25A
24 The solidarity is implemented through the pension formulae for calculation pension benefit at the time a person retires. Pension is calculated from personal income in past 30 years of a career. Not whole amount of earnings is considered due to reduction brackets and reduction coefficients. 25 Periods included are mainly those for maternal care (100% covered), unemployment (80%). From 2010 onwards non
75

person will gradually be allowed to retire up to 5 years26 prior the statutory retirement age if he/she has at least 35 years of insurance period; but he/she obtains permanently reduced early old age pension. Retirement in ages higher than the statutory retirement age is awarded by additional bonuses.
– Disability pensions occur in three forms. (i) First degree of disability – when a person has experienced a decline in his/her working capacity of at least 35% but not more than 49%; (ii) second degree of disability – a decline of at least 50% but not more than 69%; (iii) third degree of disability – a decline of at least 70%. The required insurance period is at least 5 years27 (it is derived from the ten year period prior to the occurrence of disability).Disability pension usually belongs to a person until he/she reaches entitlement for the old age pension.28 Subsequently a person is transferred from the disability pension scheme to the old age pension scheme.
– Survivor’s pensions are paid out to a widow/widower or an orphan (dependent child) if a deceased person has met eligibility conditions for the old age or disability pension or he/she died due to job-relating injury. After one year of receiving the survivor’s pension, the widow/widower must meet other conditions stipulated by the law, otherwise the entitlement lapses (the entitlement continues when the widow/widower cares for a dependent child or disabled child, parents or relatives aged 80 and higher; or when a widow/widower is disabled or he/she has reached the age 61). The entitlement is also renewed when at least one of these conditions is met within 5 year from the last entitlement termination. Orphan’s entitlement to survivor’s pension lasts until he/she is dependent but not beyond the age of 26.
1.2. Pension calculations
The basic act that determines calculation of pension benefits is the Pension Insurance Act (No. 155/1995). Pensions29 consist of two main parts: – Flat rate component is the same for all pensions regardless of the insurance period acquired
and earnings achieved. The flat rate currently amounts to 2,170 CZK30 (approx. 78 EUR) per month for all kinds of pensions.
– Earnings related component is derived from the insurance period and earnings achieved. It is calculated as a percentage of personal calculation base, which takes into consideration person’s income up to 30 years31 prior his/her retirement.32
Minimum amount of a pension is set by both the flat rate component (which is the same for everyone) and the minimum earnings related component. Another instrument that also prevents people from the poverty is the institute of the subsistence level.33 Both these instruments are set by the government and are revaluated on irregular basis.34
contributory periods for education are abolished. 26 Currently 3 years earlier retirement is allowed. 27 Applies for persons above the age 28. Younger people are required to reach shorter insurance period. 28 Respectively, until he/she reaches the retirement age qualified by the law. 29 Concerning old age pension, disability pensions and also survivor’s pensions. 30 The value is of 2007. 31 But it goes back to the year 1986 at the most. So the period used for calculation the assessment base is lengthening. The 30-year period will be achieved in 2015. 32 For detailed description see the description of the pension model in the Annex. 33 A person whose income is lower than the subsistence level has a claim for social support benefits. 34 Since there is no exact rule set by the law, we assume in the model the FRC, ERC and also reduction brackets to develop in line with wages in order to maintain their relative levels. Past development also supports this assumption.
76
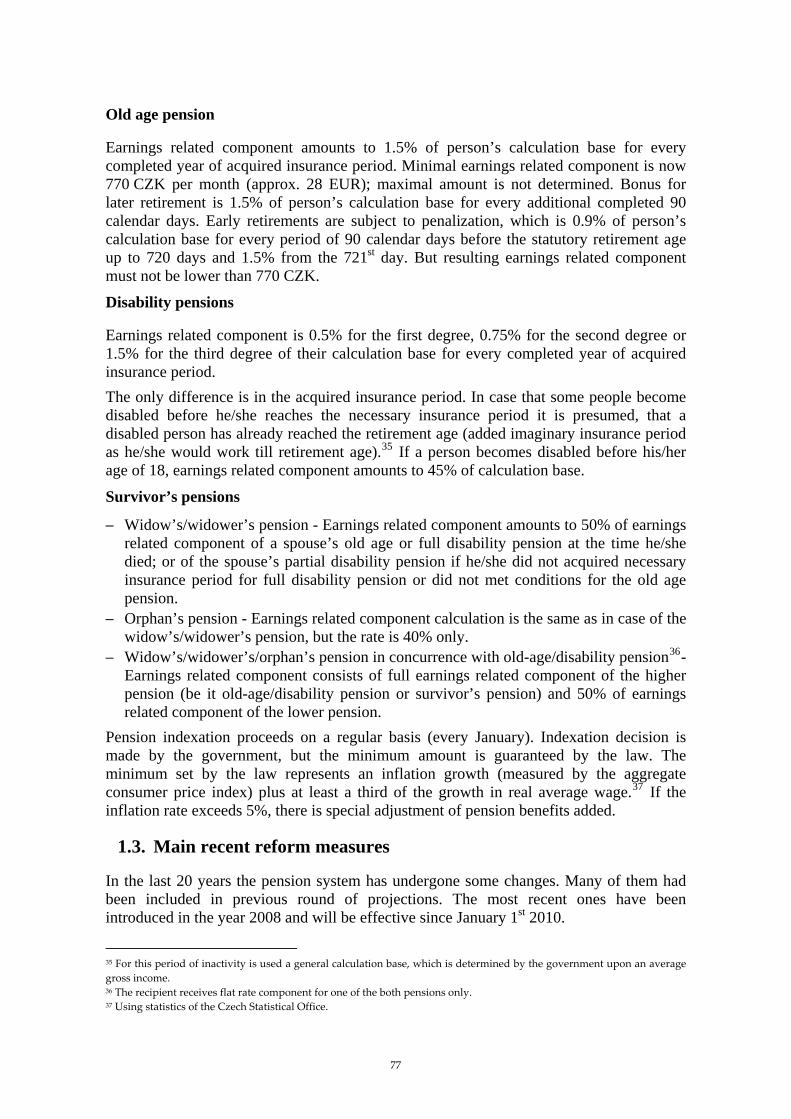
Old age pension
Earnings related component amounts to 1.5% of person’s calculation base for every completed year of acquired insurance period. Minimal earnings related component is now 770 CZK per month (approx. 28 EUR); maximal amount is not determined. Bonus for later retirement is 1.5% of person’s calculation base for every additional completed 90 calendar days. Early retirements are subject to penalization, which is 0.9% of person’s calculation base for every period of 90 calendar days before the statutory retirement age up to 720 days and 1.5% from the 721st day. But resulting earnings related component must not be lower than 770 CZK.
Disability pensions
Earnings related component is 0.5% for the first degree, 0.75% for the second degree or 1.5% for the third degree of their calculation base for every completed year of acquired insurance period. The only difference is in the acquired insurance period. In case that some people become disabled before he/she reaches the necessary insurance period it is presumed, that a disabled person has already reached the retirement age (added imaginary insurance period as he/she would work till retirement age).35 If a person becomes disabled before his/her age of 18, earnings related component amounts to 45% of calculation base.
Survivor’s pensions
– Widow’s/widower’s pension - Earnings related component amounts to 50% of earnings related component of a spouse’s old age or full disability pension at the time he/she died; or of the spouse’s partial disability pension if he/she did not acquired necessary insurance period for full disability pension or did not met conditions for the old age pension.
– Orphan’s pension - Earnings related component calculation is the same as in case of the widow’s/widower’s pension, but the rate is 40% only.
– Widow’s/widower’s/orphan’s pension in concurrence with old-age/disability pension36- Earnings related component consists of full earnings related component of the higher pension (be it old-age/disability pension or survivor’s pension) and 50% of earnings related component of the lower pension.
Pension indexation proceeds on a regular basis (every January). Indexation decision is made by the government, but the minimum amount is guaranteed by the law. The minimum set by the law represents an inflation growth (measured by the aggregate consumer price index) plus at least a third of the growth in real average wage.37 If the inflation rate exceeds 5%, there is special adjustment of pension benefits added.
1.3. Main recent reform measures
In the last 20 years the pension system has undergone some changes. Many of them had been included in previous round of projections. The most recent ones have been introduced in the year 2008 and will be effective since January 1st 2010.
35 For this period of inactivity is used a general calculation base, which is determined by the government upon an average gross income. 36 The recipient receives flat rate component for one of the both pensions only. 37 Using statistics of the Czech Statistical Office.
77

– Further increase of the statutory retirement age for policyholders born after 1968 will be 65 years of age for men and for women who have raised no more than one child. For women born after 1968 that have raised 2, 3, or 4 or more children, the retirement age will be 64, 63, and 62 years of age, respectively.
Graph 1: Retirement age by the year of birth
– In accordance with the extension of the retirement age, the age limit for entitlement to a
“permanent” widow/widower’s pension is also increased in the final phase to 61 years of age.
– The required insurance period for pension entitlement has been prolonged from 25 to 35 years (including non-contributory periods), respectively 30 years (only the period during which the insurance was paid – i.e. without non-contributory periods). Those who do not reach the required insurance period have the retirement age higher by 5 additional years comparing to the statutory age.
– Non-contributory periods have been restricted and will be assessed at 80% of the pension entitlements. The compensatory insurance period for the duration of studies has been cancelled.
– In disability pensions, new a three-tiered disability structure depending on the percentage reduction in working capacity of the policy holder has been introduced. Disabled persons aged 65 or older that belongs to the first tier will be automatically administratively reclassified as an old age pensioners.
– The restriction of pensioners’ working activity38 has been abolished. There is no condition on the working activity while receiving pension after the statutory retirement age.
1.4. Voluntary fully funded private system
This pillar (known as the third pillar) is voluntary, supplementary, fully funded and state-subsidized pension scheme based on defined contribution (DC). It also includes life insurance as a product of commercial insurance companies. The insurance can be contracted by any Czech or other EU citizen aged 18 and over, who participates in the state pension system or the public health insurance scheme in the Czech Republic. Any employer can support his employees with additional contribution to employee’s fund.
38 Formerly a retired person could have a working contract for one year at the most. After that the contract could be renewed, but again for one year only.
78

Both, employer’s and employee’s contributions are subject to additional tax allowances. State subsidizes this pillar. The higher personal contributions the higher state subsidy with maximum amount of 65 EUR per year for each contributor. Compare to the 1st pillar and with respect to pension sustainability and adequacy, the 3rd pillar plays rather minor role.
2. Pension expenditure projections
2.1. Extent of the coverage of the pension schemes
Projection results illustrate pension expenditure development focusing mainly on social security pensions as the most important scheme. Projection exercise fully covers all pensions – i.e. old age, disability and survivors’ with respect to current legislation. Some results of non-mandatory private pension scheme have been included to the extent that availability of relevant data allowed. There are data about the number of clients (contributors) of pension funds and assets saved (clients’ means) available. From the point of view of the pension system, the 3rd pillar exists for few years only. And also since benefits have a form of lump sump some in many cases, it was not able to analyze the expenditure side in the way as in the case of social security scheme. This pillar has only a limited impact on pension sustainability and adequacy, so this lack of data does not bias presented results.
2.2. Overview of projection results
Social security scheme is the major source of benefits for elderly generation based on pay-as-you-go system. With the population ageing the expenditure pressures will rise inevitably with the old-age pension as the most demanding type of pension. The increase is fully in line with the rise in the number of old age pensions, with the peak in 2060. Expenditures on other types of pension (disability and survivors’) remain rather constant as a share of GDP. Due to the difficulties discussed above, private non-mandatory pensions have not been included. Pensions in our case are not taxed in fact. This is due to relatively high threshold, up to which pensions are tax-exempt. Only amount that exceed 198,000 CZK39 (approx. 7,131 EUR) per year is subject to personal income tax. Such pension benefit is reached by only marginal number of pensioners, since the average pension is only about 110,000 CZK (approx. 3,961 EUR) per year. Only a negligible number of pensioners (hardly 1% of them) pays taxes. Moreover such negligible personal income tax revenue is a source of the state budget and not of the social security system. For these reasons we do not calculate projections of taxes.
39 This value is subject to ad hoc indexation by Ministry of Labour and Social Affairs.
79

Table 1: Projected gross pension spending, tax on pension and contributions (% of GDP) 2000 2007 2020 2030 2040 2050 2060 Peak year
* Social security pensions 8.6 7.8 6.9 7.1 8.4 10.2 11.0 2060 Old-age and early pensions 7.7 7.1 6.3 6.6 7.9 9.7 10.5 2060
Other Pensions 1.0 0.7 0.5 0.6 0.5 0.5 0.6 2000 Occupational pensions 0.0 0.0 0.0 0.0 0.0 0.0 0.0 : Private pensions : : : : : : : : Mandatory private 0.0 0.0 0.0 0.0 0.0 0.0 0.0 : Non-Mandatory private : : : : : : : : Total pension expenditure 8.6 7.8 6.9 7.1 8.4 10.2 11.0 2060 Taxes on public pensions 0.0 0.0 0.0 0.0 0.0 0.0 0.0 : Taxes on private pensions 0.0 0.0 0.0 0.0 0.0 0.0 0.0 :
* This column represents a Peak year, i.e. the year in which the particular variable reaches its maximum over the interval 2000 to 2060.
2.3. Main driving forces behind the projection results
Main driving forces of pension expenditures can be identified by simple decomposition, using dependency, coverage and benefit ratio and an employment rate as follows:
444 8444 76444 8444 764444 84444 76444 8444 76 RatioBenefitRateEmploymentRatioCoverageRatioDependency
PeopleWorkingGDP
PensionAveragePeopleWorking
PopulationPopulation
PensionersofNumberPopulationPopulation
GDPExpPension ×−×
+×
−+=
/1
6415656415
65.
Note: 'Average pension' = social security pension expenditure divided by the number of pensioners Table 2 shows results of this decomposition. It is apparent that the main contribution to the increase of pension expenditure has the ageing population that will quite dramatically change the ratio between the elderly and active population. The peak of the dependency is projected to be in 30’s and 40’s. Opposing to that, coverage ratio will decrease over time. The main reason should be seen in continuous postponement of the retirement age. This will reduce the number of pensioners and together with the increase of population aged 65+ will influence the ratio. An additional decline in the coverage ratio occurs in later years when the total population is lowering. Decreasing population has also an impact on the number of other than old age pensions – namely the number of disability pensions declines and that of widows’/widowers’ pensions stagnate.40 Thus the number of pensioners rises in lower pace than the number of persons aged 65+. Only a limited impact on expenditure per GDP will have two remaining factors. Employment rate is projected to be relatively stable over the projection horizon and has only a small dampening effect. Benefit ratio will decline in first several decades thanks to the assumed indexation amounting to inflation plus 1/3 of the real wage growth. Since the previous indexations were higher than this minimal indexation used for projections, the ratio is falling.41 This gap leads to the fall in the benefit ratio. Following decades will witness relatively stable development with some minor increase. This may be attributed to slightly lower increase of GDP per worker.
40 This effect is visible on Figure 12 to 14 in the Annex. 41 This may be also inferred from Figure 16 to 20 in the Annex, that show the evolution of benefit ratio for each pension benefit.
80

Table 2: Factors behind the public pension expenditures between 2007 and 2060 (in percentage points
of GDP) 2007-20 2020-30 2030-40 2040-50 2050-60 2007-60 Public pensions to GDP in a starting year * -0.9 0.3 1.3 1.7 0.9 3.3 Dependency ratio 3.6 1.0 1.4 2.3 1.2 9.5 Coverage ratio -1.8 -0.5 -0.2 -0.6 -0.3 -3.5 1/Employment rate -0.5 0.1 0.0 -0.1 0.0 -0.5 Benefit ratio -1.6 -0.2 0.1 0.2 0.0 -1.5
* The starting year is 2007 for the column 2007-20 and 2020 for the column 2020-30, etc.
In fact all pensioners in the Czech Republic are covered in the social security pension scheme.
Table 3: Replacement rate and coverage by pension scheme (in %)'42
2000 2007 2020 2030 2040 2050 2060 Social security scheme 35.2 32.7 28.2 25.0 29.0 28.0 27.0
Coverage * 100.0 100.0 100.0 100.0 100.0 100.0 100.0 Occupational scheme 0.0 0.0 0.0 0.0 0.0 0.0 0.0
Coverage 0.0 0.0 0.0 0.0 0.0 0.0 0.0 Private scheme : : : : : : :
Coverage : : : : : : :
* Coverage of each pension scheme is calculated as a ratio of the number of pensioners within the scheme and the total number of pensioners in the country.
The replacement rate provided by this scheme illustrated in Table 3 declines in first 20 years, which is due to the retirement age postponement. Nowadays, there are people that delay their retirement over the statutory age. That gains them an extra bonus and it raises their pension benefit. It is expected that with the age postponement the additional benefits will diminish. Following Table 4 provides a picture of demographic changes and their impact on financial sustainability. As previously discussed, however both the number of pensioners and people aged 65+ increases, their ratio will decline with the retirement age postponement and also with the decreasing number of other than old age pensioners.
Table 4: Number of pensioners and contributors in the Social security scheme (in 1000), population over 65 and total employment (in 1000) and related ratios (%)
2000 2007 2020 2030 2040 2050 2060 Number of pensioners (I) 2 592 2 729 3 015 3 119 3 375 3 619 3 637 Number of people aged 65+ (II) 1 411 1 482 2 132 2 391 2 674 3 060 3 175 Ratio of (I) and (II) 184 184 141 130 126 118 115 Number of contributors (III) 4 635 4 878 5 045 4 814 4 546 4 178 3 873 Employment(IV) 4 675 4 850 4 846 4 636 4 321 3 919 3 632 Ratio of (III) and (IV) 99 101 104 104 105 107 107 Ratio of (III) and (I) 'support ratio' 179 179 167 154 135 115 106
Contributors to the social security scheme are solely those from working population. That is why the ratio of contributors and those employed is stable over time.43 The reason why 42 Coverage of each pension scheme is calculated as a ratio of the number of pensioners within the scheme and the total number of pensioners in the country. 43 The reason why the ratio slightly increases is rather methodological. We assume the number of contributors to be all employed persons even older that 64 (whose number will increase over time), while the employment in the table covers people aged 15-64 only.
81

the ratio is slightly over 100 is in participation of volunteers (e.g. self employed) that are not included in the employment. Finally the decline in the support ratio44 is a result of changes in the structure of the population and related increase in the dependency ratio. The expenditures of the pay-as-you-go system are financed from the state budget revenues. Public pension fund, a separate part of the budget, has been created in 2004 in order to accumulate earmarked assets for financing the pension system (social security contributions). However some minor extra inflows to the fund may occur45, the assets are created solely from the surplus of the pension system. Thus the balance of the pension system in each projection year is the only factor that has an influence on the assets accumulation (in case of surplus) or their withdrawal (in case of deficit). They currently have a form of liquid financial assets only due to lack of legislation that would allow investing them into some other type of assets. The main purpose of the fund is to cover higher expenditure pressures of the pension system in the future, but in fact the money can be use for other purposes as well.46 Current positive situation on the labour market allows for surpluses and thus for assets’ accumulation. When the contributions will not be sufficient to cover rising expenditures (from late 30’s) the system will be in the deficit and assets will be spent.
Table 5: Assets of pension funds and reserves, (% of GDP)'47
2000 2007 2020 2030 2040 2050 2060 Public Pension funds 0.0 0.4 17.1 32.6 45.0 42.3 24.2 Of which liquid financial assets, non-consolidated 0.0 0.4 17.1 32.6 45.0 42.3 24.2 Of which liquid financial assets, consolidated 0.0 0.0 0.0 0.0 0.0 0.0 0.0 Occupational pensions 0.0 0.0 0.0 0.0 0.0 0.0 0.0 Private pensions 0.0 0.0 0.0 0.0 0.0 0.0 0.0 All pensions 1.6 5.1 17.1 32.6 45.0 42.3 24.2
2.4. Sensitivity analysis
Besides the baseline scenario discussed in all other parts of this document, several sensitivity analysis have been carried out.48 Higher life expectancy shows higher expenditures simply due to the longer lives of retired people and thus higher total number of pensioners that receive pension benefits. There is no compensation in the pension formulae that would reduce this effect. Higher labour productivity is slightly more demanding from the level of total expenditure point of view. But the opposite is true looking at the GDP ratios. This scenario creates higher GDP (higher denominator for per GDP spending) and somewhat higher wages. However newly granted pensions will be higher, the indexation rule will translate only 1/3 of this positive effect into the growth of the pension benefit.
44 The support ratio is defined as a number of contributors relative to the number of pensioners in public pension schemes. 45 E.g. revenues from dividends in 2008. 46 The use of the money for other purposes has been rare – to cover social security expenditure other than pensions. 47 Assets in years from 2000—2007 also includes those from non-mandatory private pension pillar. Since we do not have all relevant information we were not able to project these assets to the future. 48 In the system with one pillar the effects on public pensions and total pensions are the same.
82

Table 6: Total and public pension expenditures under different scenarios (deviation from baseline scenario)
2007 2020 2030 2040 2050 2060 Total Pension Expenditure Baseline 7.8 6.9 7.1 8.4 10.2 11.0 Higher life expectancy 7.8 6.9 7.2 8.6 10.4 11.3 Higher lab. Productivity 7.8 6.8 7.0 8.3 10.0 10.8 Higher interest rate 7.8 6.9 7.1 8.4 10.2 11.0 Higher emp. Rate 7.8 6.8 7.0 8.3 10.0 10.9 Higher emp. of older workers 7.8 6.8 7.2 8.8 10.8 12.0 Zero migration 7.8 7.1 7.6 9.2 11.4 12.5 Public Pension Expenditure Baseline 7.8 6.9 7.1 8.4 10.2 11.0 Higher life expectancy 7.8 6.9 7.2 8.6 10.4 11.3 Higher lab. Productivity 7.8 6.8 7.0 8.3 10.0 10.8 Higher interest rate 7.8 6.9 7.1 8.4 10.2 11.0 Higher emp. Rate 7.8 6.8 7.0 8.3 10.0 10.9 Higher emp. of older workers 7.8 6.8 7.2 8.8 10.8 12.0 Zero migration 7.8 7.1 7.6 9.2 11.4 12.5
Higher interest rate does not have any impact on expenditures. Only accumulated assets in our system are affected by this assumption. Higher employment rate is in terms of expenditure marginally lower comparing to the baseline. Also as in case of higher productivity, the GDP as the denominator is somewhat higher. The effect on pension expenditure itself is very limited. Higher employment of older workers contributes to a higher increase in expenditures amounting to 1 p.p. difference from the baseline. Under this assumption older workers will gain higher pension rights due to the extra benefits for working in ages after the statutory retirement age. The contribution to the GDP growth that would at least partially offset this expenditure increase in the ratio is very limited (e.g. comparing to higher employment rate scenario). Under the assumption of zero migration the increase in pension expenditure is the highest. The reason is solely in lower employment and lower GDP that raises the ratio.49
2.5. Comparison with the 2006 projections
Current projection results are a bit different comparing to previous exercise. The most sizable difference is in the expenditure dynamics that has been limited. The reasons are in different assumptions and in current reform that further delays the pension age and reduces the expenditure on disability pensions. This is reflected in the benefit ratio while the higher retirement age lowers bonuses for working behind the statutory age. The increase in dependency ratio has been slightly reduced due to different population projection. Also relatively more optimistic macroeconomic framework contributes to higher positive effect from the labour market. But this effect is less pronounced similarly to the difference in the coverage ratio.
49 The level of total expenditure is lower in this scenario comparing to the baseline.
83

Table 7: Decomposition of the change (in %) in public pension expenditure to GDP between 2007 and 2050 under the 2001, 2006 and 2009 projection exercises
% Change to 2050
Dependency ratio Coverage ratio Employment
effect Benefit ratio
Pension/GDP – 2006 * 5.6 10.5 -3.5 -0.3 -0.6 Pension/GDP - 2009 ** 2.4 8.3 -3.2 -0.5 -1.5
* Decomposition period 2004-2050, ** Decomposition period 2007-2050. Table 8: Illustrative decomposition of the difference between 2006 and 2009 public pension projection
(%GDP) 2000 2005 2007 2020 2030 2040 2050
Ageing report 2006 8.6 8.5 8.4 8.4 9.6 12.2 14.0
Change in assumptions 0.0 0.5 0.6 1.4 1.7 2.7 2.9
Improvement in the coverage or in the modelling 0.0 0.0 0.0 0.0 0.0 0.0 0.0
Change in the interpretation of constant policy 0.0 0.0 0.0 0.0 0.0 0.0 0.0
Policy related changes 0.0 0.0 0.0 0.1 0.8 1.1 0.9
Ageing report 2009 8.6 8.0 7.8 6.9 7.1 8.4 10.2
Table 8 shows an illustrative decomposition of the differences between current and previous projection round. Comparing these two exercises neither modelling approach nor the model coverage has been changed. Also the definition of constant policy scenario has not been modified and thus these factors have no impact on presented results. A change in assumptions has improved the performance of the pension system. Especially positive situation on the labour market (more economically active people) with lower unemployment rate creates a higher GDP. This fact reduces expenditures per GDP, because higher growth is translated to higher pension expenditures (through the indexation) only by 1/3 of real wage growth. Also the above mentioned policy changes has attributed to dampen the expenditure pressures. Namely an additional postponement will bring savings that will occur around the year 2020 from which the measure will affect the system in fact.50
50 Around this year, previously adopted postponement up to the age of 63 (included in the previous round of projections) will be finished.
84

Denmark (Report prepared by Benn Vestergaard, Vibe Musaus Madsen and Jorgen Sloth Bjerre Hansen)
1. Overview of the pension system
The Danish pension system is based on three pillars, each with its own form of financing. – The first pillar consists primarily of the public old-age pension system and is financed
on a PAYG basis (by ordinary government revenue). – The second pillar consists primarily of (privately organized) labour market pension
schemes. The bulk of labour market pensions are defined-contribution, savings-based group schemes that are either based on collective agreements or agreed in individual enterprises.
– The third pillar consists of individual, voluntary pension schemes.
1.1. First Pillar Pensions
For the AWG projection, the civil servant, disability and voluntary early retirement pensions are considered as belonging to the first pillar pensions in addition to the old-age pension. In the following sections each of these is described separately. Public old-age pension is a basic public pension granted from the age of 65. The amount of the pension depends on the number of years of residence in Denmark. Maximum public old-age pension is achieved after 40 years of residence in Denmark after the age of 15. If the time of residence is shorter, the pension will be reduced proportionately. Public old-age pension consists of a basic amount and a pension supplement. The pension is independent of the recipient’s previous attachment to the labour market and previous earnings, but depends on the pensioner’s present income and marital status. Assets have no effect on the amount of public old-age pension. The basic amount is DKK 61,200 (euro 8,200) annually in 2008 and taxable. The basic amount is reduced only on the basis of earnings from earned income. If the pensioner has earned income of more than DKK 259,700 (euro 34,800) annually, the basic amount is reduced by 30 per cent of the part of the earned income that exceeds the threshold. The pension supplement is DKK 61,500 (euro 8,250) annually for single pensioners and DKK 28,800 (euro 3,850) annually for married or cohabiting pensioners in 2008. The pension supplement is taxable and reduced if the pensioner or his/her spouse or cohabitant has earnings above a certain limit besides public old-age pension (earned income, supplementary pension income, equity income, investment income, etc.). Public old-age pension is paid upon application from the age of 65. From 2004, rules on deferred pension have been introduced. Disability pension is an anticipatory pension for people who are not able to support their own living. Persons between 18 and 65 years may be awarded an anticipatory pension if they satisfy a number of conditions concerning citizenship, residence and entitlement. The key condition for being awarded anticipatory pension is that the working capacity is permanently reduced and that the reduction is of such an extent that the person will not be able to support himself fully or partially from paid work.
85

The disability pension is DKK 182,800 (euro 24,500) annually in 2008 for singles and DKK 155,500 (euro 20,850) for married and cohabiting people. The disability pension is subject to income taxation. Voluntary early retirement pension (VERP) is for all employees and self-employed persons who are members of an unemployment insurance fund and the VERP scheme and who have reached the age of 60 years, but who are not yet 65 years old. The member must have been a member of an unemployment insurance fund and paid the voluntary early retirement contributions for 30 years to be eligible for VERP. Furthermore, it is a precondition that the membership and the contributions start no later than the age of 30. The VERP is, as a general rule, 166,400 DKK (euro 22,300) annually. Civil service pensions are defined-benefit schemes. The amount of the pension depends on the number of years of employment as a public servant and the pensionable pay – typically the final salary. Pensions are funded by government, regional or local authorities out of current income, i.e. taxes. Defined-benefit pension schemes in the form of civil service pension schemes have diminishing importance in both the central government and the local government sectors, where the employment form is being changed to the more flexible and individual pay forms implemented in the public sector in recent years, and where employees are to a wider extent covered by contribution-financed and contribution-defined pension schemes Indexation of public pensions The rates for different types of transfer payments (and the progressive limits etc. in the tax system) are automatically adjusted once a year on the basis of wage developments in the private sector (the area covered by the Danish Employers’ Confederation). Transfer payments are adjusted at the rate adjustment percentage; cf. the Rate Adjustment Percentage Act. The rate adjustment percentage for a given fiscal year is fixed on the basis of wage developments in the wage year, which is the year two years before the fiscal year. The rate adjustment percentage for 2008 was thus fixed on the basis of wage developments from 2005 to 2006.
1.2. Second Pillar Pensions
The second pillar consists primarily of (privately organized) labour market pension schemes and aims to secure citizens a reasonable replacement rate when they retire. Labour market pension schemes presently cover some 90 per cent of all full-time employees and can be divided into schemes based on collective agreements and schemes agreed in individual enterprises. Labour market pension schemes are mostly savings-based. Total savings in the labour market pension schemes are estimated at just over DKK 1500 billion (euro 200 billion or 85 percent of GDP) or more than two-thirds of total private Danish pension assets in insurance-based pension schemes. Labour market pensions form part of the Danish agreement-based labour market model. The agreement-based schemes have been agreed between employee and employer organisations, while the schemes at enterprise level have been agreed between an enterprise and its employees. The bulk of labour market pensions are contribution-defined, i.e. the amount of the pension depends on the contributions paid and the accumulated return on savings. The
86
contributions to the agreement-based labour market pension schemes are typically 7-10 per cent of the wage in the private labour market and 12-16 per cent of the wage in the public labour market. The employer contributes two-thirds of the sum, while the individual person contributes one-third. The composition of benefits in the labour market pension schemes varies considerably. Typically, a life-long current retirement pension is provided, which may be combined with annuity pension (paid out over 10 years) and/or capital pension (paid out at the age of retirement). To this may be added disability pension and spouse’s and child’s pensions.
1.3. Third Pillar Pensions
Individual, private pension savings plans are started on the initiative of private individuals and are independent of employment conditions. In these schemes, the individual makes his/her own choices about pension scheme, supplier, premium amount and composition of benefits. Individual pension schemes can be set up with banks, insurance companies or pension funds. In 2005, around one million persons paid contributions to individual pension schemes. The average contribution was some DKK 23,000 (euro 3,150). Self-employed persons form the group that pays the highest average contributions, since this group is rarely covered by labour market pension schemes. The individual schemes are typically capital pension or annuity pension schemes, but may also be current life-long pensions. The amount of the pensions depends on the savings (including return) made by the individual. In addition, there are a number of supplementary, statutory pensions such as the Labour Market Supplementary Pension Scheme (ATP), the Special Pension Savings Scheme (SP) and the Supplementary Labour Market Pension Scheme for Recipients of Anticipatory Pension (SAP), which cannot be placed unambiguously in one of the three pillars. ATP, SP and SAP are contribution-defined and savings-based schemes that also cover certain transfer payment recipients. In the AWG framework it is more convenient to place the ATP, SP and SAP in pillar two since they are fully funded and saving-based. Almost all citizens of working age pay contributions to ATP and SP (however contributions to the SP scheme are presently suspended). Furthermore, several groups of persons temporarily or permanently outside the labour market pay contributions to the schemes. Thus, these schemes ensure almost all future pensioners supplementary pension besides public old-age pension.
1.4. Taxation of pensions
1.4.1. Taxation of public pension
Public pensions is subject to personal income taxation. However, they are not taxed with the 8 % payroll tax.
1.4.2. Taxation of private pensions
87

Both labour market pension schemes (2nd pillar) and individual pension schemes (3rd pillar) are, as a general rule, taxed ETT (contributions exempt, returns taxed, benefits taxed). Contributions to private and occupational pensions can be deducted from ordinary income tax at the time they are paid into the schemes. However, contributions are still taxed with the 8 % payroll tax. In addition, contributions to capital pension are not deductible in the top tax rate. When benefits are paid out from life-long and annuity pensions they are subject to the personal income tax, but not the payroll tax. Benefits from capital pensions are taxed with a flat 40 % rate. In the assessment of fiscal sustainability the contributions received and payments made from the pension sector must be included, because pension savings are not taxed until the pensions are paid out, while contributions to pension schemes can be deducted from ordinary income tax at the time they are paid into the schemes. All else equal, the future rise in revenue resulting from increasing pension payments will improve public finances. Because the revenue stems from deferred tax payments, the other side of the coin is a higher general public net debt today, resulting from tax deductions for (net) pension contributions made to date.
1.5. Recent reforms of the pension system
In 2006, The Danish Government concluded the Welfare Agreement with the Social Democrats, the Danish People’s Party and the Social-Liberal Party. Thus, 158 of the Danish Parliament’s 179 mandates are behind the agreement. The key elements are: – The increase in the voluntary early retirement pension (VERP) age from 60 to 62 years
in 2019 to 2022 and the public old-age pension age from 65 to 67 years in 2024 to 2027, see table 1
– The indexation of the age thresholds in the retirement system as of 2025 for the early retirement age and 2030 for the public old-age pension.
The delay in the increase in the statutory retirement age for old age pensioners ensures that all generations may be entitled to 5 years on the VERP before moving to the old age pension. A projection of the effects of the Welfare Agreement was subject to a peer review in the AWG in November 2007. The Welfare Agreement introduces a principle of indexation to help ensure that longer life expectancy and better health also leads to more active years in the labour market. A specific formula for calculating the VERP and pension age on the basis of future observed mean life expectancy for 60 year olds is enshrined in the legislation. Changes in the VERP and pension age shall be calculated every 5 years – based on the latest observed life expectancy – and confirmed by Parliament 10 years before they take effect. It is a key requirement for the government’s long-term fiscal strategy that current legislation describing the indexation rule is adhered to. If life expectancy does not increase relative to 2004/2005 the above-mentioned new age limits will remain in force. If life expectancy increases, the age threshold for VERP will in the long run increase in line with life expectancy for 60-year olds. The first adjustment takes effect in 2025 (for the VERP age) but will (as mentioned above) be decided 10 years
88

in advance in order for people to have time to adapt to changes. The first adjustment will thus be decided in 2015 and after that every five years. The principle of indexation implies that the total (average) potential period of voluntary early retirement pension and public pension – understood as the mean life expectancy for 60-year olds less the VERP age – is maintained around 19½ years over the longer term. That is the same as in 1995. From the introduction of the voluntary early retirement scheme in 1979 to 1995, the average remaining lifespan for 60-year olds was fairly stable around 19½ years. In the period 1995-2005 life expectancy for the 60-year olds has increased by 1.8 years. The public pension age will be adjusted in line with the age of voluntary early retirement pension, taking effect 5 years later (i.e. the first time in 2030) under the indexation rule. With the assumptions about the increase in life expectancy for people aged 60 in the AWG/EUROPOP population projection and the indexation rule, the expected VERP and old age pension statutory ages in 2060 are assumed to be 67.5 years and 72 years, respectively, see Graphs 1 and 2 and Table 1 The increase in the statutory retirement age should also be seen in the light of improved health etc., i.e. a 72 year old in 2060 will be healthier than a 72 year old in 2007. Compared to the pension projection from 2007, the retirement age is increased by 1 year in 2050. Since the retirement age is calculated using the AWG assumption about life expectancy, this revision is due to the new demographic projection, the EUROPOP2008.
Graph 1: Mean remaining life expectancy for a 60-year old
Graph 2: Age thresholds for VERP and public old-age pension
0
5
10
15
20
25
30
10 15 20 25 30 35 40 45 50 55 600
5
10
15
20
25
30Year s Years
55
60
65
70
75
05 10 15 20 25 30 35 40 45 50 55 6055
60
65
70
75
VERP Old age pensi on
Ret irem entage Retirement age
Table 1: Change in the retirement age for VERP and old age pension
Age to be entitled to VERP (before reform)
Age to be entitled to VERP (after reform)
Age to be entitled to old age pension (before reform)
Age to be entitled to old age pension (after reform)
2010 60 60 65 65
2015 60 60 65 65
2020 60 61 65 65
2025 60 63 65 66
2030 60 64 65 68
2035 60 64,5 65 69
2040 60 65 65 69,5
2050 60 66.5 65 71
2060 60 67,5 65 72
89

With the AWG assumptions about life expectancy and the legislated rules about the indexation of the statutory retirement age, the latter is projected to be 72 years in 2060. However, the AWG assumptions also state that the average exit age from the labour force is 64.7 years for females in 2060 and 65.1 for males. The source of income for people that have retired, but have not yet reached the statutory retirement age, can be either disability pensions or private pensions: As the statutory retirement age increases in the projection, the share of people on disability pension is also projected to increase so that 15-20 percent of people above the retirement age in 2007 (65 years) and below the increased retirement age are projected to receive disability pension. Since people will have accumulated large private pension assets in the future, it is also plausible that some will retire before the statutory retirement age and live from their private pension while not receiving public pension until they reach the statutory retirement age. This development is not a part of the projection, but this is not likely to have an impact on the fiscal sustainability, since the effective tax rate on private pensions that are paid out before the statutory retirement age does not differ significantly from the tax rates that apply to private pensions paid out at or after the statutory retirement age.
2. Pension expenditure projections
2.1. Extent of the coverage of the pension schemes in the projections
All relevant pension schemes are included in the model, including old age pension, disability pension, civil servant pension, voluntary early retirement, occupational and private schemes. However, public expenditures on survivor pension are not covered, but it is not a significant expenditure, since survivor pensions are only paid to survivors of people on civil servants pension which amounts to approximately 1 percent of GDP.
2.2. Overview of projection results
The pension expenditures increase slightly from 2007 to 2030 due to a higher number of pensioners, because the pension age is not changed until 2019. From 2030 the expenditures are expected to decrease until 2060, where they approximately reach the same level as in 2007. This decrease should be seen in the light of the increase in the retirement age as decided with the Welfare Agreement. Disability pensions (other pensions) increase during the projection period due to the increase in the retirement age, since it is assumed that a higher percentage of older people will be eligible for disability pension.
90
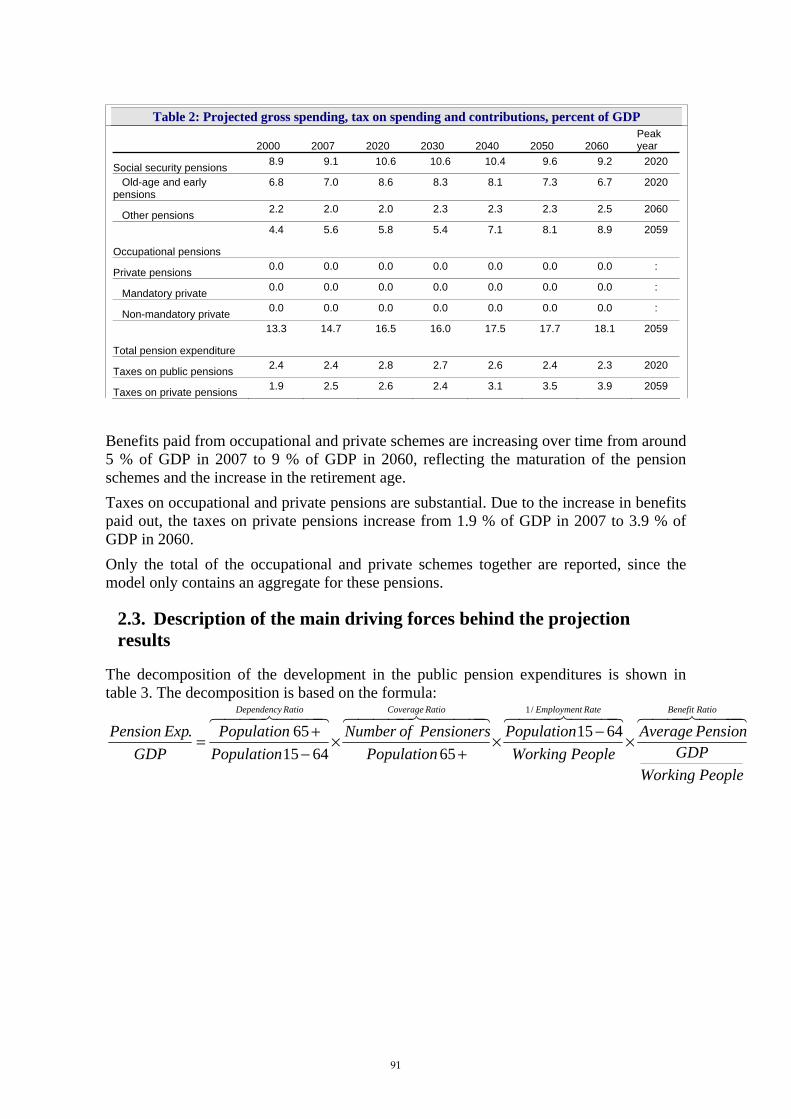
Table 2: Projected gross spending, tax on spending and contributions, percent of GDP
2000 2007 2020 2030 2040 2050 2060 Peak year
Social security pensions 8.9 9.1 10.6 10.6 10.4 9.6 9.2 2020
Old-age and early pensions
6.8 7.0 8.6 8.3 8.1 7.3 6.7 2020
Other pensions 2.2 2.0 2.0 2.3 2.3 2.3 2.5 2060
Occupational pensions
4.4 5.6 5.8 5.4 7.1 8.1 8.9 2059
Private pensions 0.0 0.0 0.0 0.0 0.0 0.0 0.0 :
Mandatory private 0.0 0.0 0.0 0.0 0.0 0.0 0.0 :
Non-mandatory private 0.0 0.0 0.0 0.0 0.0 0.0 0.0 :
Total pension expenditure
13.3 14.7 16.5 16.0 17.5 17.7 18.1 2059
Taxes on public pensions 2.4 2.4 2.8 2.7 2.6 2.4 2.3 2020
Taxes on private pensions 1.9 2.5 2.6 2.4 3.1 3.5 3.9 2059
Benefits paid from occupational and private schemes are increasing over time from around 5 % of GDP in 2007 to 9 % of GDP in 2060, reflecting the maturation of the pension schemes and the increase in the retirement age. Taxes on occupational and private pensions are substantial. Due to the increase in benefits paid out, the taxes on private pensions increase from 1.9 % of GDP in 2007 to 3.9 % of GDP in 2060. Only the total of the occupational and private schemes together are reported, since the model only contains an aggregate for these pensions.
2.3. Description of the main driving forces behind the projection results
The decomposition of the development in the public pension expenditures is shown in table 3. The decomposition is based on the formula:
444 8444 76444 8444 764444 84444 76444 8444 76 RatioBenefitRateEmploymentRatioCoverageRatioDependency
PeopleWorkingGDP
PensionAveragePeopleWorking
PopulationPopulation
PensionersofNumberPopulationPopulation
GDPExpPension ×−×
+×
−+=
/1
6415656415
65.
91

Table 3: Factors behind the public pension expenditures between 2007 and 2060 (in percentage points of GDP)
2007-20 2020-30 2030-40 2040-50 2050-60 2007-60
Public pensions to GDP in a starting year
1.6 -0.1 -0.2 -0.8 -0.4 0.1
Dependency ratio 3.3 1.9 1.3 -0.3 0.3 6.5
Coverage ratio -1.1 -1.7 -1.0 -0.4 -0.7 -4.9
1/Employment rate 0.0 0.0 -0.1 0.0 0.0 -0.1
Benefit ratio -0.4 0.0 -0.2 -0.1 0.1 -0.5
The decomposition shows that the dependency ratio gives rise to an increase in the public pension expenditures. The expenditures are kept at the same level in 2060 compared to 2007 mainly due to the decrease in the coverage ratio, which is caused by the increase in the retirement age as decided with the Welfare Agreement. Virtually everyone is covered in the old age pension scheme, cf. table 2.3. The coverage rate remains stable throughout the period due to the fact that income transfers are indexed, as a general rule, with nominal wages. The gross replacement rate is lower than the net replacement rate since pensions are not subject to the payroll tax of 8 %. In addition, the progressivity of the tax system also raises the net replacement rate above the gross replacement rate. The occupational (and private) schemes cover approximately 50 percent of the pensioners in 2007 increasing to above 60 percent in 2060 and they are therefore also important to take into account when calculating the replacement rate. Again, only the total coverage and replacement rate for occupational and private schemes are reported, since the model only contains an aggregate for these pensions. The replacement rate in the occupational and private schemes increases from 37 % in 2007 to 50 % by 2060, due to the maturation of the occupational schemes and a longer period of employment because of the Welfare Reform. In the AWG framework, the coverage of the occupational schemes is calculated as a ratio of the number of pensioners within the scheme and the total number of pensioners in the country, including people on disability pension and VERP. Since the occupational schemes are usually paid out to people on old age pension, a calculation of the coverage ratio as the number of pensioners in the scheme divided by the number of people on old age pension gives a better picture of the actual coverage. Using this method, the coverage ratio is around 90 percent throughout the period. Also, people on disability pensions already get higher benefits than people on old age pension. In addition, there is a subsidised voluntary pension for people on disability pension, which is paid out at the age of "retirement". With respect to people on the VERP scheme, they also receive a higher benefit than people on old-age pension. In addition, there are tax incentives for people on the VERP to postpone the payment of occupational pensions until they reach the age of old age pension.
92

Table 4: Gross replacement rate and coverage by pension scheme (in %)
2000 2007 2020 2030 2040 2050 2060
Social security scheme 35.0 33.4 33.4 33.4 33.4 33.4 33.4
Coverage 100.0 100.0 100.0 100.0 100.0 100.0 100.0
Occupational scheme 34.6 37.4 27.6 26.5 33.5 41.4 50.3
Coverage 50.4 55.7 63.9 62.3 64.6 65.4 62.4
Private scheme - - - - - - -
Coverage - - - - - - - Note: Occupational schemes include private schemes
The number of pensioners increases from 2007 until around 2025, where the retirement age increases due to the Welfare Agreement. This leads to a slight decrease in the number pensioners throughout the rest of the projection period. The number of people aged 65+ increases throughout the period and is almost doubled in 2060 compared to 2007. The number of pensioners exceeds the number 65+ due to the fact that people on disability pension and VERP have not yet reached the age of 65. The coverage ratio drops below 100 in 2060 due to the increase in the retirement age.
Table 5: Number of pensioners and contributors in the Social security scheme (in 1000), population over 65 and total employment (in 1000) and related ratios (%)
2000 2007 2020 2030 2040 2050 2060
Number of pensioners (I) 1.228 1.334 1.607 1.585 1.584 1.500 1.428
Number of people aged 65+ (II) 790 835 1.139 1.325 1.460 1.443 1.483
Ratio of (I) and (II) 155 160 141 120 108 104 96
Number of contributors (III) 2.712 2.822 2.798 2.779 2.774 2.838 2.844
Employment (IV) 2.712 2.822 2.798 2.779 2.774 2.838 2.844
Ratio of (III) and (IV) 100 100 100 100 100 100 100
Ratio of (III) and (I) “support ratio” 221 211 174 175 175 189 199
Due to the development in the number of pensioners and an almost constant employment in the projection period, the support ratio is almost unchanged in 2060 compared to 2007. The ratio decreases in the middle of the projection period due to the increase in the number of pensioners. The number of contributors is set equal to the employment, since the social security schemes are financed by the taxpayers and the employed people are the primary taxpayers. However, also transfer income recipients including pensions pay income taxes, so in this sense the number of contributors is higher than the number of employed.
93

Table 6: Assets of pension funds and reserves (% of GDP) 2000 2007 2020 2030 2040 2050 2060 Public pension funds 0 0 0 0 0 0 0 Occupational pensions 115.3 138.2 157.0 194.6 226.0 240.6 250.9 Private pensions - - - - - - - All pensions 115.3 138.2 157.0 194.6 226.0 240.6 250.9
Since the public pensions are PAYG, there is no accumulation of assets in the public pension sector, cf. table 6. The pension assets in the private sector are substantial and increasing due to the maturation of the occupational schemes and the increase in the retirement age. However, we are only able to report the total assets in the occupational and private schemes together, since the model only contains an aggregate for these pensions. The aggregate assets in the occupational and private schemes increase from 140 percent of GDP in 2007 to 250 percent of GDP by 2060.
2.4. Sensitivity analysis
The results from the sensitivity analyses are reported in table 7.
Higher life expectancy
Higher life expectancy will have an effect on the retirement age due to the indexation rule agreed on in the Welfare Reform from 2006. Therefore, the effect on public pension expenditures is limited, since the number of pensioners remains almost unchanged.
Higher labour productivity
Since pensions are indexed in line with nominal wages, a higher labour productivity does not alter the results in any perceptible way.
Higher interest rate A higher interest rate does not affect public pension expenditures, since there are no assets. The private pension expenditures increase due to larger accumulated assets, leading to higher benefits paid out. This will also lead to higher tax payments.
Higher employment rate and higher employment rate for older workers A higher employment rate increases GDP which lowers the public pension expenditures as a share of GDP marginally.
Public pensions are flat rate and therefore not earnings related. This is the reason why public pension expenditures do not increase when people spend more years on the labour market.
Zero migration This scenario results in higher expenditures than in the baseline scenario. The nominal expenditures does not change dramatically, but the lack of inflow of migrants reduces labour supply and employment and hence GDP, thereby increasing the relative expenditures.
94

Table 7: Total and public pension expenditures under different scenarios 2007 2020 2030 2040 2050 2060 Total pension expenditures Baseline 14.7 16.5 16.0 17.5 17.7 18.1 Higher life expectancy 14.7 16.5 16.1 17.5 17.4 18.0 Higher labour productivity 14.7 16.4 15.8 17.2 17.3 17.6 Higher interest rate 14.7 16.9 16.7 18.7 19.5 20.3 Higher employment rate 14.7 16.3 15.8 17.3 17.5 18.0 Higher employment rate for
older workers 14.7 16.3 15.8 17.3 17.5 18.0
Zero migration 14.7 16.8 16.7 18.7 19.3 19.8 Public pension expenditures Baseline 9.1 10.6 10.6 10.4 9.6 9.2 Higher life expectancy 9.1 10.7 10.7 10.4 9.8 9.4 Higher labour productivity 9.1 10.6 10.6 10.4 9.6 9.2 Higher interest rate 9.1 10.6 10.6 10.4 9.6 9.2 Higher employment rate 9.1 10.5 10.4 10.3 9.5 9.1 Higher employment rate for
older workers 9.1 10.5 10.4 10.3 9.5 9.1
Zero migration 9.1 10.9 11.1 11.2 10.6 10.1
2.5. Description of the changes in comparison with the 2001 and 2006 projections
The change in the pension expenditures relative to GDP is only 0.5 %-points in the 2009 projection, down from 3.2 %-points in the 2006, cf. table 8. The main driving force behind this result is the Welfare Reform, which will increase the retirement age and as a result of this, the coverage ratio will decrease.
Table 8: Decomposition of the change (in %) in public pension expenditure to GDP between 2007 and 2050 under the 2001, 2006 and 2009 projection exercises
% Change to 2050
Dependence ratio
Coverage ratio
Employment effect Benefit ratio
Pension/GDP – 2001* 2.7 4.1 0.5 -0.2 -1.7
Pension/GDP – 2006** 3.2 7.2 -2.8 -0.4 -0.5
Pension/GDP – 2009** 0.5 6.2 -4.2 -0.2 -0.8
* Decomposition period 2001-2050, ** Decomposition period 2004-2050, *** Decomposition period 2007-2050.
95

Germany (Report prepared by Britta Velleuer and Konrad Haker)
1. Overview of the pension system
1.1. Introduction
The German projections comprise the statutory and the civil servants pension schemes. The schemes provide old-age pension as well as survivors and disability insurance to 90 % of the employed population. The general pay-as-you-go earnings-related first pillar statutory pension scheme presently covers around 84 % of the employed German population. Another 6 % of the employed population is insured in a public funded civil servants scheme. Not covered are specific pension schemes for miners and farmers with pension expenditures of about 0.5 % of GDP as well as social assistance for pensioners which amounts to 0.1 % of GDP. The statutory pension system is operated by the "Deutsche Rentenversicherung" and administrated by the Ministry of Labour and Social Affairs. The civil servants pension scheme is operated by the Ministry of the Interior. In the following, if not stated otherwise, assertions refer to statutory pension scheme. The two major sources of funding stem from contribution payments of the insured and a government subsidy which accounts for almost a quarter of the budget. At present, insured employees and their employers each contribute 9.95 % of the employees gross wage. A minimum five years of contribution entitles for the benefits. The German statutory pension system has a strong orientation on the principle of contribution equivalence – that means high or low personal contributions transfer into pension claims of similar distribution. The statutory pension scheme does not provide minimum pensions. If individual old-age provision from all income sources is not sufficient, additional means tested benefits can be claimed from social assistance.
1.2. Calculation of pension and indexation of pensions
For each year of contributions, an insured person receives pension points that reflect the employees relative earnings position. The average wage in a particular year is equal to one pension point. When determining the individual pension, the sum of pension points is multiplied by the current value of one pension point (measured in Euro per month), a specific pension type factor (e.g. 1.0 for old-age pension at the age of 65 or 0.55 for a survivor pension). (1) ppvptppP ∗∗= with P = pension
pp = sum of pension points = ∑=
T
t
Øtt ee
1
= earning in year t te = average earning in year t Ø
te pt = pension type factor
96
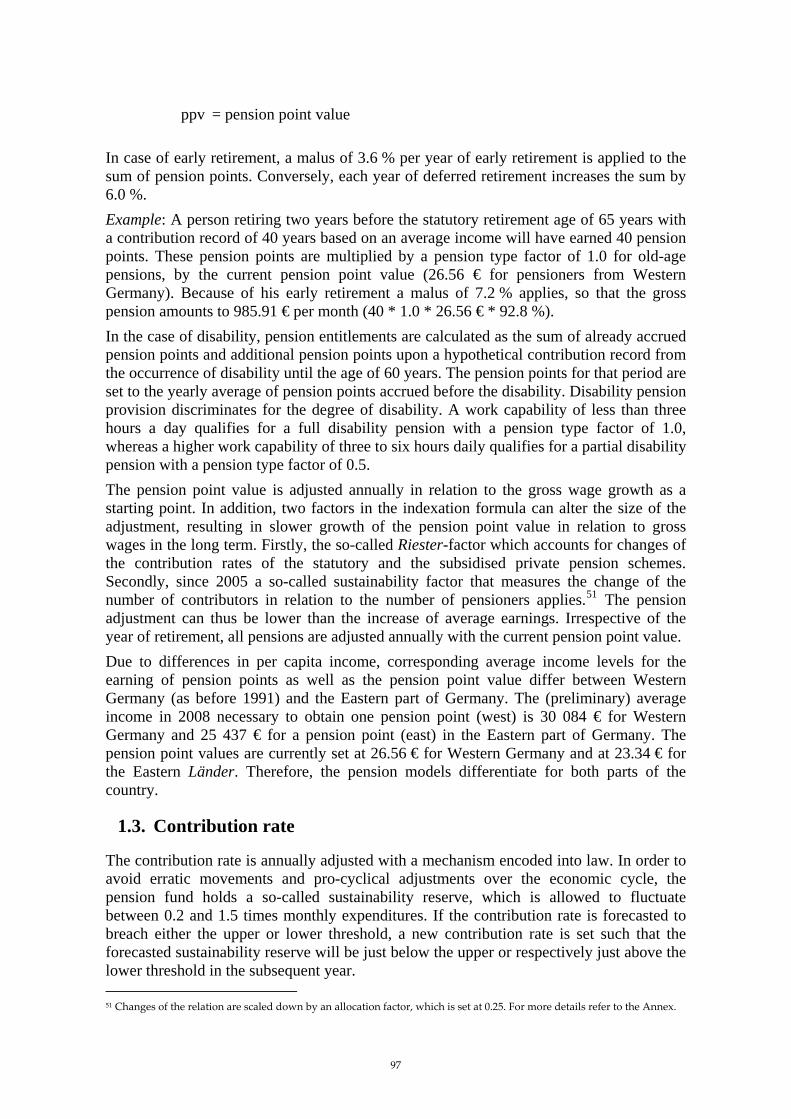
ppv = pension point value In case of early retirement, a malus of 3.6 % per year of early retirement is applied to the sum of pension points. Conversely, each year of deferred retirement increases the sum by 6.0 %. Example: A person retiring two years before the statutory retirement age of 65 years with a contribution record of 40 years based on an average income will have earned 40 pension points. These pension points are multiplied by a pension type factor of 1.0 for old-age pensions, by the current pension point value (26.56 € for pensioners from Western Germany). Because of his early retirement a malus of 7.2 % applies, so that the gross pension amounts to 985.91 € per month (40 * 1.0 * 26.56 € * 92.8 %). In the case of disability, pension entitlements are calculated as the sum of already accrued pension points and additional pension points upon a hypothetical contribution record from the occurrence of disability until the age of 60 years. The pension points for that period are set to the yearly average of pension points accrued before the disability. Disability pension provision discriminates for the degree of disability. A work capability of less than three hours a day qualifies for a full disability pension with a pension type factor of 1.0, whereas a higher work capability of three to six hours daily qualifies for a partial disability pension with a pension type factor of 0.5. The pension point value is adjusted annually in relation to the gross wage growth as a starting point. In addition, two factors in the indexation formula can alter the size of the adjustment, resulting in slower growth of the pension point value in relation to gross wages in the long term. Firstly, the so-called Riester-factor which accounts for changes of the contribution rates of the statutory and the subsidised private pension schemes. Secondly, since 2005 a so-called sustainability factor that measures the change of the number of contributors in relation to the number of pensioners applies.51 The pension adjustment can thus be lower than the increase of average earnings. Irrespective of the year of retirement, all pensions are adjusted annually with the current pension point value. Due to differences in per capita income, corresponding average income levels for the earning of pension points as well as the pension point value differ between Western Germany (as before 1991) and the Eastern part of Germany. The (preliminary) average income in 2008 necessary to obtain one pension point (west) is 30 084 € for Western Germany and 25 437 € for a pension point (east) in the Eastern part of Germany. The pension point values are currently set at 26.56 € for Western Germany and at 23.34 € for the Eastern Länder. Therefore, the pension models differentiate for both parts of the country.
1.3. Contribution rate
The contribution rate is annually adjusted with a mechanism encoded into law. In order to avoid erratic movements and pro-cyclical adjustments over the economic cycle, the pension fund holds a so-called sustainability reserve, which is allowed to fluctuate between 0.2 and 1.5 times monthly expenditures. If the contribution rate is forecasted to breach either the upper or lower threshold, a new contribution rate is set such that the forecasted sustainability reserve will be just below the upper or respectively just above the lower threshold in the subsequent year. 51 Changes of the relation are scaled down by an allocation factor, which is set at 0.25. For more details refer to the Annex.
97
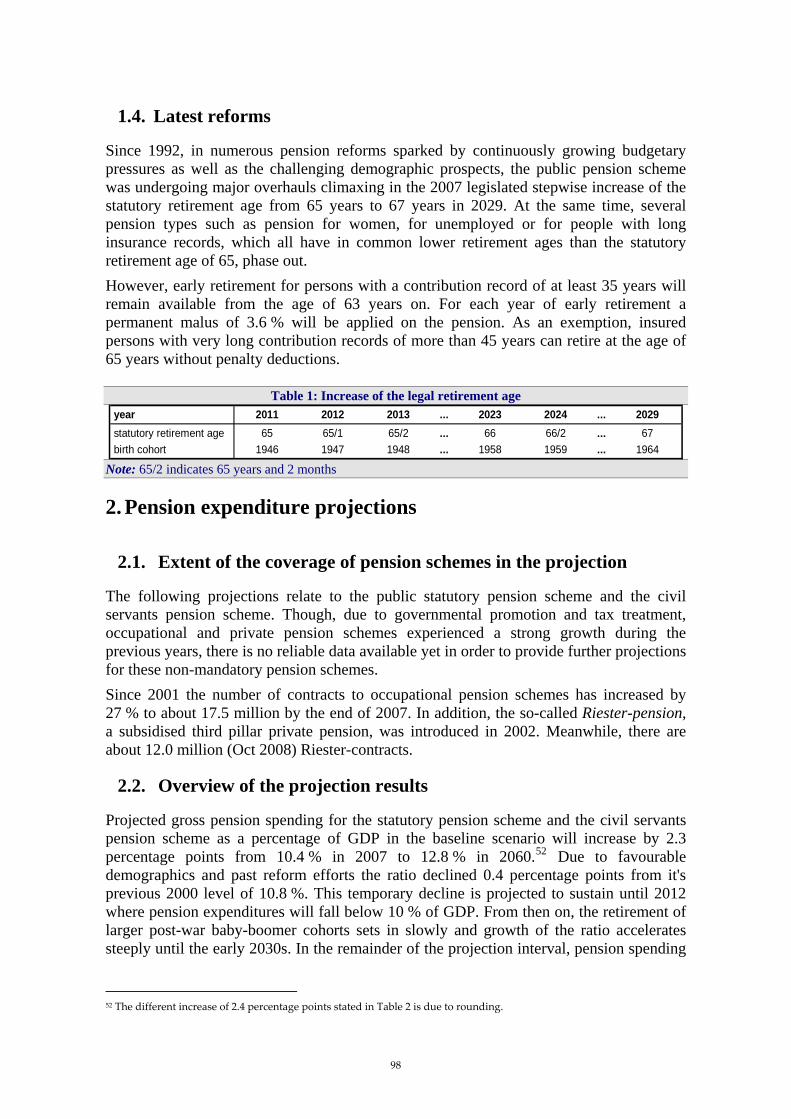
1.4. Latest reforms
Since 1992, in numerous pension reforms sparked by continuously growing budgetary pressures as well as the challenging demographic prospects, the public pension scheme was undergoing major overhauls climaxing in the 2007 legislated stepwise increase of the statutory retirement age from 65 years to 67 years in 2029. At the same time, several pension types such as pension for women, for unemployed or for people with long insurance records, which all have in common lower retirement ages than the statutory retirement age of 65, phase out. However, early retirement for persons with a contribution record of at least 35 years will remain available from the age of 63 years on. For each year of early retirement a permanent malus of 3.6 % will be applied on the pension. As an exemption, insured persons with very long contribution records of more than 45 years can retire at the age of 65 years without penalty deductions.
Table 1: Increase of the legal retirement age year 2011 2012 2013 ... 2023 2024 ... 2029statutory retirement age 65 65/1 65/2 ... 66 66/2 ... 67birth cohort 1946 1947 1948 ... 1958 1959 ... 1964
Note: 65/2 indicates 65 years and 2 months
2. Pension expenditure projections
2.1. Extent of the coverage of pension schemes in the projection
The following projections relate to the public statutory pension scheme and the civil servants pension scheme. Though, due to governmental promotion and tax treatment, occupational and private pension schemes experienced a strong growth during the previous years, there is no reliable data available yet in order to provide further projections for these non-mandatory pension schemes. Since 2001 the number of contracts to occupational pension schemes has increased by 27 % to about 17.5 million by the end of 2007. In addition, the so-called Riester-pension, a subsidised third pillar private pension, was introduced in 2002. Meanwhile, there are about 12.0 million (Oct 2008) Riester-contracts.
2.2. Overview of the projection results
Projected gross pension spending for the statutory pension scheme and the civil servants pension scheme as a percentage of GDP in the baseline scenario will increase by 2.3 percentage points from 10.4 % in 2007 to 12.8 % in 2060.52 Due to favourable demographics and past reform efforts the ratio declined 0.4 percentage points from it's previous 2000 level of 10.8 %. This temporary decline is projected to sustain until 2012 where pension expenditures will fall below 10 % of GDP. From then on, the retirement of larger post-war baby-boomer cohorts sets in slowly and growth of the ratio accelerates steeply until the early 2030s. In the remainder of the projection interval, pension spending
52 The different increase of 2.4 percentage points stated in Table 2 is due to rounding.
98

in relation to GDP will continuously expand modestly and peaks in the final projection year.
Table 2: Projected gross pension spending, tax on pension and contributions (% of GDP) 2000 2007 2020 2030 2040 2050 2060 Peak
year * Social security pensions 10.8 10.4 10.5 11.5 12.1 12.3 12.8 2060 Old-age and early pensions
10.8 10.4 10.5 11.5 12.1 12.3 12.8 2060
Other Pensions : : : : : : : : Occupational pensions : : : : : : : : Private pensions : : : : : : : : Mandatory private : : : : : : : : Non-Mandatory private : : : : : : : : Total pension expenditure 10.8 10.4 10.5 11.5 12.1 12.3 12.8 2060 Taxes on public pensions 1.3 1.7 1.7 2.0 2.2 2.3 2.4 2060 Taxes on private pensions : : : : : : : :
Note: Disability and survivors pension expenditures cannot be calculated separately and are therefore included in the old-age and early pensions
Germany is undergoing a change in the tax regime relating to contributions and pensions legislated with the Old Age Income Act (Alterseinkünftegesetz) in 2005. Taxation of pensions from statutory pension insurance is gradually changed from a system where contributions were partially taxed whereas pension benefits were practically exempted to a system where contributions are fully exempted whereas pension benefits are completely subject to tax. A long transition period is provided for this rearrangement. Contributions will be completely exempted from taxation by the year 2025 and pensions will be completely liable to taxation by 2040. Taxes on public pensions take into account social security contributions (health care and long term care) of pensioners on the one hand as well as estimates on personal income taxes paid by pensioners on the other hand. These estimates were compiled in 2004 during the legislative process considering the change of the tax regime in Germany. As more recent estimates are not available, income tax rates of the 2004 estimate are applied in the 2009 projection. The projection on taxes should not be used in the sustainability analysis. The civil servant pension expenditures as percentage of GDP will undergo a stark increase from the baseline year level (1.5 %) until 2020 (1.9 %). Afterwards, the ratio remains constant until the end of the projection sample. The divergent development compared to the statutory public pension scheme until 2020 is a consequence of an older workforce compared to the insured of the statutory pension system.
Table 3: Projected gross public pension spending: by scheme (as % of GDP) 2000 2007 2020 2030 2040 2050 2060 Peak year *
Total social security pensions
10.8 10.4 10.5 11.5 12.1 12.3 12.8 2060
of which Public sector employees 1.5 1.5 1.9 2.0 1.9 1.9 2.0 2060
Private sector employees 9.3 8.9 8.6 9.5 10.1 10.4 10.7 2060
2.3. Description of main driving forces
99

This part provides more details about the development of public pension expenditures (table 4). It uses a standard decomposition of a ratio of pension expenditures to GDP into the dependency, coverage and benefit ratio and an employment rate:
444 8444 76444 8444 764444 84444 76444 8444 76 RatioBenefitRateEmploymentRatioCoverageRatioDependency
PeopleWorkingGDP
PensionAveragePeopleWorking
PopulationPopulation
PensionersofNumberPopulationPopulation
GDPExpPension ×−×
+×
−+=
/1
6415656415
65.
Note: 'Average pension' = social security pension expenditure divided by the number of pensioners
The force that drives the prospective pension expenditures clearly is the dependency ratio. The mere demographical change measured by the dependency ratio would itself account for a 75 % increase in pension expenditures to GDP over the projection sample. Most of the increase occurs until the mid 2030s with the retirement of the baby-boomer cohorts. The continued rise of the dependency ratio during the second half of the projection is due to the assumed 30 % drop in net migration as well as the low total fertility rate starting at around 1.3 in the base year climbs only slowly to 1.5 in 2060. The coverage ratio, the inverted employment rate and the benefit ratio act as offsetting factors counterbalancing the surge in demographic related expenditures. On behalf the coverage ratio, the removal of early retirement incentives as well as the increase of the statutory retirement age to 67 years result in delayed pension entries of future pensioners and thus lower the coverage ratio, which has the population aged 65 and older as denominator. In addition, a narrowing of the gender life expectancy gap coupled with a falling probability of marriage in future pension cohorts will size the number of survivor pensions down. The effect of the increased retirement age will start to cease in 2031, from when on the statutory retirement age of 67 years applies to all new pensioners. The impact of the coverage ratio after 2040 is negligible. The benefit ratio further reduces increments of the expenditure to GDP ratio. Three factors contribute to the evolution of the benefit ratio. The sustainability factor introduced in 2005, which accounts for the relation of pensioners to contributors, will lower the further appreciation of the pension point value compared to the growth of earnings. Secondly, the average pension paid to new retirees is lower than the average stock pension, as the penalty deductions for early retirement introduced in the late 1990s will increasingly unfold their full impact. Though unemployment still generates pension claims, rising unemployment since the early 1990s has also an impact, especially for those with long periods of unemployment in their contribution record. A third factor is growing female labour participation rates and postponed retirement in line with the rising statutory retirement age which will increase pension claims. This effect is reinforced as deferred retirement exerts a positive impact on pension adjustments via the sustainability factor as the relation of contributors to pensioners increases. A negative impact on the benefit ratio dominates until 2040, thereafter the positive effect of longer contribution records compensates further deteriorations. The inverse employment rate takes a steep decline until the early 2020s as the assumed increase of older workers labour participation enlarges the workforce. Though, the increase of the statutory retirement age does not yet fully apply by then, it is assumed that contributors adjust for longer working careers earlier. For the remainder subsample the employment rate's influence is marginal.
100
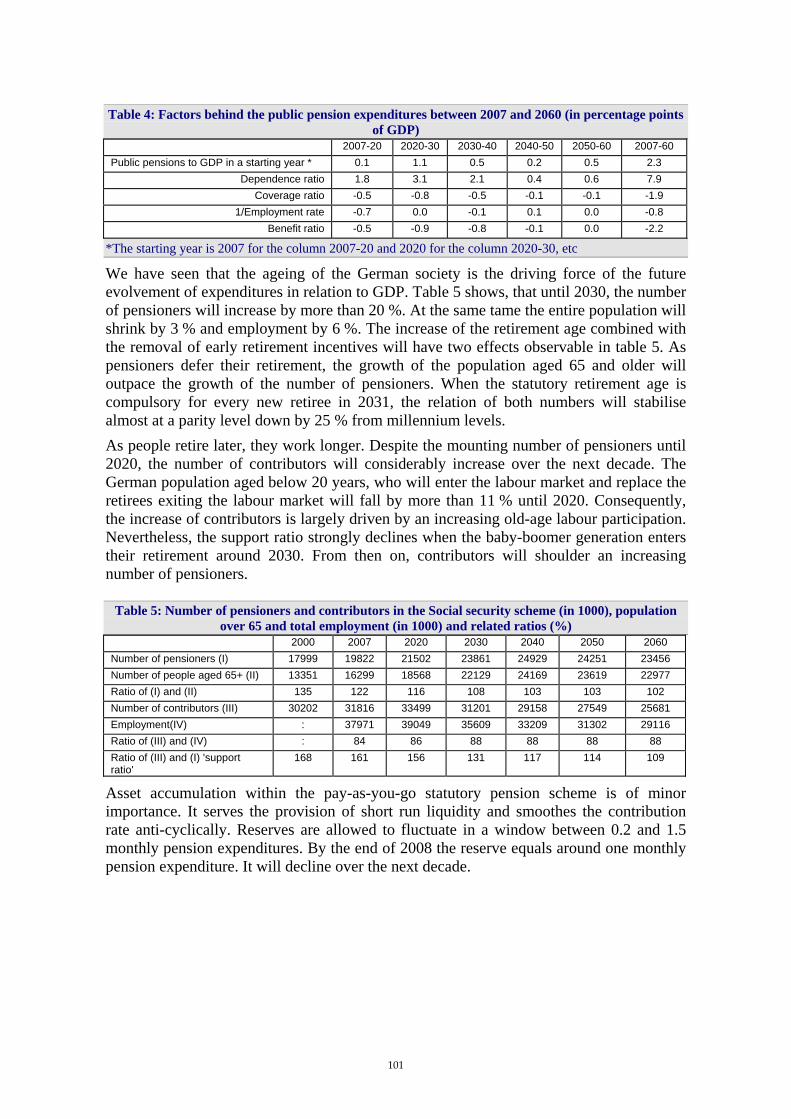
Table 4: Factors behind the public pension expenditures between 2007 and 2060 (in percentage points of GDP)
2007-20 2020-30 2030-40 2040-50 2050-60 2007-60 Public pensions to GDP in a starting year * 0.1 1.1 0.5 0.2 0.5 2.3
Dependence ratio 1.8 3.1 2.1 0.4 0.6 7.9 Coverage ratio -0.5 -0.8 -0.5 -0.1 -0.1 -1.9
1/Employment rate -0.7 0.0 -0.1 0.1 0.0 -0.8 Benefit ratio -0.5 -0.9 -0.8 -0.1 0.0 -2.2
*The starting year is 2007 for the column 2007-20 and 2020 for the column 2020-30, etc
We have seen that the ageing of the German society is the driving force of the future evolvement of expenditures in relation to GDP. Table 5 shows, that until 2030, the number of pensioners will increase by more than 20 %. At the same tame the entire population will shrink by 3 % and employment by 6 %. The increase of the retirement age combined with the removal of early retirement incentives will have two effects observable in table 5. As pensioners defer their retirement, the growth of the population aged 65 and older will outpace the growth of the number of pensioners. When the statutory retirement age is compulsory for every new retiree in 2031, the relation of both numbers will stabilise almost at a parity level down by 25 % from millennium levels. As people retire later, they work longer. Despite the mounting number of pensioners until 2020, the number of contributors will considerably increase over the next decade. The German population aged below 20 years, who will enter the labour market and replace the retirees exiting the labour market will fall by more than 11 % until 2020. Consequently, the increase of contributors is largely driven by an increasing old-age labour participation. Nevertheless, the support ratio strongly declines when the baby-boomer generation enters their retirement around 2030. From then on, contributors will shoulder an increasing number of pensioners.
Table 5: Number of pensioners and contributors in the Social security scheme (in 1000), population over 65 and total employment (in 1000) and related ratios (%)
2000 2007 2020 2030 2040 2050 2060 Number of pensioners (I) 17999 19822 21502 23861 24929 24251 23456 Number of people aged 65+ (II) 13351 16299 18568 22129 24169 23619 22977 Ratio of (I) and (II) 135 122 116 108 103 103 102 Number of contributors (III) 30202 31816 33499 31201 29158 27549 25681 Employment(IV) : 37971 39049 35609 33209 31302 29116 Ratio of (III) and (IV) : 84 86 88 88 88 88 Ratio of (III) and (I) 'support ratio'
168 161 156 131 117 114 109
Asset accumulation within the pay-as-you-go statutory pension scheme is of minor importance. It serves the provision of short run liquidity and smoothes the contribution rate anti-cyclically. Reserves are allowed to fluctuate in a window between 0.2 and 1.5 monthly pension expenditures. By the end of 2008 the reserve equals around one monthly pension expenditure. It will decline over the next decade.
101

Table 6: Assets of pension funds and reserves, (% of GDP) 2000 2007 2020 2030 2040 2050 2060
Public Pension funds 0.7 0.6 0.5 0.2 0.2 0.2 0.2 Of which liquid financial assets, non-consolidated : : : : : : :
Of which liquid financial assets, consolidated : : : : : : : Occupational pensions : : : : : : : Private pensions : : : : : : : All pensions 0.7 0.6 0.5 0.2 0.2 0.2 0.2
2.4. Sensitivity analysis
Sensitivity analysis shows that apart from the zero migration scenario, calculated pension expenditures to GDP fluctuate in a band of a mere 2 % around the values for the baseline scenario. Because of the pay-as-you-go nature of the pension system, changes of the interest rate have virtually no impact on pension expenditures. Because of the wage indexation of pensions, the gains of higher productivity are shared by contributors and pensioners. Hence, there is almost no change of the higher labour productivity scenario compared to the baseline scenario. As higher employment rates will not only lead to a higher GDP but also transfer into larger pension entitlements, there is only a small perceivable amelioration on the revenue side. After the retirement of the baby-boomer generation around 2030, the positive effect of higher employment rates is gradually diminishing in both employment scenarios. Even in the high life expectancy scenario, because of the sustainability factor in the indexation formula there is only a sub proportional increase of pension expenditures relative to GDP. Compared to the baseline scenario, assuming zero net migration results in a 14 % higher expenditure ratio by 2060, as compared to the baseline scenario a cumulated 8.2 million mostly younger (net) immigrants would be missing over the projection horizon. Whereas the impact would not be felt much before the retirement of the baby-boomer generation, the pension burden grows fast-paced thereafter for the following ever smaller cohorts. However, in the very long-run the effect would vanish.
Table 7: Total and public pension expenditures under different scenarios (deviation from baseline scenario)
2007 2020 2030 2040 2050 2060 Total Pension Expenditure
Baseline 10.4 10.5 11.5 12.1 12.3 12.8 Higher life expectancy 10.4 10.5 11.6 12.2 12.5 13.0 Higher lab. productivity 10.4 10.5 11.6 12.1 12.4 12.8 Higher interest rate 10.4 10.5 11.5 12.1 12.3 12.8 Higher emp. rate 10.4 10.3 11.4 12.0 12.2 12.7 Higher emp. of older workers 10.4 10.3 11.4 12.0 12.2 12.7 Zero migration 10.4 10.7 12.1 13.2 13.9 14.6
2.5. Description of the changes in comparison with the 2001 and 2006 projections
The projected increase (1.9 percentage points; table 8) of public pension expenditure ratio until 2050 did not change compared to the previous 2006 projection exercise. However,
102
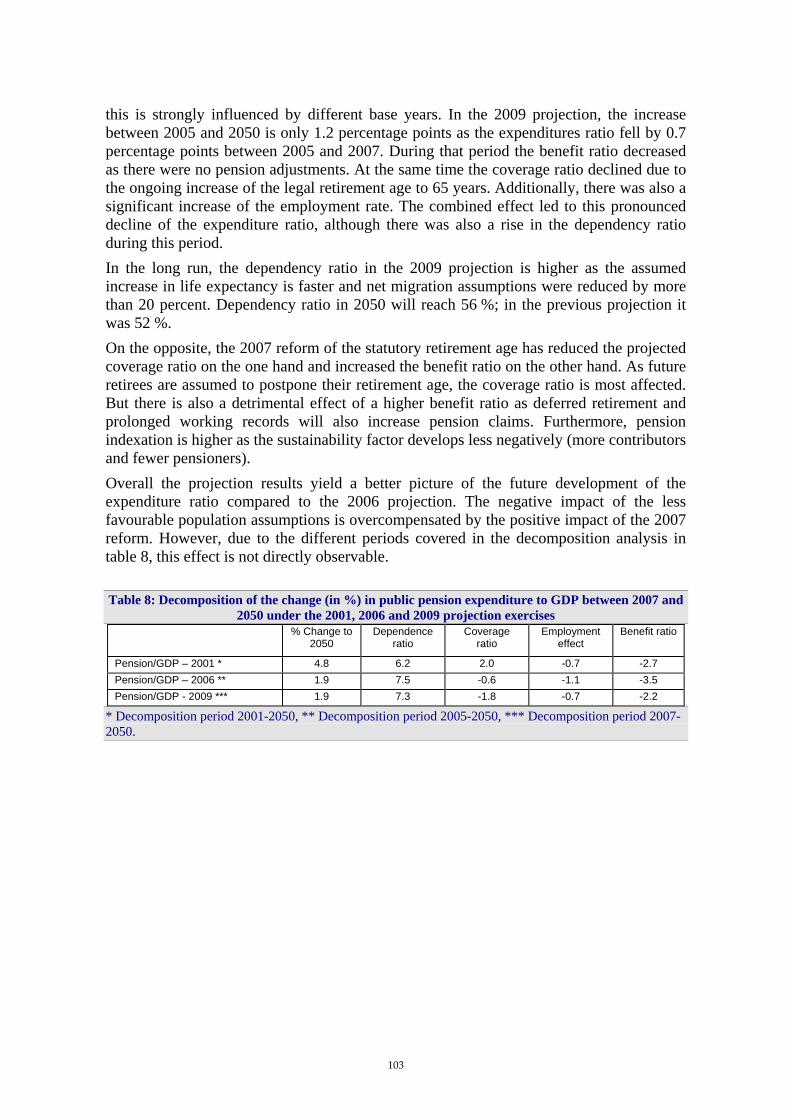
this is strongly influenced by different base years. In the 2009 projection, the increase between 2005 and 2050 is only 1.2 percentage points as the expenditures ratio fell by 0.7 percentage points between 2005 and 2007. During that period the benefit ratio decreased as there were no pension adjustments. At the same time the coverage ratio declined due to the ongoing increase of the legal retirement age to 65 years. Additionally, there was also a significant increase of the employment rate. The combined effect led to this pronounced decline of the expenditure ratio, although there was also a rise in the dependency ratio during this period. In the long run, the dependency ratio in the 2009 projection is higher as the assumed increase in life expectancy is faster and net migration assumptions were reduced by more than 20 percent. Dependency ratio in 2050 will reach 56 %; in the previous projection it was 52 %. On the opposite, the 2007 reform of the statutory retirement age has reduced the projected coverage ratio on the one hand and increased the benefit ratio on the other hand. As future retirees are assumed to postpone their retirement age, the coverage ratio is most affected. But there is also a detrimental effect of a higher benefit ratio as deferred retirement and prolonged working records will also increase pension claims. Furthermore, pension indexation is higher as the sustainability factor develops less negatively (more contributors and fewer pensioners). Overall the projection results yield a better picture of the future development of the expenditure ratio compared to the 2006 projection. The negative impact of the less favourable population assumptions is overcompensated by the positive impact of the 2007 reform. However, due to the different periods covered in the decomposition analysis in table 8, this effect is not directly observable. Table 8: Decomposition of the change (in %) in public pension expenditure to GDP between 2007 and
2050 under the 2001, 2006 and 2009 projection exercises % Change to
2050 Dependence
ratio Coverage
ratio Employment
effect Benefit ratio
Pension/GDP – 2001 * 4.8 6.2 2.0 -0.7 -2.7 Pension/GDP – 2006 ** 1.9 7.5 -0.6 -1.1 -3.5 Pension/GDP - 2009 *** 1.9 7.3 -1.8 -0.7 -2.2
* Decomposition period 2001-2050, ** Decomposition period 2005-2050, *** Decomposition period 2007-2050.
103

Estonia (Report prepared by Tanel Steinberg and Pille Mihkelson)
1. Overview of the pension system
Estonian pension system is based on the three-pillar approach, where the first pillar is the state pension fund and which is included to general government accounts. Second pillar is mandatory to newcomers to the labour market (and to all the persons born 1983 and later), and third pillar is voluntary pension scheme. Second and third pillar pension funds are not included in general government accounts but second pillar funds are included in context of EPC AWG projection exercise because of it having significant impact on future pensions. A multi-pillar pension scheme rests on the assumption that income in retirement age is to be formed from several different sources, each with different legal, organisational and financial principles. The current legal principles of state pension insurance are effective since 1999-2000. Then it was established that the right and the amount of the future old age pension is tied to the amounts of social tax paid by or on behalf of the person over the full career. Mandatory funded pension started from 2002. Possibilities for supplementary funded pension were created in 1998. The first pillar of the Estonian pension scheme is state pension insurance based on pay-as-you-go financing and covers three social risks: old age, permanent incapacity for work and loss of a provider. Protection ensured by state pension insurance includes two levels: 1) National pensions ensured for all residents of Estonia; 2) Old-age, incapacity-for-work and survivor’s pensions based on former work input.
A right to national pension on the basis of age starts from the age of 63, on the condition that the pension applicant has lived in Estonia for at least 5 years. National pension is paid in the fixed rate, in the so-called national pension rate. In 2008, the retirement age for men is 63 and for women 60 years and 6 months. The age limit for women is rising and will be equalized with that of the men by 2016. The qualification period for old age pension is 15 years of pensionable service in Estonia. Old age pension consists of three parts: base amount, length-of-service component and insurance component. The base amount is a flat-rate element. The length-of-service component applies to periods of pensionable service through the end of 1998 and depends on the length of service (in years). The insurance component applies to pensionable service from 1999 and depends on social tax paid by the person (in case of self-employment) or on behalf of the person by the employer or by the state. Since 1999, old age pension rights are acquired only on basis of social tax paid. Until 1999, pension rights were determined on the basis of the length of service. The pension formula includes a gradual transition from the old rules to the new rules. For persons who withdraw from work before 1999, the state pension depends only on the flat rate base amount and the length of service. For persons who entered the labour market in 1999 or later, the state pension also consists of two parts: base amount and insurance component.
104

In essence, the three-part pension formula applies only to those generations who have acquired pensionable service both before and after 1999. The pension formula used since 2000 can be described as follows:
∑⋅+⋅+= AVsVBP where: P – amount of pension (in EEK); B – base amount (in EEK); s – pensionable length of service (up to 1999, in years)
∑A – sum of annual pension insurance coefficients; V – cash value of one year of pensionable length of service and the pension insurance coefficient 1.0 (in EEK). To calculate the annual pension insurance coefficient for a given individual, the amounts of state pension insurance part of social tax paid or calculated for the person in the specific calendar year are divided by the Estonian annual average amount of the pension insurance part of social tax. Hence, annual pension insurance coefficient reflects the ratio of social tax calculated on the earnings of the person to the Estonian average. Real values of pensions are influenced by the values of the base amount (B) and the cash value of the annual score (V), which are subject to regular indexation (see below). From 1 April 2008, the base amount (B) is EEK 1699.94 (€108.65), which is ca 37% of the average old age pension and the cash value of annual score (V) is EEK 65.01 (€4.16). State pension insurance is financed mainly from the state pension insurance part of social tax. The rate of state pension insurance part of social tax is 16% for persons having joined the II pension pillar and 20% for those who have not joined. The expenses of national pensions and pension supplements are covered from other revenues of the state budget. If necessary, the state budget shall also cover any current deficit of the pension insurance budget, i.e. any difference between social tax revenues and expenditures on pensions. Increasing of actual pension payments is performed through regularindexation. Up to 2008 the pension index was based on social tax increase and on consumer price index with equal weights (50% and 50%). The change in 2008 was implemented to guarantee the stable increase of pensions, to ensure the higher benefit rates to older generations and to diminish the need for one-off and ad hoc increases, which used to be policy for many government coalitions before. The indexation system in place currently is still based on social tax and inflations but the weights have been changed. Pension index is a sum of 80% of social tax increase and 20% of the annual increase in consumer price index. In addition, when applying the index to the parts of the pension, different co-efficient are used – 0,9 for the cash value of annual score and 1,1 to base amount of pension. So the index, which is applied starting from 2008, is calculated as follows:
)1()2(
)1( 2,0)1(8,0 −−
− ⋅+−⋅= NYearNTear
NYearYearN CPI
SocialTaxSocialTax
i
105

and is applied to pension formula in following way:
∑⋅⋅⋅++⋅+⋅⋅+= )()9,01()1,11( AVisVBiP
According to Pension Insurance Act, the Government of Estonia has to analyse the impact of the increase in pensions to financial and social sustainability and suggest to the parliament the changes in indexation in every 5 years. Besides the general state pension insurance, the Estonian pension system also includes some special schemes – old age pensions at favourable conditions and superannuated pensions, enabling representatives of specific professions or persons with specific social status to retire before the general retirement age. Also, some categories of civil servants (for example judges, prosecutors, officials of the State Audit Office, police officers, members of the Defence Forces, Chancellor of Justice) have a right to favourable special pensions. The second pillar of the Estonian pension system is a mandatory funded pension based on full pre-financing and covering only the risk of old age. Private asset management companies administer the II pillar pension funds. In essence, the II pillar is an individual savings scheme, where the size of pension depends on the total contributions over the career and rate of return of the pension fund. Participation in the II pillar is mandatory for persons born in 1983 or later. People born prior 1983 and participating at the labour market can join the II pillar on voluntary basis. The rate of the II pillar contribution is 6% of wages – the employee pays 2% from gross wages, which is supplemented by the state with 4% of gross wage on the account of social tax paid by the employer. The retirement age in the II pillar is the same as in I pillar. An additional requirement to receive a funded pension is the fulfilment of a qualification period of 5 years, which has to be passed from the date of commencing the payment of contributions. II pillar was launched in July 2002. Thus the payment of first benefits shall commence from 2009 (benefits on the basis of inheritance started from 2007). According to the law the main payment modality is a compulsory lifetime annuity. Insurers are allowed to offer only base (insurance) products for policy holders. Joint products are also allowed but they have to meet the requirements of the base product. A guaranteed period may be stipulated so that the beneficiary or beneficiaries specified in a contract are entitled to payments made pursuant to the contract if the insured dies during the guaranteed period. In the end of October 2008, there were more than 578 thousand switchers in mandatory funded pension scheme. More than 55% of employees and more than 65% of eligible persons have joined the II pillar (around 2/3 of switchers are currently employed).
2. Pension expenditure projections
2.1. Extent of the coverage of the pension schemes in the projections
Long-term pension budget model includes all types of pensions (including II pillar pensions), non-mandatory private III pillar is excluded (due to lack of data) together with other social benefits.
106

2.2. Overview of projection results
The expected development of Social Security and Mandatory private pensions spending to GDP between 2007 and 2060. Social security pension spending will fall mainly due to implementation of mandatory private II pillar and decreasing number people in age cohorts who are employed (social tax revenues will decrease) while the number of pensioners will remain the same. Part of the social tax, together with pension rights, is switched to the funded private pension funds for the people who have joined the second pension pillar. Even with changes in pension index, which will result in much higher benefit level for the retired, the overall level of spending to GDP will fall. This will, however be compensated with payouts from the II pillar, ensuring the replacement rate to remain close to current level. Taxes on pensions are not included in model neither in projections. The reason behind this is the high level of tax-exempted income for retired. The monthly threshold of pensions exempted from income tax EEK 3000 (€192) is applied together with income tax free overall threshold of EEK 2250 (€144) in 2008. The average pension in 2008 (EEK 4588 or €293) remains considerably lower than the taxable level of pensions, thus the collected amount of tax revenue on pension is marginal. Income tax act foresees the further increases of tax-free threshold, so the assumption is that the tax collected on pensions will remain marginal.
Table 1: Projected gross pension spending, tax on pension and contributions (% of GDP) 2000 2007 2020 2030 2040 2050 2060 Peak year
* Social security pensions 0.0 5.6 5.9 5.6 5.4 5.3 4.9 2009 Old-age and early pensions
0.0 4.9 5.0 4.8 4.7 4.7 4.3 2009
Other Pensions 0.0 0.7 0.8 0.8 0.7 0.6 0.6 2011 Occupational pensions 0.0 0.0 0.0 0.0 0.0 0.0 0.0 : Private pensions 0.0 0.0 0.1 0.3 0.7 1.5 1.8 2060 Mandatory private 0.0 0.0 0.1 0.3 0.7 1.5 1.8 2060 Non-Mandatory private 0.0 : : : : : : : Total pension expenditure 0.0 5.6 6.0 5.9 6.1 6.8 6.7 2055 Taxes on public pensions 0.0 : : : : : : : Taxes on private pensions 0.00 : : : : : : :
* This column represents a Peak year, i.e. the year in which the particular variable reaches its maximum over the interval 2000 to 2060.
2.3. Description of main driving forces behind the projection results and their implications for main items from a pension questionnaire
This part provides more details about the development of public pension expenditures (Table 2). It uses a standard decomposition of a ratio of pension expenditures to GDP into the dependency, coverage and benefit ratio and an employment rate:
107
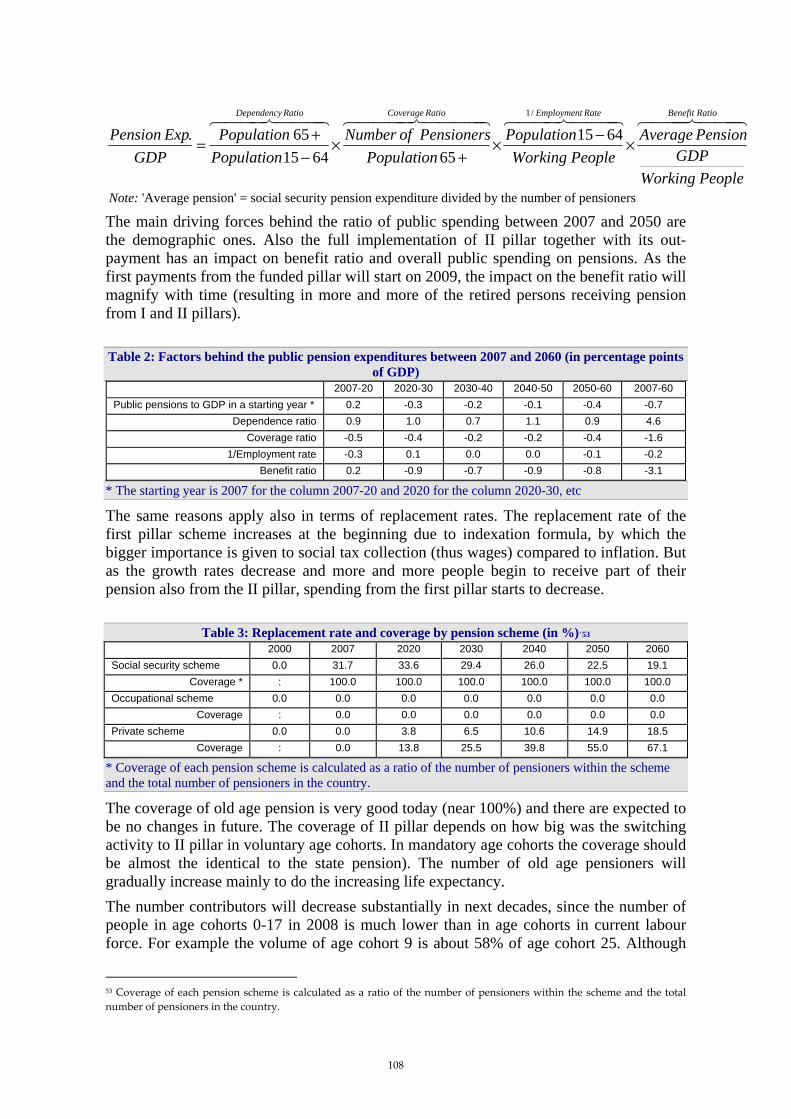
444 8444 76444 8444 764444 84444 76444 8444 76 RatioBenefitRateEmploymentRatioCoverageRatioDependency
PeopleWorkingGDP
PensionAveragePeopleWorking
PopulationPopulation
PensionersofNumberPopulationPopulation
GDPExpPension ×−×
+×
−+=
/1
6415656415
65.
Note: 'Average pension' = social security pension expenditure divided by the number of pensioners
The main driving forces behind the ratio of public spending between 2007 and 2050 are the demographic ones. Also the full implementation of II pillar together with its out-payment has an impact on benefit ratio and overall public spending on pensions. As the first payments from the funded pillar will start on 2009, the impact on the benefit ratio will magnify with time (resulting in more and more of the retired persons receiving pension from I and II pillars). Table 2: Factors behind the public pension expenditures between 2007 and 2060 (in percentage points
of GDP) 2007-20 2020-30 2030-40 2040-50 2050-60 2007-60
Public pensions to GDP in a starting year * 0.2 -0.3 -0.2 -0.1 -0.4 -0.7 Dependence ratio 0.9 1.0 0.7 1.1 0.9 4.6
Coverage ratio -0.5 -0.4 -0.2 -0.2 -0.4 -1.6 1/Employment rate -0.3 0.1 0.0 0.0 -0.1 -0.2
Benefit ratio 0.2 -0.9 -0.7 -0.9 -0.8 -3.1
* The starting year is 2007 for the column 2007-20 and 2020 for the column 2020-30, etc
The same reasons apply also in terms of replacement rates. The replacement rate of the first pillar scheme increases at the beginning due to indexation formula, by which the bigger importance is given to social tax collection (thus wages) compared to inflation. But as the growth rates decrease and more and more people begin to receive part of their pension also from the II pillar, spending from the first pillar starts to decrease.
Table 3: Replacement rate and coverage by pension scheme (in %)'53 2000 2007 2020 2030 2040 2050 2060
Social security scheme 0.0 31.7 33.6 29.4 26.0 22.5 19.1 Coverage * : 100.0 100.0 100.0 100.0 100.0 100.0
Occupational scheme 0.0 0.0 0.0 0.0 0.0 0.0 0.0 Coverage : 0.0 0.0 0.0 0.0 0.0 0.0
Private scheme 0.0 0.0 3.8 6.5 10.6 14.9 18.5 Coverage : 0.0 13.8 25.5 39.8 55.0 67.1
* Coverage of each pension scheme is calculated as a ratio of the number of pensioners within the scheme and the total number of pensioners in the country.
The coverage of old age pension is very good today (near 100%) and there are expected to be no changes in future. The coverage of II pillar depends on how big was the switching activity to II pillar in voluntary age cohorts. In mandatory age cohorts the coverage should be almost the identical to the state pension). The number of old age pensioners will gradually increase mainly to do the increasing life expectancy. The number contributors will decrease substantially in next decades, since the number of people in age cohorts 0-17 in 2008 is much lower than in age cohorts in current labour force. For example the volume of age cohort 9 is about 58% of age cohort 25. Although
53 Coverage of each pension scheme is calculated as a ratio of the number of pensioners within the scheme and the total number of pensioners in the country.
108

participation rates will increase and unemployment rates will decrease, they have rather marginal effect on number of contributors comparing to previous. The ratio of the number of social security pensioners and the number of people at the age of 65 and higher should remain more or less the same, since the number of pensioners will increase due to the increase in life expectancy and the number of employed (and not getting pensions) is also increasing (higher part rates in older ages). The coverage of pensioners should also remain the same. The ratio of the number of social security contributors and the total employment should remain the same since all contributors are employed. The support ratio is decreasing substantially due to the reasons stated above.
Table 4: Number of pensioners and contributors in the Social security scheme (in 1000), population over 65 and total employment (in 1000) and related ratios (%)
2000 2007 2020 2030 2040 2050 2060 Number of pensioners (I) 0 367 362 380 394 414 413 Number of people aged 65+ (II) 205 229 246 276 295 324 348 Ratio of (I) and (II) 0 160 147 138 133 128 119 Number of contributors (III) 0 659 631 593 562 511 470 Employment(IV) 553 634 614 574 542 489 451 Ratio of (III) and (IV) 0 104 103 103 104 105 104 Ratio of (III) and (I) 'support ratio'
: 179 174 156 143 123 114
There is no specific reserve fund to finance PAYG scheme in a long term. Although the relatively small-scale reserve exists currently – having been accumulated from good collection of social tax revenues due to favourable economic climate and from transfers to PAYG system from state budget in recent years. But this reserve is meant to finance the PAYG deficit appearing in 2008 and onwards. There are no special long-term investment strategies for this reserve (the reserve has been invested into very conservative and liquid assets). The reserve in future (2030 -…) is based on estimates and to no-policy change scenario.
Table 5: Assets of pension funds and reserves, (% of GDP) 2000 2007 2020 2030 2040 2050 2060
Public Pension funds 0.0 2.5 0.0 0.2 1.3 3.3 6.8 Of which liquid financial assets, non-consolidated 0.0 2.5 0.0 0.2 1.3 3.3 6.8
Of which liquid financial assets, consolidated 0.0 2.5 0.0 0.2 1.3 3.3 6.8 Occupational pensions 0.0 0.0 0.0 0.0 0.0 0.0 0.0 Private pensions 0.0 4.4 23.8 40.7 55.7 62.9 69.9 All pensions 0.0 6.9 23.8 40.8 57.0 66.2 76.7
2.4. Sensitivity analysis
Higher life expectancy scenario – is basically the pure mathematics - higher life expectancy means more pensioners and higher costs. There are no other links to pension spending. The higher labour productivity - scenario affects mostly the contribution side (it is naturally assumed, that the wage growth will be inline with productivity growth). It has an effect on the pension spending as well (through higher pension index) but the influence of that is marginal.
109

The higher interest rate – state pensions are not affected due to pension formula being based on other criteria but it has quite significant impact on the overall pension spending through increasing the amounts in fully-financed private II pillar. The higher employment rate of older workers scenario, the relative impacts of the resulting decrease in the number of pensioners (due to the postponement of the retirement age) and the resulting increase in the average pension (due to larger accumulated rights) is not currently calculated. The reason behind this is the system, where people can work and still get pension at the same time, making it difficult to foresee the decisions about the retirement. Thus there is no automatic correction mechanism in the projection model to change the pension coverage in case changes in the employment. Impact of higher employment rate of older workers comes in to picture through contributions and pension levels.
Table 6: Total and public pension expenditures under different scenarios (deviation from baseline scenario)
2007 2020 2030 2040 2050 2060 Total Pension Expenditure
Baseline 5.6 6.0 5.9 6.1 6.8 6.7 Higher life expectancy 5.6 5.9 5.9 6.1 6.8 6.9 Higher lab. productivity 5.6 5.9 5.8 6.0 6.5 6.5 Higher interest rate 5.6 6.0 5,9 6.3 7.2 7.4 Higher emp. rate 5.6 5.9 5.9 6.1 6.7 6.7 Higher emp. of older workers 5.6 6.0 5.9 6.1 6.7 6.7 Zero migration 5.6 6.0 5.9 6.2 6.8 6.9
Public Pension Expenditure Baseline 5.6 5.9 5.6 5.4 5.3 4.9 Higher life expectancy 5.6 5.8 5.5 5.4 5.3 5.0 Higher lab. productivity 5.6 5.8 5.5 5.3 5.2 4.8 Higher interest rate 5.6 5.9 5.6 5.4 5.3 4.9 Higher emp. rate 5.6 5.8 5.5 5.4 5.3 4.9 Higher emp. of older workers 5.6 5.8 5.6 5.4 5.3 4.9 Zero migration 5.6 5.9 5.6 5.5 5.4 5.0
2.5. Description of the changes in comparison with the 2001 and 2006 projections
As the modelling technique is almost identical to previous round, there are two bigger sources of differences:
- Life expectancy in EUROPOP2008 has increased compared to previous round, leading to higher pension spending.
- new indexation formula, which is the main driver of costs in comparison with AWG2006 projections. It was implemented from April 2008 and was at designed to keep the replacement rate constant over the long-term period.
110
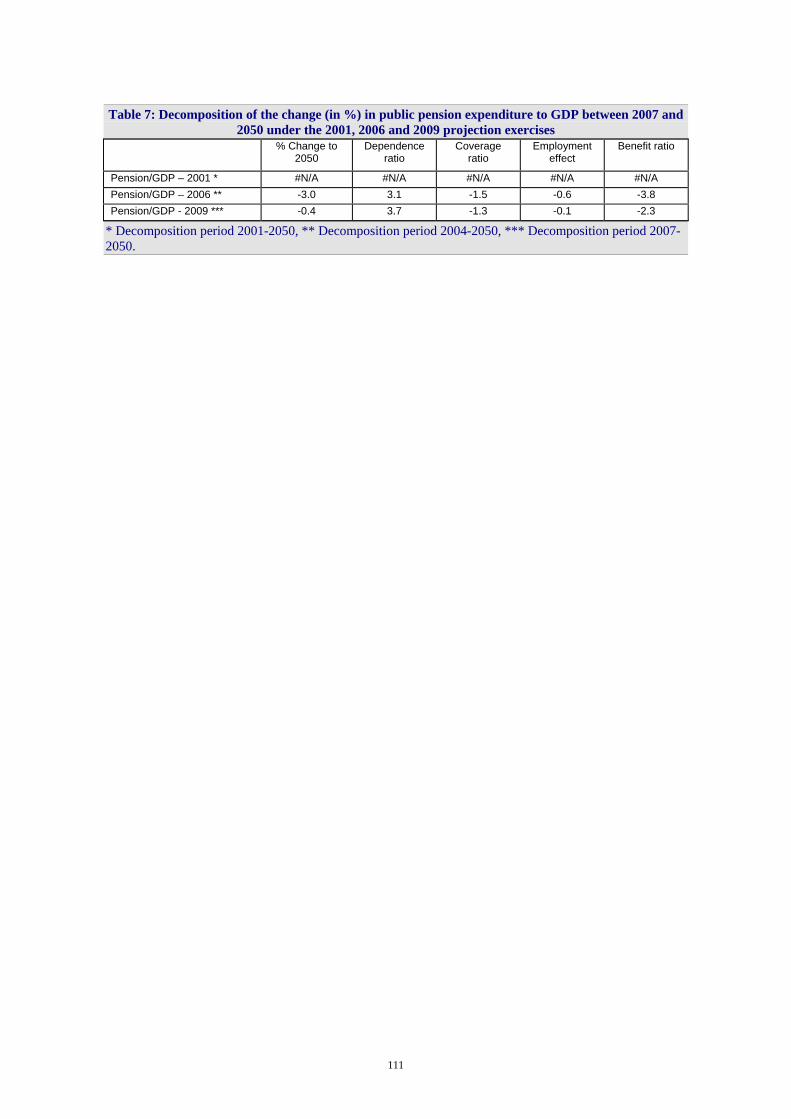
Table 7: Decomposition of the change (in %) in public pension expenditure to GDP between 2007 and 2050 under the 2001, 2006 and 2009 projection exercises
% Change to 2050
Dependence ratio
Coverage ratio
Employment effect
Benefit ratio
Pension/GDP – 2001 * #N/A #N/A #N/A #N/A #N/A Pension/GDP – 2006 ** -3.0 3.1 -1.5 -0.6 -3.8 Pension/GDP - 2009 *** -0.4 3.7 -1.3 -0.1 -2.3
* Decomposition period 2001-2050, ** Decomposition period 2004-2050, *** Decomposition period 2007-2050.
111

Ireland (Report prepared by Loretta O'Sullivan and Shane Enright)
1. Overview of the pension system
1.1. Introduction
As part of the European Commission and Economic Policy Committee’s 2009 ageing projections exercise, Member States were asked to provide projections of pension spending using national models. This fiche provides an overview of Ireland’s pension system and projection methodology. The results of the baseline scenario and those of a range of sensitivity tests are also presented, along with the underlying demographic and macroeconomic assumptions. For the purpose of this exercise, the European Committee and the Economic Policy Committee agreed the following definition of pensions54:
‘Pensions should cover pensions and equivalent cash benefits granted for a long period (over one year) for old age, early retirement, disability, survivors (widows and orphans) and other specific purposes which should be considered as equivalents or substitutes for above-mentioned types of pensions, i.e. pensions due to reduced capacity to work or due to labour market reasons.'
Similarly, it was agreed to disaggregate social security and other public pensions in terms of two broad categories namely55; ‘Old age and early retirement pensions, plus disability and widow’s pensions paid out to people over the standard retirement age (including earnings-related and flat rate or means tested minimum pensions)’ ‘Other pensions - disability, survivors’, partial pensions paid to persons below the standard retirement age without any lower age limit (including earnings-related and flat rate or means tested minimum pensions)’. Finally, it was decided to take 2007 as the base year for the pension projections exercise.
1.2. Overview of the Irish Pension System
The Irish pension system is divided into two main pillars. The first is the Social Welfare pay-as-you-go system which is administered by the Government and funded through social insurance contributions and tax revenue. The second consists of supplementary pensions including Public Service pay-as-you-go schemes, voluntary funded occupational pension schemes set up by employers and voluntary personal pensions arranged by individuals. The projections presented below relate to public pensions, that is, First Pillar Social Welfare pensions and the Public Service component of the Second Pillar. While projections of private occupational and voluntary pension schemes are not provided in the
54 European Commission (2008) 2009 Pension projection exercise: Reporting framework. 55 See previous footnote.
112

following, it should be noted that such schemes play an important role in the Irish pension system - at the end of 2007, the value of Irish pension funds stood at over €86 billion, with some 50% of workers aged 20-69 covered.
1.3. Social Security Pensions
The First Pillar Social Welfare system provides for flat rate payments (intended to cover basic living expenses) and embodies two types of schemes - Social Insurance and Social Assistance. Social insurance pension benefits are dependent on an individual’s Pay Related Social Insurance (PRSI) record, whereas non-contributory social assistance pensions are available on a means tested basis to those who do not meet the social insurance requirements. First Pillar pension payments are financed through a combination of contributions from employers, employees and the self employed (Social Insurance schemes) and general taxation (Social Assistance pensions; Social Insurance schemes in the event of a shortfall in contributions56). Section 2.1 outlines the Social Security pension schemes covered as part of Ireland’s projections exercise. A detailed overview of the associated eligibility requirements is provided in Annex 1. To summarise, qualification for the main Social Insurance schemes – the State Pension (Contributory) and the State Pension (Transition) - is based on age (66 and 65 respectively), entry into Social Insurance before a particular age (56 and 55 respectively), a requirement of least 260 social insurance contributions at the appropriate rate, and a yearly average of at least 10 contributions (paid or credited from 1953 or from the date of entry into social insurance) in the case of the State Pension (Contributory) and a minimum yearly average of 24 for the State Pension (Transition). The qualifying conditions for the main Social Assistance scheme – the State Pension (Non-Contributory) – are age (66), habitual residency and satisfaction of a means test. In 2007, the weekly payment rate was €209.30 for the State Pension (Contributory) and the State Pension (Transition) and €200 for the State Pension (Non-Contributory). These represent the maximum rates paid. Reduced rates are payable to those with incomplete social insurance records or means in excess of certain levels. In addition to the core payments, a range of supplementary benefits are available. For example, extra allowances are payable to those aged 80 and over and/or living alone, and for qualified adults and child dependents. Subject to certain qualifying conditions, non-cash benefits such as a television licence and fuel allowances can also be claimed by persons aged 66 years and over. Taken on their own, Social Welfare pensions are not taxed as they do not reach the minimum tax threshold. However, where appropriate, such payments are included in income tax assessments in conjunction with any other income and taxed accordingly.
1.4. Public Service Pensions
56 Contributions which are collected as PRSI are paid into the Social Insurance Fund. In 2007, the Social Insurance Fund (which covers a range of schemes including Social Insurance pension schemes) was in surplus to the amount of €582 million. However, a deficit is projected for 2008 and 2009 and it is expected that the Fund will be exhausted by 2010. This reflects a growth in unemployment spending rather than a growth in pension expenditure. In any event, the latest Actuarial Review of the Social Insurance Fund (as at 31 December 2005) found that the Fund’s surplus would be exhausted by 2016, even under normal conditions, and that the deterioration in its financial position could be traced ‘almost entirely to the increase in benefit outgoings under the long-term schemes’.
113
Second Pillar Public Service occupational pensions take the form of defined benefit schemes ie. the pension benefits payable are specified on the basis of clear rules. For each year of pensionable service, public servants in Ireland accrue a retirement pension of 1/80th of pensionable renumeration (or of net renumeration for public servants in the full Pay Related Social Insurance class) and a retirement lump sum of 3/80ths of pensionable renumeration. With respect to retirement age, there are considerable variations between the different groups of existing public servants. Similarly, different categories of public servants pay different Social Insurance contributions. Many pay a lower rate of PRSI than applies to employees in general and as such, do not qualify for a range of Social Insurance benefits. However, public servants who pay full PRSI are entitled to Social Insurance pension payments and consequently, the occupational pension entitlements of these individuals are subject to integration, that is, their Social Insurance benefits are taken into account when making up their replacement incomes at retirement (such public servants accrue a retirement pension of 1/80th of net pensionable renumeration. Net pensionable renumeration is pensionable pay less twice the State Pension (Contributory)). As a result of the Government’s decision that all public servants appointed on or after 6 April 1995 should be in the full PRSI class, the number of public servants whose occupational pensions and contributions are subject to integration will increase in the coming years. Finally, reforms implemented from 2004 onwards have allowed for the raising of the minimum pension age and the removal of a compulsory retirement age for most new public servants. A cost-neutral early retirement scheme with actuarially reduced benefits has also been introduced. With effect from March 1 2009, an increase in average pension contributions will apply across the Public Service. Section 2.1 outlines the Public Service pension schemes covered as part of Ireland’s projections exercise while Annex 2 details the main features of these schemes.
1.5. National Pensions Reserve Fund (NPRF)
A further feature of the Irish pension system is the National Pensions Reserve Fund. Established in 2000, the purpose of the NPRF is to pre-fund in part the future Exchequer cost of Social Welfare and Public Service pensions. A statutory obligation has been placed on the Government to pay a sum equivalent to 1% of GNP into the Fund each year until at least 2055. Draw-downs are prohibited prior to 2025.
2. Pension expenditure projections
2.1. Coverage of the Projections Exercise
An overview of the Social Security and Public Sector pension schemes covered as part of the projections exercise is set out overleaf. The various schemes are decomposed into the agreed categories.
114
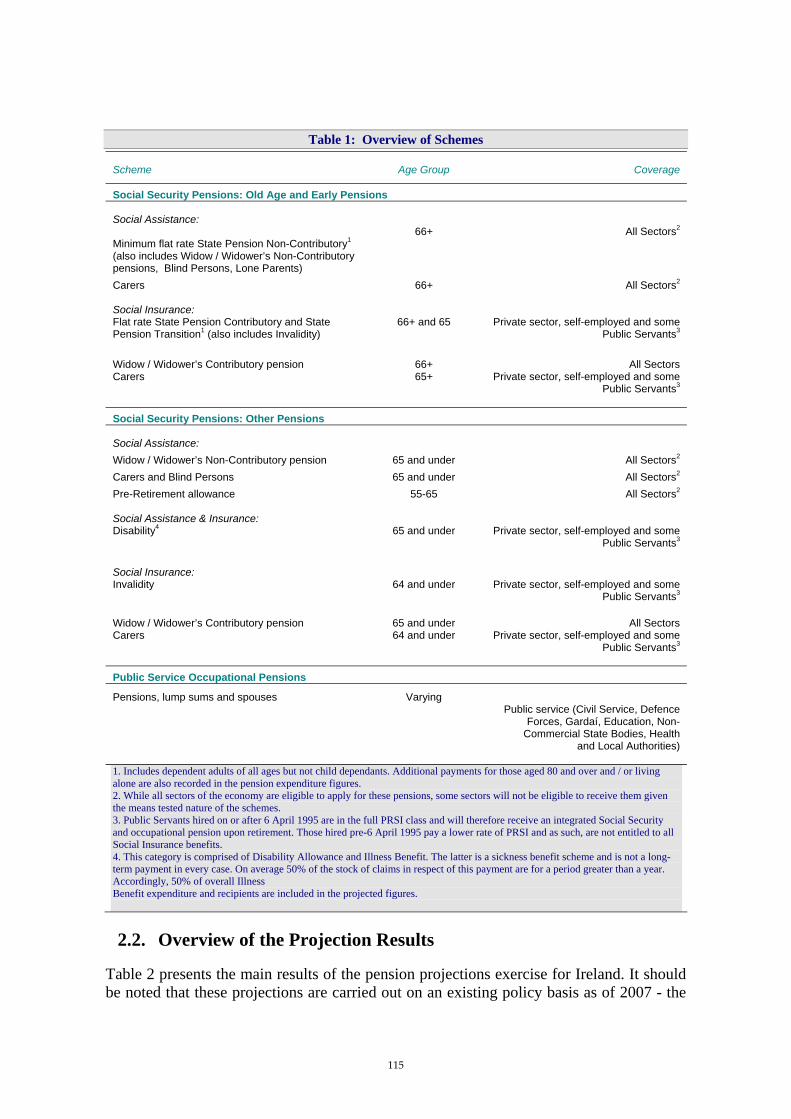
Table 1: Overview of Schemes
Scheme Age Group Coverage
Social Security Pensions: Old Age and Early Pensions
Social Assistance:
Minimum flat rate State Pension Non-Contributory1
(also includes Widow / Widower’s Non-Contributory pensions, Blind Persons, Lone Parents)
66+
All Sectors2
Carers 66+ All Sectors2
Social Insurance: Flat rate State Pension Contributory and State Pension Transition1 (also includes Invalidity)
66+ and 65
Private sector, self-employed and some Public Servants3
Widow / Widower’s Contributory pension 66+ All Sectors Carers
65+
Private sector, self-employed and some Public Servants3
Social Security Pensions: Other Pensions
Social Assistance: Widow / Widower’s Non-Contributory pension 65 and under All Sectors2 Carers and Blind Persons 65 and under All Sectors2 Pre-Retirement allowance 55-65 All Sectors2
Social Assistance & Insurance: Disability4
65 and under
Private sector, self-employed and some Public Servants3
Social Insurance: Invalidity
64 and under
Private sector, self-employed and some Public Servants3
Widow / Widower’s Contributory pension 65 and under All Sectors Carers
64 and under
Private sector, self-employed and some Public Servants3
Public Service Occupational Pensions
Pensions, lump sums and spouses
Varying
Public service (Civil Service, Defence Forces, Gardaí, Education, Non-
Commercial State Bodies, Health and Local Authorities)
1. Includes dependent adults of all ages but not child dependants. Additional payments for those aged 80 and over and / or living alone are also recorded in the pension expenditure figures. 2. While all sectors of the economy are eligible to apply for these pensions, some sectors will not be eligible to receive them given the means tested nature of the schemes. 3. Public Servants hired on or after 6 April 1995 are in the full PRSI class and will therefore receive an integrated Social Security and occupational pension upon retirement. Those hired pre-6 April 1995 pay a lower rate of PRSI and as such, are not entitled to all Social Insurance benefits. 4. This category is comprised of Disability Allowance and Illness Benefit. The latter is a sickness benefit scheme and is not a long-term payment in every case. On average 50% of the stock of claims in respect of this payment are for a period greater than a year. Accordingly, 50% of overall Illness Benefit expenditure and recipients are included in the projected figures.
2.2. Overview of the Projection Results
Table 2 presents the main results of the pension projections exercise for Ireland. It should be noted that these projections are carried out on an existing policy basis as of 2007 - the
115
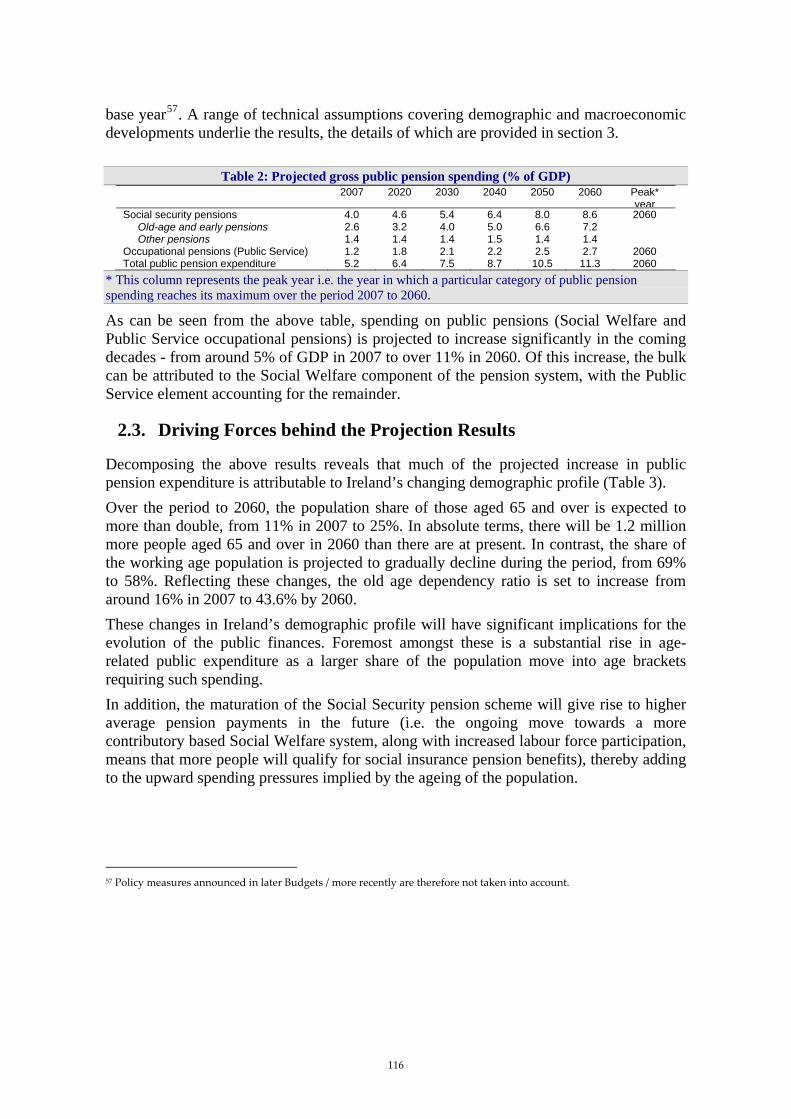
base year57. A range of technical assumptions covering demographic and macroeconomic developments underlie the results, the details of which are provided in section 3.
Table 2: Projected gross public pension spending (% of GDP) 2007 2020 2030 2040 2050 2060 Peak*
yearSocial security pensions 4.0 4.6 5.4 6.4 8.0 8.6 2060 Old-age and early pensions 2.6 3.2 4.0 5.0 6.6 7.2 Other pensions 1.4 1.4 1.4 1.5 1.4 1.4 Occupational pensions (Public Service) 1.2 1.8 2.1 2.2 2.5 2.7 2060 Total public pension expenditure 5.2 6.4 7.5 8.7 10.5 11.3 2060
* This column represents the peak year i.e. the year in which a particular category of public pension spending reaches its maximum over the period 2007 to 2060.
As can be seen from the above table, spending on public pensions (Social Welfare and Public Service occupational pensions) is projected to increase significantly in the coming decades - from around 5% of GDP in 2007 to over 11% in 2060. Of this increase, the bulk can be attributed to the Social Welfare component of the pension system, with the Public Service element accounting for the remainder.
2.3. Driving Forces behind the Projection Results
Decomposing the above results reveals that much of the projected increase in public pension expenditure is attributable to Ireland’s changing demographic profile (Table 3). Over the period to 2060, the population share of those aged 65 and over is expected to more than double, from 11% in 2007 to 25%. In absolute terms, there will be 1.2 million more people aged 65 and over in 2060 than there are at present. In contrast, the share of the working age population is projected to gradually decline during the period, from 69% to 58%. Reflecting these changes, the old age dependency ratio is set to increase from around 16% in 2007 to 43.6% by 2060. These changes in Ireland’s demographic profile will have significant implications for the evolution of the public finances. Foremost amongst these is a substantial rise in age-related public expenditure as a larger share of the population move into age brackets requiring such spending. In addition, the maturation of the Social Security pension scheme will give rise to higher average pension payments in the future (i.e. the ongoing move towards a more contributory based Social Welfare system, along with increased labour force participation, means that more people will qualify for social insurance pension benefits), thereby adding to the upward spending pressures implied by the ageing of the population.
57 Policy measures announced in later Budgets / more recently are therefore not taken into account.
116

Table 3: Factors underlying Social Security pension spending (percentage points of GDP)'58 2007-20 2020-30 2030-40 2040-50 2050-60 2007-60
Social Security pensions as a % of GDP in the starting year* 0.6 0.8 1.0 1.6 0.6 4.6
Dependency ratio 1.0 1.0 1.3 2.0 0.6 5.9 Coverage ratio -0.4 -0.3 -0.3 -0.4 -0.1 -1.5
1/Employment rate -0.2 0.0 0.0 0.0 0.0 -0.2 Benefit ratio 0.3 0.1 0.1 0.1 0.0 0.7
* The starting year is 2007 for the column 2007-20 and 2020 for the column 2020-30 etc.
Table 3 shows that Social Security pension spending is projected to increase by some 4.6 percentage points of GDP between 2007 and 2060. Of this increase, 5.9 percentage points can be attributed to demographic factors (the dependency ratio), while a further 0.7 percentage points is accounted for by the higher average pension payments associated with the maturation of the scheme (the benefit ratio). The projected fall in the ratio of beneficiaries to the population aged 65 and over (the coverage ratio) serves to offset the spending pressures arising from demographic change by 1.5 percentage points. Similarly, the increase in the employment rate at the beginning of the period (1/Employment rate) has a small offsetting effect. From a welfare perspective, it should be noted that no formal indexation criteria exist in the Irish Social Welfare system - Social Welfare increases are decided upon each year as part of the budgetary cycle. However, payments have historically grown in line with average earnings in the economy. Thus, for the purpose of this exercise, the State Pension (Contributory) is assumed to grow in line with nominal earnings. This implies a constant ‘replacement rate’ of 34% for the main scheme over the projection period. A further consequence of demographic change is that the task of financing increasing pension spending will fall to a diminishing share of the population. The public pension system in Ireland is largely funded on a ‘pay-as-you-go’ basis, that is, contributions made by today’s workforce are used to meet existing pension liabilities. By 2060 however, not only will pension costs have significantly increased, but the number of contributors per pensioner will be considerably fewer than now (Table 4). Table 4: Number of pensioners and contributors in the Social security scheme (000’s), population over
65, employment (000’s) and related ratios (%) 2007 2020 2030 2040 2050 2060
Number of pensioners (I) 759 1023 1270 1541 1863 2013 Number of people aged 65+ (II) 477 718 942 1204 1550 1702 Ratio of (I) and (II) 159 142 135 128 120 118 Number of contributors (III) 2715 3392 3667 3789 3717 3775 Number employed aged 15-64 (IV) 2044 2548 2751 2838 2781 2829 Ratio of (III) and (IV) 133 133 133 134 134 133 Ratio of (III) and (I) 'support ratio' 3.6 3.3 2.9 2.5 2.0 1.9
Table 4 shows that the number of beneficiaries of Social Welfare pension payments is set to rise from around 759,000 in 2007 to over 2 million in 2060; an increase of 165%59. In
58 This table decomposes Social Security pension expenditure as a percentage of GDP into the dependency ratio, the coverage ratio, 1/employment rate and the benefit ratio as follows. Note that the ‘average pension’ is calculated as Social Security pension expenditure divided by the number of pensioners.
444 8444 76444 8444 764444 84444 76444 8444 76 RatioBenefitRateEmploymentRatioCoverageRatioDependency
PeopleWorkingGDP
PensionAveragePeopleWorking
PopulationPopulation
PensionersofNumberPopulation
PopulationGDP
ExpPension ×−×+
×−
+=
/1
6415656415
65.
117

contrast, the ratio of beneficiaries to the population aged 65 and over is projected to decline during the period, from 159% to 118%. This reflects a number of factors including the fall-out of payments to existing non-residents60, 61, the phasing out of the pre-retirement scheme and higher employment rates. The number of Social Welfare contributors is also set to rise over the period 2007-2060 (Table 4). The projection methodology assumes that the number of contributors grows in line with the employment growth rate of those aged 15-65. As such, the ratio of contributors to employees remains fairly stable over time62. On the contrary, the support ratio is projected to fall sharply - the number of Social Welfare contributors per Social Welfare pension beneficiary will be around 1.9 in 2060, compared to 3.6 today. Overall, these trends imply a mismatch between the spending demands facing the public pension system and its ability to meet these demands. While the assets accumulated in the National Pensions Reserve Fund (Table 5) are expected to go some way towards easing funding concerns, it is expected that they will fall short of future liabilities. For example, it is estimated that in 2055 (the year in which the draw-down level as a percentage of GNP is assumed to peak), assets amounting to just over 3% of GNP will be available for drawdown, somewhat short of the projected 2055 pension liability of 13% of GNP.
Table 5: Assets of pension funds and reserves (% of GDP) 2007 2020 2030 2040 2050 2060
Public pension funds (Assets of the National Pensions Reserve Fund)
10.8 20.9 29.0 31.5 25.1 9.1
2.4. Sensitivity Analysis
A sensitivity analysis on the projections presented in Table 2 shows that putting in place policy measures that aim to increase the share of the population at work would be of benefit in meeting the pensions funding challenge. As is evident from Table 6, a higher employment rate in general, along with an increase in the employment rate of older workers, leads to lower public pension spending as a percentage of GDP than would otherwise be the case.
59 The term ‘beneficiaries’ includes both direct recipients of the Social Welfare payments outlined in Table 1 and the number of adult dependants covered under the State Pension (Contributory), State Pension (Transition) and State Pension (Non-Contributory) schemes. 60 The number of beneficiaries of Social Welfare pension payments in 2007 includes some non-residents. Payments to these individuals are projected to cease over time as they die. 61 It should be noted that no assumptions are made regarding pension payments to future non-residents. While migrants who work in Ireland for a period before returning home may be entitled to a State Pension (Contributory) upon retirement if they meet the qualifying conditions discussed earlier, they are not eligible for the State Pension (Non-Contributory). As inward migration is a recent phenomenon, historical data regarding the length of stay, contributions paid etc. is limited which means that there is no reliable basis on which to make assumptions about the potential for, or magnitude of, future payments to non-residents. On the other hand, the underlying demographic assumptions allow for net migration meaning that migrants who stay are factored into the population projection and, are therefore, captured in the projections presented above. 62 The coverage of PRSI is wider than those in employment e.g. PRSI is also payable by people with income from rents and investment. The number of contributors therefore exceeds the numbers employed leading to a ratio above 100%.
118

Table 6: Public pension expenditure under different scenarios'63 2007 2020 2030 2040 2050 2060
% of GDP Baseline 5.2 6.4 7.5 8.7 10.5 11.3 Higher life expectancy 5.2 6.4 7.5 8.7 10.6 11.5 Higher labour productivity 5.2 6.4 7.5 8.7 10.5 11.3 Higher interest rate 5.2 6.4 7.5 8.7 10.5 11.3 Higher employment rate 5.2 6.3 7.4 8.5 10.3 11.2 Higher employment of older workers 5.2 6.3 7.4 8.5 10.3 11.2 Zero migration 5.2 6.9 8.4 9.9 12.2 13.0 % point deviation from the baseline scenario Higher life expectancy 0.0 0.01 0.04 0.08 0.14 0.21 Higher labour productivity 0.0 0.00 0.01 0.01 0.01 0.01 Higher interest rate 0.0 0.00 0.00 0.00 0.00 0.00 Higher employment rate 0.0 -0.08 -0.10 -0.11 -0.13 -0.15 Higher employment of older workers 0.0 -0.07 -0.09 -0.12 -0.13 -0.13 Zero migration 0.0 0.51 0.89 1.29 1.76 1.66
In contrast, an increase in life expectancy and zero migration would serve to put upward pressure on pension costs. As the projection methodology indexes pension payment rates to nominal earnings - the real earnings component of which is assumed to grow in line with productivity - the higher productivity scenario leads to a marginal increase in pension spending.
2.5. Description of changes in comparison with the 2001 and 2006 Pension Projection Exercises
Table 7 compares the results of the current pension projections exercise with the outcomes of similar exercises carried out in 2001 and 2006.
Table 7: Decomposition of the change in public pension expenditure (% of GDP) between 2007 and 2050 under the 2001, 2006 and 2009 projection exercises
% point change to
2050
Dependency ratio
Coverage ratio
Employment rate
Benefit ratio
Public pensions (% of GDP)* 2001 exercise 4.3 4.5 1.4 -0.9 -0.7
Public pensions (% of GDP)** 2006 exercise 6.5 7.9 -1.4 -0.5 0.8
Public pensions (% of GDP)*** 2009 exercise 5.3 7.2 -1.9 -0.3 0.9
*Decomposition period: 2001-2050; ** Decomposition period: 2004-2050; *** Decomposition period: 2007-2050
As the definition of pensions used in the 2006 and 2009 exercises was wider than that used in the 2001 exercise, the change in pension spending projected in 2001 is not directly comparable with the later estimates.
63 The higher life expectancy scenario assumes an increase in life expectancy of one year by 2060 compared to the baseline scenario. The zero migration scenario assumes zero migration relative to the baseline. The higher employment rate scenario allows for an employment rate which is 1 percentage point above that in the baseline scenario. The increase is introduced linearly over the period 2010-2020 and remains 1 percentage point higher thereafter. The higher employment rate of older workers scenario assumes a linear increase of 5 percentage points in the employment rate of older workers between 2010 and 2020. The employment rate of this cohort is assumed to remain 5 percentage points higher relative to the baseline thereafter. The higher productivity scenario assumes convergence to a productivity growth rate 0.25 percentage points above that in the baseline. The increase is introduced linearly over the period 2010-2020, with productivity assumed to remain 0.25 percentage points higher thereafter. The higher interest rate scenario allows for an interest rate which is 1 percentage point higher than in the baseline scenario.
119

The 2006 and 2009 exercises cover much the same Social Security and Public Service pension schemes and use the same projection methodology, thus the differences between the results is primarily attributable to differences in the underlying assumptions, along with some base effects. In particular, the more favourable demographics that underlie the current exercise – for example, the 2050 old-age dependency ratio of 40.4% used in the 2009 round is almost 5 percentage points below the ratio of 45.2% used in the 2006 round - means that the increase in public pension spending in the 2009 exercise is lower than that projected in the 2006 exercise. Notwithstanding differences in magnitude, both the 2006 and 2009 exercises present a picture of sharply rising pension costs. As Table 7 shows, the bulk of this increase is attributable to demographic factors. Pension projections undertaken at national level as part of the Green Paper on Pensions tell a similar story. Over the period 2007 to 2050, the Green Paper projects that spending on public pensions will increase by around 8 percentage points of GDP64.
64 Green Paper on Pensions (chapter 3) - www.pensionsgreenpaper.ie.
120

Greece (Report prepared by Marianna Papamichail, Dimitris Papaoikonomou and Charitini Karakoulaki)
1. Overview of the pension system
1.1. Introduction
Since its establishment in 2002, the National Actuarial Authority of Greece (NAA) has been developing its own infrastructures for evaluating the long term sustainability of the social security pension and the public health system, in line with its mandate. In this context, NAA has recently initiated collaboration with the International Labour Office (ILO), aimed at developing analytical actuarial models for the main pension funds. As part of this collaboration, NAA staff has received training on the use of the models, which can be updated and progressively expanded to cover additional aspects of the system. This study is based primarily on the modelling framework jointly developed with ILO, adapted to the demographic and macroeconomic assumptions of the EPC AWG. The analysis is complemented by a non-actuarial method for approximating the evolution of pension spending in the part of the system which is not explicitly modelled. Details of the analytical models and the non-actuarial approximation are provided in section 4.
1.2. Overview of the pension system
The Greek social security system is, in principle, based on three pillars: I. The first pillar is public, mandatory and includes primary and auxiliary pensions,
covering the risks of old age, death, disability and sickness. Provident funds provide lump sum benefits and although membership is not compulsory they also belong to the first pillar.
II. The second pillar is not mandatory and refers to fully-funded occupational schemes, covering the same risks as the first pillar.
III. The third pillar refers to private insurance. However, pensions in Greece are provided almost exclusively by the state through the first pillar and there is very limited recourse to occupational schemes and private pensions65. In 2007, gross pension spending amounted to 11.7% of GDP, 99.5% of which consisted of first pillar public pensions. Public pensions are provided through a plethora of funds, which have the status of public entities and form part of the general government sector66. The funds offer defined benefits based on employer and employee contributions. Though the funds are permitted to retain any existing cash surpluses - reflecting the system’s original conception as a funded system - in total, these are not very significant and they generally operate as pay-as-you-go (PAYG) schemes. The large number of funds arises from the historical development of the pension system, whereby funds were created by individual sectors. Partly as a result, the benefit schemes offered by the funds, or even 65 Mylonas and de la Maisonneuve (1999), report that insurance companies attribute the low demand for private pensions to the generosity of the public pension system. 66 Before the March 2008 pension reform (Law 3655/2008), there where 133 different funds under the supervision of the Ministry of Employment and Social Protection.
121

within the funds, differ. Workers are insured by one primary fund at a time, according to their occupation, but usually have supplementary coverage, which may be provided by a separate auxiliary and/or provident fund. Operating effectively as PAYG, the Greek social security system is directly exposed to the risks posed by ageing populations. The demographic challenge in Greece has consistently been projected to be more severe than the EU average and the 2008 Eurostat projections report deterioration in the old-age dependency ratio67 from 27.8% in 2008 to 57.1% in 2060. The relation between insurants and pensioners has reached 1.75:1 instead of 4:1 which is required for a viable pay-as-you-go distributive pension system. As a result the National Regular Budget (NRB) contributes increasing amounts for the social security services year by year. For 2007 the NRB included the amount of 10,347,926 euro, in comparison to the 2006 amount which was 9,718,281 euro. The above expenditure for social services refers to pensions of politicians, military, municipal and community workers, allowances to members of National Resistance (not covered by security organizations), expenditures of medical care to public officers and pensioners, subsidies of institutes in social care and hospitalization, and other expenditures of the Ministry of Health and Social Solidarity. The overall replacement ratio68 of 60.6% in 2007 conceals the significant differences in the generosity of pension payments among the various schemes, as replacement ratios can range from 10.6% for farmers to 149.8% for civil servants. In addition, there can be significant differences within professional categories in the same scheme. Overall, existing legislation draws a broad distinction between those insured before and after 1993, with the former generally enjoying more generous provisions regarding age thresholds, replacement rates and eligibility conditions. As regards private sector wage earners, for example IKA-ETAM fund, the statutory retirement age for females insured before 1993 is set at 60 years of age, rising to 65 for those insured after 1993. Depending on the fund, however, there can be many more splits among participants with equally different provisions. An example of the multiplicity in the eligibility provisions is shown in the Part A of the Appendix, for the funds IKA –ETAM, OGA, OAEE and Public Sector (PS). The extensive fragmentation of the system has long been acknowledged as a serious impediment for effective monitoring, providing numerous channels for early retirement, facilitating contribution evasion, leading to pronounced inequalities and high administrative costs. The recent reform (Law 3655/2008) passed in March 2008, takes a decisive step towards addressing the administrative deficiencies of the system, while also including a number of parametric adjustments. Key features of the recent reform of the social security system (Law 3655/2008) Administrative features:
• Addressing decisively the fragmentation of the system, by reducing the number of funds from 133 to 13, significantly reducing administrative costs and improving monitoring and supervision.
• Introduction of an Individual Social Security Number, effective from 01.06.2009, allowing, inter alia, for improved expenditure control. The introduction of the Individual Social Security Number is also expected to assist employment inspection, thus contributing in reducing contribution evasion.
67 The old-age dependency ratio is defined as: (population aged above 65)/(population aged 15-64). 68 The replacement ratio is defined as: (average new pensions) / (average wage).
122

123
• Establishment of the Insurance Fund for Inter-generational Solidarity (AKAGE), in order to safeguard future pension payments. AKAGE will accumulate reserves in order to finance pension payments of social security funds for the years beyond 01.01.2019. Starting 01.01.2009, AKAGE will be funded by:
- 10% of annual total privatization revenue, - 4% of the annual VAT revenue, - 10% of total annual receipts from special social resources of Social
Insurance Funds, branches or accounts, as described in article 150 in Law 3655/2008.
Parametric features: • Financial incentives for extending working lives by up to 3 years past the statutory
retirement age and increased disincentives for early retirement. • Stricter eligibility conditions, mainly for wage earners (IKA-ETAM). • Strengthening provisions regarding maternity leave, aimed at facilitating female
participation in the labor market. In addition, a review has been initiated regarding the list of “arduous and unhealthy occupations”, which could result in stricter eligibility criteria for early retirement. Summary of main reforms in the pension system in the recent past:
1. Law 2084/1992. It separated insurants to those who have been employed since 1993, “pre-93’s” and to those who were employed after 1992, “post-92’s”. The former generation retained higher replacement rates and shorter careers than the later. The law reduced pensions by 1/200 for each month prior to the age of 65, with maximum reduction 22.47%. It also equalized the general thresholds for male and female by rising the normal (full pension) retirement age of women, from 60 to 65. It also induced a state contribution for the IKA-ETAM of 10% on the gross salary of the employee.
2. Law 3029/2002. It performed a first administrational merging of 10 main pension schemes of employees to IKA-ETAM by 2008, the so called “special funds”. The merging was accompanied with a unified rule for the pension formula to that of IKA-ETAM for the “post 92’s”, less generous than the one of the special funds, and also less contributions equal again with those of IKA-ETAM. It induced an incentive for careers longer than 35 years by increasing 50% the accumulation percentage from 2% to 3% until the 37th past service year. It changed the 1/200 reduction of early pensions to 1/267. It replaced the 10% state contribution on the gross salary of every IKA-ETAM employee to 1% of the GDP since 2030. It also founded the second pillar occupational insurance. The impact of this law on the pension spending system is not officially analyzed and it is difficult to do so because, as far as sustainability is concerned, it worked in various directions.
3. The recent reform, Law 3655/2008 enacted massive merges of the main, auxiliary, providence and health funds without altering pension or contribution formulas. It draw back the reduction for private sector employees to 1/200 and added gradually, on average, 5 years to special women groups such as mothers of under aged children, mothers of three or more children etc., who could generally retire from the of age 55. Its main impact was in IKA-ETAM, by reducing the pension cost, and thus for the whole social security system, by 0.5% of GDP at 2060. It generally did not have any effect on self employed and farmers where the minimum age of retirement is 65 and such groups do not exist. It also did not affect the Public Sector.
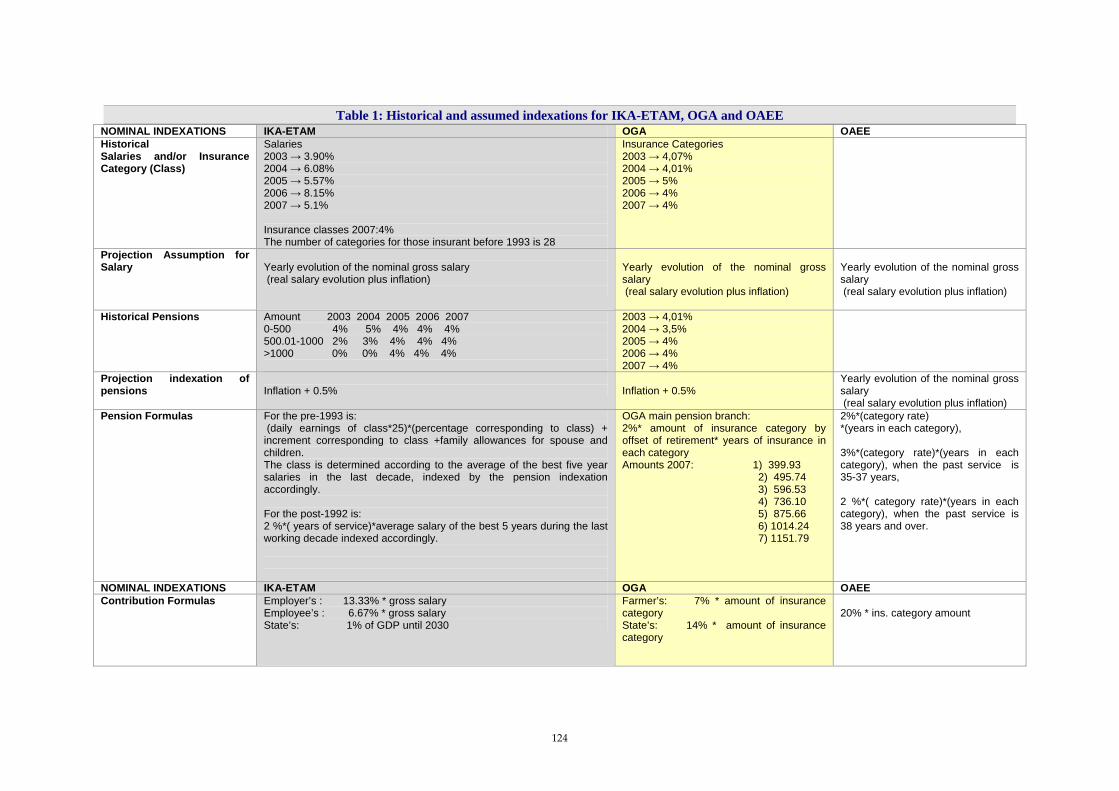
Table 1: Historical and assumed indexations for IKA-ETAM, OGA and OAEE NOMINAL INDEXATIONS IKA-ETAM OGA OAEE Historical Salaries and/or Insurance Category (Class)
Salaries 2003 → 3.90% 2004 → 6.08% 2005 → 5.57% 2006 → 8.15% 2007 → 5.1% Insurance classes 2007:4% The number of categories for those insurant before 1993 is 28
Insurance Categories 2003 → 4,07% 2004 → 4,01% 2005 → 5% 2006 → 4% 2007 → 4%
Projection Assumption for Salary
Yearly evolution of the nominal gross salary (real salary evolution plus inflation)
Yearly evolution of the nominal gross salary (real salary evolution plus inflation)
Yearly evolution of the nominal gross salary (real salary evolution plus inflation)
Historical Pensions Amount 2003 2004 2005 2006 2007 0-500 4% 5% 4% 4% 4% 500.01-1000 2% 3% 4% 4% 4% >1000 0% 0% 4% 4% 4%
2003 → 4,01% 2004 → 3,5% 2005 → 4% 2006 → 4% 2007 → 4%
Projection indexation of pensions
Inflation + 0.5%
Inflation + 0.5%
Yearly evolution of the nominal gross salary (real salary evolution plus inflation)
Pension Formulas For the pre-1993 is: (daily earnings of class*25)*(percentage corresponding to class) + increment corresponding to class +family allowances for spouse and children. The class is determined according to the average of the best five year salaries in the last decade, indexed by the pension indexation accordingly. For the post-1992 is: 2 %*( years of service)*average salary of the best 5 years during the last working decade indexed accordingly.
OGA main pension branch: 2%* amount of insurance category by offset of retirement* years of insurance in each category Amounts 2007: 1) 399.93 2) 495.74 3) 596.53 4) 736.10 5) 875.66 6) 1014.24 7) 1151.79
2%*(category rate) *(years in each category), 3%*(category rate)*(years in each category), when the past service is 35-37 years, 2 %*( category rate)*(years in each category), when the past service is 38 years and over.
NOMINAL INDEXATIONS IKA-ETAM OGA OAEE Contribution Formulas Employer’s : 13.33% * gross salary
Employee’s : 6.67% * gross salary State’s: 1% of GDP until 2030
Farmer’s: 7% * amount of insurance category State’s: 14% * amount of insurance category
20% * ins. category amount
124

Table 2: Historical and assumed indexations for the Public Sector Employees NOMINAL INDEXATIONS Public Sector Employees Rest of the schemes Historical Salaries and/or Insurance Category (Class)
2003 → 2.05% 2004 → 5.4% 2005 → 3.6% 2006 → 3.0% 2007 → 3.5% 2008 → 4.5%
Projection Assumption for Salary
Yearly evolution of the nominal gross salary (real salary evolution plus inflation)
Yearly evolution of the nominal gross salary (real salary evolution plus inflation)
Historical Pensions 4% from 2005-2007 Projection indexation of pensions
Inflation +0.5%
Inflation +0.5%
NOMINAL INDEXATIONS Public Sector Employees Rest of the schemes Pension Formulas For those who are employed before 1993 and going to retire until 2007:
Pension= family allowance + smoothing allowance +[ max(1, years of service*2,857%)]*(1+0,3*W/35)* *[1+2%*max (5, years of service-35)]*(1+b/35)*80%*[(Basic Salary) (σ)+ΤΑΡΑ] For those who are employed after 1992 and going to retire until 2007: The same formula above except for 2% accumulation has replaced 2.857% and the family allowance adds to the formula, is 8% for one child, 18.88% for two children and 33.05% for three or more children. For those who are employed before 1993 and going to retire from 2008 and then: Pension= family allowance + smoothing allowance + [max(1,years of service*2,857%)]*(1+0,3*W/35)* *[1+2%*max (5, years of service-35)]*(1+b/35)*max(80%-k/100,70%)* For those who are employed after 1992 and going from 2008 and then: The same formula above except for 2% accumulation has replaced 2.857% and the family allowance adds to the formula, is 8% for one child, 18.88% for two children and 33.05% for three or more children.
Average pension 2007 indexed
ν
α α α ω
ξσσαμσσασσ∑ ∏ ∏ ∑+
=
−
=
−
= =−−++−−−++−
++++1 1 1 1
1111)]]*)1(*12*)[ ()(1(
m
m
n
m
nnmn TAPAbasalTAPAjbasali

PARAMETER DEFINITION: W = years of theoretical past service, b= factor according to professional category (from 0.3 to 3), basal = basic salary, σ= year of pension exit, example: 2011, κ = T -2007, years of service after 2007, α = years of averaging = abs(κ), ω = abs (months of service at the year Τ) λ= years of service until 2007 = days360(31/12/2007,date of entry)/360, ν =months of service after 2007, TAPA = total average pensionable allowance = Average (family allowance + 140.80+…etc.), iρ = pension indexation of year ρ, jρ = TAPA indexation of year ρ EQUATION DEFINITION: it is the sum of the salaries after 2007 without Christmas, Easter and holiday allowances all indexed until the exit year σ
Contribution Formulas Before 1993: (Basic Salary+140.80)*6.67% After 1992: all the pensionable contributions * 6.67%
Average contribution 2007 indexed

2. Pension expenditure projections
2.1. Extent of the coverage of the pension schemes in the projections
The current exercise projects approximately 99.5% of total pension expenditure in 2007 through to 2060; corresponding to public, first pillar pension payments. However, analytical actuarial models were used only for the four biggest social security primary pension funds, namely:
- IKA-ETAM (private sector wage earners), - OAEE (self employed), - OGA (farmers) and - Public Sector employees (PS).
Those funds belong in “Group1” and in 2007 they cover 90% of the working population, 92% of pensioners and represent approximately 67% of total pension expenditure and 79% of the total deficit. The models for these four funds where developed in collaboration with the International Labour Office (ILO). The evolution of all remaining schemes was projected using non-actuarial methods, also developed in collaboration with ILO. Specifically:
- The evolution of the primary pension funds: TSMEDE, TAPOTE, NAT, and TAN and the auxiliary pension funds: MTPY and ETEAM, henceforth “Group2 schemes”, was projected using the “IKA-ETAM” age distributions of old age pensioners, invalidity and death pensioners, average age of contributors and awardees, average benefit and average pension.
- The impact of other schemes, henceforth “Group3 schemes” is calculated as a loading in the result obtained from the sum of results of “Group1” and “Group2” funds. Provident funds are also included in the study as part of “Group3”, although presently, benefits are not expressly guaranteed by the national budget.
The study does not cover second and third pillar funds, due to methodological and data constraints and their limited significance (approximately 0.05% of gross pension spending in 2007).
2.2. Overview of projection results
Pension spending for the social security system, as a percentage of GDP, is projected to rise significantly over the next 53 years, from 11.7% of GDP in the base year to 24.1% of GDP in 2060. Demographic developments are the single most important driver, with the dependency ratio clearly having the most sizeable impact on pension expenditure throughout the projection period, with the exception of the final decade 2050-2060. The coverage ratio has a comparatively small, but negative impact, reflecting mainly the assumed increase in the participation rate of older workers, especially in the early years of the projection period. Similarly, the increase in employment has a comparatively small, yet mitigating effect up until 2020. The benefit ratio has a positive contribution until the mid 2030s. Thereafter, though, it turns negative and remains so until the end of the projection period. Although pension spending is projected to increase throughout the projection period, two distinct sub-periods can be identified. In the years before 2035, expenditure growth is
127

accelerating, whereas after 2035 the pace starts slowing down. Although the demographic pressure is clearly reduced during the last ten years of the projection, its positive impact remains strong between 2035 and 2050 and does not justify the qualitative change in the pace of spending growth. The factors behind this change are systemic and can be associated to the split between old (pre-1993) and new (past 1992) workers. As the former generally enjoy more favourable provisions, the pressure on pension payments is alleviated, as the relatively more privileged workers are exiting the system. This is also corroborated by the reversal in the sign of the impact of the benefit ratio, which turns negative after 2040 and remains so until the end of the period, pointing to the reduced generosity of new pension payments. At a first glance, this appears to be at odds with the evolution of the overall replacement ratio, which starts at 60.6% in 2007 and reaches 66.5% in 2060. However, looking at individual schemes, it becomes apparent that the generosity of new pensions is clearly reduced for wage earners (IKA-ETAM) and public servants, for which there exists a more clear distinction between old and new participants.
Table 3: Projected gross pension spending, tax on pension and contributions (% of GDP) 2000 2007 2020 2030 2040 2050 2060 Peak
year Social security pensions 10.82* 11.7 13.2 17.1 21.4 24.0 24.1 2055 Old-age and early pensions : 8.8 9.9 13.1 16.3 17.9 17.7 2053 Other Pensions : 2.9 3.3 4.0 5.1 6.1 6.4 2059 Occupational pensions 0.0 0.0 0.0 0.0 0.0 0.0 0.0 : Private pensions 0.0 0.0 0.0 0.0 0.0 0.0 0.0 : Mandatory private 0.0 0.0 0.0 0.0 0.0 0.0 0.0 : Non-Mandatory private 0.0 0.0 0.0 0.0 0.0 0.0 0.0 : Total pension expenditure : 11.7 13.2 17.1 21.4 24.0 24.1 2055 Taxes on public pensions : : : : : : : : Taxes on private pensions : : : : : : : :
*From the British actuaries study of 2000.
Graph 1: Pensioners, Contributors and Support ratio
AGEIN G AN D UN EMPLOYMEN T EFFECT
01.000
.0002.0
00.00
03.000
.0004.0
00.00
05.000
.0006.0
00.00
0
2007
2010
2013
2016
2019
2022
2025
2028
2031
2034
2037
2040
2043
2046
2049
2052
2055
2058
0,00
0,200,40
0,60
0,80
1,001,20
1,40
1,601,80
2,00
pensioners con tribu trors support ratio
128

Graph 2: Pension expenditure and Deficit as % of GDP and Benefit ratio
Table 4: Projected gross public pension spending: by scheme, as a % of GDP
*Figures from the 2000 British Government Actuaries study.
2000* 2007 2020 2030 2040 2050 2060 Peak year
Total Social security pension
11.06
11.70
13.20
17.10
21.40
24.00
24.10
2055
Of which
Public sector employees 2.00
2.03
2.19
2.72
2.93
3.21
3.37
2060
Private sector employees IKA- ETAM
4.17
3.30
3.67
4.99
7.07
8.57
8.50
2054
Farmers, OGA 2.14
1.55
1.14
1.01
1.06
1.05
0.93
2007
Self-employed, OAEE 1.18
0.93
1.59
2.33
2.89
2.85
2.54
2043
Others, ‘rest of the schemes’ 1.57
3.89
4.61
6.05
7.45
8.32
8.76
2060
129

Table 5: Assumptions and differences in the driving forces for the various projected groups ASSUMPTION FOR
THE YEARLY CONTRIBUTORS’ EVOLUTION
INSURANT POPULATION
SUPPORT RATIO 2007, 2060
BENEFIT RATIO 2007, 2060
REPLACEMENT RATIO 2007, 2060
Total
4,609,000
1.75, 0.98
20.80, 23.48
60.65, 66.50
Public sector employees
Stable (Closed group)
549,000
1.59, 0.96
27.07, 24.14
150.00, 111.22
Private sector employees IKA- ETAM
According to employed population by age
2,425,000
2.54., 1.04
13.13, 15.67
84.17, 70.00
Farmers, OGA 1% decline from the base year
661,413
0.79, 0.70
4.98, 6.72
10.59, 20.99
Self-employed, OAEE
According to employed population by age
576,426
2.05, 1.12
15.16, 23.29
80.00, 85.10
Others, ‘rest of the schemes’
According to total employed
398,000
2.94, 0.90
10.35, 7.22
48.21, 44.04
Based on historical data, IKA-ETAM employees and the self-employed of OAEE are assumed to grow in line with total employees. On average, IKA- ETAM contributors are younger than those of OAEE and OGA. OGA, on the other hand, is diminishing, in line with the historical decline of the agricultural sector, while OGA actives are concentrated on comparatively higher age cohorts. The population of the rest of the schemes is even younger than that of IKA-ETAM, so the ageing effect and the deficits are expected to have their impact later than IKA-ETAM but equally severely.
2.3. Description of main driving forces behind the projection results and their implications for main items from a pension questionnaire
444 8444 7RatioBenefitRateEmploymentRatioCoverageRatioDependency
PeopleWorkingGDP
PensionAverage/1 6444 8444 764444 84444 76444 8444 76
PeopleWorkingPopulation
PopulationPensionersofNumber
PopulationPopulation
GDPExpPension ×−×
+×
−+= 6415
65641565.
In the Part B of the Appendix of the report we can see the diagrams for the a. Pension Exp./ GDP, figure 1.5 b. Dependency ratio, figure 1.4 c. Coverage ratio, figure 1.2 d. 1/Employment rate, figure 1.10 e. Benefit ratio, figure 1.6
As we previously analysed, the ageing effect, along with the awarding of “pre-93’s” pensioners are becoming more and more apparent until 2035. It is the period when we have the bigger growth of the pension expenditure and also with faster rates. After that time the effect passes, due to an establishment of a new equilibrium between pensioners and workers and also because “post-92’s” pensioners receive on average less pensions as in IKA-ETAM (most private workers become pensioners before the age of 65), or in contrast to the past years they contribute totally for their pensions as in OGA.
130

So the main driving forces behind the ratio of pensions to GDP for the period 2007-2060 is the combined evolution of the support ratio and benefit ratio. We can observe from figure 1.4, in the Appendix, that the Dependency Ratio affects the Pension expenditure to GDP in an almost linear way. That is because actually population over the age of 64 mainly represent pensioners and population between the ages 15-64 mainly represent actives. The evolution of active population is, every year, mainly a percentage of the “15-64” population, since workers over 64 represent only a small amount of total workers and pensioners emerge, according to the eligibility provisions, on average, over the age of 61. We observe that the change of trend after 2035 is apparent at the Dependency Ratio. We can see this change of trend after 2035 in almost all demographic parameters graphs such as the ratio of pensioners to employees, Graph 1, coverage ratio, Graph 2, and also in the ratio of employees to the number of population between ages 15 and 64, figure 1.3 in the Annex. Nominal pension indexation is generally assumed to be the inflation plus 0.5% i.e. 2.5%. So the real pension indexation is 0.5%. This is generally lower than 75% of the productivity growth, which means that our pension indexing system is not a generous one, what is also obvious from the low benefit ratio. In the next table 6, we present the experience since now of pension indexing, relatively to inflation and GDP growth, which supports our assumption.
Table 6: Statistics of Inflation, Real and Nominal GDP growth YEAR 2003 2004 2005 2006 2007 Inflation 3,50% 3,00% 3,50% 3,30% 2,90% Nominal GDP 171.257 185.225 198.611 213.985 228.949 Nominal GDP change 8,67% 8,16% 7,23% 7,74% 6,99% Real GDP change 5,00% 3,90% 3,90% 4,10% 3,08% Real GDP 197.636 205.343 213.352 222.099 228.949 Nominal Pension indexation 4% 4% 4% 4% 4%
Real pension indexation 0,48% 0,97% 0,48% 0,68% 1,07%
Table 7: Factors behind the public pension expenditures between 2007 and 2060
(in percentage points of GDP) 2007-20 2020-30 2030-40 2040-50 2050-60 2007-60 Public pensions to GDP in a starting year *
1.7 3.9 4.4 2.6 0.1 12.4
Dependency ratio 2.1 2.4 4.4 3.8 0.1 12.7 Coverage ratio -0.9 -0.1 -0.1 -0.1 0.8 -0.4 1/Employment rate -0.7 0.2 0.0 -0.2 0.1 -0.6 Benefit ratio 1.0 1.3 0.2 -0.8 -0.9 0.8
* The starting year is 2007 for the column 2007-20 and 2020 for the column 2020-30, etc..
In the Part B of the Annex we can see in the figure 1.9 the graph of the replacement ratio, for the baseline scenario. Factors affecting the ratio are the average wage growth, the length of the career, the eligibility conditions and the pension formula. Irregularities in the replacement ratio and in the average award graphs are due to multiplicity of the schemes and thus to different eligibility conditions and pension formulas. Some of the various schemes replacement ratios are shown in Table 8. Also distortions of the Greek pension social security system are also apparent from the large differences in the replacement ratio of each group.
131
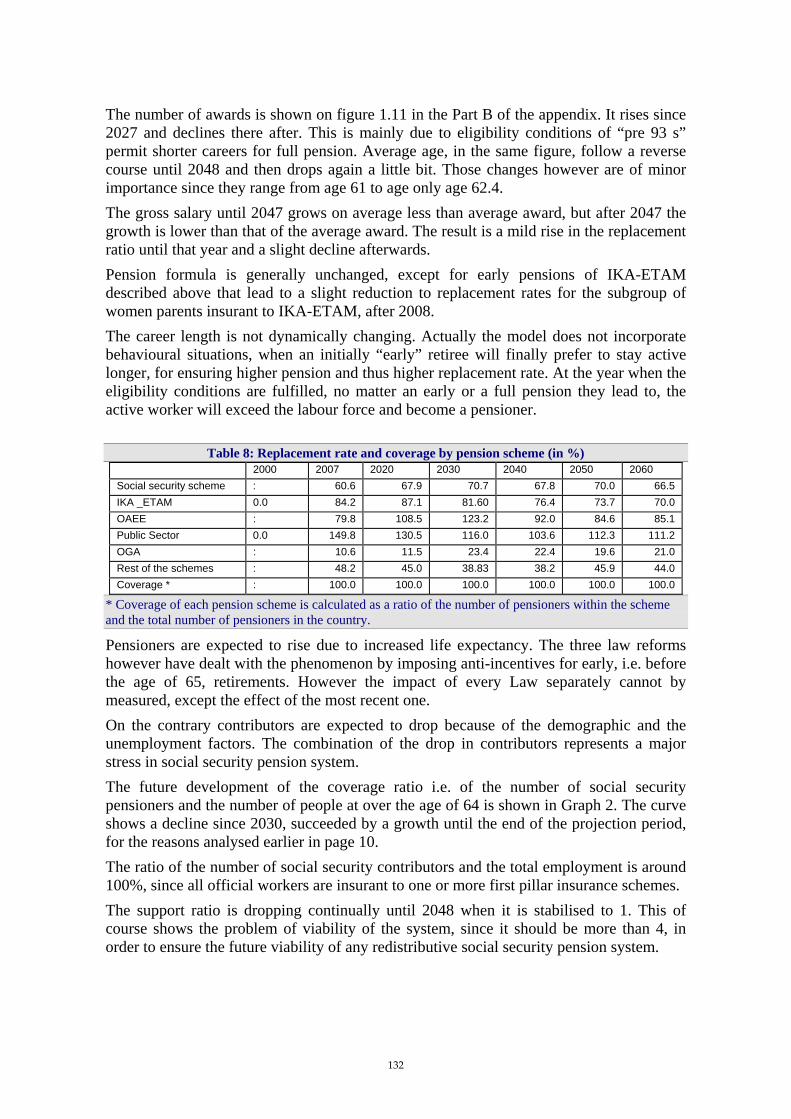
The number of awards is shown on figure 1.11 in the Part B of the appendix. It rises since 2027 and declines there after. This is mainly due to eligibility conditions of “pre 93 s” permit shorter careers for full pension. Average age, in the same figure, follow a reverse course until 2048 and then drops again a little bit. Those changes however are of minor importance since they range from age 61 to age only age 62.4. The gross salary until 2047 grows on average less than average award, but after 2047 the growth is lower than that of the average award. The result is a mild rise in the replacement ratio until that year and a slight decline afterwards. Pension formula is generally unchanged, except for early pensions of IKA-ETAM described above that lead to a slight reduction to replacement rates for the subgroup of women parents insurant to IKA-ETAM, after 2008. The career length is not dynamically changing. Actually the model does not incorporate behavioural situations, when an initially “early” retiree will finally prefer to stay active longer, for ensuring higher pension and thus higher replacement rate. At the year when the eligibility conditions are fulfilled, no matter an early or a full pension they lead to, the active worker will exceed the labour force and become a pensioner.
Table 8: Replacement rate and coverage by pension scheme (in %) 2000 2007 2020 2030 2040 2050 2060 Social security scheme : 60.6 67.9 70.7 67.8 70.0 66.5 IKA _ETAM 0.0 84.2 87.1 81.60 76.4 73.7 70.0 OAEE : 79.8 108.5 123.2 92.0 84.6 85.1 Public Sector 0.0 149.8 130.5 116.0 103.6 112.3 111.2 OGA : 10.6 11.5 23.4 22.4 19.6 21.0 Rest of the schemes : 48.2 45.0 38.83 38.2 45.9 44.0 Coverage * : 100.0 100.0 100.0 100.0 100.0 100.0
* Coverage of each pension scheme is calculated as a ratio of the number of pensioners within the scheme and the total number of pensioners in the country.
Pensioners are expected to rise due to increased life expectancy. The three law reforms however have dealt with the phenomenon by imposing anti-incentives for early, i.e. before the age of 65, retirements. However the impact of every Law separately cannot by measured, except the effect of the most recent one. On the contrary contributors are expected to drop because of the demographic and the unemployment factors. The combination of the drop in contributors represents a major stress in social security pension system. The future development of the coverage ratio i.e. of the number of social security pensioners and the number of people at over the age of 64 is shown in Graph 2. The curve shows a decline since 2030, succeeded by a growth until the end of the projection period, for the reasons analysed earlier in page 10. The ratio of the number of social security contributors and the total employment is around 100%, since all official workers are insurant to one or more first pillar insurance schemes. The support ratio is dropping continually until 2048 when it is stabilised to 1. This of course shows the problem of viability of the system, since it should be more than 4, in order to ensure the future viability of any redistributive social security pension system.
132

Table 9: Number of pensioners and contributors in the Social security scheme (in 1000), population over 65 and total employment (in 1000) and related ratios (%)
2000 2007 2020 2030 2040 2050 2060 Number of pensioners (I) 2087* 2635 2871 3262 3804 4158 4192 Number of people aged 65+ (II) 1796 2074 2441 2798 3285 3610 3519 Ratio of (I) and (II) 116 127 118 117 116 115 119 Number of contributors (III) 3711* 4608 4856 4691 4443 4210 4107 Employment (IV) 4004 4606 4854 4656 4368 4105 3977 Ratio of (III) and (IV) 93 100 100 101 102 103 103 Ratio of (III) and (I) 'support ratio' 178 175 169 144 117 101 98
*Figures from the 2000 British Government Actuaries study.
There is no accumulation of assets imposed by Law in the Greek social security system. Assets which are invested, under current regulations, is the emerging difference between contributions and outgo. In case of liquidity or financial problems of the scheme and if the state does not finance the deficit, all assets may need to be liquidated to pay the benefits of the insurants.
Table 10: Assets of pension funds and reserves, (% of GDP) 2000 2007 2020 2030 2040 2050 2060 Public Pension funds 21.4 : : : : : : Of which liquid financial assets, non-consolidated
5.3 : : : : : :
Of which liquid financial assets, consolidated 16.1 : : : : : : Occupational pensions 0.0 0.0 0.0 0.0 0.0 0.0 0.0 Private pensions 0.0 0.0 0.0 0.0 0.0 0.0 0.0 All pensions 21.4 0.0 0.0 0.0 0.0 0.0 0.0
2.4. Sensitivity analysis
Perhaps the most striking feature of the sensitivity analysis is that the baseline results appear to be particularly robust within the range of assumptions included in the different scenarios. One exception is perhaps the zero migration scenario, which results in the more pronounced increase in pension spending compared to the baseline. This is primarily due to the fact that migrants are an important injection into the labour force, and thus GDP. Higher labour productivity tends to reduce pension spending, mainly through its positive impact on GDP growth. As indexation schemes are mostly based on prices, higher labour productivity reduces the impact of the benefit ratio on pension expenditure. As a consequence, higher labour productivity generally leads to reduced pension spending compared to the baseline. The higher employment rate for older workers has a mitigating effect on expenditure via the coverage ratio; however, this tends to be partly offset by higher replacement rates, due to increased pension rights. Overall, the effect on pension spending is marginally below the baseline. The higher life expectancy scenario indicates that the total pension expenditure will rise to 24.4 of the GDP until 2060, 0.3 percentage points over the baseline scenario. From figures 3.1 and 3.10 of the Part B of the Appendix we can observe that the number of pensioners and the number of pension awards will also rise after 2040 more than that of the baseline scenario. This effect is due to the increased life expectancy of pensioners not accompanied by any age threshold increase in the eligibility provisions.
133

Table 11: Total and public pension expenditures under different scenarios
(Deviation from baseline scenario) 2007 2020 2030 2040 2050 2060 Total Pension Expenditure Baseline 11.7 13.2 17.1 21.4 24.0 24.1 Higher life expectancy 11.6 13.0 16.9 21.4 24.1 24.4 Higher lab. productivity 11.6 12.9 16.4 20.2 22.3 22.0 Higher interest rate #N/A #N/A #N/A #N/A #N/A #N/A Higher emp. rate 11.6 12.8 16.6 20.9 23.5 23.8 Higher emp. of older workers 11.6 12.8 16.5 20.8 23.5 23.8 Zero migration 11.6 13.4 17.8 23.3 27.2 27.7 Public Pension Expenditure Baseline 11.7 13.2 17.1 21.4 24.0 24.1 Higher life expectancy 11.6 13.0 16.9 21.4 24.1 24.4 Higher lab. productivity 11.6 12.9 16.4 20.2 22.3 22.0 Higher interest rate #N/A #N/A #N/A #N/A #N/A #N/A Higher emp. rate 11.6 12.8 16.6 20.9 23.5 23.8 Higher emp. of older workers 11.6 12.8 16.5 20.8 23.5 23.8 Zero migration 11.6 13.4 17.8 23.3 27.2 27.7
2.5. Description of the changes in comparison with the 2001 projection
The 2000 study, in the ratio of total pension expenditure to GDP, apart from pension expenditure included administration costs of the schemes. Due to the difficulty of collecting data from every scheme separately, it was based on statistical data from the Labour Market Survey and not to the data bases of the schemes. These data steam from a sample of 60.000 families. Unfortunately a complete comparison is not feasible because we only have fragmentarily information and software, of the 2000 valuation.
Table 12: Decomposition of the change (in %) in public pension expenditure to GDP between 2007 and 2050 under the 2001 and 2009 projection exercises
* Decomposition period 2000-2050, From the British Actuaries’ study of 2000
% Change to 2050
Dependency ratio
Coverage ratio
Employment effect
Benefit ratio
Pension/GDP – 2000 * 10.98 28.9 #N/A #N/A #N/A Pension/GDP – 2006 ** #N/A #N/A #N/A #N/A #N/A Pension/GDP - 2009 *** 12.6 12.7 -1.2 -0.7 1.7
** Decomposition period 2004-2050, *** Decomposition period 2007-2050.
134

Spain (Report prepared by Virginia Alonso, Juan Varela and Francisco de Castro) The projection exercise 2007-2060 of pension expenditure has been carried out by the Ministry of Economy and Finance, under the guidelines and demographic and economic assumptions agreed in the Ageing Working Group of the Economic Policy Committee.
1. Overview of the pension system
1.1. Description The public system is based on two schemes: basic scheme (non-contributory system)
and labour-market-based social security scheme (contributory system). In this projection exercise we consider contributory pensions (including complements to minimum pensions) and some minor non-contributory schemes.
- The basic non-contributory scheme is granted, as a general rule, to people with income below a threshold approved every year in the Budget Law (€7,988 per year in 2007; €8,400 per year in 2008). The benefit is a minimum income for the elderly (>65) and the disabled (<65), that have never contributed and subject to means-test. It is financed by the state general revenues. The part of old-age is 57% of the total non contributory pensions, amounting to 0.1% of GDP in 2007. In general, they are not considered in this projection. - The contributory system: labour-market-based social security scheme is a mandatory public system. The part of the scheme that covers the employees in the private sector, the self-employed and the public employees of the regional and local public administrations is administered and managed by the Social Security (SS), as a pay-as-you-go system. The military and the central government employees have their pensions administered and managed by the state (Clases Pasivas del Estado, CPE69). The system includes retirement and early retirement, disability and survivors pensions. Each scheme includes complements to reach minimum pensions (means-test). It also includes SOVI pensions (a system considered under the policy of minimum income and under extinction), a uniform low pension is granted to people having contributed only before 1967 (not means-tested). Pensions from the SS are financed by contributions (from employers, employees and part of the unemployed70). Complements to minimum pensions are partially financed by the state (34% in 2007) and increasing to 100% in 2013. Pensions from the CPE are financed by contributions from the employees and from the state. Pension benefits are taxed as labour income, while compulsory social contributions are excluded from the income tax base. Private pensions are voluntary (non-mandatory) and supplementary and cover both
personal and occupational pension funds (47.7% and 52.3% percent of total private pension funds’ assets in 2007). Occupational pensions include occupational plans71
69 The Social Security pensions are earnings–related pensions. The CPE (Central Administration and military) pensions are based on a flat-rate scheme by wage categories of the civil servants. 70 All unemployed receiving benefits, and subsidies if aged over 52. 71 They include the (mandatory) pension fund of public sector employees (only 0.4% of total rights of occupational schemes
135
and collective pension insurance plans (with retirement benefit purposes). Private plans are funded and mostly defined-contribution schemes. The occupational private pension schemes are agreed in the wage bargaining framework. They are usually financed by employers and employees. Private pension benefits are also taxed as labour income. Contributions to private pension plans enjoy a favourable tax treatment (EET) with the exception of collective insurance that does not enjoy tax exemptions.
1.2. Main pension formulas (old-age, disability and survivors’ pensions). Indexation.
PENSION FORMULAS BY SCHEME: The calculation method for pensions managed by SS is earnings-based. The pension benefit is related to the number of years of working life and the so-called regulatory base (RB) linked to the contributions paid. In particular, only if the worker has contributed at least for 35 years, is he/she entitled to the full old-age pension associated to his/her regulatory base if he/she retires at 65. On the other hand, if the number of years of contributions is equal to the minimum required (15 years), the worker gets only 50 percent of the RB. The percentage of the RB increases by 3 percentage points for each additional year of contribution until 25 and by 2 percentage points for each additional contribution year afterwards, up to 35. Under the SS scheme, there exists a possibility of early retirement with reduced pension benefits for workers aged 61 and older, provided very long contribution careers (30 years) and being unemployed (exceptionally for people who have been contributing since before 1967, early retirement can be at the age of 60). Also there is a possibility for partial retirement (combining part-time work) from the age of 60, gradually increasing to a minimum of 61. Therefore new early retirement pensions at 60 will still be possible only in the short term. In the case of early retirement (not partial), the pension benefit is reduced by 7.5 percent for every year or fraction of year before 65 (with 30 years of contribution), going to 6 percent per year (with at least 40 years of contributions). In case of prolonging working life after 65, there is an additional 2 or 3 percentage point of the RB depending on contribution years. The RB is the average of the contribution base (CB) of the 180 months prior to retirement (divided by 210). The contribution base (CB) is essentially the monthly earned income. CBs corresponding to the 24 months just prior to retirement are computed in nominal terms. The remaining CBs are adjusted according to the evolution of the Consumer Price Index (CPI). Disability pensions take into account the level and the cause of disability, the age of the worker and whether or not the worker is currently employed and contributing. Concerning full permanent disability, the pension amounts to 55 percent of its RB, which can be increased by 20 percent when the worker is 55 and cannot work or up to 100 percent of RB in case of absolute permanent disability. Recent reforms have increased contributory requirements. Under SS, widow(er), orphans and relatives of workers of old age or disability pensioners are eligible to survivors’ pensions. In the case of active, contributing workers, contribution requirements are different according to the cause of death. In the case of pensioners, no but a high number of contributors, 500,000).
136
period of contribution is required. The pension benefit for the widow(er) amounts to 52 percent of the deceased spouse's RB. For the orphans, it is 20 percent of RB. However, in general, the total pension benefit for the family cannot exceed 100 percent of the RB. For other relatives, the pension benefit amounts to 20 percent of the RB, but it can be increased if there are no widow(er)s nor orphans. For pensions managed by the Contributory Public Pension System (CPE) for the military and central government employees, the eligibility requirements for old age pensions are 65 years of age and 15 years of contributions. Since 1997, civil servants can retire after the age of 65 up to 70 on a voluntary basis. Under the CPE scheme, early retirement is possible at 60, provided workers have contributed for at least 30 years or more (reduction coefficients also apply). The RB is fixed and depends on the wage category the civil servant belongs to. The pension benefit for old-age, early retirement and disability depends also on the number of years worked. In case of permanent disability occurring while working, RB is multiplied by 2. For survivors, pensions are calculated as: 50 percent of the deceased spouse's RB for the widow(er); 25 percent of RB for a single orphan; 10 percent for each orphan when there are more than one plus an extra 15 percent to share among them; 15 percent for other relatives. THRESHOLDS (see their evolution in graph 1): There are minimum and maximum Contribution Bases (CB). The minimum CB is similar to the minimum wage (and evolves in line with it). It has increased more than inflation in recent years in an effort to improve contributiveness. The maximum contributory base is regulated by the Annual Budget Law (increasing close to CPI but with differences among groups). It has been observed that the average CB has increased in line with productivity (or wage) increase. This is applied in the projection exercise and it is in line with the general assumption of a constant revenue-to-GDP ratio. There are minimum and maximum pension benefits. Minimum pension benefits depend on pensioner age and household composition (in 2008, €9,222 per year with dependent spouse). If a person that is eligible to a contributive pension does not reach the minimum pension and has no other resources, a complement to reach the minimum will be granted. In 2007, 27% of pensions had complements to minimum pensions (2.2 millions of pensions) and 20% of new pensions. The system also has a maximum pension that only affects 1% of pensions. In 2007, the maximum pension benefit was €32,729 per year.
137

Graph 1: Evolution of thresholds 1996-2007
Source: own ellaboration with Social Security published data PENSION INDEXATION (legislation and projection): All existing pension benefits, including minimum and maximum pensions, are indexed to target inflation (CPI), by the Social Security law. If actual inflation is above (in November), the difference is paid to all pensioners72. However, in recent years, annual Budget Laws have set increases in minimum pensions higher than inflation (similar to increases in minimum contribution bases), following a political compromise to improve pension adequacy. In the projection, this compromise is included, with minimum pensions increasing more than inflation: 6% in the short term, followed by a convergence path to CPI indexation, after 2035 CPI indexation is assumed. As for maximum pensions, for simplicity as its incidence is very low (1% of pensions), in the projection no cap has been applied till 2035. In the very long term, as productivity increases, more pensioners should be affected by the maximum pension, and price indexation is assumed. Other important features of our system are: The Social Security Reserve Fund was created in 2000 and accumulations are based on the SS surplus (all revenues and expenditure are computed). In December 2008 it reached €57.221 million (5.4% of GDP). The portfolio composition is 56% invested in Spanish public debt and the rest in other euro area public debt. Withdrawals are only permitted in case of SS deficit to finance contributory pensions. The average retirement age in 2007 (old-age and early retirement) was 63.6 years (63.4 for males and 64 for females).
1.3. Recent reforms of the pension system included in the projections
The most recent measures are enacted by Law 35/2002 on gradual and flexible retirement and in Law 40/2007 (it entered into force in January 1st, 2008). They focus on rationalization of early retirement pensions and old-age pensions, promoting the voluntary extension of working life, and on changes in disability and survivors’ pensions. These
72 The law also foresees possible compensation by pensioners if CPI inflation is actually lower than expected, although till now it has not been applied.
138

changes will potentially increase labour participation among older workers and improve the balance of contributions and benefits. Measures affecting the labour market are included in macroeconomic assumptions. The main impact of reforms is a considerable labour participation increase for older workers, reflected in an increase in the average retirement age. This has a positive impact on expenditure projections but only in the short/medium term: there is a delay in newly awarded pensions but these will be granted in the future and there is an increase in accrued pension rights because of more years of contributions (coverage is affected in two different ways, by reducing the possibility for early retirement but also by increasing eligibility as more people reach the minimum 15 years, and better adequacy of pensions). • Prolonging working lives: in 2002, the mandatory retirement age in the private sector
(65 years) was abolished. Workers can remain active after 65 with an increase in their pension benefits of 2% (applied to RB) for each additional year of work. The 2007 reform facilitates access to incentives (a minimum contribution of 15 years is enough, instead of 35)73 to have a 2% increase; and a new 3% for each extra year is introduced to those who have contributed more than 40 years. These incentives will now be applicable also to pensioners’ recipients of maximum pensions (in the form of a lump-sum).
• Reduction in social contributions: since 2002, for workers reaching the age of 60, employer social contributions are reduced by 50 percent. This figure increases by 10 percentage points every additional year until it reaches 100 percent, at the age of 65. In 2007, employees’ social contributions reductions that remain at work after 65 years-old (having contributed 35 years) were introduced. Other reductions for employers hiring workers older than 59 were extended in recent legislation.
• Early retirement: since 2002, it is possible from 61 years as long as the worker has paid social contributions for at least 30 years, has not left the company on a voluntary basis and has been registered as unemployed for at least 6 months, for people entering the system after 1967 (age 60 if they entered before 1967). Early retirement pension benefits are reduced depending on the number of years of contributions. The reduction coefficients of the pension benefit for each year of early retirement are: 7.5% (for 3074-34 years of contribution), 7% (35-37 years), 6.5% (38-39 years), and 6% for more than 40 years of contributions.
• Partial retirement pensions: in 2002, pensions have been made compatible with part-time work, the pension benefit being reduced according to the length of the working day. In 2007, partial pensions are rationalized, and the requirements hardened; 61 will be the minimum partial retirement age (instead of 60). The transition phase will be completed by 2013.
• Contributiveness: although the law required 15 years of contribution to be eligible for retirement pensions, the effective period was lower. The 2007 reform increases the minimum effective contribution years to be eligible for a retirement pension from 12.6 years to 15 years (because of the no consideration of days corresponding to extra payments). The transition phase will be completed by 2011. Other schemes are being reformed since 2007 to increase contributions and consequently their levels of protection (the new Self Employed Statute) and other regimes are being integrated in the Self Employed (the Special Scheme for farm workers). Other scheme reforms are
73 The aim of promoting the extension of working lives for short career contributions is also to allow generating pensions above the minimum, reinforcing contributiveness of the system. 74 The reduction coefficient was 8% for 30 years of contribution before the 2007 reform.
139

in the pipeline: the gradual integration of the ‘agrarian employee scheme’ and the special scheme for domestic employees within the general scheme.
• Disability pensions: the 2007 reform reduces the incentives to early exits via disability, reinforcing contributiveness and administrative control.
• Widow(er)s’ pensions: some tightening of eligibility criteria for married couples under certain conditions and extension for other family unions.
• Legislation relative to private pensions: the 1999 Regulation established a transition period till the end of 2002 to externalise occupational pensions from corporations to convert them into autonomous pension funds. Thus, there is an important increase in 2002 contributions to pension funds. A Pension Fund for Central Government employees started operations at the end of 2004, affecting around 500.000 persons but with very low average contributions. The 2006 income tax law introduced a penalisation for pension payments in the form of a lump-sum, incentivising annualised pensions.
1.4. Description of the effective constant policy in the projection
The model applies the no policy change assumption. However, as an exception, enacted pension rules were not strictly applied when practice differs from the rule. According to legislation, pension benefits are indexed with inflation. But effectively, in recent years, minimum pensions have increased well above inflation and above the average pension (moreover an annual 6% average increase is foreseen in the coming years by the government and there is a political compromise backed by all parties to improve adequacy). In the projection exercise, this effective policy continues over the medium term (see point 2, indexation).
2. Pension expenditure projections
2.1. Coverage of the pension schemes in the projections
The concept of public pensions used in the projections includes all kind of contributory public pensions and part of non-contributory public pensions, according to the following definitions. INCLUDED IN THE PROJECTIONS:
2.2. Contributory Public Pensions (including minimum pensions) • Old-age and early retirement pensions: includes old-age retirement pensions for
people who are 65 and more, plus early retirement pensions for 60-64 year-old persons. It includes public pensions for private sector employees, public sector employees (both under SS and CPE) and the self-employed and complements to minimum pensions. It also includes the SOVI regime (pensions for persons having contributed only before 1967, not means-tested) and other former pension schemes75.
75 Persons belonging to mutual pension schemes after 1967 are awarded additional contribution years (assuming they
140

• Disability pensions: includes all disability public pensions for private sector employees, public sector employees (both under SS and CPE), self-employed and complements to minimum pensions. Since 1997, disability pensions for persons aged 65 and older are considered by the Social Security administration as old-age retirement pensions.
• Survivors’ pensions: includes all ages survivors’ public pensions for private and public sector employees (both under SS and CPE), self-employed and complements to minimum pensions. They include widow(er), orphans and family benefits.
2.3. Non-contributory Public Pensions • War pensions: includes civil war (1936-1939) injury and survivors pensions.
They are included in the state public sector employees system (military). They accounted for 0.05% of GDP in 2007.
2.4. Private pensions Private pensions are covered for the first time in these projections. They include occupational and personal pension funds (note that both are voluntary, except the occupational plan of the public sector).
NOT INCLUDED IN THE PROJECTIONS: • Other non-contributory pensions76: they are similar to a minimum income
for the elderly and the disabled that have never contributed and without economic resources (means-tested, considering the family unit). It includes old-age (over 65) and disability (under 64). The level of the pension depends also on the number of beneficiaries in the household and family carers. It is managed by the IMSERSO (not the SS), the Institute for social services for the elderly. They accounted for 0.19% of GDP in 2007; 469,000 beneficiaries; the average level is 300€/month. The part considered as old-age accounts for 0.1% of GDP.
We can assume that this percentage will diminish in the future: (i) the number of beneficiaries has been decreasing in the past; (2) women are the main beneficiaries (72% of non-contributory pensions), as female participation rate increases in the projection, more women will be entitled to a contributory pension and thus will not be eligible for non-contributory pensions.
2.5. Overview of projection results The main projection results presented in the reporting framework are summarised below:
− The projected development of public (Social Security and CPE) pensions’ expenditure over GDP between 2007 and 2060 is an increase of 6.7 percentage points of GDP (from 8.4% to 15.1% of GDP). The increase is mainly due to retirement pensions (6.5 percentage points; from 5.6% to 12.1% of GDP). The
started working at the minimum working-age). SOVI pensions can be awarded to persons accrediting contributions before 1967 (but who stop working afterwards). 76 Regulation of these pensions started in 1990 (Law 26/1990).
141

peak year in public pension spending is 2053 with 15.6% of GDP, while for retirement pensions the peak is reached in 2054 (12.5% of GDP). The ratio would remain broadly stable until the mid-twenties but then would accelerate until 2050. In the last decade pension expenditure as a share of GDP would stabilise and slightly decrease after 2054.
− Other pensions include disability (always under age 64) and survivors pensions (all ages), which account for 3% of GDP and are more stable in the projection.
− The expected development of Occupational and Non-mandatory private personal pension spending to GDP has been projected for the first time: prudent assumptions have been considered to project private pensions (see section 3) and the projected increase is 0.7 percentage points of GDP (from 0.6% of GDP in 2007 to 1.4% of GDP in 2060).
− The expected development of taxes on pensions to GDP is based on a constant tax rate over the projection period (the 2005 withholding tax rate for pensions), that is 4.7% for public pensions and 10.04% for private pensions. The ratio of revenue over GDP on public pensions rises from 0.4% to 0.7% over the projection period; in the case of total private pensions the revenue ratio is stable at 0.1%.
Table 1: Projected gross pension spending and tax on pension (% of GDP)
2000 2007 2020 2030 2040 2050 2060 Peak year *
Total public pensions** 9.1 8.4 9.5 10.8 13.2 15.5 15.1 2053 Old-age and early retirement pensions***
6.0 5.6 6.6 7.8 10.0 12.3 12.1 2054
Other Pensions (disability and survivors)***
3.0 2.9 2.9 3.0 3.2 3.2 3.0 2042
Occupational pensions : 0.4 0.5 0.6 0.7 0.7 0.7 2043 Private personal pensions : 0.2 0.4 0.6 0.8 0.8 0.7 2044 Mandatory private 0.0 0.0 0.0 0.0 0.0 0.0 0.0 : Non-Mandatory private : 0.2 0.4 0.6 0.8 0.8 0.7 2044 Total pension expenditure (public and private)
: 9.1 10.4 12.0 14.7 16.9 16.5 2053
Taxes on public pensions 0.4 0.4 0.4 0.5 0.6 0.7 0.7 2052 Taxes on private pensions : 0.1 0.1 0.1 0.1 0.1 0.1 2044
* This column represents a Peak year, i.e. the year in which the particular variable reaches its maximum over the interval 2000 to 2060. ** Public pensions include Social Security and public sector employees (CPE). ***Old age pensions refer to old-age retirement pensions. Other pensions include disability (<64 age) and survivors (all ages). The Spanish Social Security system comprises various contributory regimes. The General Regime incorporates the great majority of contributors. It co-exists with five special and not so quantitatively important regimes. Those special regimes include the self-employed, dependent farm workers, self-employed farm workers, fishermen, coalminers and domestic workers. Among them, the most important are the farmers (1.2% of GDP in 2000; 0.9% of GDP in 2007) and the self-employed (0.7% of GDP in 2000; 0.7% of GDP in 2007). As stated in part 1, these schemes are in a reform process and their projection has been integrated. As stated in the description of the system, the separate CPE regime affects central government employees (within a rationalisation process that foresees a lower replacement of civil servants) and the military, while regional administration employees belong to the SS system. Its projection is disaggregated in table 2 and graph 2 below.
142

Table 2: Projected gross public pension spending by scheme (as % of GDP) 2000 2007 2020 2030 2040 2050 2060 Peak year * Total public pensions 9.1 8.4 9.5 10.8 13.2 15.5 15.1 2053 of which Private sector employees (SS)
8.1 7.6 8.7 10.0 12.5 14.8 14.6 2054
Public sector employees (CPE)
0.9 0.8 0.9 0.9 0.8 0.6 0.5 2026
Graph 2: Total public pension expenditure by type of pension
Total public pension expenditure (% of GDP)
0,0%
2,0%
4,0%
6,0%
8,0%
10,0%
12,0%
14,0%
16,0%
Public sector employees (CPE) total %GDP SS old-age pensions (%GDP)
SS disability and survivors pensions (%GDP) Total public pensions (%GDP)
2.6. Description of main driving forces behind the projection results The standard decomposition of the ratio of pension expenditure to GDP into the dependency, coverage, benefit ratio and the inverse of the employment rate gives a better understanding of the main driving forces behind the ratio of public pension expenditures to GDP between 2007 and 2060 (see table 3 below):
444 8444 76444 8444 764444 84444 76444 8444 76 RatioBenefitRateEmploymentRatioCoverageRatioDependency
PeopleWorkingGDP
PensionAveragePeopleWorking
PopulationPopulation
PensionersofNumberPopulationPopulation
GDPExpPension ×−×
+×
−+=
/1
6415656415
65.
Note: 'Average pension' = social security pension expenditure divided by the number of pensioners (in our case pensioners have been estimated after pensions discounting possible duplicates).
− The first component, the contribution of the old-age dependency ratio, is the main driving force, accounting for more than the total projected increase in expenditure in terms of GDP in each sub-period and in the entire projection period (10.7 over 6.7 percentage points, see table 3). This is fully consistent with our type of pension system that is mainly dependent on demographic factors. The old-age dependency ratio increases from 24% in 2008 to 59% in 2060, with a peak in 2055 and a slight decline afterwards, explaining the profile of the pension expenditure-to-GDP ratio. The other components offset this demographic effect, although there are some differences in certain periods.
− The second component, the coverage ratio, is expected to mitigate the increase in expenditure. Although the number of pensions (all types and ages) increases up until the 2050’s decade, population over 65 increases further. This is due to recent
143

reforms to rationalise the number of other pensions and to demography. As an exception, coverage contributes to increase pension spending in the last decade 2050-2060. This is due to population over 65 falling further than the number of total pensions as the dependency ratio declines. It is important to take the following considerations into account regarding the interpretation of this coverage ratio: • It is to be noted that coverage in the above standard formula and table 3 is
defined for total public pensions (all ages) over population aged over 65. The interpretation of the level and evolution of the ratio can be misleading because of the heterogeneity of ages that enter the ratio. If the coverage were defined for pensioners or pensions aged >65 (instead of all ages) over population >65, the ratio would increase along the projection by 5 p.p. (see graph 3 below). This means a lower risk for adequate coverage of the elderly, much different from the first interpretation of a declining coverage that the standard (heterogeneous) ratio in table 3 shows. The increase is in line with the increase in participation rates (in particular female participation rates that increase their future rights). The decline in the medium term is mainly due to prolonging working lives that causes a delay in retirement.
• It is important to note that the coverage level with homogeneous ages is always under 100% in Spain. There is a percentage of the elderly population that is not entitled to contributive pensions. This does not represent a coverage concern because they are normally receiving other income: (i) The bulk of them are spouses (mostly women) aged over 65 not having the right to a contributive pension because they did not work. They are implicitly covered by the spouse (husband) contributive retirement pension; and after dying by the widow(er) pension. Also the existence of an economically dependent spouse entitles for a higher minimum pension. (ii) The elderly not having enough household resources can be granted a non-contributive pension. Comparisons of coverage ratio levels among countries that project only pensions cannot be done (as the number of pensions is normally higher). In our case, the coverage of the formula is calculated with pensioners.
Graph 3: Coverage ratio by group of ages
144

− The third component, the inverse of the employment rate, is also mitigating the dependency ratio impact, consistent with the expected increase in the employment rate by sub-periods. The strongest impact is projected in the first decade when employment growth is highest, while in the last decade the contribution is reversed as the employment rate stabilises and even slightly declines.
− The fourth component, the benefit ratio, also contributes to partly compensate the increase in expenditure, except in the first sub-period. This exception is due to the above-mentioned effective policy assumption that takes into account recent discretionary increases in minimum pensions and to the impact of recent increases in average new pensions that lead to an increase in average pensions above productivity. When these factors fade, price indexation arises as the main reason behind the decline in the benefit ratio, together with the gradual increase in life expectancy (as older pensioners that have relatively lower pensions will stay more years in the system).
Table 3: Factors behind the increase in public pension expenditures between 2007 and 2060 (in
percentage points of GDP) 2007-20 2020-30 2030-40 2040-50 2050-60 2007-60 Public pensions to GDP * 1.1 1.3 2.4 2.2 -0.3 6.7 Dependence ratio 1.1 2.3 3.7 3.4 0.1 10.7 Coverage ratio** -0.3 -0.1 -0.2 -0.3 0.1 -0.9 1/Employment rate -0.7 -0.1 -0.1 -0.1 0.1 -0.9 Benefit ratio 1.0 -0.7 -0.8 -0.7 -0.6 -1.8
*The starting year is 2007 for the column 2007-20 and 2020 for the column 2020-30, etc. ** coverage: see graph 3 The evolution of the projected old-age replacement ratio77 , defined as the first pension of those who retire at a given year over an average wage of the economy, has shown variability as new pensions have been influenced by recent behaviour in early retirement and by policy changes, among other causes. The replacement rate has increased in recent years. According to these projections and the AWG’s definition, it evolves from 66% in 2007 to 69% in 2060, with some variability in the middle of the period. Some of these effects of different sign are mentioned below: The agreed AWG’s labour market assumptions have a break in the exit rates from activity of older workers, producing a remarkable change in the retirement exits around 2020. - Recent policy changes increasing the level of minimum pensions above average
pension increase are projected to continue in the next years.
- There is a lag effect of productivity (and wage) increases over future pension expenditure increase. Productivity increases more slowly in the first projection sub-period, affecting pension entitlements in the mid-decades.
- Composition effects:
77 Gross Replacement Rate used here is a ratio of the first retirement pension of those who retire a given year over an economy-wide average wage based on National Accounts. It is a different concept and not comparable to other more usual theoretical replacement rates that take into account, among other things, average contribution years and statutory retirement ages. The theoretical gross replacement rate, at 65 with 35 years of contributions, reached 90.5 in 2006 and is projected to be 85% by 2050 for Spain (ISG, 2005).
145

• A high influence of the share of early retirement pensions over old-age pensions can be observed (potential early retirees decide to retire when they are entitled to high levels of pensions). This continues in the short term, but some recent reforms should pay-off in the medium term, reducing the possibility of early and partial retirement. In particular, new entries at 60 years-old will no longer be possible.
• At the same time, in the long term, the average retirement age increases, contribution careers lengthen and average new pensions should increase accordingly. In this regard, there should be an increase in the average new pension received by women, as their careers tend to converge to men’s in our projection (gradual convergence in contribution years), together with the increase in the share of women in old-age pensions.
In table 4 below, the evolution of demographic variables is projected:
− The coverage ratio (number of pensioners covered by public schemes) and its interpretation have already been commented (see section “driving forces” above). The coverage here included (pensioners all ages over population>65) can be misleading for the analysis of adequate coverage. In fact, as noted above, the ratio of pensioners aged more than 65 over population aged also more than 65 shows an increase from 82% to 87% over the projection period, in line with increased activity that translates into future new pensions.
− The expected development of the number of contributors is in line with labour force projections, as both employed and unemployed are potential contributors.
− The support ratio78 has recorded a favourable evolution in the recent past. However, ageing populations will dramatically turn around this result, with a projected decline from 266 in 2007 to 130 in 2060. Therefore, over the projection period the support ratio will halve, with only 1.3 contributors financing one public pension in 2060.
Table 4: Number of pensioners and contributors in the Social security and CPE scheme (in 1000),
population over 65 and total employment (in 1000) and related ratios (%) 2000 2007 2020 2030 2040 2050 2060 Number of pensioners (I) 7508 8075 9775 12080 15017 17002 16805 Number of people aged 65+ (II) 6706 7407 9292 11655 14740 17090 16788 Ratio of (I) and (II)* 112 109 105 104 102 99 100 Number of contributors (III) 16994 21510 25326 25769 24544 22630 21911 Employment(IV) 15333 20089 24055 24324 23004 21197 20615 Ratio of (III) and (IV) 111 107 105 106 107 107 106 Ratio of (III) and (I) 'support ratio' 226 266 259 213 163 133 130
*See more explanations above and graph 3. Since 2000, Spain accumulates assets in a special fund, the Social Security Reserve Fund, for the purpose of financing future public pension expenditure (Table 5):
− The rule under which assets are being accumulated and spent is clearly defined by law. The surplus of the Social Security system should accumulate into the Reserve Fund (accumulations are approved by the government yearly or twice a year). Withdrawals from the fund can only be made to finance public pensions (and related management spending) only in the case of Social Security deficit.
78 The support ratio is defined as a number of contributors relative to the number of pensioners in public pension schemes.
146
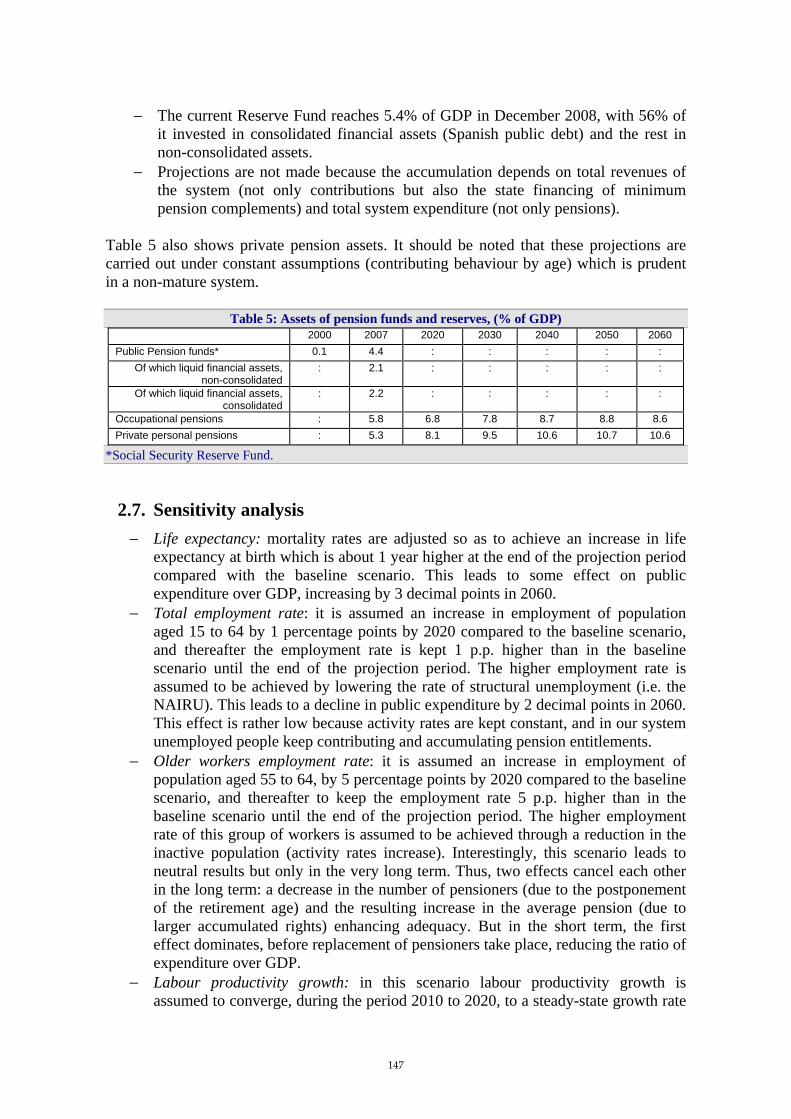
− The current Reserve Fund reaches 5.4% of GDP in December 2008, with 56% of it invested in consolidated financial assets (Spanish public debt) and the rest in non-consolidated assets.
− Projections are not made because the accumulation depends on total revenues of the system (not only contributions but also the state financing of minimum pension complements) and total system expenditure (not only pensions).
Table 5 also shows private pension assets. It should be noted that these projections are carried out under constant assumptions (contributing behaviour by age) which is prudent in a non-mature system.
Table 5: Assets of pension funds and reserves, (% of GDP) 2000 2007 2020 2030 2040 2050 2060
Public Pension funds* 0.1 4.4 : : : : : Of which liquid financial assets,
non-consolidated : 2.1 : : : : :
Of which liquid financial assets, consolidated
: 2.2 : : : : :
Occupational pensions : 5.8 6.8 7.8 8.7 8.8 8.6 Private personal pensions : 5.3 8.1 9.5 10.6 10.7 10.6
*Social Security Reserve Fund.
2.7. Sensitivity analysis − Life expectancy: mortality rates are adjusted so as to achieve an increase in life
expectancy at birth which is about 1 year higher at the end of the projection period compared with the baseline scenario. This leads to some effect on public expenditure over GDP, increasing by 3 decimal points in 2060.
− Total employment rate: it is assumed an increase in employment of population aged 15 to 64 by 1 percentage points by 2020 compared to the baseline scenario, and thereafter the employment rate is kept 1 p.p. higher than in the baseline scenario until the end of the projection period. The higher employment rate is assumed to be achieved by lowering the rate of structural unemployment (i.e. the NAIRU). This leads to a decline in public expenditure by 2 decimal points in 2060. This effect is rather low because activity rates are kept constant, and in our system unemployed people keep contributing and accumulating pension entitlements.
− Older workers employment rate: it is assumed an increase in employment of population aged 55 to 64, by 5 percentage points by 2020 compared to the baseline scenario, and thereafter to keep the employment rate 5 p.p. higher than in the baseline scenario until the end of the projection period. The higher employment rate of this group of workers is assumed to be achieved through a reduction in the inactive population (activity rates increase). Interestingly, this scenario leads to neutral results but only in the very long term. Thus, two effects cancel each other in the long term: a decrease in the number of pensioners (due to the postponement of the retirement age) and the resulting increase in the average pension (due to larger accumulated rights) enhancing adequacy. But in the short term, the first effect dominates, before replacement of pensioners take place, reducing the ratio of expenditure over GDP.
− Labour productivity growth: in this scenario labour productivity growth is assumed to converge, during the period 2010 to 2020, to a steady-state growth rate
147

which is 0.25 percentage points higher than in the baseline scenario. This scenario has far more impact than the others, decreasing the expenditure ratio by 9 decimal points in 2060. The positive effect on the denominator (GDP) more than offsets the resulting higher new pension entitlements.
− Real interest rates: 1 percentage point above that in the baseline scenario, i.e. 4%. This scenario has only an impact on private pensions, increasing spending in private pensions by 2 decimal points in 2060.
− Zero migration: this is an extreme case test that assumes that there are no new flows of migration in the projection. The pension-to-GDP ratio would be much higher than in the baseline, 3 percentage points of GDP higher in 2060. Its main impact comes through the denominator (lower GDP level). The results of this test should be considered with caution as no new migration flows is a very implausible scenario.79
Table 6: Total and public pension expenditures under different scenarios 2007 2020 2030 2040 2050 2060
Total Pension Expenditure* Baseline 9.1 10.4 12.0 14.7 16.9 16.5 Higher life expectancy 9.1 10.4 12.0 14.8 17.1 16.8 Higher lab. Productivity 9.1 10.3 11.6 14.0 16.0 15.5 Higher interest rate 9.1 10.5 12.1 14.9 17.2 16.7 Higher emp. Rate 9.1 10.3 11.8 14.5 16.7 16.3 Higher emp. of older workers 9.1 10.0 11.6 14.5 16.9 16.4 Zero migration 9.1 11.4 13.6 17.4 20.7 19.6
Public Pension Expenditure Baseline 8.4 9.5 10.8 13.2 15.5 15.1 Higher life expectancy 8.4 9.5 10.8 13.3 15.6 15.4 Higher lab. Productivity 8.4 9.4 10.4 12.6 14.6 14.2 Higher interest rate 8.4 9.5 10.8 13.2 15.5 15.1 Higher emp. Rate 8.4 9.4 10.7 13.1 15.3 14.9 Higher emp. of older workers 8.4 9.2 10.5 13.1 15.4 15.1 Zero migration 8.4 10.4 12.3 15.7 19.0 18.1
* Total public and private pensions
2.8. Description of the changes in comparison with the 2001 and 2006 projections
The expenditure-to-GDP ratio variation from the starting point to 2050 has not changed too much compared to past projections. However, there are differences in the time-profile and on the impact of the decomposition factors. Comparing to 2006 projections, new public pension projections reflect mainly the reduction in the dependency ratio and the improvement in macroeconomic assumptions.
• Population projections:
− The projections use the AWG demographic scenarios provided by Eurostat. The baseline demographic scenario for Spain assumes an increase of total population of 16.7 percent in the period 2007-2060, and a working age population (16 to 71)
79 It is important to note that we cannot derive sustainability implications of immigration from this simple test: (i) indirect labour and productivity effects also influence GDP developments; (ii) dynamic effects after 2060 are not taken into account. No new immigrants (now concentrated in young cohorts) generate a fall in pensioners already from 2050 compared to the baseline.
148

decrease of 2.3 percent. The ageing process that started to accentuate in Spain in the mid-eighties would slow down till around 2020 due to the consequences of the civil war (1936-1939) and it would accelerate later on. The acceleration would be more pronounced after 2032, especially between 2044 and 2050, and it would slow down again after 2054.
− Comparing to 2006 projection, the impact of population can be illustrated by the following graph 4. The dependency ratio is around 10 percent lower than last projections, with further deviation in the mid-decades. The peak in the ratio is reached in 2054, whereas in the last projections the peak year was the last one, 2050. Therefore, in the new projections the relative decline in dependency contributes to mitigate the increase in the pension-to-GDP expenditure.
− Comparing to the EU-27 dependency ratio, now there is a longer first period with a ratio lower than the EU average (till 2040). Afterwards, the ratio increases above the average, but far less than in 2004 demographic projections.
− The flow of annual projected net migrants accounts for the bulk of the working-age population improvement. It is to be noted that Eurostat 2004 projections became rapidly obsolete underestimating this demographic component, at least in the observed years. More young immigrants have a positive impact on GDP assumptions but as they become eligible to pensions, in the long term, expenditure would increase (this is observed more in the decade 2050).
− The improvement in dependency ratio is summarised in table 7, now contributing 2 percentage points less than in 2006 projections to the increase in expenditure over GDP. This improvement reduces the benefit ratio with respect to 2006 projections, as a younger population leads to lower total average pensions. The reason behind this is a composition effect of disability, orphans and widowers (for example, the potential number of disabled decreases with age and the average disability pension is higher than the others; the opposite occurs with orphans). Also the decline in the benefit ratio is the result of the interaction between the increased life expectancy and the indexation of pensions to prices (older pensioners that have lower pensions will stay more time in the system).
− Consequently, the peak in the pension expenditure ratio over GDP has been delayed by 7 years (from 2046 to 2053). The ratio in the peak is quite similar (now 0.5 percentage points lower for total public pensions and 0.1 percentage points lower for retirement pensions).
149

Graph 4: Old-age dependency ratio
• GDP projections:
− Labour input and productivity have improved in the current exercise. As graph 5 illustrates, potential GDP growth is higher than in 2006 projections, as well as its components. It is interesting to note that productivity growth is lower than in 2006 projections in the first years, but it is compensated with higher growth in the next decades. Also participation rates increase more in the mid-years of the projection but stabilise and slightly decline along the projection horizon. In the long run higher productivity and labour force increase pension entitlements, leading to small changes in expenditure-to-GDP in the projection horizon or even increases in the last decades. But in the medium term, GDP and participation (female and older workers) increases have mitigating effects on the expenditure-to-GDP ratio.
− Also, the mitigating impact of the coverage ratio is somewhat lower in the new projection because of higher projected labour force (in particular female participation) affecting old-age pensions in the long run.
− The countering effect of employment has also been lower in the current projections.
− There is an important base effect: 2007 real GDP was well underestimated in the last 2006 projections (in part because of migration underestimation). If we correct the starting level in 2007 GDP and afterwards we apply the 2006 macroeconomic scenario growth rates, expenditure over GDP in 2007 would have been 0.6 percentage points less than expected in the last 2006 projections. This deviation accumulates along the projection period (see table 8).
150
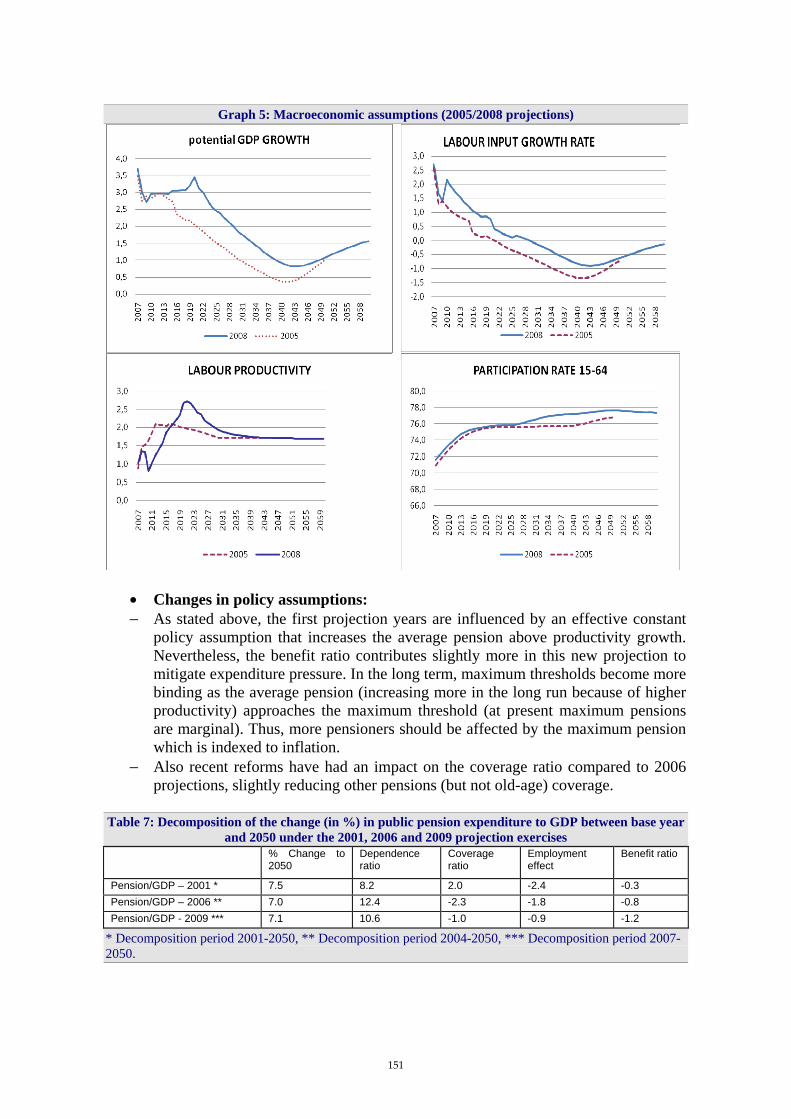
Graph 5: Macroeconomic assumptions (2005/2008 projections)
• Changes in policy assumptions: − As stated above, the first projection years are influenced by an effective constant
policy assumption that increases the average pension above productivity growth. Nevertheless, the benefit ratio contributes slightly more in this new projection to mitigate expenditure pressure. In the long term, maximum thresholds become more binding as the average pension (increasing more in the long run because of higher productivity) approaches the maximum threshold (at present maximum pensions are marginal). Thus, more pensioners should be affected by the maximum pension which is indexed to inflation.
− Also recent reforms have had an impact on the coverage ratio compared to 2006 projections, slightly reducing other pensions (but not old-age) coverage.
Table 7: Decomposition of the change (in %) in public pension expenditure to GDP between base year
and 2050 under the 2001, 2006 and 2009 projection exercises % Change to
2050 Dependence ratio
Coverage ratio
Employment effect
Benefit ratio
Pension/GDP – 2001 * 7.5 8.2 2.0 -2.4 -0.3 Pension/GDP – 2006 ** 7.0 12.4 -2.3 -1.8 -0.8 Pension/GDP - 2009 *** 7.1 10.6 -1.0 -0.9 -1.2
* Decomposition period 2001-2050, ** Decomposition period 2004-2050, *** Decomposition period 2007-2050.
151

Table 8: Decomposition of the difference between 2006 and 2009 public pension projection (%GDP) 2000 2005 2007 2020 2030 2040 2050
Ageing report 2006 9.1 8.7 8.8 9.3 11.8 15.2 15.7
Ageing Report 2006 deviation, if 2007 GDP level corrected
-0.6 -0.7 -0.8 -1.1 -1.1
Changes in assumptions*
-0.2 0.2 0.9 -0.2 -0.9 0.9
Ageing report 2009 9.1 8.5 8.4 9.5 10.8 13.2 15.5
* They include population, GDP, policy assumptions and recent reforms
152

France (Report prepared by Thibault Guyon, Falilou Fall and Franck Arnaud)
1. Overview of the pension system
1.1. Key characteristics of the French pensions system
1.1.1. Description, key features The French pension system is essentially a pay-as-you-go system financed by contributions from both workers end employers. Several regimes coexist: – The regime general (CNAVTS) is the largest regime. It provides basic pensions for all
non-farm private sector employees. The actual number of contributors is roughly 17 million of people. A scheme with similar rules covers farm workers (MSA), about 670 thousands of people.
– In the public sector, employees are covered by various schemes: central government (2,5 million of people contributing), hospitals and local government employees (CNRACL), about 1,8 million of people contributing, and several so-called regimes spéciaux (EDF-GDF, SNCF, RATP, mines …), more than 500 thousands of people contributing.
– Independent workers are affiliated to the RSI (the rules of which are aligned to the regime general) or in some cases (e.g. lawyers) to particular schemes (about 1, 8 million of people contributing)... The MSA covers farmers (600 thousands of people contributing).
Complementary regimes come on top of basic regimes. The main schemes are the ARRCO (all private sector workers) and AGIRC (private sector executives); these schemes are ruled by social partners and participation is mandatory. Demographic trends do not affect all schemes to the same extent. Financial compensation mechanisms neutralize these differences between basic pension schemes. Box A describes rules for calculating basic private sector pensions. Rules governing the public sector and complementary schemes are provided in box B and C respectively. Box A – rules for calculating basic private sector pensions (CNAVTS and aligned regimes) Under the CNAVTS system, an individual may withdraw his pension at age 60 or older. The pension amount P is calculated according to the following formula:
P = t. Min (1, D/T). SAM The three components entering this formula are:
The reference wage SAM (“salaire annuel moyen”), i.e. the average wage over the 25 “best years” (up to a ceiling). Two changes introduced by the 1993 reform have greatly reduced the generosity of the calculation: first, the reference period has been extended from 10 to 25 years; second, past wages are adjusted in line with the rate of prices (rather than wages).
153

The coefficient of proratisation Min (1,D/T), where D is the contribution length, it denotes the number of quarters validated by the insured and T is the reference length. In other words, the pension is reduced in a proportional manner whenever D < T.
The 1993 reform had raised the reference length T from 150 to 160 quarters. With
the 2003 reform it is now scheduled to increase in line with life expectancy gains. The 2008 “rendez-vous” has indeed confirmed the planned increase from 160 quarters (for generation 1948) to 164 quarters (for the 1952 cohort).
The pension rate t. The standard rate is 50%. However, in order to favour senior activity, either a deduction or a premium may be applied under certain conditions:
- A deduction applies when the pension is withdrawn before the age of 65 and when the contribution length is lower than the reference (D < T). The deduction is then calculated as Min [65 - Age, ¼(T-D)] multiplied by the rate of deduction (5% per year for the 1952 cohort). - Conversely a premium applies for contributing periods beyond the reference length when these additional periods are obtained after age 60. Hence the premium is calculated as Min (Age-60, ¼ (D-T)] multiplied by the premium rate (3% the first year, 4% after and 5% after age 65). The 2008 “rendez-vous” plans to raise the premium to 5% for all years.
It is worth noting that the reference length evolves semi-automatically with the life expectancy gains. The rule established by the 2003 reform is that, life expectancy gains will be divided in such way that the ratio (1.79) between the reference length and the average length in retirement is maintained constant. The average length in retirement is defined as the life expectancy at age 60 published five years before by the National statistical agency (Insee). The mechanism is semi-automatic and has been applied for the first time this year. The national institute publishes the life expectancy at age 60, an independent commission, headed by the first magistrat of the Conseil d’Etat (the highest level of the administrative court), assesses whether the ratio reference length over average length in retirement fall under 1.79 and therefore whether and how much the reference length has to increase. In 2007, the commission stated that the reference length has to be increased by one quarter per year from 2009 to 2012 (included). Once the commission has given its opinion, if nothing is done, it is applied. If the government wants to overturn the commission’s avis, it has to take a law. In 2008, the government applied the commission recommendation. Therefore the reference length will increase from 160 quarters in 2008 to 164 quarters in 2012. This has been incorporated in the projections. An additional increase of two quarters is expected before 2020 and has been added in the projection in line with the projected life expectancy gains. Also, the statutory retirement age in both private and public sector is age 60 in general. There are some exceptions in the private sector as well as in the public sector. The most important has been introduced by the 2003 reform. For people who have contributed 168 quarters (reference length is 160) and who validated some quarters at age 14, 15 and 16, the reform opens the possibilities to withdraw their pensions between age 56 and age 60. The number of people eligible for this measure is expected to decrease sharply by 2012 because of the establishment of mandatory leaving school age of 16 applying to the generation born in 1953 and an increase in the reference number of quarters.
154

In the public sector for some special activities, so-called “active service” (police men, nurse), the minimum retirement age is 55 years old. In general there is no gender difference in the eligibility requirements. The contribution rates to the pension scheme are 9.6% of the wage for the employers and 6.75% for the workers in the general scheme. The civil servant contribution rate is 7.85% of their gross wage. Pensions are submitted to the general social contributions (CSG) at a 7.1% rate and to a health contribution rate of 1%. Pensions are also subject to income taxation. However, pensioners who are not qualified for income tax (due to progressive taxation) could benefit from a reduction or an exemption of this taxation. All these elements are part of the current legal framework and are taken into account in the projections.
Box B: Pensions in the public service schemes The basic scheme pension for public-service workers is a fraction of the final wage:
P = 75% × D × S T1
The calculation differs from that under the general scheme in two essential respects:
• The reference wage taken into account is the final wage (excluding bonuses) received for at least 6 months, as opposed to the average of the best 25 years' wages (including bonuses) in the private sector.
• The pension rate is higher (75 %) because the pension scheme for the public service contains mainly one basic pension. The 2003 reform introduced a deduction and a premium, similar to the private sector.
As in the general scheme, the duration T1 taken into account for the purpose of proratisation is of 160 quarters The calculation of the proratisation is mathematically analogous in the two schemes. In the civil and military pension’s code, the annuity value is defined as 1.875 %, giving a pension rate of 75 % for a career spanning 40 years. In the social security code, the full pension rate is 50 % for 40 years, giving an implicit annuity value of 1.25 % per year. The 2003 reform created a complementary scheme for public sector workers, under which bonuses paid in will give entitlement to a pension.
Since the 2003 reform As for the general scheme, the government has confirmed the increase of the target contribution period from 160 quarters in 2008 for cohort born in 1948 to 164 quarters in 2012 for cohort born in 1952 and to 166 quarters for cohorts born in 1960 and after.
155

Box C: Pensions under the mandatory complementary pension schemes: AGIRC (executives) and ARRCO (all workers) The complementary schemes are of the pay-as-you-go type operating through points and with defined contributions, these points representing pension rights. The contributor acquires each year a certain number of points through his own contributions and those of his employer, calculated on the basis of a rate τt, known as the “contractual rate”, applied to a bracket of his gross wage. The purchase price of each point, still known as “reference wage”, depends on the year in question.
Number of points acquired in year t = τt × (Gross wage/Purchase price of a point) The actual contribution rates differ from those that generate entitlement, i.e. the contractual rates. This is because since 1971 the contractual rates have been affected by a percentage (denoted as x), which, if above 100 %, implies surplus contributions not producing rights paid by the contributor in order to help to achieve equilibrium for the complementary scheme. We then have:
τt = Actual contribution rate / x In 2003, the maximum effective contribution rate applied to the first bracket in ARRCO is 7.5 % and the “assessed rate” 125 %, giving a maximum contractual contribution rate of 6 %. At the time of exercise of pension rights, the transformation of the accumulated points into monetary units is a function of the contributor's age and duration of contribution and of the purchase price of a point at the date of calculation. The complementary pension is then calculated in the following manner:
Pension = Total number of points acquired × Value of a point × shortfall coefficient The “full rate” in the complementary pension schemes is granted to those who meet the conditions needed to benefit from the full rate in the general scheme. In the event that the individual exercises his pension rights before reaching the full rate of the CNAVTS, the value of a point is adjusted downward by means of a “shortfall coefficient” (cf. table 1).
Table 1: Shortfall coefficient applicable to the complementary schemes Age Shortfall (quarters) Coefficient
60 20 0.78 61 16 0.83 62 12 0.88 63 8 0.92 64 4 0.96
The contribution basis and the contribution rates vary from one scheme to another and according to the wage brackets involved. Non-executive workers contribute to ARRCO on the basis of that part of the wage below three times the Social Security ceiling, now equal to 33 276 euros per year. Executive employees contribute to both ARRCO (with respect to wages up to the ceiling) and to AGIRC (for wages between 1 and 8 times the ceiling).
156
1.1.2. Recent reforms included in the projections and adherence to the common agreement
Up to this year the French pension schemes had two main reforms: the 1993 reform in the private sector and the 2003 reform in both the private and public sectors80. These two reforms have a gradual impact, and this impact is included in the projections, with effects inter alia on the commonly agreed participation rates, the average pension, and financial sustainability. The projections are built on a “constant policy” principle and based on the legislation and rules as of July 2008. Reforms prior to this date do affect parameters in the future; for instance, reference wages and pensions are indexed on prices (as a consequence of the 1993 reform) and, as a consequence of the 2003 reform, the reference period is expected to grow from 160 quarters (generation 1948) to 164 quarters (generation 1952) and then 166 quarters (generation 1960 and beyond). However the projections do not take into account ongoing reforms, particularly measures resulting from the “rendez-vous de 2008”. These measures have been adopted since July 2008 or are likely to be adopted in the near future (see box D). Box D - Ongoing reforms not included in the projections – the “rendez-vous de 2008” As settled in the 2003 reform, a “rendez-vous” every four year is scheduled to assess the financial situation of the pension schemes. The 2008 rendez-vous is the first one and an intensive round of discussion between social partners and the government has taken place to prepare additional measures intended to guarantee the financial sustainability of the pension system. Most measures have been inserted in the 2009 social security budget draft law which is to be voted by Parliament by end-2008. In the 2008 rendez-vous a strong emphasis has been put on increasing employment of elderly workers. Key measures include increasing the attractiveness of working at senior ages: thus, the premium for extra years worked after reaching the full rate of pension will be raised to 5% (see above). Moreover, the possibilities of drawing concurrently a pension and a salary will be fully freed for people entitled with a full rate of pension. Meanwhile employers are encouraged to adopt quantitative targets for senior workers and will not be able to use retirement as a substitute for layoff any longer. Additionally the options to buy past periods not contributed to the pension scheme and use them to meet the conditions for retirement before 60 will be strictly restricted, and the minimum age for the remaining early retirement schemes will be increased. Other measures to be implemented include commitments to increase the lowest pension’s levels, notably by raising the basic minimum pension as well as the pension rate of low-income survivors. However, the required contribution period needed to obtain the contributive minimum pension will be increased.
2. Pension expenditure projections
80 The so-called regimes spéciaux have been reformed in late 2007 in order to align the required contribution period with the rules of other regimes. While this reform was key from the point of view of equity and harmonization of rules, its financial significance is modest given the limited size of these regimes.
157

2.1. Extent of the coverage of the pensions schemes in the projections
The French pension schemes projections cover all pensions from social security system, i.e. all public pensions. Both basic and mandatory complementary schemes have been taken into account. Occupational pensions (with contractual agreements between employers and employees), which have a very low weight in the French pension system, are not covered by the projection. Private mandatory pensions do not exist in France. The projections cover old-age and early pensions as well as widows’ and widower’s pensions. It covers also the minimum old-age allowance so-called “minimum vieillesse”, paid by the General Scheme to people aged 65 and over whose revenues are less than a threshold (7 537 euros for one person in 2008) indexed with inflation rate. The amount of the minimum vieillesse is 2.7 billion euros in 2007 (that is around 1% of the total amount of pension expenditures). The disability pension is a replacement revenue for people aged 60 and less unable to work completely or partially, temporarily or in a permanent base. The entitlement to a disability pension is decided by doctors mandated by the Social Security. At age 60, these people are eligible to a full pension rate. So before age 60, they are covered and projected with health expenditures. The projections covers pensions served at age 60 to disable people. The model used cannot separate between various kinds of social security pensions. Survivors’ and partial pensions paid to people below the standard retirement age are just a little part of social security pensions, so we assume that all social security pensions are old-age or early pensions. The following table lists the main pension schemes along with the amount of pensions distributed in 2007. There are numerous pensions schemes, which explains the weight of the ‘Others’ item.
Table 2: Expenses of the main pension schemes Scheme Billion € 2007 % of GDP CNAVTS 83,6 4,4 Central state 40,2 2,1 ARRCO+AGIRC 57 3,0 CNRACL 11,1 0,6 MSA 8,7 0,5 Others 50,4 2,7
Total 251 13,3 Source: Report of the Commission des Comptes de la Sécurité Sociale, September 2008 The projections rest on two inputs. First are the AWG assumptions on demographic and macroeconomic trends. Second is a global model of the French pension system run by the Secretariat of the Conseil d’Orientation des Retraites (COR). This model was used, along with projections provided by the various pension schemes, for the projections produced by the COR in 2007. More details on the projections process and methods are in part III.
2.2. Overview of projection results
As explained, we provide only a global projection of pension expenditures under the item social security pensions. Under this item, we gather all mandatory pension schemes for public and private workers or independent professions.
158
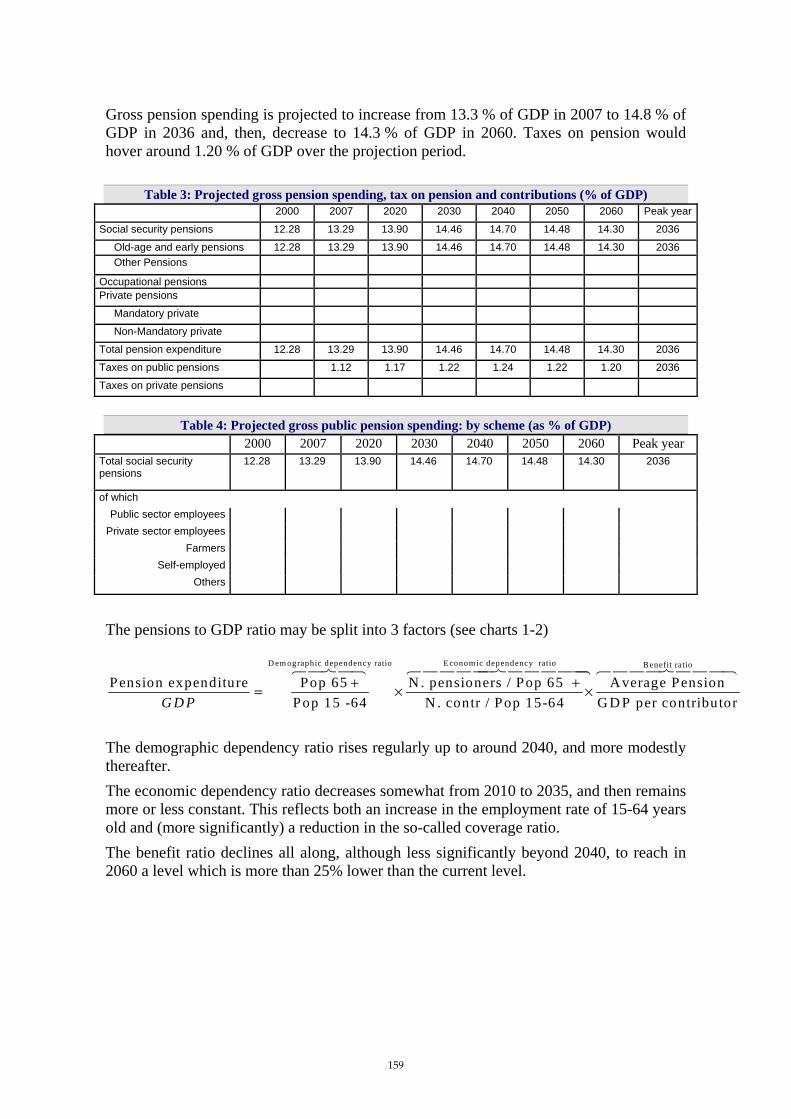
Gross pension spending is projected to increase from 13.3 % of GDP in 2007 to 14.8 % of GDP in 2036 and, then, decrease to 14.3 % of GDP in 2060. Taxes on pension would hover around 1.20 % of GDP over the projection period.
Table 3: Projected gross pension spending, tax on pension and contributions (% of GDP) 2000 2007 2020 2030 2040 2050 2060 Peak year
Social security pensions 12.28 13.29 13.90 14.46 14.70 14.48 14.30 2036
Old-age and early pensions 12.28 13.29 13.90 14.46 14.70 14.48 14.30 2036 Other Pensions
Occupational pensions Private pensions
Mandatory private
Non-Mandatory private
Total pension expenditure 12.28 13.29 13.90 14.46 14.70 14.48 14.30 2036
Taxes on public pensions 1.12 1.17 1.22 1.24 1.22 1.20 2036
Taxes on private pensions
Table 4: Projected gross public pension spending: by scheme (as % of GDP)
2000 2007 2020 2030 2040 2050 2060 Peak year Total social security pensions
12.28 13.29 13.90 14.46 14.70 14.48 14.30 2036
of which Public sector employees
Private sector employees Farmers
Self-employed Others
The pensions to GDP ratio may be split into 3 factors (see charts 1-2)
D em ographic dependency ratio Econom ic dependency ratio Benefit
Pension expenditure Pop 65 N . pensioners / Pop 65 A verage PensionPop 15 -64 N . contr / Pop 15-64 G D P per contributorG D P
+ += × ×
64748 6444447444448 ratio644474448
The demographic dependency ratio rises regularly up to around 2040, and more modestly thereafter. The economic dependency ratio decreases somewhat from 2010 to 2035, and then remains more or less constant. This reflects both an increase in the employment rate of 15-64 years old and (more significantly) a reduction in the so-called coverage ratio. The benefit ratio declines all along, although less significantly beyond 2040, to reach in 2060 a level which is more than 25% lower than the current level.
159

Graph 1: Movements in the pensions to GDP ratio
13,25
13,50
13,75
14,00
14,25
14,50
14,75
2007 2011 2015 2019 2023 2027 2031 2035 2039 2043 2047 2051 2055 2059
Phase 1
Phase 2
Phase 3
Phase 4
Four periods may be identified: – Up to 2010: pensions are expected to grow steadily (+0.4 percentage point of GDP
between 2007 and 2010). – For most of the 2010s, pensions would only moderately increase relative to GDP.
Demographic forces would be about compensated by a decrease in the benefit ratio and an increase in the economic dependency ratio.
– From the late 2010s to the mid-2030s, pensions increase by 0.05 point of GDP per year on average. The peak is reached in 2036 at 14.8 % of GDP (an increase by 1½ % of GDP from 2007). Over this sub-period the hike in the dependency ratio weighs heavier than the projected decline in the benefit ratio and improvement in the economic ratio.
– Pensions are projected to decline over 2037-2060 relative to GDP (by 0.02 point per year on average), to reach 14.3 % of GDP in 2060.
160

Graph 2: Demographic and financial projections of the pension schemes
60
80
100
120
140
160
180
200
2007 2011 2015 2019 2023 2027 2031 2035 2039 2043 2047 2051 2055 2059
Benefit ratio 1/employment rate Dependency ratio Coverage ratio Expenditure / GDP
Dependency ratio(Pop 65+ / Pop 15-64)
Expenditure / GDP
Basis 100 in 2007
Coverage ratio(Pensioners / Pop 65+)
1/employment rate(Pop 15-64 / Number of contributors)
Benefit ratio(Average pension / GDP per capita)
2.3. Further description of main driving forces between 2007-2060 Between 2007 and 2060, public pensions will grow by 1.0 point of GDP (from 13.3 % in 2007 to 14.3 % in 2060). Two broad opposite changes are underneath: – Demographics: the dependency ratio increases by 80%, from 0.25 to 0.45. Ceteris
paribus, this contributes to an 8.3 percentage point increase in the public pensions to GDP ratio.
– A decrease in the benefit ratio (-27 %), contributing to about -4½ percentage points. The reduction of the benefit ratio expresses the difference between the evolution of the average pension and that of the average wage per worker. The average pension evolves mostly in line with the inflation rate because pensions are indexed on prices and the calculation of the first pension is based on the average annual wage which is calculated by updating past wages with inflation rates. This has been set up by the 1993 reform. While the average wage per worker evolves roughly with labour productivity or GDP per worker. Thus, the decrease of the benefit ratio, in the French case, comes from the increase of the wage growth rate mainly. That is, since the past reform (1993 and 2003), no decrease in the replacement rate or the pension level is expected. In addition, the economic dependency ratio contributes close to -3 percentage points to the change in the pensions to GDP ratio (with the coverage ratio bringing the highest contribution).
161
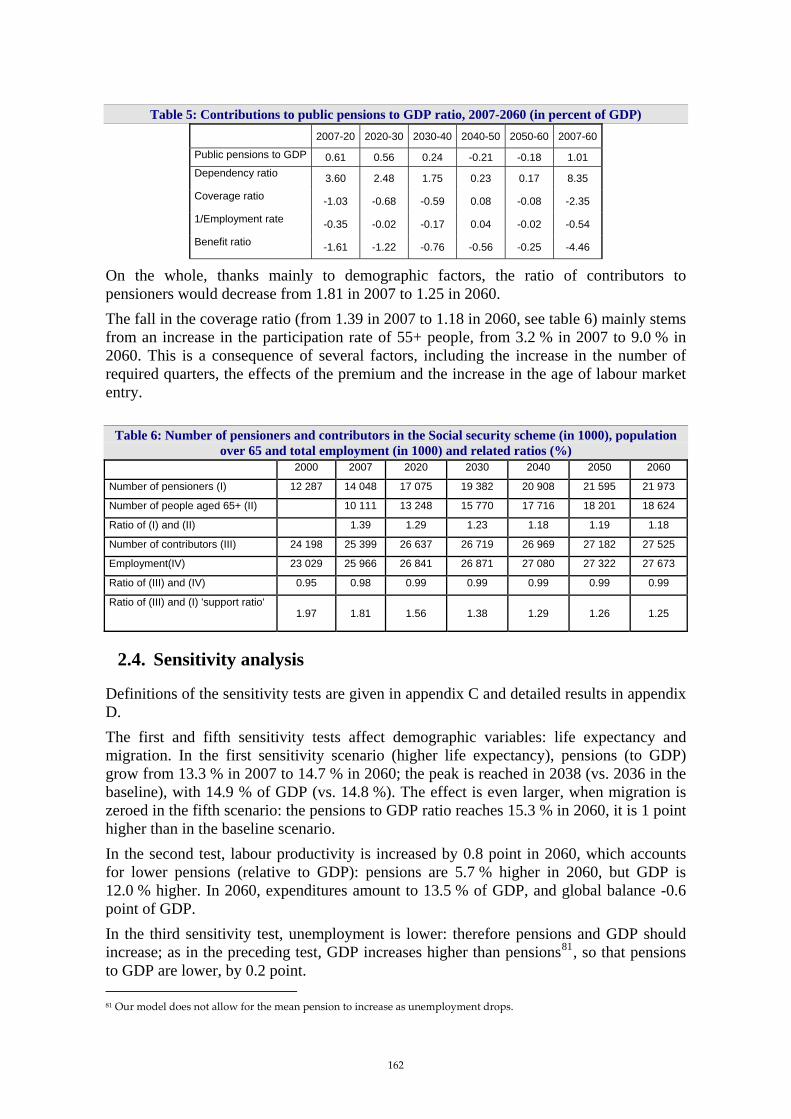
Table 5: Contributions to public pensions to GDP ratio, 2007-2060 (in percent of GDP) 2007-20 2020-30 2030-40 2040-50 2050-60 2007-60
Public pensions to GDP 0.61 0.56 0.24 -0.21 -0.18 1.01 Dependency ratio 3.60 2.48 1.75 0.23 0.17 8.35 Coverage ratio -1.03 -0.68 -0.59 0.08 -0.08 -2.35 1/Employment rate -0.35 -0.02 -0.17 0.04 -0.02 -0.54 Benefit ratio -1.61 -1.22 -0.76 -0.56 -0.25 -4.46
On the whole, thanks mainly to demographic factors, the ratio of contributors to pensioners would decrease from 1.81 in 2007 to 1.25 in 2060. The fall in the coverage ratio (from 1.39 in 2007 to 1.18 in 2060, see table 6) mainly stems from an increase in the participation rate of 55+ people, from 3.2 % in 2007 to 9.0 % in 2060. This is a consequence of several factors, including the increase in the number of required quarters, the effects of the premium and the increase in the age of labour market entry.
Table 6: Number of pensioners and contributors in the Social security scheme (in 1000), population over 65 and total employment (in 1000) and related ratios (%)
2000 2007 2020 2030 2040 2050 2060
Number of pensioners (I) 12 287 14 048 17 075 19 382 20 908 21 595 21 973
Number of people aged 65+ (II) 10 111 13 248 15 770 17 716 18 201 18 624
Ratio of (I) and (II) 1.39 1.29 1.23 1.18 1.19 1.18
Number of contributors (III) 24 198 25 399 26 637 26 719 26 969 27 182 27 525
Employment(IV) 23 029 25 966 26 841 26 871 27 080 27 322 27 673
Ratio of (III) and (IV) 0.95 0.98 0.99 0.99 0.99 0.99 0.99
Ratio of (III) and (I) 'support ratio' 1.97 1.81 1.56 1.38 1.29 1.26 1.25
2.4. Sensitivity analysis
Definitions of the sensitivity tests are given in appendix C and detailed results in appendix D. The first and fifth sensitivity tests affect demographic variables: life expectancy and migration. In the first sensitivity scenario (higher life expectancy), pensions (to GDP) grow from 13.3 % in 2007 to 14.7 % in 2060; the peak is reached in 2038 (vs. 2036 in the baseline), with 14.9 % of GDP (vs. 14.8 %). The effect is even larger, when migration is zeroed in the fifth scenario: the pensions to GDP ratio reaches 15.3 % in 2060, it is 1 point higher than in the baseline scenario. In the second test, labour productivity is increased by 0.8 point in 2060, which accounts for lower pensions (relative to GDP): pensions are 5.7 % higher in 2060, but GDP is 12.0 % higher. In 2060, expenditures amount to 13.5 % of GDP, and global balance -0.6 point of GDP. In the third sensitivity test, unemployment is lower: therefore pensions and GDP should increase; as in the preceding test, GDP increases higher than pensions81, so that pensions to GDP are lower, by 0.2 point. 81 Our model does not allow for the mean pension to increase as unemployment drops.
162
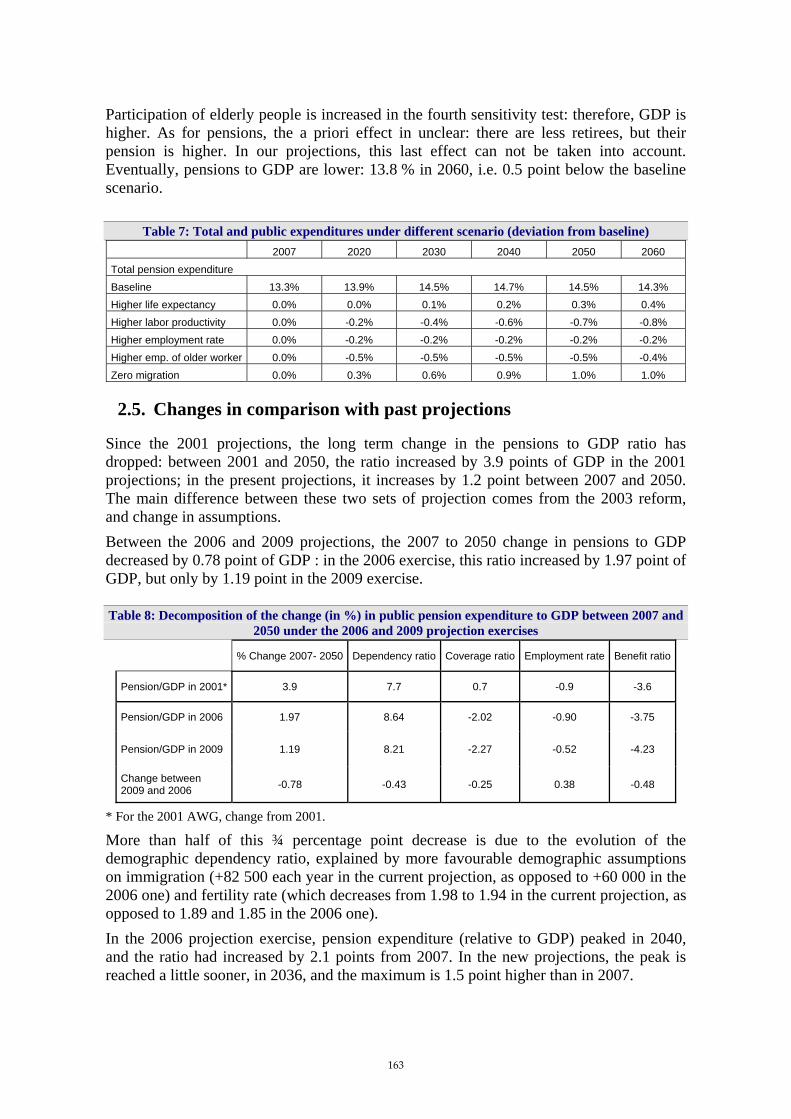
Participation of elderly people is increased in the fourth sensitivity test: therefore, GDP is higher. As for pensions, the a priori effect in unclear: there are less retirees, but their pension is higher. In our projections, this last effect can not be taken into account. Eventually, pensions to GDP are lower: 13.8 % in 2060, i.e. 0.5 point below the baseline scenario.
Table 7: Total and public expenditures under different scenario (deviation from baseline) 2007 2020 2030 2040 2050 2060 Total pension expenditure Baseline 13.3% 13.9% 14.5% 14.7% 14.5% 14.3% Higher life expectancy 0.0% 0.0% 0.1% 0.2% 0.3% 0.4% Higher labor productivity 0.0% -0.2% -0.4% -0.6% -0.7% -0.8% Higher employment rate 0.0% -0.2% -0.2% -0.2% -0.2% -0.2% Higher emp. of older worker 0.0% -0.5% -0.5% -0.5% -0.5% -0.4% Zero migration 0.0% 0.3% 0.6% 0.9% 1.0% 1.0%
2.5. Changes in comparison with past projections
Since the 2001 projections, the long term change in the pensions to GDP ratio has dropped: between 2001 and 2050, the ratio increased by 3.9 points of GDP in the 2001 projections; in the present projections, it increases by 1.2 point between 2007 and 2050. The main difference between these two sets of projection comes from the 2003 reform, and change in assumptions. Between the 2006 and 2009 projections, the 2007 to 2050 change in pensions to GDP decreased by 0.78 point of GDP : in the 2006 exercise, this ratio increased by 1.97 point of GDP, but only by 1.19 point in the 2009 exercise. Table 8: Decomposition of the change (in %) in public pension expenditure to GDP between 2007 and
2050 under the 2006 and 2009 projection exercises
% Change 2007- 2050 Dependency ratio Coverage ratio Employment rate Benefit ratio
Pension/GDP in 2001* 3.9 7.7 0.7 -0.9 -3.6
Pension/GDP in 2006 1.97 8.64 -2.02 -0.90 -3.75
Pension/GDP in 2009 1.19 8.21 -2.27 -0.52 -4.23
Change between 2009 and 2006 -0.78 -0.43 -0.25 0.38 -0.48
* For the 2001 AWG, change from 2001.
More than half of this ¾ percentage point decrease is due to the evolution of the demographic dependency ratio, explained by more favourable demographic assumptions on immigration (+82 500 each year in the current projection, as opposed to +60 000 in the 2006 one) and fertility rate (which decreases from 1.98 to 1.94 in the current projection, as opposed to 1.89 and 1.85 in the 2006 one). In the 2006 projection exercise, pension expenditure (relative to GDP) peaked in 2040, and the ratio had increased by 2.1 points from 2007. In the new projections, the peak is reached a little sooner, in 2036, and the maximum is 1.5 point higher than in 2007.
163
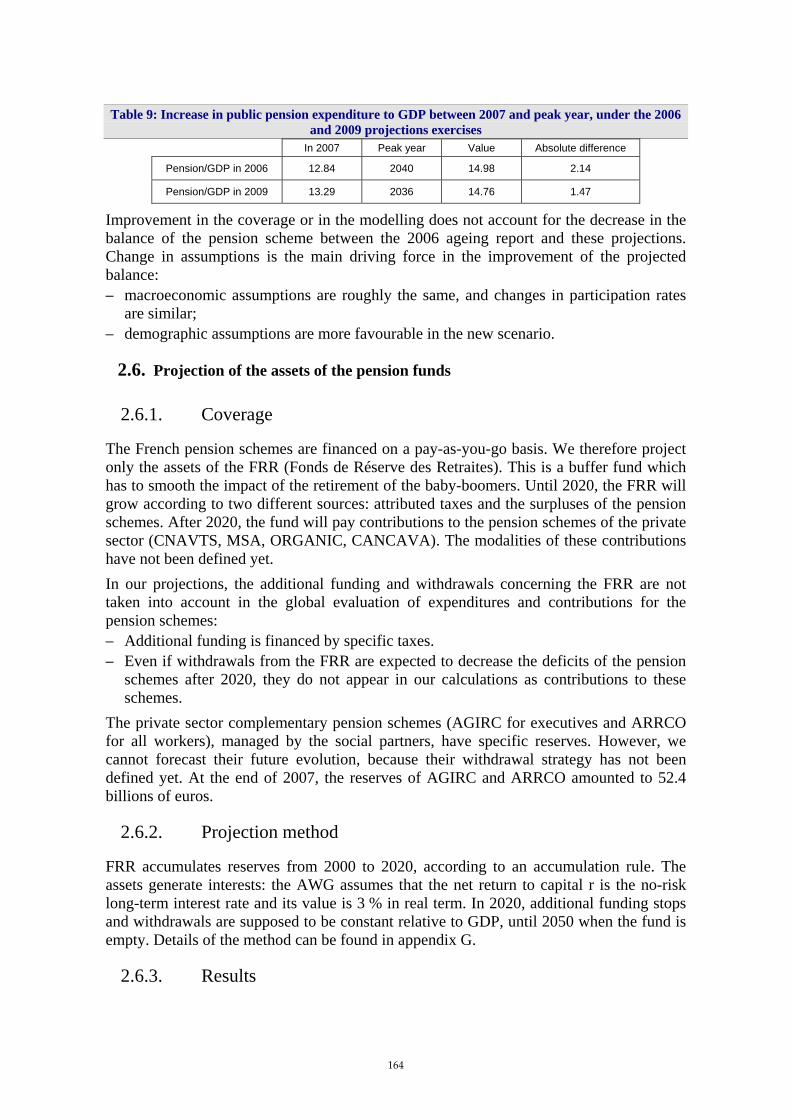
Table 9: Increase in public pension expenditure to GDP between 2007 and peak year, under the 2006 and 2009 projections exercises
In 2007 Peak year Value Absolute difference
Pension/GDP in 2006 12.84 2040 14.98 2.14
Pension/GDP in 2009 13.29 2036 14.76 1.47
Improvement in the coverage or in the modelling does not account for the decrease in the balance of the pension scheme between the 2006 ageing report and these projections. Change in assumptions is the main driving force in the improvement of the projected balance: – macroeconomic assumptions are roughly the same, and changes in participation rates
are similar; – demographic assumptions are more favourable in the new scenario.
2.6. Projection of the assets of the pension funds
2.6.1. Coverage
The French pension schemes are financed on a pay-as-you-go basis. We therefore project only the assets of the FRR (Fonds de Réserve des Retraites). This is a buffer fund which has to smooth the impact of the retirement of the baby-boomers. Until 2020, the FRR will grow according to two different sources: attributed taxes and the surpluses of the pension schemes. After 2020, the fund will pay contributions to the pension schemes of the private sector (CNAVTS, MSA, ORGANIC, CANCAVA). The modalities of these contributions have not been defined yet. In our projections, the additional funding and withdrawals concerning the FRR are not taken into account in the global evaluation of expenditures and contributions for the pension schemes: – Additional funding is financed by specific taxes. – Even if withdrawals from the FRR are expected to decrease the deficits of the pension
schemes after 2020, they do not appear in our calculations as contributions to these schemes.
The private sector complementary pension schemes (AGIRC for executives and ARRCO for all workers), managed by the social partners, have specific reserves. However, we cannot forecast their future evolution, because their withdrawal strategy has not been defined yet. At the end of 2007, the reserves of AGIRC and ARRCO amounted to 52.4 billions of euros.
2.6.2. Projection method
FRR accumulates reserves from 2000 to 2020, according to an accumulation rule. The assets generate interests: the AWG assumes that the net return to capital r is the no-risk long-term interest rate and its value is 3 % in real term. In 2020, additional funding stops and withdrawals are supposed to be constant relative to GDP, until 2050 when the fund is empty. Details of the method can be found in appendix G.
2.6.3. Results
164

In the baseline scenario, the amount of FRR assets at the end of the year 2020 is 95.7 Bn€ 2007. After 2020, FRR withdrawals would be 0.16 point of GDP per year.
Table 10: Assets of pension funds and reserves, % of GDP 2007 2020 2030 2040 2050 2060
Public Pension funds (FRR) 1.8% 4.0% 2.8% 1.5% 0.0% 0.0%
Of which liquid financial assets, non consolidated
Of which liquid financial assets, consolidated
Compulsory complementary schemes* 5.2% : : : : :
Of which liquid financial assets, non consolidated 0.3% : : : : :
Of which liquid financial assets, consolidated 4.8% : : : : :
Occupational pensions
Private pensions
All pensions 7.0% 4.0% 2.8% 1.5% 0.0% 0.0%
• Reserves of the two compulsory complementary schemes, AGIRC and ARRCO.
Table 11: Projection of the assets of the pension funds 2007 2015 2020 2030 2040 2050 2060
FRR assets at the end of the year in amount terms (€2007) 34.40 64.29 95.72 80.51 50.91 0.00 0.00 as a share of GDP 1.78 2.91 3.93 2.78 1.47 0.00 0.00
Additional funding (+) and then withdrawals (-) in amount terms (€2007) 1.8 3.64 3.92 -4.55 -5.43 -6.48 0.00 as a share of GDP 0.09 0.16 0.16 -0.16 -0.16 -0.16 0.00
In the sensitivity tests linked with demographic or economic assumptions, the FRR assets are close to the amounts in the baseline scenario82. Theoretically, the NAIRU would have an important impact; but it has just a very weak impact with our simplified calculation of the additional funding83. On the contrary, the hypothesis of return to capital has a strong impact on the assets of the FRR. With a return rate of 4 % (respectively 2 %) instead of 3 %, the FRR assets are 104.8 Bn€ 2007 (respectively 87.5 Bn€ 2007) at the end of the year 2020, and yearly withdrawals represents 0.20 point (respectively 0.12) of GDP.
82 Cf. appendix C for the definitions of various sensitivity tests. 83 See appendix D for results.
165

Italy (Report prepared by Rocco Aprile)
1. Overview of the pension system
1.1. The legal and institutional framework of the Italian pension system - an overview
The Italian pension system is almost entirely composed of a compulsory, public, pay-as-you-go system. It is fragmented into quite a number of different schemes, although the five largest ones cover more than 9/10th of the total pension expenditure. Most of the other schemes involve very few workers or pensioners. In terms of contributors to the public pension system, about 80% are administered by INPS (Social Security Institute for the private sector), nearly 15% are administered by INPDAP (Social Security Institute for the public sector), while the remaining part (mainly freelance workers and professionals) is administered by quite a number of small institutions. In 2007, the public pension expenditure accounted for 14% of GDP, gross of the tax revenue on it. Discarding the component of social pensions, public pension expenditure was attributed to direct pensions (old age, early and disability pensions) for 83% and to survivors’ pensions for the remaining 17%. Moving on to the decomposition by sectors, 61% of pension expenditure was assigned to private sector employees, 24% to public sector employees and 15% to the self-employed, which mainly includes artisans, shopkeepers and farmers. The legal-institutional framework of the Italian pension system has been heavily reformed since 1992. The measures that have contributed most to improving financial sustainability in the mid-long term may be summarized as follows: – the elimination of pension indexation to real wages (law 503/1992), which was
foreseen in addition to that on prices; – the introduction of the contribution-based method, which significantly reduces the size
of early retirement pensions, especially for the self-employed (law 335/1995); – the tightening of the minimum eligibility requirements for both old age and early
pensions (law 503/1992, law 335/1995, law 449/1997 and law 243/2004, as recently modified by law 247/2007).
Since 2006, further changes to pension legislation have been adopted with the aim of consolidating the reform process. The major interventions stem from the implementation of the 23rd July Agreement on welfare between government and social partners, which envisaged: i) an increase of low amount pensions (law 127/2007); ii) the slowdown of the process of elevating minimum requirements for early pensions, without altering the phased-in targets previously foreseen (law 127/2007) iii) the adoption of the updated transformation coefficients and the reinforcement of the procedure for subsequent revisions. More recently, law 133/2008 has strengthened the possibility of accumulating pension and labour income. As of today, the funded part of the pension system is not well developed. The reforms approved in 1993 (legislative decree 507/1993) and 1995 (law 335/1995) introduced legislation to regulate supplementary, funded schemes with the aim of building a multi-
166

pillar pension system. Subsequently, additional measures were adopted in order to augment the number of insured workers. In this regard, law 243/2004, the legislative decree 252/2005 and law 296/2006 provided important novelties in terms of fiscal incentives and the transfer to private funds of employees severance pay (‘trattamento di fine rapporto’).
1.2. The public pension system
1.2.1. Calculation rules
As a result of the 1995 pension reform (law 335/95), the Italian pension system is moving gradually from an earnings-related regime to a contribution-based one, which is fully applied to all labour market entrants after 31st December 1995. The main feature of the new regime concerns the calculation rules, which are based on a defined contribution formula instead of a defined benefit one, as in the previous regime (Table 1). Earnings-related regime. Under the earnings-related regime, the amount of pension is calculated as a percentage of the reference wage. Such a percentage is obtained multiplying 2%84 by the number of contribution years, up to a maximum of 80%. The reference wage is an average of the last wages, indexed to prices up to the year before that of retirement. The number of wages involved in the calculation varies depending on the scheme and the years to which contributions refer. Contribution-based regime. Unlike the preceding method, under the contribution-based regime the amount of pension is calculated as a product of two factors: the total lifelong contributions, capitalised with the nominal GDP growth rate (five-year geometric average) and the transformation coefficient, the calculation of which is mainly based on the probability of death, the probability of leaving a widow or widower, and the average number of years for which a survivor’s benefit will be drawn (Annex 2)85. As a consequence, pension amount is proportional to the contribution rate and inversely related to retirement age - the lower the age, the lower the pension and vice versa. The transformation coefficients are available for the age bracket 57-65. For retirement ages falling below (i.e. disability pensions) or above the range, the lowest and the highest transformation coefficients are respectively applied. In any case, workers may not retire earlier than 65 unless they have reached the eligibility requirements stated in current legislation and an amount of pension not less than 1.2 times the old age allowance. Until 2010, the transformation coefficients to be applied are those laid down by law 335/95, which range from 4.72%, at the age of 57, to 6.14%, at the age of 65. In 2010 the new coefficients, revised on the basis of the procedure foreseen by law 335/95, will be applied, which range from 4.42% to 5.62% (law 247/2007)86. According to current legislation, it is foreseen that transformation coefficients will be revised every 3 years on the basis of a procedure falling entirely under the administrative sphere of competence (Box 1.1). 84 Such a percentage may vary for special schemes and be declining above a given amount of reference wage. 85 For a description of the formula and parameters utilised for the updating of the transformation coefficients, see Ministero dell’Economia e delle Finanze-RGS (2007), box 5.3, p. 135. 86 This is the first ever revision of transformation coefficients since they were first calculated in 1995. In fact, according to previous legislation (law 335/95), it was foreseen that such a revision would be made every 10 years. Therefore, the percentage of transformation coefficients reduction (6-8% depending on age) reflects changes in life expectancy covering a quite long period of time.
167

Transitional phase. The new regime will be fully phased in after 2030-2035. Meanwhile, there will be a transitional phase which only affects workers already employed at the end of 1995. In particular, two different calculation methods will be used, depending on the years of contribution matured at the end of 1995: – workers with at least 18 years of contribution will maintain the earnings-related method
but, for the contribution years after 1992, the number of annual wages involved in the calculation of pension will increase gradually until it covers the last 10 years for employees and the last 15 years for the self-employed87;
– workers with less than 18 years of contribution will be subject to the so-called pro-rata, mixed regime, according to which the pension is obtained as a sum of two components: the former, related to contributions accrued up 1995, is calculated according to the earnings-related method88; the latter is calculated according to the contribution-based one.
Survivors’ pensions. In all regimes, survivors’ pensions are 60% of the amount of the deceased's pension or, in cases where the deceased person is a contributor, the amount of pension calculated as described above89. Such a percentage is reduced by 25%, 40% or 50% if the survivor’s total income exceeds, respectively, 3, 4 or 5 times the minimum pension (paragraph 1.2.4).
1.2.2. Eligibility requirements
Old age pensions. Under the earnings-related and mixed regimes, the age requirement to be entitled to an old age pension is 65 for men and 60 for women, together with a minimum contribution period of 20 years90. Under the contribution-based regime all pensions are referred to as ‘old age’ ones. However, the same requirements must be fulfilled as those required for early pensions under the earnings-related and mixed regimes in order to retire before 65 for men and 60 for women. At an age between 60 and 65, women may retire with 5 years of contributions, as long as the prerequisite of an amount of pension of at least 1.2 times the old age allowance is fulfilled. Above 65 the latter prerequisite is non longer required91. Early retirement pensions. Beginning in 2008, for all regimes (earnings-related, mixed and contribution-based), the possibility of receiving a pension at an age lower than 65 for males and 60 for females is allowed to all workers with at least: – 40 years of contributions, regardless of age or, alternatively, – 35 years of contributions together with an age requirement increasing through time.
The latter is 58 (59 for the self-employed) from 1st January 2008 to 30th June 2009, 60 (61 for the self-employed) from 1st July 2009 to the end of 2010. Subsequently, the age requirement rises by one year in 2011 and 2013, thus reaching 62 and 63 for the
87 Before the 1992 reform, the reference wage was calculated on the last 10 years for the self employed, the last 5 years for private sector employees and the last monthly salary for public sector employees. 88 For the contribution accrued in the three-year period 1993-1995, the reference wage tends gradually to cover the entire career. 89 Survivors’ pensions may be also an entitlement of children up to 18 (or 26, in the case they are students) when there is no surviving spouse. 90 Before 1992, the minimum retirement age was, respectively, 60 and 55 for private sector employees, and the minimum contribution period was 15 years. 91 Before 2008, retirement age for an old age pension ranged from 57 to 65, but workers could not retire earlier than 65 unless they had reached an amount of pension of at least 1.2 times the old age allowance. The possibility of retirement before 57 was subject to a contribution requirement of at least 40 years.
168

employed and the self-employed, respectively. In addition, starting from July 2009, workers are allowed to access early retirement at an age lower by 1 year than the age requirements mentioned above, provided that they possess at least 36 years of contributions instead of 3592.
A further postponement of pension payments is envisaged, with respect to the moment in which the requirements are met, by way of the so-called ‘exit windows’ (‘finestre di uscita’). Such postponement is foreseen for all regimes and, starting from 2008, will average about 9 months for employees and 15 months for the self-employed93. For the period 2008-2015, women under earnings-related and mixed regimes who have satisfied the requirements laid down by legislation before law 243/2004 are allowed to retire before 60 as long as they choose the less favourable pension treatment provided by the contribution-based method. For specific categories of workers involved in particularly hard and stressful jobs ('lavori usuranti'), the possibility to retire with a minimum age requirement lower than the normal one is also envisaged, albeit within very stringent limits (Box 1.1) Disability pension. In all regimes, 5 years of contribution, 3 of which accrued in the last five years before retirement, are required in order to be entitled to a disability pension94. Survivor’s pension. In all regimes, 15 years of contribution, or alternatively 5 years of contribution, 3 of which accrued in the last five years, are required for a contributor’s survivor to be entitled to a survivor’s pension.
1.2.3. Old age allowance and social assistance additional lump sums
According to the 1995 reform, the old age allowance (‘assegno sociale’) is a social assistance benefit elderly people in poverty aged 65 and over are entitled to. It is therefore means-tested, and awarded to elderly people regardless of any contribution records. The amount of the old age allowance in 2008 is 5,143 euro per year. However, additional social assistance lump sums (‘maggiorazioni sociali’) are acknowledged as a supplement to the old age allowance up to given income thresholds, depending on age and marital status. More specifically, the entitlement to an old age allowance and additional lump sums is subject to the following income requirements: – a personal income below 5,311 euro, in the age bracket 65-69, and below 7,540 euro in
the age bracket 70 and over. Old age allowance and additional lump sums are acknowledged up to these income limits;
92 Before 2008, the following eligibility requirements were necessary under the earnings-related and mixed regimes: for the employed (private and public sectors), either 35 years of contribution at the age of 57 or 38 years of contribution regardless of age, for the period 2004-2005, increasing by 1 year for the period 2006-2007. For the period 2004-2005, the age requirement was reduced by 1 year for blue-collar workers. Before 1992, there was only a contribution requirement of 35 years, for private sector employees, and of 20 years for public sector employees, that could be reduced to 15 for married women with children; for the self-employed, either 40 years of contribution regardless of age, or 35 years of contribution at the age of 58, starting from 2001. Before 1992, there was only a contribution requirement of 35 years. 93 Such a postponement is somehow lower, until 2011, for those accessing retirement with 40 years of contributions. 94 After the 1984-reform (law 222/84), disability pension entitlements only depend on the mental and physical impairments without considering the labour market conditions. In this regard, two typologies of disability pensions were introduced: the ‘assegno ordinario di invalidità’ and the ‘pensione di inabilità’, which are provided to people whose reduction of ability to work is at least 2/3rds and 100%, respectively.
169

– in the case of a married person, the amount of social assistance benefits, determined as above, is provided as long as the total income of the couple falls below 11,071 euro, in the age bracket 65-69, and 12,683 euro, in the age bracket 70 and over. In any case, benefits are acknowledged up to these income limits.
Under the earnings-related and mixed regimes alone, besides the old age allowance, pensioners may be entitled to a minimum pension (5,761 euro in 2008) whenever the calculation of pension comes to an amount lower than the minimum. The additional sum necessary to supplement pension for the difference is means-tested. Minimum pension is only acknowledged for workers who access retirement having fulfilled the minimum requirements (age and contributions) to be entitled to a pension.
1.2.4. Indexation
Both in the transition and fully phased-in period, pensions are indexed to prices, unlike the scheme applied before 1992, which also provided partial indexation to real wages for the private sector pensioners95 . According to current legislation, the percentage of indexation to prices is differentiated by pension amount brackets. Such a percentage is: 100% of the inflation rate for the amount of pension up to three times the minimum pension, 90% for the amount between three and five times the minimum and 75% for the part above five times the minimum. As regards the intermediate pension amount bracket, the percentage of 90% has been temporarily (from 2008 to 2010) elevated to 100% by law 247/200796.
1.2.5. Accumulation of pension and labour income
Old age and early pensions. According to the recently passed law 133/2008, old age and early pensions may be fully accumulated with labour income. The new legislation improves upon the previous one, which foresaw some restrictions on the possibility of accumulation, especially in the case of employees97. Disability pensions. The possibility of accumulation is fully allowed only in cases of 40 years of contributions. Otherwise the pensioner is subject to withdrawal from their pension of 50% of the amount exceeding the minimum pension. In any case, the amount of pension is first reduced by 25% or 50%, depending on whether the pensioner’s income, including the amount of pension, exceeds 4 or 5 times the minimum pension. Survivor’s pensions. The possibility of accumulation without any curtailment is allowed only when the pensioner’s income, including the amount of pension, falls below 3 times the minimum pension. For higher incomes, a reduction of 25%, 40% and 50% is foreseen for income amounts falling in the brackets 3 to 4, 4 to 5 and more than 5 times the minimum pension.
1.2.6. Contribution rates 95 Since then pensions, including minimum pension (paragraph 1.2.3) have been indexed only to prices. 96 In 2008 alone, pensions of amounts more than 8 times the minimum pension are not indexed. 97 According to previous legislation (law 338/2000 and law 289/2002), the possibility of accumulation was fully allowed for pensioners retiring with at least: a) 40 years of contributions, b) 37 years of contributions and 58 years of age, c) the minimum requirements for an old age pension. On the contrary, it was forbidden for pensioners retired with less than 37 years of contributions and 58 years of age when the labour income concerned stemmed from dependent work. In all other cases, the possibility of accumulation was partial insofar as it was allowed, albeit subject to a reduction of the amount of pension depending on labour income levels. For a description of the previous legislation, see Ministero dell’Economia e delle Finanze-RGS (2007), annex 1, p. 161.
170

Contribution rates paid in the public pension system are differentiated by category of workers according to the following98: – private and public employees. The contribution rate is 33%, of which about 1/3rd is
paid by the employee and 2/3rd by the employer; – the self-employed. The contribution rate of artisans, shopkeepers and farmers is 20%
starting from 2008. For artisans and shopkeepers it was, respectively, 19.5% and 19.6% in 2007;
– atypical workers. The contribution rate is gradually increasing starting from 23% in 2007 and reaching 26% in 2010. It is reduced to 16% (17% starting from 2008) in cases of atypical workers already entitled to a pension, or contextually contributing to other public pension schemes.
1.2.7. Taxation of pensions
All pensions are taxed as labour-income, allowing for detractions inversely correlated to the income level. Pension income below 7,500 euro per year are tax-exempt (no tax-area). In 2007, total revenues on public pensions accounted for about 14.7% of the total expenditure which, in turn, corresponded to nearly 2.1% of GDP. Contributions paid to the public pension system are fully deductible from taxable income.
1.3. Funded component of the pension system
Reforms establishing funded pension schemes have also been enacted in order to foster a multi-pillar pension system. In particular, the 1992-1993 and 1995 reforms respectively introduced and improved legislation on supplementary, funded schemes. During the 1990’s, measures were progressively introduced with the aim of regulating financial markets (1991, 1996 and 1998) and of reforming taxation on income from financial assets (1997). At the end of the decade, additional measures were approved aiming to increase the amount of savings invested in pension funds (law 133/99 and related legislative decree for fiscal treatment of contributions paid to private funds). Despite the legislative intervention mentioned above, the number of workers enrolled in private pension funds remained low. For this reason, the 2004-pension reform (law 243/2004 and related legislative decree 252/2005) and law 296/2006 introduced further measures in order to foster the development of the second pillar. This was done through two kinds of interventions, coming into force from 2007: i) higher fiscal incentives, and ii) silence-as-assent for the transfer of severance pay for private sector employees. According to the latter measure, the current flow of severance pay should be transferred to private pension funds unless the worker actively communicates his or her refusal. Nevertheless, enrolment in private pension funds remains on a voluntary basis.
98 An additional contribution rate of 0.09% for all workers is foreseen starting from 2011.
171
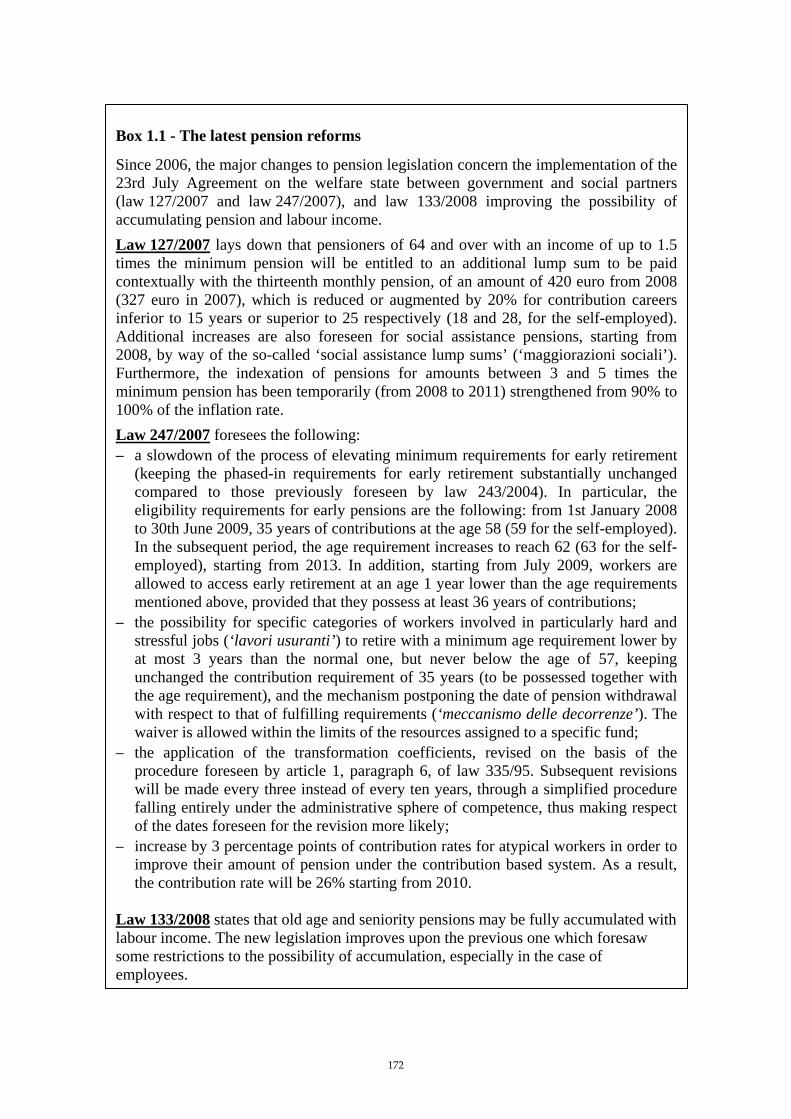
Law 247/2007 foresees the following: – a slowdown of the process of elevating minimum requirements for early retirement
(keeping the phased-in requirements for early retirement substantially unchanged compared to those previously foreseen by law 243/2004). In particular, the eligibility requirements for early pensions are the following: from 1st January 2008 to 30th June 2009, 35 years of contributions at the age 58 (59 for the self-employed). In the subsequent period, the age requirement increases to reach 62 (63 for the self-employed), starting from 2013. In addition, starting from July 2009, workers are allowed to access early retirement at an age 1 year lower than the age requirements mentioned above, provided that they possess at least 36 years of contributions;
– the possibility for specific categories of workers involved in particularly hard and stressful jobs (‘lavori usuranti’) to retire with a minimum age requirement lower by at most 3 years than the normal one, but never below the age of 57, keeping unchanged the contribution requirement of 35 years (to be possessed together with the age requirement), and the mechanism postponing the date of pension withdrawal with respect to that of fulfilling requirements (‘meccanismo delle decorrenze’). The waiver is allowed within the limits of the resources assigned to a specific fund;
– the application of the transformation coefficients, revised on the basis of the procedure foreseen by article 1, paragraph 6, of law 335/95. Subsequent revisions will be made every three instead of every ten years, through a simplified procedure falling entirely under the administrative sphere of competence, thus making respect of the dates foreseen for the revision more likely;
– increase by 3 percentage points of contribution rates for atypical workers in order to improve their amount of pension under the contribution based system. As a result, the contribution rate will be 26% starting from 2010.
Law 133/2008 states that old age and seniority pensions may be fully accumulated with labour income. The new legislation improves upon the previous one which foresaw some restrictions to the possibility of accumulation, especially in the case of employees.
Law 127/2007 lays down that pensioners of 64 and over with an income of up to 1.5 times the minimum pension will be entitled to an additional lump sum to be paid contextually with the thirteenth monthly pension, of an amount of 420 euro from 2008 (327 euro in 2007), which is reduced or augmented by 20% for contribution careers inferior to 15 years or superior to 25 respectively (18 and 28, for the self-employed). Additional increases are also foreseen for social assistance pensions, starting from 2008, by way of the so-called ‘social assistance lump sums’ (‘maggiorazioni sociali’). Furthermore, the indexation of pensions for amounts between 3 and 5 times the minimum pension has been temporarily (from 2008 to 2011) strengthened from 90% to 100% of the inflation rate.
Since 2006, the major changes to pension legislation concern the implementation of the 23rd July Agreement on the welfare state between government and social partners (law 127/2007 and law 247/2007), and law 133/2008 improving the possibility of accumulating pension and labour income.
Box 1.1 - The latest pension reforms
172
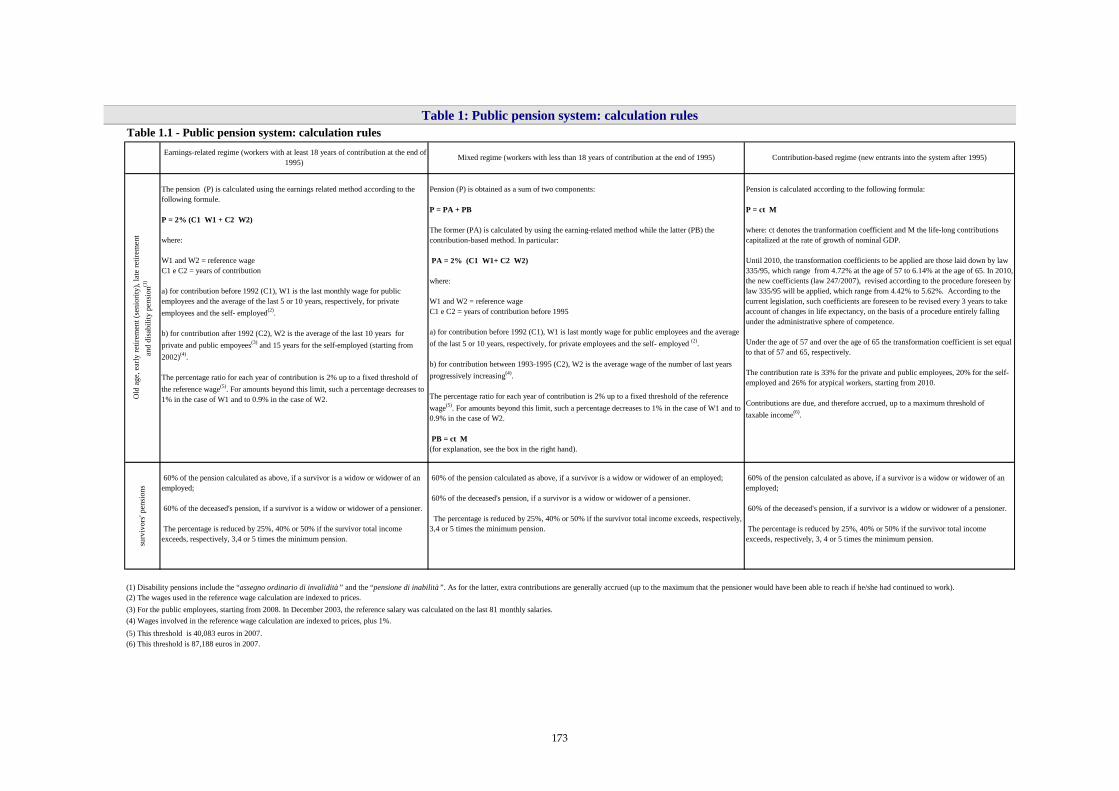
Table 1: Public pension system: calculation rules O
ld a
ge, e
arly
retir
emen
t (se
nior
ity),
late
retir
emen
t an
d di
sabi
lity
pens
ion(1
)
Pension (P) is obtained as a sum of two components:
P = PA + PB
The former (PA) is calculated by using the earning-related method while the latter (PB) the contribution-based method. In particular: PA = 2% (C1 W1+ C2 W2)
where:
W1 and W2 = reference wageC1 e C2 = years of contribution before 1995
a) for contribution before 1992 (C1), W1 is last montly wage for public employees and the average of the last 5 or 10 years, respectively, for private employees and the self- employed (2).
b) for contribution between 1993-1995 (C2), W2 is the average wage of the number of last years progressively increasing(4).
The percentage ratio for each year of contribution is 2% up to a fixed threshold of the reference wage(5). For amounts beyond this limit, such a percentage decreases to 1% in the case of W1 and to 0.9% in the case of W2.
PB = ct M(for explanation, see the box in the right hand).
Pension is calculated according to the following formula:
P = ct M
where: ct denotes the tranformation coefficient and M the life-long contributions capitalized at the rate of growth of nominal GDP.
Until 2010, the transformation coefficients to be applied are those laid down by law 335/95, which range from 4.72% at the age of 57 to 6.14% at the age of 65. In 2010, the new coefficients (law 247/2007), revised according to the procedure foreseen by law 335/95 will be applied, which range from 4.42% to 5.62%. According to the current legislation, such coefficients are foreseen to be revised every 3 years to take account of changes in life expectancy, on the basis of a procedure entirely falling under the administrative sphere of competence.
Under the age of 57 and over the age of 65 the transformation coefficient is set equal to that of 57 and 65, respectively.
The contribution rate is 33% for the private and public employees, 20% for the self-employed and 26% for atypical workers, starting from 2010.
Contributions are due, and therefore accrued, up to a maximum threshold of taxable income(6).
surv
ivor
s' pe
nsio
ns
60% of the pension calculated as above, if a survivor is a widow or widower of an employed;
60% of the deceased's pension, if a survivor is a widow or widower of a pensioner.
The percentage is reduced by 25%, 40% or 50% if the survivor total income exceeds, respectively, 3,4 or 5 times the minimum pension.
60% of the pension calculated as above, if a survivor is a widow or widower of an employed;
60% of the deceased's pension, if a survivor is a widow or widower of a pensioner.
The percentage is reduced by 25%, 40% or 50% if the survivor total income exceeds, respectively, 3, 4 or 5 times the minimum pension.
(3) For the public employees, starting from 2008. In December 2003, the reference salary was calculated on the last 81 monthly salaries.(4) Wages involved in the reference wage calculation are indexed to prices, plus 1%.
(6) This threshold is 87,188 euros in 2007.
(2) The wages used in the reference wage calculation are indexed to prices.(1) Disability pensions include the “assegno ordinario di invalidità ” and the “pensione di inabilità ”. As for the latter, extra contributions are generally accrued (up to the maximum that the pensioner would have been able to reach if he/she had continued to work).
(5) This threshold is 40,083 euros in 2007.
60% of the pension calculated as above, if a survivor is a widow or widower of an employed;
60% of the deceased's pension, if a survivor is a widow or widower of a pensioner. The percentage is reduced by 25%, 40% or 50% if the survivor total income exceeds, respectively, 3,4 or 5 times the minimum pension.
Earnings-related regime (workers with at least 18 years of contribution at the end of 1995)
Table 1.1 - Public pension system: calculation rules
Mixed regime (workers with less than 18 years of contribution at the end of 1995) Contribution-based regime (new entrants into the system after 1995)
The pension (P) is calculated using the earnings related method according to the following formule.
P = 2% (C1 W1 + C2 W2)
where:
W1 and W2 = reference wageC1 e C2 = years of contribution
a) for contribution before 1992 (C1), W1 is the last monthly wage for public employees and the average of the last 5 or 10 years, respectively, for private employees and the self- employed(2).
b) for contribution after 1992 (C2), W2 is the average of the last 10 years for private and public empoyees(3) and 15 years for the self-employed (starting from 2002)(4).
The percentage ratio for each year of contribution is 2% up to a fixed threshold of the reference wage(5). For amounts beyond this limit, such a percentage decreases to 1% in the case of W1 and to 0.9% in the case of W2.
b f b fb f
173

174
Table 2: Public pension system: eligibility requirements
2004 - 2007 Starting from 2008 (Law 243/2004) up to 2007 Starting from 2008 (Law 243/2004)
65 years of age for male,60 years of age for female and 20 years of contribution for males and females.
as before.
Eligibility requirements range from age 57 to age 65. At least 5 years of contribution are required. A worker is allowed to retire before 65 only if he/she is entitled to a pension of at least 1.2 times the old age allowance.
Males may retire at the age of 65 with at least 5 years of contribution.
Females may retire at the age of 60 with at least 5 years of contribution.
For both genders, before the age of 65, the amount of pension must be at least 1.2 times the old age allowance to retire.
Private sector employees
35 years of contribution and 57 years of age(1) or, alternatively, 38 years of contribution, in the period 2004 - 2005, and 39 in the period 2006 - 2007(2).
40 years of contributions regardeless of age or, alternatively, 35 years of contribution and 58 years of age until 30/06/2009, 60 from 01/07/2009 to 2010, 61 for the two-year period 2011-2012 and 62 starting from 2013. In addition, starting from July 2009, workers are allowed to access early retirement at an age lower by 1 year with at least 36 years of contributions(3) (4)
Public sector employees as above as above
Self-employed35 years of contribution and 58 years of age or 40 years of contribution(2).
40 years of contributions regardeless of age or, alternatively, 35 years of contribution and 59 years of age until 30/06/2009, 61 from 01/07/2009 to 2010, 62 for the two-year period 2011-2012 and 63 starting from 2013. In addition, starting from July 2009, workers are allowed to access early retirement at an age lower by 1 year with at least 36 years of contributions(3)(4)
5 years of contribution 3 of which accrued in the last five years. The entitlement of the pension depends only on the amount of disability and not on labour market conditions.
as before. as before. as before.
15 years of contributions, or alternatively, only 5 years of contribution 3 of which accrued in the last five years. as before. as before. as before.
Earnings-related and mixed regimes (workers already insured as of 1995)
(1) The age requirement is reduced to 56 for blue-collar workers in the period 2004 - 2005.(2) A further postponement of the retirement date is provided through the so-called "exit windows". The postponement ranges from 3 to 11 months.(3) For the period 2008-2015, women are allowed to retire having satisfied the requirements laid down by legislation before Law 243/2004, as long as their pension is calculated according to the contribution-based method.(4) From 2008, the further postponement through "exit window" is foreseen for all regimes and averages about 9 months for the employees and 15 months for the self-employed (somehow lower, until 2011, for those accessing retirement with 40 years of contributions).(5) It includes “assegno ordinario di invalidità” and “pensione di inabilità”, which are provided to people whose reduction of ability to work is at least 2/3rds for the former and 100% for the latter.
Table 1.2 - Public pension system: eligibility requirements
Disability pensions(5)
Survivors' pensions
Old age retirement
Early
retir
emen
t
For both genders, retirement is allowed with at least 57 year of age and 5 years of contribution or, alternatively, 40 years of contribution regardless of age. In both cases the requirement of an amount of pension of at least 1.2 time the minimum pension must be fulfilled.
The possibility to receive a pension at an age lower than 65 for man and 60 for women is allowed to those with 40 or more years of contributions, or to those with no less than 35 years of contributions and 58 years of age (59 for self-employed) until 30/06/2009, 60 (61 for self-employed) from 01/07/2009 to 2010, 61 (62 for self-employed) for the two-year period 2011-2012 and 62 starting from 2013 (63 for self-employed). In addition, starting from July 2009, workers are allowed to access early retirement at an age lower by 1 year with at least 36 years of contributions(4).
Contribution-based regime (new entrants into the system after 1995)

2. Pension expenditure projections
2.1. Extent of the coverage of pension schemes
Pension projections cover the expenditure of the whole public pension system and that for old-age allowances (social pensions, if awarded before1995) and social assistance additional lump sums. The first component, which insures workers against old age, disability and survivors’ risks, comprises all pensions awarded on the basis of contribution requirements. The second component has been included in view of its close relationship with age. In fact, in addition to being means-tested, old age allowances are not awarded until the age of 65. In terms of pension expenditure, such an aggregate is just a bit smaller than that of Eurostat (ESSPROS statistics). The difference accounts for about 0.8% of GDP (Table 3). In particular, it does not include some benefits awarded to survivors and disabled people (0.7 percentage point in terms of GDP) which are not pensions insofar as they are not related either to contribution requirements or old age (benefits paid to the disabled and the deaf and dumb below 65 years old, war pensions, work injury annuities and merit awards)99.
Table 3: Eurostat vs. national definition of public pension expenditure (% of GDP) 2000 2001 2002 2003 2004 2005Eurostat pension expenditure(1) 14.4 14.3 14.6 14.7 14.6 14.8National pension expenditure 13.5 13.5 13.7 13.8 13.8 14.0Total difference(2) 0.9 0.9 0.9 0.9 0.8 0.8
Benefits paid to the disabled and the deaf and dumb below 65 years old, war pensions, work injury annuities and merit awards
0.7 0.6 0.7 0.6 0.6 0.6
Survivors’ war pensions and survivors’ work injury annuities 0.1 0.1 0.1 0.1 0.1 0.1Supplementary pensions paid by private pension funds 0.1 0.1 0.1 0.1 0.1 0.1
(1) Source: Eurostat (2008), Social protection: expenditure on pensions. (2) Because of rounding to the first digit after the dot, the sum of the expenditure addends may not match the total difference.
Furthermore, the aggregate covered by projections does not include supplementary pensions paid by private pension funds (0.1 percentage points in terms of GDP) which, being private, fall outside the public pension system definition to be utilized for the analysis of the sustainability of public finances. Moreover, the features of the private component of the Italian pension system, as designed by current legislation, imply that no risk is run by the State concerning financial investment returns which may significantly affect the amount of benefit. The main reasons for this may be summarized as follows: – private pension funds are never mandatory (no matter whether they are or are not
occupational pension schemes); – the enrolment in private pension funds never replaces that in the public pension system,
which is compulsory for all workers; – private pension funds provide a supplementary pension adding to the sum guaranteed
by the public pension system. A quota of the capital accumulated (up to 50%) may be
99 Such benefits represent compensatory lump sums because of disability or work injury which bear no relation to pension contributions and, therefore, to the sphere of risks covered by public pension systems.
175

withdrawn as a one-off reimbursement at the time of retirement (or even before, to finance particular expenses, such as purchasing a home);
– the supplementary pension provided by private pension funds is but a minor fraction of that provided by the public pension system. This implies that workers who choose to be enrolled in a private pension fund will accept all the risks concerning financial investment returns, since the public pension system in any case provides them with an adequate amount of public pension.
Table 4 gives some statistical information about the state of development of the private component of the pension system in Italy during the period 2000-2007, in terms of workers enrolled, contributions paid yearly, and financial assets.
Table 4: Private component of the Italian pension system: historical data 2000-2007 2000 2001 2002 2003 2004 2005 2006 2007 (4)
Pension expenditure, gross, in millions € 1568 2120 1847 2788 1887 1502 2484 1805Non-mandatory occupational pensions (1) (2) 1568 2120 1847 2788 1887 1502 2484 1805
- pensions 602 637 733 736 735 698 918 901 - benefit in capital 966 1483 1114 2052 1152 804 1566 904
Non-mandatory private pensions 0 0 0 0 0 0 0 0Number of pensioners, in 1000’s 108 121 123 114 111 111 143 144
Non-mandatory occupational pensions (1) (2) 108 121 123 114 111 111 143 144Non-mandatory private pensions 0 0 0 0 0 0 0 0
Contributions, in millions € 2665 3751 4231 4568 4951 5481 6231 8422Non-mandatory occupational pensions (1) 2665 3395 3638 3822 4021 4401 4988 6995Non-mandatory private pensions 0 356 593 746 930 1080 1243 1427
Number of contributors, in 1000’s 1692 2104 2362 2572 2740 2994 3184 4560Non-mandatory occupational pensions (1) 1692 1885 1972 2018 2056 2172 2304 3424Non-mandatory private pensions (3) 0 219 390 555 685 823 880 1136
Assets of pension funds and reserves, in millions € 23011 28001 30356 33389 37174 42648 51478 57770
Non-mandatory occupational pensions (1) 23011 27808 29739 32111 35024 39310 46932 51980Non-mandatory private pensions 0 193 617 1278 2150 3338 4546 5790
Source: Covip (2000-2007), Relazione annuale. Such reports can be downloaded from the following web site: www.covip.it (1) Including open and closed pension funds and those existing before the 1993-reform. (2) Referring only to ‘pre-existing’ pension funds, i.e. those pension funds set up before the 1993 reform. (3) For the years 2001-2005, expressing the cumulative number of insurance policy subscriptions since 2001. (4) The sharp increase of contributors and contributions in 2007 is due to the effects of legislative decree 252/2005 as
amended by the law 296/2006, as far as the date of effectiveness is concerned. A further increase has been registered in the first half of 2008.
2.2. Overview of projection results
Graph 1a shows the projected ratio of pension expenditure (gross of tax revenues) to GDP obtained on the basis of the AWG baseline scenario and in accordance with pension legislation in force at the end of September 2008. The values foreseen at the end of each decade of the forecasting period are reported in Table 5.
176

Table 5: Projected gross pension spending, tax on pension and contributions (% of GDP) 2000 2007 2020 2030 2040 2050 2060 Peak year
(1) Social security pensions 13.5 14.0 14.1 14.8 15.6 14.7 13.6 2041
Old-age and early pensions
13.0 13.5 13.6 14.4 15.2 14.4 13.3 2041
Other Pensions 0.5 0.5 0.5 0.4 0.3 0.3 0.3 2003 Total pension expenditure 13.5 14.0 14.1 14.8 15.6 14.7 13.6 2041 Taxes on public pensions : 2.1 2.1 2.1 2.1 2.1 2.1 2006
(1) The year in which the particular variable reaches its maximum in the period 2000 to 2060.
After a substantial steadiness up to 2018, where the gradual increase of the minimum requirements to be entitled to an early pension tends to compensate for the dynamics brought about by the endurance of the earnings-related system, the ratio starts to rise to a peak of 15.6% in 2041, which is 1.6 percentage points higher than that in 2007. The increase is smaller up to 2025, and significantly sharper thereafter. After 2041, a phase of rapid decrease begins which leads the ratio to settle at 14.7% in 2050 and 13.6% in 2060. In the middle of the forecasting period, the growth of the ratio of pension expenditure to GDP is mainly due to the increase of the ratio of pensions to employees brought about by demographic change and only partly compensated for by the tightening of eligibility requirements. Such an increase exceeds the containing effect on the evolution of pension amounts which comes about from the gradual introduction of the contribution-based method (mixed regime). The rapid decrease in the ratio of pension expenditure to GDP in the final phase of the forecasting period is determined by the shrinkage in pension amounts as an effect of the transition from a mixed regime to a contribution-based one, whilst the ratio between pensions and employees tends to stabilise. This last phenomenon arises from the gradual disappearance of the baby boom generations. The projection of tax revenues from pensions, reported in Table 5, has been made by assuming the simple rule of keeping its incidence constant in terms of GDP over time. This is in line with the assumption adopted for all other tax revenues, when assessing the mid-long term sustainability of public finances, and seems consistent with the concept of a no policy change scenario underlying the baseline assumptions100. Furthermore, it guarantees cross country comparability, since income tax systems vary considerably from country to country and so do the pension models utilised for projections101. According to this rule, the incidence of tax revenues on public pensions remains constant at the 2007-level of 2.1% of GDP over the entire forecasting period. Consequently, the incidence of taxation in terms of pension expenditure varies according to changes in the ratio of pension expenditure to GDP102.
100 In fact, income tax systems are generally progressive and income thresholds are quite often indexed neither to wages nor to prices. This would imply an increase of the average tax rate over time, unless governments periodically introduce changes to income tax regulation. In doing this, policy makers do generally take account of the following two implications: i) the effects in terms of the average tax rate, i.e. the incidence of the overall revenues in terms of GDP, and ii) the distributive effects amongst different categories of taxpayers (dependent workers, self-employed, pensioners etc.). Therefore, the assumption of a no policy change scenario implies no change in governmental policies concerning both the average tax rate and the related income distribution pattern. This means that the overall income tax burden, as well as the quota of it deriving from pension income, should be kept constant over time in terms of GDP. 101 Besides being able to make a satisfactory estimate of pension income distribution, a pension model should also be able to project income sources other than pensions, the knowledge of which is necessary correctly to apply the progressiveness of income tax. 102 The knowledge of the incidence of income tax on pensions in the base year is important in order to assess the real burden of public pension expenditure in terms of GDP, and thus to make it comparable amongst countries.
177

Table 6 gives the projected pension expenditure distributed by scheme. As can be seen, private sector employees, including atypical workers, account for about 60% of the total pension expenditure, and their relative weight increases over time to 66% in 2060. Correspondently, the quota of public sector employees and that of the self-employed are reduced from 24% to 19% and from 15% to 10%, respectively. Changes in the composition of pension expenditure by sector are only partly explained by a corresponding composition in enrolled workers, which follows the same pattern. An important contribution is given by the containing effects brought about by the introduction of the contribution based method, which is higher for public sector employees and for the self-employed. As for the former, it depends on the earnings-related calculation method which was, and still continues to be, more generous than for private sector employees. As for the latter, the reduction effect is particularly strong because of the lower contribution rate (20% instead of 33%). Finally, we may note the relevant increase of the incidence of expenditure on social pensions and old age allowances which, in terms of GDP, moves from 0.2% in 2007 to 0.6% in 2060.
Table 6: Projected gross public pension spending: by scheme (% of GDP) 2000 2007 2020 2030 2040 2050 2060 Peak
year (1) Total social security pensions (2) 13.5 14.0 14.1 14.8 15.6 14.7 13.6 2041
Public sector employees 3.2 3.3 3.6 3.5 3.3 2.9 2.6 2021 Private sector employees 8.3 8.4 8.1 8.8 9.9 9.7 9.0 2044 Self-employed (3) 1.8 2.1 2.1 2.1 1.9 1.6 1.4 2018 Others (4) 0.2 0.2 0.3 0.4 0.5 0.5 0.6 2058
(1) The year in which the particular variable reaches its maximum in the period 2000 to 2060. (2) Because of rounding figures to the first digit after the dot, the sum of the addends may not coincide with the total. (3) Including farmers, shopkeepers, artisans and professionals. (4) Including social pensions, old age allowances and social assistance additional lump sums (‘maggiorazioni sociali’).
2.3. Description of the main driving forces behind pension projections
2.4. Table 7: Factors behind public pension expenditure between 2007 and 2060 (% of GDP)
2007-20 2020-30 2030-40 2040-50 2050-60 2007-60 Public pensions to GDP in a starting year * 0.1 0.7 0.8 -0.8 -1.1 -0.4 Dependence ratio 2.4 2.7 3.9 1.5 0.0 10.4 Coverage ratio -1.4 -0.2 -1.0 -0.7 0.1 -3.2 1/Employment rate -0.9 -0.2 -0.1 0.0 0.1 -1.1 Benefit ratio 0.3 -1.3 -1.6 -1.5 -1.3 -5.5 Interaction effect (residual) -0.2 -0.3 -0.4 0.0 0.0 -1.0
(1) The starting year is 2007 for the column 2007-20 and 2020 for the column 2020-30, etc.
The decomposition of the ratio of pension expenditure to GDP as a product of the ‘benefit ratio’ (the ratio of the average pension to labour productivity) and the ‘economic
178
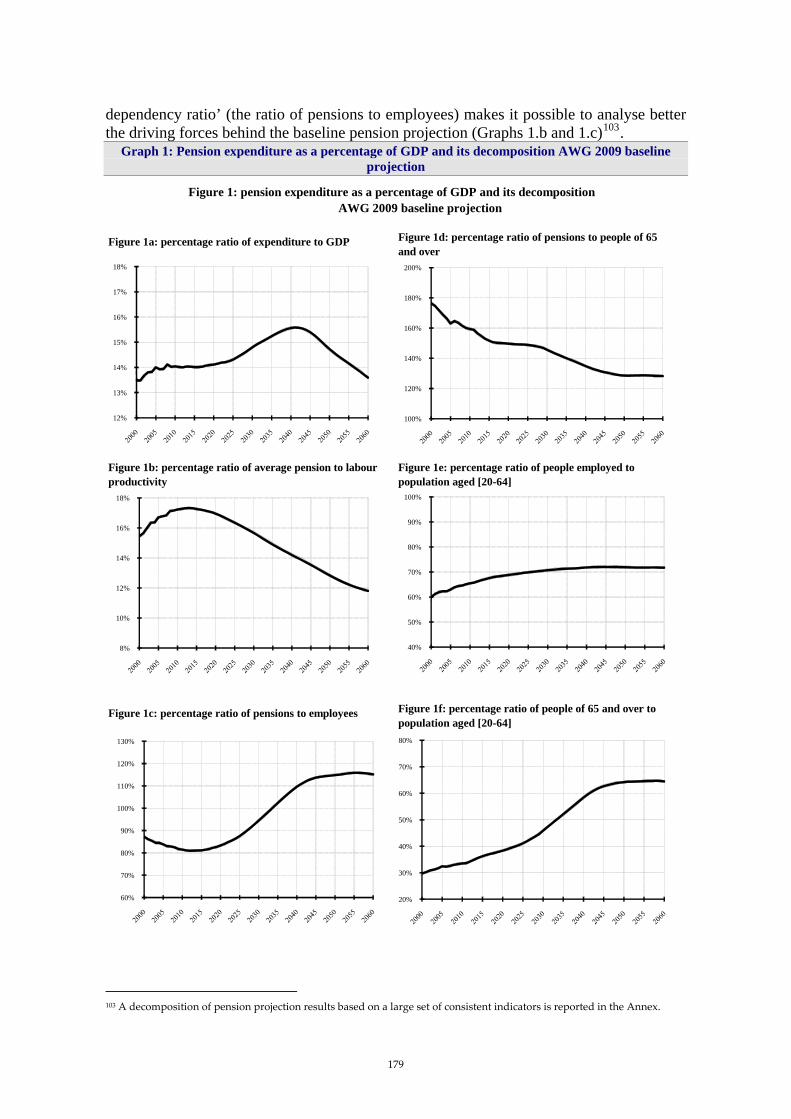
dependency ratio’ (the ratio of pensions to employees) makes it possible to analyse better the driving forces behind the baseline pension projection (Graphs 1.b and 1.c)103.
Graph 1: Pension expenditure as a percentage of GDP and its decomposition AWG 2009 baseline projection
Figure 1a: percentage ratio of expenditure to GDP Figure 1d: percentage ratio of pensions to people of 65 and over
Figure 1b: percentage ratio of average pension to labour productivity
Figure 1e: percentage ratio of people employed to population aged [20-64]
Figure 1c: percentage ratio of pensions to employees Figure 1f: percentage ratio of people of 65 and over to population aged [20-64]
Figure 1: pension expenditure as a percentage of GDP and its decomposition AWG 2009 baseline projection
8%
10%
12%
14%
16%
18%
60%
70%
80%
90%
100%
110%
120%
130%
100%
120%
140%
160%
180%
200%
40%
50%
60%
70%
80%
90%
100%
20%
30%
40%
50%
60%
70%
80%
12%
13%
14%
15%
16%
17%
18%
103 A decomposition of pension projection results based on a large set of consistent indicators is reported in the Annex.
179

The initial steadiness of pension expenditure to GDP ratio derives from the substantial compensation between an increase in the benefit ratio because of the low growth of productivity assumed at the beginning of the forecasting period, and a decrease in the economic dependency ratio mainly caused by the tightening of the eligibility requirements. Starting from 2015, the ratio of pensions to employed people begins to rise for well-known demographic reasons. The increase becomes sharper a decade later, when the baby boom generations are expected to cross the threshold of 65, moving from the working-age population (denominator of the ratio) to elderly people (numerator of the ratio), while the employment rate stops increasing. At the same time, however, the benefit ratio decreases significantly because of the gradual introduction of the contributions-based regime. In fact, in these years most new pensions are awarded under the mixed regime. However, such an effect is not so strong as to offset the rapid rise in the economic dependency ratio. This will happen in the last decade of the forecasting period, when the ratio of pension expenditure to GDP falls very sharply owing to the gradual shift from the mixed regime to the contributions-based one, fully phased in by that date. This time the effects of the legal-institutional framework are accompanied by a slowdown in the rise of the economic dependency ratio, which settles at around 115% in the last ten years of the forecasting period. The latter mainly results from the progressive elimination of pensions paid to the baby boom generations and the tendency of employment to stabilise. As noted above, the reduction of the benefit ratio is mainly due to normative reasons. In this regard, besides the fact that pensions are indexed only to prices104, an important role is played by the gradual shift from the earnings-related to the contributions-based system enforced by the three-year revision of transformation coefficients in accordance with mortality assumptions105. In this regard, Table 8 shows the evolution of the ratio between the average amount of newly awarded pensions (old age and early retirement alone) and the average wage based on national accounts figures. As can be seen, starting from a level of the 67% in 2007 the indicator remains almost stable or even increases slightly until 2015, because of the endurance of the earnings-related regime accompanied by low dynamics of productivity. However, with the gradual introduction of the contribution-based method of calculation, the ratio starts to decline, settling at about 50% from 2050 on106. It is interesting to note that during the transitional phase the indexation to prices reduces, in relative terms, the advantages of the old pensions calculated under the earnings-related method compared to the newly awarded ones107.
104 Albeit not stated in current legislation, social pensions, old age allowances and additional social assistance lump sums have been indexed to nominal GDP per capita, starting from 2009. 105 In this regard, the revision of transformation coefficients, including that already legislated to take place in 2010, implies a reduction of pension expenditure to GDP ratio of almost 2.4 percentage points in 2060. 106In terms of pension amounts, the transformation coefficient revision implies a reduction of the replacement rate which accounts for about 14 percentage points for an employee and 8 percentage points for the self-employed (Box 2.1). The remaining part is explained by the fact that the actuarial equivalence, on the basis of which the transformation coefficients are calculated (Annex 2), would imply a lower average replacement rate, compared to that of the earnings-related method, even keeping unchanged the current transformation coefficient. This effect varies according to retirement age and the level of contribution rate. It is more marked for those retiring at a younger age and for the self-employed. 107 Such an indicator is useful to assess the projected evolution of the average amount of a newly awarded pension, compared to the dynamics of productivity. However, it should never be considered as an ‘average replacement rate’. This is because the average wage in the denominator: i) does not represent the last wage before retirement; ii) varies significantly by sector; iii) only refers to employees, and, iv) does not coincide with the average contribution base.
180

Table 8: Replacement rate and coverage by pension scheme (in %) 2000 2007 2020 2030 2040 2050 2060
Social security scheme 64.1 66.8 65.5 57.6 56.0 51.0 49.4 Coverage (1) 100.0 100.0 100.0 100.0 100.0 100.0 100.0
(1) Calculated as a ratio of the number of pensioners within the scheme and the total number of pensioners in the country.
The effect brought about by the new calculation rules can also be assessed at a microeconomic level by calculating the ‘theoretical gross replacement rate’, i.e. the ratio between the initial, annual amount of pension and the last annual wage (or labour income for the self-employed) for different typologies of careers, which may be considered representative of workers’ behaviour. The results are reported in Box 2.1 for two typologies of workers: a private employee and a self-employed one. This is because the two differ significantly in terms of contribution rates, which proportionally affects the amount of pension under the contributions-based regime108. As expected, the gross replacement rates are almost stable for the first years of the forecasting period and decrease afterwards. The reduction from 2010 to 2060 accounts for about 27% in the case of the private employees, and about 55% in the case of the self-employed. Albeit useful to measure the impact of changes in calculation rules, the theoretical gross replacement rate is insufficient to assess the capability of the pension system to guarantee an adequate income to elderly people after retirement. In this regard, the analysis should be complemented with further information concerning the distributive effect of the pension system rules, the presence of a safety net, the disposable income of the pensioner before and after retirement, and additional income sources provided by the private component of the pension system. Such aspects are discussed in Box 2.1. Graphs 1d-1f help us understand better the evolution of the ratio of pensions to employees compared with the evolution of the elderly dependency ratio. As emerges from the comparison, the former is expected to grow significantly less than the latter. It depends both on a decrease in the ratio of pensions to people aged 65 and over (Graph 1d) and on an increase in the ratio of employees to people in the age bracket 20-64 (Graph 1e). Table 9: Number of pensioners and contributors in the social security scheme (in 1000’s), population
over 65, and total employment (in 1000) and related ratios (%) 2000 2007 2020 2030 2040 2050 2060
Number of pensioners (I) 15266 15807 16819 19299 21335 21304 20802 Number of people aged 65+ (II) 10310 11773 13931 16180 19108 19978 19427 Ratio of (I) and (II) 148 134 121 119 112 107 107 Number of contributors (III) 21624 23550 25404 25304 23835 22687 21922 Employment(IV) 20620 22925 24576 24210 22555 21594 20880 Ratio of (III) and (IV) 105 103 103 105 106 105 105 Ratio of (III) and (I) 'support ratio' 142 149 151 131 112 106 105
The first phenomenon is mainly due to the evolution of two components within the number of pensions: survivors’ pensions of 65 and over and pensions paid to people under 65. The evolution of both components is shown, respectively, in Graphs 2a and 2b.
108 As the contribution rate is substantially the same for public and private employees, the figures reported for a private sector employee can also be referred to a public sector employee. For more details concerning different typologies of workers and the comparison between gross and net replacement rates, see Ministero dell’Economia e delle Finanze-RGS (2007), Le tendenze di medio-lungo periodo del sistema pensionistico e socio-sanitario, Report no. 9, Rome, chapter 4. This report and previous ones can be downloaded from the following website: http://www.rgs.mef.gov.it/VERSIONE-I/Norme-e-do/Spesa-soci/ATTIVITA--/Presentazione.doc_asc1.pdf.
181
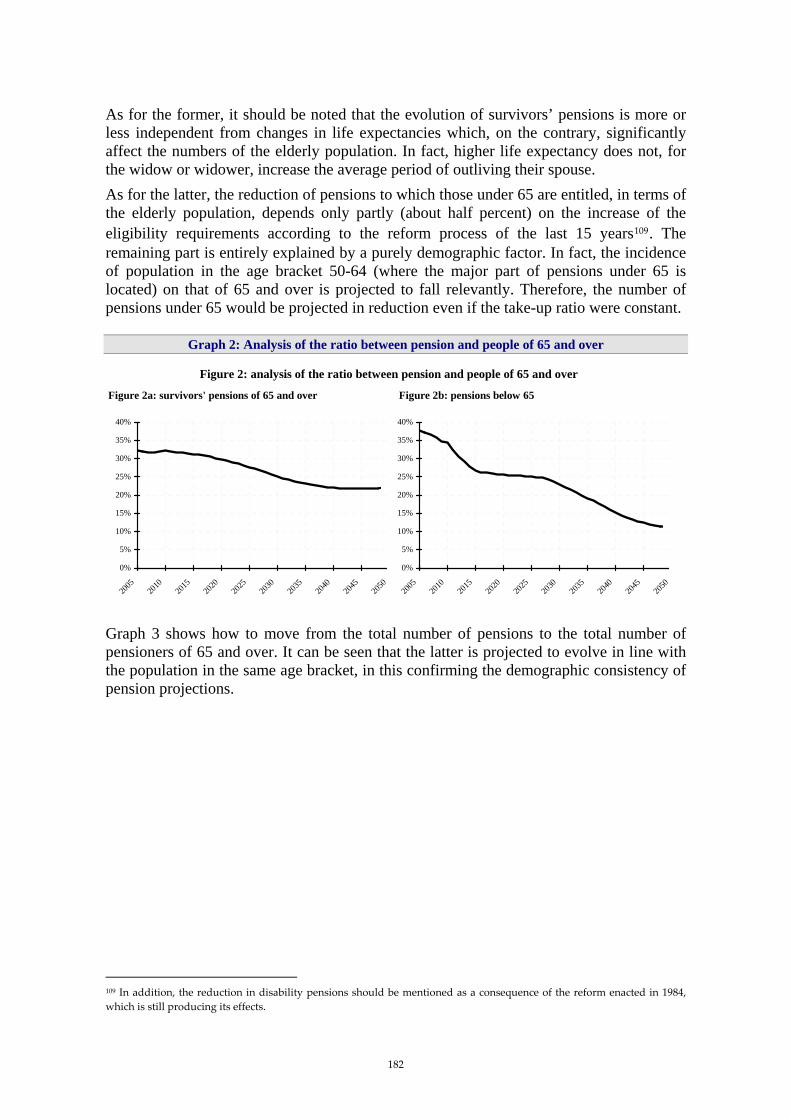
As for the former, it should be noted that the evolution of survivors’ pensions is more or less independent from changes in life expectancies which, on the contrary, significantly affect the numbers of the elderly population. In fact, higher life expectancy does not, for the widow or widower, increase the average period of outliving their spouse. As for the latter, the reduction of pensions to which those under 65 are entitled, in terms of the elderly population, depends only partly (about half percent) on the increase of the eligibility requirements according to the reform process of the last 15 years109. The remaining part is entirely explained by a purely demographic factor. In fact, the incidence of population in the age bracket 50-64 (where the major part of pensions under 65 is located) on that of 65 and over is projected to fall relevantly. Therefore, the number of pensions under 65 would be projected in reduction even if the take-up ratio were constant.
Graph 2: Analysis of the ratio between pension and people of 65 and over
Figure 2a: survivors' pensions of 65 and over Figure 2b: pensions below 65
Figure 2: analysis of the ratio between pension and people of 65 and over
0%
5%
10%
15%
20%
25%
30%
35%
40%
2005
2010
2015
2020
2025
2030
2035
2040
2045
205
0%
5%
10%
15%
20%
25%
30%
35%
40%
2005
2010
2015
2020
2025
2030
2035
2040
2045
2050 0
Graph 3 shows how to move from the total number of pensions to the total number of pensioners of 65 and over. It can be seen that the latter is projected to evolve in line with the population in the same age bracket, in this confirming the demographic consistency of pension projections.
109 In addition, the reduction in disability pensions should be mentioned as a consequence of the reform enacted in 1984, which is still producing its effects.
182
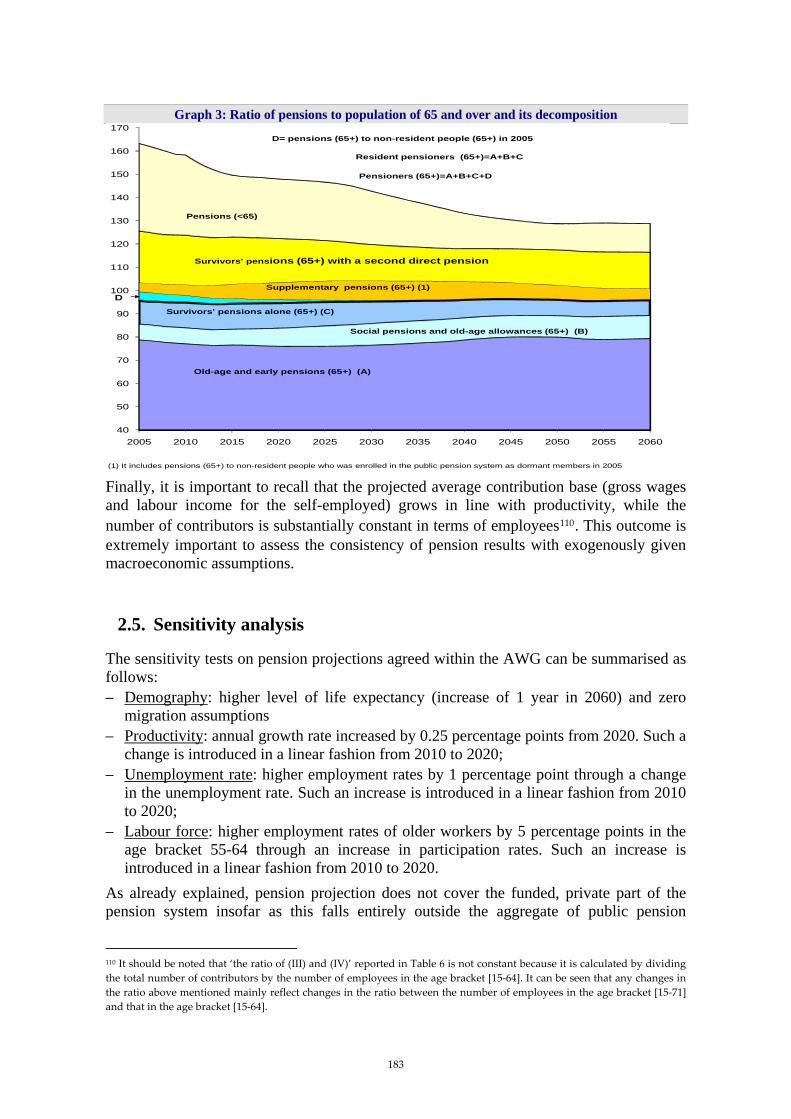
Graph 3: Ratio of pensions to population of 65 and over and its decomposition
40
50
60
70
80
90
100
110
120
130
140
150
160
170
2005 2010 2015 2020 2025 2030 2035 2040 2045 2050 2055 2060
Supplementary pensions (65+) (1)
Survivors' pensions (65+) with a second direct pension
Resident pensioners (65+)=A+B+C
Old-age and early pensions (65+) (A)
Social pensions and old-age allowances (65+) (B)
D= pensions (65+) to non-resident people (65+) in 2005
D
Survivors' pensions alone (65+) (C)
Pensioners (65+)=A+B+C+D
Pensions (<65)
(1) It includes pensions (65+) to non-resident people who was enrolled in the public pension system as dormant members in 2005
Finally, it is important to recall that the projected average contribution base (gross wages and labour income for the self-employed) grows in line with productivity, while the number of contributors is substantially constant in terms of employees110. This outcome is extremely important to assess the consistency of pension results with exogenously given macroeconomic assumptions.
2.5. Sensitivity analysis
The sensitivity tests on pension projections agreed within the AWG can be summarised as follows: – Demography: higher level of life expectancy (increase of 1 year in 2060) and zero
migration assumptions – Productivity: annual growth rate increased by 0.25 percentage points from 2020. Such a
change is introduced in a linear fashion from 2010 to 2020; – Unemployment rate: higher employment rates by 1 percentage point through a change
in the unemployment rate. Such an increase is introduced in a linear fashion from 2010 to 2020;
– Labour force: higher employment rates of older workers by 5 percentage points in the age bracket 55-64 through an increase in participation rates. Such an increase is introduced in a linear fashion from 2010 to 2020.
As already explained, pension projection does not cover the funded, private part of the pension system insofar as this falls entirely outside the aggregate of public pension
110 It should be noted that ‘the ratio of (III) and (IV)’ reported in Table 6 is not constant because it is calculated by dividing the total number of contributors by the number of employees in the age bracket [15-64]. It can be seen that any changes in the ratio above mentioned mainly reflect changes in the ratio between the number of employees in the age bracket [15-71] and that in the age bracket [15-64].
183
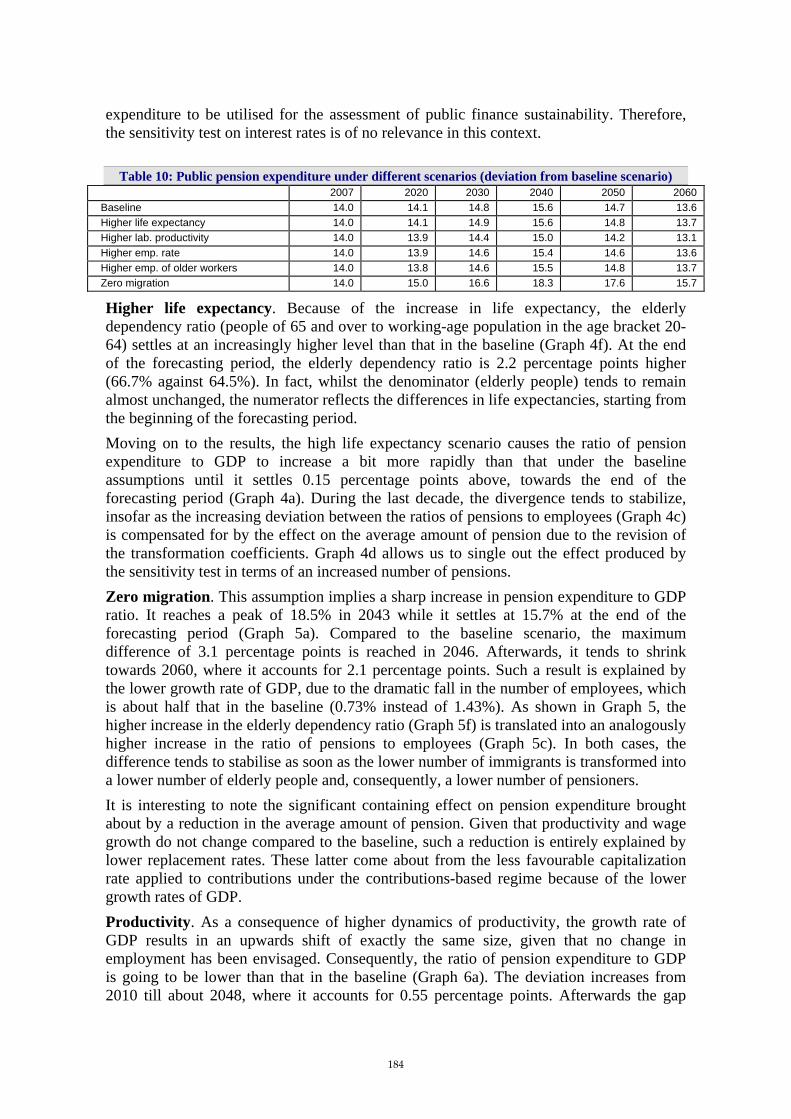
expenditure to be utilised for the assessment of public finance sustainability. Therefore, the sensitivity test on interest rates is of no relevance in this context.
Table 10: Public pension expenditure under different scenarios (deviation from baseline scenario) 2007 2020 2030 2040 2050 2060
Baseline 14.0 14.1 14.8 15.6 14.7 13.6 Higher life expectancy 14.0 14.1 14.9 15.6 14.8 13.7 Higher lab. productivity 14.0 13.9 14.4 15.0 14.2 13.1 Higher emp. rate 14.0 13.9 14.6 15.4 14.6 13.6 Higher emp. of older workers 14.0 13.8 14.6 15.5 14.8 13.7 Zero migration 14.0 15.0 16.6 18.3 17.6 15.7
Higher life expectancy. Because of the increase in life expectancy, the elderly dependency ratio (people of 65 and over to working-age population in the age bracket 20-64) settles at an increasingly higher level than that in the baseline (Graph 4f). At the end of the forecasting period, the elderly dependency ratio is 2.2 percentage points higher (66.7% against 64.5%). In fact, whilst the denominator (elderly people) tends to remain almost unchanged, the numerator reflects the differences in life expectancies, starting from the beginning of the forecasting period. Moving on to the results, the high life expectancy scenario causes the ratio of pension expenditure to GDP to increase a bit more rapidly than that under the baseline assumptions until it settles 0.15 percentage points above, towards the end of the forecasting period (Graph 4a). During the last decade, the divergence tends to stabilize, insofar as the increasing deviation between the ratios of pensions to employees (Graph 4c) is compensated for by the effect on the average amount of pension due to the revision of the transformation coefficients. Graph 4d allows us to single out the effect produced by the sensitivity test in terms of an increased number of pensions. Zero migration. This assumption implies a sharp increase in pension expenditure to GDP ratio. It reaches a peak of 18.5% in 2043 while it settles at 15.7% at the end of the forecasting period (Graph 5a). Compared to the baseline scenario, the maximum difference of 3.1 percentage points is reached in 2046. Afterwards, it tends to shrink towards 2060, where it accounts for 2.1 percentage points. Such a result is explained by the lower growth rate of GDP, due to the dramatic fall in the number of employees, which is about half that in the baseline (0.73% instead of 1.43%). As shown in Graph 5, the higher increase in the elderly dependency ratio (Graph 5f) is translated into an analogously higher increase in the ratio of pensions to employees (Graph 5c). In both cases, the difference tends to stabilise as soon as the lower number of immigrants is transformed into a lower number of elderly people and, consequently, a lower number of pensioners. It is interesting to note the significant containing effect on pension expenditure brought about by a reduction in the average amount of pension. Given that productivity and wage growth do not change compared to the baseline, such a reduction is entirely explained by lower replacement rates. These latter come about from the less favourable capitalization rate applied to contributions under the contributions-based regime because of the lower growth rates of GDP. Productivity. As a consequence of higher dynamics of productivity, the growth rate of GDP results in an upwards shift of exactly the same size, given that no change in employment has been envisaged. Consequently, the ratio of pension expenditure to GDP is going to be lower than that in the baseline (Graph 6a). The deviation increases from 2010 till about 2048, where it accounts for 0.55 percentage points. Afterwards the gap
184

remains almost unchanged for some ten years, before shrinking slightly towards the end of the forecasting period. To help us understand such trends, it is useful to recall that every time pensions are indexed only to prices, as is the case of Italy, an increase (decrease) in the growth rate of productivity will result in an increase (decrease) in the growth rate of GDP of the same size in the years concerned. Diversely, as regards pension expenditure the effect is very slight at the beginning. In fact it only concerns newly awarded pensions, which are in some way related to the final level of earnings and, indirectly, to the growth rate of productivity111. Generally it will take two to three decades until the structural change in the growth rate of productivity is entirely transferred to pension expenditure evolution. That is why for a long period the differences in the growth rates of GDP, which follow changes in productivity assumptions, are higher than those regarding pension expenditure. Yet, as the initial stock of pensions is replaced by newly awarded ones, the growth rate of both pension expenditure and GDP are going to equalise.
As expected on the basis of the previous considerations, the differences among the two curves in Graph 6a are explained by the diverse evolution of the corresponding benefit ratios (Graph 6b). Differently, the ratio of pensions to employees (Graph 6c) and its decomposition (Graph 6d-6f) are going to change imperceptibly. This latter phenomenon depends on the contribution-based method, which does not allow workers to retire until they have reached an amount of pension of at least 1.2 times the old age allowance112. Finally, it is interesting to remark that symmetrical changes in productivity growth in either direction produce almost symmetrical deviations from the baseline projection. Older workers’ participation rate. The sensitivity test concerning an increase in participation rates among the older workers has raised some concerns regarding the possibility of guaranteeing the consistency between pension results and exogenous assumptions. In fact, it is somewhat difficult to devise changes in eligibility requirements or retirement behaviour aimed at prolonging working lives which produce exactly the same effects on participation rates as those exogenously assumed in the sensitivity test, this in terms both of time profile and of the age classes involved. This aspect is of major relevance when, as in the case of Italy, current legislation provides for a tightening of eligibility requirements in the middle of the period chosen for an increase in older workers’ participation rates. Since it seems logical to assume that changes in the retirement behaviour of the older worker should be consistent with the legal framework which is embodied in the model, the projection on the sensitivity test under consideration has been made trying to approximate, as far as possible, to exogenous indications, without renouncing consistency between older worker retirement choices and pension legislation. Prolonging working lives has been achieved partly through a postponement of retirement age and partly through an increase of pensioner-contributor positions113. Regarding the
111 The amount of a newly awarded pension can always be expressed as a product of the final annual wage (or labour earnings) and the replacement rate. The former moves in line with productivity growth, the latter depends on the calculation formula provided by the legal framework. 112 Obviously, the number of workers impelled to put off the retirement age changes according to the assumption of the growth rate of productivity. 113 As for the postponement of retirement age, it has been assumed that those workers who, under the baseline assumptions, would have retired at the minimum age foreseen for an old age pension, in the case of women, and for an early pension, in the case of men, postpone their retirement by one year. The increase of pensioner-contributors has been
185

former, the pension model calculates the corresponding lower number of pensions. In both cases, however, it takes into account the subsequent increase in the average amount of pension due to the higher level of contributions. Ex-post, the increase in employment of older workers brought about by changes in the retirement behaviour has turned out substantially in line with that provided for in 2020 onwards, although some differences remain in the transition phase between 2010 and 2020. The reduction in the projected ratios of pension expenditure to GDP reaches a maximum value of 0.31 percentage points in 2020 (Graph 7a). This effect, stemming from an increase in the older worker’s participation rate, mainly reflects changes in employment (and, in this way, in GDP growth rates) and in the number of pensions during the first decades of the forecasting period (Graph 7c). Moving towards 2060, these effects tend to be counterbalanced by higher amounts of pensions due to longer working lives and, under the contribution-based system, higher transformation coefficients (Graph 7b). In the last 20 years of the forecasting period, the latter effect overcomes, temporarily, that brought about by the reduction in the ratio of pensions to employees. Unemployment rate. The sensitivity test consists of applying a correction to the structural level of the unemployment rate in order to make the employment rate rise 1 percentage point higher than that assumed in the baseline, starting from 2020. As a consequence, the growth rate of GDP is going to increase slightly, consistently with the deviation in the growth rate of employees. The effects on the ratio of pension expenditure to GDP are illustrated in Graph 8a. As expected, the higher reduction of the unemployment rate causes the ratio to settle just below that of the baseline for the forty-year period between 2010 and 2050. This outcome is mainly due to a higher growth rate of employees, which is not yet counterbalanced by a corresponding higher number of pensions (Graph 8c). Towards the end of the forecasting period the ratio of pension expenditure to GDP tends to overlap that in the baseline. This is partly due to replacement rates under the contributions-based system, which are increasingly higher than those in the baseline, due to the higher GDP growth rates utilised to capitalise contributions.
2.6. Comparison with the previous AWG baseline projections
Comparison between 2001 and 2006 AWG baseline projections. Apart from the update of initial values over time, differences between the 2001 and 2006 AWG pension projections (Graph 9a) are explained by the following two driving factors: changes in the legal framework and changes in the demographic and macroeconomic scenarios. To disentangle the effects of these two factors we may compare the 2001 AWG pension projection with that reported in the 2004 stability programme of Italy, and this latter with that elaborated for the 2006 round of AWG common projections (hereafter the ‘2006 AWG projection’). In fact the former comparison (Graph 9b) allows us to assess the effects brought about by the changes in pension legislation introduced with the 2004 pension reform (law 234/2004), whilst the latter (Graph 9c) shows the impact due to the revision of the
obtained by increasing the probabilities that a pensioner will continue to work.
186
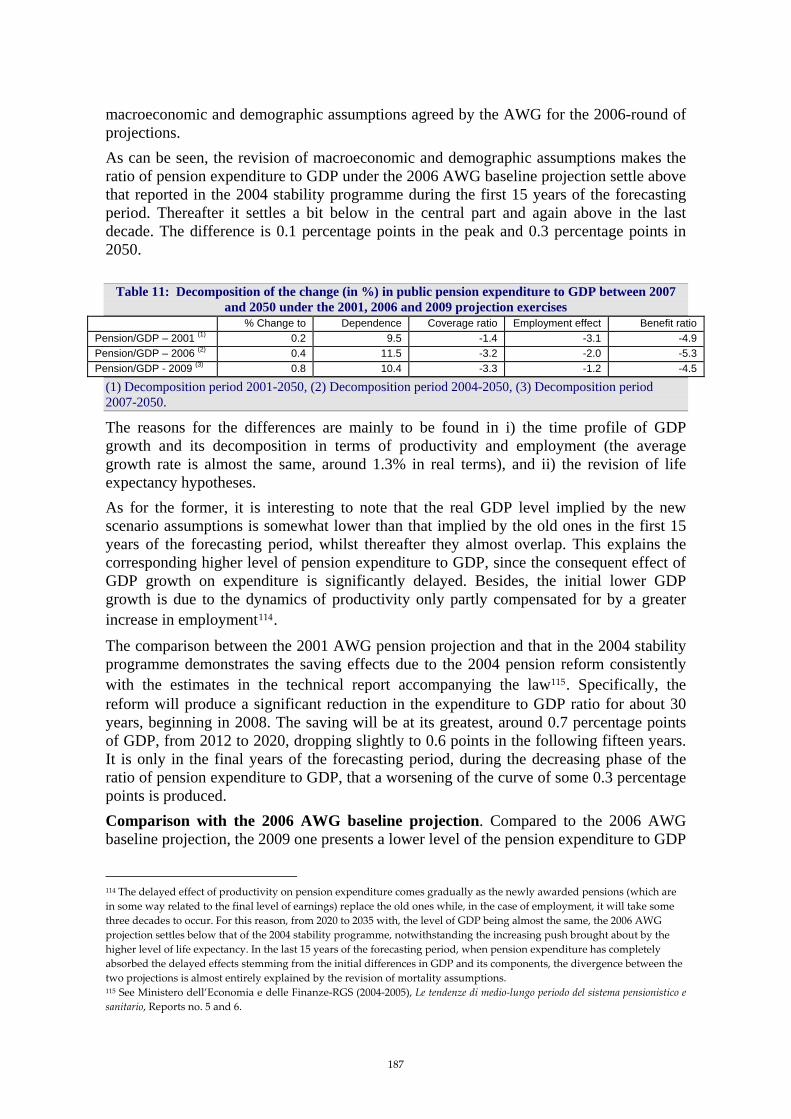
macroeconomic and demographic assumptions agreed by the AWG for the 2006-round of projections. As can be seen, the revision of macroeconomic and demographic assumptions makes the ratio of pension expenditure to GDP under the 2006 AWG baseline projection settle above that reported in the 2004 stability programme during the first 15 years of the forecasting period. Thereafter it settles a bit below in the central part and again above in the last decade. The difference is 0.1 percentage points in the peak and 0.3 percentage points in 2050.
Table 11: Decomposition of the change (in %) in public pension expenditure to GDP between 2007 and 2050 under the 2001, 2006 and 2009 projection exercises
% Change to Dependence Coverage ratio Employment effect Benefit ratio Pension/GDP – 2001 (1) 0.2 9.5 -1.4 -3.1 -4.9 Pension/GDP – 2006 (2) 0.4 11.5 -3.2 -2.0 -5.3 Pension/GDP - 2009 (3) 0.8 10.4 -3.3 -1.2 -4.5
(1) Decomposition period 2001-2050, (2) Decomposition period 2004-2050, (3) Decomposition period 2007-2050.
The reasons for the differences are mainly to be found in i) the time profile of GDP growth and its decomposition in terms of productivity and employment (the average growth rate is almost the same, around 1.3% in real terms), and ii) the revision of life expectancy hypotheses. As for the former, it is interesting to note that the real GDP level implied by the new scenario assumptions is somewhat lower than that implied by the old ones in the first 15 years of the forecasting period, whilst thereafter they almost overlap. This explains the corresponding higher level of pension expenditure to GDP, since the consequent effect of GDP growth on expenditure is significantly delayed. Besides, the initial lower GDP growth is due to the dynamics of productivity only partly compensated for by a greater increase in employment114. The comparison between the 2001 AWG pension projection and that in the 2004 stability programme demonstrates the saving effects due to the 2004 pension reform consistently with the estimates in the technical report accompanying the law115. Specifically, the reform will produce a significant reduction in the expenditure to GDP ratio for about 30 years, beginning in 2008. The saving will be at its greatest, around 0.7 percentage points of GDP, from 2012 to 2020, dropping slightly to 0.6 points in the following fifteen years. It is only in the final years of the forecasting period, during the decreasing phase of the ratio of pension expenditure to GDP, that a worsening of the curve of some 0.3 percentage points is produced.
Comparison with the 2006 AWG baseline projection. Compared to the 2006 AWG baseline projection, the 2009 one presents a lower level of the pension expenditure to GDP
114 The delayed effect of productivity on pension expenditure comes gradually as the newly awarded pensions (which are in some way related to the final level of earnings) replace the old ones while, in the case of employment, it will take some three decades to occur. For this reason, from 2020 to 2035 with, the level of GDP being almost the same, the 2006 AWG projection settles below that of the 2004 stability programme, notwithstanding the increasing push brought about by the higher level of life expectancy. In the last 15 years of the forecasting period, when pension expenditure has completely absorbed the delayed effects stemming from the initial differences in GDP and its components, the divergence between the two projections is almost entirely explained by the revision of mortality assumptions. 115 See Ministero dell’Economia e delle Finanze-RGS (2004-2005), Le tendenze di medio-lungo periodo del sistema pensionistico e sanitario, Reports no. 5 and 6.
187

ratio. The difference accounts for about 0.4 percentage points around 2035 and becomes nil in 2050. The reason for this difference is to be found in the following three factors: – the revision of GDP time series carried out by Istat (National Institute of Statistics) for
the period 2001-2004116 and the downward correction of short term GDP dynamics. – changes in pension legislation mainly concerning the implementation of the 23rd July
agreement between government and social partners (laws 127/2007 and 247/2007); – the adoption of new demographic and macroeconomic assumptions agreed in AWG for
the 2009 round of projections. Since pension projections based on AWG baseline scenario are updated yearly to take into account changes in legislation and starting data, the impact of each factor listed above may by analysed by comparing consecutive updates of AWG baseline projections made in the past. In this regard, the baseline projections elaborated for the yearly updating of the stability programmes fit this purpose well. In fact, the effect of the revision of GDP time series and those brought about by changes in short-term GDP dynamics may be assessed by comparing the AWG baseline projection elaborated in view of the 2006 round of AWG projections and its first update, published in the 2006 stability programme. Furthermore, the effects of changes in pension legislation may be analysed by comparing the latter with the second update of AWG baseline projection published in the 2007 stability programme. Finally, the effects brought about by the revision of demographic and macroeconomic assumptions may be evaluated by comparing the current baseline projection and that of the 2007 stability programme. All of these projections are suitably compared in Graph 10. However, it should be borne in mind that differences at the beginning of the forecasting period may also reflect the updating of macroeconomic variables in the starting year and their possible short-term realignment with those foreseen in the baseline scenario117. The revision of the GDP time series for the period 2001-2004 has caused the GDP level in 2004 to be higher by 2.8% than that in the previous time series. In 2005, the pension expenditure to GDP ratio was 0.3 percentage points lower. Because of this revision alone, the projected ratio between pension expenditure and GDP should have been correspondently lower for the entire forecasting period. However, as can be seen in Graph 10b, the two curves almost overlap in the first part of the forecasting period, showing a difference of the same order of magnitude as that implied by the GDP time series revision only in the second half. The initial overlapping is caused by the downward revision of the short-term GDP growth rates originally foreseen in the AWG baseline scenario, to make them consistent with both the historical growth rates and those assumed for the medium term. However, the effect due to the lower GDP growth assumed for that period in the 2006 stability programme projection is gradually compensated for by the delayed effects on pension expenditure. Graph 10c allows us to evaluate the differences in the pension expenditure to GDP ratio brought about by legislative changes passed in 2007. In particular, the increase of low amount pensions results in a higher level of pension expenditure of 0.1 percentage point for the entire forecasting period, starting from 2007118. On the other hand, the slowdown
116 Such revision was communicated by Istat with a note of the 1st March 2006. 117 In this regard, any changes in the starting value reflect a revision of GDP growth, whilst pension expenditure has always resulted in line with the forecasts. 118 In 2007, the increase was somewhat lower than that of the following years. However, because of rounding figures to the first digit after the dot, both account for 0.1 percentage points in terms of GDP.
188
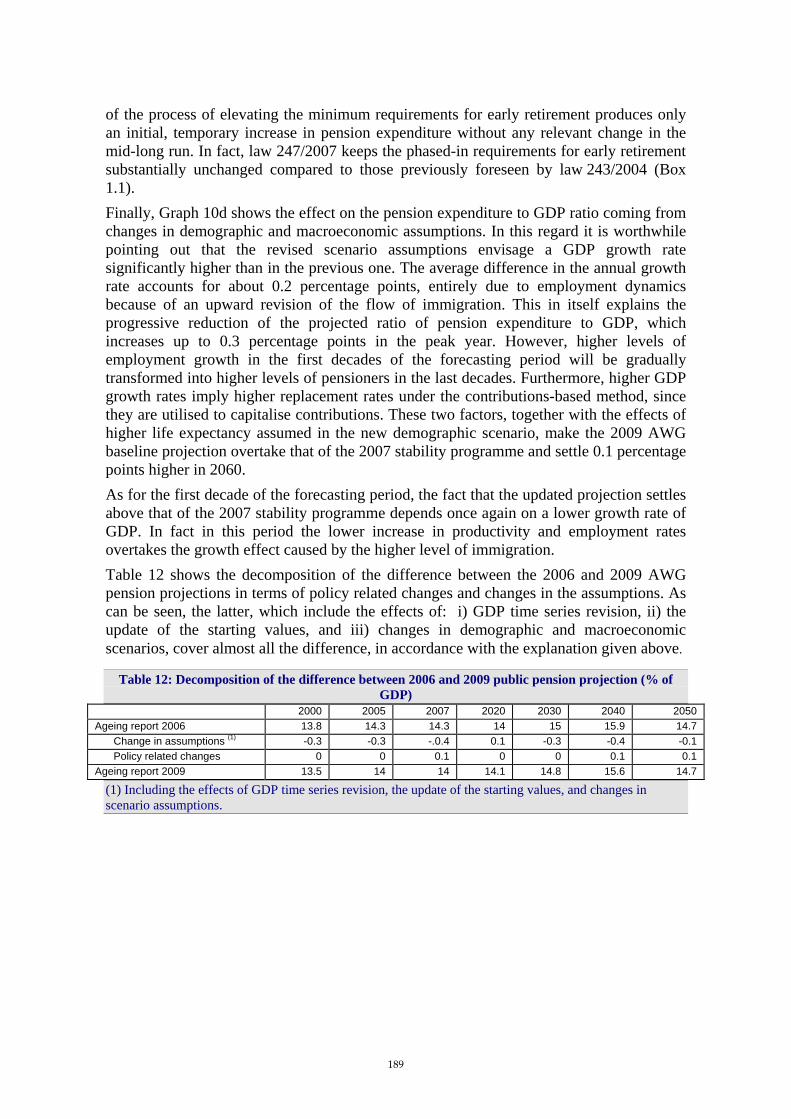
of the process of elevating the minimum requirements for early retirement produces only an initial, temporary increase in pension expenditure without any relevant change in the mid-long run. In fact, law 247/2007 keeps the phased-in requirements for early retirement substantially unchanged compared to those previously foreseen by law 243/2004 (Box 1.1). Finally, Graph 10d shows the effect on the pension expenditure to GDP ratio coming from changes in demographic and macroeconomic assumptions. In this regard it is worthwhile pointing out that the revised scenario assumptions envisage a GDP growth rate significantly higher than in the previous one. The average difference in the annual growth rate accounts for about 0.2 percentage points, entirely due to employment dynamics because of an upward revision of the flow of immigration. This in itself explains the progressive reduction of the projected ratio of pension expenditure to GDP, which increases up to 0.3 percentage points in the peak year. However, higher levels of employment growth in the first decades of the forecasting period will be gradually transformed into higher levels of pensioners in the last decades. Furthermore, higher GDP growth rates imply higher replacement rates under the contributions-based method, since they are utilised to capitalise contributions. These two factors, together with the effects of higher life expectancy assumed in the new demographic scenario, make the 2009 AWG baseline projection overtake that of the 2007 stability programme and settle 0.1 percentage points higher in 2060. As for the first decade of the forecasting period, the fact that the updated projection settles above that of the 2007 stability programme depends once again on a lower growth rate of GDP. In fact in this period the lower increase in productivity and employment rates overtakes the growth effect caused by the higher level of immigration. Table 12 shows the decomposition of the difference between the 2006 and 2009 AWG pension projections in terms of policy related changes and changes in the assumptions. As can be seen, the latter, which include the effects of: i) GDP time series revision, ii) the update of the starting values, and iii) changes in demographic and macroeconomic scenarios, cover almost all the difference, in accordance with the explanation given above.
Table 12: Decomposition of the difference between 2006 and 2009 public pension projection (% of GDP)
2000 2005 2007 2020 2030 2040 2050 Ageing report 2006 13.8 14.3 14.3 14 15 15.9 14.7
Change in assumptions (1) -0.3 -0.3 -.0.4 0.1 -0.3 -0.4 -0.1 Policy related changes 0 0 0.1 0 0 0.1 0.1
Ageing report 2009 13.5 14 14 14.1 14.8 15.6 14.7
(1) Including the effects of GDP time series revision, the update of the starting values, and changes in scenario assumptions.
189

Graph 4: pension expenditure as a percentage of GDP and its decomposition – A comparison between
two hypotheses on life expectancy
Figure 4a: percentage ratio of expenditure to GDP Figure 4d: percentage ratio of pensions to people of 65 and over
Figure 4b: percentage ratio of average pension to labour productivity
Figure 4e: percentage ratio of people employed to population aged [20-64]
Figure 4c: percentage ratio of pensions to employees Figure 4f: percentage ratio of people of 65 and over to population aged [20-64]
Figure 4: pension expenditure as a percentage of GDP and its decompositionA comparison between two hypotheses on life expectancy
8%
10%
12%
14%
16%
18%
12%
13%
14%
15%
16%
17%
18%
60%
70%
80%
90%
100%
110%
120%
130%
100%
120%
140%
160%
180%
200%
40%
50%
60%
70%
80%
90%
100%
20%
30%
40%
50%
60%
70%
baseline baseline + higher life expectancy (increase of 1 year in 2060)
190

Graph 5: Pension expenditure as a percentage of GDP and its decomposition – A comparison between
two hypotheses on migration flows
Figure 5a: percentage ratio of expenditure to GDP Figure 5d: percentage ratio of pensions to people of 65 and over
Figure 5b: percentage ratio of average pension to labour productivity
Figure 5e: percentage ratio of people employed to population aged [20-64]
Figure 5c: percentage ratio of pensions to employees Figure 5f: percentage ratio of people of 65 and over to population aged [20-64]
Figure 5: pension expenditure as a percentage of GDP and its decomposition A comparison between two hypotheses on migration flows
8%
10%
12%
14%
16%
18%
12%
13%
14%
15%
16%
17%
18%
19%
20%
60%
70%
80%
90%
100%
110%
120%
130%
140%
150%
160%
100%
120%
140%
160%
180%
200%
40%
50%
60%
70%
80%
90%
100%
20%
30%
40%
50%
60%
70%
80%
90%
baseline baseline + zero migration
191
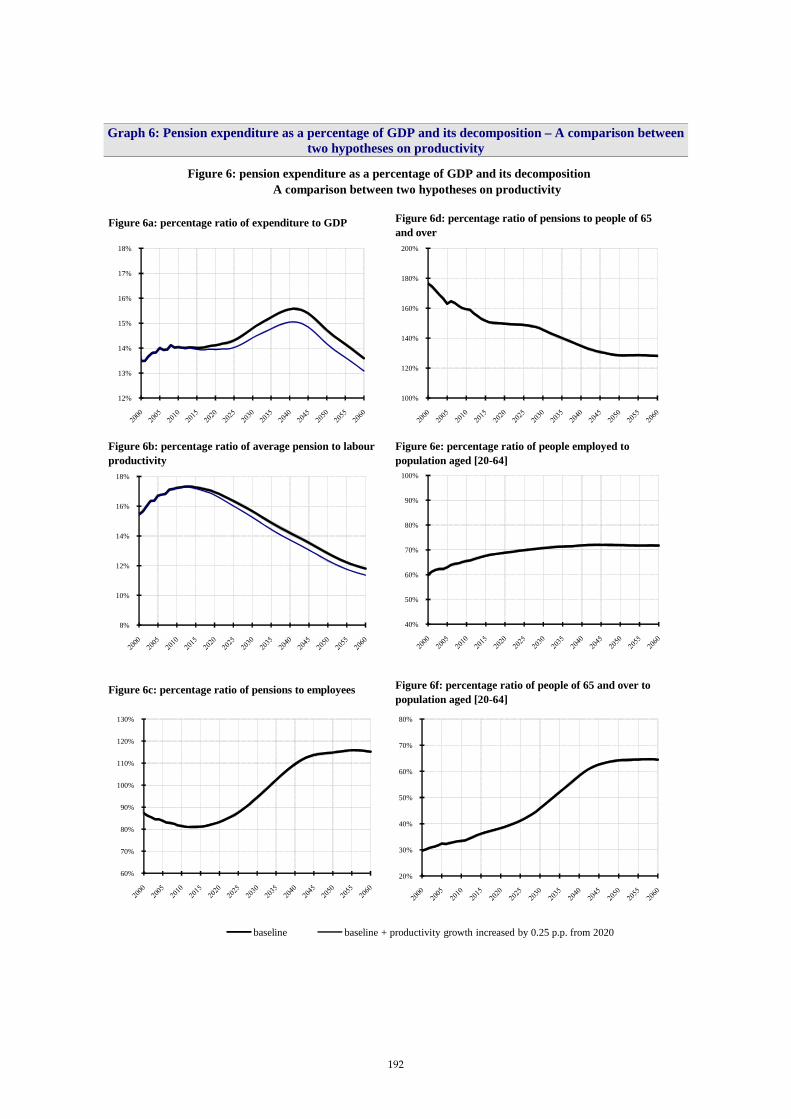
Graph 6: Pension expenditure as a percentage of GDP and its decomposition – A comparison between
two hypotheses on productivity
Figure 6a: percentage ratio of expenditure to GDP Figure 6d: percentage ratio of pensions to people of 65 and over
Figure 6b: percentage ratio of average pension to labour productivity
Figure 6e: percentage ratio of people employed to population aged [20-64]
Figure 6c: percentage ratio of pensions to employees Figure 6f: percentage ratio of people of 65 and over to population aged [20-64]
Figure 6: pension expenditure as a percentage of GDP and its decomposition A comparison between two hypotheses on productivity
8%
10%
12%
14%
16%
18%
12%
13%
14%
15%
16%
17%
18%
60%
70%
80%
90%
100%
110%
120%
130%
100%
120%
140%
160%
180%
200%
40%
50%
60%
70%
80%
90%
100%
20%
30%
40%
50%
60%
70%
80%
baseline baseline + productivity growth increased by 0.25 p.p. from 2020
192

Graph 7: Pension expenditure as a percentage of GDP and its decomposition – A comparison between
two hypotheses on participation rate
Figure 7a: percentage ratio of expenditure to GDP Figure 7d: percentage ratio of pensions to people of 65 and over
Figure 7b: percentage ratio of average pension to labour productivity
Figure 7e: percentage ratio of people employed to population aged [20-64]
Figure 7c: percentage ratio of pensions to employees Figure 7f: percentage ratio of people of 65 and over to population aged [20-64]
Figure 7: pension expenditure as a percentage of GDP and its decomposition A comparison between two hypotheses on participation rate
8%
10%
12%
14%
16%
18%
12%
13%
14%
15%
16%
17%
18%
60%
70%
80%
90%
100%
110%
120%
130%
100%
120%
140%
160%
180%
200%
40%
50%
60%
70%
80%
90%
100%
0%
10%
20%
30%
40%
50%
60%
70%
baseline baseline + older workers partecipation rate increased by 5 p.p. from 2010 to 2020
193

Graph 8: Pension expenditure as a percentage of GDP and its decomposition – A comparison between
two hypotheses on unemployment rate
Figure 8a: percentage ratio of expenditure to GDP Figure 8d: percentage ratio of pensions to people of 65 and over
Figure 8b: percentage ratio of average pension to labour productivity
Figure 8e: percentage ratio of people employed to population aged [20-64]
Figure 8c: percentage ratio of pensions to employees Figure 8f: percentage ratio of people of 65 and over to population aged [20-64]
Figure 8: pension expenditure as a percentage of GDP and its decomposition A comparison between two hypotheses on unemployment rate
8%
10%
12%
14%
16%
18%
12%
13%
14%
15%
16%
17%
18%
60%
70%
80%
90%
100%
110%
120%
130%
100%
120%
140%
160%
180%
200%
40%
50%
60%
70%
80%
90%
100%
20%
30%
40%
50%
60%
70%
80%
baseline baseline + unemployment rate lowered by 1 p.p. from 2010 to 2020
194
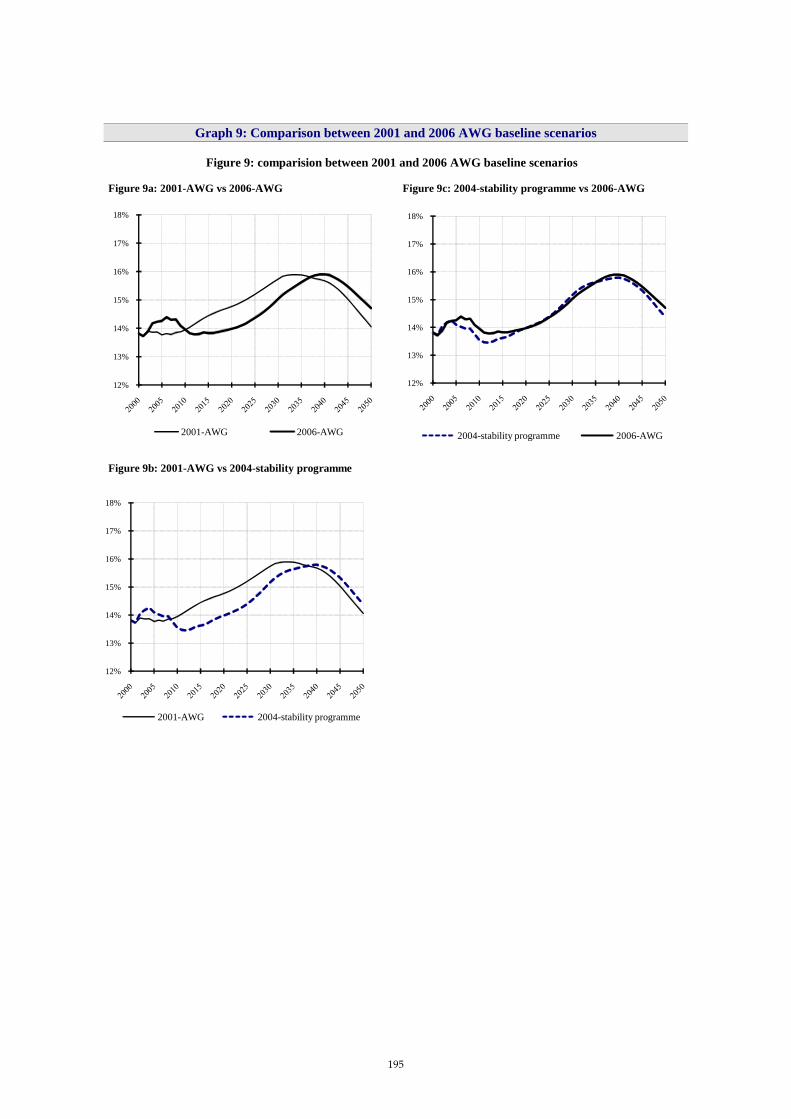
Graph 9: Comparison between 2001 and 2006 AWG baseline scenarios
Figure 9a: 2001-AWG vs 2006-AWG Figure 9c: 2004-stability programme vs 2006-AWG
Figure 9b: 2001-AWG vs 2004-stability programme
Figure 9: comparision between 2001 and 2006 AWG baseline scenarios
12%
13%
14%
15%
16%
17%
18%
12%
13%
14%
15%
16%
17%
18%
2001-AWG 2006-AWG 2004-stability programme 2006-AWG
12%
13%
14%
15%
16%
17%
18%
2001-AWG 2004-stability programme
195
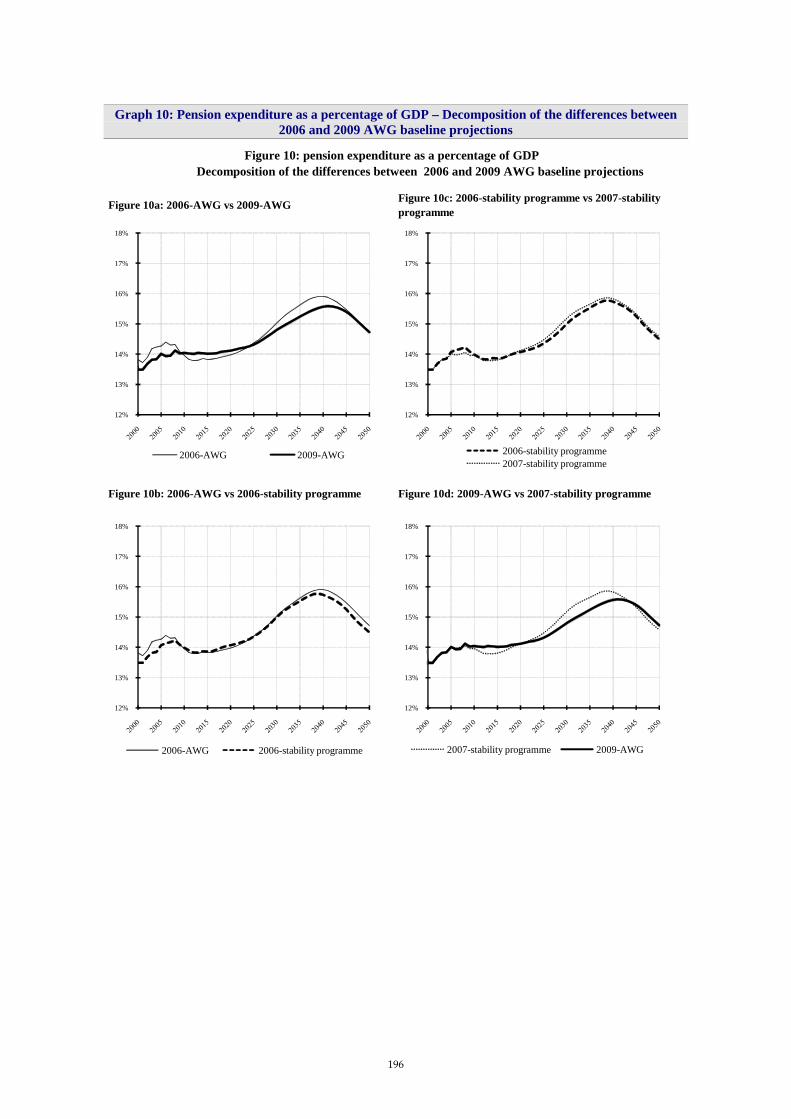
Graph 10: Pension expenditure as a percentage of GDP – Decomposition of the differences between 2006 and 2009 AWG baseline projections
Figure 10a: 2006-AWG vs 2009-AWG Figure 10c: 2006-stability programme vs 2007-stability programme
Figure 10b: 2006-AWG vs 2006-stability programme Figure 10d: 2009-AWG vs 2007-stability programme
Figure 10: pension expenditure as a percentage of GDP Decomposition of the differences between 2006 and 2009 AWG baseline projections
12%
13%
14%
15%
16%
17%
18%
12%
13%
14%
15%
16%
17%
18%
2006-stability programme2006-AWG 2009-AWG2007-stability programme
12%
13%
14%
15%
16%
17%
18%
12%
13%
14%
15%
16%
17%
18%
2007-stability programme 2009-AWG2006-AWG 2006-stability programme
196
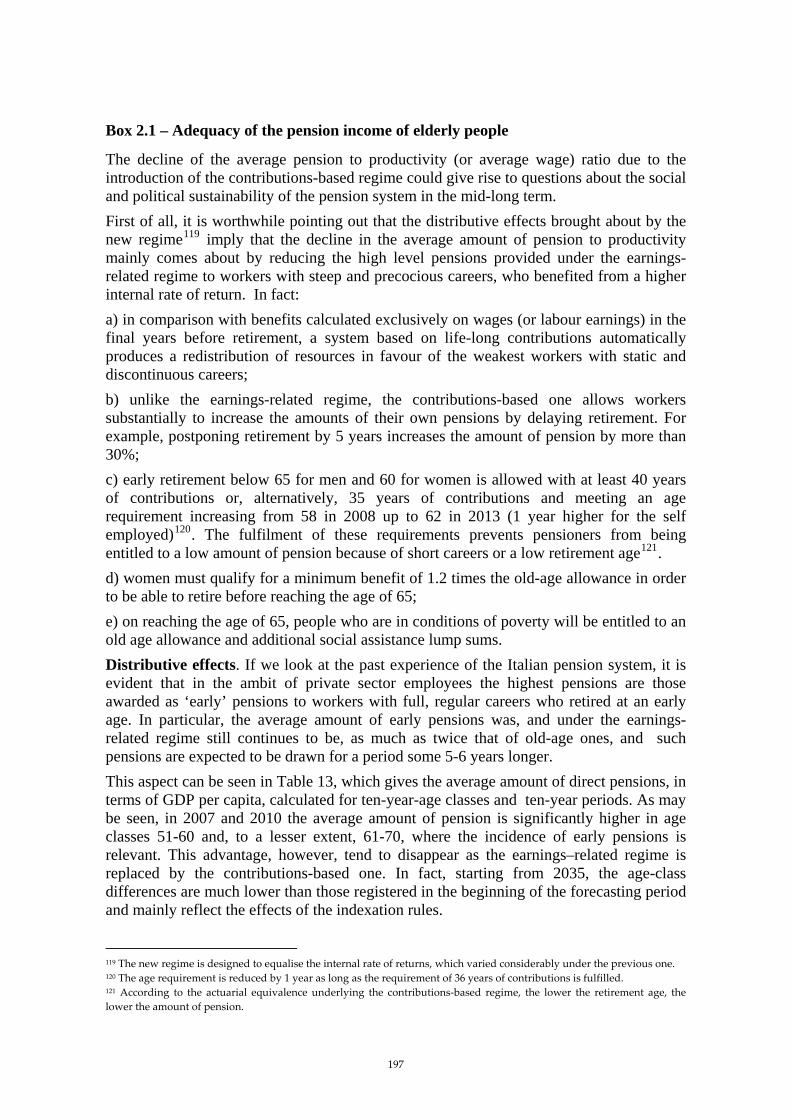
Box 2.1 – Adequacy of the pension income of elderly people
The decline of the average pension to productivity (or average wage) ratio due to the introduction of the contributions-based regime could give rise to questions about the social and political sustainability of the pension system in the mid-long term. First of all, it is worthwhile pointing out that the distributive effects brought about by the new regime119 imply that the decline in the average amount of pension to productivity mainly comes about by reducing the high level pensions provided under the earnings-related regime to workers with steep and precocious careers, who benefited from a higher internal rate of return. In fact: a) in comparison with benefits calculated exclusively on wages (or labour earnings) in the final years before retirement, a system based on life-long contributions automatically produces a redistribution of resources in favour of the weakest workers with static and discontinuous careers; b) unlike the earnings-related regime, the contributions-based one allows workers substantially to increase the amounts of their own pensions by delaying retirement. For example, postponing retirement by 5 years increases the amount of pension by more than 30%; c) early retirement below 65 for men and 60 for women is allowed with at least 40 years of contributions or, alternatively, 35 years of contributions and meeting an age requirement increasing from 58 in 2008 up to 62 in 2013 (1 year higher for the self employed)120. The fulfilment of these requirements prevents pensioners from being entitled to a low amount of pension because of short careers or a low retirement age121. d) women must qualify for a minimum benefit of 1.2 times the old-age allowance in order to be able to retire before reaching the age of 65; e) on reaching the age of 65, people who are in conditions of poverty will be entitled to an old age allowance and additional social assistance lump sums. Distributive effects. If we look at the past experience of the Italian pension system, it is evident that in the ambit of private sector employees the highest pensions are those awarded as ‘early’ pensions to workers with full, regular careers who retired at an early age. In particular, the average amount of early pensions was, and under the earnings- related regime still continues to be, as much as twice that of old-age ones, and such pensions are expected to be drawn for a period some 5-6 years longer. This aspect can be seen in Table 13, which gives the average amount of direct pensions, in terms of GDP per capita, calculated for ten-year-age classes and ten-year periods. As may be seen, in 2007 and 2010 the average amount of pension is significantly higher in age classes 51-60 and, to a lesser extent, 61-70, where the incidence of early pensions is relevant. This advantage, however, tend to disappear as the earnings–related regime is replaced by the contributions-based one. In fact, starting from 2035, the age-class differences are much lower than those registered in the beginning of the forecasting period and mainly reflect the effects of the indexation rules.
119 The new regime is designed to equalise the internal rate of returns, which varied considerably under the previous one. 120 The age requirement is reduced by 1 year as long as the requirement of 36 years of contributions is fulfilled. 121 According to the actuarial equivalence underlying the contributions-based regime, the lower the retirement age, the lower the amount of pension.
197
Theoretical replacement rate. Apart from the distributive effect mentioned above, the adequacy of benefits need to be assessed in terms of the disposable income of a pensioner before and after retirement. In fact, considering that workers pay contributions to the public pension system which are entirely deductible and that income tax is progressive, net replacement rates are significantly higher than gross ones, all else being equal. Graph 11 shows the evolution of gross and net replacement rates calculated on the basis of the methodology agreed within the Indicator Subgroup of the Social Protection Committee and assuming a dynamic for wages (or labour earnings) and GDP consistent with the AWG-baseline scenario. Calculations have been made for a private sector employee122 and for a self-employed one, in order to take account of the different contribution rates (33% against 20%). A worker retiring at the age of 63 with 35 years of contribution has been taken as a basic example, this being considered representative of average worker behaviour, on the basis of the current pension legislation. As can be seen, at the and of the forecasting period net replacement rates settle above the gross one by more than 10 percentage points for an employee and nearly 15 percentage points for the self-employed. Furthermore, still in agreement with the methodology agreed within the Indicator Subgroup, a private sector employee may supplement his or her public pension with an additional income from a private pension fund on the basis of the transfer of the annual flow of severance pay (‘Trattamento di fine rapporto’), which accounts for 6,91% of the wage. For the sake of comparability, the same percentage of financing has been assumed for the self-employed. The calculations given in Graph 11 show a further increase in terms of the net replacement rate of about 12 percentage points for an employee, and about twice as much for the self-employed. In the latter case, the effect is much stronger because the contribution to the private pension fund is deductible from income, while the annual flow of severance pay is already excluded from gross wages. A safety net. The old age allowance and other social assistance lump sums represent the safety net of the public pension system insofar as they are available for poor elderly people, regardless of any contribution record. Despite the fact that legislation governing these social benefits is quite complicated, the effects in terms of a safety net may be summarised as follows: the public pension system, through old age allowances and additional lump sums, guarantees to all elderly people of 70 years and over a personal income not less than 7,540 if single, and for a couple an income not less than 12,683, if married. These income thresholds are reduced to 5,311 and 11,071, respectively, for the age bracket 65-69 (paragraph 1.2.3). Such a difference depends solely on the amount of social assistance additional lump sums.
122 The results are almost the same for a public sector employee, as the contribution rate is the same.
198
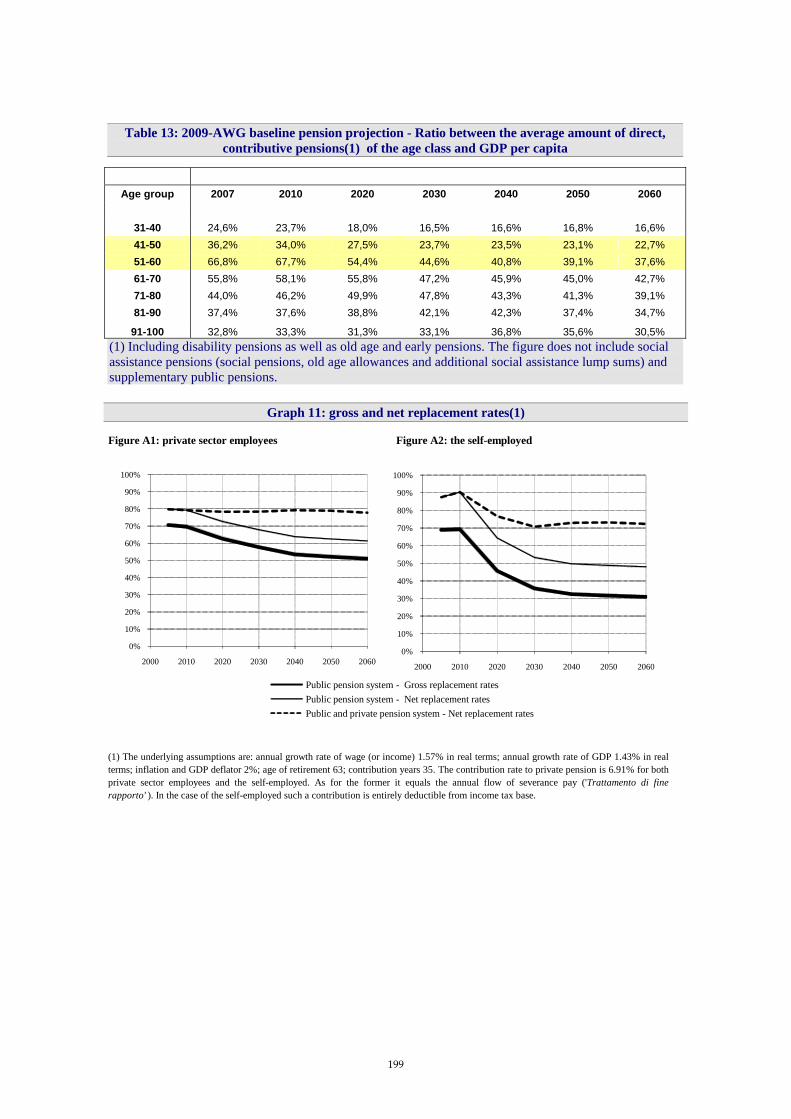
Table 13: 2009-AWG baseline pension projection - Ratio between the average amount of direct,
contributive pensions(1) of the age class and GDP per capita
Age group 2007 2010 2020 2030 2040 2050 2060
31-40 24,6% 23,7% 18,0% 16,5% 16,6% 16,8% 16,6% 41-50 36,2% 34,0% 27,5% 23,7% 23,5% 23,1% 22,7% 51-60 66,8% 67,7% 54,4% 44,6% 40,8% 39,1% 37,6% 61-70 55,8% 58,1% 55,8% 47,2% 45,9% 45,0% 42,7% 71-80 44,0% 46,2% 49,9% 47,8% 43,3% 41,3% 39,1% 81-90 37,4% 37,6% 38,8% 42,1% 42,3% 37,4% 34,7%
91-100 32,8% 33,3% 31,3% 33,1% 36,8% 35,6% 30,5% (1) Including disability pensions as well as old age and early pensions. The figure does not include social assistance pensions (social pensions, old age allowances and additional social assistance lump sums) and supplementary public pensions.
Graph 11: gross and net replacement rates(1)
Figure A1: private sector employees Figure A2: the self-employed
Figure 1a: private sector employees
(1) The underlying assumptions are: annual growth rate of wage (or income) 1.57% in real terms; annual growth rate of GDP 1.43% in realterms; inflation and GDP deflator 2%; age of retirement 63; contribution years 35. The contribution rate to private pension is 6.91% for bothprivate sector employees and the self-employed. As for the former it equals the annual flow of severance pay ('Trattamento di finerapporto' ). In the case of the self-employed such a contribution is entirely deductible from income tax base.
0%
10%
20%
30%
40%
50%
60%
70%
80%
90%
100%
2000 2010 2020 2030 2040 2050 20600%
10%
20%
30%
40%
50%
60%
70%
80%
90%
100%
2000 2010 2020 2030 2040 2050 2060
Public pension system - Gross replacement ratesPublic pension system - Net replacement ratesPublic and private pension system - Net replacement rates
199

Cyprus (Report prepared by Zenon Kontolemis, Maria Matsi and Costas Stavrakis)
1. Overview of the pension system
1.1. Introduction
The General Social Insurance Scheme was introduced in 1957 and since the 1964 reform extends compulsory insurance to every person gainfully employed in Cyprus, both in public and private sector, including all categories of self-employed. A major reform in 1980 introduced an earnings-related insurance scheme, replacing the previous scheme of flat-rate contributions and benefits. Formally speaking, according to the Social Security Law the system is meant to be partially funded, with the annual surplus deposited to a special reserve of the Social Security Fund (SSF). By law the size of the fund is determined as a multiple of the total annual obligations. An actuarial review should be conducted every three-years to determine the adequacy of the system to deal with future obligations and to recommend reforms if these are deemed necessary to safeguard the sustainability of the SSF. In practice, however, the fund has been operating de facto as a pay-as you-go with the annual contributions invested almost exclusively in non-tradable government securities. The size of this reserve is of the order of 36% of GDP in 2007. The projected pension liabilities which presented in this report depend, among other things, on two important factors. The first is, of course, the demographic change which is taking place due to ageing populations and which is the main motivation for conducting this study in the first place. Secondly, to a significant extent the projected increased expenditure is due to the ongoing maturing of the post-1980 social security system which implies that pensions will increase significantly during the next two decades as workers completing a minimum number of working years benefit from the supplementary part of the Social Security System. Another factor which is relevant for the sustainability of the pension system in Cyprus is the low level of taxation (direct and indirect) and of social security contributions. Both the relative low level of the standard VAT rate, at 15%, and social security contributions, at 16.6% (for employed persons), leave considerable room for the authorities to adjust taxes to tackle the sustainability problem.
The Social Security System Overview of Pension System The current pension system in Cyprus comprises:
The General Social Insurance Scheme The Social Pension Scheme The Special Allowance to pensioners Supplementary occupational pension provision
200

• The Government Employees Pension Scheme • Other Public Sector Employees Pension Schemes • The Voluntary Provident Funds and other similar collective
arrangements. In 2005 total pension expenditure was estimated to be €929 million or 6.8% of GDP. Of this amount, around 65% is accounted for by pensions paid under the general Social Insurance Scheme, nearly 22% under earnings-related pension schemes for central government, and nearly 5% under voluntary private provident fund payments and semi-government employees pension schemes. The remaining 8% represented pension income support through over programmes. The projections of the 2009 AWG pension exercise cover the expenditure of General Social Insurance Scheme and the Government Employees Pension Scheme, which in total represent more than 87% of the total pension expenditure or 6% of GDP. The General Social Insurance Scheme The General Social Insurance Scheme provides very comprehensive benefits which consist of the basic benefit – related to insurable earnings in the lower band - and the supplementary benefit – related to insurable earnings in the upper band. It includes the following benefits:
Short-term benefits: • Sickness benefit • Maternity benefit • Marriage grant
Unemployment benefit Employment injury benefit (in cash and in kind) Long-term benefits
• Old age pension • Invalidity pension • Survivors´ pension • Orphan's benefit
Old-age pensions under the General Social Insurance Scheme represent the main source of income for retirees. The pensionable age under the Social Insurance Scheme is 65 years for both men and women; however, an insured person is entitled to old age pension (without reduction) at the age of 63 years if:
(i) he or she has paid contributions in at least three years and his/her insurable
earnings in the lower band are not less than 156 times the weekly basic earnings, and
(ii) has a weekly average of insurable earnings (paid or credited) in the lower band at least 70% of the weekly amount of the basic insurable earnings (paid or credited).
Retiring before reaching the pensionable age of 65 under the general Social Insurance Scheme is very common. The effective retirement age for pensioners is 63.6 years.
201

The level of old-age pensions under the General Social Insurance Scheme depends on the length of the contribution period and the level of insurable earnings. Pension benefits have two components: a basic pension and a supplementary pension based on the level of insurable earnings. The earnings on which contributions and benefits are calculated (insurable earnings), are divided into a “lower” and an “upper” band, with the “lower band” consisting of earnings up to a certain “basic” level (the amount of the basic insurable earnings changes from year to year and for 2007 is €141.25 per week or €7345 a year. The “upper band,” consists of earnings in excess of the “basic” level up to a maximum limit of six times the threshold of the lower band. Insured persons are credited each year with “insurance points”. One insurance point is credited for each multiple of the yearly amount of basic earnings of the following year (in 2007, one point is credited for every €7668. The weekly amount of the old-age pension is composed of:
a basic pension equal to 60% of the average weekly insurable earnings123 in the lower band for a beneficiary without dependants, 80% for a beneficiary with one dependant, 90% for a beneficiary with two dependants and 100% for a beneficiary with three or more dependants, and
a supplementary pension equal to 1/52 of 1.5% multiplied by the number of insurance points in the "upper" band, multiplied by the amount of the basic insurable earnings at the time the payment starts
A minimum pension is paid to insured persons who are eligible for old-age pension and their total basic and supplementary pension is less than that amount of minimum pension. The monthly amount of minimum for 2007 was €288.17. The minimum pension is paid 13 times a year and is adjusted every year in the same way as the basic pension. The basic pension is indexed yearly to annual increase of the average insurable earnings and the supplementary pension is indexed to the consumer price index. Total contribution rates for the General Social Insurance Scheme differ between the employed and self-employed persons. Contribution rates for employed persons are 12.6% of their insurable earnings, shared equally between the employer and the employee and 11.6% for the self-employed. The central government contributes the equivalent of 4% of insurable earnings. Out of the total 16.6 percent social insurance contribution rate, around 8.7 and 5.6 percentage points are attributed to the long-term benefits of the basic and supplementary pensions respectively. Consequently, with a PAYG contribution rate124 of around 8.7% for the basic lower pension band and 3.5% for the supplementary upper pension band, the pension system is currently financially covered and produces a surplus under the supplementary part. The scheme is at an early stage of its maturity with the number of contributors well in excess of the number of pensioners. Indeed, the surplus in the social insurance funds accounts was €411 million or 2.6% of GDP in 2007 and resulted in the reserves of the General Social Insurance Scheme accumulating to €5.7 billion or 36% of GDP by the end of 2007.
123 The average weekly insurable earnings in the lower band is equal to the number of insurance points in the lower band, multiplied by the amount of the basic insurable earnings at the time the payment starts, divided by the number of weeks since 5 October 1964 or the date on which the insured person attained the age of 16. 124 The contribution rate in a given year which is necessary to finance the respective pension expenditures in that year.
202

Following extensive discussions and dialogue with the social partners, the Government of Cyprus has decided to take measures that will ensure the long-term financial sustainability of the Social Insurance Scheme. These measures aim primarily at increasing revenue (higher contributions and higher investment returns) and, to a lesser extent, at reducing expenditure. In particular the package includes:
Increasing gradually the total contribution rate by 1.3 percentage points every five years beginning with 2009 until the current contribution of 14.3% allocated to financing pensions, reaches 23.4% in 2039.
Increasing the minimum qualifying period of paid contributions for old age pension from three to ten years and the total period, including credited contributions, from 12 to 15 years within a period of three years starting from 2009, as well as raising the minimum contribution period for entitlement to old age grant (payable where there is no entitlement to pension) from three to six years.
Restricting the crediting of contributions for full-time education for old age pension to six years.
The Social Pension Scheme The Social Pension Scheme closes the gap in accessibility to pensions by providing non-means tested pensions to those residents, of 65 years or more who, for any reason did not participate in the labour market and as a consequence have no pension income either from the General Social Insurance Scheme or from any other source. In other words, the Social Pension Scheme ensures universality in pension provision. The scheme is financed by the Consolidated Fund. The beneficiaries are mostly women (about 95%), who were either urban housewives or non-insured wives or unmarried daughters of farmers engaged in family agricultural work. The rate of the Social Pension is equivalent to 81% of the full basic social insurance pension, and as a consequence, is automatically indexed to earnings. The monthly amount of social pension for 2007 was €274.61. Special Allowance to pensioners A special allowance, currently amounting to up to €1,538 per year, is payable to pensioners whose total pension income from the General Social Insurance Scheme and any other pension scheme does not exceed €11,106 per year. It is paid without any test of income from work or other sources and without taking into account the household total pension income, since each pensioner is treated as a member of a single person household. This allowance is financed by the Consolidated Fund. The Government Employees Pension Scheme The Government Employees Pension Scheme provides retirement and survivors pensions to civil servants, members of the educational service, the police and the armed forces. It is financed almost entirely by general taxation on a pay-as-you-go basis. The number of active members is currently about 31,000 and old-age pensioners about 12,000. Pensions are calculated on the final salary at an accrual rate that produces a retirement benefit equivalent to two thirds of that salary after 33 1/3 years of service. Pension benefits are integrated to those provided under the General Social Insurance Scheme. In particular, the pension is 50% of the final salary, but it is reduced by the amount of
203

supplementary Social Insurance pension from the time the retiree is awarded such pension (normally at the age of 63 years). The scheme’s compulsory retirement age up to July, 2005 was 60 years, with early retirement allowed after 55 years without any actuarial reduction of benefits. In fact, the effective retirement age for central government employees has been significantly below 60 years. As from 1.7.2005 the age of compulsory retirement for civil servants will gradually increase to 63 years by 1.7.2008. The members of the police of the rank of sergeant and below retire compulsorily at 55 years; early retirement is allowed from age 50 years. Other Public Sector Employees Pension Schemes There are other occupational funded pension schemes that provide cover to permanent employees of public utility organizations, local governments and of other public law authorities under the same terms and conditions as for civil servants. It is estimated that the total number of employees covered is around 7,500 and the total size of the assets is around €2.5 bn or 16% of GDP. These pension schemes, which operate under special laws, are financed almost solely by employers and participation of employees is limited to the part of the cost of survivor's benefits. The benefits and the entitlement conditions are the same as for central government employees. Voluntary Provident Funds Provident Funds are arrangements that are agreed within the framework of the system of free collective bargaining. They provide defined contribution lump-sum benefits. However, for certain categories of employees (e.g. bank employees, employees of oil companies, government manual workers), the Provident Fund is combined with a defined benefit lump-sum based on the recent salary and the employee receives the higher of the two amounts. Provident Funds are financed by contributions from employers and employees. The number of Provident Funds for which annual returns were made in 2004, was 1820 with a total membership of about 109,800 employees. The average joint contribution was 12.6% of earnings. The total size of the assets is around €2 bn or 13% of GDP. Industry-based Provident Funds operate for certain categories of employees, like construction workers, hotel employees etc. Trade unions also operate multi-employer Provident Funds. However, most of the Provident Funds operate on an enterprise basis and are small in size. In 2004, 92% of the Provident Funds had less than 100 members. Accessibility to Pensions The prime purpose of the pension system in Cyprus is to provide access for all individuals for appropriate pension arrangements, public and/or private, which allow them to earn pension entitlements, enabling the maintenance of a reasonable standard of living after retirement. Accessibility to pensions is universal for the 65 years and over population and is ensured through the general Social Insurance Scheme and the Social Pension Scheme. The latter is of importance for women, especially of the older generations with the low labour force participation rates and the non-remunerated family work in agriculture. Accessibility to supplementary pension provisions is encouraged through tax incentives by exemption of contributions, investment income and lump-sum gratuities of pension funds and contributions, investment income and lump sum benefits of Provident Funds.
204

However, the majority of employees, around to 55%, have no supplementary protection at all, or they are covered by provisions, like Provident Funds, with serious weaknesses in terms of their effectiveness as retirement income institutions. This is due to the fact that members usually receive their entitlements at the time of changing of employers. This situation has led to substantial inequalities within the pension system as a whole, especially between the employees of the broader public sector and the majority of the employees in the private sector. These inequalities are manifested in the financing, the replacement rates and the pensionable age. Pension System: Early Retirement and Labour force Participation While the general Social Insurance Scheme and the pension schemes for public sector employees encourages early retirement, at the same time they provide incentives for maintenance of the participation of elderly workers in the labour force. Under the general Social Insurance Scheme, the average effective retirement age is 63 years and among public sector employees is around 57 years. Under these schemes, old-age pensioners have the right to continue work and earn income without prejudice to their pension benefits. Indeed, the participation rate among elderly persons (55 to 64 years) is relatively high in Cyprus being 57.7% in 2007 compared with the EU 25 average of 47.5%.
2. Pension expenditure projections
The previous 2006 AWG pension projections for Cyprus were based on the projection results of the 2003 actuarial valuation of the Social Security Scheme, which was conducted by the International Labour Organization (ILO), but augmented to take into account of the Commonly Agreed Assumptions of the AWG. Thus, the final results were probably not as precise as those results that could have been produced directly from the ILO pension model using the AWG assumptions. The present pension projections for Cyprus are produced directly from the actuarial pension model of the Social Insurance Services of the Ministry of Labour and Social Insurance, using the agreed common assumptions of the AWG. As mentioned above, the present actuarial pension model is the evolution of the ILO model and it now incorporates a small number of enhancements to better reflect the parameters of the Social Security System in Cyprus. Thus, the difference between the current and previous results can be explained by (i) the different underlying assumptions, and (ii) to a lesser extent the different model used for the projections. Table 1 shows the aggregate results of the projections for social security pensions only. Reliable data for occupational and private pensions were not available so no results are presented. The pension expenditure is expressed in percentage of GDP.
205

Table 1: Projected gross pension spending (% of GDP) 2000 2007 2020 2030 2040 2050 2060 Peak year
* Social security pensions : 6.3 8.9 10.8 12.8 15.5 17.7 2060 Old-age and early pensions
: 4.8 6.7 8.2 10.0 12.4 14.2 2060
Other Pensions : 1.4 2.2 2.6 2.8 3.1 3.5 2060 Occupational pensions : : : : : : : : Private pensions : : : : : : : : Mandatory private : : : : : : : : Non-Mandatory private : : : : : : : : Total pension expenditure : 6.3 8.9 10.8 12.8 15.5 17.7 2060 Taxes on public pensions : : : : : : : : Taxes on private pensions : : : : : : : :
* This column represents a Peak year, i.e. the year in which the particular variable reaches its maximum over the interval 2000 to 2060.
The results indicate a significant increase in pension spending over the next 50 years, with the most dramatic deterioration occurring from 2030 onwards. It is clear from the results that both old-age and early pension and other pension (which include invalidity and survivor’s pension benefits) increases during the period. Specifically old-age and early pension expenditure is projected to increase from 4.8% of GDP in 2007 to 14.2% of GDP in 2060, while other pension expenditure will increase from 1.4% to 3.5% of GDP over the same period. Total expenditure is projected to rise from 6.3% of GDP to 17.7% in 2060.
Graph 1: Projected Pension Expenditure (as % GDP): General Social Insurance Scheme vs Government Employees Pension Scheme
4.7%
7.1%
9.0%
10.6%
13.1%
15.1%
1.6% 1.8% 1.7% 2.2% 2.4% 2.5%
0%
2%
4%
6%
8%
10%
12%
14%
16%
2007 2020 2030 2040 2050 2060
GSIS pensions Government employees pensions
Graph 1 shows that the increase in social security pension expenditure between 2007 and 2060 (from 6.3% of GDP to 17.7% in 2060) primarily comes from the increase in the pension expenditure under the General Social Insurance Scheme and at a lesser extent from the government employees pension scheme expenditure. In particular, the expenditure under the General Social Insurance Scheme increases by a factor 3.2 whereas the expenditure under the Government Employees Pension Scheme increases only by a factor 1.6.
206

Table 2 presents a standard decomposition of the ratio of pension expenditures to GDP into the dependency, coverage and benefit ratio and an employment rate:
444 8444 76444 8444 764444 84444 76444 8444 76 RatioBenefitRateEmploymentRatioCoverageRatioDependency
PeopleWorkingGDP
PensionAveragePeopleWorking
PopulationPopulation
PensionersofNumberPopulationPopulation
GDPExpPension ×−×
+×
−+=
/1
6415656415
65.
Note: 'Average pension' = social security pension expenditure divided by the number of pensioners Table 2: Factors behind the public pension expenditures between 2007 and 2060 (in percentage points
of GDP) 2007-20 2020-30 2030-40 2040-50 2050-60 2007-60
Public pensions to GDP in a starting year *
2.8 1.9 2.1 2.7 2.2 11.4
Dependence ratio 1.7 2.0 1.3 2.9 2.8 10.8 Coverage ratio 0.9 0.3 0.3 0.2 0.0 1.6
1/Employment rate -0.5 0.0 0.1 0.0 0.0 -0.5 Benefit ratio 0.5 -0.4 0.3 -0.2 -0.5 -0.3
* The starting year is 2007 for the column 2007-20 and 2020 for the column 2020-30, etc
Graph 2: Factors behind the change in pension expenditure between 2007 and 2060
11.410.8
1.6
-0.5 -0.3
-2.0
0.0
2.0
4.0
6.0
8.0
10.0
12.0
P ublic pens ions Dependence ratio C overage ratio E mployment rate B enefit ratio
Pens
ion
Expe
nditu
re a
s %
of G
DP
As clearly indicated by Table 2 and Graph 2, the aforementioned significant increase in pension expenditure in Cyprus over the period 2007-60 is explained almost by the deterioration of the dependency ratio during this period, and to a much lesser extent by the increased coverage ratio. The latter is due to the expected increase in the percentage of female insured persons who meet the qualifying conditions for receiving an old-age pension at the age of 63. This is as a result of the expected increase in the female labour force participation rates and longer contribution periods. More specifically out of the 11.4 percentage point increase in total pension expenditure, 10.8 points are due to the increase dependency ratio, and 1.6 points the coverage ratio. Offsetting this positive contribution is a negative contribution stemming from:
a small increase employment rate as a result of the high expected employment growth, particularly for females, in the first decade; and
a marginal decrease in the benefit ratio, primarily due to the price indexation on benefits in the longer-term – in the first couple of decades as the supplementary part
207

of the social insurance scheme matures the average level of new pensions is expected to increase at a rate higher than that of productivity.
Table 3 shows data on the number of pensions, contributors, population and employment. Table 3: Number of pensions and contributors in the Social security scheme (in 1000), population over
65 and total employment (in 1000) and related ratios (%) 2000 2007 2020 2030 2040 2050 2060
Number of pensions (I) : 118 201 279 347 439 520 Number of people aged 65+ (II) 77 96 143 192 233 291 346 Ratio of (I) and (II) : 123 140 145 149 151 151 Number of contributors (III) : 392 509 551 591 603 607 Employment(IV) 286 379 489 531 571 581 585 Ratio of (III) and (IV) : 104 104 104 104 104 104 Ratio of (III) and (I) 'support ratio'
: 332 253 198 170 137 117
It reveals that the number of pensions will increase much faster than the number of people aged 65+. The number of pensions includes old age, invalidity as well as survivor’s pension. The number of pensions exceeds the number of people aged 65+ for two main reasons (i) the former refers to individuals who receive pension before 65 (63+) and (ii) survivors pensions, which are usually paid to females, are paid in addition to old-age pension. The projected increase in this ratio depends mainly on the significant increase of female participation in the labour market, assuming a fixed share of survivors pensions paid to females, which will eventually lead to an increase in the number of old-age pensions paid to females from age 63. Regarding the employment, the increase is mainly due to the net immigration flows and the increase in the female participation, which are assumed sizeable over the period. In line with this increase in employment, we project a similar increase in the number of contributors. However, the support ratio will decline significantly from 332 in 2007 to 117 in 2060, primarily due to the ageing effect. Therefore, over the projection period the support ratio will be reduced to one third, with only 1.2 contributors financing one social security pension in 2060. Table 4 shows the projected evolution of the reserve fund of the General Social Insurance Scheme. The size of this fund in 2007 was of the order of 36% of GDP.
Table 4: Assets of pension funds and reserves, (% of GDP) 2000 2007 2020 2030 2040 2050 2060
Public Pension funds : 36.9 32.3 9.9 -24.1 -79.4 -166.5 Of which liquid financial assets, non-
consolidated : : : : : : :
Of which liquid financial assets, consolidated : : : : : : : Occupational pensions : : : : : : : Private pensions : : : : : : : All pensions : : : : : : :
In line with the projected increase of pension expenditure, and projected revenues, it is shown that the reserve will hold assets until 2033. Thereafter it will accumulate debt obligations which will amount to some 182% of GDP by 2060.
208

Graph 3: Evolution of GSIS Reserve Ratio
-
1.0
2.0
3.0
4.0
5.0
6.0
7.0
8.0
9.0
2007 2011 2015 2019 2023 2027 2031
R e s
e r v
e R
a t i o
Graph 3 shows the evolution of the reserve ratio of the General Social Insurance Scheme. The reserve ratio, which is defined as the size of the reserve fund in a given year as proportion of the annual pension expenditure in that year, is projected to decrease from 8 in 2007 to 0 in 2033.
2.1. Sensitivity analysis The results presented previously depend heavily on the underlying macroeconomic and demographic assumptions. It is therefore useful to examine the sensitivity of pension schemes to different economic assumptions. The projected pension expenditure under the different scenarios is presented in Table 5, together with the baseline scenario for comparison purposes.
Table 5: Total and public pension expenditures under different scenarios 2007 2020 2030 2040 2050 2060
Total Pension Expenditure Baseline 6.3 8.9 10.8 12.8 15.5 17.7 Higher life expectancy 6.3 8.9 10.8 12.9 15.7 17.9 Higher lab. productivity 6.3 8.5 10.4 12.4 15.0 17.0 Higher interest rate Higher emp. rate 6.3 8.8 10.7 12.7 15.4 17.6 Higher emp. of older workers 6.3 8.8 10.7 12.8 15.5 17.6 Zero migration 6.3 10.1 13.7 18.1 23.5 27.2
Public Pension Expenditure Baseline 6.3 8.9 10.8 12.8 15.5 17.7 Higher life expectancy 6.3 8.9 10.8 12.9 15.7 17.9 Higher lab. productivity 6.3 8.5 10.4 12.4 15.0 17.0 Higher interest rate Higher emp. rate 6.3 8.8 10.7 12.7 15.4 17.6 Higher emp. of older workers 6.3 8.8 10.7 12.8 15.5 17.6 Zero migration 6.3 10.1 13.7 18.1 23.5 27.2
Graph 4 shows the deviation of the change in pension expenditure between 2007 and 2060 under the various scenarios from the change in expenditure under the baseline scenario.
209

Graph 4: Change in expenditure (as % GDP) in 2060: Deviation from baseline scenario
The striking result from Table 5 and Graph 4 is that of “zero migration” scenario, which raises total pension expenditure by 9.5% of GDP by 2060 when compared to baseline. Indeed, zero migration will have fiscal, but also serious real effects. It will imply a shrinking labour force, significantly lower growth rates and a stagnant economy for many years. On the other hand the sensitivity of the results to the other variables seems relatively limited. Graph 5 compares the projected pension expenditure figures under the AWG 2006 and 2009 exercise.
Graph 5: Pension expenditure (as % GDP): AWG 2006 vs 2009 Exercise
When compared with the 2006 AWG pension projection exercise, this represents a sizeable improvement over the period through 2050 of the order of 4.3% of GDP (2006 exercise – 19.8% vs. 2009 exercise – 15.5%). Graph 6 clearly indicates that the above improvement is primarily due to more favourable demographics.
8.0
9.9
12.2
15.0
19.8
6.9
8.9
10.8
12.8
15.5
17.7
-
5.0
10.0
15.0
20.0
25.0
2010 2020 2030 2040 2050 2060
Total Public Pension Expenditure as % of GDP 2010-2060AWG Pension Projection Exercise 2006 vs 2009
2006 AWG Exercise 2009 AWG Exercise
0
5
10
15
20
25
Baseline Higher life expectancy
Higher labour productivity
Higher employment
rate
Higher employment of older workers
Zero migration
+0.2 -0.7 -0.1 -0.1
+9.5
210

Graph 6: Old-age Dependency Rate: AWG 2006 vs 2009 Exercise
19.1%
25.5%
32.9%36.1%
43.2%
18.0%
22.3%
27.4%30.8%
37.7%
44.5%
0%
5%
10%
15%
20%
25%
30%
35%
40%
45%
50%
2010 2020 2030 2040 2050 2060
Old-Age Dependancy Rate (OADR) 2010-2060AWG Pension Projection Exercise 2006 vs 2009
2006 AWG Exercise 2009 AWG Exercise
Table 6 provides a comparison of the decomposition of the change in pension expenditure during 2007-2050 between the current and previous exercise. Table 6: Decomposition of the change (in %) in public pension expenditure to GDP between 2007 and
2050 under the 2001, 2006 and 2009 projection exercises % Change to
2050 Dependence
ratio Coverage
ratio Employment
effect Benefit ratio
Pension/GDP – 2001 * #N/A #N/A #N/A #N/A #N/A Pension/GDP – 2006 ** 12.8 10.2 1.2 -1.2 2.5 Pension/GDP - 2009 *** 9.4 8.0 1.6 -0.5 0.3
* Decomposition period 2001-2050, ** Decomposition period 2004-2050, *** Decomposition period 2007-2050.
The difference amounts to 3.4 percentage points of GDP. A more favourable dependency ratio due to improved demographics in the most recent population projection exercise explains about 2 percentage points. A lower benefit ratio implies also lower expenditure equal to some 2½ % of GDP. In contrast, both the employment effect and coverage ratio have the opposite effect that is they imply higher expenditure.
211

Latvia (Report prepared by Ilmars Snucins and Sandra Stabina)
1. Overview of the pension system
1.1. Pension system in Latvia
The Notional defined-contribution (NDC) pension scheme is functioning already since 1996, the state mandatory financially defined contribution pension scheme was launched in July 2001, and private pension funds are operating from July 1998.
1.1.1. State pensions, all included in projections
Old-age pension scheme, NDC and pay-as-you-go (PAYG) scheme The first pillar pension scheme implemented in Latvia in January 1996 is based on insurance principles, as the social insurance contributions, earmarked for old-age pensions (20 percent of wage) are recorded in the notional individual accounts, introduced in 1996, that are given a rate of return until retirement and accumulate (notional) pension capital, while real contributions are used for financing current pension expenditures. Pensions are calculated by dividing the amount accumulated in the notional account by projected cohort unisex life expectancy at retirement. A benefit can be claimed to any time from the minimum pension age and it is possible to receive full pension while continuing work after the retirement. Working pensioners continue to contribute and accumulate additional notional pension capital. This newly accrued pension capital also yields a rate of return, and the benefit is recalculated upon final retirement to include this new capital. The principle behind this is that it provides an opportunity and support for gradual withdrawal from the labour force. Minimum insurance record for taking state old age pension is 10 years. Person who has insurance period less than 10 years and has exceeded the qualifying age for old age pension by 5 years shall be granted the state social security benefit, paid by state budget. (not included in projection exercise). The transition to the retirement age of 62 is carried out on a step-by-step basis, i.e. by six months each year. Men have reached the retirement age of 62 in January 2003, but women reached it in 2008. Until 31 December 2011, the legislation provides for a possibility to retire 2 years before the age of 62, if person’s insurance record is 30 years or more (they receive 80% of normal pension amount (the full pension restored after normal retirement age). Early retirement will be eliminated after this date. Here is also possibility during transition period to take old age pension from earlier time – for persons in special cases (as disabled for life, Lilliputians, blind persons) and persons who have worked under hazardous and hard conditions. The average benefit is directly dependent on the actual pension age, number of years worked and dynamics of the contribution base (growth of the contribution wage sum in the Country), which determines the rate of return for the NDC pension capital.
212

Pensions granted before 1996 were not revised according to the rules of the NDC scheme. Nevertheless the same rules for indexation are applied for both the old-law and new-law pensioners: until 2002 pension indexation was based on the consumer price index and since 2002 – the pension index is based on the CPI and the contribution wage base125. Since January 2006 the supplementary payment for each length of period of insurance year up to 31 December 1995 have been paid to old age pensioners. Since January 2009 such supplementary payment will be paid also for disability pensioners. Amount of supplementary payment for each length of period year: from 1 January 2006 to 31 May 2008 – LVL 0.19; from 1 June 2008 to 31 December 2008 – LVL 0.40; from 1 January 2009 – not less than LVL 0.70. Disability pensions Those insured persons whose insurance record is not less than three years and they have been recognised as disabled can receive disability pension; excluded persons whose disability has been caused by an accident at work or an occupational disease. Persons with a disability resulting from an accident at work or an occupational disease shall be granted and paid indemnity (compensation) for the loss of the capacity of work. Disabled persons are divided into three categories. The Health and Working Capacity Medical Expert Commission determines the category of disability as well as the cause and anticipated duration of the disability. The disabled persons who have reached retirement age shall be granted the old age pension instead of a disability pension (disability pensioners, who reached retirement age before 1996 continue to receive disability pension – until the end of transition period). If amount of old age pension is smaller than disability pension’s amount, person continues to receive bigger amount. The same rules for indexation are applied for all state pensions. Survivor’s pensions If the breadwinner has been an insured person, his/her family members shall be entitled to a survivor’s pension irrespective of the cause of death of the breadwinner. Family members (under the age of 18) incapable of work who have been dependent on the deceased breadwinner are entitled to the survivor’s pension. Persons shall be also considered incapable of work, if at the time of the death of the breadwinner or later they are day department (full-time) students at secondary, vocational or higher educational establishment and are under the age of 24. Widow’s, who have pensions according to the old pension system, continue to receive those during the transition period. Widow’s pensions shall be paid out from the state pension special budget. 125 According to the legislation the adjustment is differentiated dependently on amount of pension. Small pensions are indexed considering the actual CPI and 50% of the real growth of contribution wage sum. The medium pensions are indexed with CPI.
213

The same rules for indexation are applied for all state pensions. Service pensions (during the transition period) Starting with January 1, 1999 the determination of insurance record entitling to service pensions shall be terminated. Only for persons, who by January 1, 1999 have worked in special qualifying occupations for not less than three fourths of the insurance period required for allocation of the service pension in accordance with special regulations shall retain their entitlement to the service pension. The service pension shall be paid out from the state pension special budget. For persons who have been granted the service pension in accordance to the special regulations and who have reached the retirement age shall be granted the old age pension instead of the service pension. It must not be smaller in amount than the service pension received prior to the allocation of the old age pension. The same rules for indexation are applied for all state pensions.
1.1.2. The state mandatory funded pension scheme, included in projections
The FDC pension scheme in Latvia started operation in July 2001. It is a fully funded statutory pension scheme, where a part of the social insurance contributions within the 20 % contribution rate for old-age pensions are invested in financial assets. Coverage in the FDC pension scheme is mandatory for persons who were under the age of 30 July 1, 2001, when the State Funded Pension Law came into force. Persons who were at that moment in the age group of 30 – 49 can affiliate to this scheme on a voluntary basis at any time. Participation conditions are simplified to a maximum extent and synchronized with the participation in the NDC PAYG pension scheme. This means that the FDC pension scheme gradually will cover almost all persons covered by the state pension insurance. However, persons who were at the age of 50, when the law came into force, have no option to participate. This scheme is expected to be fully mandatory around 2035, when cohorts of voluntary participants will gradually vanish. The share of contributions dedicated for saving in this scheme is scheduled to increase gradually, proportionally reducing contribution rate for the 1st pillar (NDC PAYG). Initially only 2 percent of the contribution wage will be transferred for the investment. Over time, the contributions, designated to the funded pension scheme, will rise gradually to 10 percent in 2011, reaching the same proportion for both pillars (10%+10% = 20%). As the financing of the state mandatory funded pension scheme is in the framework of public pension scheme, all subsidies for the individual, paid by the state budget or other social insurance budgets (in case of child care, unemployment etc.) are respectively attributed for both schemes. The State Social Insurance Agency contracts with the asset managers and insurance providers on behalf of the public sector. Until January 2003, the sole asset manager under the FDC pension scheme was the State Treasury. From January 2003, participants of the FDC pension scheme are able to choose among state or private asset managers. It is possible to change asset manager during the participation period, (but not more than once a year) and to choose investment plan (but not more then twice a year). As the state funded pension scheme is a public scheme, participant’s capital, left after the death and prior to retirement, shall be remitted to the state pension budget for financing
214

survivor’s benefits for the dependent family members (children) in accordance with the legislation for the 1st pillar. In such a case spouses have no rights for survivor’s benefits either in the NDC PAYG or in the FDC pension scheme. There are two options at retirement - at the participant’s choice the accumulated state funded pension capital will be: – added to the 1st pillar pension capital for calculation of the total old-age pension, based
on the NDC scheme formula, or – transferred to the life insurance company, which subsequently will provide a whole life
annuity.
1.1.3. Voluntary private pension scheme, not included in projections
Scheme is operating since 1st of July 1998 and the purpose of this scheme is to accumulate and invest the voluntarily made contributions of its participants by means of private pension funds thus ensuring additional pension capital in old age. Pension plan participants may participate directly or with involvement of their employer. The pension plan participant can receive all accumulated pension capital from the age of 55 or continue participating and receive capital in parts.
1.1.4. Financing of the Social Security system
In 1998 several significant changes were introduced in the area of financing social insurance. Four special social insurance budgets (special budgets) were approved instead of one special insurance budget and expenditures permissible within the given budgetary frame: the state pension special budget; the employment special budget; the occupational accident special budget; the disability, maternity and sickness special budget. Differentiated rate for social insurance contributions was established. Persons were insured and made social insurance contributions against risks which could, in fact, set in.
Socially insured persons:
1) Persons subject to compulsory social insurance: • employees; • domestic employees working for an employer – foreigner; • foreign employees working for an employer – foreigner; • self – employed persons; • persons insured from the state basic budget; • persons insured from the Social Insurance Special Budget.
2) Persons who have joined to state pension insurance on voluntary basis (individual
who has reached the age of 15 and is not subject to compulsory social insurance): • a person who has not been granted the state old age pension, may join to state
pension insurance; • the spouse of self – employed person who has not yet reached the retirement
age, may join to state pension insurance, disability insurance, parental insurance and maternity and sickness insurance.
215

1.1.5. Basis for calculation of the pension(s), including information on wages, adjustments and indexations of pension schemes
Old-age pension formula during the transition period: P = (Ks + K) / G, where
P: annual pension, of which 1/12 is the monthly pension;
K: the pension capital of insured person;
G: time period (in years), during which pension disbursements are planned, starting from the pension allocation year (projected life expectancy at a certain retirement age);
Ks: starting (credited) capital, calculated according to the following formula:
Ks = Vi x As x 0.2, where
As: the insurance record until the year 1995 (inclusive);
Vi: the insured person’s average insurance contribution wage of 48 months in the period from 1996 to 2000 (calculated in 1996 prices). If during this period the insurance contributions have been made for less than 48 months, the average insurance contribution wage shall be calculated by dividing the total amount of insurance contribution wage by 48. For persons, who have years of service not less as 30 and contribution wage less as average contribution wage in the state, average wage of the state has used for calculations.
The calculation of the disability pension is made according to the following formula: Category I
P = 0.45 x Vi + (ASi / ASie) x Vi x 0.1
Category II
P = 0.4 x Vi + (ASi / ASie) x Vi x 0.1, where
P: pension;
Vi: reference earnings (see below “Reference earnings or calculation basis”);
Asi: individual insurance record in years;
ASie: maximum possible insurance record from the age of 15 until legal retirement age;
For disabled persons of category III: the benefit is fixed as the amount of the state social security benefit (LVL 45 per month).
The amount of the disability pension for Group I and II shall not be less than the amount of the state social security benefit ( LVL 45), as the basis for calculation of the guaranteed pension to which the following coefficient shall be applicable:
in case of Group I disability - 1.6; in case of Group II disability - 1.4.
Survivor's pension for orphans having lost one parent: the total pension calculated from the potential old age pension of the deceased as follows:
1) for one child - 50 percent of the pension, but not less than 65 per cent of the state social insurance benefit amount for each child.
216

2) for two children - 75 percent of the pension, but not less than 65 per cent of the state social insurance benefit amount for each child. 3) for three and more children - 90 per cent of the pension, but not less than 65 per cent of the state social insurance benefit amount for each child.
Survivors pension for orphans having lost both parents: pension calculated by taking into account the potential old age pension of both parents. Taxation of pensions Pensions are included in the annual taxable income. Pensions granted prior to 1996 are not subject to income tax. For pensioners, whose pensions were granted after this date, the annual non-taxable minimum was:
▪ Since 01/01/1997 until 31/12/2005 - LVL 1200 per annum; ▪ Since 01/01/2006 until 30/09/2006 - LVL 1320 per annum; ▪ Since 01/10/2006 - LVL 1980 per annum.
2. Pension expenditure projections
2.1. Extent of the coverage of the pension schemes in the projections
Social security and private mandatory (funded) pension schemes are introduced in the country pension model. Social security pension scheme covers all contributors. Coverage in the private (FDC) pension scheme is mandatory for persons who were under the age of 30 July 1, 2001, when the State Funded Pension Law came into force. Persons who were in the age group of 30 – 49 at that moment could join to this scheme on a voluntary basis at any time.
2.2. Overview of projection results
The expenditures of social security pensions have been decreased from 8.3% of GDP in 2000 to 5.4% of GDP in 2007. This decrease was mainly influenced by: 1) the rise of the retirement age;2) smaller generation in the retirement age (born during WWII) , which has caused the decrease of a number of newly granted pensions, and 3) rapid GDP growth that outpaced pension growth, because of indexation rule. The decrease of expenditures of social security pensions from 5.4% of GDP in 2007 to 5.1% in 2060 is mainly connected with the redistribution of pension contribution rate between NDC and FDC and as result lower replacement rate from NDC. Mandatory private pension as % of GDP will increase by 4.9 p.p. during period of projections. For projections of taxes on pensions - simple difference (in %) between actual average net and gross pensions has been calculated. The same % has been used for all period of projections.
217
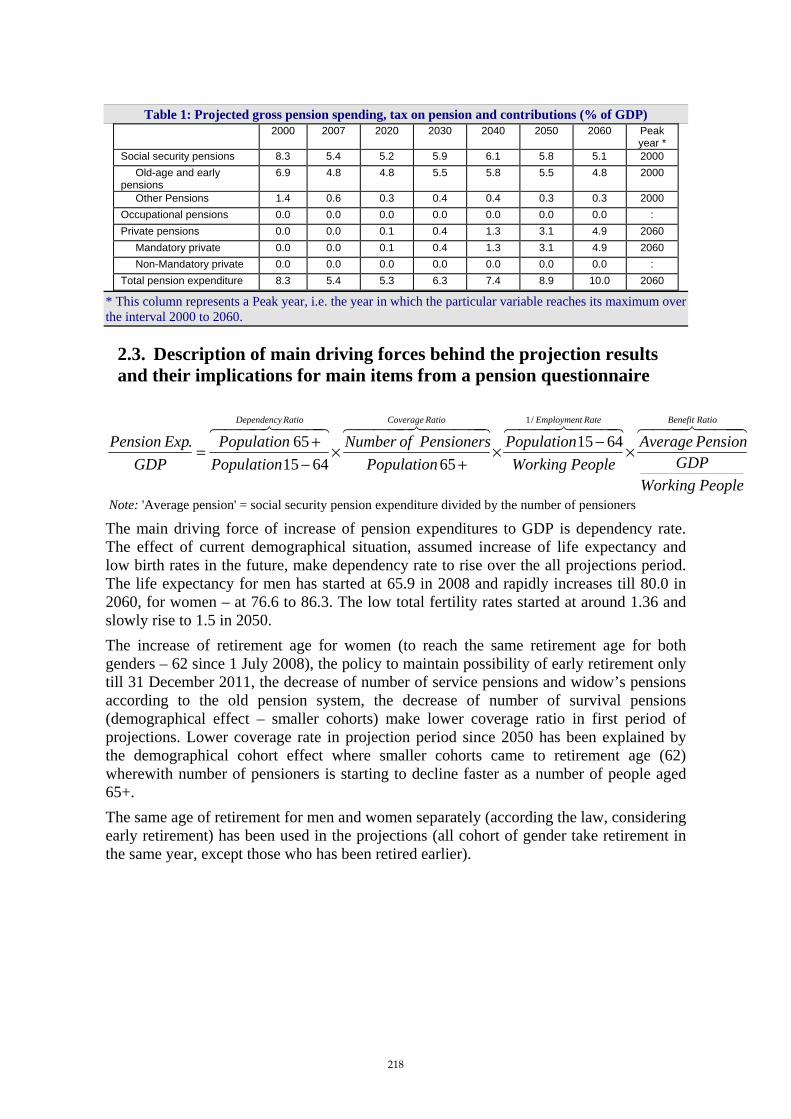
Table 1: Projected gross pension spending, tax on pension and contributions (% of GDP) 2000 2007 2020 2030 2040 2050 2060 Peak
year * Social security pensions 8.3 5.4 5.2 5.9 6.1 5.8 5.1 2000 Old-age and early pensions
6.9 4.8 4.8 5.5 5.8 5.5 4.8 2000
Other Pensions 1.4 0.6 0.3 0.4 0.4 0.3 0.3 2000 Occupational pensions 0.0 0.0 0.0 0.0 0.0 0.0 0.0 : Private pensions 0.0 0.0 0.1 0.4 1.3 3.1 4.9 2060 Mandatory private 0.0 0.0 0.1 0.4 1.3 3.1 4.9 2060 Non-Mandatory private 0.0 0.0 0.0 0.0 0.0 0.0 0.0 : Total pension expenditure 8.3 5.4 5.3 6.3 7.4 8.9 10.0 2060
* This column represents a Peak year, i.e. the year in which the particular variable reaches its maximum over the interval 2000 to 2060.
2.3. Description of main driving forces behind the projection results and their implications for main items from a pension questionnaire
444 8444 76444 8444 764444 84444 76444 8444 76 RatioBenefitRateEmploymentRatioCoverageRatioDependency
PeopleWorkingGDP
PensionAveragePeopleWorking
PopulationPopulation
PensionersofNumberPopulationPopulation
GDPExpPension ×−×
+×
−+=
/1
6415656415
65.
Note: 'Average pension' = social security pension expenditure divided by the number of pensioners
The main driving force of increase of pension expenditures to GDP is dependency rate. The effect of current demographical situation, assumed increase of life expectancy and low birth rates in the future, make dependency rate to rise over the all projections period. The life expectancy for men has started at 65.9 in 2008 and rapidly increases till 80.0 in 2060, for women – at 76.6 to 86.3. The low total fertility rates started at around 1.36 and slowly rise to 1.5 in 2050. The increase of retirement age for women (to reach the same retirement age for both genders – 62 since 1 July 2008), the policy to maintain possibility of early retirement only till 31 December 2011, the decrease of number of service pensions and widow’s pensions according to the old pension system, the decrease of number of survival pensions (demographical effect – smaller cohorts) make lower coverage ratio in first period of projections. Lower coverage rate in projection period since 2050 has been explained by the demographical cohort effect where smaller cohorts came to retirement age (62) wherewith number of pensioners is starting to decline faster as a number of people aged 65+. The same age of retirement for men and women separately (according the law, considering early retirement) has been used in the projections (all cohort of gender take retirement in the same year, except those who has been retired earlier).
218
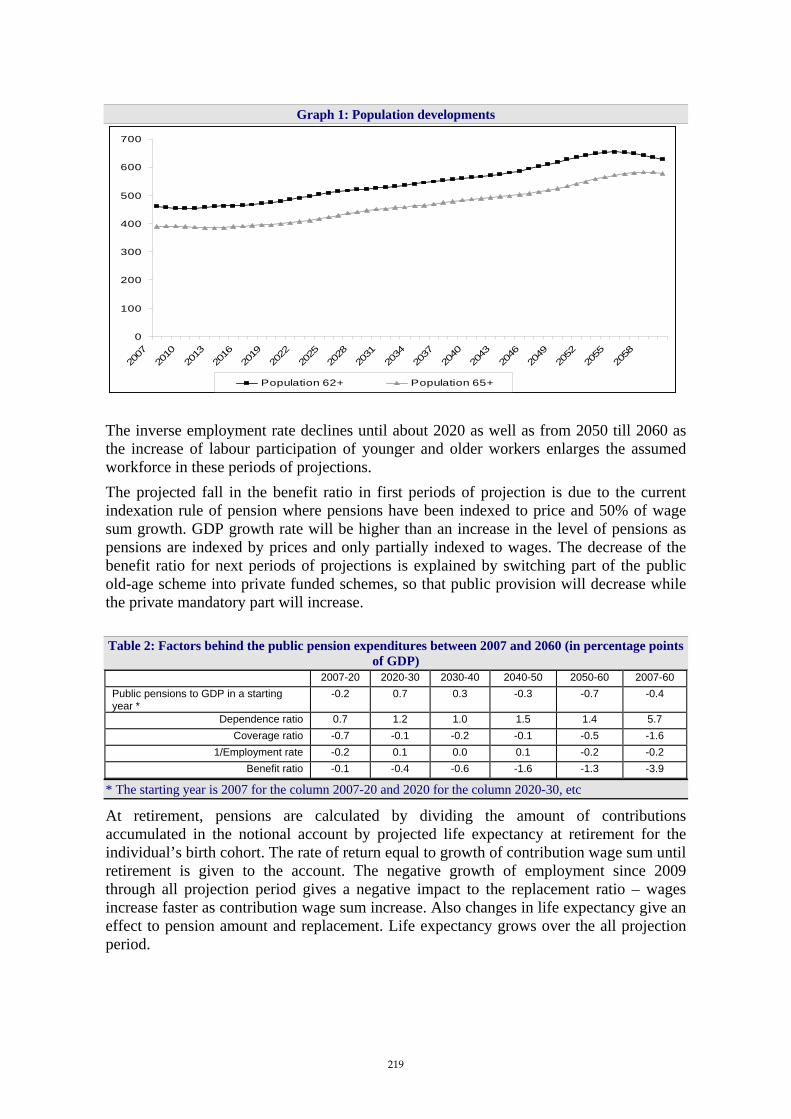
Graph 1: Population developments
0
100
200
300
400
500
600
700
2007
2010
2013
2016
2019
2022
2025
2028
2031
2034
2037
2040
2043
2046
2049
2052
2055
2058
Population 62+ Population 65+
The inverse employment rate declines until about 2020 as well as from 2050 till 2060 as the increase of labour participation of younger and older workers enlarges the assumed workforce in these periods of projections. The projected fall in the benefit ratio in first periods of projection is due to the current indexation rule of pension where pensions have been indexed to price and 50% of wage sum growth. GDP growth rate will be higher than an increase in the level of pensions as pensions are indexed by prices and only partially indexed to wages. The decrease of the benefit ratio for next periods of projections is explained by switching part of the public old-age scheme into private funded schemes, so that public provision will decrease while the private mandatory part will increase. Table 2: Factors behind the public pension expenditures between 2007 and 2060 (in percentage points
of GDP) 2007-20 2020-30 2030-40 2040-50 2050-60 2007-60
Public pensions to GDP in a starting year *
-0.2 0.7 0.3 -0.3 -0.7 -0.4
Dependence ratio 0.7 1.2 1.0 1.5 1.4 5.7 Coverage ratio -0.7 -0.1 -0.2 -0.1 -0.5 -1.6
1/Employment rate -0.2 0.1 0.0 0.1 -0.2 -0.2 Benefit ratio -0.1 -0.4 -0.6 -1.6 -1.3 -3.9
* The starting year is 2007 for the column 2007-20 and 2020 for the column 2020-30, etc
At retirement, pensions are calculated by dividing the amount of contributions accumulated in the notional account by projected life expectancy at retirement for the individual’s birth cohort. The rate of return equal to growth of contribution wage sum until retirement is given to the account. The negative growth of employment since 2009 through all projection period gives a negative impact to the replacement ratio – wages increase faster as contribution wage sum increase. Also changes in life expectancy give an effect to pension amount and replacement. Life expectancy grows over the all projection period.
219
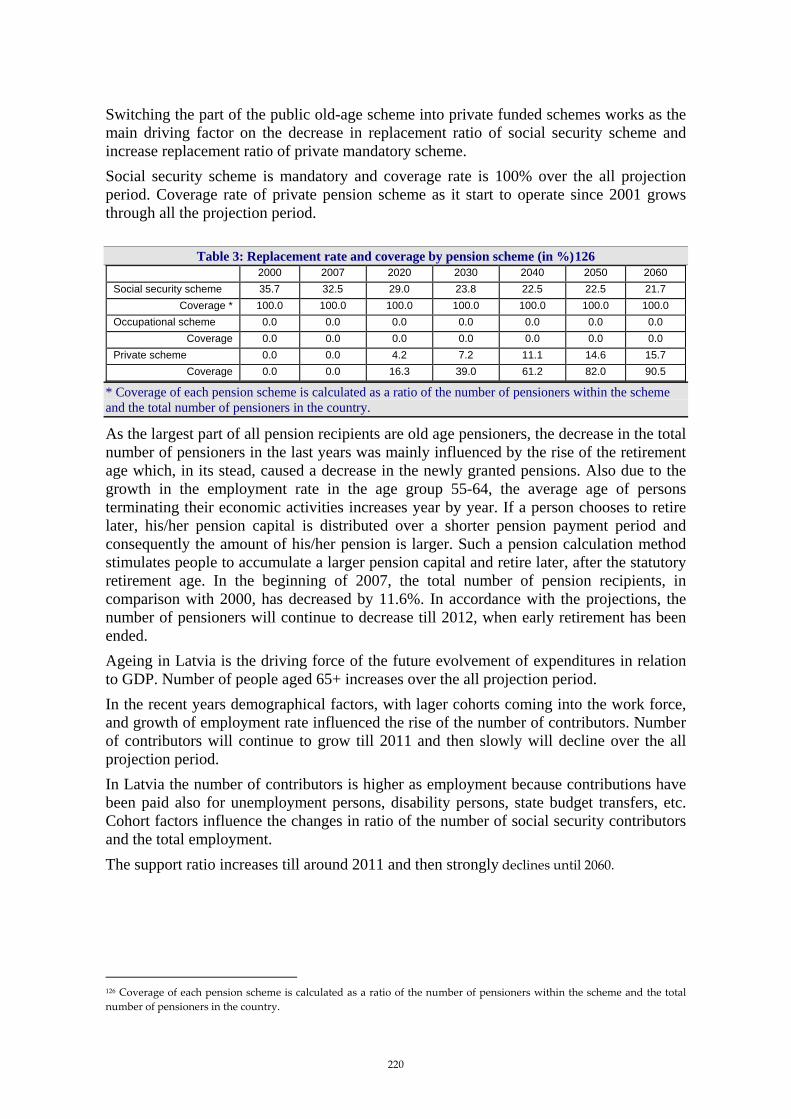
Switching the part of the public old-age scheme into private funded schemes works as the main driving factor on the decrease in replacement ratio of social security scheme and increase replacement ratio of private mandatory scheme. Social security scheme is mandatory and coverage rate is 100% over the all projection period. Coverage rate of private pension scheme as it start to operate since 2001 grows through all the projection period.
Table 3: Replacement rate and coverage by pension scheme (in %)126 2000 2007 2020 2030 2040 2050 2060
Social security scheme 35.7 32.5 29.0 23.8 22.5 22.5 21.7 Coverage * 100.0 100.0 100.0 100.0 100.0 100.0 100.0
Occupational scheme 0.0 0.0 0.0 0.0 0.0 0.0 0.0 Coverage 0.0 0.0 0.0 0.0 0.0 0.0 0.0
Private scheme 0.0 0.0 4.2 7.2 11.1 14.6 15.7 Coverage 0.0 0.0 16.3 39.0 61.2 82.0 90.5
* Coverage of each pension scheme is calculated as a ratio of the number of pensioners within the scheme and the total number of pensioners in the country.
As the largest part of all pension recipients are old age pensioners, the decrease in the total number of pensioners in the last years was mainly influenced by the rise of the retirement age which, in its stead, caused a decrease in the newly granted pensions. Also due to the growth in the employment rate in the age group 55-64, the average age of persons terminating their economic activities increases year by year. If a person chooses to retire later, his/her pension capital is distributed over a shorter pension payment period and consequently the amount of his/her pension is larger. Such a pension calculation method stimulates people to accumulate a larger pension capital and retire later, after the statutory retirement age. In the beginning of 2007, the total number of pension recipients, in comparison with 2000, has decreased by 11.6%. In accordance with the projections, the number of pensioners will continue to decrease till 2012, when early retirement has been ended. Ageing in Latvia is the driving force of the future evolvement of expenditures in relation to GDP. Number of people aged 65+ increases over the all projection period. In the recent years demographical factors, with lager cohorts coming into the work force, and growth of employment rate influenced the rise of the number of contributors. Number of contributors will continue to grow till 2011 and then slowly will decline over the all projection period. In Latvia the number of contributors is higher as employment because contributions have been paid also for unemployment persons, disability persons, state budget transfers, etc. Cohort factors influence the changes in ratio of the number of social security contributors and the total employment. The support ratio increases till around 2011 and then strongly declines until 2060.
126 Coverage of each pension scheme is calculated as a ratio of the number of pensioners within the scheme and the total number of pensioners in the country.
220

Table 4: Number of pensioners and contributors in the Social security scheme (in 1000), population over 65 and total employment (in 1000) and related ratios (%)
2000 2007 2020 2030 2040 2050 2060 Number of pensioners (I) 651 576 519 573 602 645 640 Number of people aged 65+ (II) 353 390 400 451 486 534 578 Ratio of (I) and (II) 184 148 130 127 124 121 111 Number of contributors (III) 1003 1202 1113 997 916 787 707 Employment(IV) 918 1077 1019 917 837 714 633 Ratio of (III) and (IV) 109 112 109 109 109 110 112 Ratio of (III) and (I) 'support ratio'
154 209 214 174 152 122 110
Table 5 shows accumulated assets of the state pension special budget, which is under the consolidated state social insurance budget. The state pension special insurance budget includes contributions and expenditures connected with public old age, survivors, service pensions and funeral benefits. Contributions for and expenditures of disability pensions are included in other special budget - maternity and sickness special budget. Currently, notwithstanding the pessimistic projections of the future, the demographic situation regarding the pension system is comparatively beneficial, as the generation born during the Second World War and retiring now, is small in number. Furthermore, the generation born in the eighties of the 20th century, when the birth rates were twice higher then at present, is entering in working age. The beneficial demographic, economic situation and increasing age of retirement were the main drivers for developing of surplus in the state pension special budget and accumulation of public pension assets. The projections show accumulation of public pension assets until 2022 and then complete spending in the next decade. Afterwards state pension special budget will accumulate debt. Most recent developments however indicate sharp reversal of economic activity and worsening of medium term growth prospects below AWG macroeconomic assumptions (GDP growth, wage growth, etc.). This will lead to much sooner deterioration of the social insurance budget as projections show. Projections show growth of private pension funds reserves, used real interest rate 3%.
Table 5: Assets of pension funds and reserves, (% of GDP) 2000 2007 2020 2030 2040 2050 2060
Public Pension funds -0.9 3.9 8.4 5.0 -1.8 -7.1 -9.0 Of which liquid financial assets, non-
consolidated 0.0 0.0 0.0 0.0 0.0 0.0 0.0
Of which liquid financial assets, consolidated -0.9 3.9 8.4 5.0 -1.8 -7.1 -9.0 Occupational pensions 0.0 0.0 0.0 0.0 0.0 0.0 0.0 Private pensions 0.0 1.8 31.3 55.9 77.9 87.9 96.0 All pensions -0.9 5.7 39.7 60.9 76.1 80.8 87.0
2.4. Sensitivity analysis
Higher life expectancy scenario assumed an increase in life expectancy, which corresponds roughly to an increase in life expectancy at birth on about 1 year by 2060. As this increase on life expectancy is too small, there is no real impact on the ratio of total pension expenditures to GDP. At retirement, pensions are calculated by dividing the amount of contributions accumulated in the notional account by projected life expectancy
221
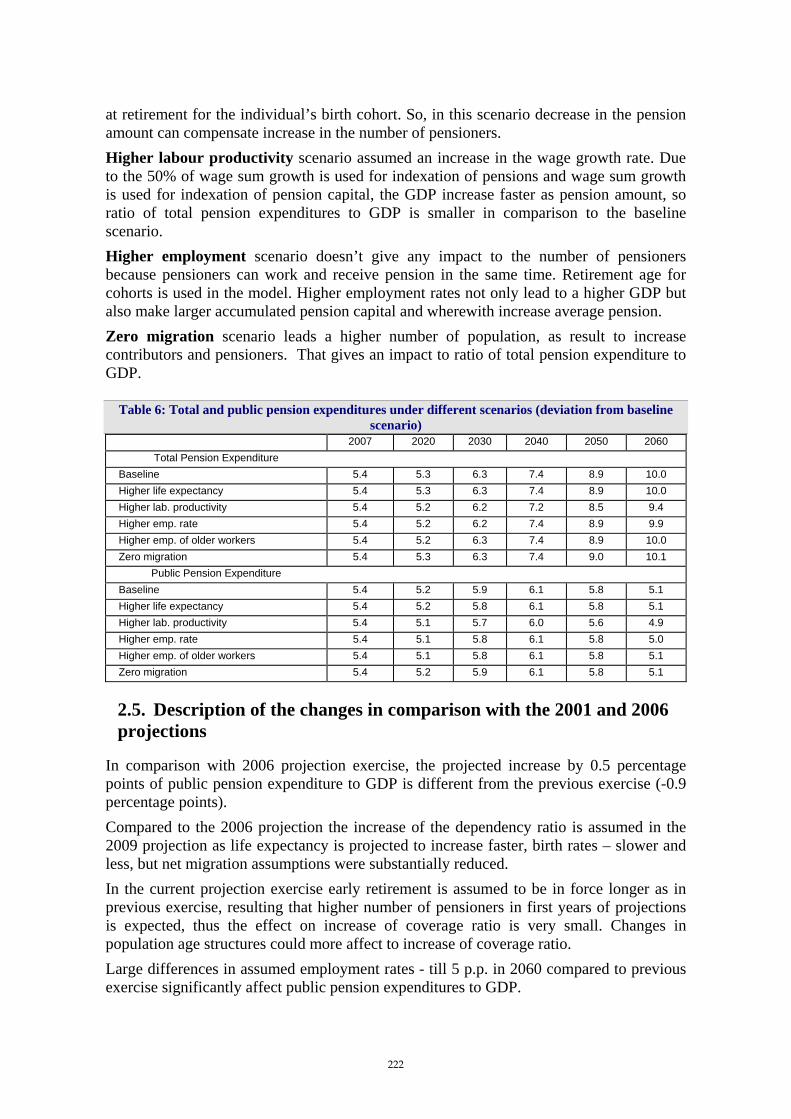
at retirement for the individual’s birth cohort. So, in this scenario decrease in the pension amount can compensate increase in the number of pensioners. Higher labour productivity scenario assumed an increase in the wage growth rate. Due to the 50% of wage sum growth is used for indexation of pensions and wage sum growth is used for indexation of pension capital, the GDP increase faster as pension amount, so ratio of total pension expenditures to GDP is smaller in comparison to the baseline scenario. Higher employment scenario doesn’t give any impact to the number of pensioners because pensioners can work and receive pension in the same time. Retirement age for cohorts is used in the model. Higher employment rates not only lead to a higher GDP but also make larger accumulated pension capital and wherewith increase average pension. Zero migration scenario leads a higher number of population, as result to increase contributors and pensioners. That gives an impact to ratio of total pension expenditure to GDP.
Table 6: Total and public pension expenditures under different scenarios (deviation from baseline scenario)
2007 2020 2030 2040 2050 2060 Total Pension Expenditure
Baseline 5.4 5.3 6.3 7.4 8.9 10.0 Higher life expectancy 5.4 5.3 6.3 7.4 8.9 10.0 Higher lab. productivity 5.4 5.2 6.2 7.2 8.5 9.4 Higher emp. rate 5.4 5.2 6.2 7.4 8.9 9.9 Higher emp. of older workers 5.4 5.2 6.3 7.4 8.9 10.0 Zero migration 5.4 5.3 6.3 7.4 9.0 10.1
Public Pension Expenditure Baseline 5.4 5.2 5.9 6.1 5.8 5.1 Higher life expectancy 5.4 5.2 5.8 6.1 5.8 5.1 Higher lab. productivity 5.4 5.1 5.7 6.0 5.6 4.9 Higher emp. rate 5.4 5.1 5.8 6.1 5.8 5.0 Higher emp. of older workers 5.4 5.1 5.8 6.1 5.8 5.1 Zero migration 5.4 5.2 5.9 6.1 5.8 5.1
2.5. Description of the changes in comparison with the 2001 and 2006 projections
In comparison with 2006 projection exercise, the projected increase by 0.5 percentage points of public pension expenditure to GDP is different from the previous exercise (-0.9 percentage points). Compared to the 2006 projection the increase of the dependency ratio is assumed in the 2009 projection as life expectancy is projected to increase faster, birth rates – slower and less, but net migration assumptions were substantially reduced. In the current projection exercise early retirement is assumed to be in force longer as in previous exercise, resulting that higher number of pensioners in first years of projections is expected, thus the effect on increase of coverage ratio is very small. Changes in population age structures could more affect to increase of coverage ratio. Large differences in assumed employment rates - till 5 p.p. in 2060 compared to previous exercise significantly affect public pension expenditures to GDP.
222

Lower benefit ratio decreases public pension expenditures to GDP and effects that assumed life expectancy is higher (used in pension formula) and employment rates are lower in comparison with previous exercise. Table 7: Decomposition of the change (in %) in public pension expenditure to GDP between 2007 and
2050 under the 2001, 2006 and 2009 projection exercises % Change to
2050 Dependence
ratio Coverage
ratio Employment
effect Benefit ratio
Pension/GDP – 2001 * #N/A #N/A #N/A #N/A #N/A Pension/GDP – 2006 ** -0.9 3.4 -1.3 -0.7 -2.3 Pension/GDP - 2009 *** 0.5 4.3 -1.1 0.0 -2.6
* Decomposition period 2001-2050, ** Decomposition period 2004-2050, *** Decomposition period 2007-2050.
223

Lithuania (Report prepared by Vidija Pastukiene and Rasa Sliogeriene)
1. Overview of the pension system
1.1. Key Features of the Pension System
Since 2004, the Lithuanian pension system consists of three pillars: statutory mandatory PAYG (defined-benefit) pension scheme, statutory quasi-mandatory private funded (defined contributions) scheme and voluntary private funded pension scheme. A legal framework was developed laying down the foundation for occupational pensions in 2006. A social security scheme in Lithuania comprises state social insurance scheme, state pension’s scheme, and social assistance pension scheme. The scheme of state pension benefits is functioning independently from the state social insurance pension scheme; as they usually accompany one of the main pensions (state social insurance pension), except social assistance pensions, which are due when a person is not eligible for state social insurance pension. The State social insurance pension scheme was reformed in 1995 introducing the insurance principle, extending the requirement of years of coverage, abolishing some early retirement provisions and increasing the retirement age. It includs old-age, work-incapacity and widows (-ers) /orphans state social insurance pensions. This pension scheme is financed from contributions: 23.85% of gross wage is paid by the employer and 2.5% by the employee (data as of 2008). Self-employed people who earn less than 12 minimum gross monthly wages a year are insured for a basic part of a social insurance pension only and pay a contribution which equals half of the basic pension. Those of the self-employed who earn more than 12 minimum gross monthly wages a year also have an obligation to insure for a supplementary part of pension and pay a contribution of 15% from the declared income. In principle, all the employed (96% in 2007) are insured with the pension social insurance to receive old age, disability and survivors’ social insurance pensions. Nevertheless, some categories of self-employed persons (farmers, sportspeople, creative workers receiving authorship payments) are not insured in a mandatory way (although they may insure themselves on a voluntary basis). There are several population groups which are covered by means of state budget for the full pension calculated on minimum wage namely persons taking care of children under three years or of disabled persons. Regular legal retirement age for men is 62.5 years (from 2003) and for women 60 years (from 2006). Pension formula State social insurance pensions are combined of three elements:
• the basic part (basic pension) is almost flat, fixed at same amount for all who have acquired 30 years of insurance,
• earnings related supplementary part depending on a work record and on income, calculated with a formula comprising years of work record, individual wage coefficient and average insurable income in the country (figure approved by the
224

Government based on income on which social insurance contributions were paid) and
• Bonus for lengthy insurance record exceeding 30 years.
Pension formula since 2008: P = 1.1 * B + 0.005 * S * K * DP + 0.03 * e*B were P – amount of pension; B – the amount of the basic pension on the month of the pension payment; 0.005 – accrual rate; S – years of insurance record; K – individual wage coefficient calculated as a weighted average of a ratio between person’s monthly earnings and the average insurable income in the country for the entire insurance period (with ceiling=5); DP – the amount of the average insurable income in the country on the month of the pension payment; 0.03 – accrual rate for insurance record exceeding 30 years; e – insurance record exceeding 30 years. The basic pension is a unit of measurement of the basic part of a pension and depends only on the individual’s insurance record, i.e. everyone with a mandatory insurance record is eligible to the same basic element of a pension which equals to a basic pension (basic pension is EUR 104 in 2008).The qualifying period to receive full pension is 30 years (a minimum qualifying period being 15 years). In case of minimum qualifying period, basic part of pension is equal to 0.5 of the basic pension. The requirements of the minimum and full social insurance period for the work-incapacity pension depend on the person’s age and increase gradually along it. Since 2008, in order to increase adequacy for low wage earners more substantially, a basic part of pension was equalled to 110 percent of a basic pension. A new bonus (3 % of basic pension for each year exceeding 30) as a part of pension benefit was introduced from July 2007. The part of contribution rate allocated for the supplementary part of old age pension is approved by the Government every year and comprises 9.3 percentage points of total 26% in 2008. There are no automatic indexation rules in Lithuania. State social insurance pensions are increased when the new amount of basic pension and average insured income of the current year are set by the Government. Nevertheless, adjustments were made in line with wage increases in the past. Furthermore, in 2005 the Government of Lithuania committed itself that the pension growth would surpass the real wage growth in order to achieve higher RR. In July 2004 an early retirement pension scheme was introduced for the long-term unemployed if less than 5 years were left until the retirement age. Under that scheme pensions are reduced by 0.4% for every full month remaining until the retirement age and the reduced pension is paid life-long. The mandatory provision to receive the early
225

retirement pension is 30 years work record and a person must be registered at the Labour Exchange Office as unemployed for the period not less than 12 last months. After reaching the retirement age, a person can continue working and receive his earnings from work together with the old-age pension. In case of deferred retirement the pension will be increased by 0.67 % per month or 8% per annum. Until July 2005, a person who received the disability pension and reached the retirement age was able to choose whether to continue receiving the disability pension or start receiving the old-age pension. In 2005 a social integration reform for the disabled was implemented, considerably changing the disability recognition procedure. Disability is now linked to capacity to work rather than merely to a health condition. The level of capacity for work is established in respect of working age individuals only. A disabled person can receive the work incapacity pension (three-tiered structure depending in percentage reduction in working capacity) until retirement age and thereafter the old-age pension. Family members of deceased insured person are entitled the widow's (ers) and orphan’s pensions. In 2007 widow’s pension system was reformed. Only widows (ers) of retirement age or disabled are eligible for widow’s pensions; they are flat rate (EUR 20.3) and are paid as a supplement to the main old age or disability pension. Orphan’s benefits are linked with the pension amount of the deceased (50% of the latter’s pension). There is no minimum social insurance pension guaranteed by the Law. No income tax is levied on pension benefits paid from the statutory schemes. The mandatory private funded pension scheme was introduced on 1st January 2004. The second tier of the statutory system is voluntary: people are free to choose whether to join it or not. Opting out from the scheme once joined is not allowed. There are no restrictions for participation except being insured by the State social insurance pension system and aged below the legal retirement age. In 2008 the number of switchers (880 thousand) accounted for 69% of all eligible (the insured for the full amount of pension) or 57% of the employed. The number of participants in pension accumulation grew largely due to involvement of younger population (with 90% activity rate). The scheme is a defined contribution scheme financed by a fraction of the social insurance contribution (increasing from 2.5% to 5.5% of gross wage by 2007). No further increases of this part of the contribution are foreseen. At retirement, the participant has to purchase a pension annuity from an insurance company. Only in case of very small annuities (half the amount of basic pension) or for sums exceeding the annuity of three times the basic pension, one can choose to receive pension benefits in lump sum or as phased withdrawals from the pension fund. For annuity calculation sex-specific life tables are used. Transfer of part of social insurance contributions into private pension funds in 2004–2007 was partially (by 50%) funded by state allocations (from the means of the Reserve (Stabilisation) Fund). Pension reform transition costs, which are about to reach the ceiling of 1% of GDP in 2020, are financed from the social insurance sector surplus which is generated by short-term improvement of the demographic situation and economic growth, as well as from the funds received from sold state assets and the funds of the state budget and other financial resources. Drop in the costs is foreseen around 2030, when almost half of pensioners will start receiving reduced state social insurance old-age pensions (a supplementary part of an old-age pension is reduced in proportion to the size of the
226
contribution rate transferred to pension accumulation) together with annuities generated by the accumulated amount. There is no government guarantees regarding this scheme. The voluntary private funded pension scheme started operating only in 2004, although the law was adopted already in 1999. Contributions to the system may be made by the insured himself or by his employer with tax allowances if contributions to pension funds do not exceed 25% of the person's annual earnings. The participation in the system remains very low accounting for mere 0.1% of the total labour force of Lithuania. Moreover, legal regulation of voluntary private pension accumulation provides for a possibility to terminate contracts before reaching retirement age without sustaining substantial financial losses (but not earlier than 10 years after the beginning of accumulation), acquisition of annuity is not mandatory, thus, such participants can be called participants in “pension” accumulation subject to certain reservations. Occupational schemes can be established according to the Law on the Accumulation of Occupational Pensions. However, so far the voluntary private pension provisions occupy the place which possibly could be devoted to the second pillar schemes. The state pension system functions independently from the social insurance pension system. The state pensions are awarded to the persons for distinguished achievements for the state (1st and 2nd degree), officials and military servants, judges, scientists and for victims and deprived persons. Some of them are earning-related (e.g. officials and military servants state pensions and judges’ state pensions) some are calculated on the special state pension’s basis (e.g. 1st and 2nd degree, scientists and pensions of deprived persons). State pensions are awarded irrespective of the eligibility to social insurance pensions and may be paid out along with them. However, the amount of pensions of the first and second degree, military servants and judges in total may not exceed 1.5 of the average wage in the country. The state pension system is financed directly from the State Budget. 12% of pensioners obtain this type of pension and state pension expenditure to GDP comprises 0.34%. Social assistance pensions provide a minimum income to those not eligible to social insurance pensions (3.8 % of all pensioners are covered in 2007). The amount of the social assistance pension in case of old age is equal to 90% of the basic pension that amounts to 41% of the minimum monthly salary or 18.9% of the average net wage in the country in 2008. They are pension income-tested. Since recently only 63% of working age population is covered by pension social insurance, increase of social assistance pensions in the future is expected (13% of all pensioners in 2060).
1.2. Recent Reforms
In 2006 retirement age increase reform reached its’ ultimate point by fixing female retirement age at 60. In 2007 a bonus was introduced in the pension formula for those with long insurance record. In practise this means as the basic part of pension would be increased after 30 years as well; until then only the reduction of the basic part of the pension in proportion to individual’s work record which fell below the required mandatory 30 years was possible. As of 1 January 2008 for the purpose of increasing pensions the national law on pensions was amended so that the basic part of pension was equalled to 110% of the basic pension.
227
This was instrumental in reinforcing the impact of the basic part of pension on the final pension calculation formula and in a relatively more substantial increase of small pensions. In 2007–2008 the widow’s pension reform was implemented: rates of widow’s pensions (flat rate basic amount of EUR 20.3 was introduced) were unified and the scope of eligible beneficiaries was expanded (but only of retirement age or disabled). The number of beneficiaries of old-age widow’s pensions in 2008 grew by 14.6% compared to 2006. When unifying the rates of widow’s pensions it was decided that only orphan’s benefits would be linked to the pension amount of the deceased and would be further increased (from 25% to 50% of father’s or mother’s pension). The numbers of widows’ pension recipients of under retirement age will shrink, as mothers rising children of the deceased will not be eligible for survivors’ pension on behalf of the orphans. The new assessment system of disability and working capacity level was introduced in 2005. It has stopped the growth of the number of the disabled (aged 50-69) that was observed prior the reform. From 2006 all disabled and persons at retirement age not eligible to social insurance pensions are granted the social assistance pensions.
1.3. Description of the currently effective constant policy
The constant policy scenario is strictly applied. Indexation of social insurance pension is fully aligned to wage evolution as well as earnings related state pensions. Not earnings related state pensions are indexed to prices. For social assistance pensions indexation to real wage growth was applied. Retirement age is constant through all projection period.
2. Pension expenditure projections
2.1. Coverage of the pension schemes
All contributory social insurance and non-contributory (financed from state budget) state pensions are included in the projections (social assistance as well). Disability and widow’s pensions paid out to persons over the standard retirement age are attributed to the category “old age and early pensions”. Projections cover the private mandatory pensions as well.
2.2. Overview of projection results
Social Security pension spending in proportion to GDP between 2007 and 2060 is projected to increase by 4.6% (from 6.8% to 11.4% with a peak year in 2060). This increase is determined by spending in old age category (4.7%). Due to favourable demographics, the ratio (pension spending/GDP) in 2007 declined by 1 percentage point from 2000 year level of 7.8%; until 2020 pension expenditure level is expected to remain stable. The situation will change sharply after 2020 when major post-war baby-boomer cohorts will retire and low birth rate cohorts will be contributing. At the same time the offsetting factor will occur - the level of newly granted benefits from public pension scheme is projected to start decreasing due to the partial switch into a private scheme. Despite of slightly shrinking number of old age pensioners from 2050, the expenditures will continue to growth, because of higher life expectancy.
228
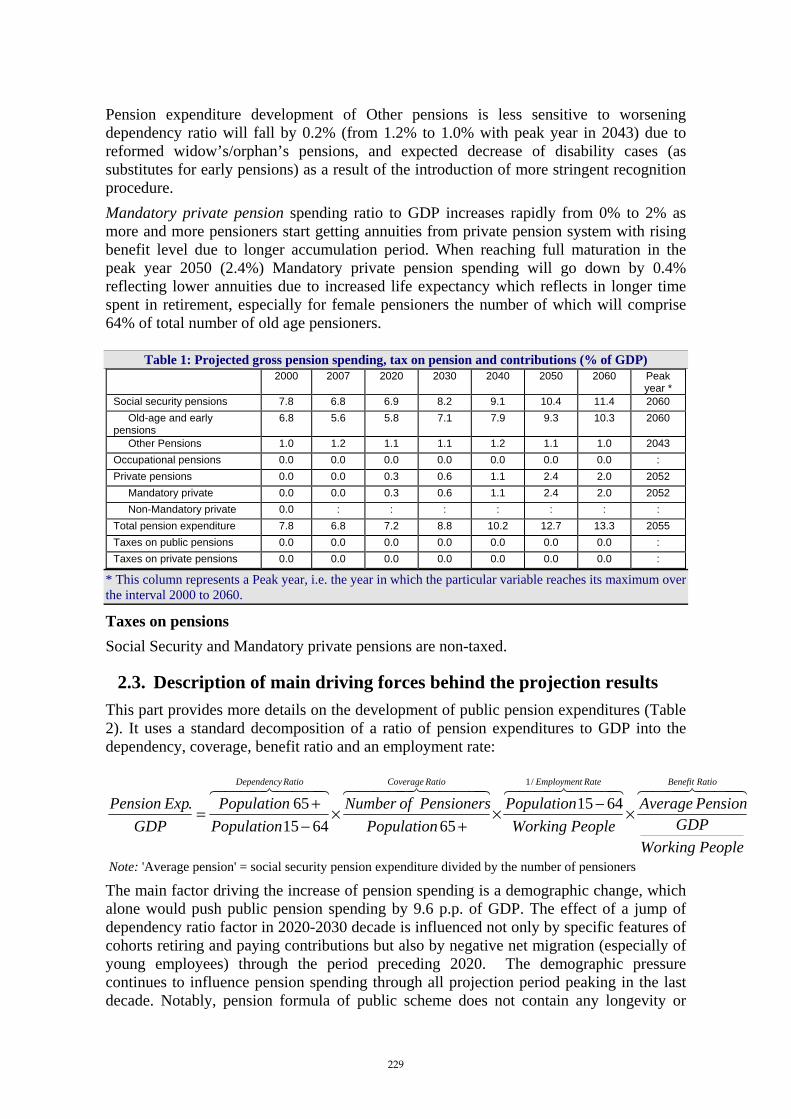
Pension expenditure development of Other pensions is less sensitive to worsening dependency ratio will fall by 0.2% (from 1.2% to 1.0% with peak year in 2043) due to reformed widow’s/orphan’s pensions, and expected decrease of disability cases (as substitutes for early pensions) as a result of the introduction of more stringent recognition procedure. Mandatory private pension spending ratio to GDP increases rapidly from 0% to 2% as more and more pensioners start getting annuities from private pension system with rising benefit level due to longer accumulation period. When reaching full maturation in the peak year 2050 (2.4%) Mandatory private pension spending will go down by 0.4% reflecting lower annuities due to increased life expectancy which reflects in longer time spent in retirement, especially for female pensioners the number of which will comprise 64% of total number of old age pensioners.
Table 1: Projected gross pension spending, tax on pension and contributions (% of GDP) 2000 2007 2020 2030 2040 2050 2060 Peak
year * Social security pensions 7.8 6.8 6.9 8.2 9.1 10.4 11.4 2060 Old-age and early pensions
6.8 5.6 5.8 7.1 7.9 9.3 10.3 2060
Other Pensions 1.0 1.2 1.1 1.1 1.2 1.1 1.0 2043 Occupational pensions 0.0 0.0 0.0 0.0 0.0 0.0 0.0 : Private pensions 0.0 0.0 0.3 0.6 1.1 2.4 2.0 2052 Mandatory private 0.0 0.0 0.3 0.6 1.1 2.4 2.0 2052 Non-Mandatory private 0.0 : : : : : : : Total pension expenditure 7.8 6.8 7.2 8.8 10.2 12.7 13.3 2055 Taxes on public pensions 0.0 0.0 0.0 0.0 0.0 0.0 0.0 : Taxes on private pensions 0.0 0.0 0.0 0.0 0.0 0.0 0.0 :
* This column represents a Peak year, i.e. the year in which the particular variable reaches its maximum over the interval 2000 to 2060.
Taxes on pensions Social Security and Mandatory private pensions are non-taxed.
2.3. Description of main driving forces behind the projection results This part provides more details on the development of public pension expenditures (Table 2). It uses a standard decomposition of a ratio of pension expenditures to GDP into the dependency, coverage, benefit ratio and an employment rate:
444 8444 76444 8444 764444 84444 76444 8444 76 RatioBenefitRateEmploymentRatioCoverageRatioDependency
PeopleWorkingGDP
PensionAveragePeopleWorking
PopulationPopulation
PensionersofNumberPopulationPopulation
GDPExpPension ×−×
+×
−+=
/1
6415656415
65.
Note: 'Average pension' = social security pension expenditure divided by the number of pensioners
The main factor driving the increase of pension spending is a demographic change, which alone would push public pension spending by 9.6 p.p. of GDP. The effect of a jump of dependency ratio factor in 2020-2030 decade is influenced not only by specific features of cohorts retiring and paying contributions but also by negative net migration (especially of young employees) through the period preceding 2020. The demographic pressure continues to influence pension spending through all projection period peaking in the last decade. Notably, pension formula of public scheme does not contain any longevity or
229

dependency ratio adjustment factor, therefore the level of benefits in DB system does not react to longer periods spent in retirement. The coverage ratio is the first strongest offsetting factor. The number of Old age pensioners follows a pattern of population 65+ growth with relatively small difference due to extinction of some kinds of the state pensions (e.g. pensions for victims and deprived persons) and stagnate development of other state pensions (officials and military personnel state pensions, judges, scientists, etc.) as well as widow’s pensions. Therefore decreasing number of Other than old age pensioners in relation to population 65+ is a result of shrinking population and reforms described above. Increase in employment rate is projected to offset demographic pressure only in the first decade (2007-2017), but its declining trend since 2020 to 2050 negates long-term effect on pension spending. The second offsetting factor – the benefit ratio – has a stable decreasing effect through the all projection period due to the partial switch of social security pensions to the private scheme. The slight tendency of strengthened effect reflects the maturation of statutory private scheme. Table 2: Factors behind the public pension expenditures between 2007 and 2060 (in percentage points
of GDP) 2007-20 2020-30 2030-40 2040-50 2050-60 2007-60
Public pensions to GDP in a starting year *
0.1 1.3 0.9 1.3 1.0 4.6
Dependence ratio 0.9 2.3 1.9 1.7 2.8 9.6 Coverage ratio 0.0 -0.7 -0.6 -0.1 -1.0 -2.4
1/Employment rate -0.3 0.2 0.1 0.1 -0.1 0.0 Benefit ratio -0.3 -0.3 -0.4 -0.4 -0.5 -1.8
* The starting year is 2007 for the column 2007-20 and 2020 for the column 2020-30, etc.
The replacement ratio of the social insurance scheme pensions increased in 2008 reflecting the changes in the pension formula (described above). Since 2008 the replacement rates of switchers and non-switchers to the private pension accumulation scheme will begin to differ. This difference will increase through the entire projection period. As social insurance pensions are assumed to evolve in line with wages the replacement rate of non-switchers will remain constant (36.2%) at 2008-year level, while replacement rates of switchers will decrease from 35% in 2008 to 27% in 2060. The loss of replacement rate has to be compensated through private funded part and it is expected Gender difference in replacement rates is an important feature of private mandatory pension scheme in Lithuania. There are two main factors affecting this: statutory retirement age (60 for female and 62.5 years for male) and life expectancy at retirement (7.3 years difference in 2008 and 6.4 - in 2060). This is reflected in annuity calculation through sex-specific life tables. Higher weight of female pensioners (64% of all pensioners in time of take up of the pension) lowers average replacement rate of all pensioners.
230

Table 3: Replacement rate and coverage by pension scheme (in %)127 2000 2007 2020 2030 2040 2050 2060
Social security scheme 0.0 32,3 35,3 33,4 31,0 30,0 29,1 Coverage * 100.0 100.0 100.0 100.0 100.0 100.0 100.0
Occupational scheme 0.0 0.0 0.0 0.0 0.0 0.0 0.0 Coverage 0.0 0.0 0.0 0.0 0.0 0.0 0.0
Private scheme 0.0 0,0 3,8 6,4 9,1 9,9 10,4 Coverage 0.0 0,0 20,4 41,8 57,5 66,3 76,6
* Coverage of each pension scheme is calculated as a ratio of the number of pensioners within the scheme and the total number of pensioners in the country.
The number of pensioners is much higher than the number of people aged 65+ because statutory retirement age is below 65 (its increase is not envisaged in the projection) and high number of disability pensioners below the standard retirement age. The number of pensioners decreased during 2000-2007 due to retirement age reform and smaller cohorts retiring (generation born during the Second World War). Since 2013 the number of pensioners and number of population aged 65+ is projected to grow, however, its ratio will show a declining trend as a result of decreasing number of pensioners other than old age ones. As a result of recent rapid economic growth, higher employment, higher economic activity of elderly and larger cohorts, the number of contributors has increased significantly and its growth is expected until 2015. The ratio of contributors to employment is stable. It slightly rises and exceeds 100 percent because age of the contributors might be higher as compared to age bracket (15-64) used for employment in the Table 3. The support ratio is expected to increase until 2011 (the reasons are described above) and after will dramatically go down by 50% from 1.6 contributors for each pensioner to 0.8 only.
Table 4: Number of pensioners and contributors in the Social security scheme (in 1000), population over 65 and total employment (in 1000) and related ratios (%)
2000 2007 2020 2030 2040 2050 2060 Number of pensioners (I) 941 912 974 1065 1108 1166 1157 Number of people aged 65+ (II) 483 527 566 683 767 813 884 Ratio of (I) and (II) 195 173 172 156 144 143 131 Number of contributors (III) 1300 1467 1477 1330 1212 1076 940 Employment(IV) 1382 1510 1493 1311 1181 1036 886 Ratio of (III) and (IV) 94 97 99 101 103 104 106 Ratio of (III) and (I) 'support ratio' 138 161 152 125 109 92 81
There is no fund that should be accumulated strictly for the purpose of covering pension-related expenditure and comply with all the criteria set down in the guidelines. The surplus accumulated in Lithuanian statutory pension scheme may be used for financing needs of the other social insurance strands (e.g. maternity, unemployment, etc.). The assets of private pension funds which comprise the statutory part of social security scheme are increasing rapidly.
127 Coverage of each pension scheme is calculated as a ratio of the number of pensioners within the scheme and the total number of pensioners in the country.
231

Table 5: Assets of pension funds and reserves, (% of GDP) 2000 2007 2020 2030 2040 2050 2060
Public Pension funds 0.0 0.0 0.0 0.0 0.0 0.0 0.0 Of which liquid financial assets, non-
consolidated 0.0 0.0 0.0 0.0 0.0 0.0 0.0
Of which liquid financial assets, consolidated
0.0 0.0 0.0 0.0 0.0 0.0 0.0
Occupational pensions 0.0 0.0 0.0 0.0 0.0 0.0 0.0 Private pensions 0.0 1.7 12.9 24.1 37.3 51.6 64.1 All pensions 0.0 1.7 12.9 24.1 37.3 51.6 64.1
2.4. Sensitivity analysis
Sensitivity analysis shows the different impact of different economic assumptions on the ratio of total pension expenditure to GDP. Higher life expectancy scenario generates higher public pension expenditure compared to the baseline scenario by 0.3 percentage points because of higher number of pensioners. There is no compensation mechanism in the pension formula that would reduce the effect of longevity. Private mandatory pension expenditure is supposed to be actuarially neutral. In contrast to above mentioned scenario public pension expenditure to GDP does not react to higher labour productivity factor because of pension indexation to the wage growth. For private mandatory pension scheme, the effect of increasing life expectancy offsets the effect of higher wage growth in the last decade of projection. This leads to slight (0.1 p.p.) decrease in total pension expenditure in 2060. High interest rate scenario has a significant impact on private mandatory pension scheme expenditure to GDP; it brings a 33% increase. Public scheme is not affected at all. The effect of higher employment factor is negligible (-0.1 p.p. of GDP) in comparison with baseline scenario, as GDP will grow at a higher pace than pension expenditure. In the case of Lithuania higher employment rate of older workers has no impact on the decrease in the number of pensioners. A postponement of the retirement age is not used, because of possibility to work and to get pension at the same time without any restrictions. Higher GDP created by older workers is quite fully offset by the resulting increase in the average pension (due to larger accumulated rights). So effect of higher employment rate of older workers is negligible (-0.1 p.p.). Recently a huge negative net migration of young population which brings a loss of future labour force due to non-born children is observed in the country. Therefore zero migration means an increase of labour force and leads to improved dependency ratio. The pension expenditure as % of GDP decreases by 0.3 percentage points despite of larger number of pensioners as compared to baseline scenario.
232
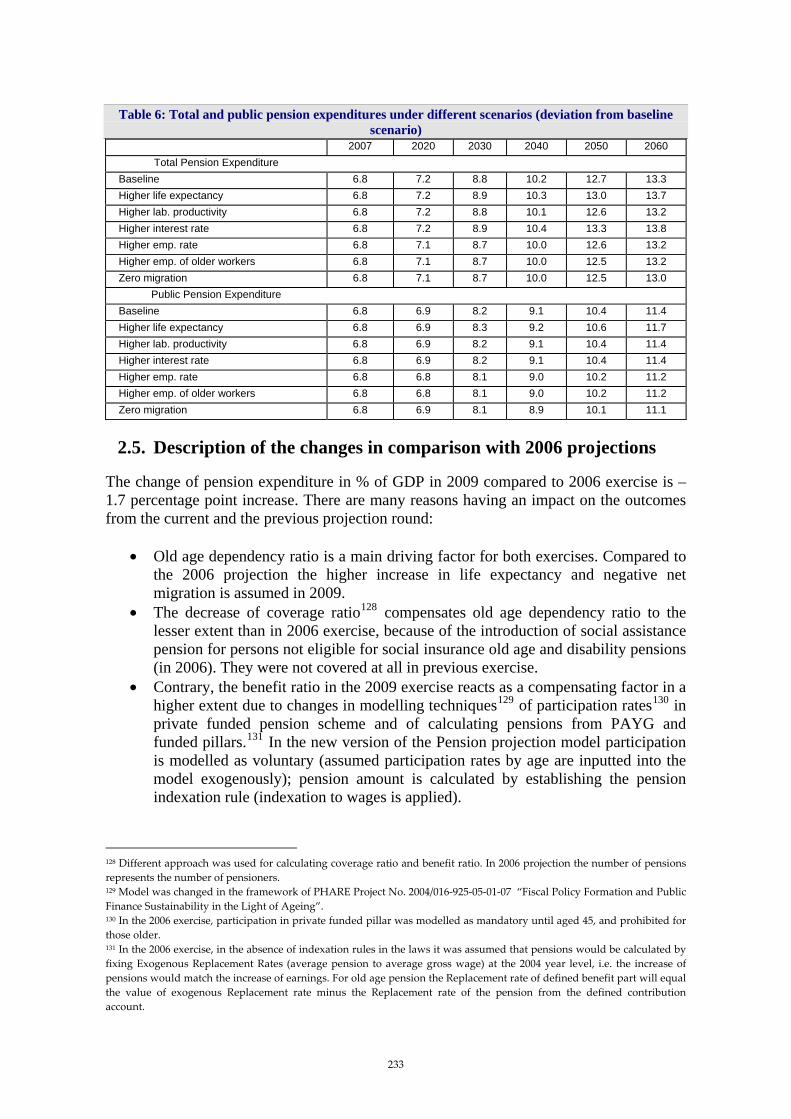
Table 6: Total and public pension expenditures under different scenarios (deviation from baseline scenario)
2007 2020 2030 2040 2050 2060 Total Pension Expenditure
Baseline 6.8 7.2 8.8 10.2 12.7 13.3 Higher life expectancy 6.8 7.2 8.9 10.3 13.0 13.7 Higher lab. productivity 6.8 7.2 8.8 10.1 12.6 13.2 Higher interest rate 6.8 7.2 8.9 10.4 13.3 13.8 Higher emp. rate 6.8 7.1 8.7 10.0 12.6 13.2 Higher emp. of older workers 6.8 7.1 8.7 10.0 12.5 13.2 Zero migration 6.8 7.1 8.7 10.0 12.5 13.0
Public Pension Expenditure Baseline 6.8 6.9 8.2 9.1 10.4 11.4 Higher life expectancy 6.8 6.9 8.3 9.2 10.6 11.7 Higher lab. productivity 6.8 6.9 8.2 9.1 10.4 11.4 Higher interest rate 6.8 6.9 8.2 9.1 10.4 11.4 Higher emp. rate 6.8 6.8 8.1 9.0 10.2 11.2 Higher emp. of older workers 6.8 6.8 8.1 9.0 10.2 11.2 Zero migration 6.8 6.9 8.1 8.9 10.1 11.1
2.5. Description of the changes in comparison with 2006 projections
The change of pension expenditure in % of GDP in 2009 compared to 2006 exercise is – 1.7 percentage point increase. There are many reasons having an impact on the outcomes from the current and the previous projection round:
• Old age dependency ratio is a main driving factor for both exercises. Compared to the 2006 projection the higher increase in life expectancy and negative net migration is assumed in 2009.
• The decrease of coverage ratio128 compensates old age dependency ratio to the lesser extent than in 2006 exercise, because of the introduction of social assistance pension for persons not eligible for social insurance old age and disability pensions (in 2006). They were not covered at all in previous exercise.
• Contrary, the benefit ratio in the 2009 exercise reacts as a compensating factor in a higher extent due to changes in modelling techniques129 of participation rates130 in private funded pension scheme and of calculating pensions from PAYG and funded pillars.131 In the new version of the Pension projection model participation is modelled as voluntary (assumed participation rates by age are inputted into the model exogenously); pension amount is calculated by establishing the pension indexation rule (indexation to wages is applied).
128 Different approach was used for calculating coverage ratio and benefit ratio. In 2006 projection the number of pensions represents the number of pensioners. 129 Model was changed in the framework of PHARE Project No. 2004/016-925-05-01-07 “Fiscal Policy Formation and Public Finance Sustainability in the Light of Ageing”. 130 In the 2006 exercise, participation in private funded pillar was modelled as mandatory until aged 45, and prohibited for those older. 131 In the 2006 exercise, in the absence of indexation rules in the laws it was assumed that pensions would be calculated by fixing Exogenous Replacement Rates (average pension to average gross wage) at the 2004 year level, i.e. the increase of pensions would match the increase of earnings. For old age pension the Replacement rate of defined benefit part will equal the value of exogenous Replacement rate minus the Replacement rate of the pension from the defined contribution account.
233
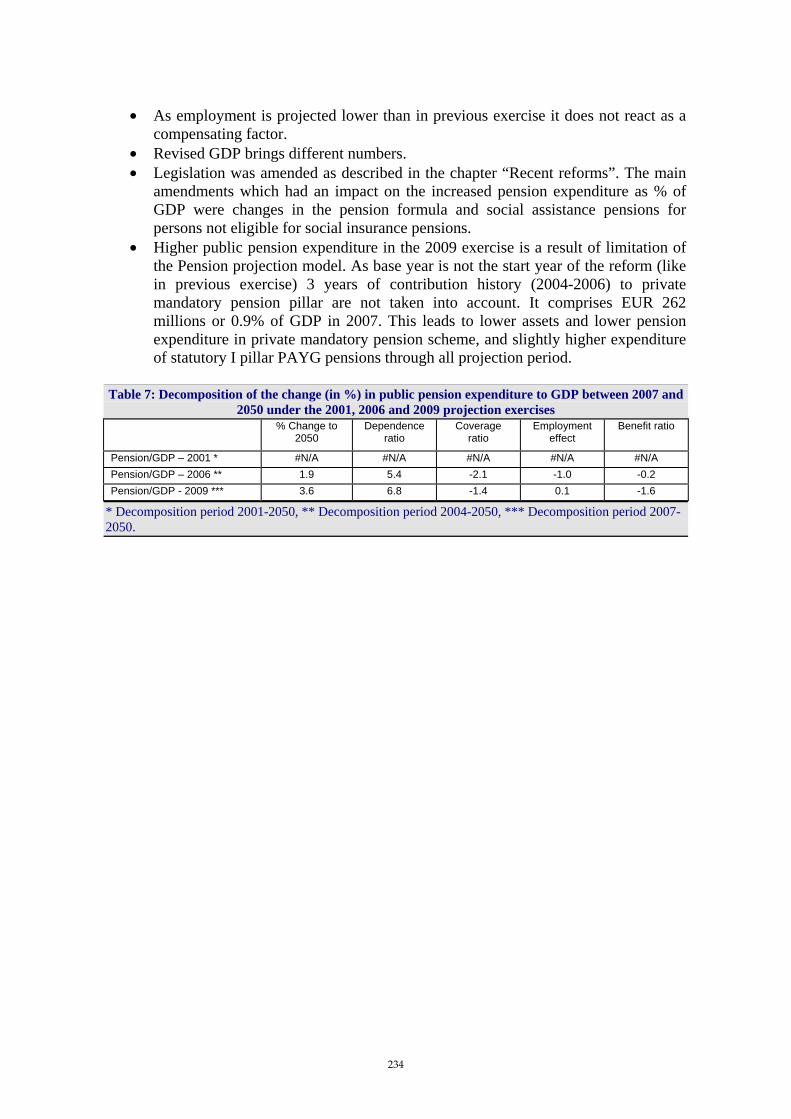
• As employment is projected lower than in previous exercise it does not react as a compensating factor.
• Revised GDP brings different numbers. • Legislation was amended as described in the chapter “Recent reforms”. The main
amendments which had an impact on the increased pension expenditure as % of GDP were changes in the pension formula and social assistance pensions for persons not eligible for social insurance pensions.
• Higher public pension expenditure in the 2009 exercise is a result of limitation of the Pension projection model. As base year is not the start year of the reform (like in previous exercise) 3 years of contribution history (2004-2006) to private mandatory pension pillar are not taken into account. It comprises EUR 262 millions or 0.9% of GDP in 2007. This leads to lower assets and lower pension expenditure in private mandatory pension scheme, and slightly higher expenditure of statutory I pillar PAYG pensions through all projection period.
Table 7: Decomposition of the change (in %) in public pension expenditure to GDP between 2007 and
2050 under the 2001, 2006 and 2009 projection exercises % Change to
2050 Dependence
ratio Coverage
ratio Employment
effect Benefit ratio
Pension/GDP – 2001 * #N/A #N/A #N/A #N/A #N/A Pension/GDP – 2006 ** 1.9 5.4 -2.1 -1.0 -0.2 Pension/GDP - 2009 *** 3.6 6.8 -1.4 0.1 -1.6
* Decomposition period 2001-2050, ** Decomposition period 2004-2050, *** Decomposition period 2007-2050.
234

Luxembourg (Report prepared by Tom Dominique)
1. Overview of the pension system
Numerous instruments have been created in the Grand Duchy of Luxembourg to ensure that elder people continue to receive an income. These instruments may be categorised as follows:
- the general scheme for the private sector, - special schemes for the public sector, - supplementary schemes for the private sector, - private pension plans, and - social assistance.
1.1. The general pension scheme of the private sector
The general pension scheme in Luxembourg is based on a system of compulsory insurance derived from the system introduced by Bismarck. Apart from civil servants and other employees of the government, local authorities, public institutions and the railways, which have their own statutory schemes, all those who are covered by pension insurance in Luxembourg belong to the general pension scheme. Those people who belong to a pension scheme by virtue of working for an international body are not subject to the national scheme. The general pension scheme in Luxembourg comprises invalidity, retirement and surviving dependants’ pensions. The general pension scheme guarantees its members a minimum personal pension (€1 401), provided that they have belonged to the scheme for at least 40 years (total membership period). It is reduced by one fortieth of the amount of the personal pension for each missing year, down to an eligibility threshold of 20 years. The monthly retirement pension comprises the following main elements:
- one twelfth of the annual pro rata enhancement corresponding to 1.85% of the total of eligible pay and other contributory income,
- one twelfth of the annual incremental enhancement: for each full year of the recipient’s life after his or her 55th birthday and for each year of contribution in excess of 38 years, the pro rata enhancement is increased by 0.01% up to a ceiling of 2.05% of total eligible pay and other contributory income,
- a flat-rate bonus calculated on the basis of the number of qualifying years (€366) for a working lifetime of 40 years), which include not only years for which compulsory contributions have been paid but also credited non-contributory periods such as years of study or years taken off to bring up children; the number of qualifying years is capped at 40, and
- one twelfth of the end-of-year allowance (€598 per annum for a 40-year working lifetime); the periods taken into account are the same as for the flat-rate bonus.
Any insured person who has reached his or her 65th birthday is entitled to a retirement pension, subject to proof of at least 120 months’ compulsory and/or voluntary insurance.
235

Any insured person who has reached his or her 60th birthday is entitled to an early retirement pension, subject to proof of 480 months’ compulsory and/or voluntary insurance, including credited non-contributory periods, provided that compulsory insurance accounts for at least 120 months of this total. Any insured person who has reached his or her 57th birthday is entitled to an early retirement pension, subject to proof of 480 months’ compulsory insurance. Invalidity pensions are calculated in the same way as retirement pensions. In order to ensure that recipients of invalidity pensions receive an adequate income, however, the period taken into account for the pro rata enhancement is extended to the age of 55 (special pro rata enhancement), the amount of the enhancement being derived from a notional salary corresponding to the average of the monthly salaries on which actual contributions have been paid. The period on which the flat-rate enhancement is based is notionally extended to the recipient’s 65th birthday (special flat-rate enhancement). The surviving spouse’s pension comprises three quarters of the pro rata enhancement, including any incremental or special enhancement, the entire flat-rate enhancement, including any special enhancement, and the entire end-of-year allowance to which the insured was or would have been entitled. Abatement provisions apply if the surviving spouse’s total income exceeds a fixed ceiling. The surviving child’s pension comprises one quarter of the pro rata enhancement, including any incremental or special enhancement, one third of the flat-rate enhancement, including any special enhancement, and one third of the end-of-year allowance.
1.2. Special pension schemes for the public sector
The public sector comprises the civil service proper, Luxembourg National Railways, the local authorities and public institutions whose staff are subject to a special pension scheme that differs from the general scheme as defined in the Social Insurance Code. The public sector has two distinct pension schemes: the original scheme, now known as the transitional special pension scheme, which has undergone numerous amendments, and the new special pension scheme, which, apart from a few specific procedural and funding features, essentially corresponds to the general pension scheme. In the transitional scheme for civil servants and persons treated as such who were in post on 31 December 1998 or had been appointed by that date, the features of the old scheme have been preserved; in other words, the pension is calculated on the basis of the final salary earned by the public servant. For years of service after 1 January 1999, the reference replacement rate is lowered in stages from 83.33% to 72%. However, public servants who have completed a full service career of 35 or 40 years when they become eligible for early retirement at the age of 55 or 60 can enhance the value of their pension by 2.31% of their pensionable pay for each year of service beyond that age. In this way, they can obtain, at the age of 60 or 65 as appropriate, a pension corresponding to five sixths (83.33%) of their final pay, i.e. the maximum pension available under the old scheme. Pensions awarded prior to the entry into force of the new law were not affected by the 1999 reform. Applying to employees who entered the public service after 31 December 1998, the new scheme retains the status of a special scheme, but it is based on the same principles as the general scheme for the private sector, with the exception of the income ceiling for the assessment of contributions.
236

1.3. Supplementary pension schemes
The law provides for a statutory framework designed to protect the rights of employees and to put the various supplementary pension schemes on the same fiscal footing; these schemes are either internally funded by companies through provisions in the balance sheet or externally funded in the form of a pension fund or group policy. The legislative act in question applies to all supplementary pension schemes established after its entry into force and to existing schemes which give rise to payouts of a capital sum or annuity after its entry into force. The law applies to supplementary schemes established by a company for all of its employees or for certain categories of its employees but not to promises made to individual members of staff. Every company is free to establish one or more supplementary pension schemes and to determine their organisational structure, the conditions of membership, the funding arrangements, the level of benefits, the ways in which benefits are assigned and the rules governing the amendment and termination of the scheme.
1.4. Individual pension plans
A pension plan is a contract between an insurer and an individual. From a fiscal point of view, the cost of premiums paid into a pension plan is tax-deductible under the heading of special expenses. As for membership, the scheme is accessible to all taxpayers residing in the Grand Duchy of Luxembourg as well as to non-residents who opt to be treated in the same way as residents for tax purposes, on condition that at least 90% of their total earned income from domestic and foreign sources is taxable in the Grand Duchy of Luxembourg. The relevant legislation provides for:
- freedom to make payments to an insurance company or credit institution for capital-redemption products with or without a guaranteed return,
- scope for the restitution of accumulated savings to the beneficiary if the policyholder dies before the expiry of the policy,
- the possibility of a final lump-sum benefit, limited to 50% of the accumulated savings, with the remainder in the form of a life annuity, payable monthly,
- taxation of benefits at half the standard rate after exemption of 50% of the life annuity,
- a graduated tax allowance ranging from €1 500 to €3 200, and - prohibition of the use of a personal pension plan as security, as a pledge, etc.
1.5. Social assistance
Unlike the general pension scheme, which is an instrument of social security based on solidarity between people in different income brackets and between generations, the minimum guaranteed income (€1 119 for single person) is defined as a measure of social assistance provided by the public authorities to individuals with insufficient financial resources.
237
1.6. The pension fund of the general pension scheme of the private sector
The thinking behind the establishment of the general pension scheme Recoupment Fund [Fonds de Compensation or FDC] was to enable the scheme’s reserve to benefit from developments in the financial markets by diversifying its assets while taking account of both risk and return criteria. Before the reform, the surplus from the four pension funds concerned was invested only in short-term deposits, bonds, financial loans and real estate. In 1999, with a view to making management of the reserve more flexible, the Government announced in its coalition programme that a study was to be carried out, looking on the one hand at the structure of the reserve, and on the other at the general pension scheme’s investment policy. A study conducted in 2001 by Pricewaterhouse Coopers provided a basis for important decisions about the financial management of the reserve. One of the study’s aims was to formulate an investment strategy that would:
- promote sustainable asset growth and strengthen the reserve, - minimise investment risks, - comply with a prudential control regime and enable the pension scheme to meet its
commitments, - ensure efficient diversification, - comply with minimum-financing rules - restrict low-yield short-term investment.
The study also set out recommendations for an operational management approach, namely:
- passive, concession-based management rather than active management, - outsourcing the management of specific types of assets to a number of asset
management companies, - establishing a compartmentalised ‘collective investment body’ [organisme de
placement collectif or OPC]. On the basis of this preliminary work, the General Pension Scheme Assets Administration Law of 6 May 2004 was adopted, stipulating that a public body should have responsibility for managing the general pension scheme reserve and authorising that body to invest the reserve with the aim of securing the long-term viability of the scheme. Over the three years following adoption of the 2004 Law, its provisions were implemented by the bodies responsible through the creation of an investment company with variable capital – a specialised investment fund known as the Social Security Recoupment Fund [FDC de la Sécurité Sociale, SICAV-FIS]. Portfolio managers, a deposit bank, a central administration and a company auditor were also designated. The first investments were made in August 2007. The FDC strategy is to pursue maximum return on investment subject to specific risk criteria. The current favourable situation on the labour market means that it can plan its investments over more than 10 years. Although the general pension scheme’s reserve stands at a level three times its annual expenditure, the system of financing in Luxembourg is based on seven-year periods of coverage and cannot be regarded to any significant degree as a funded system. The recoupment reserve will be used, when necessary, to guarantee the pension scheme’s
238

outgoings for a transitional period. Contribution levels are fixed at the beginning of each period in order to secure the scheme’s financing throughout that period, while maintaining the reserve at a level at least 1.5 times that of expenditure. The total rate of contribution is 16% of assessable income, which is split equally between employer and employee. The state contributes to the general pension scheme at a rate of 8% of aggregate assessable income. Income from contributions is currently running well ahead of expenditure on benefits, and the level of contribution-based income, fixed at 24% of the contributions base, is around 3% in excess of that required by a straightforward burden-sharing system. This surplus is assigned to the recoupment reserve and, so long as population trends sustain the current favourable ratio of workers to pensioners, the level of that reserve should keep rising The impact of the rate of return on the scheme’s financial equilibrium is, however, limited. To produce the scenario of perpetual financial equilibrium and given the machinery for pegging pension levels to rising wage levels (through indexing, which takes effect directly, or adjustment, where there is a slight time lag), the rate of return from the reserve would have to surpass or at least equal the growth rate of wages. However, comparing annual rates of adjustment in pension levels with the rates of return on the reserve for the last 20 years shows that the latter have been only marginally higher than the former. Taking selective pension re-evaluations (as in 1987, 1988, 1991 and 2002) into account, it is more than likely that the rate of return from the reserve fell below the rates of adjustment in pension levels over the period 1990 to 2006. The key task of the FDC – set up in 2004 and operational since January 2007 – is to optimise the way in which the general pension scheme’s recoupment reserve is managed and to achieve investment security while minimising the risk inherent in the financial markets.
1.7. Indexation of pensions and social assistance
Pensions, as well as social assistance, are automatically adjusted to price evolution each time prices increase by more than 2.5%. In addition, pensions are adjusted every two years to the real wage evolution. Whereas price indexation is automatic, the decision on indexing pensions to wage evolution is the responsibility of government and has to be approved by the parliament. Index-linking to wages was common practice in the past.
1.8. Pension system financing
The funding of the general pension scheme is based on a system of division into seven-year coverage periods with mandatory formation of a reserve fund exceeding one and a half times the total amount of annual expenditure. The contribution rate is set at the start of each seven-year period at such a level as to guarantee the funding of the scheme throughout the period. The rate, half of which is payable by the employer and half by the employee, amounts to 16% of assessable income. The state also makes a contribution, amounting to a further 8% of total assessable income. The state also intervenes in the payment of certain contributions on behalf of insured persons. Pensions awarded under the special transitional scheme and the special scheme are paid by the public treasury. The members of these schemes contribute at the rate of 8% of gross income. Pension funds serve to channel the expenditure and receipts of the special schemes.
239
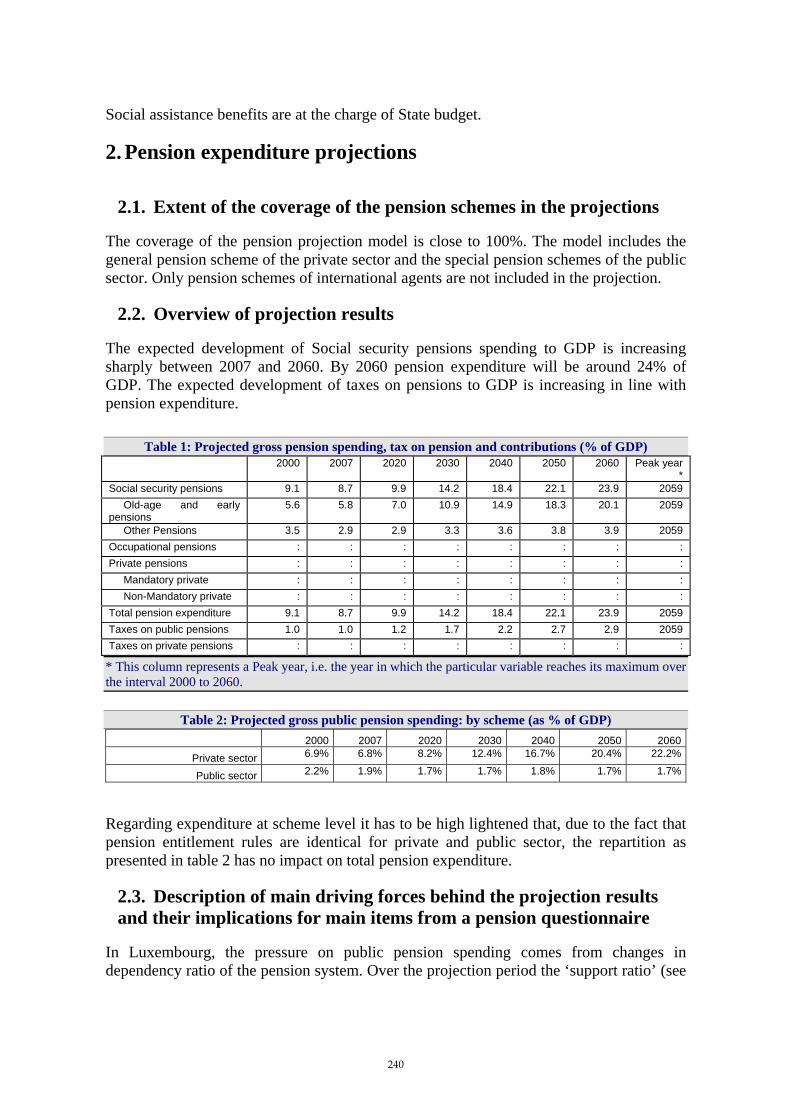
Social assistance benefits are at the charge of State budget.
2. Pension expenditure projections
2.1. Extent of the coverage of the pension schemes in the projections
The coverage of the pension projection model is close to 100%. The model includes the general pension scheme of the private sector and the special pension schemes of the public sector. Only pension schemes of international agents are not included in the projection.
2.2. Overview of projection results
The expected development of Social security pensions spending to GDP is increasing sharply between 2007 and 2060. By 2060 pension expenditure will be around 24% of GDP. The expected development of taxes on pensions to GDP is increasing in line with pension expenditure.
Table 1: Projected gross pension spending, tax on pension and contributions (% of GDP) 2000 2007 2020 2030 2040 2050 2060 Peak year
* Social security pensions 9.1 8.7 9.9 14.2 18.4 22.1 23.9 2059 Old-age and early pensions
5.6 5.8 7.0 10.9 14.9 18.3 20.1 2059
Other Pensions 3.5 2.9 2.9 3.3 3.6 3.8 3.9 2059 Occupational pensions : : : : : : : : Private pensions : : : : : : : : Mandatory private : : : : : : : : Non-Mandatory private : : : : : : : : Total pension expenditure 9.1 8.7 9.9 14.2 18.4 22.1 23.9 2059 Taxes on public pensions 1.0 1.0 1.2 1.7 2.2 2.7 2.9 2059 Taxes on private pensions : : : : : : : :
* This column represents a Peak year, i.e. the year in which the particular variable reaches its maximum over the interval 2000 to 2060.
Table 2: Projected gross public pension spending: by scheme (as % of GDP) 2000 2007 2020 2030 2040 2050 2060
Private sector 6.9% 6.8% 8.2% 12.4% 16.7% 20.4% 22.2%
Public sector 2.2% 1.9% 1.7% 1.7% 1.8% 1.7% 1.7%
Regarding expenditure at scheme level it has to be high lightened that, due to the fact that pension entitlement rules are identical for private and public sector, the repartition as presented in table 2 has no impact on total pension expenditure.
2.3. Description of main driving forces behind the projection results and their implications for main items from a pension questionnaire
In Luxembourg, the pressure on public pension spending comes from changes in dependency ratio of the pension system. Over the projection period the ‘support ratio’ (see
240
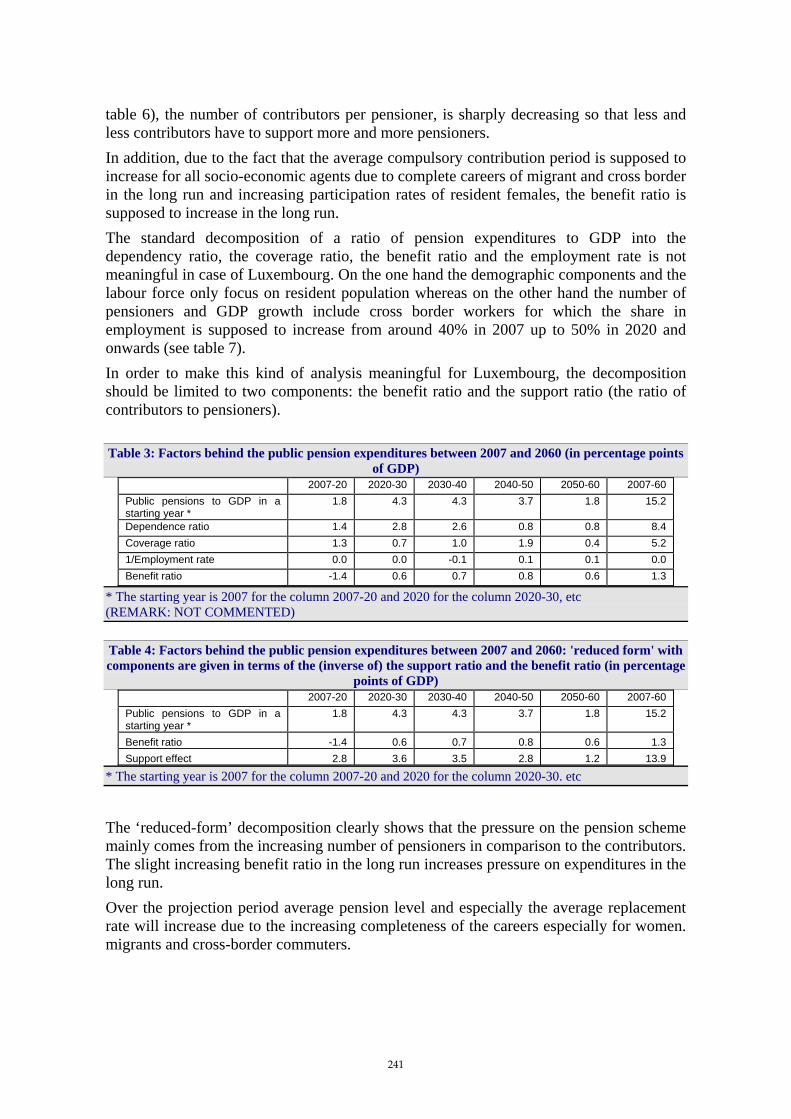
table 6), the number of contributors per pensioner, is sharply decreasing so that less and less contributors have to support more and more pensioners. In addition, due to the fact that the average compulsory contribution period is supposed to increase for all socio-economic agents due to complete careers of migrant and cross border in the long run and increasing participation rates of resident females, the benefit ratio is supposed to increase in the long run. The standard decomposition of a ratio of pension expenditures to GDP into the dependency ratio, the coverage ratio, the benefit ratio and the employment rate is not meaningful in case of Luxembourg. On the one hand the demographic components and the labour force only focus on resident population whereas on the other hand the number of pensioners and GDP growth include cross border workers for which the share in employment is supposed to increase from around 40% in 2007 up to 50% in 2020 and onwards (see table 7). In order to make this kind of analysis meaningful for Luxembourg, the decomposition should be limited to two components: the benefit ratio and the support ratio (the ratio of contributors to pensioners). Table 3: Factors behind the public pension expenditures between 2007 and 2060 (in percentage points
of GDP) 2007-20 2020-30 2030-40 2040-50 2050-60 2007-60 Public pensions to GDP in a starting year *
1.8 4.3 4.3 3.7 1.8 15.2
Dependence ratio 1.4 2.8 2.6 0.8 0.8 8.4 Coverage ratio 1.3 0.7 1.0 1.9 0.4 5.2 1/Employment rate 0.0 0.0 -0.1 0.1 0.1 0.0 Benefit ratio -1.4 0.6 0.7 0.8 0.6 1.3
* The starting year is 2007 for the column 2007-20 and 2020 for the column 2020-30, etc (REMARK: NOT COMMENTED) Table 4: Factors behind the public pension expenditures between 2007 and 2060: 'reduced form' with components are given in terms of the (inverse of) the support ratio and the benefit ratio (in percentage
points of GDP) 2007-20 2020-30 2030-40 2040-50 2050-60 2007-60 Public pensions to GDP in a starting year *
1.8 4.3 4.3 3.7 1.8 15.2
Benefit ratio -1.4 0.6 0.7 0.8 0.6 1.3 Support effect 2.8 3.6 3.5 2.8 1.2 13.9
* The starting year is 2007 for the column 2007-20 and 2020 for the column 2020-30. etc
The ‘reduced-form’ decomposition clearly shows that the pressure on the pension scheme mainly comes from the increasing number of pensioners in comparison to the contributors. The slight increasing benefit ratio in the long run increases pressure on expenditures in the long run. Over the projection period average pension level and especially the average replacement rate will increase due to the increasing completeness of the careers especially for women. migrants and cross-border commuters.
241

Table 5: Replacement rate and coverage by pension scheme (in %)132 2000 2007 2020 2030 2040 2050 2060 Social security scheme 55.0 53.0 55.0 56.0 61.0 62.0 62.0 Coverage * 100.8 100.0 99.6 100.3 99.8 100.0 99.8 Occupational scheme : : : : : : : Coverage : : : : : : : Private scheme : : : : : : : Coverage : : : : : : :
* Coverage of each pension scheme is calculated as a ratio of the number of pensioners within the scheme and the total number of pensioners in the country.
Table 6: Number of pensioners and contributors in the Social security scheme (in 1000), population over 65 and total employment (in 1000) and related ratios (%)
2000 2007 2020 2030 2040 2050 2060 Number of pensioners (I) 122 146 226 320 417 504 551 Number of people aged 65+ (II) 62 67 89 119 146 160 172 Ratio of (I) and (II) 197 218 253 270 286 314 320 Number of contributors (III) 269 342 447 468 491 517 536 Employment(IV) 180 205 235 246 258 271 281 Ratio of (III) and (IV) 150 167 190 190 191 191 191 Ratio of (III) and (I) 'support ratio'
220 234 198 146 118 103 97
The dynamics of the projection are such that the number of pensioners will increase sharply over the period 2020-2040. In addition to the resident aging population, the take-up rate of pensions of cross-border workers will increase as they become eligible for benefits. Due to the AWG assumptions of decreased employment growth from 2020 onwards the proportion of contributors to pensioners will decrease continuously over the projection period. Table 7: Number of pensioners and contributors in the Social security scheme (in 1000), by residency
2000 2007 2020 2030 2040 2050 2060resident pensioners 83 98 149 194 226 248 268cross border pensioners 38 48 77 125 191 256 284 resident contributors 178 197 228 242 258 272 279cross border contributors 91 145 219 226 233 244 257
The increase of the pension reserve up to 2025 is generated by two factors. On the one hand actual contribution income is higher than pension expenditure over that period so that pension reserve will increase. On the other hand, supplementary receipts are generated by the reserve fund itself. In the medium term financial surplus is guaranteed for the general pension scheme. But the sustainability of the scheme is not projected to last until the year 2060. By 2025 the balance of the general scheme turns negative and the assets will be exhausted by 2040.
132 Coverage of each pension scheme is calculated as a ratio of the number of pensioners within the scheme and the total number of pensioners in the country.
242

Table 8: Assets of pension funds and reserves (% of GDP) 2000 2007 2020 2030 2040 2050 2060 Public Pension funds 18.9 21.8 46.0 39.3 -14.4 -116.0 -258.4 Of which liquid financial assets. non-consolidated
: : : : : : :
Of which liquid financial assets. consolidated
: : : : : : :
Occupational pensions : : : : : : : Private pensions : : : : : : : All pensions 18.9 21.8 46.0 39.3 -14.4 -116.0 -258.4
Table 9: Assets portfolio
general pension scheme as of 31.12.2007 Liquidity and monetary funds 60.2%Bonds and bond fund 16.9%Equities and equity fund 4.0%Real estate 2.7%Loans 7.1%Other assets 9.1%Total 100.0%
2.4. Sensitivity analysis
Two out of the 6 sensitivity tests impact sensibly on GDP growth in the long run. Increased labour productivity leads to a higher growth rate whereas a decrease of labour input due to missing migrant work force results in a lower growth in the long run. The higher life expectancy scenario mainly affects pension expenditure in the long run. The high labour productivity scenario increases the income base and the resulting contributions to the pension scheme over the whole projection period. Higher productivity leads to higher pension adjustments over the whole projection period and in addition individual amplified life time income will put pressure on the expenditure side in the long run. The higher interest rate scenario only leads to an increased accumulation of the reserve fund over the projection period, without however having although any major impact on receipts of the pension system. The higher employment rate scenario generates higher contribution receipts over the whole projection period whereas higher pension expenditures are to be expected in the long run. The higher employment rate of older workers scenario increases income base as the number of contributors increases. In the short run, a slight decrease of expenditure occurs due to increased professional activity of older workers. Or the resulting accumulation of life time income leads to an increase of expenditure in the long run. Finally the zero migration scenario clearly shows the expose of the Luxembourg economy on migrant labour force. Apart the steep decrease of GDP growth to be expected in the long run due to missing labour input, this scenario clearly shows to what extend non national labour input impacts on the sustainability of the pension system.
243
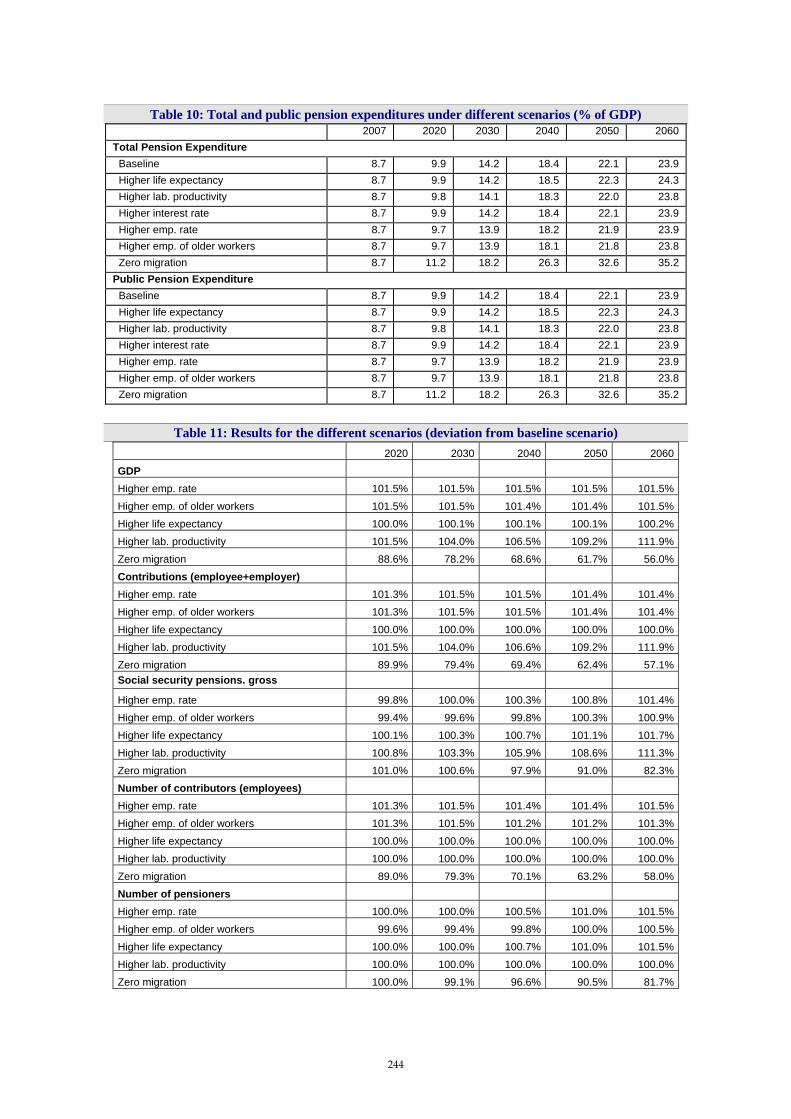
Table 10: Total and public pension expenditures under different scenarios (% of GDP) 2007 2020 2030 2040 2050 2060 Total Pension Expenditure Baseline 8.7 9.9 14.2 18.4 22.1 23.9 Higher life expectancy 8.7 9.9 14.2 18.5 22.3 24.3 Higher lab. productivity 8.7 9.8 14.1 18.3 22.0 23.8 Higher interest rate 8.7 9.9 14.2 18.4 22.1 23.9 Higher emp. rate 8.7 9.7 13.9 18.2 21.9 23.9 Higher emp. of older workers 8.7 9.7 13.9 18.1 21.8 23.8 Zero migration 8.7 11.2 18.2 26.3 32.6 35.2 Public Pension Expenditure Baseline 8.7 9.9 14.2 18.4 22.1 23.9 Higher life expectancy 8.7 9.9 14.2 18.5 22.3 24.3 Higher lab. productivity 8.7 9.8 14.1 18.3 22.0 23.8 Higher interest rate 8.7 9.9 14.2 18.4 22.1 23.9 Higher emp. rate 8.7 9.7 13.9 18.2 21.9 23.9 Higher emp. of older workers 8.7 9.7 13.9 18.1 21.8 23.8 Zero migration 8.7 11.2 18.2 26.3 32.6 35.2
Table 11: Results for the different scenarios (deviation from baseline scenario)
2020 2030 2040 2050 2060GDP Higher emp. rate 101.5% 101.5% 101.5% 101.5% 101.5%Higher emp. of older workers 101.5% 101.5% 101.4% 101.4% 101.5%Higher life expectancy 100.0% 100.1% 100.1% 100.1% 100.2%Higher lab. productivity 101.5% 104.0% 106.5% 109.2% 111.9%Zero migration 88.6% 78.2% 68.6% 61.7% 56.0%Contributions (employee+employer) Higher emp. rate 101.3% 101.5% 101.5% 101.4% 101.4%Higher emp. of older workers 101.3% 101.5% 101.5% 101.4% 101.4%Higher life expectancy 100.0% 100.0% 100.0% 100.0% 100.0%Higher lab. productivity 101.5% 104.0% 106.6% 109.2% 111.9%Zero migration 89.9% 79.4% 69.4% 62.4% 57.1%Social security pensions. gross Higher emp. rate 99.8% 100.0% 100.3% 100.8% 101.4%Higher emp. of older workers 99.4% 99.6% 99.8% 100.3% 100.9%Higher life expectancy 100.1% 100.3% 100.7% 101.1% 101.7%Higher lab. productivity 100.8% 103.3% 105.9% 108.6% 111.3%Zero migration 101.0% 100.6% 97.9% 91.0% 82.3%Number of contributors (employees) Higher emp. rate 101.3% 101.5% 101.4% 101.4% 101.5%Higher emp. of older workers 101.3% 101.5% 101.2% 101.2% 101.3%Higher life expectancy 100.0% 100.0% 100.0% 100.0% 100.0%Higher lab. productivity 100.0% 100.0% 100.0% 100.0% 100.0%Zero migration 89.0% 79.3% 70.1% 63.2% 58.0%Number of pensioners Higher emp. rate 100.0% 100.0% 100.5% 101.0% 101.5%Higher emp. of older workers 99.6% 99.4% 99.8% 100.0% 100.5%Higher life expectancy 100.0% 100.0% 100.7% 101.0% 101.5%Higher lab. productivity 100.0% 100.0% 100.0% 100.0% 100.0%Zero migration 100.0% 99.1% 96.6% 90.5% 81.7%
244
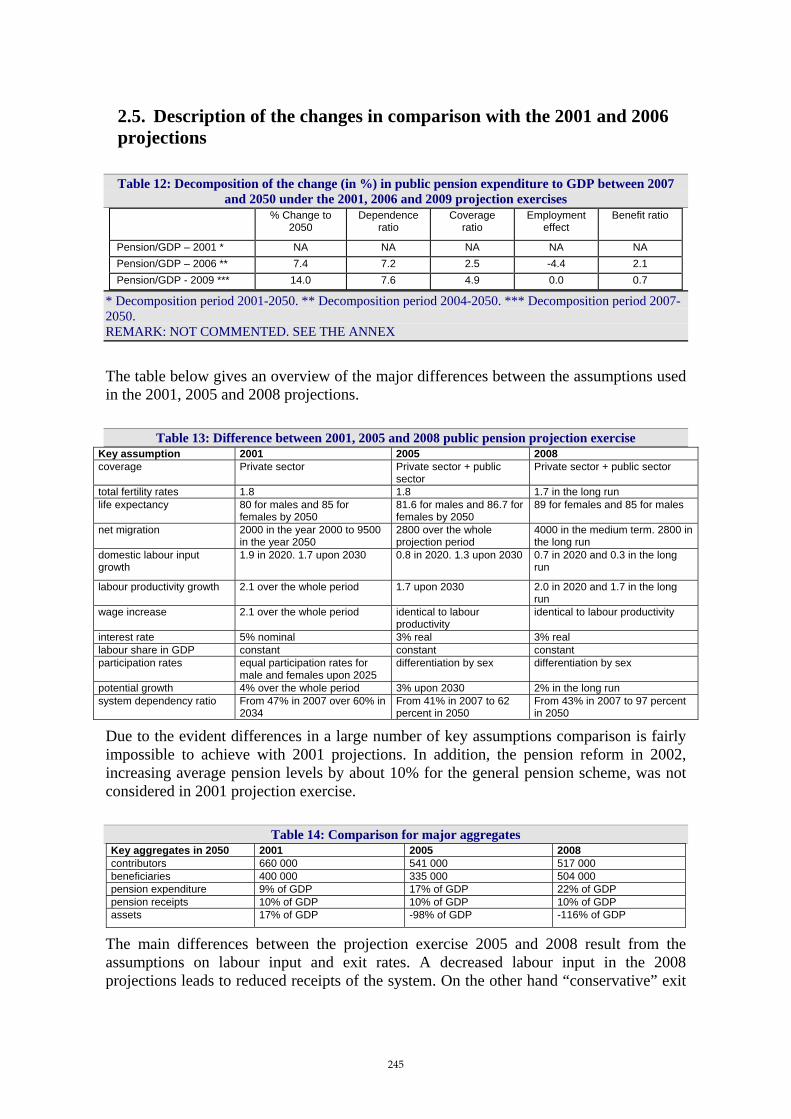
2.5. Description of the changes in comparison with the 2001 and 2006 projections
Table 12: Decomposition of the change (in %) in public pension expenditure to GDP between 2007
and 2050 under the 2001, 2006 and 2009 projection exercises % Change to
2050 Dependence
ratio Coverage
ratio Employment
effect Benefit ratio
Pension/GDP – 2001 * NA NA NA NA NA Pension/GDP – 2006 ** 7.4 7.2 2.5 -4.4 2.1 Pension/GDP - 2009 *** 14.0 7.6 4.9 0.0 0.7
* Decomposition period 2001-2050. ** Decomposition period 2004-2050. *** Decomposition period 2007-2050. REMARK: NOT COMMENTED. SEE THE ANNEX The table below gives an overview of the major differences between the assumptions used in the 2001, 2005 and 2008 projections.
Table 13: Difference between 2001, 2005 and 2008 public pension projection exercise Key assumption 2001 2005 2008 coverage Private sector Private sector + public
sector Private sector + public sector
total fertility rates 1.8 1.8 1.7 in the long run life expectancy 80 for males and 85 for
females by 2050 81.6 for males and 86.7 for females by 2050
89 for females and 85 for males
net migration 2000 in the year 2000 to 9500 in the year 2050
2800 over the whole projection period
4000 in the medium term. 2800 in the long run
domestic labour input growth
1.9 in 2020. 1.7 upon 2030 0.8 in 2020. 1.3 upon 2030 0.7 in 2020 and 0.3 in the long run
labour productivity growth 2.1 over the whole period 1.7 upon 2030 2.0 in 2020 and 1.7 in the long run
wage increase 2.1 over the whole period identical to labour productivity
identical to labour productivity
interest rate 5% nominal 3% real 3% real labour share in GDP constant constant constant participation rates equal participation rates for
male and females upon 2025 differentiation by sex differentiation by sex
potential growth 4% over the whole period 3% upon 2030 2% in the long run system dependency ratio From 47% in 2007 over 60% in
2034 From 41% in 2007 to 62 percent in 2050
From 43% in 2007 to 97 percent in 2050
Due to the evident differences in a large number of key assumptions comparison is fairly impossible to achieve with 2001 projections. In addition, the pension reform in 2002, increasing average pension levels by about 10% for the general pension scheme, was not considered in 2001 projection exercise.
Table 14: Comparison for major aggregates Key aggregates in 2050 2001 2005 2008 contributors 660 000 541 000 517 000 beneficiaries 400 000 335 000 504 000 pension expenditure 9% of GDP 17% of GDP 22% of GDP pension receipts 10% of GDP 10% of GDP 10% of GDP assets 17% of GDP -98% of GDP -116% of GDP
The main differences between the projection exercise 2005 and 2008 result from the assumptions on labour input and exit rates. A decreased labour input in the 2008 projections leads to reduced receipts of the system. On the other hand “conservative” exit
245
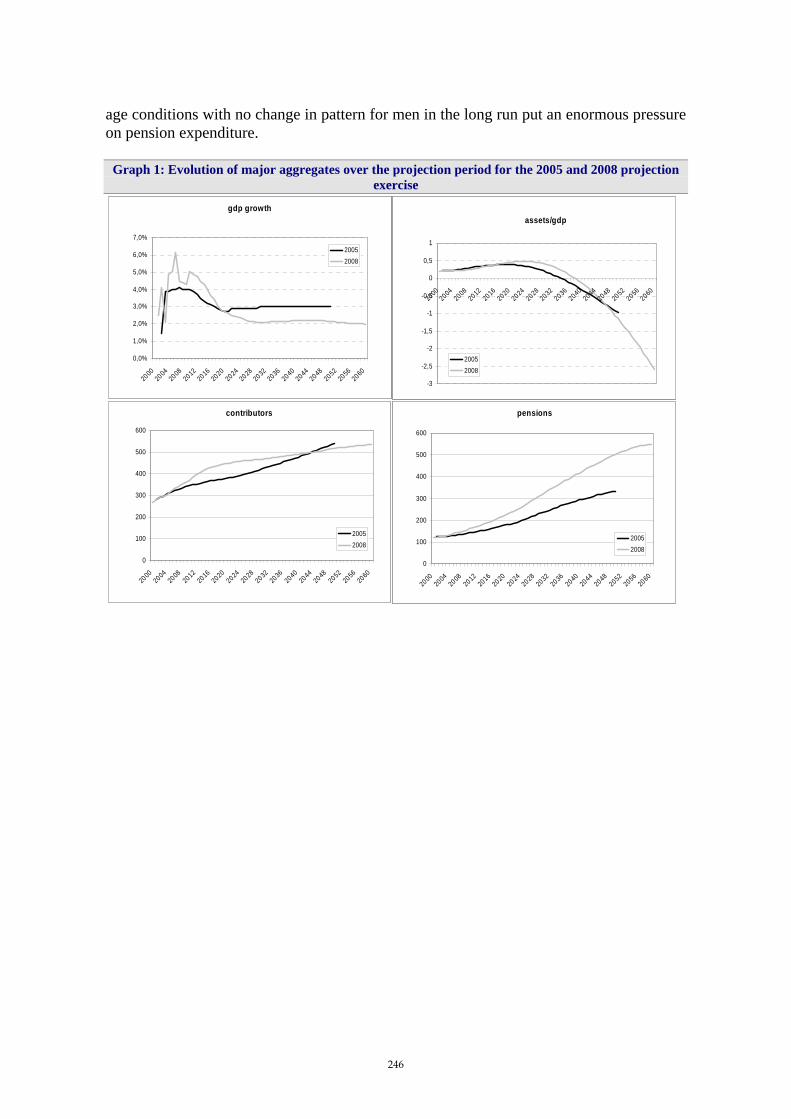
age conditions with no change in pattern for men in the long run put an enormous pressure on pension expenditure.
Graph 1: Evolution of major aggregates over the projection period for the 2005 and 2008 projection exercise
contributors
0
100
200
300
400
500
600
20002004
20082012
20162020
20242028
20322036
20402044
20482052
20562060
20052008
pensions
0
100
200
300
400
500
600
20002004
20082012
20162020
20242028
20322036
20402044
20482052
20562060
20052008
gdp growth
0,0%
1,0%
2,0%
3,0%
4,0%
5,0%
6,0%
7,0%
20002004
20082012
20162020
20242028
20322036
20402044
20482052
20562060
20052008
assets/gdp
-3
-2,5
-2
-1,5
-1
-0,5
0
0,5
1
20002004
20082012
20162020
20242028
20322036
20402044
20482052
20562060
20052008
246
Hungary (Report prepared by Edit Lendvai and Marton Szili)
1. Overview of the pension system
1.1. Structure of the pension system
Since the 1997 pension reform the mandatory pension system consists of two pillars. The first pillar is a uniform publicly managed, pay-as-you-go financed, defined-benefit, social security pension scheme. It provides earnings-related old-age, disability and survivors benefits, which are financed mainly from separate pension contributions. The second pillar of the compulsory pension system is operated by funded, defined contribution, personal, private pension funds (currently 20 in number). Funds accumulate and invest contributions paid by their members onto their individual accounts. At retirement the accumulated sum increased by investment yield is converted into a life annuity, which can be provided by either the fund itself or a life insurance company. The mandatory system covers all persons who are engaged in any kind of gainful employment (ie. the employed and the self-employed, with almost 100 per cent coverage) as well as recipients of unemployment and certain child-care benefits. Persons entering the labour market for the first time are automatically enrolled into the new two-pillar scheme, whereas those who had already acquired pension rights before 1998 could voluntarily opt for the new system at the time of its inception (about 50 per cent of the labour force did so). Those who did not join the two-pillar system remained in the pure pas-as-you-go scheme, which is identical with the first pillar of the new system except for the level of contributions and benefits. Currently about 70 per cent of the labour force are members of the two-pillar scheme. The level of total contributions payable to the compulsory system (whether divided between the two pillars or paid only to the first one) is stipulated by law. Members of the two pillar system pay contributions at the same rate as members of the pure PAYG scheme do. However, participants of the two-pillar system pay part of these contributions into the funded pillar (in 2008, 8% out of the overall 33.5%). The assessment base is entirely the same for both types of contributions. In accordance with their reduced PAYG contribution, members of the mixed system will only be entitled to a reduced, 75 per cent benefit level from the public scheme. In their case, however, social security pensions will be supplemented by benefits from the mandatory private pillar. Those who have reached the standard retirement age but are not eligible for a social security pension and have no other source of sufficient income can apply for an income-tested old-age social allowance [„időskorúak járadéka”]. This allowance is financed from general budget revenues and forms part of the social assistance system. There exists various forms of voluntary supplementary pension insurance (voluntary mutual pension funds, occupational pension funds, pension savings accounts).
247
The Parliament adopted law amendments in May 2009 that imply further parametric modifications of the pension system in relation to the reforms in 2006 and 2007 with the following key elements:
Increasing statutory retirement age:
From 2012, the statutory retirement age will gradually ascend six months each year both for women and men until 65 years of age (in case of advanced retirement age 63) by 2021.
For early retirement, malus rule will enter into force from 2011: Malus system related to the advanced old-age retirement will come into effect from 2011 instead of 2013.
New rules of indexation: In the new indexation of pension benefit, the wage growth component represents a smaller weight. It will be effective from 2010. Changes to consumption prices and net earnings continue to determine the annual regular increase of pension benefits, with the weight of the two components depending on the rate of economic growth, however. Under 3% of GDP growth, benefits should be increased by the price index. Based on 3 to 3.9% of GDP growth, mixed indexation should be applied in a proportion of 20% to 80%; for 4 to 4.9% of GDP growth the proportion would be 40 to 60%, and for 5% or higher growth, the Swiss indexation would apply.
Cancellation of disability pension correction originally planned for 2010. Abolishment of 13th month pension benefit from 1 July 2009.
Implementation of these measures significantly improves the long-term sustainability of the Hungarian pension system. In addition to this, measures will also contribute to higher effective retirement age and higher level of employment.
BOX: pension reforms enacted after July 2008 in Hungary
1.2. Eligibility requirements
The standard retirement age for men is 62, for women 61 but increasing to 62 by 2009. 20 years of service are needed for a full old-age pension and 15 years for a partial old-age pension (partial means that it does not constitute eligibility to the minimum pension). The most general early retirement scheme [„előrehozott öregségi nyugdíj”] currently allows men to retire two years early (ie. at age 60) and women five years early (at age 57) provided that they have at least 33 years of service. The amount of the early retirement benefit equals the amount of a normal old-age benefit if the length of service attains 38 years but is reduced for those retiring with 33 to 38 years of service. The rate of reduction depends on the number of missing service years (relative to 38) and on the number of years (or more precisely, months) the retiree is away from reaching his/her 62nd birthday. As from January 2009, three years early retirement will be possible at most for women and two years for men. Thus, the earliest age will change to 59 for women and the early retirement age remains 60 for men. Contribution years for eligibility will also be increased: for a full benefit 40 years and for a reduced one a minimum of 37 years will be required. As from 2013, the lowest age at which early retirement can be taken for women will go up to 60 (ie. two years before standard retirement age) and all early retirement benefit will be a reduced benefit. The minimum length of service required for a reduced benefit will remain the same (37).
1.3. Method of benefit calculation
The amount of social security pension benefits depends on the number of service years and the average of wages earned since 1988 (which were liable to pension contribution).
248
As from 1 January 2008, the calculation of new benefits is started with reducing earnings by employees’ social security contributions (for pension, health and unemployment) and personal income tax (whose amount is only computed on wages net of contributions). Thereafter, all earnings are revalued (valorised) by the growth of nationwide net average earnings up to a point one year before retirement (ie. in 2008 to year 2007). Finally, the average of these adjusted earnings is multiplied by a rate pertaining to the number of service years the person has acquired (for example, this rate is 80 per cent for 40 service years). If someone retires after the standard retirement age and earns further service periods, he/she will be entitled to a bonus of 0.5 per cent of the pension benefit for each additional 30 day periods. Disability pensions are calculated similarly to old age benefits, but higher accrual rates are used at age groups where the length of service cannot be long enough to ensure a decent benefit level. There exist three disability groups, according to the level of disability. The amount of disability pension for fully incapacitated people is higher by 5 or 10 per cent (depending on whether the person can care for himself or not) than that for those not fully disabled. Survivors’ benefits are calculated on the basis of pension that the deceased person was or would have been entitled to. Those who received pension in the previous year are entitled to a so called 13th month benefit. Pensions granted before the beginning of the year are indexed by 50 per cent net wages and 50 per cent inflation in January each year. A supplementary increase is carried out in November if macroeconomic developments show a diversion from the planned values. As from January 2008, pension payment for those working and receiving an early retirement pension will be suspended when earnings that have been cumulated in the year reach the annual amount of the national minimum wage. Suspended means that no further pension disbursement will be made for the rest of the year. Currently, all pensions are exempt from taxation and contributions are deducted from earnings net of income tax. As from 2013, however, social security pensions will be calculated from gross earnings and simultaneously, pension benefits (calculated by a reformed scale of accrual rates) will become taxable.
2. Pension expenditure projections
2.1. Definition of certain lines of the reporting sheet
In section 3.3., a list of schemes covered in the projection exercise is given. However, the question of which scheme is reported in which line of the reporting sheet requires further explanation. ’Social security pensions’: all public pensions, including pension-like regular social allowances (which are not considered as social security benefits in the national terminology). ’Old-age and early pensions’: old age benefits (incl. general early retirement scheme and pensions of the armed forces) [„öregségi nyugdíj, előrehozott öregségi nyugdíj, fegyveres szervek nyugdíja”], miners’ early pension [„bányásznyugdíj”], artists’ pensions [„művésznyugdíj”], early pension subsidized by the employer [„korengedményes nyugdíj”], regardless of whether the benefits has been granted under the statutory
249
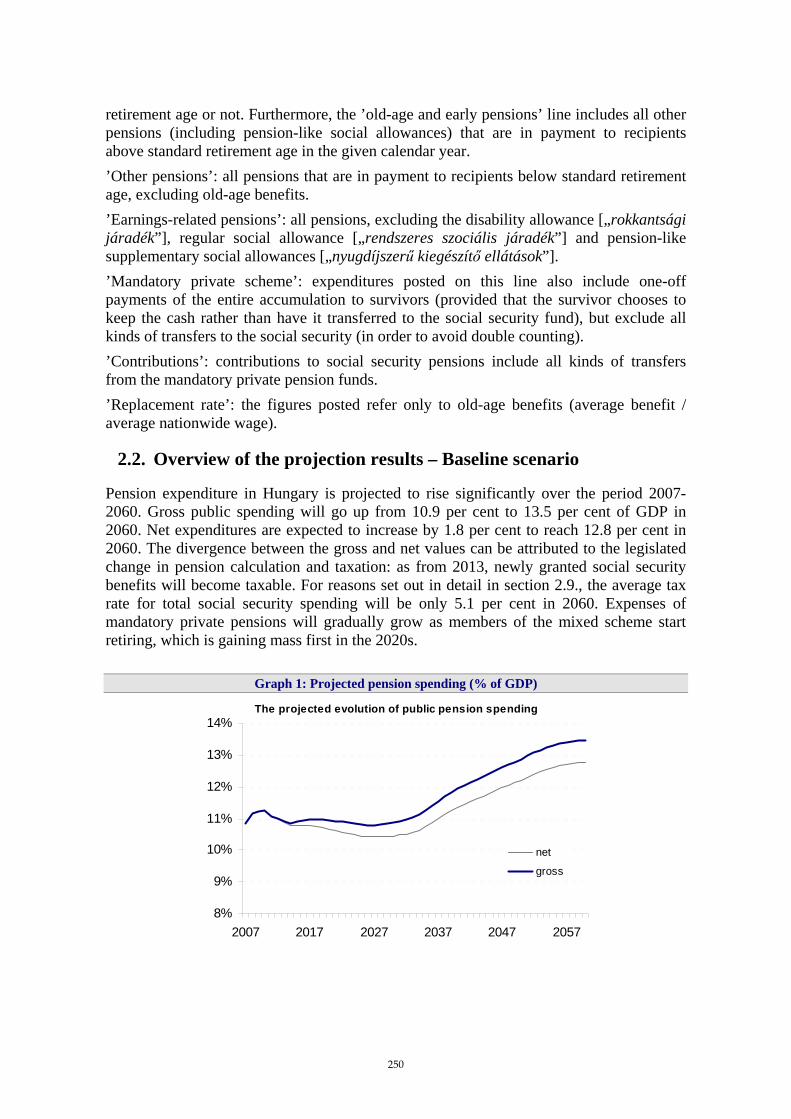
retirement age or not. Furthermore, the ’old-age and early pensions’ line includes all other pensions (including pension-like social allowances) that are in payment to recipients above standard retirement age in the given calendar year. ’Other pensions’: all pensions that are in payment to recipients below standard retirement age, excluding old-age benefits. ’Earnings-related pensions’: all pensions, excluding the disability allowance [„rokkantsági járadék”], regular social allowance [„rendszeres szociális járadék”] and pension-like supplementary social allowances [„nyugdíjszerű kiegészítő ellátások”]. ’Mandatory private scheme’: expenditures posted on this line also include one-off payments of the entire accumulation to survivors (provided that the survivor chooses to keep the cash rather than have it transferred to the social security fund), but exclude all kinds of transfers to the social security (in order to avoid double counting). ’Contributions’: contributions to social security pensions include all kinds of transfers from the mandatory private pension funds. ’Replacement rate’: the figures posted refer only to old-age benefits (average benefit / average nationwide wage).
2.2. Overview of the projection results – Baseline scenario
Pension expenditure in Hungary is projected to rise significantly over the period 2007-2060. Gross public spending will go up from 10.9 per cent to 13.5 per cent of GDP in 2060. Net expenditures are expected to increase by 1.8 per cent to reach 12.8 per cent in 2060. The divergence between the gross and net values can be attributed to the legislated change in pension calculation and taxation: as from 2013, newly granted social security benefits will become taxable. For reasons set out in detail in section 2.9., the average tax rate for total social security spending will be only 5.1 per cent in 2060. Expenses of mandatory private pensions will gradually grow as members of the mixed scheme start retiring, which is gaining mass first in the 2020s.
Graph 1: Projected pension spending (% of GDP)
The projected evolution of public pension spending
8%
9%
10%
11%
12%
13%
14%
2007 2017 2027 2037 2047 2057
net
gross
250

Despite constant contribution rates, the share of social security contribution revenues within GDP is expected to gradually fall between 2008 and 2025, due to the growing proportion of employees participating in the mixed scheme and thus paying contributions to the social security at lower rates. Later on, social security revenues are more or less constant as per cent of GDP. Since revenues of the public pension fund also include transfers from the mandatory private pillar, proportions between the social security contribution revenues and the private pillar revenues do not reflect the proportion between the underlying contribution rates.
Table 1: Projected gross pension spending, tax on pension and contributions (% of GDP) Baseline 2000 2007 2010 2020 2030 2040 2050 2060 Peak
year Gross
Public pensions 8.1 10.9 11.3 10.9 10.9 12.0 12.9 13.5 2060 Old-age and early pensions : 9.0 9.5 9.8 9.7 10.8 11.7 12.3 2060 Other pensions : 1.9 1.8 1.1 1.2 1.2 1.2 1.1 2007
Occupational pension 0.00 0.00 : : : : : : :Mandatory private pensions 0.00 0.0 0.0 0.1 0.4 1.0 1.0 2.2 2060
Mandatory private pensions 0.00 0.0 0.0 0.1 0.4 1.0 1.0 2.2 2060Non-mandatory : : : : : : : : :
Total pension expenditure 8.1 10.9 11.3 11.1 11.3 12.9 12.9 15.6 2060Net Public pensions 8.1 10.9 11.3 10.7 10.5 11.4 12.2 12.8 2060 Old-age and early pensions : 9.0 9.5 9.5 9.2 10.2 11.1 11.6 2060 Other pensions : 1.9 1.8 1.1 1.2 1.2 1.2 1.1 2007
Occupational pension 0.00 0.00 : : : : : : : Mandatory private pensions 0.00 0.0 0.0 0.1 0.4 1.0 1.6 2.2 2060
Mandatory private pensions 0.00 0.0 0.0 0.1 0.4 1.0 1.0 2.2 2060Non-mandatory : : : : : : : : :
Total pension expenditure 8.1 10.9 11.3 10.8 10.9 12.3 13.9 14.9 2060 Taxes on public pension 0.0 0.0 0.0 0.3 0.4 0.6 0.7 0.7 2060Taxes on private pension 0.0 0.0 : : : : : : : Social security pension contributions
7.1 8.6 8.9 8.6 8.6 8.7 8.6 8.6 2009
2.3. Description of main driving forces behind the projection results
The main driving force of the increasement in expenditure is the significant growth of dependency ratio. In the next decade the baby boom of the 1950’s (number of birth was the highest in 1954) are going to retire which worsen the dependency ratio. This effect will be partially offset by the reduction in coverage ratio, benefit ratio and the expected higher employment rate.
251
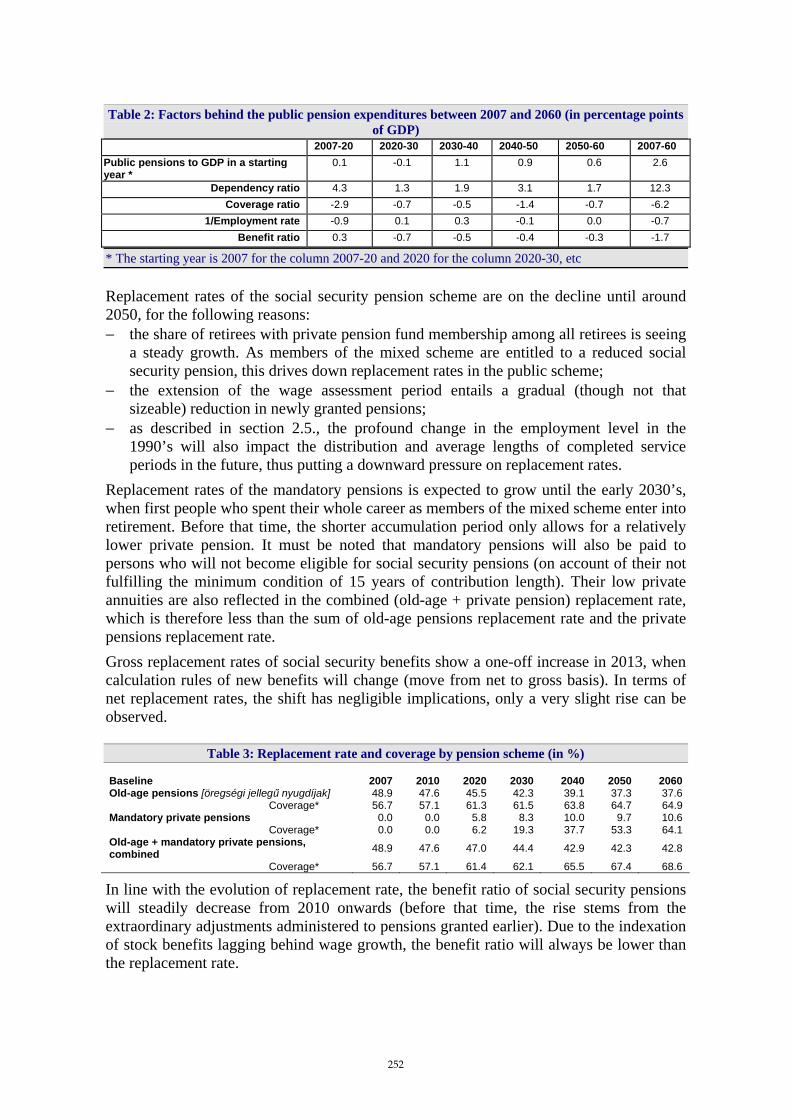
Table 2: Factors behind the public pension expenditures between 2007 and 2060 (in percentage points of GDP)
2007-20 2020-30 2030-40 2040-50 2050-60 2007-60 Public pensions to GDP in a starting year *
0.1 -0.1 1.1 0.9 0.6 2.6
Dependency ratio 4.3 1.3 1.9 3.1 1.7 12.3 Coverage ratio -2.9 -0.7 -0.5 -1.4 -0.7 -6.2
1/Employment rate -0.9 0.1 0.3 -0.1 0.0 -0.7 Benefit ratio 0.3 -0.7 -0.5 -0.4 -0.3 -1.7
* The starting year is 2007 for the column 2007-20 and 2020 for the column 2020-30, etc Replacement rates of the social security pension scheme are on the decline until around 2050, for the following reasons: − the share of retirees with private pension fund membership among all retirees is seeing
a steady growth. As members of the mixed scheme are entitled to a reduced social security pension, this drives down replacement rates in the public scheme;
− the extension of the wage assessment period entails a gradual (though not that sizeable) reduction in newly granted pensions;
− as described in section 2.5., the profound change in the employment level in the 1990’s will also impact the distribution and average lengths of completed service periods in the future, thus putting a downward pressure on replacement rates.
Replacement rates of the mandatory pensions is expected to grow until the early 2030’s, when first people who spent their whole career as members of the mixed scheme enter into retirement. Before that time, the shorter accumulation period only allows for a relatively lower private pension. It must be noted that mandatory pensions will also be paid to persons who will not become eligible for social security pensions (on account of their not fulfilling the minimum condition of 15 years of contribution length). Their low private annuities are also reflected in the combined (old-age + private pension) replacement rate, which is therefore less than the sum of old-age pensions replacement rate and the private pensions replacement rate. Gross replacement rates of social security benefits show a one-off increase in 2013, when calculation rules of new benefits will change (move from net to gross basis). In terms of net replacement rates, the shift has negligible implications, only a very slight rise can be observed.
Table 3: Replacement rate and coverage by pension scheme (in %) Gross replacement rate and coverage by pension scheme (in %) Baseline 2007 2010 2020 2030 2040 2050 2060 Old-age pensions [öregségi jellegű nyugdíjak] 48.9 47.6 45.5 42.3 39.1 37.3 37.6 Coverage* 56.7 57.1 61.3 61.5 63.8 64.7 64.9 Mandatory private pensions 0.0 0.0 5.8 8.3 10.0 9.7 10.6 Coverage* 0.0 0.0 6.2 19.3 37.7 53.3 64.1 Old-age + mandatory private pensions, combined 48.9 47.6 47.0 44.4 42.9 42.3 42.8
Coverage* 56.7 57.1 61.4 62.1 65.5 67.4 68.6
In line with the evolution of replacement rate, the benefit ratio of social security pensions will steadily decrease from 2010 onwards (before that time, the rise stems from the extraordinary adjustments administered to pensions granted earlier). Due to the indexation of stock benefits lagging behind wage growth, the benefit ratio will always be lower than the replacement rate.
252
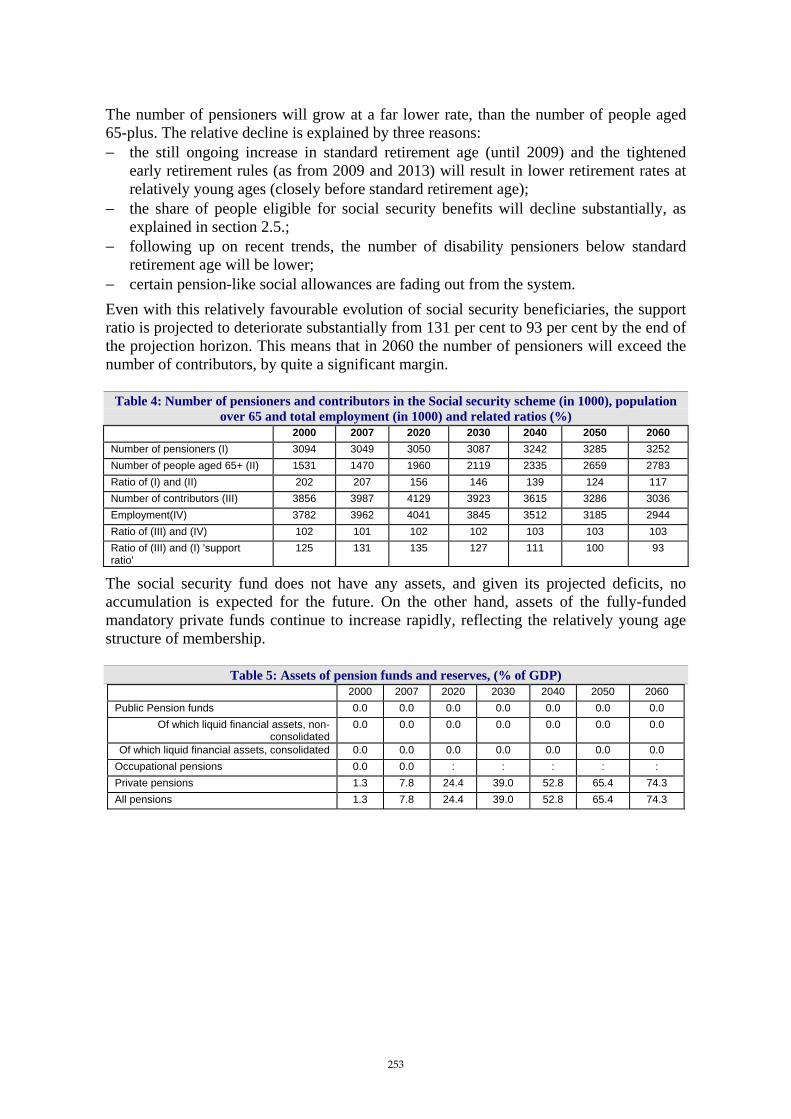
The number of pensioners will grow at a far lower rate, than the number of people aged 65-plus. The relative decline is explained by three reasons: − the still ongoing increase in standard retirement age (until 2009) and the tightened
early retirement rules (as from 2009 and 2013) will result in lower retirement rates at relatively young ages (closely before standard retirement age);
− the share of people eligible for social security benefits will decline substantially, as explained in section 2.5.;
− following up on recent trends, the number of disability pensioners below standard retirement age will be lower;
− certain pension-like social allowances are fading out from the system. Even with this relatively favourable evolution of social security beneficiaries, the support ratio is projected to deteriorate substantially from 131 per cent to 93 per cent by the end of the projection horizon. This means that in 2060 the number of pensioners will exceed the number of contributors, by quite a significant margin.
Table 4: Number of pensioners and contributors in the Social security scheme (in 1000), population over 65 and total employment (in 1000) and related ratios (%)
2000 2007 2020 2030 2040 2050 2060 Number of pensioners (I) 3094 3049 3050 3087 3242 3285 3252 Number of people aged 65+ (II) 1531 1470 1960 2119 2335 2659 2783 Ratio of (I) and (II) 202 207 156 146 139 124 117 Number of contributors (III) 3856 3987 4129 3923 3615 3286 3036 Employment(IV) 3782 3962 4041 3845 3512 3185 2944 Ratio of (III) and (IV) 102 101 102 102 103 103 103 Ratio of (III) and (I) 'support ratio'
125 131 135 127 111 100 93
The social security fund does not have any assets, and given its projected deficits, no accumulation is expected for the future. On the other hand, assets of the fully-funded mandatory private funds continue to increase rapidly, reflecting the relatively young age structure of membership.
Table 5: Assets of pension funds and reserves, (% of GDP) 2000 2007 2020 2030 2040 2050 2060
Public Pension funds 0.0 0.0 0.0 0.0 0.0 0.0 0.0 Of which liquid financial assets, non-
consolidated 0.0 0.0 0.0 0.0 0.0 0.0 0.0
Of which liquid financial assets, consolidated 0.0 0.0 0.0 0.0 0.0 0.0 0.0 Occupational pensions 0.0 0.0 : : : : : Private pensions 1.3 7.8 24.4 39.0 52.8 65.4 74.3 All pensions 1.3 7.8 24.4 39.0 52.8 65.4 74.3
253

2.4. Sensitivity analysis Table 6: Total and public pension expenditure under different scenarios (deviation from baseline,
percentage points) 2007 2010 2020 2030 2040 2050 2060
Total pension expenditure (gross) Higher life expectancy 0,00 0,00 0,03 0,09 0,16 0,23 0,31 Higher labour productivity 0,00 0,00 -0,08 -0,19 -0,29 -0,39 -0,48 Higher interest rate 0,00 0,00 0,00 0,02 0,08 0,15 0,22 Higher employment rate 0,00 -0,02 -0,19 -0,18 -0,15 -0,09 -0,04 Higher empl. rate of older workers 0,00 -0,02 -0,22 -0,23 -0,26 -0,22 -0,17 Zero migration 0,00 0,02 0,26 0,49 0,87 1,33 1,65
Public pension expenditure (gross) Higher life expectancy 0,00 0,00 0,04 0,10 0,18 0,26 0,34 Higher labour productivity 0,00 0,00 -0,08 -0,17 -0,23 -0,28 -0,32 Higher interest rate 0,00 0,00 0,00 0,00 0,00 0,00 0,00 Higher employment rate 0,00 -0,02 -0,18 -0,17 -0,14 -0,08 -0,03 Higher empl. rate of older workers 0,00 -0,02 -0,22 -0,22 -0,25 -0,21 -0,17 Zero migration 0,00 0,02 0,26 0,46 0,78 1,11 1,33
Higher life expectancy gives rise to higher spending from the social security, since the initial level of benefits does not depend on the time spent in retirement. On the other hand, private pension expenditure will temporarily (but lasting beyond 2060) sink, as new annuities will be granted in smaller amounts. Consequently, the number of pensioners will be higher than in the baseline scenario. Higher labour productivity implies lower public expenditures in terms of share of GDP, because of the indexation of stock benefits. As pensions are uprated by 50 per cent wages and 50 per cent prices, the divergence between the rate pension indexation and GDP (or productivity) growth will broaden, resulting in lower relative (but higher nominal) spending. Outlays of the private funds will go down even in nominal terms for about two decades, since regulation currently requires their indexation to be linked to that of the social security pensions, which can only be accomplished through lower initial annuities. Higher interest rates have no impact on public pension spending, but allow for higher annuities from the defined-contribution private pension funds. In 2060, the difference in private pension expenditure will amount to 0.22 per cent of GDP. The assumption of a higher employment rate has multiple effects. First, it increases the basis of comparison, ie. the level of GDP. Second, as it also concerns higher ages, the average time of retirement will be somewhat delayed, which means that in the short to medium term the number of pensioners will be slightly decreased. Third, in the medium to long run, longer service periods and a higher share of people becoming eligible for pension will bring about an increase in expenditures. By the end of the period, this latter effect actually offsets the other effects, and GDP proportional spending will almost equal the figure seen in the baseline scenario. The effects of a higher employment rate of older workers are similar to those explained at the scenario of overall higher employment rate, but the decline in expenditures is a little more marked. The reason is that reduction rates of early retirement benefits will not be entirely actuarial even after 2012, ie. deferred retirement will not result in a proportionally higher benefit. (As opposed to the 2006 exercise, we assumed that higher employment rates will automatically imply a deferral in retirement.) Results of the zero migration scenario show that expenditures as per cent of GDP would substantially rise if net immigration would not help in upkeeping the number of employees. In that case, GDP levels would decline immediately while pension
254
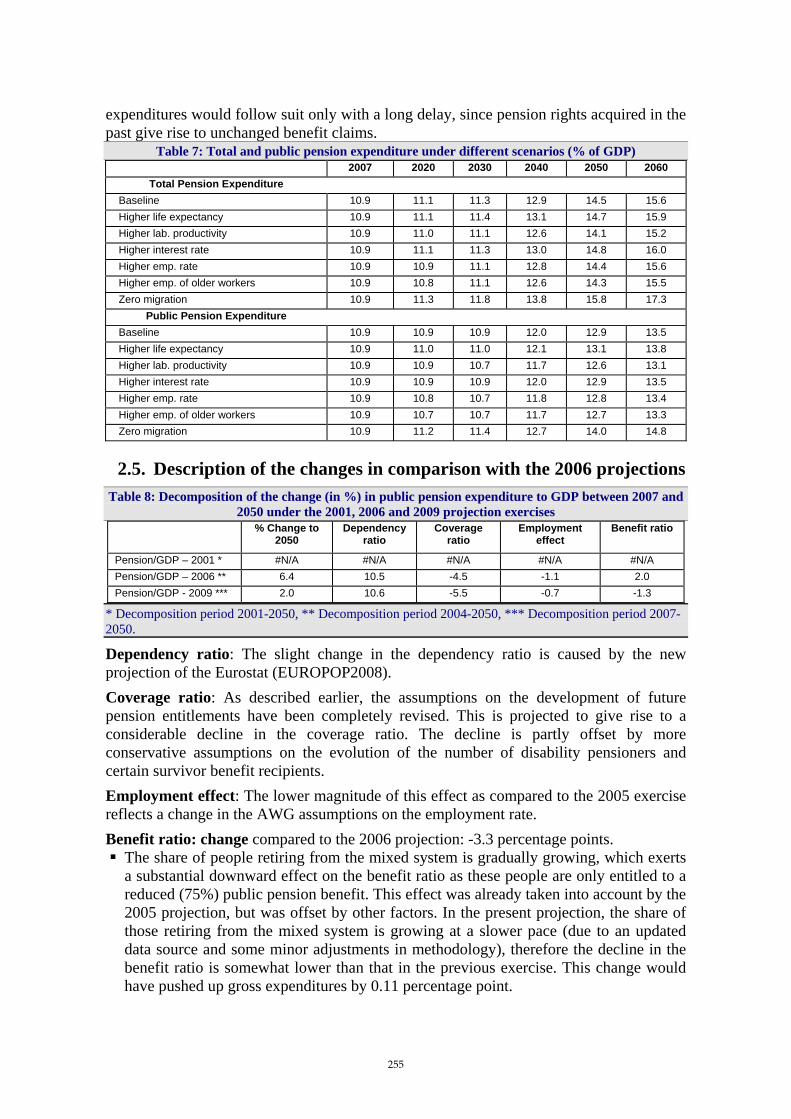
expenditures would follow suit only with a long delay, since pension rights acquired in the past give rise to unchanged benefit claims.
Table 7: Total and public pension expenditure under different scenarios (% of GDP) 2007 2020 2030 2040 2050 2060
Total Pension Expenditure Baseline 10.9 11.1 11.3 12.9 14.5 15.6 Higher life expectancy 10.9 11.1 11.4 13.1 14.7 15.9 Higher lab. productivity 10.9 11.0 11.1 12.6 14.1 15.2 Higher interest rate 10.9 11.1 11.3 13.0 14.8 16.0 Higher emp. rate 10.9 10.9 11.1 12.8 14.4 15.6 Higher emp. of older workers 10.9 10.8 11.1 12.6 14.3 15.5 Zero migration 10.9 11.3 11.8 13.8 15.8 17.3
Public Pension Expenditure Baseline 10.9 10.9 10.9 12.0 12.9 13.5 Higher life expectancy 10.9 11.0 11.0 12.1 13.1 13.8 Higher lab. productivity 10.9 10.9 10.7 11.7 12.6 13.1 Higher interest rate 10.9 10.9 10.9 12.0 12.9 13.5 Higher emp. rate 10.9 10.8 10.7 11.8 12.8 13.4 Higher emp. of older workers 10.9 10.7 10.7 11.7 12.7 13.3 Zero migration 10.9 11.2 11.4 12.7 14.0 14.8
2.5. Description of the changes in comparison with the 2006 projections Table 8: Decomposition of the change (in %) in public pension expenditure to GDP between 2007 and
2050 under the 2001, 2006 and 2009 projection exercises % Change to
2050 Dependency
ratio Coverage
ratio Employment
effect Benefit ratio
Pension/GDP – 2001 * #N/A #N/A #N/A #N/A #N/A Pension/GDP – 2006 ** 6.4 10.5 -4.5 -1.1 2.0 Pension/GDP - 2009 *** 2.0 10.6 -5.5 -0.7 -1.3
* Decomposition period 2001-2050, ** Decomposition period 2004-2050, *** Decomposition period 2007-2050.
Dependency ratio: The slight change in the dependency ratio is caused by the new projection of the Eurostat (EUROPOP2008). Coverage ratio: As described earlier, the assumptions on the development of future pension entitlements have been completely revised. This is projected to give rise to a considerable decline in the coverage ratio. The decline is partly offset by more conservative assumptions on the evolution of the number of disability pensioners and certain survivor benefit recipients. Employment effect: The lower magnitude of this effect as compared to the 2005 exercise reflects a change in the AWG assumptions on the employment rate. Benefit ratio: change compared to the 2006 projection: -3.3 percentage points.
The share of people retiring from the mixed system is gradually growing, which exerts a substantial downward effect on the benefit ratio as these people are only entitled to a reduced (75%) public pension benefit. This effect was already taken into account by the 2005 projection, but was offset by other factors. In the present projection, the share of those retiring from the mixed system is growing at a slower pace (due to an updated data source and some minor adjustments in methodology), therefore the decline in the benefit ratio is somewhat lower than that in the previous exercise. This change would have pushed up gross expenditures by 0.11 percentage point.
255

The average lengths of service periods of new retirees are projected to decline significantly in the future due to the incorporation of assumed effects of the pre-2007 entitlements (see above). Furthermore, the present model also takes account of a rule according to which only periods spent in higher education before 1998 can be taken into account as service years (unless they are covered by contribution payment). The overall effect of these changes is an 0.72 pp lower expenditure.
The gradual widening of the wage assessment period (when calculating new pensions, all wages earned since 1988 are taken into account) also lowers replacement rates, which will bring down gross expenses by appr. 0.53 percentage points. Although this has been the rule since 1998, the previous projection failed to take account of its effect.
Different methodology was applied for tax and benefit calculation as from 2013 (resulting in 1.56 pp lower expenditure).
Policy related change: the actuarial reduction of early retirement benefits coming into force in 2013 is projected to reduce gross expenditures by about 0.58 percentage point by 2050.
Table 9: Decomposition of the difference between 2006 and 2009 public pension projection (%GDP) 2005 2007 2010 2020 2030 2040 2050 Ageing report 2006 - gross 10.4 11.12 11.11 12.55 13.46 16.02 17.12 - Change in assumptions - 0.00 0.00 -0.06 +0.15 +0.11 +0.68 - Improvement in coverage - +0.16 +0.14 +0.06 +0.03 +0.01 +0.01 - Improvement in modelling methodology - 0.00 0.00 -0.90 -1.98 -3.31 -4.01 - estimation of pre-2005 entitlements - 0.00 0.00 -0.37 -1.02 -1.92 -2.45 - method of tax imputation - 0.00 0.00 -0.53 -0.96 -1.39 -1.56 - Policy-related changes - +0.11 +0.21 -0.21 -0.58 -0.80 -0.88 - Other - -0.53 -0.21 -0.49 -0.20 -0.10 -0.03 Ageing report 2009 - gross - 10.86 11.25 10.95 10.89 11.95 12.88 Ageing report 2006 - net 10.4 11.12 11.11 11.69 11.90 13.76 14.59 - Change in assumptions - 0.00 0.00 -0.06 +0.15 +0.11 +0.64 - Improvement in coverage - +0.16 +0.14 +0.06 +0.03 +0.01 +0.01 - Improvement in modelling methodology - 0.00 0.00 -0.34 -0.87 -1.66 -2.16 - estimation of pre-2005 entitlements - 0.00 0.00 -0.36 -0.97 -1.83 -2.32 - method of tax imputation - 0.00 0.00 +0.02 +0.10 +0.16 +0.17 - Policy-related changes - +0.11 +0.21 -0.21 -0.55 -0.76 -0.84 - Other - -0.53 -0.21 -0.48 -0.20 -0.09 -0.03 Ageing report 2009 - net - 10.86 11.25 10.95 10.89 11.95 12.88
The previous model projected an increase in gross pension expenditures of 6% of GDP (from 11.1% in 2007 to 17.1% of GDP in 2050), while according to the current model the increase is 2% of GDP (from 10.9% to 12.9% of GDP) during the same period. In 2006 Hungary adopted important reform measures and submitted a revised projection to the AWG prepared with an unchanged modelling background. The results of the revised projection were discussed at the AWG meeting on 13 November 2007 and endorsed by the EPC on its meeting held in November 2007.
Table 10: The results of different projections as a percentage of GDP 2007 2050 difference
Gross pension expenditure - 2005 model 11.1 17.1 6 Gross pension expenditure - 2007 peer review 11.1 16.8 5.7 Gross pension expenditure - 2008 model 10.9 12.9 2 difference 2005 model 2007 peer review 0 0,3 difference 2005 model 2008 model -0,2 -4,2
The table compares the results of the different projections made in 2005, reviewed in 2007 and in 2008. The current 2008 model projects significantly lower pension expenditure (by 4.2% of GDP) in 2050 than the 2005 model. This difference is explained by several factors:
256

Factors as a percentage of GDP 1. Improved in modelling methodology of which: -4.01
-estimation of pre-2005 entitlements -2.45 -method of tax imputation -1.56 2. Policy related changes -0.88 3. Change in assumptions +0.68 4. Improvement in coverage +0.01 Other -0.03 Σ -4.24
2.5.1. Improvement in modelling methodology effect: -4.01% of GDP
The difference between the results of the 2005 model and the current projection is primarily explained by an improved methodology. The current model uses more realistic assumptions on i) the long term development of entitlements and ii) the average tax rate on pensions. These two changes have a significant effect on the results. (The revised projection submitted in November 2007 was based on the 2005 model.) i) Different assumption on long term development in entitlements
effect on gross expenditures: -2.45% of GDP The 2005 model assumed that age-specific retirement rates observed in 2004 will not change in the future, except on account of prospective changes in the labour market. Thus the model failed to take on board the implications of past changes in labour market participation and employment and assumed that the recently observed high retirement rates and long service periods will continue to be characteristic in the future. Nevertheless labour market developments of the last two decades give enough argument to assume that future entitlement rate and average service length will not remain constant in the period to come. Much lower employment rate in the last two decades leads to less entitlements and service years in the next decades. The new model redresses this shortcoming and incorporates information on the estimated evolution of pension rights acquisition in over the past 20 years.
257

Graph 2: Employment development in Hungary 1980-2006
Employment development in Hungary 1980-2006
3000
3500
4000
4500
5000
5500
600019
80
1981
1982
1983
1984
1985
1986
1987
1988
1989
1990
1991
1992
1993
1994
1995
1996
1997
1998
1999
2000
2001
2002
2003
2004
2005
2006
1000
of p
erso
ns
Transition year
Future entitlement rate (effect: -1.20% of GDP ) Currently, almost all people approaching retirement age meet the qualifying conditions, i.e. have at least 15 years of service. Consequently, 98 per cent of men and 95 per cent of women aged 62-70 receive either old age or disability pension benefits. These high percentages have resulted from the high participation and employment rates in the pre-1990 times, when virtually everybody in the working age population could (and was expected) to find occupation and women could already earn pension rights while being recipients of various child care allowances. Cohorts retiring nowadays started their careers sometime around 1965-1970, so they had a continuous labour history of about 20-25 years prior to the systemic change. Therefore, they could easily gather the minimum required number of service years even if they experienced long spells of unemployment in the past 15 to 20 years. However, as we proceed in time, younger cohorts will have a smaller and smaller fraction of their lives spent in the pre-1990 era and a growing fraction of their lives spent in periods characterised by low employment rates. As a result, there will be more and more people who will not have a sufficiently long contributory period to qualify for old age pension. However, due to the lack of retrospective data on pension accruals, it is very difficult to estimate the share of population which will probably fail to accumulate enough rights. Digitalised (alphanumerical) records are only available for rights that accrued since 1997, otherwise data are processed only at the time of award. Therefore, estimates can only be based on data of the past ten years – that is, about one quarter of a regular career. Augusztinovics et al. [2008]133 carried out a thorough research on this issue and found that the proportion of people with less than 20 years of service at retirement age might climb to as high as 33%. In the present projection we took a more cautious approach (from the point of view of pension expenditures) and assumed that the share of cohorts without pension in own right at age 70 will gradually mount to 15 per cent by 2025 and stay at that level thereafter. The reason for this cautiousness is that an amendment passed
133 Augusztinovics, Mária – Gyombolai, Márton – Máté, Levente: Contribution payment and pension entitlement 1997-2006, in: Közgazdasági Szemle [Economic Review], July-Aug. 2008 (in Hungarian).
258

at end 2007 preserved the possibility of retiring with 15 years of service (earlier the law envisaged the discontinuation of the so called partial pension from 2009). People who fail to obtain enough rights that would qualify them for a social security pension, might become entitled to a social assistance benefit (e.g. old-age allowance [időskorúak járadéka]). Such benefits are not covered by the current pension model but these cost should be also taken into account in the long term projection. In order to capture this effect we add the future spending on old age allowances to the long term age related cost, which can be estimated to be around 0,4% of GDP by 2060. (See details in the annex) (The implications on certain pension-like regular social allowances are taken on board by the projection, though their effect is not that significant.) Average service length (effect: -0.72% of GDP) The severe fall in employment rates that occurred during the systemic change in the 1990s will impact not only the share of eligible people but also the average service lengths of those fulfilling eligibility requirements. Predicting the magnitude of this impact is however equally difficult since both issues have their roots in the profound change in intra-cohort distribution of people along the dimension of lifetime (longitudinal) labour market performance. In the projection it was assumed that the cohort average service lengths will gradually fall, while the 2005 model did not take into consideration this phenomenon. Widening wage assessment period (effect: -0.53% of GDP) The gradual widening of the wage assessment period (when calculating new pensions, all wages earned since 1988 are taken into account) will lower replacement rates, since the shape of the individual wage path is usually concave, i.e. wages earned at younger ages are relatively lower. Although this has been the rule since 1998, the previous projection failed to take account of its effect. ii) Significantly lower assumption for average tax rate on pension
effect: -1.56% of GDP The methodology of simulating benefit calculation after 2012 has been completely revised. The 2005 model first projected the net level of newly granted benefits, assuming that average net replacement rate from year 2012 to 2013 will not change. Gross amounts were then calculated inversely by simply assuming a uniform 15 per cent income tax rate and adding the computed amount of tax to net benefits. The assumption on the tax rate was not aligned to average effective tax rates applicable to wages. According to the current income tax rule, 15% income tax rate is in line with a benefit ratio of about 80%, which is not realistic (see table).
259

Table 11: Computed income tax rates at different income levels Wage level, relative to nationwide
average wage Income tax rate
30% 0.0% 40% 3.5% 45% 5.1% 50% 6.4% 55% 7.7% 60% 9.3% 70% 11.8% 80% 15.4% 90% 18.7%
100% 21.3% 120% 25.1% 150% 27.3% 200% 29.5%
In the new model used for the present projections, these rough assumptions have been eliminated and a new methodology devised that actually mirrors the functioning of the regulatory framework. For the period starting in 2013, newly granted gross benefits have now been calculated from gross wages, using the amended accrual rates. Net pensions are derived from gross benefits. The average effective tax rate on pensions will be much lower than what had been assumed in the 2005 exercise or in its 2007 upgrade (there is no reason to think that pensions would be liable to higher taxes than wages). The benefit ratio and the gross replacement rate vary during the projection period (until 2050) respectively between 42%-36% and 54%-42%. This ratio results 3.5-7.7% income tax rate and the overall average tax burden of old age pensions will rise from zero to 5.1 per cent by 2050. The new methodology also allowed for a proper consideration of other effects of the amended regulation, such as the shift to linear accrual scale from the current regressive one.
Table 12: Computed income tax rates at different income levels (2) Average
income tax rate
Tax burden in 2050
Gross pension expenditure in 2050
Net pension expenditure in 2050
Tax content of the gross pension expenditure
2005 model 15% 15% 17.1 14.6 2.5 2007 peer review
21% 21% 16.8 13.3 3.5
2008 model 5.1% 5.1% 12.9 12.2 0.7 Difference
between 2005 and 2008 model
1.8
All pensions are exempt from taxation until 2013; therefore the tax burden is zero till 2012. The introduction of taxation will be gradual, because only new pensions will be taxed. By 2050 when old pensions which are exempted from tax will be phased out, all pensions will be subject to taxation (nevertheless, a considerable share of pensions will carry a zero per cent effective tax burden). Due to the revised method of tax and benefit calculation, gross results became lower by 1.56 percentage points while net results got higher by 0.17 percentage point compared to the 2005 exercise. Altogether, the difference between the gross and net results shrunk by 1.73 percentage points to 0.66 percentage point. (The difference of 1.8 pp in tax contents as indicated in the above table is higher than this 1.73 pp. The reason is that the latter value was calculated following the effects of all the other modifications, such as
260

entitlement or policy related changes. The higher expenditures as projected in 2005 would have led to a tax content higher than 0.7 pp even if they had been calculated with the same tax rate that we applied in the present projection.)
2.5.2. Policy-related changes effect on gross expenditures: -0.88% of GDP
Hungary adopted a pension reform package at the end of 2006 and 2007. In November 2007, the AWG could review only the measures adopted in 2006. The new model includes the measures adopted in late 2007 as well. The 2007 revision of the pension projection was based on the 2005 model. The convergence programme submitted in November 2007 already took into account the effects of the measures adopted late 2007, but its calculation was still based on the 2005 model. The following table shows the deviations of the current results from those presented in 2007.
Table 13: The effect of the pension measures in 2050 as a percentage of GDP measures Difference between
2007 revision and 2006 Ageing Report
Difference between 2007 CP and 2006
Ageing Report
Difference between 2008 model
and 2006 Ageing Report
adopted in 2006: gross net gross net gross net Increase of the early retirement age -0.26 -0.22 -0.26 -0.22 -0.25 -0.24
Suspensions of pension in case of working -0.03 -0.02 -0.03 -0.02 -0.06 -0.06
Alteration in calculation of pensions 0.00 -1.08 0.00 -1.08 0.00 0.00
adopted in 2007 Introduction of an actuarially correct treatment of early retirement pensions
- - -0.30 -0.30 -0.58 -0.55
Σ -0.29 -1.33 -0.59 -1.63 -0.88 -0.84
Table 14: Decomposition of difference between 2008 and 2005 projections due to policy related changes, in per cent of GDP (gross expenditures)
2007 2010 2020 2030 2040 2050 Policy-related changes, total 0.11% 0.21% -0.21% -0.58% -0.80% -0.88% Increase of the early retirement age 0.00% -0.12% -0.23% -0.25% -0.25% -0.25% Introduction of an actuarially correct treatment of early retirement pensions 0.00% 0.00% -0.15% -0.31% -0.49% -0.58% Alteration in calculation of pensions 0.00% -0.09% 0.00% 0.00% 0.00% 0.00% Pension correction programme 0.10% 0.46% 0.21% 0.03% 0.00% 0.00% Suspensions of pension in case of working 0.00% -0.04% -0.05% -0.05% -0.06% -0.06%
The main deviations are the following ones: − The effects of the so called pension correction programme started in 2007 were not
taken into account in the 2007 projection. As these measures aimed at providing one-off extraordinary benefit increases to certain groups of pensioners who retired before 1999, their effects will gradually decline and finally disappear around the mid 2030s as the cohorts concerned are dying out.
− The effects of the alteration of pension calculation rules are differing significantly from the results presented in 2007, in line with the improved methodology of tax and benefit calculation after 2012. (In the 2005 exercise and its 2007 update, we assumed that net benefit levels will not change from 2012 to 2013 despite the change in calculation rules and therefore the 2008 amendment will have an infinite effect on net spending. In the current projection, however, we have assumed a more strict approach
261
and followed closely the rules legislated for the post-2012 period as set out in the previous section. Consequently, the altered calculation rules effective as from 2008 will only be affecting newly granted benefits until end 2012. The savings arising from this measure will therefore be restricted to people who retire between 2008 and 2012.)
Policy changes since 2005 that have been included in the present projection: − As from 2013, only two years of early retirement will be possible for both gender
instead of the previously legislated three years for women (the lowest age at which general early retirement benefit can be claimed will go up from 59 to 60 years of age). From 2013 all early pensions will be subject to a reduction. The rate of reduction, depending on the time remaining until retirement age, would be 0.3% per month for the 61-62 age-group and 0.4% per month below the age of 61.
− Men’s early retirement age will stay at 60 between 2009-2012, instead of falling to 59, as laid down by a previous (no longer effective) regulation.
− As from January 2008, the calculation method of newly granted pension benefits will be revised in a number of its elements. Furthermore, earnings are reduced by employees’ social security contributions (for pension, health and unemployment) before deducting the computed amount of personal income tax. The combined effect of these changes will bring about a substantial reduction in the replacement rate.
− In 2006, a new law was passed that required certain pension benefits awarded before 1998 to be adjusted through a series of exceptional increases in years 2007-2010. This adjustment has its effects until the mid 2020’s, when beneficiaries concerned die out.
− As from January 2008, all kinds of early retirement benefits will only be available after the termination of the employment relationship. Furthermore, pension payment for those working and receiving an early retirement pension will be suspended when earnings that have been cumulated in the year reach the annual amount of the national minimum wage. Suspended means that no further pension payouts will be made for the rest of the year. Those working beyond the standard age of retirement (ie. above 62) will not be subject to such restrictions.
− Favourable retirement conditions (lower retirement age) for those working in potentially health damaging occupations will be subject to an additional 13% pension contribution payment. This will initially be paid by central government, but then responsibility for payment will gradually be transferred to employers, so that by 2011 they will pay all of the additional contribution. The legislation however will allow employers to apply for an opt-out from this system based on proof of certain health and safety standards (which implies that its workers will not acquire new entitlements for early retirement, either).
− Since April 2007 those working and getting an early retirement pension have had to pay the 8.5% pension contribution of employees out of their earnings but are compensated by a pension increase equal to 0.5% of the average monthly earnings (from 2008) for each full year of contributions.
2.5.3. Change in assumptions effect: +0.68% of GDP
The new model built for the present exercise was also run with demographic and macroeconomic assumptions used in the 2006 exercise. In terms of social security expenditures, the results are somewhat lower with those ’old’ assumptions than with the ’new’ ones.
262
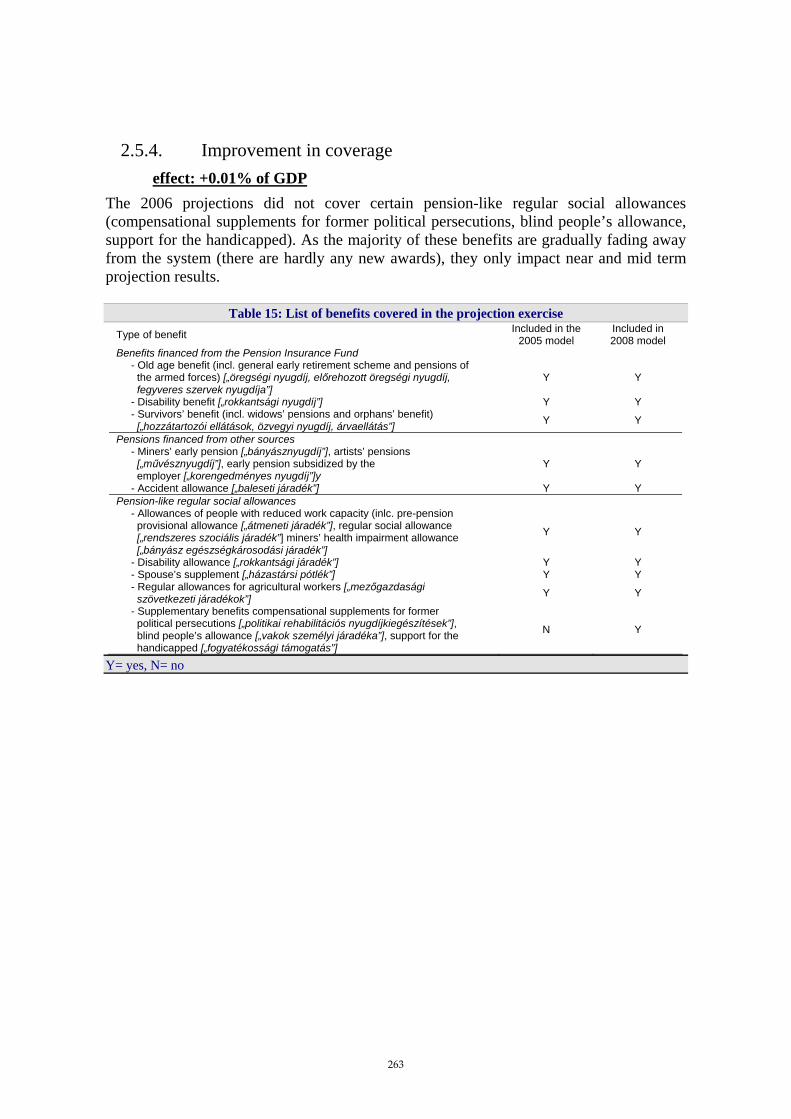
2.5.4. Improvement in coverage effect: +0.01% of GDP
The 2006 projections did not cover certain pension-like regular social allowances (compensational supplements for former political persecutions, blind people’s allowance, support for the handicapped). As the majority of these benefits are gradually fading away from the system (there are hardly any new awards), they only impact near and mid term projection results.
Table 15: List of benefits covered in the projection exercise Type of benefit Included in the
2005 model Included in 2008 model
Benefits financed from the Pension Insurance Fund - Old age benefit (incl. general early retirement scheme and pensions of the armed forces) [„öregségi nyugdíj, előrehozott öregségi nyugdíj, fegyveres szervek nyugdíja”]
Y Y
- Disability benefit [„rokkantsági nyugdíj”] Y Y - Survivors’ benefit (incl. widows’ pensions and orphans’ benefit) [„hozzátartozói ellátások, özvegyi nyugdíj, árvaellátás”] Y Y
Pensions financed from other sources - Miners’ early pension [„bányásznyugdíj”], artists’ pensions [„művésznyugdíj”], early pension subsidized by the employer [„korengedményes nyugdíj”]y
Y Y
- Accident allowance [„baleseti járadék”] Y Y Pension-like regular social allowances - Allowances of people with reduced work capacity (inlc. pre-pension provisional allowance [„átmeneti járadék”], regular social allowance [„rendszeres szociális járadék”] miners’ health impairment allowance [„bányász egészségkárosodási járadék”]
Y Y
- Disability allowance [„rokkantsági járadék”] Y Y - Spouse’s supplement [„házastársi pótlék”] Y Y - Regular allowances for agricultural workers [„mezőgazdasági szövetkezeti járadékok”] Y Y
- Supplementary benefits compensational supplements for former political persecutions [„politikai rehabilitációs nyugdíjkiegészítések”], blind people’s allowance [„vakok személyi járadéka”], support for the handicapped [„fogyatékossági támogatás”]
N Y
Y= yes, N= no
263

ANNEX Additional costs coming from the old age allowances
The new pension model (compared to the 2006 model) projects a significant decline in the pension cost due to the declining future entitlement rate. A number of persons will not qualifying for an old-age pension, because of the insufficient working years. Nevertheless those people who will not be entitled to pension in the coming decades will still burden public spending, but not through the pension system. Neglecting such expenditure items could lead to an underestimation of public expenditures related to an ageing population. Taking on board this additional cost, which is estimated to rise to around 0,4% by 2060, the pension spending will increase from 13,5% to 13,8% of GDP in 2060 in gross term and from 12,8% to 13,2% in net term, respectively. Method of the estimation of the old-age allowances According to the current legislation people who fail to obtain enough rights that would qualify them for a social security pension, might become entitled to a social assistance benefit (e.g. old-age allowance [időskorúak járadéka]). The old-age allowances can be received after age 62. The model quantifies that the proportion of the people aged above 62 without pension and the pensioners aged above 62 will increase from almost 0% to around 15%. Between 2010 and 2020 the change in total old-age allowance expenditure in percentage of GDP is less than 0.05 %. As from 2020 a sharp increase can be observed and the expenditure of the old-age allowance will rise up to 0.4% of GDP by 2060. When estimating the cost coming from the old age allowances we assume that 97% of the people aged above 62 without pension will apply for this allowances. The calculation uses the same indexation as we use for the public pension.
264

Malta (Report prepared by Godwin Mifsud and Pauline Mercieca)
1. Overview of the pension system
1.1. Introduction
This pension fiche summarises the pension projections for Malta for the period 2007-2060 on the basis of the assumptions of the Ageing Working Group. The pension projections incorporate the latest changes to the Social Security System, in particular the reform law enacted during December 2006. The fiche is organised as follows: Part 1 provides an overview of the pension system in Malta, Part 2 describes the pension projection model and the base data while Part 3 provides the projection results.134 Annex I provides a description of the contributory and non-contributory benefits in Malta. Annex II provides an overview of the main equations used in the model and Annex III provides an explanation to the factors affecting the pension coverage over the projection period.
1.2. Overview of the Pension System in Malta
1.2.1. The Social Security Scheme
The current pension scheme in Malta is based on the Social Security Act, Chapter 318 of the Laws of Malta. The Act provides for two basic schemes, the Contributory Scheme, and the Non Contributory Scheme. In the Contributory Scheme, the basic requirement for entitlement is that specific contribution conditions are satisfied. In the Non Contributory Scheme, the basic requirement is that the conditions of the means test are satisfied. The Non Contributory Scheme has made possible the allocation of more than one benefit at the same time, thus providing simultaneous coverage in those cases where more than one contingency is present. Through the process of targeting, this scheme has succeeded in the provision of additional assistance to certain specific categories such as, in the case of persons with a disability, in the case of single parents, as well as in the case of the family as a single unit. The Contributory Scheme is universal since it practically covers all strata of the Maltese society. Within this scheme, employees, self-occupied and self-employed persons acquire social insurance rights through the payment of a weekly contribution as laid down by the Social Security Act. A description of the contributory and non-contributory benefits can be found in Annex 1. Contributions are payable by all gainfully occupied persons between the age of 16 and their pension age.135 The scheme allows for different types of contributions in order to extend coverage to all types of persons in employment. Employed persons pay Class One 134 The assistance of the World Bank and the Ministry for Social Policy is acknowledged. 135 Contributions are also payable by pensioners in gainful employment that retired after 5 of January 2008. Pensioners who retired earlier than this date are allowed to work without prejudicing their pension rights in the ages of 61 years to 65 years without paying social security contributions, subject to a ceiling on earnings equivalent to the national minimum wage. For this group, ceiling on earnings is removed at age of 65 years and no further contributions are due.
265

contributions, while the self-occupied pay Class Two contributions. Class One contributions imply that any person employed under a contract of service in Malta is considered to be in insurable employment and subject to the payment of these contributions. For each person, a tripartite contribution is payable: the employed person, the employer and the State each pay 10 per cent of the basic salary of the employee; with the contribution capped to the Maximum Pensionable Income that stood at €16,419 in 2007 i.e. around 25 per cent higher than the average wage. The rate of Class Two contributions is equally shared by the State and self-occupied persons, whereby the self-occupied pays 15 per cent and the State pays 7.5 per cent of their annual income that is subject to the same ceiling that applies for employees.136 The following categories of persons are statutorily exempt from the payment of a Class Two contribution:
a) Persons in receipt of full-time education or training. b) Non-gainfully occupied married persons. c) Persons in receipt of a pension in respect of widowhood, invalidity or retirement or
persons in receipt of a Parent’s Pension. d) Persons in receipt of non-contributory Social Assistance or a non-contributory
pension. Crediting of contributions is allowed during certain contingencies, mainly:
i. A widow, where such widow is not gainfully occupied for any period during which she does not remarry.
ii. An ex-member of the Malta Police Force or the Armed Forces of Malta who retires on a service pension on completion of the full service prior to reaching pension age, for any period during which he or she is not gainfully occupied and has not yet reached pension age.
iii. A person who goes abroad as a volunteer worker on projects in the areas of human welfare and development and environmental protection for any period he or she is performing such volunteer work and has not yet reached pension age subject to statutory defined criteria.
iv. A person who is entitled to sickness, injury, or unemployment benefits or to an Invalidity Pension.
v. Following the implementation of the pension reform, which is explained in detail below, the categories of persons to whom credit of contributions is allowed has been extended to include persons born on or after the 1 January 1962, who have the legal care and custody of a child who is less than six years old, or ten years old in the case of a child suffering from a serious disability.
1.2.2. Overview of Key Pension Parameters
What follows is an outline of the main pension parameters of the contributory old-age pension also known as the two-thirds pension scheme. During December 2006 the House of Representatives formally adopted a series of parametric reforms (Act No. XIX of 2006) that provided for changes in the definition of pension age, retirement before pension age, the full rate of two-thirds pension, calculation formula, the maximum pensionable income and the crediting of contributions.
136 A self-occupied person is a defined by the Social Security Act as “a self-employed person who is engaged in any activity through which earnings exceeding €910 per annum are being derived”.
266

By virtue of Legal Notice 336 of 2006 published in the Malta Government Gazette of the 29 December 2006, Government announced the dates when provisions of the Social Security (Amendment) (No. 2) Act, 2006 will enter into force. It was announced that some of these measures entered into force as from 2007 while others shall come into force as from the 1st of January 2011. The Definition of Pension Age One of the main parametric changes announced in the reform concerns changes to the statutory pension age. Prior to the reform, pension age stood at sixty years for females and sixty-one years for males. Following the implementation of the reform, pension age was raised to sixty-five years, however, a number of provisos apply: As outlined in Table 1, in the case of a person born on or before the 31 December 1951, pension age shall be sixty-one years while for females pension age shall be sixty years; in the case of a person born during the calendar years 1952 to 1955, pension age shall be sixty-two years; for persons born during the period 1956 to 1958, pension age shall be sixty-three years; for persons born in the period 1959 to 1961, pension age shall be sixty-four years. Retirement before the Pension Age Prior to the enactment of the reform, the full weight of a pension was payable to a person who has paid or has been credited with a yearly average of 50 contributions over a 30 year contributions period upon reaching pension age. Fewer years of contribution resulted in linearly reduced pensions, with the minimum years of contributions paid required to collect a pension currently set at ten years. Following the reform, a person who has attained the age of sixty-one years but has not yet attained pension age, may after attaining sixty-one years of age claim a pension in respect of retirement if such person is no longer gainfully occupied. It is necessary that since reaching his eighteenth birthday, the claimant has had a total of: • 2,080 (or 40 years) paid or credited contributions in the case of a person born on or
after the 1st January 1962, or • 1,820 (or 35 years) paid or credited contributions in the case of a person born during
calendar years 1952 to 1961. Pensionable Income Prior to the enactment of the pension reform law, the pension was determined on the basis of the yearly average of the basic wage during the best three years of the last ten years in the case of employees while the best ten years were taken into consideration for self-occupied persons.137 Under the reform law, in the case of a person born on or after the 1 January 1962, the pension shall be determined by taking the yearly average of the basic wage/salary/net income/net earnings as the case may be, during the best ten calendar years within the last forty years immediately preceding his retirement or invalidity. In determining pensionable income, past wages and incomes are updated with the cost of living adjustment (COLA) granted with respect to those years.138 137 The basic wage refers to the gross wage or salary that is payable to an employed person by or on behalf of his employer excluding any remuneration for overtime, any form of bonus, any extra allowances, any remuneration in kind and commissions. 138 COLA is a flat rate increase in wages and pensions (the latter granted in full as from Budget for 2008) that reflects the indexation of the basic wage to the average Retail Price Index inflation of the last 12 months to September of that year. In 2007, the basic wage was around 17% higher than the National Minimum Wage that came into effect on 1st January 2007.
267

Pension Formula Prior to the reform, the pension formula for the two thirds pension was as follows:
PensionServiceIncomeePensionablAverageonContributi __*)32(*_ −
Where the Contribution Average was determined as the average of two averages with the first average being the average weekly contribution over the last ten years prior to retirement (Avg_Cont10) and second being the average weekly contribution paid during a maximum of twenty years falling prior the last ten years before the retirement of an insured person (Avg_Cont20):
502
)__(_
2010 ContAvgContAvgAverageonContributi
+=
The Social Security Act defines the ‘service pension’ as a pension or any allowance awarded to a person at any time before and after 1st of April 1978 that is payable by or on behalf of his employer with respect to past services in Malta or abroad. Over the years there were a number of changes made to the definition of service pension, however the principle introduced in 1978 remained in place as in the case where a person is in receipt of a service pension that exceeds two-thirds of his or her pensionable income then he or she is entitled to a flat-rate Retirement Pension (classified under ‘top-ups’). On the other hand, if the person’s service pension is less than two-thirds of pensionable income then the person is awarded an Increased Retirement Pension (classified under ‘2/3 retirement pension’) that is equivalent to the difference between the two-thirds of pensionable income and the service pension. Therefore, prior to the enactment of the reform, the full rate of the Two-Thirds Pension was equal to 2/3 of pensionable income for a claimant who has paid or been credited with a yearly average of 50 contributions over a period of thirty-years. Under the reform law, the period of contribution was changed as follows: (i) thirty years in the case of a person born on or before the 31 December 1951; (ii) thirty-five years for a person born during calendar years 1952 to 1961; and (iii) forty years in the case of a person born on or after the 1 January 1962. For a person born on or after the 1 January 1962, the yearly average of contributions required for the purposes of awarding a Two-Thirds Pension shall be assessed on any period of 40 years between the first day of his contribution year in which he reaches the age of eighteen and the last day of his last complete contribution year before the beginning of his benefit year.
268

Table 1: pension reform measures
Pension Age
Males Females Males Females2004 61 60 61 602010 61 60 61 602013 61 60 62 622018 61 60 63 632022 61 60 64 642026 61 60 65 65
No of Contributions Years for Full-Pension Entitlement
Before 30 years
After Born on or before 31 December 1951 30 yearsBorn during the years 1952 to 1961 35 yearsBorn on or after 1 January 1962 40 years
Calculation of Pensionable Income
Before Best three out of last ten years for employed personsLast ten years for self-occupied persons
After No change for persons born before 1962
Minimum Pension
Before 4/5ths of the National Minimum Wage for a couple2/3 of the National Minimum Wage for any other person
After
For persons born on or after 1962 pension shall be determined as the yearly average of the basic wage/salary/net income/ net earnings of the best ten years within the last forty years
Pension Reform: Summary of Selected Measures
Establishment of the Guaranteed National Minimum Pension payable at a rate that is not less than 60 per cent of the National Median Income
Before After
The Maximum Pensionable Income Prior to the reform, the maximum pensionable income was fixed by law and in 2006 it stood at €15,723.27 and was revised in recent years in line with the cost of living adjustment (COLA). Following the reform, in the case of a person born on or before the 31 December 1961, whose retirement occurs on or after the 1 January 2007, the basic wage/salary/net
269

income/net earnings and the resultant pensionable income, shall not exceed €16,207.78 increased by such sum as the Government may award as a cost of living increase. The following provisions stand: (i) for a person born on or before the 31 December 1951, the resultant pensionable income including any such cost of living increase shall not exceed the sum of €17,470.30; (ii) in the case of a person born during calendar years 1952 to 1961, the resultant pensionable income including any such cost of living increase shall not exceed the sum of €20,964.36. In the case of a person born on or after the 1 January 1962 whose retirement occurs on or after the 1 January 2007, the resultant pensionable income shall not exceed: (i) €16,207.78 increased by such sum that the Government awards for the cost of living, in respect of the years 2007 to 2010; (ii) €16,207.78 increased on the 1 January of each year between 2011 and 2013 by one third of the difference between the sum referred to above and €20,964.36; (iii) €20,964.36 increased annually by 70 per cent of the percentage increase in the national average wage for the previous calendar year, plus 30 per cent of the inflation rate for that same year. This applies as from the 1 January 2014. The Guaranteed National Minimum Pension Changes were enacted to the National Minimum Pension, which stood at 4/5ths of the National Minimum Wage for a couple and 2/3rds of the National Minimum Wage for any other person. Following the enactment of the reform law, a person born on or after the 1 January 1962 who is not entitled to a Service Pension shall be entitled to a Guaranteed National Minimum Pension (GNMP) which shall be payable at a rate that is not less than 60 per cent of the National Median Income. This represents a higher rate than that awarded to pensioners at present. The exact rate shall be determined by the Minister in charge of the Department of Social Security with the concurrence of the Minister responsible for Finance. In any case, the rate of GNMP cannot be less than that declared for the preceding year. Crediting of contributions The categories of persons to whom credit of contributions is allowed has been extended to include persons born on or after the 1 January 1962, who have the legal care and custody of a child who is less than six years old, or ten years old in the case of a child suffering from a serious disability. Crediting of contributions may be claimed for a maximum period of two years in the case of a parent who has stopped working to take care of his/her child, extended to four years in the case of a child suffering from a serious disability. An adoptive parent is also able to claim such credits. Credits may be claimed for every child, with no distinction between employed and self-employed persons. The claimant is bound to have worked a minimum number of years equal to the duration of the crediting period. In the case of a parent’s death, the latter proviso ceases to apply. Pension Indexation Persons born before the 1 of January 1962 (including present retirees) have their pension updated on the basis of the COLA as well as any increases in wages presently awarded through collective bargaining to the occupation or salary scale previously occupied by the person in retirement. Following the pension reform, persons born after the 1 of January 1962 will have their pension updated annually by such a sum that corresponds to 70 per cent of the increase in the national average wage and 30 per cent of the inflation rate as published by National Statistics Office.
270

Ministerial Powers and Responsibilities The Minister in charge of the Department of Social Security will, within intervals not exceeding five years, prepare a report reviewing the workings regarding the Retirement Pensions together with recommendations for achieving further adequacy, sustainability and social solidarity. The first report is due in 2010. The Minister, in concurrence with the Minister of Finance has the power to make and vary any regulations requiring persons who have not reached pension age and their employers as the case may be, to make contributions into Mandatory Second Pension Funds. Such regulations may provide for the rate of contribution payable, method and frequency of payment. Second Pension funds shall be governed by the Special Funds (Regulation) Act (Cap. 450). The Minister may in conjunction with the Minister for Finance provide exemptions from income tax in respect of contributions made by any person to Third Pension funds. These funds will be governed by the Special Funds (Regulation) Act (Cap. 403) as applicable.
1.2.3. Other reforms
Apart from the pension reform described in Section 1.1, the Maltese Government also introduced changes to regime regulating the award of the invalidity pensions and the review procedure. The new regime was implemented over the course of 2007 after the necessary legislative and organisational changes were instituted. These measures introduced a new medical review process for this benefit and amongst the measures involved one finds: (i) Change the application format – to include more medical data and further responsibility on the part of the claimant to prove his case. No invalidity pension is issued for life and each case is subject to regular reviews. All cases are reviewed every three to four years – where updated medical evidence is requested from the beneficiary. (ii) Change the current medical panel system – under the new system, the Department of Social Security will be recruiting medical practitioners through an Expression of Interest to act as a Medical Review Team. The Team’s main function is to advise the Director (Social Security) on the medical aspects of Invalidity claims. (iii) Establish specific medical criteria for the award of benefits – this has been achieved by establishing “Impairment Tables” that provide the basic guidelines under which that Medical Review Team would decide on work- related impairment for Invalidity pension. (iv) Establish an independent systems audit – Establish a medical audit for benefit claims awarded and rejected on medical grounds, in order to establish whether such benefits have been awarded correctly. Changes were also made to minimum period of sickness prior to payment of invalidity pension benefit which is now set at three months. However this waiting period does not apply in the case of sudden severe or terminally-ill persons.
271
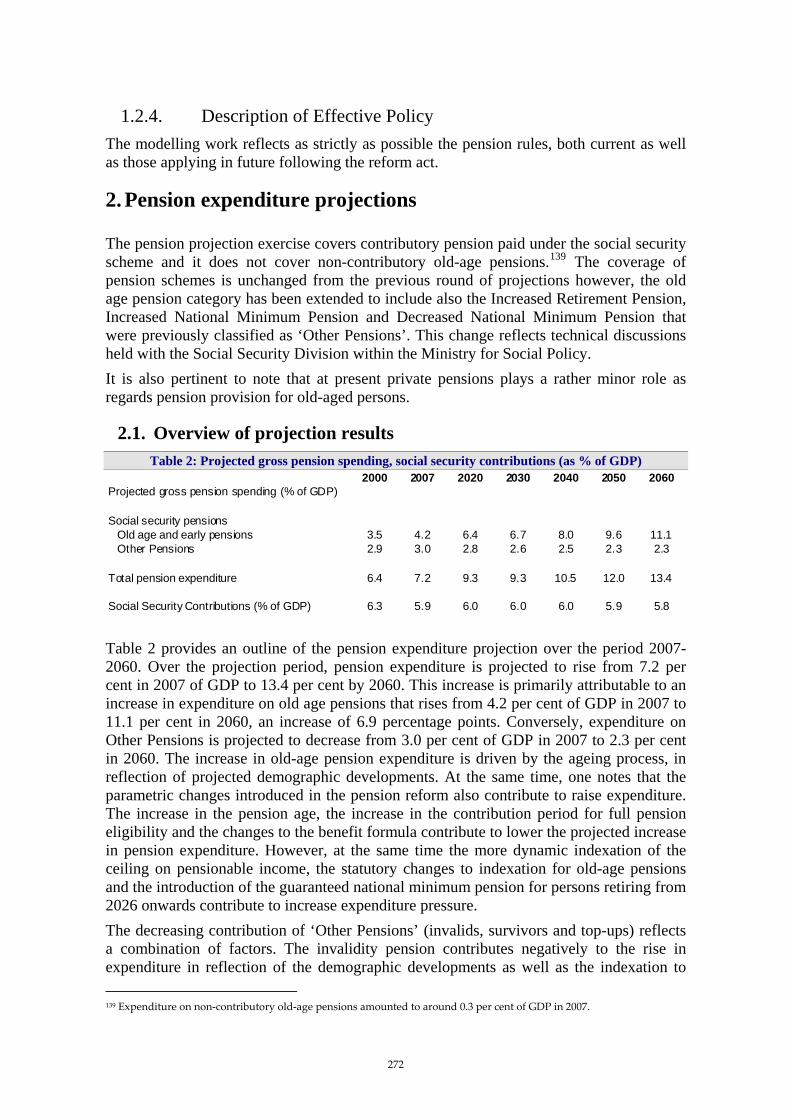
1.2.4. Description of Effective Policy The modelling work reflects as strictly as possible the pension rules, both current as well as those applying in future following the reform act.
2. Pension expenditure projections
The pension projection exercise covers contributory pension paid under the social security scheme and it does not cover non-contributory old-age pensions.139 The coverage of pension schemes is unchanged from the previous round of projections however, the old age pension category has been extended to include also the Increased Retirement Pension, Increased National Minimum Pension and Decreased National Minimum Pension that were previously classified as ‘Other Pensions’. This change reflects technical discussions held with the Social Security Division within the Ministry for Social Policy. It is also pertinent to note that at present private pensions plays a rather minor role as regards pension provision for old-aged persons.
2.1. Overview of projection results Table 2: Projected gross pension spending, social security contributions (as % of GDP)
2000 2007 2020 2030 2040 2050 2060Projected gross pension spending (% of GDP)
Social security pensions Old age and early pensions 3.5 4.2 6.4 6.7 8.0 9.6 11.1 Other Pensions 2.9 3.0 2.8 2.6 2.5 2.3 2.3
Total pension expenditure 6.4 7.2 9.3 9.3 10.5 12.0 13.4
Social Security Contributions (% of GDP) 6.3 5.9 6.0 6.0 6.0 5.9 5.8
Table 2 provides an outline of the pension expenditure projection over the period 2007-2060. Over the projection period, pension expenditure is projected to rise from 7.2 per cent in 2007 of GDP to 13.4 per cent by 2060. This increase is primarily attributable to an increase in expenditure on old age pensions that rises from 4.2 per cent of GDP in 2007 to 11.1 per cent in 2060, an increase of 6.9 percentage points. Conversely, expenditure on Other Pensions is projected to decrease from 3.0 per cent of GDP in 2007 to 2.3 per cent in 2060. The increase in old-age pension expenditure is driven by the ageing process, in reflection of projected demographic developments. At the same time, one notes that the parametric changes introduced in the pension reform also contribute to raise expenditure. The increase in the pension age, the increase in the contribution period for full pension eligibility and the changes to the benefit formula contribute to lower the projected increase in pension expenditure. However, at the same time the more dynamic indexation of the ceiling on pensionable income, the statutory changes to indexation for old-age pensions and the introduction of the guaranteed national minimum pension for persons retiring from 2026 onwards contribute to increase expenditure pressure. The decreasing contribution of ‘Other Pensions’ (invalids, survivors and top-ups) reflects a combination of factors. The invalidity pension contributes negatively to the rise in expenditure in reflection of the demographic developments as well as the indexation to
139 Expenditure on non-contributory old-age pensions amounted to around 0.3 per cent of GDP in 2007.
272

COLA. On the other hand, the survivors’ pension contributes positively to overall increase in expenditure as result of the ageing process as well as its indexation that is similar to old-age pensions. The ‘top-up’ pension is a benefit currently payable to persons in receipt of service pensions which includes former servicemen in receipt of overseas pensions. This expenditure category is projected to decrease in importance over time in line with the life expectancy of the recipients of this pension. Meanwhile the social security contribution (exclusive of the state contribution) is projected to remain rather stable throughout the projection horizon. This reflects the outcome of interaction between factors raising social security revenue such as the increase in pension age and more dynamic increases in the contribution ceiling that are expected to be countered by demographic factors.
2.2. Expenditure decomposition
A deeper insight into the drivers of these results may be obtained by looking at the results of the decomposition of pension expenditure between 2007 and 2060 into the dependency ratio, coverage ratio, the employment rate and the benefit ratio. This decomposition was obtained by applying the standard expression that follows:
444 8444 76444 8444 764444 84444 76444 8444 76 RatioBenefitRateEmploymentRatioCoverageRatioDependency
PeopleWorkingGDP
PensionAveragePeopleWorking
PopulationPopulation
PensionersofNumberPopulationPopulation
GDPExpPension ×−×
+×
−+=
/1
6415656415
65.
Table 3: Factors behind the public pension expenditure between 2007 and 2060 (in p.p. of GDP)
2007-20 2020-30 2030-40 2040-50 2050-60 2007-60Public pensions to GDP in a starting year 2.1 0.1 1.2 1.4 1.4 6.2
Dependency ratio 4.0 2.2 0.6 2.0 2.2 10.9Coverage ratio -0.6 -1.0 -0.1 -0.7 -0.4 -2.8Employment effect -0.7 -0.5 0.0 -0.1 0.0 -1.3Benefit ratio -0.4 -0.5 0.8 0.3 -0.4 -0.1Interaction effect -0.2 -0.2 0.0 -0.1 -0.1 -0.5 As shown in Table 3, over the period 2007-2060 pension expenditure as a percentage of GDP increases by 6.2 percentage points. Taking into consideration the entire projection horizon, this increase is entirely driven by the developments in the dependency ratio. The other factors play a mitigating effect with the contribution of the benefit ratio being almost neutral. Over the period 2007-2020 public expenditure on pensions is expected to rise by 2.1 p.p. driven by the increases in the old-age dependency ratio, while the coverage ratio, the employment rate and the benefit ratio contribute negatively. Over the next decade (2020-2030), public pension expenditure rises only marginally. Over the period 2030-2050, the rise in pension expenditure is driven by the dependency ratio but also the benefit ratio, in reflection of the entrance into effect of some expenditure-increasing reforms described above. Meanwhile, the contribution of the benefit ratio turns slightly negative over the decade 2050-2060 as average pensions rise at a slower rate compared to economy-wide labour productivity.
273

Table 4: Number of pensioners and contributors in the Social Security scheme (in 1000), population over 65 and total employment (in 1000) and related ratios (%)
2007 2020 2030 2040 2050 2060Number of Pensioners (I) 68.3 97.4 104.7 107.2 110.4 116.6Number of Persons aged 65+ (II) 56.5 86.2 103.3 107.3 118.2 128.8Ratio of (I) and (II) 121% 113% 101% 100% 93% 91%
Number of Contributors (III) 165.0 165.8 168.5 166.2 155.3 142.1Employment (IV) 159.0 168.5 172.3 170.2 159.4 146.2Ratio of (III) and (IV) 1.0 1.0 1.0 1.0 1.0 1.0Ratio of (III) and (I) 'support ratio' 2.4 1.7 1.6 1.5 1.4 1.2
Number of Persons aged 15-64 (V) 283.8 277.1 265.7 260.4 241.4 221.3Ratio of (V) and (I) 4.2 2.8 2.5 2.4 2.2 1.9 Table 4 provides an insight into the impact of demographic factors on the financial sustainability of public pension schemes. The number of pensioners is projected to rise by around 71 per cent over the projection period, in reflection of increases in the number of old-age pensioners while the number of ‘Other Pensioners’ is projected to decrease. The ratio of pensioners to the 65+ population declines from 121 per cent in 2007 to 91 per cent in 2060. The number of persons in employment is projected to rise from around 159,000 in 2007 and reach a peak between 2026 and 2030. Subsequently it decreases in line with the ageing process of the Maltese population as the number of new entrants in the labour market is not enough to compensate for the number of persons entering into retirement. As a result, the support ratio (defined as the ratio of contributors to pensioners) is projected to decrease from 2.4 contributors per pensioner in 2007 to 1.2 in 2060.
2.3. Sensitivity Analysis
Table 5 shows the impact of different shocks on public pension expenditure as a percentage of GDP. The ‘higher life expectancy’ scenario models an increase in life expectancy at birth. As a result, expenditure increases by 6.5 p.p. over the projection horizon i.e. 0.3 p.p. higher than in baseline. This increase reflects that the fact that longevity results in a higher outlay on public pensions in line with a priori expectations.
Table 5: Public pension expenditures as a % of GDP under different scenarios
2007 2020 2030 2040 2050 2060 2060-07
Baseline 7.2 9.3 9.3 10.5 12 13.4 6.2Higher life expectancy 7.2 9.3 9.4 10.7 12.2 13.7 6.5Higher labour productivity 7.2 9.2 9.1 10.2 11.4 12.6 5.4Higher interest rate 7.2 9.3 9.3 10.5 12 13.4 6.2Higher employment rate 7.2 9.1 9.2 10.4 11.9 13.3 6.1Higher emp. Of older workers 7.2 9.1 9.2 10.4 11.8 13.3 6.1Zero migration 7.2 9.6 10 11.6 13.7 15.7 8.5 In the scenario modelling ‘higher labour productivity’, public expenditure on pensions increases by 5.4 p.p. of GDP over the projection period i.e. 0.8 p.p. lower than in the baseline case. This result reflects the fact that higher labour productivity results in a higher
274

outlay on pensions in reflection of indexation of benefit formula parameters to wages but also higher GDP with the latter effect outweighing the former. The scenarios modelling ‘higher employment rate’ (+1%) and ‘higher employment rate of older workers’ (+5%) result in an increase in pension expenditure by 6.1 p.p. of GDP. This result is the net effect of higher pension expenditure in line with the increase in the number of contributors and higher GDP, with the increase in the latter resulting in a marginal decline relative to the baseline case. In the ‘zero migration’ scenario expenditure on public pensions is projected to increase by 8.5 p.p. of GDP over the projection horizon. This increase reflects the outcome of less contributors - that results in a lower expenditure outlay – which is outweighed by the decrease in the rate of GDP growth owing a lower labour input relative to baseline. When compared to baseline, public pension expenditure increases by an additional 2.3 p.p. of GDP. As regards the ‘interest rate’ scenario, this leaves the baseline results unaffected as Malta’s pension system is an unfunded PAYG.
2.4. Changes in comparison to 2006 projections
Table 6 compares the decomposition of the main drivers in the pension expenditure ratio in the 2009 and 2006 projections over the period 2007-2050. The benefit ratio had a strong negative effect on expenditure in the 2006 projection, however this has now been reversed and it shows a small but positive contribution of 0.3 p.p. in 2009. This development reflects the impact of the expenditure-increasing aspect of the reform. Additionally, the change in assumptions – both demographic and macroeconomic had a relatively strong impact on the outcome. In fact, the dependence ratio has a stronger effect on pension expenditure in the 2009 projections in comparison to 2006. As regards the employment rate its contribution remained rather stable while the contribution of the coverage rate is stronger in 2009 relative to 2006, a development that is likely to reflect the impact of the pensions reform that is expected to lower the number of pensioners particularly as a result of the increase in pension age as well as the demographic assumptions adopted.
Table 6: Decomposition of the change (in %) in public expenditure to GDP between 2007 and 2050 under the 2006 and 2009 pension projections
% Change 2007-2050
Dependence Ratio
Coverage Ratio
Employment Rate
Benefit Ratio
Interaction Effect
Pension/GDP - 20061 -0.5 7.3 -1.2 -1.0 -5.0 -0.6
Pension/GDP - 2009 4.8 8.7 -2.4 -1.3 0.3 -0.5
1) The change in Pension/GDP ratio refers to 2005-2050 The sensitivity of the projection results to the demographic and macroeconomic assumptions may be also illustrated by replacing the AWG assumptions for 2009 with the set of assumptions used in the 2006 round. As shown in Table 7 below the results outlined in the fiche are sensitive to the AWG demographic and macroeconomic assumptions adopted.
275

Table 7: Sensitivity to assumptions – Impact of adopting the 2006 AWG assumptions
2000 2005 2007 2020 2030 2040 2050 2050-2007
2009 Baseline 6.4 7.1 7.2 9.3 9.3 10.5 12.0 4.8
2009 Baseline with 2006 assumptions 6.4 7.1 7.2 9.1 8.5 8.9 9.7 2.5
276
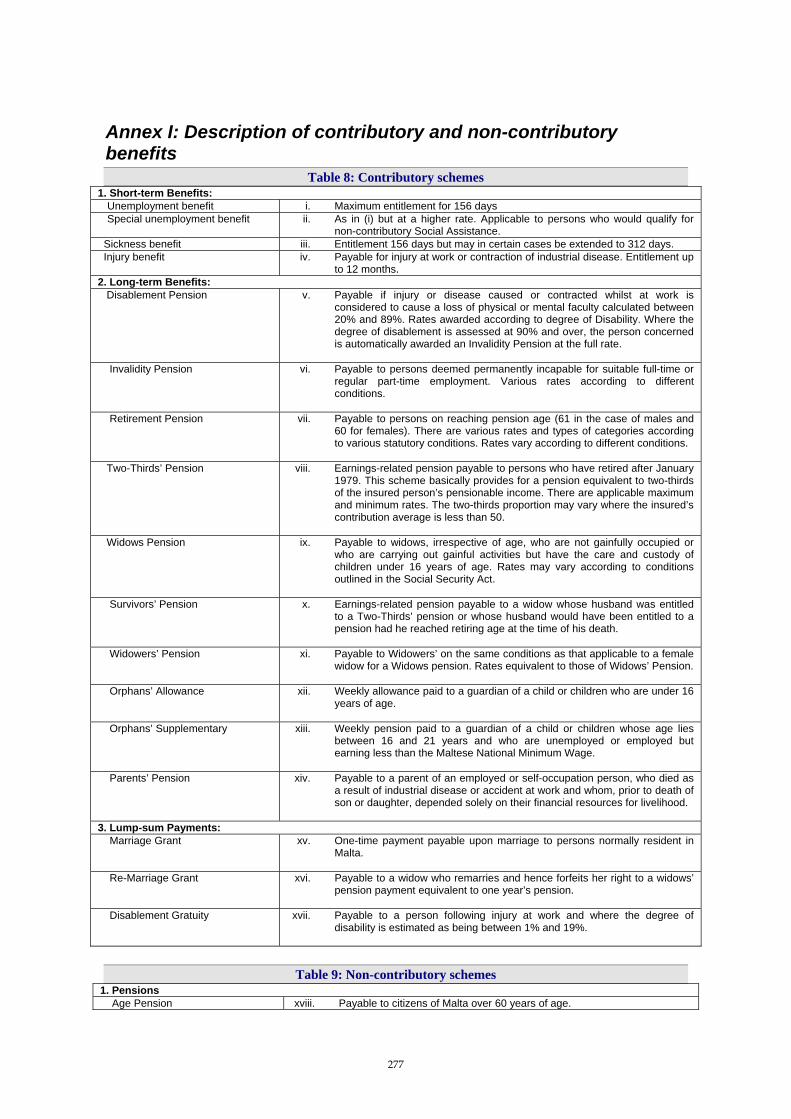
277
Annex I: Description of contributory and non-contributory benefits
Table 8: Contributory schemes 1. Short-term Benefits:
Unemployment benefit i. Maximum entitlement for 156 days Special unemployment benefit ii. As in (i) but at a higher rate. Applicable to persons who would qualify for
non-contributory Social Assistance. Sickness benefit iii. Entitlement 156 days but may in certain cases be extended to 312 days. Injury benefit iv. Payable for injury at work or contraction of industrial disease. Entitlement up
to 12 months. 2. Long-term Benefits: Disablement Pension v. Payable if injury or disease caused or contracted whilst at work is
considered to cause a loss of physical or mental faculty calculated between 20% and 89%. Rates awarded according to degree of Disability. Where the degree of disablement is assessed at 90% and over, the person concerned is automatically awarded an Invalidity Pension at the full rate.
Invalidity Pension vi. Payable to persons deemed permanently incapable for suitable full-time or
regular part-time employment. Various rates according to different conditions.
Retirement Pension vii. Payable to persons on reaching pension age (61 in the case of males and
60 for females). There are various rates and types of categories according to various statutory conditions. Rates vary according to different conditions.
Two-Thirds’ Pension viii. Earnings-related pension payable to persons who have retired after January
1979. This scheme basically provides for a pension equivalent to two-thirds of the insured person’s pensionable income. There are applicable maximum and minimum rates. The two-thirds proportion may vary where the insured’s contribution average is less than 50.
Widows Pension ix. Payable to widows, irrespective of age, who are not gainfully occupied or
who are carrying out gainful activities but have the care and custody of children under 16 years of age. Rates may vary according to conditions outlined in the Social Security Act.
Survivors’ Pension x. Earnings-related pension payable to a widow whose husband was entitled
to a Two-Thirds’ pension or whose husband would have been entitled to a pension had he reached retiring age at the time of his death.
Widowers’ Pension xi. Payable to Widowers’ on the same conditions as that applicable to a female
widow for a Widows pension. Rates equivalent to those of Widows’ Pension.
Orphans’ Allowance xii. Weekly allowance paid to a guardian of a child or children who are under 16 years of age.
Orphans’ Supplementary xiii. Weekly pension paid to a guardian of a child or children whose age lies
between 16 and 21 years and who are unemployed or employed but earning less than the Maltese National Minimum Wage.
Parents’ Pension xiv. Payable to a parent of an employed or self-occupation person, who died as
a result of industrial disease or accident at work and whom, prior to death of son or daughter, depended solely on their financial resources for livelihood.
3. Lump-sum Payments: Marriage Grant xv. One-time payment payable upon marriage to persons normally resident in
Malta.
Re-Marriage Grant xvi. Payable to a widow who remarries and hence forfeits her right to a widows’ pension payment equivalent to one year’s pension.
Disablement Gratuity xvii. Payable to a person following injury at work and where the degree of
disability is estimated as being between 1% and 19%.
Table 9: Non-contributory schemes
1. Pensions Age Pension xviii. Payable to citizens of Malta over 60 years of age.

Pension for the Visually Impaired xix. Payable to a citizen of Malta over 14 years of age whose visual activity has
been certified by an ophthalmologist to be so low so as to render such persons unable to perform any work for which eyesight is essential.
Pension for Persons with a Disability
xx. Payable to citizens of Malta over 16 years of age. Various types of disability are listed under the Social Security Act.
Carers’ Pension xxi. Payable to single or widowed citizens of Malta who are taking care on a
full-time basis of a bed-ridden or wheel-chair bound near relative.
Social Assistance xxii. Payable to heads of households and who are either unemployed or seeking employment and where the relative financial means falls below that established by the Social Security Act. Payable also to single persons who lack financial resources and who are caring for an elderly or physically/mentally handicapped relative on a full-time basis.
Emergency Assistance xxiii. Granted to a female who is or has been rendered destitute by the head of
household to the extent that she becomes an inmate of any institute for the care and welfare of such persons. This benefit is payable by the Department of Welfare.
Sickness Assistance xxiv. Payable to persons suffering from a chronic disease or condition that
requires a special diet.
Tuberculosis Assistance xxv. Payable to head of household or any member of the household suffering from or has, within the last 5 years, suffered from Tuberculosis. This assistance is not subject to a means test.
Leprosy Assistance xxvi. Payable to head of household or any member of the household who is receiving treatment for leprosy. It is not means tested.
Milk Grant xxvii. Payable to head of household receiving Social Assistance when he or any
member of the household has the care or custody of a child under 40 weeks of age requiring to:
• either be weaned or, • is losing weight in spite of being breast fed or, • is a member of a household receiving Tuberculosis Assistance.
Free Medical Aid xxviii. Payable to a person who on account of disablement, sickness, or disease
(and who is not hospitalised), is in need of medical, surgical or pharmaceutical aid. Means-tested except in cases where the person is suffering from tuberculosis, leprosy, poliomyelitis or diabetes mellitus or other chronic diseases outlined in the Social Security Act.
Table 10: Family allowance & Maternity Benefits (Also 'Non-Contributory' Benefits)
Children’s Allowance xxix. The children’s allowance is partly flat-rate applicable universally. However there is over and above a means tested component which increases the basic flat rate according to an incomes test.
Special Allowance xxx. Payable to locally residing female citizens of Malta who have the care of a child who is 16 years of age or over and who is either still at school or registering for employment. This is also means-tested.
Disabled Child Allowance xxxi. Payable to locally residing citizens of Malta who have the effective custody of a child suffering from cerebral palsy or severe mental subnormality or is severely handicapped or have a child under 14 years of age who is blind.
Foster Care Allowance xxxii. Payable to recognised institutes for the care of children and to foster parents. The children are to be resident at a recognised institute and young persons or living with foster parents.
Maternity Benefit xxxiii. Payable to local residing pregnant citizens of Malta in respect of the last 8 weeks of pregnancy and the first 6 weeks after childbirth (for a total of 14 weeks benefits). Only payable if the female is not entitled to maternity leave from her employer, if employed. Not means tested.
Bonus(1) xxxiv. Payable to all persons receiving a pension, orphans’ allowance, Social Assistance and Leprosy Assistance under the Social Security Act.
Bonus(2) xxxv. Payable to persons receiving a pension for services rendered in Malta, or ex-British Service pensioners, or persons over 75 years of age who receive a service pension.
Additional Bonus xxxvi. Payable to all persons who receive bonus. Supplementary Allowance xxxvii. Payable to households where the total income of the members falls below the
limits outlined by the Social Security Act from time to time.
278
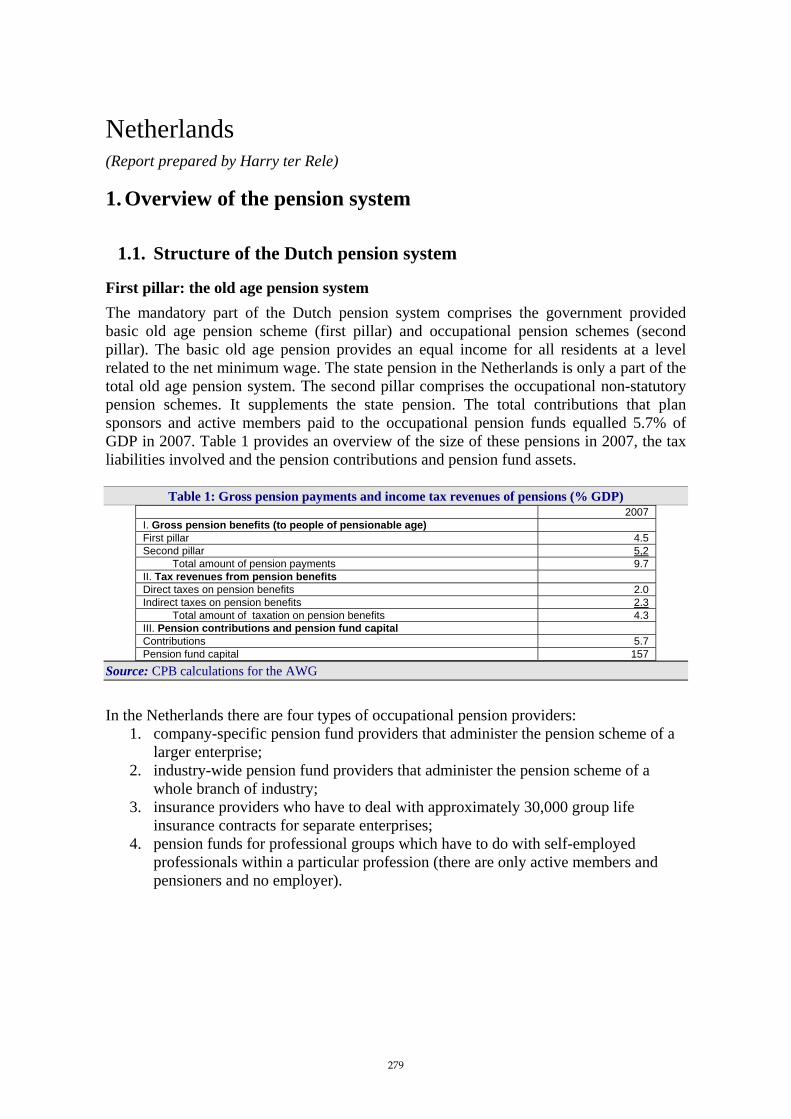
Netherlands (Report prepared by Harry ter Rele)
1. Overview of the pension system
1.1. Structure of the Dutch pension system
First pillar: the old age pension system The mandatory part of the Dutch pension system comprises the government provided basic old age pension scheme (first pillar) and occupational pension schemes (second pillar). The basic old age pension provides an equal income for all residents at a level related to the net minimum wage. The state pension in the Netherlands is only a part of the total old age pension system. The second pillar comprises the occupational non-statutory pension schemes. It supplements the state pension. The total contributions that plan sponsors and active members paid to the occupational pension funds equalled 5.7% of GDP in 2007. Table 1 provides an overview of the size of these pensions in 2007, the tax liabilities involved and the pension contributions and pension fund assets.
Table 1: Gross pension payments and income tax revenues of pensions (% GDP) 2007 I. Gross pension benefits (to people of pensionable age) First pillar 4.5 Second pillar 5,2 Total amount of pension payments 9.7 II. Tax revenues from pension benefits Direct taxes on pension benefits 2.0 Indirect taxes on pension benefits 2.3 Total amount of taxation on pension benefits 4.3 III. Pension contributions and pension fund capital Contributions 5.7 Pension fund capital 157
Source: CPB calculations for the AWG In the Netherlands there are four types of occupational pension providers:
1. company-specific pension fund providers that administer the pension scheme of a larger enterprise;
2. industry-wide pension fund providers that administer the pension scheme of a whole branch of industry;
3. insurance providers who have to deal with approximately 30,000 group life insurance contracts for separate enterprises;
4. pension funds for professional groups which have to do with self-employed professionals within a particular profession (there are only active members and pensioners and no employer).
279

Table 2: Survey of Dutch Pension Funds Industry-wide Pension
Funds Company-specific Pension Funds
Pension Funds for Professional Groups
Number of pension funds on December 2006
95 529 13
Source: DNB
The pension sector is also concentrated. The largest fund , with an invested capital of 215 billion euros at December 31 2007 (The Dutch Civil Servants’ Pension Fund ABP), represents 25% of the total assets. The following largest five funds share 57% of the total assets. At present, 637 pension funds are in operation, of which 529 funds are company-specific, 95 are industry-wide and 13 are pension funds for a particular profession (see Table 2). Other than these, 30,000 group pension agreements have been made with insurance providers by companies that do not have a pension fund. All these pension providers are being supervised by the Dutch Central Bank (DNB). Their joint capital is estimated at around 800 billion euros. First pillar: the state old age pension (AOW) The AOW is the statutory old age pension scheme of the Netherlands. By legislation, it provides all residents of the Netherlands as from the age of 65 a flat-rate pension benefit that, in net terms, equals 70% of the net minimum wage for singles and 100% for a married couple. Therefore these pensions rise in line with minimum wages. There is no means-test for the eligibility of benefits; other forms of income have no effect on the AOW benefit. Until 2015, the 100% of net minimum wage benefit also applies to couples of which one of the partners has not yet reached the age of 65. As of that date however, this changes for new cases of which the younger partner has sufficient means of his or her own. This measure was legislated in 1996 and is expected to eventually curb the level of expenditure on this scheme by 3%. This effect is assumed to be reached in 2025. All residents of the Netherlands between the ages of 15 and 65 are insured for the AOW. No distinction is made between men and women, between civil servants, employees, self-employed and housewives. During the period of insurance, entitlement is accrued in 2% steps for every insured year. This leads to a 100% entitlement to the relevant pension benefit on reaching the age of 65, provided there are no gaps in the period of insurance. A gap occurs when a person resides outside the Netherlands. People who are not entitled to the full AOW benefit and who have, together with other sources of income, a total income below the subsistence level (i.e. less than 70% of the legal minimum wage) are entitled to receive social assistance. State old age pensions are financed according to the pay-as-you-go system: today’s contributors finance the pension payments made to the pensioners of today. The ageing of the population will put pressure on this system of financing. At the moment there are over 2 million old age pensioners in the Netherlands, but this number will double over the next few decades. The administrative body for the AOW is the Social Insurance Bank (SVB). The SVB is independent of the government in its day-to-day operations. The Board of Directors manages the Bank in consultation with the Board of Advisors. The Ministry of Social Affairs and Employment (SZW) appoints the members of both the Board of Directors and Board of Advisors and approves its annual plan and budget. The SVB is subject to inspection by the Work and Income Inspectorate (IWI), part of SZW.
280
Second pillar: occupational pensions Although there is no obligation for employers to make pension commitments to their employees, the vast majority of those employed in the Netherlands (over 90%) participate in an occupational pension scheme. Occupational pensions are subject to negotiation between the social partners and have to be financed by capital funding. A pension scheme is part of the employment conditions laid down in an agreement (which may be a collective agreement). Characteristically, final salary schemes and average pay schemes promise a yearly replacement rate of 1.75% to 2% of the final salary or average career salary (including first pillar benefits). If the collective labour agreement lasts for 35 to 40 years, the total pension benefit (first plus second pillar) will be around 70% of the final or average salary. 70% of the pension funds aim at wage indexation and 30% at price indexation. Occupational pension schemes are considered supplementary to the AOW state pension. The AOW benefit is therefore a factor included in most calculations of second pillar pension schemes in order to arrive at the 70% aim referred to above. This is known as the AOW franchise. In recent years many pension funds have switched from final pay schemes to average pay schemes. As of January 1st 2007, some 90% of all active members were participating in a defined benefit scheme, of which 95% in a career average pay scheme. Usually, the way contributions are divided among social partners varies from one pension scheme to another. According to statistical data of Statistics Netherlands (CBS), the average employer contribution amounts to approximately 70% of all contributions. The third and fourth pillar in the Netherlands are relatively small. Together, they provide around 10% of pension income. Early retirement In many sectors voluntary early retirement schemes (VUT) were set up on a pay-as-you-go basis. These schemes came into existence in the early 1980s as a result of collective efforts among social partners to cope with youth unemployment. However, reflecting the generosity of the overall pension system, the rate of early retirement has significantly increased over the years. Because of the increasing costs for employers and the ageing population, reform of the VUT began a few years ago. Some pension funds established pre-funded early retirement schemes. As of January 1st 2006, legislation removed the favourable tax treatment of these schemes. With these measures the government wants to encourage higher labour force participation by older workers. The financial position of pension funds The second pillar of the Dutch pension system is characterised by the legal obligation of full funding for the nominal, i.e. non-indexed, liabilities of pension funds. Many pension funds have invested in equity and real estate. In order to compensate the higher risks involved in these investments, the supervisor requires that a Dutch pension fund hold additional reserves (buffers). During the 1990’s certain developments took place, including a systemic increase in pension obligations (and costs), a reduction of contributions paid and a continuous drop of the capital market interest rate. These developments caused a reduction of reserves and the erosion of prudence from the pension system itself. The erosion was even deepened by the occurring shift towards high-risk investments. These developments led to a fall of the funding ratio. This ratio, which is defined as the ratio between assets and nominal, that is
281
non indexed, liabilities fell from approximately 230% in 1990 to 115% in 2004. In terms of the real, indexed, liabilities the latter figure coincides with a ratio of around 80%. The supervisor subsequently tightened up the regulations for pension funds and intensified their supervision. Pension fund administrators then made arrangements in order to restore their financial positions. Most funds are currently on track to restore the shortfall in reserves. Simultaneously, the supervision structure is being revised. There is a consensus between the government, social partners, pension fund administrators and the supervising authority that stop-gap regulations aimed at short-term financial stability could be counterproductive to the long-term quality of the pension system. Achieving a balance between short-term exigent requirements and the long-term robustness of the pension system remains to be a challenging task for the regulator, the supervisor and pension fund administrators. Part of the reform within the financial supervision context as a whole is the financial assessment framework (FTK) which came into force in 2007. It is legally required for pension funds to determine a cost-effective contribution rate and a minimum amount of cash in order to guarantee their members a pension benefit. If the amount is less than this basic limit, pension funds will be compelled to take measures to restore this level. According to the FTK, pension funds have to state in a clear way whether or not they will index the pension rights and under what conditions they intend to do so. The FTK will be assessed every five years. Disability and survivors benefits The system of disability pensions has undergone a substantial reform. In 2004 a number of measures were taken that affect the disability schemes. One more followed in 2006. The reform intends to curb the inflow into these schemes. This inflow has always been very high in the Netherlands and has resulted in a stock of beneficiaries that amounted to almost one million. The 2004 measures were threefold. First, it involved the extension from 1 to two years of the duration of the period in which employers have to continue to pay the wages of sick employees, though at a reduced rate of 70% of its previous level (down from 80%). This measure has a direct limiting effect on eligibility which sharply reduced the inflow in 2005. Apart from this, it is also expected to curb the future inflow by raising the incentives for employers to enhance working conditions and to increase the effort to fit the involved employees into the workforce. A further improvement may come from recovery from sickness during the period of the extension and from the incentives of the reduced earnings (to 70%) on employees. The second 2004 measure involves a restriction of eligibility by raising the requirements to qualify for these schemes. Not only the new claimants are submitted to the new, sharpened, criteria, the measure also applies to the existing stock of beneficiaries which undergo a one-off screening on the basis of the revised criteria. The third measure taken in 2004 was the abolition of the, separate, public scheme for the self-employed. These people have to resort to private insurers. The 2006 measures distinguish between degrees of disability. The effect on the inflow is expected to be substantial. This results from the combination of three effects. The first is a restriction in the eligibility of those who are partially disabled. Especially those with a very low degree of disability can in the future not apply at all. The other two, cost raising, effects involve the increase in benefit level of those with a high degree of disability (from 70% of previous earnings to 75%) and the abolition of a previously successful measure that differentiates the contribution to the scheme by imposing a higher contribution on
282

companies from which there had in the past been a large inflow of employees into the schemes. Overall, the cost saving effect of the reform results from the lower inflow. On average, benefit levels are only slightly affected. In the period 2003-2006 and over the next decades the stock of persons that benefit from the schemes are expected to decline by around 300 thousand between 2004 and 2030, or by roughly one third. This corresponds to the reduction in the cost for government. Note that this contrasts sharply with the projection in 2001 where the number of disabled was expected to rise by around 300 thousand in the coming decades. Relative to the 2001 round of projections the current one thus involves a decrease in the stock of claimants that amounts to about 600 thousand persons and a correspondingly lower size of expenditure on this scheme. The scheme of survivors benefits covers widowers, widows and orphans. The benefit level has a maximum of 70% of minimum wage. This level applies only to individuals with no income from labour. In net terms it equals the social assistance level. In case the involved individual has income from labour the benefit is reduced by a level that equals 50% of minimum wage plus two thirds of the surplus of labour income. Possession of personal wealth or incomes from pensions do not lead to a reduction of the benefit.
1.2. The role of the government
Employers and employees organisations are responsible for the arrangement of the occupational pensions. The government’s role with respect to these supplementary pensions is confined to providing a legal framework and supervision. Tax legislation Tax legislation is very influential in the development of the Dutch pension system. The Taxation of Pensions Act was approved by Parliament in 1999. This Act defined the conditions under which pensions are reasonable pensions. Pension contributions from the employer and employee are, within the limits set by the Taxation of Pensions Act, tax-deductible. Furthermore, the investment returns are exempt from taxation. Pension benefits received are taxed as income. Since, in general the rate at which contribution rates are deduced is higher than the rate at which pension benefits are taxes, this implies a subsidy on retirement saving through pension funds. Note that this tax regime implies that when the baby boomers start to retire, this positively affects direct as well as indirect tax revenues. Pension and Savings Fund Act (PSW) Once an employer has made a pension commitment to his employees, this commitment must be implemented in the way prescribed in the PSW. The commitment is therefore subject to the protection of the PSW. The main safeguard is the rule that pension commitments have to be financed on the basis of capital funding, and that the reserves must be placed outside the employer’s company either by joining an industry-wide pension fund or by establishing a company pension fund or by entering into an agreement with an insurance provider. This avoids the pension funds going to creditors if the company goes bankrupt. A number of other measures laid down in the PSW are:
• the legal right of transfer of pension rights in the event of a change from one employer to another;
283
• the fact that indexation rights applied to pensioners must also be applied to early leavers (indexation itself is customary but not mandatory);
• a ban on surrendering pension rights to the beneficiary (exchanging the entitlement for a lump sum payment would undermine the purpose of accrual safeguarding of pensions);
• as of 2002, participants who are accruing a survivor’s pension are entitled to exchange this position on the retirement date for a higher or earlier old age pension. As of 2002, the outcome of these and other optional modules in pension schemes must result in equal benefits for men and women. As of 2005, contributions and benefits in defined contribution schemes must also be equal for men and women.
The PSW also lays down the institutional framework of a pension scheme: conditions concerning statute and rules, the constitution of the Governing and Executive Boards, representation of pensioners in the implementation process of pensions, supervision on schemes and pension providers, information given to participants by pension funds and insurance providers, etc. Mandatory Participation in a Branch Pension Fund Act of 2000 (Wet Bpf 2000) When central organisations of employers and employees jointly set up a branch pension fund, they may ask the government to impose an obligation on all employers and employees within their particular industrial sector to participate in the industry-wide fund. In this way, agreements between social partners are made binding for everyone in the sector. For participation in a pension fund to be declared mandatory, however, the employer’s organisations supporting the request must employ at least 60% of the employees in their sector. No support percentage is prescribed for the organised employees. In certain defined cases, companies can be exempted from participation in a mandatory pension scheme, for example, when a company already has an individual pension fund or when the performance of investment by the branch pension fund is inadequate. The mandatory branch pension funds in the Netherlands cover about 80% of the total number of employees in the Netherlands who are in an occupational pension scheme. The Netherlands have 71 mandatory branch pension funds. There are funds not only for health care workers, for example, and construction workers, but also for organ builders. Public servants are under a special statutory obligation to participate in the pension fund for public servants, the ABP fund, and it is one of the largest funds in the world. In recent years branch pension funds have been criticised for offering companies too little room to develop pension schemes of their own. This has lead to the question of whether mandatory participation in branch pension funds is compatible with competition law. In particular, it has been alleged that this principle is contrary to the EC Convention that was designed to ensure free competition and prevent the creation of monopolies. Branch pension funds function on the basis of solidarity. Employees are offered the same pension rights on the same conditions irrespective of gender, age or state of health. A solidarity-based system such as this can only function well if participation is mandatory. The European Court of Justice has endorsed this position. In 1999 the Court ruled that the obligation to participate in a branch pension fund is of general, social and economic importance. Not only because of the solidarity, but also because of the obligation for all employees in the sector to participate enables a good pension scheme to be offered. On
284

these grounds the Court ruled that the compulsory nature of these funds is permitted under EC law and is not contrary to competition law. Mandatory Participation in a Pension Scheme for Professional Groups Act (Wet Bpr) A pension scheme for professional groups is based on an agreement between self-employed professionals in a particular profession. Through a procedure based on the Mandatory Participation in a Pension Scheme for Professional Groups Act (Wet Bpr), the government can make participation in a pension scheme for a professional group mandatory for the profession as a whole. This occurs at the request of an organisation or organisations representing a sufficient majority of the professional concerned. A bill is in preparation which will be stricter for pension schemes for professional groups: medical examinations before entering the fund will not be allowed any more. Also all members have to pay the same percentage of contribution to the fund, irrespective of age, sex or health. Because pension schemes for professional groups are not based on pension commitments made by employers, such a pension scheme is subject only partially to the PSW. At present there are 11 pension funds for professional groups. The new Pension Act A new Act was implemented in 2007. It gives effect to the modernizing provisions and to a technical review of the Pension and Savings Fund Act (PSW). The new policy proposals concern issues relating to:
• the personal scope of the bill (who has to participate in a pension scheme); • basic criteria for the financial solvency of the pension funds; • information that must be given to participants by the pension fund and insurance
provider. Increasing transparency in the implementation of pension schemes can increase support for maintenance of the current pension system. A key issue here is to raise the public’s pension awareness. The government is promoting the provision of information by pension administrators through the inclusion of relevant regulations in the new Pension Act, encouraging projects and the conclusion of agreements with pension administrators, social partners and senior citizens organisations. The new Act will also include further guarantees that agreed pensions will actually result in pension payments. Further attention will also be paid to pensioner involvement in administering and managing the implementation of the pension scheme.
2. Pension projections
2.1. The projections
Table 3 presents the results of the projections for both public and occupational pensions, the tax revenue effects related to these pensions, and the expected developments of pension contributions and pension fund assets. All variables are expressed as a percentage of GDP. The (state) first pillar old age pensions rise from 4.5% of GDP in 2007 to 9.0 % in 2060. This is slightly smaller than the percentage increase of the old age dependency ratio.140 Given its flat rate nature, this is in line with the fact that a minor cost saving
140 The old age dependency ratio, defined as the number of over 65 year olds relative to 15 to 64 year olds, equals 21.6% in
285

change in the scheme is implemented (see section 1) and participation rates are projected to rise. The rise is roughly similar to the one in the 2006 projection. In the case of occupational pensions the rise, from 5.2% of GDP in 2007 to 12.1% in 2060, slightly exceeds that of the old age dependency ratio. This development is the net result of two counteracting factors. The first one, leading to an additional rise of pensions, is caused by the future rise of the share of pensioners that have fully participated in the occupational pension system during their working years. This reflects the maturing of the system. The second, somewhat smaller one, which reduces occupational pensions, captures the effects of the reform which involve a decrease of benefit ratios. Table 3 also shows the projections for ‘other pensions' (see row 3). Disability benefits are extrapolated by imputing the projected decrease of the number of claimants due to the reform. This extrapolation is carried out by a separate analysis. Table 3 shows that expenditure on other pensions (disability and survivors benefits), expressed as a share of GDP, will decrease from 2.1% in 2007 to 1.6% in 2060. The decline of 0.5%-points is fully due to the reform of the disability scheme. Demographic developments do not play a role as the relevant age group coincides with the working years. The decline is similar to that in the 2006 projection. However, it contrasts sharply with the 1% of GDP rise of expenditure on these benefits which were projected in 2001 (see below). As a result of the rising old age and occupational pensions, tax revenues from these incomes are also expected to increase (see the last two rows of table 3). Taxes are levied on the combined income from both sources.141 The tax rate structure on pension income is highly progressive. In the table however, they are presented separately assuming that the public pension is taxed at the tax rate that applies to ‘first’ or basic income and that the occupational pension is taxed at the (higher) rates that apply to income in excess of the basic income. The tax rate on the public pension amounts to 14% whereas the average rate on the supplementary occupational pensions is around 27%. This latter figure applies to 2007. It will show a gradual and slight increase to 29% in 2060 as average incomes from this source will rise at a faster pace than average wage income (due to the future rise of the share of pensioners with a full occupational pension), making effective the progressive tax rate structure on pension income. This tax progression is included in the calculation by applying a tax progression factor if the increase of average pension income exceeds that of average wage income. The increase in occupational pensions, amounting to almost 7% of GDP between 2007 and 2060, represents an increase in the total tax base. It does not adversely affect other tax bases in the economy. This is due to the fact that they are financed by revenues from assets that are accumulated abroad. This accumulation of pension fund assets (see table 6) is made possible by the large amounts of tax exempt savings in this form, and is reflected in the current large surpluses on the balance of payments which amount to 7% of GDP. The current tax base is thus smaller than GDP. Pension contribution rates, and indirectly also the balance of payments surplus, are set at a level that makes it possible that the accumulation of foreign assets in the coming decades suffices to finance the future rise in 2007. It is projected to increase to 30.7% in 2020, 40,0% in 2030, 46.8% in 2040, dip slightly to 45.6% in 2050 and subsequently rise again to 47.2% in 2060, the last year of the projection. Over the whole period 2007-2060, this entails a 118% rise of this ratio. The table does not provide data for private pensions. The reason for this is that mandatory private pensions do not exist and non-mandatory private pensions can not be distinguished from incomes from personal savings. 141 The taxation of occupational pensions can be characterised as an EET-system (exempt-exempt-taxed). Pension contributions to the pension funds are tax exempt, as are the returns on assets to the pension fund. The pensions are taxed, however, when they are paid out to the pensioners.
286

occupational pensions. In this process, the current surplus on the trade balance is projected to decrease, eventually vanish and even turn into a small permanent deficit that is financed by the revenues on the accumulated funds abroad. The ratio of pension fund assets to GDP will then reach a steady state value of more than 300% (see Table 6). This process also leads to a rise of consumer spending relative to GDP without crowding out other spending, and therefore to a rise of indirect taxes.
Table 3: Projected gross pension spending, tax on pension and contributions (% of GDP) 2000 2007 2020 2030 2040 2050 2060 Peak year142 Social security pensions 7.3 6.6 7.8 9.3 10.3 10.3 10.5 2060 Old-age and early pensions 4.5 4.5 5.9 7.6 8.8 8.7 9.0 2060 Other Pensions 2.8 2.1 1.9 1.7 1.6 1.6 1.6 2000 Occupational pensions 4.0 5.2 6.7 9.0 10.8 11.1 12.1 2060 Total pension expenditure 11.2 11.7 14.4 18.3 21.2 21.4 22.6 2060 Taxes on public pensions 0.6 0.6 0.8 1.0 1.2 1.2 1.2 2060 Taxes on private pensions 1.1 1.4 1.8 2.5 3.1 3.2 3.5 2060
Table 4 decomposes the increase in the ratio of pension expenditures to GDP into the effects of changes in the dependency, coverage and benefit ratio and in the employment rate. The following formula shows how the decomposition is carried out:
444 8444 76444 8444 764444 84444 76444 8444 76 RatioBenefitRateEmploymentRatioCoverageRatioDependency
PeopleWorkingGDP
PensionAveragePeopleWorking
PopulationPopulation
PensionersofNumberPopulationPopulation
GDPExpPension ×−×
+×
−+=
/1
6415656415
65.
Table 4 shows that the driving force behind the ratio of public pension expenditures to GDP between 2007 and 2060 lies completely in the enormous increase in the dependency ratio during the period up to 2040. The other factors exert mitigating effects. The coverage ratio decreases due to the reform in the disability schemes which curbs the future inflow into these schemes. Its full effect is reached in 2040. The benefit ratio decreases for two reasons. The first is that the share of other pensions falls. These pensions are generally higher than the old age pensions. It is a composition effect. The second lies in the abolishment, as of 2015, of the full married couple public pension for couples with a younger partner below 65 (see above). Finally, the rise of employment rates also turns out to have a, small, dampening effect. Table 4: Factors behind the public pension expenditures between 2007 and 2060 (in percentage points
of GDP) 2007-20 2020-30 2030-40 2040-50 2050-60 2007-60 Public pensions to GDP in a starting year143 1.3 1.5 1.1 -0.1 0.3 4.0
Dependency ratio 2.7 2.3 1.6 -0.3 0.4 6.6 Coverage ratio -0.7 -0.5 -0.3 0.0 0.0 -1.5
1/Employment rate -0.1 0.0 -0.2 0.1 0.0 -0.2 Benefit ratio -0.5 -0.2 0.0 0.1 -0.1 -0.6
Table 5 provides an insight into the impact of demographic factors on the financial sustainability of public pension schemes. The number of pensioners (row 1) consists of two components: persons benefiting from an old age pension, which depends on the 142 This column represents a peak year, i.e. the year in which the particular variable reaches its maximum over the interval 2000 to 2060. 143 The starting year is 2007 for the column 2007-20 and 2020 for the column 2020-30, etc.
287

number of over 65 year olds, and persons benefiting from an ‘other’ pension (disability or survivor benefit). This number increases in the next decades due to the first component: the rise in the number of people entitled to an old age pension (the first component) because they reached the age if 65. The second component, the number of people benefiting from another pension, has an opposing, though smaller, effect due to the reform in the disability schemes. Mainly as a result of the reform however, the ratio of pensioners to the number of people aged over 65 (row 3) decreases from 150% in 2000 and 139% in 2007 to 114% in 2060. The number of contributors to the social security scheme (row 4) consists of workers and pensioners.144 It is projected to increase due to the rising number of people aged over 65. This outweighs the decline in the number of working contributors (employment) due to demographic factors. Both developments contribute to the fact that the ratio of the number of contributors to employment rises from 131% in 2007 to 164% in 2060. The ‘support ratio’ (last row), the ratio of contributors to pensioners, declines from 333% in 2007 to 238% in 2060.This is purely a result of the increase in the old age dependency ratio. Other factors, such as the fall in the number of people receiving an other pension and the higher employment rate, only mitigate this development.
Table 5: Number of pensioners and contributors in the Social security scheme (in 1000), population over 65 and total employment (in 1000) and related ratios (%)
2000 2007 2020 2030 2040 2050 2060 Number of pensioners (I) 3229 3302 4201 4903 5301 5158 5158 Number of people aged 65+ (II) 2152 2368 3346 4147 4633 4506 4523 Ratio of (I) and (II) 150 139 126 118 114 114 114 Number of contributors (III) 10278 10981 12015 12464 12725 12463 12259 Employment(IV) 7807 8400 8401 8013 7780 7703 7460 Ratio of (III) and (IV) 132 131 143 156 164 162 164 Ratio of (III) and (I) 'support ratio' 318 333 286 254 240 242 238
Table 6 shows how the assets of pension funds, expressed as a percentage to GDP, develop in the period up to 2060. The increase in this percentage reflects the ageing of the population. The higher the ratio of pensioners to workers become, the higher the percentage of assets to GDP that is needed to cover the pension funds’ liabilities. Pension contribution rates are, in the long run, determined at a level that ensures coverage. The bulk of the increase of assets lies in the period up to 2040.This is the period in which the ageing of the population takes place. The smaller increase after 2040 is a result of the ongoing increase of life expectancy which calls for a further rise of assets.
Table 6: Assets of pension funds and reserves, (% of GDP) 2000 2007 2020 2030 2040 2050 2060 Occupational pensions 129.5 156.9 209.0 255.1 280.0 297.9 316.3
Table 7 compares the rise in the pension to GDP ratio in this round of projections to their equivalents in the previous two rounds. The comparison is carried out for the period until 2050 because this was the time horizon of the previous exercises. Table 7 shows that the current projection only slightly differs from the previous one in 2006. The demography driven impact of the dependency ratio even shows no change at all. The benefit ratio now has a somewhat larger dampening effect due the inclusion of the abolishment, as of 2015, of the full married couple public pension for couples with a younger partner below 65. Mistakenly, as this measure was already legislated in 1996, this effect was not included in 144 The contribution of the pensioners to these three schemes however is very small and consists only of the contribution to the survivors' scheme. Pensioners are exempt from contributing to the old-age and the disability scheme.
288

the previous two rounds. The coverage ratio, in contrast, now has a slightly smaller dampening effect. An explanation for this lies in the lower number of disability claimants in the initial year 2007 relative to what was projected in the previous round. This reduces the scope for further reduction in these numbers after 2007 due to the reform of these schemes. The differences with the 2001-round, however, are sizeable and roughly made up of three factors which, on balance, lead to a far lower rise in this ratio. The net change of 5.5% of GDP, projected in 2001, is now reduced to 3.7%. The main reason for this lies in the reform of the disability schemes (see above). Whereas a large rise of the number of claimants was projected in 2001, the current projection features a significant reduction in these numbers. As a result, the rise in the coverage ratio changes into a reduction. As the benefit levels in these schemes are higher than those of the old age pensions, this also impacts on the benefit ratio. The other two factors counteract the effect of the reform but turn out to be much smaller. These are a higher rise in the dependency ratio, which reflects a change in demographic assumptions, and a lower offsetting effect of the increase of the employment rate. Table 7: Decomposition of the change (in %) in public pension expenditure to GDP between 2007 and
2050 under the 2001, 2006 and 2009 projection exercises % Change to
2050 Dependence
ratio Coverage ratio Employment rate Benefit
ratio Pension/GDP – 2001 5.5 5.4 0.5 -0.6 0.2 Pension/GDP – 2006 3.8 6.3 -1.6 -0.2 -0.4 Pension/GDP – 2009 3.8 6.3 -1.5 -0.2 -0.5
Table 8 presents the effects on public pensions under assumptions that deviate from the baseline assumptions. The higher life expectancy scenario shows higher expenditure on pensions. This simply reflects the increase in the number of persons in the relevant age groups. It is fully due to the higher dependency ratio. In the Dutch schemes, the benefit and coverage ratios remain unchanged. In the higher labour productivity scenario the ratios of public pensions remain unchanged. This reflects the wage indexation rules of public schemes. The ratios of total pensions to GDP however decline somewhat due to a lagging increase of occupational pensions. The reason for this lies in the average pay schemes. In such schemes, higher growth rates lead to a lower accrual of pension entitlements relative to GDP. In the higher interest rate scenario public pensions remain unchanged as a share of GDP. Occupational pensions however, and therefore total pensions, increase somewhat because the higher interest rates improve funding ratios. They reduce the present values of the pension funds’ liabilities, and consequently lead to smaller restrictions in the indexation rules that apply to pensions. Note that the main change in the occupational pension schemes in this scenario is not presented in table 8. This lies in a sharp drop in pension contributions. Both higher employment scenarios lead to a small drop in public pensions relative to GDP. This is purely due to an increase in GDP (the denominator). Public pensions (the numerator) are not affected by an increase in employment. In contrast, occupational pensions do increase in line with employment, and GDP, as this scheme links pension entitlements to past (average) wages.
289

Table 8: Total and public pension expenditures under different scenarios (deviation from baseline scenario)
2007 2020 2030 2040 2050 2060 Total Pension Expenditure
Baseline 11.7 14.4 18.3 21.2 21.4 22.6 Higher life expectancy 11.7 14.4 18.4 21.4 21.8 23.2 Higher lab. productivity 11.7 14.4 18.1 20.8 21.0 22.2 Higher interest rate 11.7 15.0 19.0 21.7 21.7 22.8 Higher emp. rate 11.7 14.3 18.1 21.0 21.2 22.5 Higher emp. of older workers 11.7 14.3 18.2 21.1 21.3 22.6 Zero migration 11.7 14.7 19.2 23.1 23.9 24.9
Public Pension Expenditure Baseline 6.6 7.8 9.3 10.3 10.3 10.5 Higher life expectancy 6.6 7.8 9.4 10.5 10.5 10.9 Higher lab. productivity 6.6 7.8 9.3 10.3 10.3 10.5 Higher interest rate 6.6 7.8 9.3 10.3 10.3 10.5 Higher emp. rate 6.6 7.7 9.2 10.2 10.2 10.4 Higher emp. of older workers 6.6 7.7 9.2 10.2 10.2 10.4 Zero migration 6.6 7.9 9.7 11.2 11.4 11.6
The zero migration scenario assumes the absence of both immigration and emigration. The last rows of the upper and bottom part of table 8 show that the pension to GDP ratios in this scenario would be significantly higher than in the baseline. This mainly results from the absence of immigration which leads to lower employment and GDP levels and, via its effect on the denominator, raises these ratios. The effect on the numerator, pension beneficiaries, follow far later as immigration is concentrated among the younger age groups (see below). However, it should be noted that the level of pension beneficiaries in this scenario is somewhat overestimated, and therefore also the presented ratios. This is due to a flaw in our model. The model uses actual expenditure on pensions in the base year as the starting point and projects future expenditure by linking its percentage growth rate to the forecasted percentage growth in the number of residents over the age of 65. This is not fully in conformity with the arrangement. In fact, entitlements to the public pension do not depend on residency during the ages that one receives the pension (over 65) but on residency during the working years (actually the number of years of residency in the Netherlands between 15 and 64). In the baseline this flaw of the model does not form a major problem. This is because the divergence in growth rates between the residing elderly and the elderly actually receiving a pension is small as the share of emigrating elderly may be assumed to remain roughly constant (and is small anyway). Both absolute change in the number of elderly residents as its stock then equally differ from their counterparts in terms of beneficiaries, leading to the same percentage increase. Ignoring migration therefore only has a minor effect on the baseline outcome. However, in a variant in which we change assumptions on migration this flaw may lead to more significant mistakes. In this case it leads to an overestimation of pension beneficiaries as in the baseline emigration exceeds immigration in the higher age groups. Consequently, the ratios of pensions to GDP presented in table 8 are also too high. Note also that the effects on government finances that the zero migration scenario produces up until 2060 can not be used to derive the sustainability effects of migration from. This is for two reasons. The first is that this would require an analysis that covers the full life cycle of immigrants and thus also the years in which the pension entitlements that the immigrants build up are actually paid out and included in the calculations. In our
290

analysis that only runs up to 2060 this is not equally the case. The second reason is that immigrants may have economic characteristics that differ from those of the native population which is not taken account of here.
291

Austria (Report prepared by Caroline Haberfeller, Peter Part, Hans Stefanits, Roman Freitag and Werner Lenzerbauer)
1. Overview of the pension system
1.1. Overview of the Austrian pension system
The public pension system in Austria is predominantly based on a pay-as-you-go (PAYG) scheme and consists of several sub-systems, above all for blue and white collar workers, farmers, self-employed and civil servants. The coverage of the public pension system is very high. Public pension benefits are still by far the primary source of income for retirees (approximately 95%). In order to harmonise these different schemes, a standardised, more actuarially-oriented pension account system for all employed under 50 years (i.e. for people born on 1 January 1955 or later) was introduced in 2005, established in the Act on Harmonisation of Austrian Pension Systems. This new pension system will gradually replace those different pension schemes over the long run. Currently, the statutory retirement age is 65 years for men and 60 years for women. But as a follow-up of a Constitutional Court ruling in the 90ies, the female retirement age of 60 years will be gradually raised to 65 years from 2024 (by ½ years steps) until 2033. Besides the regular old-age pensions, some possibilities are at disposal to receive early old-age pensions. Generally, when going on pension earlier (before reaching the statutory retirement age) a yearly deduction of 4.2% points is due (with a maximum ceiling of 15% points). The so called corridor pension (“Korridorpension”) enables a person to go on early pension within an age-corridor from 62 to 65 years when having actively contributed payments of at least 450 months (37.5 years) to the public old-age insurance scheme. For women this gets relevant only by 2028 with the phasing in of the harmonisation of retirement age of men and women. In that case, the yearly deduction for early retirement amounts to a reduced rate of 2.1% points per annum. Simultaneously, for working up to three years longer than demanded (i.e. until the age of 68) a bonus of annually 2.1% points is granted. A further possibility is the early old-age pension with a long period of insurance (“Vorzeitige Alterspension bei langer Versicherungsdauer”). People can claim a pension when having been insured for 450 months (37.5 years). Currently, they can leave the labour market with 57 (women) or 62 (men) years, respectively. This option is already expiring since 2004 by a stepwise increase of the entry age for early retirement and will be fully phased out by 2017. Furthermore, men can go on early pension with 60 years if their work has been in the area of “hard labour” (“Schwerarbeiterpension”). For women this settlement is only relevant from 2024 on (harmonisation of retirement age of men and women). The number of Schwerarbeiterpensionen, however, is very low (only 443 pensions in 2007). The pension settlement for long-term insured (“Langzeitversichertenregelung” or “Hacklerregelung”) makes a retirement with 55/60 years for women/men possible when having contributed 40 years (women)/45 years (men) to the pension system. No yearly deductions are applied when making use of this option until 2013. Currently, 64,000 retirees make use of this early pension option. These are almost 60% of total early pensioners.
292
The public pension system comprises also disability and survivors’ pensions. To be entitled to a disability pension, a medical certificate is required documenting the invalidity. Moreover, the status of disability must prevail for a minimum period of at least 6 months. The entitlement condition for a survivor pension is the death of the husband/wife. The deceased must have contributed for a certain period to the public pensions system (this depends on the age at which the spouse died). The new defined-benefit formula “45-65-80” is central in shaping the actual individual replacement rate. A person contributing 45 years to the public pension system and retiring at the statutory retirement age of 65 is entitled to receive a gross public pension amounting to 80% of his average life-time earnings. At present, the annual accrual rate corresponds to 1.8% in 2008 and will be further lowered to 1.78% in 2009 (from initially 2% before the reforms). The basis of average individual earnings will be extended gradually from the best 15 to the best 40 years of income until 2028. Entitlements for a regular old-age pension first arise with a minimum of 7 contribution years and when the statutory retirement age has been reached. Due to the establishment of the Act on Harmonisation of Austrian Pension Systems a system of parallel accounting in the transformation process from the old to new law is used. For people who have contributed to the pension system from 2005 on, only the new law (with the above mentioned benefit formula) is applied. For those who were 50 years or older by 1 January 2005 still the regulations according to the old law are valid. For all the persons who were below 50 years in 2005 this parallel accounting is applied. For those people pension benefits are calculated corresponding to old and to new law. Than a weighting method is used according to the contributions paid before and after 2005. As an example, a person having contributed to the public pension system 15 years before 2005 (old law) and 30 years after 2005 (new law) is entitled to pension benefits, with 1/3 due to the regulations of the old law and from 2/3 due to the new law. Currently, there still exists an overall ceiling on pension deductions (when comparing individual pension benefits due to the old and new legislation) of 10%. This cap will ultimately fade out in 2033. The purchasing power of pension benefits is secured by yearly adjustments according to consumer price inflation (CPI). Occasionally, on 24 September 2008 the Austrian Parliament decided on an exceptional slightly higher pension benefit adjustment, paid out already two months earlier in November 2008, together with a staged lump sum. This measure was taken in order to support the purchasing power of low income retirees in compensation for the high oil and food prices in 2008. Additionally, the waiting period for the first pension adjustment was repealed. Before, pension benefits of new pensioners were adjusted according to inflation only from the second year on after pensioning. As of 2009 pension benefits are adjusted from the first year on. Average pension benefits in the private social insurance scheme amounted to approx. € 840 per benefit received in 2007. This amount is quite low as also very small pensions (ca. 250,000 in number) are included which are paid to non-residents. Civil servants pension benefits are still much higher and made up for approx. € 2,320 per benefit received. In order to avoid elderly poverty, pensioners with pension claims below a certain minimum, have access to so called “Ausgleichszulagen” which are financed solely by federal tax revenues. If the total income of a pensioner is below a statutory minimum (“Richtsatz”), the pensioners receive a state-financed “equalising allowance” in order to add on to reach at least this defined minimum threshold (indexed by consumer price developments). The monthly statutory minimum was € 772.40 for a single pensioner in 2008 and € 1,158.08 for a married couple. At present, “Ausgleichszulagen” are granted to
293
around 240,000 recipients (approximately 10% of total pensioners). The total sum of equalising allowances amounts to approximately 0.3% of GDP (2007). The public pension system is financed mainly through compulsory contributions, which are supplemented by other public transfers (as c.f. out of the unemployment insurance scheme, the family allowance equalisation fund or federal transfers for granting minimum income standards). Pension contributions are levied on gross salaries and deducted from these before personal income tax. The present contribution rates are uniformly set at 22.8% in the private social insurance sector, whereof the employer bears 12.55% and the employee 10.25%. There are no contributions of the employers in the civil service sector. There, the employee’s contribution ranges from 12.55% to 10.25%. For farmers and self employed in the private social insurance sector a contribution rate of 15% and 17.5% is effective, whereby the difference to the standard contribution rate is borne by federal government transfers. The federal budget also covers the deficits in most public pension schemes in the case of their actual emergence (“Bundesbeitrag”). These deficits are, thus, financed by general tax revenues. Contributions to public old-age provisions in Austria are exempt from taxation, but pension benefits are subject to income tax and health care contributions. Generally, private pensions in Austria (both occupational and private) are still of much less quantitative importance than public pensions. Recent estimates145 show that private pension benefits paid in 2007 correspond to less than 5% of overall pension benefits. Nevertheless, the volumes of private pensions have increased rapidly in recent years. Benefits resulting from private pension provisions accounted for approximately 0.5% of GDP in 2007. It is projected that these benefits could rise to around 2% of GDP by 2070. The Austrian Occupational Pension Act (“Betriebspensionsgesetz”) contains all regulations for occupational old age provisions (2nd pillar). This Act regulates primarily following firm-related retirement provisions: 1) pension provision funds (“Pensionskassen”), 2) occupational collective insurances, 3) direct provisions allowed by a company to an employer and 4) life insurances. The implementation of the new severance payment (“Abfertigung neu”) in 2002 increased the relevance of the second pension pillar, as it made occupational pensions mandatory. Since then employers are obliged to transfer 1.53% of the monthly salary of their employees to a staff provision fund (“Mitarbeitervorsorgekasse”), set up especially for this purpose. In view of old-age provision, retiring employees can choose to receive the payout in form of the total sum (taxed with 6%) or in form of a monthly paid additional pension (tax exempt) or in terms of a reinvestment in a pension investment fund (which is tax exempt). Since the introduction of the new severance payment the entitlements arising out of these schemes rose from € 144m in 2003 to € 1,126m (or 0.4% of GDP) in 2006. Likewise, the number of prospective beneficiaries grew from 1.5m in 2003 to 2.1m in 2006. Private pension provisions made by individuals form the third pillar of the Austrian pension system. Like in the occupational sector, also in the private sector individuals can choose between a multiple range of investment products fulfilling directly or indirectly the purpose of old-age provision. Hence, in the private sector one can generally distinguish between concrete pension directed provisions and a general accumulation of savings over the life-cycle. Concrete pension directed provisions are aided by the state in order to boost
145 By the „Austrian Institute for Advanced Studies“.
294
the development of the third pension pillar. Traditionally, life insurances play a significant role in the private pension provision. Private life insurance contracts have continued to show a major upward trend over the past years. In 2006, the volume of premiums amounted to € 1.31bn (compared to € 1.197bn in 2003), whereas the insured sum made up for € 30.7bn or 12% of GDP (compared to € 26.2bn in 2003). While a private life insurance, in general leads to a one-off payment, private pension insurance contracts are usually concluded for the purpose of obtaining a life-long pension. The most attractive private old-age provision represents the new premium-aided pension savings scheme (“Zukunftsvorsorge”). This product was introduced in 2003 and can be understood as a form of life insurance (incl. a capital guarantee) subsidised by the state with a tax premium. The annual state premium made up for 9.5% in 2008. After a minimum investment period of 10 years, the taxpayer may dispose of his entitlements. If the entitlements are, however, paid out, half of the allowed state bonuses must be paid back, a tax of 25% must be paid on the capital gains retroactively and the capital guarantee is lost. If the entitlements are transferred or used for pension payments, no tax will be due. This scheme has been recording strong growth since its launch in 2003. In 2003 already 272,435 contracts existed. This amount more than tripled in the following three years to 987,521 contracts in 2006. By the end of 2006 the declared duration of every second contract was 30 years or longer.
2. Pension expenditure projections
Demographic developments until 2060
According to the EUROPOP2008 population projection (released by Eurostat in May 2008), the Austrian population is expected to increase from 8.3m persons today to a peak of 9.1m in 2046, before it starts to decline again to the level of 9m by 2060. The overall size of the Austrian population is projected to be larger by about 700,000 inhabitants in 50 years time, but also much older than it is now. According to the projections, the working-age population (aged 15-64) will continue to expand modestly from 5.6m to 5.8m people until 2020, before commencing to go down to a level of 5.2m by 2060 (despite continuous positive net immigration of 28,000 persons on average). Over the whole projection period, the potential labour force will drop by 8%. Also the young population (aged 0-14) will decline by 4% over the projection horizon. Simultaneously, the elderly population (aged 65 and above) will increase markedly throughout the projection period. The number of elderly will almost double, rising from 1.4m in 2008 to 2.6m in 2060. The very old population (80+ years) is projected to rise even stronger, by 176% (from about 370,000 in 2007 to over 1 million by 2060).
295

Graph 1: Austrian population projections – by age cohorts
Austrian population projections: Age cohorts
0
2000000
4000000
6000000
8000000
10000000
2007
2011
2015
2019
2023
2027
2031
2035
2039
2043
2047
2051
2055
2059
Years
Popu
latio
n
Age cohort 0-14 Age cohort 15-64 Age cohort 65+
Source: Eurostat (2008). The old-age dependency ratio (the ratio of persons 65+ years in relation to the age cohort 15-64 years), however, more than doubles from 25% at present to 51% in 2060 due to the baby-boom generation reaching the retirement age and life expectancy increasing by more than 6.5 years. This entails that Austria would move from having 4 working-age people for every person aged over 65 years to a ratio of 2 to 1. The economic dependency ratio (i.e. the ratio of young (0-14) and old age (65+) cohorts together in relation to the working age population) will step up from 102% to above 129%, as the fall in the young population will not compensate for the much stronger rise of older people. The convergence scenario approach employed in the EUROPOP2008 projection by Eurostat assumes a process of convergence in key demographic determinants (fertility rates, mortality rates/life expectancy, migration) across Member States to that of the forerunners over the very long-term (by the year 2150). For Austria, in consequence, the total fertility rate is projected to rise from 1.41 in 2008 to 1.48 by 2030 and further to 1.57 by 2060. In turn, life expectancy at birth for males is projected to increase by 7.2 years over the projection period, from 77.2 in 2008 to 84.4 in 2060. For females, life expectancy at birth is expected to go up by 6.1 years, from 82.6 in 2008 to 88.7 in 2060. Further, annual net migration inflows are projected to fall from about 33,000 people in 2008 to 22,000 people by 2060. In an additional calculated “zero migration scenario” the assumption of no migration would lead to a drop of the working-age population (15-64) of 5.6m today to 3.4m by 2060, which would amount to a decrease of 39%.
Labour force and employment developments until 2060
The labour force projection (based on a cohort component methodology initially defined by the OECD) shows the outcome for the labour force by extrapolating recent trends in rates of entry to and exit from the labour market. This base case projection reflects the working assumption of “no policy change” and, therefore, does not account for more or less likely future developments. Since the common macroeconomic projections of the Ageing Working Group already account for the pension reforms of the last years, in
296

particular the effects of raising and harmonising legal retirement ages and enhancing financial incentives to remain longer at work, their effects on employment are reflected by the Commission macro assumptions, accordingly. There has been no major change in incorporating these pension reforms into the labour force projections compared to the 2006 macro scenario. The labour force over the next 50 years is projected by combining the projections of population and of rates of participation by gender/age group (based on the EU labour force concept). The overall participation rate (for the age group 15 to 64) in Austria is anticipated to increase by 2.8 percentage points over the period 2007-2060 (from 74.8% in 2007 to 77.6% in 2060). The projected upward shift in the overall participation rate is mainly due to the increase of participation rates for women and the elderly. While the participation rate for men within this age group increases only by 0.3 percentage points over the projection horizon (from 81.7% in 2007 to 82% in 2060), the participation rate for women will be boosted by 5.1 percentage points (from 68% in 2007 to 73.1% in 2060). For the total age-group 15-71, the current and projected total participation rates as well as the increase are smaller (from 68.6% in 2007 to 70.1% in 2060). Apparently, due to the enacted pension reforms, the biggest raise in participation rates is projected for older workers (55-64 years); around 21 percentage points for females and 9.2 percentage points for males within the projection horizon. Compared to the participation rates projected in the previous projection round (2006), the recent outcomes result in lower levels. If the total participation rate for the age cohort 15-64 increased previously from 76.1% in 2010 to 79.1% by 2050, it only starts from the level of 75.3% in 2010 and rises to 77.5% in 2050 in the most recent projection exercise. This difference is only due to a statistical revision in the Austrian participation rate in 2004, which lowered this rate by more than 1 percentage point and to changes in the methodology used, as most recently a weighted average is used to calculate entry/exit rates on the basis of observed entry/exit rates from the labour market in 2006. Hence, the overall labour force (aged 15 to 71) in Austria is projected to drop by almost 3% from 2007 to 2060, whereby the female labour supply is increased by 2.3% and the male labour supply decreases by 4.5% within the projection horizon. In addition, unemployment rates are expected to converge to the estimated NAIRU146 in 2009, based on the Spring 2008 economic forecasts by the European Commission (DG ECFIN147), and afterwards they are kept constant at that rate. For Austria, these assumptions imply an initial unemployment rate of 4.5% in 2007, decreasing to 4.3% until 2010 and staying at this level thereafter. Given the population projection, the unemployment rate assumptions and the labour force projection, the overall employment rate (of people age 15 to 64) in Austria is projected to increase from 71.5% in 2007 to 72.7% in 2020, and to reach 74.3% in 2060.
146 NAIRU = Non-Accelerating Inflation Rate of Unemployment. 147 DG ECFIN = Directorate General for Economy and Finance.
297
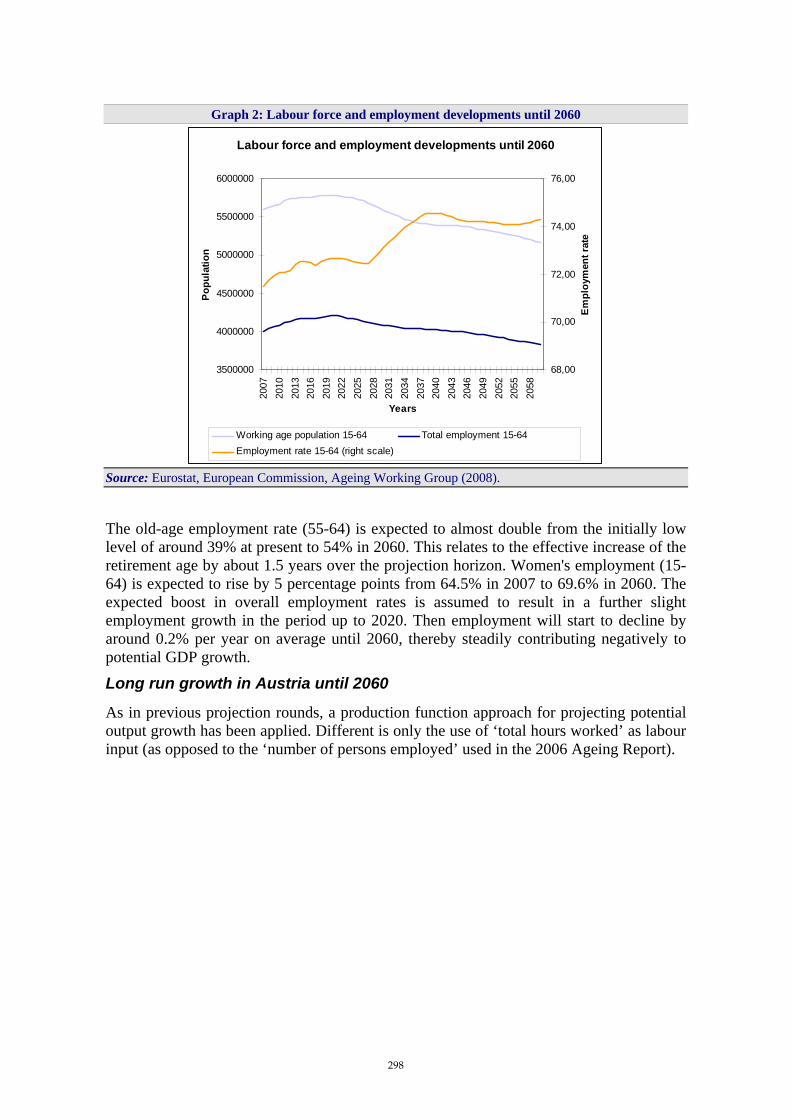
Graph 2: Labour force and employment developments until 2060
Labour force and employment developments until 2060
3500000
4000000
4500000
5000000
5500000
6000000
2007
2010
2013
2016
2019
2022
2025
2028
2031
2034
2037
2040
2043
2046
2049
2052
2055
2058
Years
Pop
ulat
ion
68,00
70,00
72,00
74,00
76,00
Em
ploy
men
t rat
e
Working age population 15-64 Total employment 15-64Employment rate 15-64 (right scale)
Source: Eurostat, European Commission, Ageing Working Group (2008).
The old-age employment rate (55-64) is expected to almost double from the initially low level of around 39% at present to 54% in 2060. This relates to the effective increase of the retirement age by about 1.5 years over the projection horizon. Women's employment (15-64) is expected to rise by 5 percentage points from 64.5% in 2007 to 69.6% in 2060. The expected boost in overall employment rates is assumed to result in a further slight employment growth in the period up to 2020. Then employment will start to decline by around 0.2% per year on average until 2060, thereby steadily contributing negatively to potential GDP growth.
Long run growth in Austria until 2060
As in previous projection rounds, a production function approach for projecting potential output growth has been applied. Different is only the use of ‘total hours worked’ as labour input (as opposed to the ‘number of persons employed’ used in the 2006 Ageing Report).
298

Graph 3: Driving factors of future GDP growth
Driving factors of future GDP growth
-0,5
0,0
0,5
1,0
1,5
2,0
2,5
2007-2010 2011-2040 2041-2060
Years
Gro
wth
rat
e
Labour productivity (growth rate, per hour)Labour input (growth rate)GDP per capita (growth rate)Real GDP (growth rate)
Source: European Commission, Ageing Working Group (2008).
The annual average potential GDP growth rate in Austria is projected to decline from 2.2% in 2007 to 1.5% in 2060. Over the whole period 2007-2060, real GDP growth rates in Austria comply with those in the EU-27 area, 1.7%. Driving factors of GDP growth are labour input and labour productivity, whereby, economic growth up to 2060 is strongly influenced by a shrinking labour supply due to the ageing population. Labour input in Austria is projected to increase up to the 2020s. Thereafter, the demographic changes, with a reduction in the working-age population, are projected to act as a drag on growth as displayed in graph 3. Henceforward, labour productivity will be the sole source of economic growth. For Austria, labour productivity growth (which is based on assumptions about total factor productivity growth and capital stock developments) is projected to remain fairly stable throughout the projection period close to 1.7%.
Baseline pension projections until 2060
Population ageing represents a major financial challenge for the Austrian public pension systems, which are predominantly PAYG based. The higher old-age dependency ratio will be reflected in a marked increase in the overall number of pensions by 50%. Overall, gross public pension expenditures in Austria are, thus, projected to rise from 12.8% of GDP in the year 2007 to a high of 14% of GDP in 2046, then a decline to 13.6% of GDP in 2060 will follow.148
148 Some pension expenditures not directly linked to pension benefits (as for rehabilitation, administrative costs, etc.) are not included in these projections. This is analogous to the 2006 projection round. These other pension expenditures make up for approximately 0.9% of GDP. “Ausgleichszulagen”, amounting to around 0.3 % of GDP, are also not contained in these projections.
299
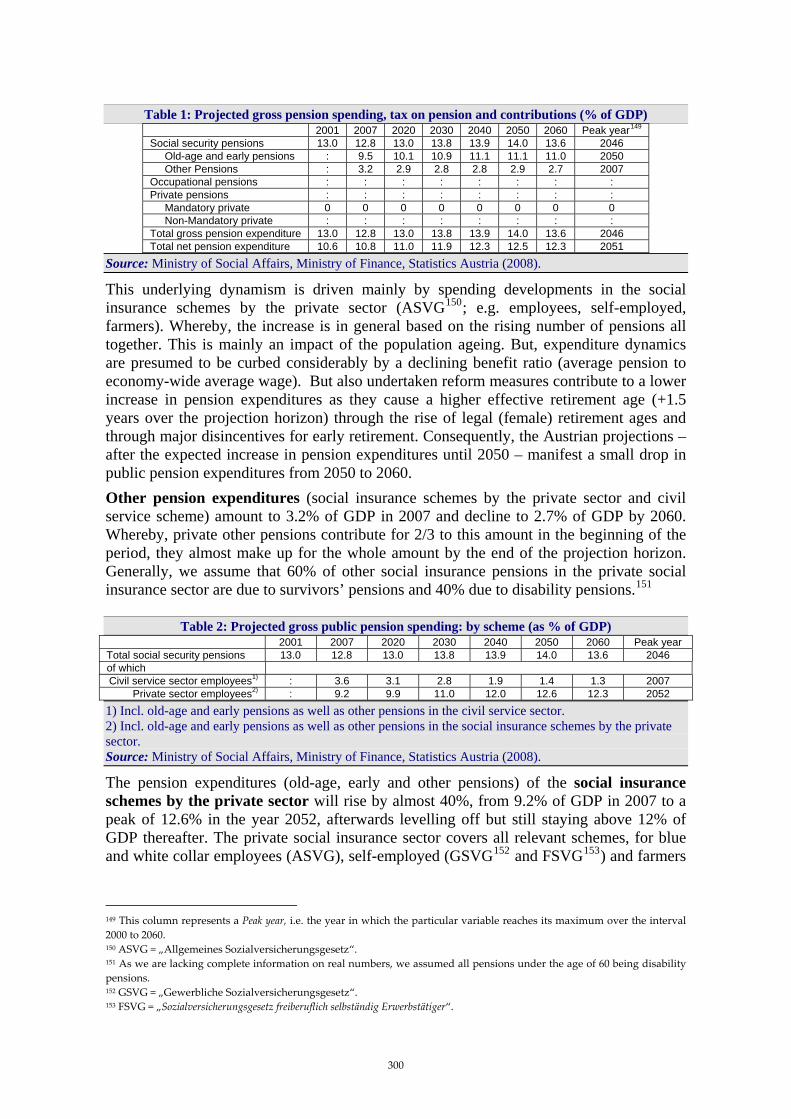
Table 1: Projected gross pension spending, tax on pension and contributions (% of GDP) 2001 2007 2020 2030 2040 2050 2060 Peak year149 Social security pensions 13.0 12.8 13.0 13.8 13.9 14.0 13.6 2046 Old-age and early pensions : 9.5 10.1 10.9 11.1 11.1 11.0 2050 Other Pensions : 3.2 2.9 2.8 2.8 2.9 2.7 2007 Occupational pensions : : : : : : : : Private pensions : : : : : : : : Mandatory private 0 0 0 0 0 0 0 0 Non-Mandatory private : : : : : : : : Total gross pension expenditure 13.0 12.8 13.0 13.8 13.9 14.0 13.6 2046 Total net pension expenditure 10.6 10.8 11.0 11.9 12.3 12.5 12.3 2051
Source: Ministry of Social Affairs, Ministry of Finance, Statistics Austria (2008).
This underlying dynamism is driven mainly by spending developments in the social insurance schemes by the private sector (ASVG150; e.g. employees, self-employed, farmers). Whereby, the increase is in general based on the rising number of pensions all together. This is mainly an impact of the population ageing. But, expenditure dynamics are presumed to be curbed considerably by a declining benefit ratio (average pension to economy-wide average wage). But also undertaken reform measures contribute to a lower increase in pension expenditures as they cause a higher effective retirement age (+1.5 years over the projection horizon) through the rise of legal (female) retirement ages and through major disincentives for early retirement. Consequently, the Austrian projections – after the expected increase in pension expenditures until 2050 – manifest a small drop in public pension expenditures from 2050 to 2060. Other pension expenditures (social insurance schemes by the private sector and civil service scheme) amount to 3.2% of GDP in 2007 and decline to 2.7% of GDP by 2060. Whereby, private other pensions contribute for 2/3 to this amount in the beginning of the period, they almost make up for the whole amount by the end of the projection horizon. Generally, we assume that 60% of other social insurance pensions in the private social insurance sector are due to survivors’ pensions and 40% due to disability pensions.151
Table 2: Projected gross public pension spending: by scheme (as % of GDP) 2001 2007 2020 2030 2040 2050 2060 Peak year
Total social security pensions 13.0 12.8 13.0 13.8 13.9 14.0 13.6 2046 of which Civil service sector employees1) : 3.6 3.1 2.8 1.9 1.4 1.3 2007
Private sector employees2) : 9.2 9.9 11.0 12.0 12.6 12.3 2052 1) Incl. old-age and early pensions as well as other pensions in the civil service sector. 2) Incl. old-age and early pensions as well as other pensions in the social insurance schemes by the private sector. Source: Ministry of Social Affairs, Ministry of Finance, Statistics Austria (2008).
The pension expenditures (old-age, early and other pensions) of the social insurance schemes by the private sector will rise by almost 40%, from 9.2% of GDP in 2007 to a peak of 12.6% in the year 2052, afterwards levelling off but still staying above 12% of GDP thereafter. The private social insurance sector covers all relevant schemes, for blue and white collar employees (ASVG), self-employed (GSVG152 and FSVG153) and farmers
149 This column represents a Peak year, i.e. the year in which the particular variable reaches its maximum over the interval 2000 to 2060. 150 ASVG = „Allgemeines Sozialversicherungsgesetz“. 151 As we are lacking complete information on real numbers, we assumed all pensions under the age of 60 being disability pensions. 152 GSVG = „Gewerbliche Sozialversicherungsgesetz“. 153 FSVG = „Sozialversicherungsgesetz freiberuflich selbständig Erwerbstätiger“.
300
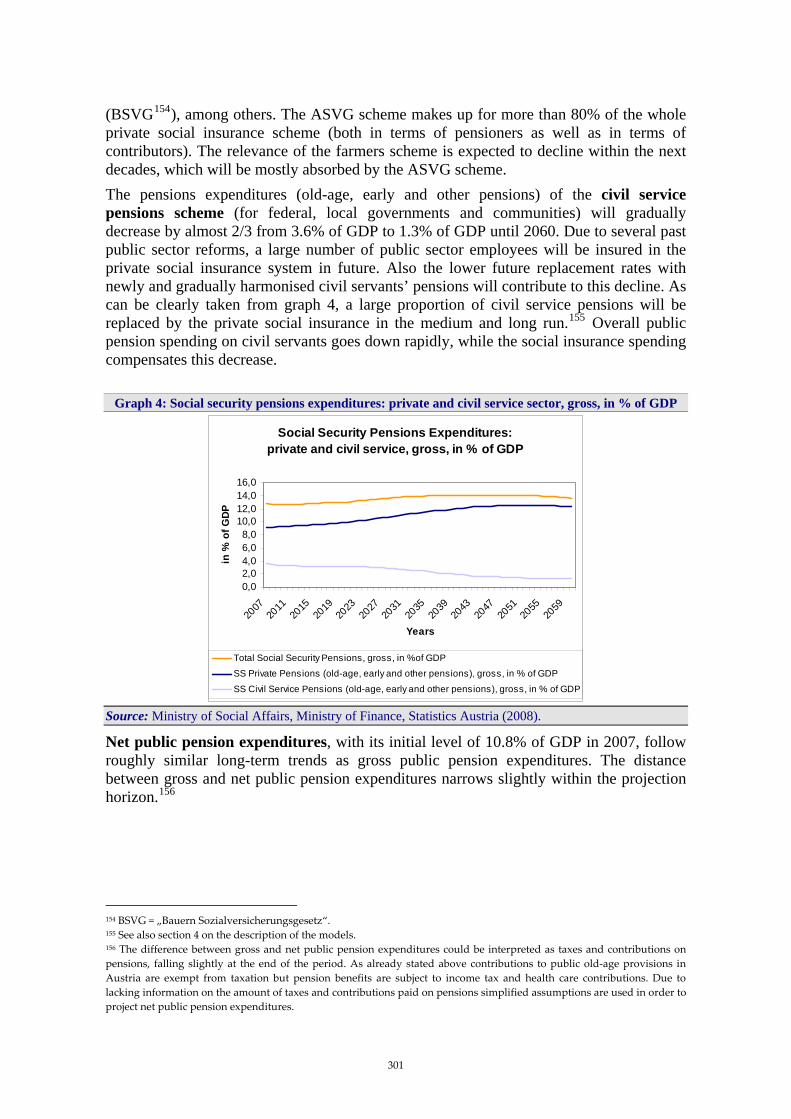
(BSVG154), among others. The ASVG scheme makes up for more than 80% of the whole private social insurance scheme (both in terms of pensioners as well as in terms of contributors). The relevance of the farmers scheme is expected to decline within the next decades, which will be mostly absorbed by the ASVG scheme. The pensions expenditures (old-age, early and other pensions) of the civil service pensions scheme (for federal, local governments and communities) will gradually decrease by almost 2/3 from 3.6% of GDP to 1.3% of GDP until 2060. Due to several past public sector reforms, a large number of public sector employees will be insured in the private social insurance system in future. Also the lower future replacement rates with newly and gradually harmonised civil servants’ pensions will contribute to this decline. As can be clearly taken from graph 4, a large proportion of civil service pensions will be replaced by the private social insurance in the medium and long run.155 Overall public pension spending on civil servants goes down rapidly, while the social insurance spending compensates this decrease.
Graph 4: Social security pensions expenditures: private and civil service sector, gross, in % of GDP
Social Security Pensions Expenditures: private and civil service, gross, in % of GDP
0,02,04,06,08,0
10,012,014,016,0
2007
2011
2015
2019
2023
2027
2031
2035
2039
2043
2047
2051
2055
2059
Years
in %
of G
DP
Total Social Security Pensions, gross, in %of GDP
SS Private Pensions (old-age, early and other pensions), gross, in % of GDP
SS Civil Service Pensions (old-age, early and other pensions), gross, in % of GDP
Source: Ministry of Social Affairs, Ministry of Finance, Statistics Austria (2008).
Net public pension expenditures, with its initial level of 10.8% of GDP in 2007, follow roughly similar long-term trends as gross public pension expenditures. The distance between gross and net public pension expenditures narrows slightly within the projection horizon.156
154 BSVG = „Bauern Sozialversicherungsgesetz“. 155 See also section 4 on the description of the models. 156 The difference between gross and net public pension expenditures could be interpreted as taxes and contributions on pensions, falling slightly at the end of the period. As already stated above contributions to public old-age provisions in Austria are exempt from taxation but pension benefits are subject to income tax and health care contributions. Due to lacking information on the amount of taxes and contributions paid on pensions simplified assumptions are used in order to project net public pension expenditures.
301
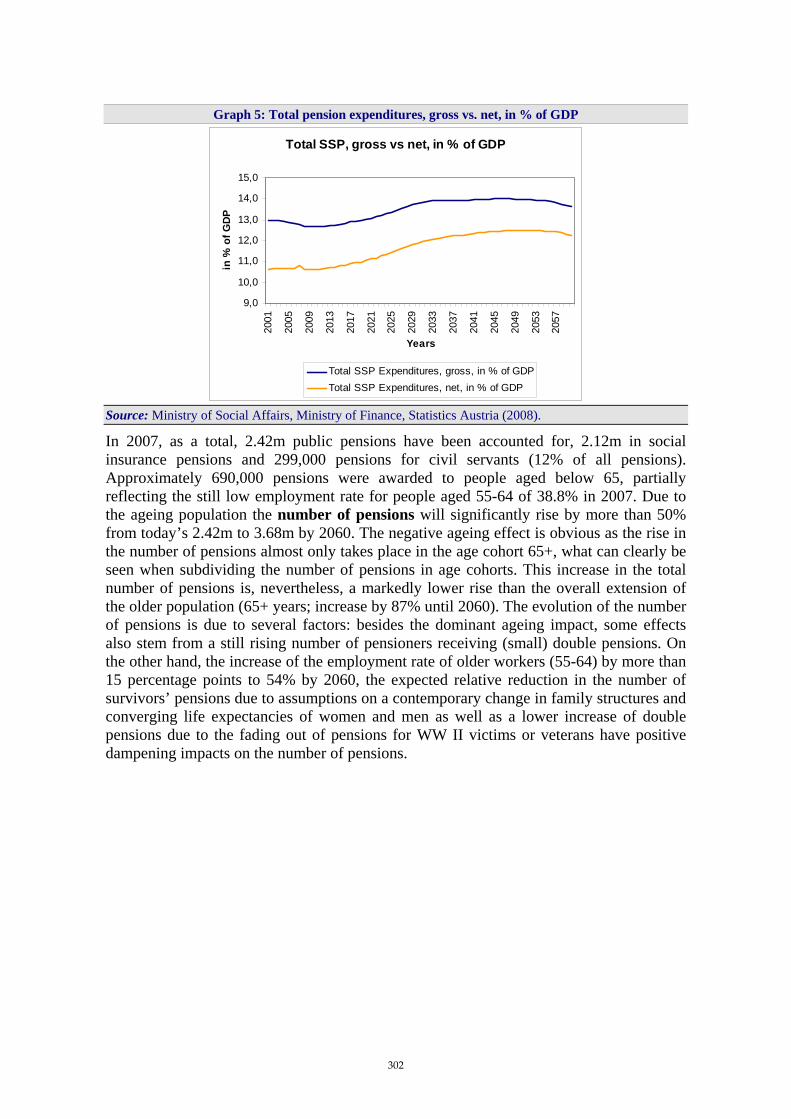
Graph 5: Total pension expenditures, gross vs. net, in % of GDP
Total SSP, gross vs net, in % of GDP
9,0
10,0
11,0
12,0
13,0
14,0
15,0
2001
2005
2009
2013
2017
2021
2025
2029
2033
2037
2041
2045
2049
2053
2057
Years
in %
of G
DP
Total SSP Expenditures, gross, in % of GDPTotal SSP Expenditures, net, in % of GDP
Source: Ministry of Social Affairs, Ministry of Finance, Statistics Austria (2008).
In 2007, as a total, 2.42m public pensions have been accounted for, 2.12m in social insurance pensions and 299,000 pensions for civil servants (12% of all pensions). Approximately 690,000 pensions were awarded to people aged below 65, partially reflecting the still low employment rate for people aged 55-64 of 38.8% in 2007. Due to the ageing population the number of pensions will significantly rise by more than 50% from today’s 2.42m to 3.68m by 2060. The negative ageing effect is obvious as the rise in the number of pensions almost only takes place in the age cohort 65+, what can clearly be seen when subdividing the number of pensions in age cohorts. This increase in the total number of pensions is, nevertheless, a markedly lower rise than the overall extension of the older population (65+ years; increase by 87% until 2060). The evolution of the number of pensions is due to several factors: besides the dominant ageing impact, some effects also stem from a still rising number of pensioners receiving (small) double pensions. On the other hand, the increase of the employment rate of older workers (55-64) by more than 15 percentage points to 54% by 2060, the expected relative reduction in the number of survivors’ pensions due to assumptions on a contemporary change in family structures and converging life expectancies of women and men as well as a lower increase of double pensions due to the fading out of pensions for WW II victims or veterans have positive dampening impacts on the number of pensions.
302

Graph 6: Number of pensions, private and civil service sector, in 1,000
Number of Pensions, private and civil service, in 1000
0500
1000150020002500300035004000
2001
2005
2009
2013
2017
2021
2025
2029
2033
2037
2041
2045
2049
2053
2057
Years
in 1
000
Number of Private Pensions (old-age, early and other), in 1000Number of Civil Service Pensions (old-age, early and other), in 1000
Source: Ministry of Social Affairs, Ministry of Finance, Statistics Austria (2008).
Whereas the increase of the number of pensions mainly accounts for the rise in pension expenditures this evolution is, to some degree, offset by a lowering benefit ratio157. The benefit ratio will decline from today’s 47% to 33% by 2060. This reflects both the shift of employees from the civil service scheme to the private social insurance scheme and the strong decrease of the benefit ratio in the civil service sector. This development also tracks the fall in the replacement rate158 by 9 percentage points over the projection horizon. This mirrors apparently introduced deductions for early retirement and longer insurance times as precondition for the maximum replacement ratio (45 years, 80% of the best 40 income years). Also, the indexation of pensions due to consumer price developments, whereby average wage in the model is adjusted according to labour productivity, explains for the decrease of average benefits in relation to average wages over time.
Table 3: Benefit ratio and gross replacement rate for social security pension sector (in %) 2001 2007 2020 2030 2040 2050 2060 Gross Replacement Rate, Social security scheme 54 49 49 46 45 44 38
Benefit Ratio, Social security scheme 48 47 44 42 40 37 33
Source: Ministry of Social Affairs, Ministry of Finance, Statistics Austria (2008).
Table 4 decomposes the increase in the ratio of pension expenditures to GDP into the effects of changes in the dependency, coverage and benefit ratio and in the employment rate. Whereas the dependency ratio measures the ageing effect, the coverage ratio reflects the take-up effect of pensions relative to the number of old people159, the employment effect measures the share of the working age population to the number of the employed and the benefit effect captures changes in the average pension relative to the output per employed person.
157 Average pension to economy-wide average wage. 158 First pension to economy-wide average wage. 159 In the Austrian case the number of pensions is used instead of the number of pensioners due to lacking information.
303
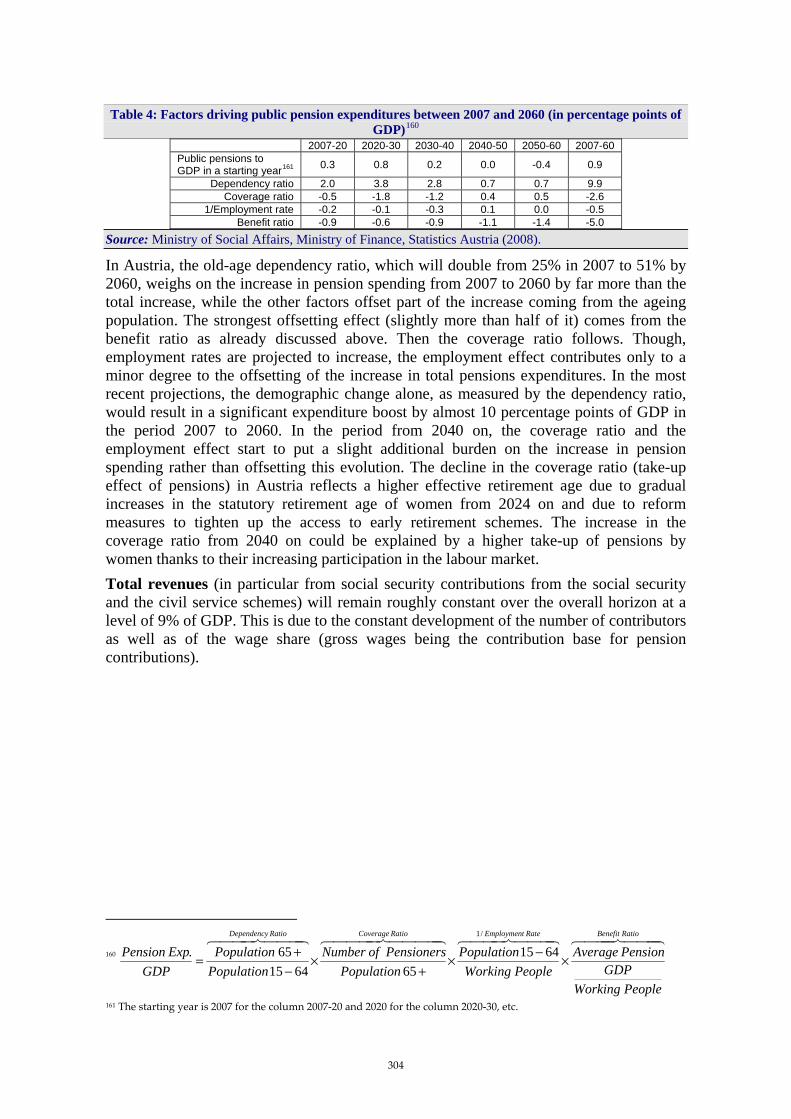
Table 4: Factors driving public pension expenditures between 2007 and 2060 (in percentage points of GDP)160
2007-20 2020-30 2030-40 2040-50 2050-60 2007-60 Public pensions to GDP in a starting year161 0.3 0.8 0.2 0.0 -0.4 0.9
Dependency ratio 2.0 3.8 2.8 0.7 0.7 9.9 Coverage ratio -0.5 -1.8 -1.2 0.4 0.5 -2.6
1/Employment rate -0.2 -0.1 -0.3 0.1 0.0 -0.5 Benefit ratio -0.9 -0.6 -0.9 -1.1 -1.4 -5.0
Source: Ministry of Social Affairs, Ministry of Finance, Statistics Austria (2008).
In Austria, the old-age dependency ratio, which will double from 25% in 2007 to 51% by 2060, weighs on the increase in pension spending from 2007 to 2060 by far more than the total increase, while the other factors offset part of the increase coming from the ageing population. The strongest offsetting effect (slightly more than half of it) comes from the benefit ratio as already discussed above. Then the coverage ratio follows. Though, employment rates are projected to increase, the employment effect contributes only to a minor degree to the offsetting of the increase in total pensions expenditures. In the most recent projections, the demographic change alone, as measured by the dependency ratio, would result in a significant expenditure boost by almost 10 percentage points of GDP in the period 2007 to 2060. In the period from 2040 on, the coverage ratio and the employment effect start to put a slight additional burden on the increase in pension spending rather than offsetting this evolution. The decline in the coverage ratio (take-up effect of pensions) in Austria reflects a higher effective retirement age due to gradual increases in the statutory retirement age of women from 2024 on and due to reform measures to tighten up the access to early retirement schemes. The increase in the coverage ratio from 2040 on could be explained by a higher take-up of pensions by women thanks to their increasing participation in the labour market. Total revenues (in particular from social security contributions from the social security and the civil service schemes) will remain roughly constant over the overall horizon at a level of 9% of GDP. This is due to the constant development of the number of contributors as well as of the wage share (gross wages being the contribution base for pension contributions).
160 444 8444 76444 8444 764444 84444 76444 8444 76 RatioBenefitRateEmploymentRatioCoverageRatioDependency
PeopleWorkingGDP
PensionAveragePeopleWorking
PopulationPopulation
PensionersofNumberPopulationPopulation
GDPExpPension ×−×
+×
−+=
/1
6415656415
65.
161 The starting year is 2007 for the column 2007-20 and 2020 for the column 2020-30, etc.
304
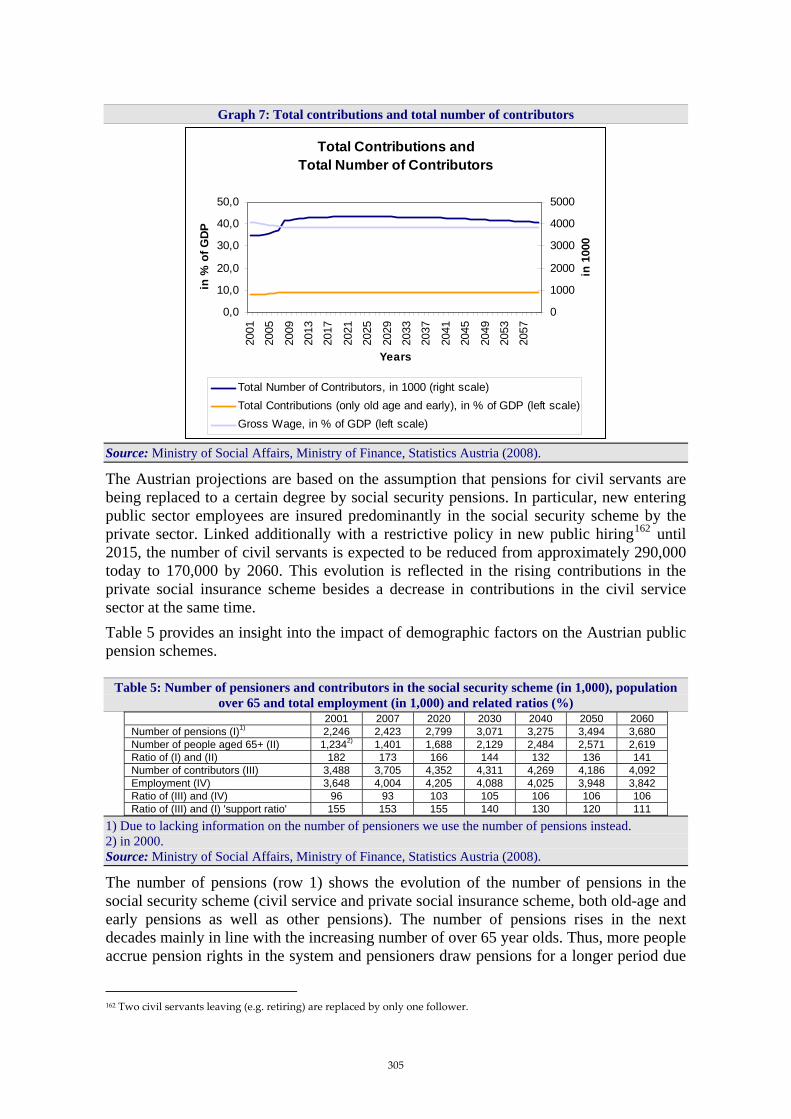
Graph 7: Total contributions and total number of contributors
Total Contributions and Total Number of Contributors
0,0
10,0
20,0
30,0
40,0
50,0
2001
2005
2009
2013
2017
2021
2025
2029
2033
2037
2041
2045
2049
2053
2057
Years
in %
of G
DP
0
1000
2000
3000
4000
5000
in 1
000
Total Number of Contributors, in 1000 (right scale)Total Contributions (only old age and early), in % of GDP (left scale)Gross Wage, in % of GDP (left scale)
Source: Ministry of Social Affairs, Ministry of Finance, Statistics Austria (2008).
The Austrian projections are based on the assumption that pensions for civil servants are being replaced to a certain degree by social security pensions. In particular, new entering public sector employees are insured predominantly in the social security scheme by the private sector. Linked additionally with a restrictive policy in new public hiring162 until 2015, the number of civil servants is expected to be reduced from approximately 290,000 today to 170,000 by 2060. This evolution is reflected in the rising contributions in the private social insurance scheme besides a decrease in contributions in the civil service sector at the same time. Table 5 provides an insight into the impact of demographic factors on the Austrian public pension schemes.
Table 5: Number of pensioners and contributors in the social security scheme (in 1,000), population over 65 and total employment (in 1,000) and related ratios (%)
2001 2007 2020 2030 2040 2050 2060 Number of pensions (I)1) 2,246 2,423 2,799 3,071 3,275 3,494 3,680 Number of people aged 65+ (II) 1,2342) 1,401 1,688 2,129 2,484 2,571 2,619 Ratio of (I) and (II) 182 173 166 144 132 136 141 Number of contributors (III) 3,488 3,705 4,352 4,311 4,269 4,186 4,092 Employment (IV) 3,648 4,004 4,205 4,088 4,025 3,948 3,842 Ratio of (III) and (IV) 96 93 103 105 106 106 106 Ratio of (III) and (I) 'support ratio' 155 153 155 140 130 120 111
1) Due to lacking information on the number of pensioners we use the number of pensions instead. 2) in 2000. Source: Ministry of Social Affairs, Ministry of Finance, Statistics Austria (2008).
The number of pensions (row 1) shows the evolution of the number of pensions in the social security scheme (civil service and private social insurance scheme, both old-age and early pensions as well as other pensions). The number of pensions rises in the next decades mainly in line with the increasing number of over 65 year olds. Thus, more people accrue pension rights in the system and pensioners draw pensions for a longer period due
162 Two civil servants leaving (e.g. retiring) are replaced by only one follower.
305

to the upsurge in life expectancy and higher coverage rate due to women and double pensions. Still, in conformity with reforms undertaken, in order to tighten the access to early retirement schemes, the ratio of pensioners to the number of people aged over 65 (row 3) declines from 182% in 2001 and 173% in 2007 to 141% in 2060. The number of contributors to the social security scheme (row 4) consists of employees being insured in the social security scheme. The number of contributors is projected to stay almost stable, but slightly plunge from 2020 on. This evolution goes in line with the slight fall of the potential working age population (15-64) within the projection horizon. The ratio of the number of contributors to employment rises from 93% in 2007 to 106% in 2060, thus, the number of contributors starts to exceed the employed from 2020 on. This fact emerges to a large extent because the number of contributors results from the number of labour force contracts and, currently, approximately 200,000 persons have more than only one engagement. The support ratio (last row), the ratio of contributors to pensioners, declines from 153% in 2007 to 111% in 2060. This is mainly the result of the increasing population aged 65+ and of the decreasing working age population (15-64). The total deficit (total contributions minus total net expenditures) in terms of GDP will rise from 1.8% of GDP in 2007 to 3.2% of GDP in 2060.
Graph 8: Deficit, contributions minus expenditures, in % of GDP
Deficit = Contributions - Expenditures, in % of GDP
-6,0-4,0-2,00,02,04,06,08,0
10,012,014,0
2001 2006 2011 2016 2021 2026 2031 2036 2041 2046 2051 2056
Years
in %
of G
DP
Total SSP Expenditures, net, in % of GDPTotal SSP Contributions (only Old Age and Early), in % of GDPDeficit (Contributions - Expenditures), in % of GDP
Source: Ministry of Social Affairs, Ministry of Finance, Statistics Austria (2008).
2.1. Sensitivity tests
The baseline projections cannot capture all the direct and indirect channels through which ageing can influence economic growth, as the projection exercise is carried out on the basis of commonly agreed assumptions in order to ensure comparability and clarity. However, given the uncertainty surrounding the assumptions underpinning long-run projections, it is necessary to carry out a number of sensitivity tests so as to quantify the responsiveness of projection results to changes in key underlying assumptions. This is why it was agreed to run a series of sensitivity analysis. Pension expenditure dynamics could be dampened by higher labour productivity growth and higher total employment rates, especially, higher employment rates of older workers. On the other hand, additional
306
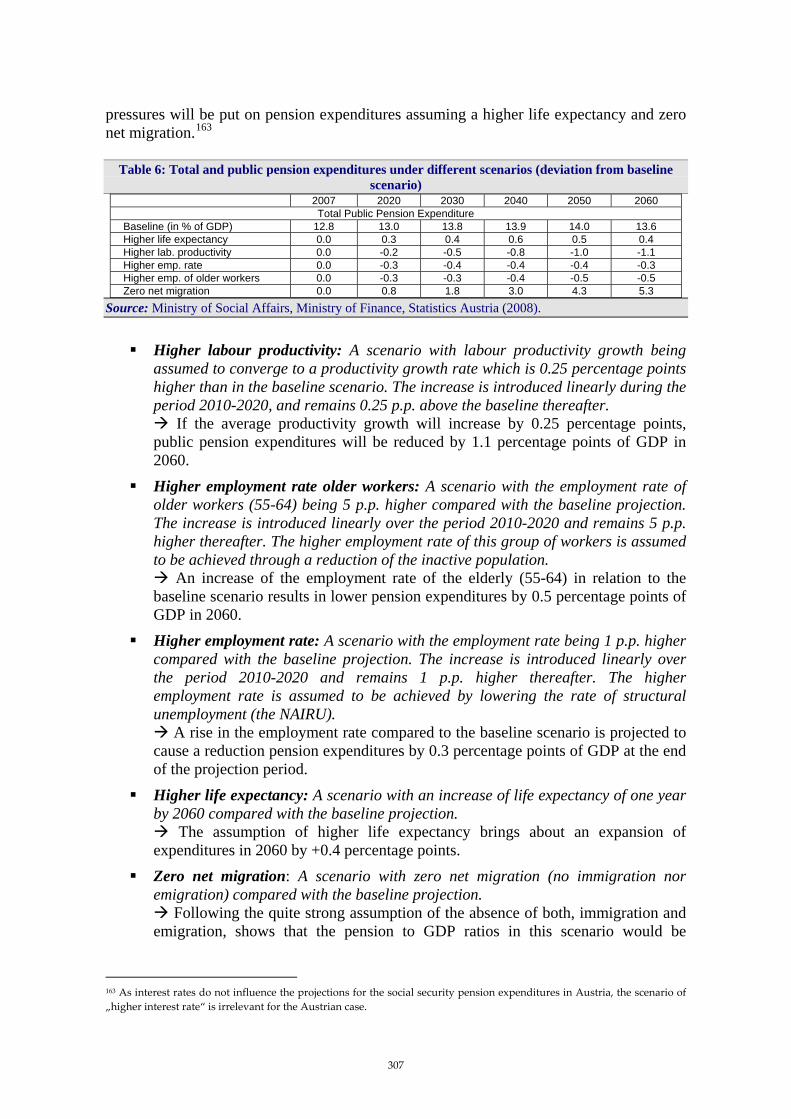
pressures will be put on pension expenditures assuming a higher life expectancy and zero net migration.163
Table 6: Total and public pension expenditures under different scenarios (deviation from baseline
scenario) 2007 2020 2030 2040 2050 2060
Total Public Pension Expenditure Baseline (in % of GDP) 12.8 13.0 13.8 13.9 14.0 13.6 Higher life expectancy 0.0 0.3 0.4 0.6 0.5 0.4 Higher lab. productivity 0.0 -0.2 -0.5 -0.8 -1.0 -1.1 Higher emp. rate 0.0 -0.3 -0.4 -0.4 -0.4 -0.3 Higher emp. of older workers 0.0 -0.3 -0.3 -0.4 -0.5 -0.5 Zero net migration 0.0 0.8 1.8 3.0 4.3 5.3
Source: Ministry of Social Affairs, Ministry of Finance, Statistics Austria (2008).
Higher labour productivity: A scenario with labour productivity growth being assumed to converge to a productivity growth rate which is 0.25 percentage points higher than in the baseline scenario. The increase is introduced linearly during the period 2010-2020, and remains 0.25 p.p. above the baseline thereafter.
If the average productivity growth will increase by 0.25 percentage points, public pension expenditures will be reduced by 1.1 percentage points of GDP in 2060.
Higher employment rate older workers: A scenario with the employment rate of older workers (55-64) being 5 p.p. higher compared with the baseline projection. The increase is introduced linearly over the period 2010-2020 and remains 5 p.p. higher thereafter. The higher employment rate of this group of workers is assumed to be achieved through a reduction of the inactive population.
An increase of the employment rate of the elderly (55-64) in relation to the baseline scenario results in lower pension expenditures by 0.5 percentage points of GDP in 2060.
Higher employment rate: A scenario with the employment rate being 1 p.p. higher compared with the baseline projection. The increase is introduced linearly over the period 2010-2020 and remains 1 p.p. higher thereafter. The higher employment rate is assumed to be achieved by lowering the rate of structural unemployment (the NAIRU).
A rise in the employment rate compared to the baseline scenario is projected to cause a reduction pension expenditures by 0.3 percentage points of GDP at the end of the projection period.
Higher life expectancy: A scenario with an increase of life expectancy of one year by 2060 compared with the baseline projection.
The assumption of higher life expectancy brings about an expansion of expenditures in 2060 by +0.4 percentage points.
Zero net migration: A scenario with zero net migration (no immigration nor emigration) compared with the baseline projection.
Following the quite strong assumption of the absence of both, immigration and emigration, shows that the pension to GDP ratios in this scenario would be
163 As interest rates do not influence the projections for the social security pension expenditures in Austria, the scenario of „higher interest rate“ is irrelevant for the Austrian case.
307
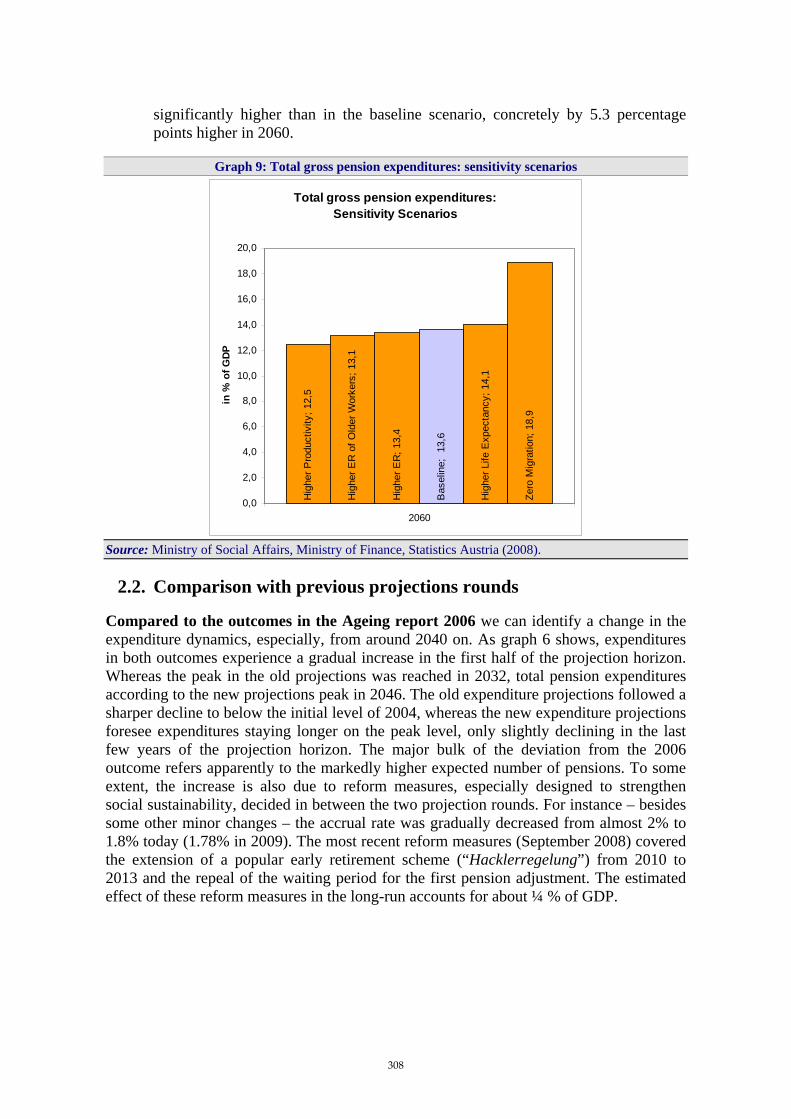
significantly higher than in the baseline scenario, concretely by 5.3 percentage points higher in 2060.
Graph 9: Total gross pension expenditures: sensitivity scenarios
Total gross pension expenditures: Sensitivity Scenarios
Hig
her P
rodu
ctiv
ity; 1
2,5
Hig
her E
R o
f Old
er W
orke
rs; 1
3,1
Hig
her E
R; 1
3,4
Bas
elin
e; 1
3,6
Hig
her L
ife E
xpec
tanc
y; 1
4,1
Zero
Mig
ratio
n; 1
8,9
0,0
2,0
4,0
6,0
8,0
10,0
12,0
14,0
16,0
18,0
20,0
2060
in %
of G
DP
Source: Ministry of Social Affairs, Ministry of Finance, Statistics Austria (2008).
2.2. Comparison with previous projections rounds
Compared to the outcomes in the Ageing report 2006 we can identify a change in the expenditure dynamics, especially, from around 2040 on. As graph 6 shows, expenditures in both outcomes experience a gradual increase in the first half of the projection horizon. Whereas the peak in the old projections was reached in 2032, total pension expenditures according to the new projections peak in 2046. The old expenditure projections followed a sharper decline to below the initial level of 2004, whereas the new expenditure projections foresee expenditures staying longer on the peak level, only slightly declining in the last few years of the projection horizon. The major bulk of the deviation from the 2006 outcome refers apparently to the markedly higher expected number of pensions. To some extent, the increase is also due to reform measures, especially designed to strengthen social sustainability, decided in between the two projection rounds. For instance – besides some other minor changes – the accrual rate was gradually decreased from almost 2% to 1.8% today (1.78% in 2009). The most recent reform measures (September 2008) covered the extension of a popular early retirement scheme (“Hacklerregelung”) from 2010 to 2013 and the repeal of the waiting period for the first pension adjustment. The estimated effect of these reform measures in the long-run accounts for about ¼ % of GDP.
308

Graph 10: Comparison of old and new total pension expenditures, in % of GDP
Comparison of old and new Total Pension Expenditures, in % of GDP
11,011,512,012,513,013,514,014,515,0
2004
2008
2012
2016
2020
2024
2028
2032
2036
2040
2044
2048
2052
2056
2060
Years
in %
of G
DP
NEW Total Pension Expenditures, gross, in % of GDPOLD Total Pension Expenditures, gross, in % of GDP
Source: Ministry of Social Affairs, Ministry of Finance, Statistics Austria (2008).
Comparing the recent projection results with those of the previous two projection rounds show the following differences (see table 7). In the 2001-projections as well as in the current projection round total pension expenditures expressed in terms of GDP increase within the projection horizon. In the last projections (2006) a decline of total pension expenditures in % of GDP was projected. The positive effects stemming from ambitious pension reform measures at the beginning of 2000 were partly offset by higher expected number of pensions, lower employment rate projections compared to the previous round as well as recent reform measures. Table 7: Decomposition of the change (in %) in public pension expenditure to GDP between 2007 and
2050 under the 2001, 2006 and 2009 projection exercises % Change
2007- 2050 Dependence
ratio Coverage
ratio Employment
rate Benefit ratio
Pension/GDP – 2001164 2.4 10.5 -3.0 -2.2 -2.9 Pension/GDP – 2006165 -1.0 11.3 -5.8 -1.3 -4.3 Pension/GDP - 2009166 1.3 9.3 -3.1 -0.5 -3.8
Source: Ministry of Social Affairs, Ministry of Finance, Statistics Austria (2008).
As can be seen in table 7 the greatest pressure on total pension expenditures comes from the ageing population, whereby the effects stemming from the coverage ratio, the employment rates and the benefit ratio partly (or fully, as in the case of the 2006 projections) offset these negative effects on public pension expenditures.
164 Decomposition period 2001-2050. 165 Decomposition period 2004-2050. 166 Decomposition period 2007-2050.
309
Poland (Report prepared by Joanna Stachura, Agnieszka Chłoń-Domińczak and Paweł Strzelecki)
1. Overview of the pension system
1.1. Description
In Poland, pensions are paid out from two insurance systems: general and for farmers. Security provision systems for military forces, police and similar services as well as judges and prosecutors function separately. Each of those systems operates under separate rules and concerns another group of people. The largest, general pension system, pays out old-age, survivor and disability pensions for nearly 79.4% of all pensioners. Benefits for 16.6% of pensioners are paid out from the agricultural system. Other pensioners receive their benefits from the security provision systems. The systems are based on different rules for paying contributions and receiving benefits. The benefit indexation rules, however, are the same. General Pension System Social insurance in Poland includes insurance against old age, illness, maternity, inability to work, loss of the person who supported the family, work injury and professional diseases. The general social insurance system in 2007 covered 14 million people. From this system benefits have been paid out to 7.3 million old-age, survivor and disability pensioners. The reform that was launched on January 1, 1999, has fundamentally changed the system’s construction. The basic reason for the reconstruction of the system was to adjust it to demographic changes and to accelerate the economic growth of the country. The pension system should be financially stable and encourage the participants to continue their professional activity. The reform is to contribute to a higher level of savings in the economy. The system, which was based on the defined benefit rule, was transformed into a system based on a defined contribution. The mandatory part of the system was divided into two parts: non-financial and financial. The former is managed by a public institution – Social Insurance Institution (ZUS), the latter – by private institutions, i.e. general pension fund societies. For each insured person in this system two accounts are kept. The first account (non-financial) is kept by ZUS, the other is kept in an open pension fund. The retirement age applicable so far has been preserved: 60 years of age for women and 65 for men. There is no option foreseen for the persons covered with the new system to retire earlier, which should lead to a rise in the effective retirement age. In 2007, the average actual retirement age was 57.1 years (59.7 for men and 55.8 years for women). Old-age pension contribution amounts to 19.52 per cent of gross wage and are payable in equal parts by the employer and by the employee. In the event of a member of an open pension fund, part of the contribution in the amount of 7.3 per cent of the wage is transferred by ZUS to the fund of member’s choice. The remaining part, i.e. 12.22 per cent stays in ZUS. The mandatory system should be supplemented with voluntary saving in the framework of Employee Pension Plans and Individual Retirement Accounts.
310

The contributions registered on the individual account of the insured with ZUS are indexed. The indexation can be considered as a sort of rate of return on pension savings. Indexation factor is equal to consumer price index increased by the real growth of the contribution revenue, measured on contribution due. Indexation cannot be lower than the Consumer Price Index. The funds transferred to the Open Pension Funds (OFE) are converted into settlement units. Their value depends on investment performance. Rules of the new pension system apply to people born in 1949 or after. People under 30 (born in 1969 and after) at the time of the reform must also participate in the finanicial part; people aged 30-50 (born between 1949 and 1968) could choose such option. Pension formula in the non-financial defined contribution (NDC) part is as follows:
(unisex) retirement of age in the personsfor expectancy life Average capital initial indexed theand onscontributipension indexed and collected of Sum=pension
In 2008, the new regulation on annuity payments (the law on funded pensions) was adopted by the Parliament. The law regulates the rules regarding payments of pensions from the financial part. The law envisages two types of annuity payments: – temporary annuity pension, paid by the OFE for pensioners (women) retiring between
age 60 and 65; – lifetime annuity pension, paid by newly established annuity funds and annuity
companies. Temporary annuity pension will be calculated following the same pension formula as in the NDC system as well as indexed according to the same rules. Lifetime annuity pension will be calculated as single annuity, using unisex life tables for calculating benefits. Special compensating mechanism is envisaged to compensate differences in the structure of client portfolio between annuity companies. Lifetime annuities will be increased by 90% of return from annuity fund. Farmers’ Pension System Since 1977, farmers and their families are subject to compulsory social insurance. Until 1991 that system was managed by ZUS, and since 1991 – by the new established institution: Agricultural Social Insurance Fund (Kasa Rolniczego Ubezpieczenia Społecznego – KRUS). At the end of 2007, there were 1.6 million people subject to insurance, while old-age, survivor or disability pension benefits were received by 1.5 million beneficiaries. Pension insurance for farmers is financed from the Pension Fund. The contribution for old-age, disability and survivor pension insurance is payable quarterly and amounts to 30% of monthly minimum old-age pension. The proceeds from contributions for old-age and disability pension insurance cover only 6% of the expenses for the old-age and disability pension insurance. An insured farmer is entitled to a farmer’s old-age pension upon meeting the following conditions:
• he/she attained retirement age (60 years for a woman, 65 years for a man), • he/she was subject to the old-age and disability pension insurance for at least 25
years.
311

A farmer’s old-age pension is calculated in relation to the amount of minimum old-age pension and consists of a contribution part and a supplementary party. The contribution part depends on how long the farmer was subject to insurance and it is determined by an assumption of 1% of the minimum old-age pension for each year of being subject to old-age and disability pension insurance. This part of the farmer’s old-age pension is paid out regardless of cessation of agricultural activities, i.e. transfer of the farm. The supplementary part equal between 95% and 85% of the minimum old-age pension and decreases with the period of insurance. The supplementary part of the benefit is payable after the transfer of the farm. In the current projection there is an assumption in line with "no policy change" assumption used in the whole projection. The constant share of employment in agriculture in total employment in each age and sex group is assumed. The reference year is 2007. Security Provision Systems Security provision systems are entirely financed by the state budget. They include benefits for the police, army, fire-fighters, officers of the Government Protection Bureau, Internal Security Agency, Foreign Intelligence Agency, Polish Border Guard, prison guards, judges and prosecutors. In comparison with the general system, it has two distinguishable features: – the acquisition of retirement rights depends on the work service period – one can retire
as soon as after 15 years of service, which means that those systems have relatively the youngest retirees;
– the amount of benefit is determined in the basis of the amount of final salary or wages, so in a different manner than in the general system.
In 2007 a total of 362 thousand old-age and disability pension benefits is paid out from this system (which was about 4.7 per cent of all beneficiaries).
1.2. Recent reforms of the pension system
1.2.1. Prolonging the possibility to obtain entitlements to the early retirement for people born between 1949-1968 till the end of 2008
According to the previous assumptions, the entitlement to the early retirement under the old retirement pension system was granted to people meeting the conditions and was to be kept until the end of 2006, after that date the system was to be applicable to people working in special conditions or in a job of a specific nature to be defined anew. However, the date was postponed twice. First, before the parliamentary elections in 2005 it was postponed until the end of 2007, and then before another parliamentary elections in 2007 it was postponed for one more year until the end of 2008. Under present law:
• people employed in special conditions or in a job of a specific nature that worked in the above mentioned conditions for at least 15 years and whose overall length of insurance is 25 years, and
• women who have been insured for at least 30 years; can retire early up to five years (ten years for some occupations) before the general retirement age. In 2008 due to the implementation of the Constitutional Court judgment,
312
the group of people entitled to early retirement was extended to men born before 1949, who reached 60 years of age and can prove 35 years of contributory and non-contributory periods. This regulation applies people born before 1 January 1949, hence, people covered by the old retirement pension system.
1.2.2. Excluding miners from the new retirement pension system
In 2005 an amendment was made to the retirement pension provisions concerning miners. As a result of it miners, though still being a part of the occupational retirement pension scheme, gained a right to early retirement and to calculate their retirement pension level basing on the current formula of the defined benefits, hence, they were excluded from the new retirement pension system.
1.2.3. Changes as regards the retirement and pension benefits indexation
The 2007 faced another change of a significant parameter defining the operation of the system – indexation rules. The pension benefits indexation in the previous calendar year was dependent not only on the increased prices of consumer goods and services, but also was increased by at least 20% of real wage growth in the previous calendar year. Benefits indexation on an annual basis was also re-established. The actual increase of the average income by at least 20% is subject to negotiations within the framework of the Tripartite Committee for Social and Economic Affairs. Negotiations should take place prior to the preparation of the draft state budget law for the next calendar year (i.e. in June of preceding year).
1.2.4. Changes as regards social insurance contributions
In 2007 a change was introduced in the level of pension insurance contributions. From 1999 the level of disability and survivor pension contributions was 13% of the gross wage. The contributions were paid in equal parts by the employee and the employer. Since July 2007 the contribution rate decreased to 10% of wage (from which the employer paid 6.5%, while the employee – 3.5%). Since 1 January 2008 the contribution rate is 6% from which the employer pays 4.5%, while the employee – 1.5% of the gross wage. The following changes will be implemented from 2009: – Bridging pensions The key measure is to implement the bridging pension scheme, which replaces early retirement provision for some categories of workers. According to the regulations adopted in 1998, the possibility of early retirement is gradually eliminated from the new pension scheme. The new law on bridging pensions ensures the right to early retirement for people working in particular conditions or performing specific jobs. Bridging pensions will be temporary benefits granted for 5 years (in exceptional cases for 10 years) before the statutory retirement age. Their amount will take into account the amount of the future pension of a given person. Working conditions that give right to the bridging pensions are defined according to the expertise of medical experts specializing in assessment of work conditions for health. According to the government estimates, the total
313

number of workers covered by bridging pensions should not exceed 300 thousand people (around 2% of total workforce). The actual number of persons covered by this system will be known by the end of 2009, when register of people working in conditions applicable to bridging pensions will be established. – Payout of funded pensions The necessary step to ensure the financial stability of the pension scheme is the completion of work on the acts allowing for the payout of pensions from the new system. Act on funded pensions have been adopted in 2008. According to these regulations, annuities will be paid in the form of single life annuity using unisex life table for calculating the benefit rate. Lifetime annuities will be paid from age of 65. Women retiring before that age will receive temporary funded pensions, which together with annuity will form a deferred annuity combined with a form of scheduled withdrawal. As mentioned earlier, the temporary pension will be calculated using NDC formula and paid from assets in the OFE. When age of 65 is reached, the remaining value of OFE assets will be converted into annuity.
2. Pension expenditure projections
2.1. Extent of the coverage of the pension schemes
The following projection relates to the sum of the results from the General Pension System, Farmer’s Pension System, Security Provision Systems and projection of Pre-retirement benefits. The results for the General Pension System incorporate the projection of the “old” defined contribution system as well as mandatory parts of the “new” defined contribution schemes.
2.2. Overview of projection results
The gross pension spending for Social Security Pensions as percentage of GDP will decrease continuously from 11.6% in 2007 to 8.75% in 2060. The projected decline is due to the pension reform introduced in 1999. The share of the pension expenditures from the mandatory private pillar will increase up to 1.9% GDP in 2060. The total pension expenditures as a share of GDP are expected to fall. The most significant reduction is projected until the year 2013, from 11.56% of GDP in 2007 to 9.72% (1.84 pp) as a result of the pension system reform implemented in 1999 (mainly by reduction of inflow to early retirement and resulting increase of an effective retirement age, but also introduction of defined contribution pension system). After 2013, public pension expenditures will decrease slightly until year 2060 by another 0.97 pp of GDP. If we look at total pension expenditure, we observe drop until 2030 and than a slight increase as the funded scheme matures and volume of annuity payments increases. According to current legislation pensions are taxed in the same way as labour income with the progressive personal income tax.
314
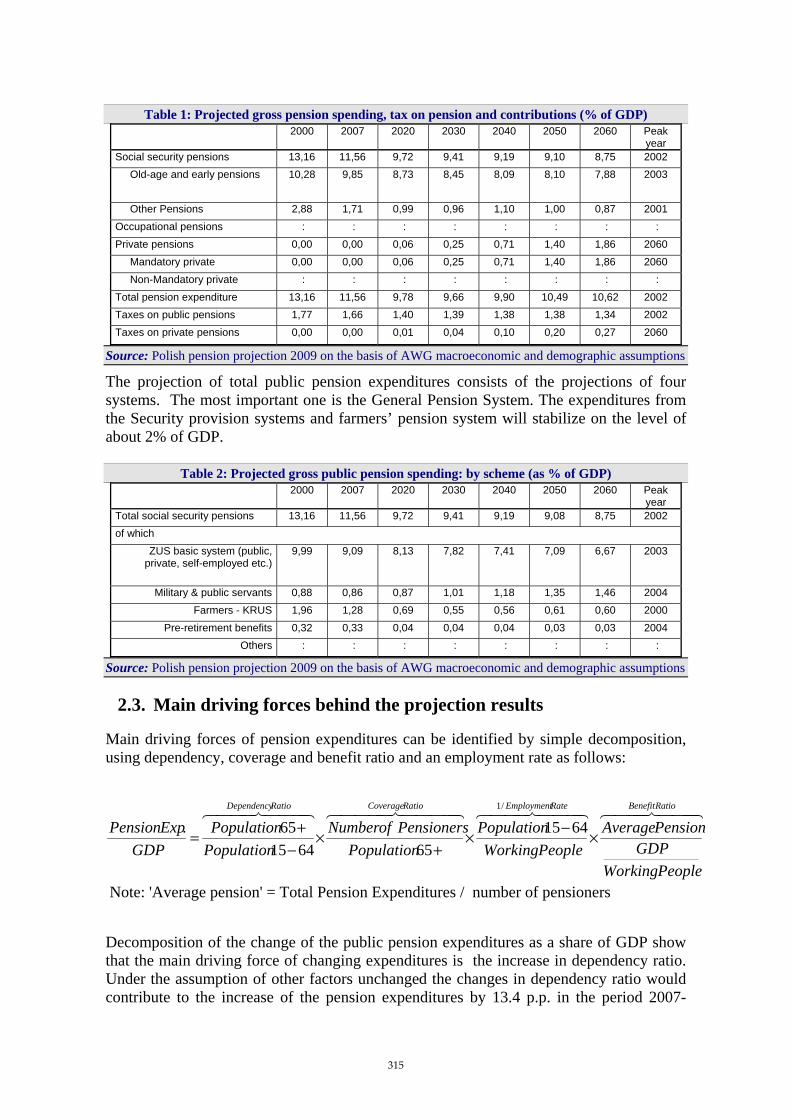
Table 1: Projected gross pension spending, tax on pension and contributions (% of GDP) 2000 2007 2020 2030 2040 2050 2060 Peak
year Social security pensions 13,16 11,56 9,72 9,41 9,19 9,10 8,75 2002 Old-age and early pensions 10,28 9,85 8,73 8,45 8,09 8,10 7,88 2003
Other Pensions 2,88 1,71 0,99 0,96 1,10 1,00 0,87 2001 Occupational pensions : : : : : : : : Private pensions 0,00 0,00 0,06 0,25 0,71 1,40 1,86 2060 Mandatory private 0,00 0,00 0,06 0,25 0,71 1,40 1,86 2060 Non-Mandatory private : : : : : : : : Total pension expenditure 13,16 11,56 9,78 9,66 9,90 10,49 10,62 2002 Taxes on public pensions 1,77 1,66 1,40 1,39 1,38 1,38 1,34 2002 Taxes on private pensions 0,00 0,00 0,01 0,04 0,10 0,20 0,27 2060
Source: Polish pension projection 2009 on the basis of AWG macroeconomic and demographic assumptions
The projection of total public pension expenditures consists of the projections of four systems. The most important one is the General Pension System. The expenditures from the Security provision systems and farmers’ pension system will stabilize on the level of about 2% of GDP.
Table 2: Projected gross public pension spending: by scheme (as % of GDP) 2000 2007 2020 2030 2040 2050 2060 Peak
year Total social security pensions 13,16 11,56 9,72 9,41 9,19 9,08 8,75 2002 of which
ZUS basic system (public, private, self-employed etc.)
9,99 9,09 8,13 7,82 7,41 7,09 6,67 2003
Military & public servants 0,88 0,86 0,87 1,01 1,18 1,35 1,46 2004 Farmers - KRUS 1,96 1,28 0,69 0,55 0,56 0,61 0,60 2000
Pre-retirement benefits 0,32 0,33 0,04 0,04 0,04 0,03 0,03 2004 Others : : : : : : : :
Source: Polish pension projection 2009 on the basis of AWG macroeconomic and demographic assumptions
2.3. Main driving forces behind the projection results
Main driving forces of pension expenditures can be identified by simple decomposition, using dependency, coverage and benefit ratio and an employment rate as follows:
444 8444 76444 8444 764444 84444 76444 8444 76 RatioBenefitRateEmploymentRatioCoverageRatioDependency
PeopleWorkingGDP
PensionAveragePeopleWorking
PopulationPopulation
PensionersofNumberPopulationPopulation
GDPExpPension ×−×
+×
−+=
/1
6415656415
65.
Note: 'Average pension' = Total Pension Expenditures / number of pensioners Decomposition of the change of the public pension expenditures as a share of GDP show that the main driving force of changing expenditures is the increase in dependency ratio. Under the assumption of other factors unchanged the changes in dependency ratio would contribute to the increase of the pension expenditures by 13.4 p.p. in the period 2007-
315

2060. The changes in coverage ratio reflect the increase in participation rate and should contribute to the decrease of public expenditures. The influence of the employment rate will be negative until 2030 as a result of increasing employment rates. Than the aggregate employment rate will be influenced by changes in age structure of working age population. According to the projection benefit ratio would be the factor that decrease spendings in the whole projection period, mainly due to the switch to the funded pillar.
Table 3: Factors167 behind the public pension expenditures between 2007 and 2060 (in percentage points of GDP)
2007-20 2020-30 2030-40 2040-50 2050-60 2007-60 Public pensions to GDP -1,8 -0,3 -0,2 -0,1 -0,3 -2,8
Dependency ratio 4,1 2,9 1,3 3,0 2,0 13,4 Coverage ratio -3,5 -1,4 -0,1 -0,7 -0,6 -6,3
1/Employment rate -0,9 -0,2 0,3 0,0 -0,1 -1,0 Benefit ratio -0,8 -1,3 -1,6 -1,9 -1,5 -7,1
Source: Polish pension projection 2009 on the basis of AWG macroeconomic and demographic assumptions *The starting year is 2007 for the column 2007-20 and 2020 for the column 2020-30, etc.
The decreasing benefit ratio and moving some of the pension expenditures to the private mandatory scheme will lead to the decreasing replacement rate of the Social security scheme that covers all pensioners in the projection. The coverage of the supplement pensions from private mandatory schemes will gradually increase as a result of the increasing share of pensions paid from the new system. According to ISG/OECD calculation of the theoretical gross replacement rate from unfunded and funded schemes (man, 40 years of contribition period, 65 retirement age) is axpected to amount to 47.5% and 34.4% for female in 2046. The projected drop from 2007 to 2046 is 19 p.p. This is mainly caused by the change of a pension formula from DB to DC system. Moreover it is also expected that average length of work will decrease in the next years. Poland as transition economy has undergone through significant changes on the labour market situation. Prior to 1989, officially there was full employment in Poland. As a result, persons who were retiring in the past had relatively long working careers. After 1989, the labour market transition led to gradually falling participation rates. This has a postponed impact on the pension system. Namely, the new retirees, also in the nearest future, should have relatively shorter working careers, as most of their careers happened after 1990. Those who retire currently, started their working careers around 1970, i.e. they have worked around 20 years with higher participation and probability of employment. Additionally, the cohorts who currently retire, started their working careers relatively early. Currently, the average age of entering the workforce in Poland is higher, which is a trend observed also in other European economies. This means potentially shorter working careers from the perspective of pension system. Overall, in the next years we can expect that new retirees will have shorter working careers, this should reverse after 2020, when assumed higher participation rates on the labour market will affect those cohorts, who will be retiring. This phenomenon can be seen, among others, by looking at the number of insured persons relative to total
167 Decomposition base on ceteris paribus analysis. The values show the results increase/decrease of pension expenditures as a % of GDP if single factor would change the value and the rest would stay on the base year levels.
316
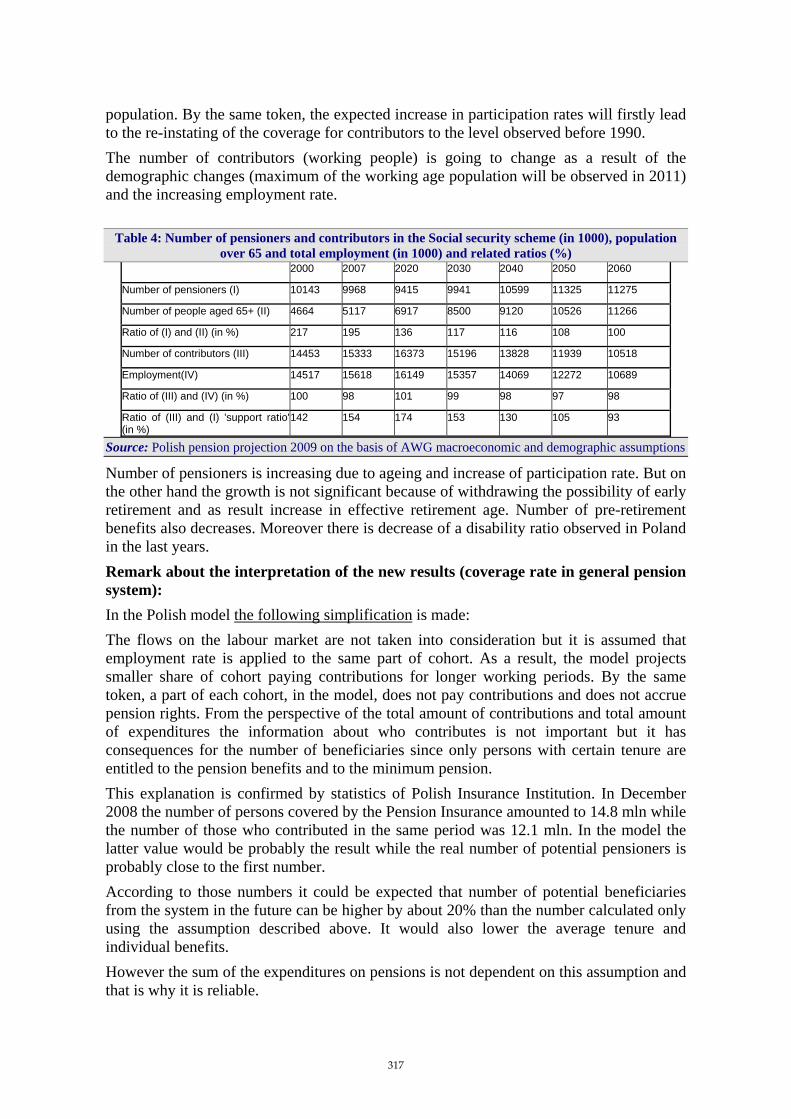
population. By the same token, the expected increase in participation rates will firstly lead to the re-instating of the coverage for contributors to the level observed before 1990. The number of contributors (working people) is going to change as a result of the demographic changes (maximum of the working age population will be observed in 2011) and the increasing employment rate.
Table 4: Number of pensioners and contributors in the Social security scheme (in 1000), population over 65 and total employment (in 1000) and related ratios (%)
2000 2007 2020 2030 2040 2050 2060
Number of pensioners (I) 10143 9968 9415 9941 10599 11325 11275
Number of people aged 65+ (II) 4664 5117 6917 8500 9120 10526 11266
Ratio of (I) and (II) (in %) 217 195 136 117 116 108 100
Number of contributors (III) 14453 15333 16373 15196 13828 11939 10518
Employment(IV) 14517 15618 16149 15357 14069 12272 10689
Ratio of (III) and (IV) (in %) 100 98 101 99 98 97 98
Ratio of (III) and (I) 'support ratio'(in %)
142 154 174 153 130 105 93
Source: Polish pension projection 2009 on the basis of AWG macroeconomic and demographic assumptions
Number of pensioners is increasing due to ageing and increase of participation rate. But on the other hand the growth is not significant because of withdrawing the possibility of early retirement and as result increase in effective retirement age. Number of pre-retirement benefits also decreases. Moreover there is decrease of a disability ratio observed in Poland in the last years. Remark about the interpretation of the new results (coverage rate in general pension system): In the Polish model the following simplification is made: The flows on the labour market are not taken into consideration but it is assumed that employment rate is applied to the same part of cohort. As a result, the model projects smaller share of cohort paying contributions for longer working periods. By the same token, a part of each cohort, in the model, does not pay contributions and does not accrue pension rights. From the perspective of the total amount of contributions and total amount of expenditures the information about who contributes is not important but it has consequences for the number of beneficiaries since only persons with certain tenure are entitled to the pension benefits and to the minimum pension. This explanation is confirmed by statistics of Polish Insurance Institution. In December 2008 the number of persons covered by the Pension Insurance amounted to 14.8 mln while the number of those who contributed in the same period was 12.1 mln. In the model the latter value would be probably the result while the real number of potential pensioners is probably close to the first number. According to those numbers it could be expected that number of potential beneficiaries from the system in the future can be higher by about 20% than the number calculated only using the assumption described above. It would also lower the average tenure and individual benefits. However the sum of the expenditures on pensions is not dependent on this assumption and that is why it is reliable.
317
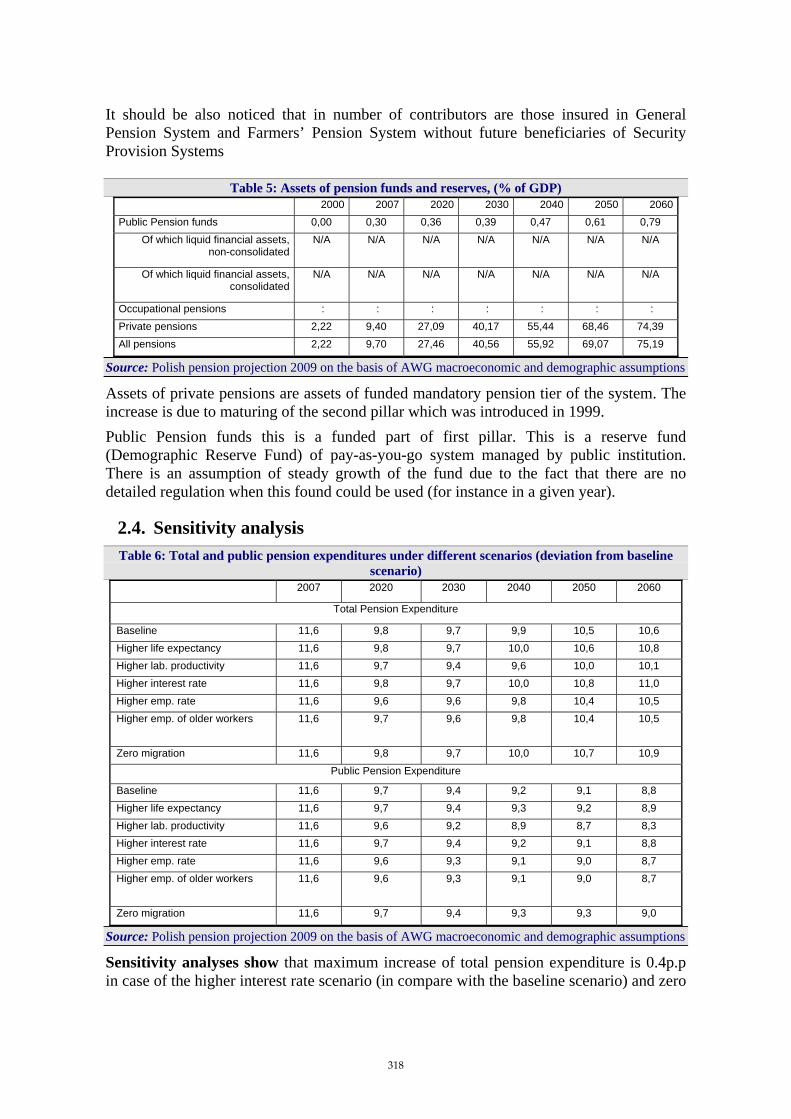
It should be also noticed that in number of contributors are those insured in General Pension System and Farmers’ Pension System without future beneficiaries of Security Provision Systems
Table 5: Assets of pension funds and reserves, (% of GDP) 2000 2007 2020 2030 2040 2050 2060Public Pension funds 0,00 0,30 0,36 0,39 0,47 0,61 0,79
Of which liquid financial assets, non-consolidated
N/A N/A N/A N/A N/A N/A N/A
Of which liquid financial assets, consolidated
N/A N/A N/A N/A N/A N/A N/A
Occupational pensions : : : : : : : Private pensions 2,22 9,40 27,09 40,17 55,44 68,46 74,39 All pensions 2,22 9,70 27,46 40,56 55,92 69,07 75,19
Source: Polish pension projection 2009 on the basis of AWG macroeconomic and demographic assumptions
Assets of private pensions are assets of funded mandatory pension tier of the system. The increase is due to maturing of the second pillar which was introduced in 1999. Public Pension funds this is a funded part of first pillar. This is a reserve fund (Demographic Reserve Fund) of pay-as-you-go system managed by public institution. There is an assumption of steady growth of the fund due to the fact that there are no detailed regulation when this found could be used (for instance in a given year).
2.4. Sensitivity analysis Table 6: Total and public pension expenditures under different scenarios (deviation from baseline
scenario) 2007 2020 2030 2040 2050 2060
Total Pension Expenditure
Baseline 11,6 9,8 9,7 9,9 10,5 10,6 Higher life expectancy 11,6 9,8 9,7 10,0 10,6 10,8 Higher lab. productivity 11,6 9,7 9,4 9,6 10,0 10,1 Higher interest rate 11,6 9,8 9,7 10,0 10,8 11,0 Higher emp. rate 11,6 9,6 9,6 9,8 10,4 10,5 Higher emp. of older workers 11,6 9,7 9,6 9,8 10,4 10,5
Zero migration 11,6 9,8 9,7 10,0 10,7 10,9 Public Pension Expenditure
Baseline 11,6 9,7 9,4 9,2 9,1 8,8 Higher life expectancy 11,6 9,7 9,4 9,3 9,2 8,9 Higher lab. productivity 11,6 9,6 9,2 8,9 8,7 8,3 Higher interest rate 11,6 9,7 9,4 9,2 9,1 8,8 Higher emp. rate 11,6 9,6 9,3 9,1 9,0 8,7 Higher emp. of older workers 11,6 9,6 9,3 9,1 9,0 8,7
Zero migration 11,6 9,7 9,4 9,3 9,3 9,0
Source: Polish pension projection 2009 on the basis of AWG macroeconomic and demographic assumptions
Sensitivity analyses show that maximum increase of total pension expenditure is 0.4p.p in case of the higher interest rate scenario (in compare with the baseline scenario) and zero
318
migration on public pension expenditure. The lowest influence is in the higher employment rate scenario. Higher life expectancy is expected to be more or less neutral in DC system but only in old-age general pension system. AWG projections cover other benefits, where actuarial formula is not introduced. Moreover a principle was introduced, in accordance to which, persons receiving disability pension, who reached the retirement age, would start to receive the old-age pension from the Social Insurance Institution (ZUS) and the funded part of the system. If the disability pension was higher than the old-age pension, the difference would be covered by the Social Insurance Fund. Another aspect which should be also taken into account is that in this scenario the probability of survival until the retirement age is bigger and as an effect there will be more beneficiaries. Higher labour productivity gives lower expenditures as a result of GDP assumptions in this scenario. Higher benefits will be paid but due to pension indexation rules there will be lower growth in expenditures than in GDP. Higher interest rate influences on expenditures only in the funded pillar. It should be mention here that in this scenario positive effect (not visible in a table) is also noticed in the first pillar as an increase of reserve fund’s level. Higher employment rate as well as higher employment of older workers has small impact on expenditure decrease. The growth of GDP and the increase of expenditures (due to higher benefits) stay almost in the same proportion as in the baseline scenario. Zero migration shows the most significant effect on public pension expenditures, which is caused by lower GDP in compare with baseline assumptions and increase of expenditure because of higher number of beneficiaries.
2.5. Comparison with the 2006 projections Poland took part in previous round of projections in 2006. In comparison the 2006 exercise the projected decrease of the public expenditure to GDP is smaller but it is mainly due to the change of the period in comparison to the 2006 exercise. Polish system experienced the maximum of the in 2002 as a result of the reform introduced in 1999 (see Table 1). Subsequently the expenditures have continuously decreased and further decrease in the future in 2007 was projected to be lower than those in the year 2004. The main driving forces that influence expenditures have not changed much in comparison to previous projection with the exception of employment rate which in 2007 is expected to increase less than in the year 2004. The difference is due to the better labour market situation in 2007 in comparison to 2004.
319

Table 7: Decomposition168 of the change (in p.p.) in public pension expenditure to GDP between 2007 and 2050 under the 2001, 2006 and 2009 projection exercises
% Change 2007- 2050
Dependency ratio
Coverage ratio
Employment rate
Benefit ratio Interraction effect
Pension/GDP - 2001
Pension/GDP - 2006 -5.1 15.9 -3.8 -2.4 -6.8 -8.0
Pension/GDP - 2009 -2.5 16.1 -4.2 -1.3 -4.9 -8.2
Source: Polish pension projection 2009 and 2006 on the basis of AWG macroeconomic and demographic assumptions
168 Decomposition base on ceteris paribus analysis. The values show the results increase/decrease of pension expenditures as a % of GDP if single factor would change the value and the rest would stay on the base year levels.
320
Portugal (Report prepared by Vanda Geraldes da Cunha, João Ferreira, Sofia Frederico, Manuela Paixão and Ariana Paulo)
1. Overview of the pension system
The Portuguese public social security system incorporates two distinct schemes: one that covers private sector workers and public sector employees registered since January 2006 (the general regime of social security subsystem) and another one that covers public sector employees who have started working to the public sector until 2005 (the Caixa Geral de Aposentações subsystem). In 2007, the general regime of social security covered more than 3.6 million workers and about 2.5 million pensions. The Caixa Geral de Aposentações (CGA) covered 675 thousand contributors and 534 thousand pensions at the end of 2007. As it is a closed system since January 2006, the number of contributors is decreasing continuously (until the 2040’s) and the pensions trend is expected to increase by the early 2030’s and then will decrease as well. The public social security pension system is basically a defined benefit (DB) system, working on a pay-as-you-go (PAYG) financing basis. Even though the system is run on a PAYG basis, a share of the general regime of Social Security contributions is annually transferred to the Social Security Trust Fund (FEFSS). In 2007, the fund assets represented 4.5% of GDP. In the case of CGA, the gap between pension expenditures and contributions is financed by State transfers. Private pension schemes represent a smaller share of Portuguese pension schemes, but are expected to increase in the future. In 2007, the overall occupational pension schemes which covers the banking sector collective agreement and some other agreements in which defined benefits are substitutive of the social security benefits as well as other DB and DC pension schemes complementary to the State benefits, accounted to near 200 thousand contributors and slightly more than 100 thousand pensioners. Total private pension funds assets represented 16,5% of GDP by end of 2007, with occupational funds accounting for 13,3% of GDP. This exercise covers the public pension and private occupational systems that will be described in the following sections.
1.1. Public pension systems
Pension benefit formula Under the general contributory regime of social security, workers become eligible for an old age pension once they reach 65 years-old, having contributed for at least 15 years. In the case of disability, the qualifying period was recently differentiated: 5 years in the case of relative disability and 3 years in the case of total incapacity.169
169 Relative incapacity corresponds to situations where the person is permanently disabled to do his/her former profession and cannot get more than one third of the respective earnings, while total incapacity applies when there is a permanent and definitive incapacity to perform any profession or work.
321
Regarding to CGA, the rules have been converging to the ones of social security general regime: to public sector employees hired since September 1993 the same conditions apply; to other public sector employees, legal retirement age is gradually increasing from 60 years until 2005 to 65 years by 2015 (6 months each year) and the qualifying period is also converging to 15 years by 2015. Old age pensions are calculated according to the following formula:
P = SF * GAR * RE
where P represents the value of the monthly pension (14 months per year), SF the sustainability factor, GAR the pension global accrual rate and RE the reference earning.
The sustainability factor is applied to all new pensions required since the beginning of 2008 and is calculated as:
SF t = LE 2006 / LE t-1
where LE is the average life expectancy at the age of 65170 and t is the year when the pension is required.
The pension global accrual rate is set according to the number years of earnings registration and the level of wages declared and the annual accrual rate varies between 2% and 2.3%. The reference earning considers the individual whole contributory career, according to the new rules. However, in the past, only the best 10 out of the last 15 years where considered, in the case of social security general regime, and only the last month earnings, in the case of CGA. Therefore, it is in force a transitory formula that accounts proportionately the length of service before and after the pension reform for both subsystems. Minimum pensions are guaranteed for pensioners whose statutory pension (the pension that derives from the application of the pension benefit formula) falls below the legally established pension, which is differentiated by the length of the pensioner contributory career and by the respective subsystem (social security general regime or CGA). Pension projections also include minimum pensions of the social/non-contributory scheme of social security. They correspond to means-tested pensions that people aged 65 or more are eligible to receive. Indexation formulas The annual increase of pensions is defined by law as a function of the consumer inflation, the real growth of GDP and the pension amount as a reference to a social support index (IAS). The latter, in the year it was established (2006), had a similar value to the National Minimum Wage, but from then on it is annually updated according to a specific formula, independent from the annual increase set for the National Minimum Wage.
170 As defined by law, it corresponds to the average life expectancy at age 65 that is published, on an annual basis, by the national statistics institute (INE). In the projection exercise, LE refers to the weighted average of male and female life expectancy at age 65 given by the demographic scenario, being the weights the shares of male and female on total projected population aged 65.
322

Recent reforms of the pension system The most representative measures taken into account in this exercise are:
- The introduction of the sustainability factor in the pension benefit formula to new pensions required from the beginning of 2008 onwards;
- The new rule for updating pensions as a function of the consumer inflation, the real growth of GDP and the pension amount;
- The earlier transition to the new pension benefit formula which considers the whole contributive career and differentiates the accrual rate according to the reference earnings;
- The introduction of a pension ceiling to the new pensions.
All this measures were already enacted and it is admitted that they will remain in force during the whole projection horizon (no policy change scenario).
1.2. Occupational private systems
The Portuguese occupational private system is composed by three pension plan schemes: i) 1st Pillar DB plan, which represents nearly 70% of total pension fund assets but only 30% of participants, which reflects its first pillar nature as the replacement rate for these pensions are quite high when compared to the others two schemes; ii) other DB plans that encompasses all other DB plans, which are complementary of the social security system; and iii) Defined Contribution (DC) plans that although represent a very small part in terms of volume of assets it already accounts for 23% of participants and, according to the recent trends, it will play a very important role in the future. In Portugal, there is no common formula for DB benefits as it depends on the specific provisions of the pension plans. However, pensions for the DB plans are commonly final salary pension plans, in which the benefit depends on the number of years of work and the pensionable salary (typically the last salary). It is also common to have DB plans in which the benefit results from the difference between a total pension (around 80% of last salary) and a Social Security pension (sometimes instead of the real pension a frozen formula is used). Pension indexation under collective labour agreements is usually mandatory and related to the consumer price index published by the National Statistics Institute (INE). For the remaining plans, pension indexation is not guaranteed and is usually made on a discretionary basis.
2. Pension expenditure projections
2.1. Coverage
The present projections comprise the main Portuguese pension systems: the two public social security systems and the private occupational system. One of the public pension schemes is the general regime of social security subsystem, which applies to private sector workers and public employees registered since January 2006. This system is roughly divided into a general contributory scheme and a welfare scheme. The latter includes the non-contributory regime and the agricultural workers
323

regime, both being financed by the State Budget. The agricultural workers’ regime is closed to new contributors since 1986 and is expected to be extinct by around 2045. The Caixa Geral de Aposentações subsystem covers other public employees and, as already mentioned, is a closed system. However, public employees who started working since September 1993 have already been under the same pension schemes rules than the ones of private sector. The pension scheme of public employees registered before September 1993 has been in a convergence process towards the general regime of social security since 2005. Portuguese occupational pensions are now considered for the first time in the AWG projections. They encompass three types of plans: 1st Pillar DB, other DB and DC plans. The projection exercise was made separately for each pension plan as its different characteristics determines that different assumptions should be used in modelling the cash flows for the future. Private non-mandatory pension schemes have not yet been included in the country pension model because of the difficulty in gathering all the information regarding these private schemes. Although there is information regarding individual pension plans one would have to add the information of life insurance retirement products and other retirement products (PPR’s), thus projecting only the individual pension funds would be misleading. In addition, they still represent a small share of the Portuguese private pension’s schemes. The projections are in line with all the assumptions agreed within the AWG (both macroeconomic and demographic assumptions) It is also worth noting that the present projections incorporate the effects of the 2006 reform of the social security in Portugal. In fact, in October 2006, the government and social partners reached an agreement on the reform of the social security and this agreement was followed by the revision of the Social Security Framework Law (Law 4/2007 of January 16) and specific legislation on the general regime of the social security (Decree Law 187/2007 of May 10) and on the CGA subsystem (Law 52/2007 of August 31 and Law 11/2008 of February 20).
2.2. Projection results
Under the assumptions that are implicit in the AWG baseline scenario, simulation results presented in Table 1 suggest that until 2060 social security pensions are expected to rise 2.1 p.p. (from 11.4 % in 2007 to 13.4% of GDP in 2060 after reaching a peak in 2053 of 13.6% of GDP). Old-age and early pensions are responsible for 1.7 p.p. of this increase, while disability and survivors’ pensions are expected to take up an extra 0.4 p.p. of GDP along this period. Regarding occupational pensions, in spite of the increase of number of beneficiaries, the upwards trend of DC plans and the progressively smaller proportion of DB schemes – specially the 1st pillar DB pensions which have an average pension higher because of being substitutive of the Social Security –, leads to a lower average pension and, therefore, the maintenance of their share in terms of GDP. Overall contributions are expected to reach a maximum of 11.2% of GDP in 2010 and afterwards decrease gradually to 9.0% in 2060. In the case of Social Security subsystem, from 2046 onwards contributions will not be sufficient to cover earnings-related pension expenses.
324

Table 1: Projected gross pension spending, tax on pension and contributions (% of GDP)
2000 2007 2020 2030 2040 2050 2060 Peak year
Social security pensions 8,7 11,4 12,4 12,6 12,5 13,3 13,4 2053 Old-age and early pensions 6,6 9,1 10,2 10,4 10,2 10,8 10,8 2053 Other Pensions 2,1 2,3 2,2 2,2 2,3 2,6 2,7 2060Occupational pensions : 0,6 0,6 0,6 0,6 0,5 0,5 2007Private pensions : : : : : : : : Mandatory private 0 0 0 0 0 0 0 : Non-Mandatory private : : : : : : : :Total pension expenditure 8,7 12,0 13,0 13,2 13,1 13,9 14,0 2053Taxes on public pensions 0,6 0,8 0,9 0,9 0,9 1,0 1,0 2053Taxes on occupational pensions : 0,05 0,05 0,04 0,04 0,04 0,04 2007Contributions 9,5 10,7 10,4 9,6 9,2 9,0 9,0 2010
As far as the public sector employees system is closed to new contributors since 2006, pension expenses with public sector employees under the general contributory regime are expected to rise gradually until 2060, reaching 1% of GDP in the end of the projection period, while, in the case of CGA subsystem they will decrease to 0.9% of GDP by then (Table 2).
Table 2: Projected gross public pension spending: by scheme (as % of GDP) 2007 2020 2030 2040 2050 2060 Peak year
Total social security pensions 11,4 12,4 12,6 12,5 13,3 13,4 2053of which: CGA 4,1 4,0 3,9 2,9 1,8 0,9 2009of which
Public sector employees (1) 3,6 3,5 3,3 2,4 1,7 1,5 2009Private sector employees (1) 4,9 6,4 6,9 7,6 8,9 9,1 2053
Farmers 0,5 0,1 0,0 0,0 0,0 0,0 2007Self-employed : : : : : : :
Others 2,4 2,4 2,3 2,5 2,7 2,8 2060Note: (1) Refer to earnings-related pensions.
The Agricultural Workers’ Regime, which is closed to new contributors since 1986, is expected to be extinct near 2045. The expenses with this regime, which represented 6% of total pension expenditure in 2007 (0.5% of GDP), are projected to decrease progressively.
2.3. Description of main driving forces behind the projection results
Ageing population is the main driver behind the evolution of public pension expenditures, in particular until mid 40’s (Table 3). The contribution of the dependency ratio to the increase of the public pensions’ ratio to GDP is of almost 10 p.p. of GDP. However, it is halved offset by the one of the benefit ratio, which decreases by almost 5 p.p. of GDP. This means that the set of new measures that were introduced within the scope of the recent social security reform, namely, new rules for the calculation of new pensions and for pension indexation, do impact on the average pension value in relation to the average wage of the economy, with productivity gains being no longer appropriated by pensioners. According to the underlying macroeconomic assumptions, productivity gains are higher until the 30’s and therefore the decline of the benefit ratio is stronger by then.
325
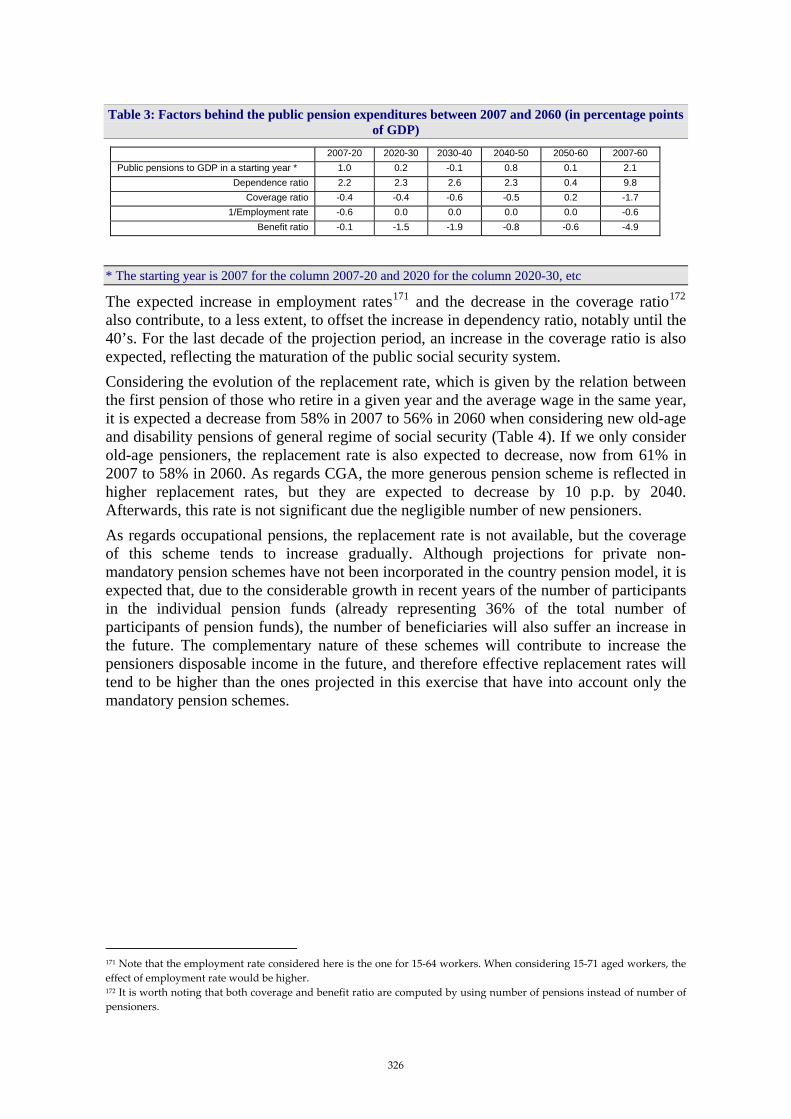
Table 3: Factors behind the public pension expenditures between 2007 and 2060 (in percentage points of GDP)
2007-20 2020-30 2030-40 2040-50 2050-60 2007-60 Public pensions to GDP in a starting year * 1.0 0.2 -0.1 0.8 0.1 2.1
Dependence ratio 2.2 2.3 2.6 2.3 0.4 9.8 Coverage ratio -0.4 -0.4 -0.6 -0.5 0.2 -1.7
1/Employment rate -0.6 0.0 0.0 0.0 0.0 -0.6 Benefit ratio -0.1 -1.5 -1.9 -0.8 -0.6 -4.9
* The starting year is 2007 for the column 2007-20 and 2020 for the column 2020-30, etc
The expected increase in employment rates171 and the decrease in the coverage ratio172 also contribute, to a less extent, to offset the increase in dependency ratio, notably until the 40’s. For the last decade of the projection period, an increase in the coverage ratio is also expected, reflecting the maturation of the public social security system. Considering the evolution of the replacement rate, which is given by the relation between the first pension of those who retire in a given year and the average wage in the same year, it is expected a decrease from 58% in 2007 to 56% in 2060 when considering new old-age and disability pensions of general regime of social security (Table 4). If we only consider old-age pensioners, the replacement rate is also expected to decrease, now from 61% in 2007 to 58% in 2060. As regards CGA, the more generous pension scheme is reflected in higher replacement rates, but they are expected to decrease by 10 p.p. by 2040. Afterwards, this rate is not significant due the negligible number of new pensioners. As regards occupational pensions, the replacement rate is not available, but the coverage of this scheme tends to increase gradually. Although projections for private non-mandatory pension schemes have not been incorporated in the country pension model, it is expected that, due to the considerable growth in recent years of the number of participants in the individual pension funds (already representing 36% of the total number of participants of pension funds), the number of beneficiaries will also suffer an increase in the future. The complementary nature of these schemes will contribute to increase the pensioners disposable income in the future, and therefore effective replacement rates will tend to be higher than the ones projected in this exercise that have into account only the mandatory pension schemes.
171 Note that the employment rate considered here is the one for 15-64 workers. When considering 15-71 aged workers, the effect of employment rate would be higher. 172 It is worth noting that both coverage and benefit ratio are computed by using number of pensions instead of number of pensioners.
326

Table 4: Replacement rate and coverage by pension scheme (in %)
2007 2020 2030 2040 2050 2060
Social security scheme (1)All pensions 57,9 53,1 49,0 52,7 53,8 55,9Old age (2) 61,2 55,2 50,8 54,5 55,4 57,7Old age (3) 63,5 58,1 53,4 57,3 58,3 60,7
Coverage 83,1 82,1 82,5 83,4 85,6 88,1CGA (4) 80,5 75,3 71,7 72,4 0 0
Coverage 13,7 14,4 14,0 13,0 10,7 7,7Occupational scheme : : : : : :
Coverage 3,2 3,5 3,6 3,6 3,7 4,2Private scheme : : : : : :
Coverage : : : : : :Notes:
(2) Considering the average wage of all workers.(3) Considering the average wage of workers 60-64 years old.
(1) Ratio between the average pension of new pensioners (earnings-related old-age and disability pensioners) and the average declared wage of general regime of wage earners.
(4) Ratio between the average pension of new pensioners (earnings-related old-age and disability pensioners) and the average wage of CGA contributors.
In the social security scheme, projections show a downwards trend in the ratio “number of pensions over population aged 65 or older” until the 50’s, reflecting the fact of the growth rate of older population being higher than the growth rate of pensions (Table 5). In the last decade of the horizon, this ratio decreases gradually as social security system matures and increases its coverage in relation to the older population.
Table 5: Number of pensioners and contributors in the Social security scheme (in 1000), population over 65 and total employment (in 1000) and related ratios (%)
2000 2007 2020 2030 2040 2050 2060 Number of pensioners* (I) 2906 3196 3755 4302 4783 5156 5293 Number of people aged 65+ (II) 1635 1829 2230 2632 3073 3449 3476 Ratio of (I) and (II) 178 175 168 163 156 150 152 Number of contributors (III) 4922 4296 4315 4127 3879 3633 3496 Employment(IV) 4705 4835 5195 5147 4939 4676 4544 Ratio of (III) and (IV) 105 89 83 80 79 78 77 Ratio of (III) and (I) 'support ratio' 169 134 115 96 81 70 66
* Data refer to the number of pensions.
The markedly reduction in the support ratio shows the challenge that the public pension scheme has to face being a PAYG system and justifies the recent reforms that were implemented. However, it should be noticed that the support ratio is computed with the number of pensions which is higher than the number of pensioners and, therefore, underestimates the “true” support ratio. On what concerns the Public Pension Fund, in 2007 the fund assets represented 4.5% of GDP (Table 6). This Fund receives annually the surpluses from the contributory scheme along with 2 percentage points of the workers social security contribution rate. It also increases by reinvested earnings (interest and holding gains of their own assets). The fund assets are used to cover pension expenditures. As far as, under this scenario, the contributory scheme is expected to generate surpluses from 2008 until 2025, the funds assets are expected to grow until this date (in 2025 FEFSS is expected to represent 13.1% of GDP).
327

Table 6: Assets of pension funds and reserves (% of GDP)
2000 2007 2020 2030 2040 2050 2060Public Pension funds 2.5 4,5 12,3 12,9 9,1 0,0 0,0Of which liquid financial assets, non-consolidated : : : : : : :
Of which liquid financial assets, consolidated : : : : : : :Occupational pensions 13,3 16,6 17,6 17,8 19,0 20,7Private pensions : : : : : : :All pensions 2.5 17.8 28.9 30.5 26.9 19.0 20.7
The pension funds assets for occupational pensions represented 13,3% of GDP, in 2007 and is expected to grow consistently until 2060 mainly because of the working population cover ratio increase (from 3,8% to 7,5%).
2.4. Sensitivity analysis
Table 7 presents the sensitivity analysis of the pension expenditure projections to different assumptions. Each sensitivity scenario was computed in relation to the baseline scenario with the respective parameter change, ceteris paribus. The results show that, in general, pension expenditure projections are robust to different economic scenarios and even to changes in the life expectancy, vis-à-vis the baseline scenario, being more vulnerable to the zero migration scenario (an extreme assumption).
Table 7: Total and public pension expenditures under different scenarios
2007 2020 2030 2040 2050 2060 Total Pension Expenditure
Baseline 12.0 13.0 13.2 13.1 13.9 14.0 Higher life expectancy 12.0 13.0 13.3 13.2 14.2 14.4 Higher lab. productivity 12.0 12.8 12.8 12.5 13.2 13.2 Higher interest rate 12.0 13.0 13.2 13.1 13.9 14.0 Higher emp. rate 12.0 12.8 13.1 12.9 13.7 13.8 Higher emp. of older workers 12.0 12.9 13.1 12.9 13.7 13.8 Zero migration 12.0 13.6 14.5 15.1 16.8 17.0
Public Pension Expenditure Baseline 11.4 12.4 12.6 12.5 13.3 13.4 Higher life expectancy 11.4 12.4 12.7 12.7 13.6 13.8 Higher lab. productivity 11.4 12.2 12.2 12.0 12.7 12.7 Higher interest rate 11.4 12.4 12.6 12.5 13.3 13.4 Higher emp. rate 11.4 12.2 12.5 12.3 13.2 13.3 Higher emp. of older workers 11.4 12.2 12.5 12.3 13.2 13.3 Zero migration 11.4 12.9 13.8 14.4 16.1 16.3
Due to the low weight of the occupational pensions in terms of the overall pension expenditure over the GDP, the sensibility analysis on the occupational pensions’ projections does not have a significant impact on the total pension expenditure ratios, which mainly reflect the public pension trends. The higher life expectancy test leads to a rise in the pension expenditure ratio of 0.4 percentage points (p.p.) by 2060. This moderate increase reflects the introduction of the so-called sustainability factor that indexes the new pension’s value to the evolution of life expectancy at 65 years-old (legal retirement age). On the other hand, a higher labour productivity scenario induces a decrease in total pension expenditure by 0.8 p.p. (0.7 p.p.
328

in the case of public pensions), as pension updating is no longer linked to wage increases (and productivity gains). The assumption of zero migration is by far the most extreme one, leading to an increase of pension expenditure ratio of around 3 p.p. in 2060 when compared to the baseline scenario. This assumption is associated to a significant reduction of employment and economic growth and, therefore, the GDP “denominator effect” exceeds the “numerator effect” of lower pension expenditures in the long-term. Whereas the assumptions of higher employment rate and higher employment rate of older workers have a small impact on the results, the scenario of higher interest rate does not influence the outcomes on public pension spending, as the projection models do not consider interest rate as a parameter.
2.5. Description of the changes in comparison with previous projections
The current projections on public pension expenditure show a significant downwards revision vis-à-vis previous projections (Tables 8 and 9).
Table 8: Decomposition of the change (in p.p.) in public pension expenditure to GDP between 2007 and 2050 under the 2001, 2006 and 2009 projection exercises
% Change to 2050
Dependence ratio
Coverage ratio
Employment effect
Benefit ratio
Pension/GDP – 2001 * 3.3 6.7 -2.4 -1.1 0.1 Pension/GDP – 2006 ** 9.3 13.7 -0.9 -0.2 -3.0 Pension/GDP - 2009 *** 2.0 9.4 -1.9 -0.7 -4.3
The main driver of this result was the incorporation of major measures of recent public pension reform, which were discussed at the 2007 Peer Review exercise. The latter took also into account a new model for CGA projections and the revision of data for base year. A more favourable demographic scenario along with higher projected employment and productivity rates, justify the expected decrease of the change in total pension expenditures within the present projection exercise in relation to the 2007 outcome. However, other factors should be referred like the update of base year (2007 instead of 2005) and the introduction of recent changes in the CGA legislation framework.
329

Table 9: Decomposition of the difference between 2006 and 2009 public pension projection (% of GDP)
2005 2007 2020 2030 2040 2050
Ageing report 2006 11,5 11,7 14,1 16,0 18,8 20,8
- Change in assumptions- Improvement in the coverage or in the modelling (1) -0,6 -0,1 -0,6 -0,5 -0,8 -1,3- Change in the interpretation of constant policy- Policy – related changes 0,0 -0,1 -0,9 -2,1 -3,0 -3,6
Peer Review 2007 11,0 11,5 12,6 13,4 15,0 16,0
- Change in assumptions (2) -0,1 -0,1 -0,2 -0,8 -2,5 -2,6- Improvement in the coverage or in the modelling- Change in the interpretation of constant policy- Policy – related changes
Ageing report 2009 10,9 11,4 12,4 12,6 12,5 13,3
Notes:(1) Includes other minor effects as change in assumptions and revised data for base year.
(2) Includes other minor effects as improvement in the modelling and change in the probability of retirement for CGA contributors from 2008 on, due to new legislation of February 2008.
330

Romania (Report prepared by Iuliana Mihaela Dascălu)
1. Overview of the pension system
1.1. Description of the pension system The Romanian pension system consists of three pillars: mandatory PAYG state system, mandatory private pension system and voluntary fully funded pension system.
1.1.1. Public pension system and other rights of social insurance
The actual public pension system (Pillar 1) is governed by the Law 19/2000 - Public pension system and other social insurance rights Law- with further amendments. It is organized as a single system, granted by the state on the following principles: redistribution, equality, social solidarity, mandatory contribution, distribution and autonomy. Pillar 1 corresponds to a publicly managed earnings-related scheme. Coverage Public pension insurance covers five types of pensions:
1. old age and length of work experience, 2. early retirement pensions, 3. partial early retirement pensions, 4. disability pensions 5. survivor pensions.
Other insurance rights comprise: - decease aids, - insurance for work accidents and professional diseases, - social assistance in case of diseases and temporary invalidity, - allowances for survivors.
Contributors The Romanian public pension system is work related (pay-as-you-go) with mandatory pension insurance for all working persons. By the provisions stipulated in the Pension Law 19/2000 almost all the existing professional pension systems (artists, writers, farmers, etc.) were unified in a single system whith mandatory contributions for employees, self-employed, , employed with temporary agreements, extra-job system (civil convention) and the unemployed persons173. In the public system are mandatory insured by the law effect:
173 The contribution is paid out by the Unemployment Agency-ANOFM
331

I. employed on individual labor contract and public servants (except military, police, intelligence service);;
II. persons in elective positions or appointed within the executive, legislative and judicial authorities
III. unemployed with monthly benefits from the unemployment insurance budget; IV. individuals in one of the following situations:
a) sole associate, associate, silent partners or share-holder; b) managers that have concluded a management contract; c) members of family associations; d) individuals authorized to deploy independent activities; e) individuals employed in foreign institutions, in the case they are not insured; f) other individuals that earn incomes from professional activities.
Individuals who are referred to in the IV paragraph are obliged to insure by himself according to the insurance declaration. The monthly insured income is set according to the insurance declaration174. Except for some categories (lawyers, military) – who have special pension systems – all employees and other persons working on contractual basis are included in this scheme. Still, the pension system does not entirely cover certain categories such as free-lancers, peasants, house-wives or black market employees. The resources for the state pension funds are centralized and the Social Insurance Budget is included in the General State Budget, so that the general government assumed the obligation to cover the eventual shortage of revenues from the insurance payments and to pay benefits and pensions.
Non-contributive pension schemes
These schemes are not included in the public pension system, are organised in the same manner as Pillar 1, and the State Budget grants the pension payments.
The pension for old farmers (working as state farmers before 1990) was initially (in 2001) included in the Pillar 1 even if they never contribute to the system, having the role of a social pension. Starting 2005 the pensions for farmers were externalised from the Social Insurance Budget and paid from the State Budget.
Not included in the Social Insurance Budget are the pensioners of the Ministry of Defence, the Ministry of Administration and Interior, Romanian Intelligence Office, State Secretariat for Cults and Lawyers Insurance Office system. The sums (except Lawyers Insurance Office system which is organised as an optional scheme) are granted from the State Budget to the respective ministries.
All these categories above do not pay contributions to the Social Insurance Budget175.
Special schemes for magistrates, parliamentary, aeronautic personnel include payments both from Insurance Budget (for state pension based, computed on pension point system) and from the State Budget for the difference from the value computed as percent of their last salary before retirement (special scheme computation) and the state pension.
174 At least ¼ of minimum wage 175 For military the employee pay a contribution of 5% of the gross pay. Farmers, do not contribute at all.
332

Beneficiaries In the public pension system are included: - the insured individuals owing individual contributions to the social insurances; - National Agency for Employment which manages the budget of the unemployment
fund; - individuals that have concluded a contract for social insurance - The right to pension is guaranteed for all insured persons who respect legal provisions
regarding the statutory retirement age and contribution period. - The minimum contributive period both for women and men is 15 years and will be
achieved by gradual increase by march 2015 (in 2001 it was 10 years). - The retirement age is reduced for personnel working in dangerous conditions of work:
type I and type II, or women with at least 3 children. The reduced retirement ages must be higher than 50 for women and 55 for men.
- Insured individuals who accomplish the conditions for obtaining an age pension are allowed to continue their activity only based on an agreement with the employer and cumulates income with the due pension.
- Sightless insured individuals benefit from an age pension, irrespective of they achieved as sightless individuals at least the third part of the complete contributive period provided by the law.
The pension system was created around the three categories of work: type I and type II specifically for personnel working in dangerous conditions, while type III for the ordinary working conditions. For the first two categories the retirement age, is reduced. Insured individuals who deployed activities in jobs considered in the Group I or Group II of labor, according to the legislation before 2001, April 1st, benefit from an additional number of points:
a) 0.50 points for each year of benefit, for the length of service in the Group I; b) 0.25 points for each year of benefit, for the length of service in the Group II.
Structure of benefits In the public system the following pension categories are granted: old age pension; early retirement pension; disability pension and survivor pension. a) Old age pension is granted to insured individuals, who accomplish cumulatively, at the moment of retirement, the conditions regarding the standard retirement age and the minimum contributive period achieved in the public system. The standard retirement age is 60 for women and 65 for men and will be achieved through the gradually increase of the retirement age by 2014, starting from 57 for women and 62 from men (see Annex 1).
ANNEX 1
years/months WOMEN MEN
PERIOD Retirement
age standard
contribution period
minimum contribution
period
Retirement age
standard contribution
period
minimum contribution period
1 2 3 4 5 6 7 april 2001 - march 2002 57 25 10 62 30 10 april 2002 - sept 2002 57/1 25/1 10/1 62/1 30/1 10/1
333

oct 2002 - march 2003 57/2 25/2 10/2 62/2 30/2 10/2 april 2003 - sept 2003 57/3 25/3 10/3 62/3 30/3 10/3 oct 2003 - march 2004 57/4 25/4 10/4 62/4 30/4 10/4 april 2004 - sept 2004 57/5 25/5 10/5 62/5 30/5 10/5 oct 2004 - march 2005 57/6 25/6 10/6 62/6 30/6 10/6 april 2005 - july 2005 57/7 25/7 10/7 62/7 30/7 10/7 august 2005 - nov 2005 57/8 25/8 10/8 62/8 30/8 10/8 dec 2005 - march 2006 57/9 25/9 10/9 62/9 30/9 10/9 april 2006 - july 2006 57/10 25/10 10/10 62/10 30/10 10/10 august 2006 - nov 2006 57/11 25/11 10/11 62/11 30/11 10/11 dec 2006 - martie 2007 58 26 11 63 31 11 april 2007 - july 2007 58/1 26/2 11/2 63/1 31/2 11/2 august 2007 - nov 2007 58/2 26/4 11/4 63/2 31/4 11/4 dec 2007 - march 2008 58/3 26/6 11/6 63/3 31/6 11/6 april 2008 - july 2008 58/4 26/8 11/8 63/4 31/8 11/8 august 2008 - nov 2008 58/5 26/10 11/10 63/5 31/10 11/10 dec 2008 - march 2009 58/6 27 12 63/6 32 12 april 2009 - july 2009 58/7 27/2 12/2 63/7 32/2 12/2 august 2009 - nov 2009 58/8 27/4 12/4 63/8 32/4 12/4 dec 2009 - march 2010 58/9 27/6 12/6 63/9 32/6 12/6 april 2010 - july 2010 58/10 27/8 12/8 63/10 32/8 12/8 august 2010 - nov 2010 58/11 27/10 12/10 63/11 32/10 12/10 dec 2010 - march 2011 59 28 13 64 33 13 april 2011 - july 2011 59/1 28/2 13/2 64/1 33/2 13/2 august 2011 - nov 2011 59/2 28/4 13/4 64/2 33/4 13/4 dec 2011 - march 2012 59/3 28/6 13/6 64/3 33/6 13/6 april 2012 - july 2012 59/4 28/8 13/8 64/4 33/8 13/8 august 2012 - nov 2012 59/5 28/10 13/10 64/5 33/10 13/10 dec 2012 - march 2013 59/6 29 14 64/6 34 14 april 2013 - july 2013 59/7 29/2 14/2 64/7 34/2 14/2 august 2013 - nov 2013 59/8 29/4 14/4 64/8 34/4 14/4 dec 2013 - march 2014 59/9 29/6 14/6 64/9 34/6 14/6 april 2014 - july 2014 59/10 29/8 14/8 64/10 34/8 14/8 august 2014 - nov 2014 59/11 29/10 14/10 64/11 34/10 14/10 dec 2014 - march 2015 60 30 15 65 35 15
334
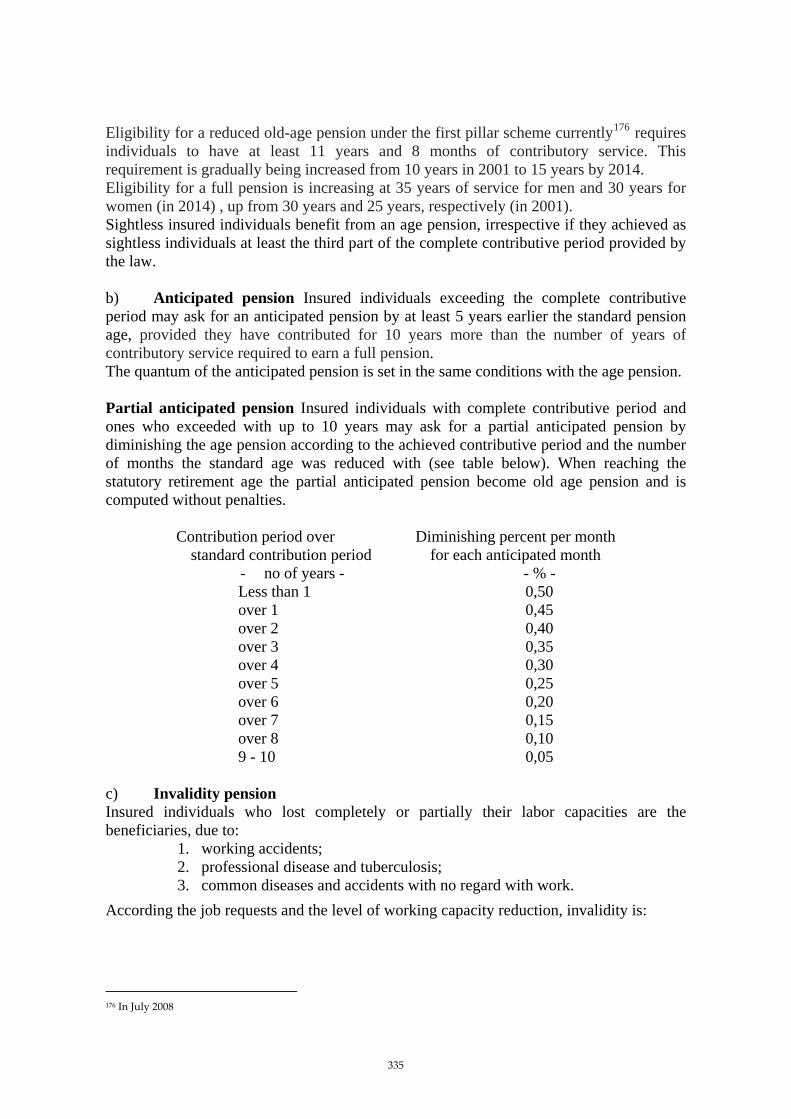
Eligibility for a reduced old-age pension under the first pillar scheme currently176 requires individuals to have at least 11 years and 8 months of contributory service. This requirement is gradually being increased from 10 years in 2001 to 15 years by 2014. Eligibility for a full pension is increasing at 35 years of service for men and 30 years for women (in 2014) , up from 30 years and 25 years, respectively (in 2001). Sightless insured individuals benefit from an age pension, irrespective if they achieved as sightless individuals at least the third part of the complete contributive period provided by the law. b) Anticipated pension Insured individuals exceeding the complete contributive period may ask for an anticipated pension by at least 5 years earlier the standard pension age, provided they have contributed for 10 years more than the number of years of contributory service required to earn a full pension. The quantum of the anticipated pension is set in the same conditions with the age pension. Partial anticipated pension Insured individuals with complete contributive period and ones who exceeded with up to 10 years may ask for a partial anticipated pension by diminishing the age pension according to the achieved contributive period and the number of months the standard age was reduced with (see table below). When reaching the statutory retirement age the partial anticipated pension become old age pension and is computed without penalties.
Contribution period over Diminishing percent per month
standard contribution period for each anticipated month - no of years - - % - Less than 1 0,50 over 1 0,45 over 2 0,40 over 3 0,35 over 4 0,30 over 5 0,25 over 6 0,20 over 7 0,15 over 8 0,10 9 - 10 0,05
c) Invalidity pension Insured individuals who lost completely or partially their labor capacities are the beneficiaries, due to:
1. working accidents; 2. professional disease and tuberculosis; 3. common diseases and accidents with no regard with work.
According the job requests and the level of working capacity reduction, invalidity is:
176 In July 2008
335

1. first degree, characterized through the total lost of working individual capacity being necessary care or permanent surveillance of an another person;
2. second degree, characterized through total lost of working capacity, invalid person does need no help;
3. third degree, characterized through the lost of half of the working capacity at least, invalid person may deploy an activity.
When achieving the standard age of the reduced standard age according to the law in order to obtain the age pension, the beneficiary of the invalidity pension care choose for the most advantageous pension. d) Survivor benefits are awarded to spouses and orphans of individuals who, at the time of their death, were receiving/had met the criteria to receive an old-age or disability pension . When reaching the retirement age, spouses are entitled to 50 percent of the deceased’s pension if the spouse had been married for at least 15 years. Spouses married for 10–15 years will receive reduced benefits (by 0.5 percent a month for each month short of 15 years of marriage). Disabled spouses are entitled to survivor benefits regardless of age, provided the spouse was married for at least one year. If the deceased died as a result of a work-related accident, occupational disease, or tuberculosis, spouses are entitled to survivor benefits, regardless of age or the number of years of marriage, provided that the spouse’s earnings are subject to mandatory insurance coverage and represent less than 25 percent of the average gross wage. Spouses who are eligible for a pension of their own may choose to receive their own pension or a survivor pension. Orphans are entitled to survivor benefits until age 16 up to 26 (if orphan is enrolled in school) or for the duration of their disability in cases in which the orphan becomes disabled while receiving a survivor benefit. The benefit for orphans represent 50% (for 1 orphan) up to 100% (3 or more orphans) of the deceased´s pension. Pension benefits The main criterion for compute pension benefits is the contribution period so that the main element for the amount of the insured services is strictly correlated with the period of contribution and not with the employment period. Another major reform introduced by the Law 19/2000 consists in using a new formula for computing pensions, based on a points system177. This mechanism takes into account the incomes obtained throughout the career period with strong redistributive elements considered in the calculation (instead of the previous computation based on the best consecutive five years in the preceding ten in service), improving the correlation between the contributions to the system and the level of benefits.
177 Each year the contributor received a number of points as a ratio of her/his salary and the gross average wage, published by the National Institute for Statistics.
336

Also, this factor constitutes a discerning characteristic of the Romanian public pension scheme: income-differences before retirement are reproduced to a high degree after retirement. The following categories may cumulate the pension with the income achieved from a professional activity, regardless the level of the corresponding revenue: - children – survivors, which are orphans from the both parents, during their education; - sightless individuals; - age pensioners; - invalidity pensioners third level; - beneficiaries of the successor pension, if their monthly gross income doesn’t exceed a
quarter from the average monthly gross salary in the economy Computation of pensions and indexation rules Since 2001, a new formula based on points was introduced instead the defined-benefit formula. For each year of contributions, an insured person receives pension points that reflect the employee’s relative earnings position to the economy average wage. .. The yearly pension points are calculated as the ratio of the individual’s monthly gross wages and other compensations to the national average monthly gross wage for that year. The life time accumulated pension points are divided to the complete contribution period and pension is determined by multiplying the average pension points with the pension point value, which is laid down in the social security budget law every year. Pension gross benefit is equal to the value resulted plus the contribution for health insurance. As benefits are based on total accumulated points at retirement, the formula tightens the link between lifetime contributions and the benefits received at retirement. In the case where contribution period is less than established by law, in order to compute one’s average pension points, the sum of pension points over the working period is divided by the number of years that corresponds to the complete contribution period, as established by law. In the case of partial anticipated pension the average pension points are reduced according to legal provisions. According to the current legislation, we can synthesize the somewhat complicated provisions of the law into a mathematical formula:
CpCfppvappP ∗∗∗= Where: P= pension benefit
app= average pension points = ∑=
T
tt np
1
= tp ∑12
1
*12/1 mm we
= yearly pension points tp = earning in month j te
337
w = wide economy average earnings in month j n = number of years that corresponds to the complete contribution period ppv = pension point value,
Cf = coefficient for flexible conditions (i.e for disability pension or partial anticipated pension) Cp= coefficient that takes into account the reduction in PAYG contribution due to Pillar 2
Adding pension points in the following cases: 1. Insured individuals who deployed activities in jobs considered in the Group I or
Group II of labor, according to the legislation before 2001, April 1st, benefit from an additional number of points: c) 0.50 points for each year of benefit, for the length of service in the Group I; d) 0.25 points for each year of benefit, for the length of service in the Group II
2. Each time period of working after the standard retirement age is awarded by 0.3% per month, or 3.6% per year.
The pension point value is established by the social insurance law on annual basis and, in fact it is adjusted in relation to the gross wage growth as the law indicate that is update each December at least accordingly to the inflation rate but a pension point cannot be less than 37.5 percent of the average gross wage in 2007178 and less than 45 percent of the average gross wage in 2008 (according to 2008 Insurance Budget Law). The pension adjustment is in line with the increase of average gross wage and irrespective of the year of retirement, all pensions (including disability and survivor pensions) are adjusted annually with the current pension point value. This means that in Romania the current methodology revalues existing pensions from the first pillar by multiplying the individual’s average points by the new point value, thus maintaining the pensions value relative to the average wage. The increase in the point value over the past few years resulted in pensions rising faster than wages, because the point value, as a share of the average wage, increased from 31.2 percent (in 2006) to 45 percent (in October 2008). Quotas of social security contributions Social security contributions quotas are differentiated according to the normal, different or special working conditions and are annually approved through the Law of state social security budget.
A. During 2008, January 1st – November 30th a) for normal working conditions 29%; b) for uncommon working conditions 34%; c) for special working conditions 39%; B. Starting with 2008, December the 1st; a) for normal working conditions 27.5%; b) for uncommon working conditions 32.5%; d) for special working conditions 37.5%.
Quota of individual social security contribution is 9.5%, no matter which are the working conditions, including also the quota corresponding to private pensions funds (of 2% in 2008 up to 6% in 2016 and over). 178 The rate between the pension point and the average gross wage used for the assessment of the Social Insurance Budget was 31.2 percent in 2007.
338
Contribution rate Contributions for pension insurance are determined applying the contribution quota to the gross monthly earnings. The contribution rate is annually adjusted with a mechanism encoded into law. The average179 social security pension contribution rate 2008 paid for the PAYG system is 28.9%, splitted between the employer (19.4%) and the employee (9.5%)180. The contribution applies to the gross wage. Since 2005 the average contribution rate has reduced every year, and the government announces the intention of further reductions. The individual social insurance contribution is paid by the insured persons (except the unemployed for whom pay ANOFM) and is calculated as the third part from the yearly-established contribution for normal labour condition. The social insurance contribution paid by the employer represents the difference between the amounts of the whole contribution for the certain labour condition (normal, uncommon or special) and the individual social insurance contribution. The persons who have insurance agreements pay the whole amount of the contribution by themselves, according to the labor condition. Taxation of PAYG pension The difference between pension gross benefit minus the contribution for health insurance and the threshold set up by law (GPO 87/2000) is subject to personal income tax (by a tax rate of 16% starting 2005.
1.1.2. Mandatory Private Pension System
Starting 2007 a new mandatory personal accounts system - the private-managed compulsory pensions (2nd pillar) was established and became functionally in May 2008. This new pension system shifted from "defined benefits" DB to "defined contributions "DC. In the latter case employees are aware of the value of their contributions, but do not know the exact amount they will receive when the pension is paid out. Contributors Participation in a mandatory pension fund is mandatory for all those under 35 years old and voluntary for the 36 - 45 age cohort. Contribution rate A part of the employee’s Social Security contributions is compulsorily directed towards the mandatory pension scheme. Contributions were up to 2 pp of wages during the first year (2008) and will increase by 0.5 pp each year until they reach rate of 6 pp (2016). Retirement age
179 According to the Law 19/2000 the employers and self employed pay contribution rates accordingly to the work conditions´ categories that are published annually in the State Insurance Budget. House of Pension taking into account the number of participants by each working category computes the average rate. 180 Once the mandatory personal pension system starts operating in 2007 this percentage will diminish by 0.5% a year until it reaches 3.5% as the state pension will gradually be reduced by 6%.
339

The retirement age is the same as for the social security pension, with the law providing the possibility to request retirement 5 years earlier if the participant has reached the full contribution period. Taxation Investment income is tax exempt. Pension benefits are subject to ordinary tax legislation. Rules Each pension fund assist minimum 50,000 participants and function under the supervision of a newly established body named the Private Pension System Supervisory Commission (established by Law no 313/2005). The persons who did not succeed in choosing a certain fund were directed ex officio towards a fund administrator. Pension funds have no legal capacity and are managed by pension fund management companies (joint stock companies). Pension funds are established by a civil company contract concluded between participants in accordance with the Civil Code and Law 23/2007 regarding privately administered pension funds. A pension management company can run one pension fund which may consist in high, medium or low risk investments. Administrators can charge an annual management fee of up to 0.6% and a contribution fee of up to 2.5% of contributions paid in. Results In June 2008 pension funds reported 3438452 persons and net managed assets of 51 million euro. In July 2009 were registered 4.4 million active participants and net assets of 404.8 million euro. Funds operating on Pillar II invested most assets in state securities, municipal bonds, corporate bonds and others, including stocks and bank deposits.
1.1.3. Non-mandatory Private Pension System
The 3rd pillar was implemented in September 2007 (Law no 204/2006 regarding optional pensions) and is ensured for the moment by the existing life insurance companies. According to the law, private-managed voluntary pension’s schemes funds must have at least 100 members. Contributors Employees and the self-employed may participate in voluntary schemes. Participation is voluntary for employees. Employees can participate in as many occupational schemes as they wish and cumulate pension rights and benefits. Contribution rate Contribution levels are established by the scheme rules and collected and paid by the employer and/or employee into a pension account identified by the employee, simultaneously with the mandatory social insurance contributions. The contributions are paid into the employee’s individual account. Contributions to the voluntary pension tier can amount to 15% of the monthly gross wage or of income associated with the member’s employment. The contribution can be shared between employer and employee in accordance with the scheme regulations or a collective agreement. Employees may at any time change the level of contributions or cease paying contributions altogether, but must notify the employer and the administrator.
340

Retirement age Participants become eligible when they reach the age of 60 years (both men and women), under the condition of having made contributions for a period of at least 90 months and have accumulated enough capital to meet a minimum threshold. In the event of disability before retirement, a participant is entitled to receive the funds in the account. In the event that the participant dies before reaching retirement, account funds will be distributed to the participant’s surviving dependents. Benefits Benefits are payable when participants fulfill the retirement conditions and when the assets are at least equal to the amount required for a minimum voluntary pension. Regulations on the pay-out phase of voluntary pensions will be drawn up by 2009. Taxation Employee and employer contributions are each tax-deductible up to a ceiling of €200 per year181. Investment income is also exempted. Pension benefits are subject to ordinary tax. Rules The Private Pension System Supervisory Commission supervises the two-funded pension system Voluntary pension schemes can be administered by a pension company, an investment administration company or insurance company, which must be authorized in accordance with sectoral legislation and obtain an authorization from the Private Pension System Supervisory Commission. Administrators can charge a contribution fee of up to 5% and an annual management fee of up to 2.4%. Transfer fees are payable if the participant switches funds within 2 years of joining. Regulations on the procedures for switching funds have recently been issued. Administrators must achieve a minimum rate of return relative to the market. Results At the end of September 2007, 6 fund administrators and 7 optional pension’s funds were authorized summing up 14543 participants. No voluntary pension funds were in operation in 2007, but in June 2008 were registered 110 316 participants and net assets of 11 million euro. In July 2009 were registered 173 thousands participants and net account of 35.7 million euro. Funds operating on Pillar III invested most assets in state securities, municipal bonds, corporate bonds and others, including stocks and bank deposits.
1.2. Other insurance forms that are not included in Social Insurance System
Apart from the Social Insurance System there are: state allowances for children, complementary allowances for poor families with many children, expenditures for prevention of social exclusion (social aids, aids to single persons and very poor families). The guaranteed minimum income program was implemented closely linked to the social security system, aiming at alleviating poverty and promoting employment. It provides 181 In October 2008 the ceiling was raised at 400 euro/year for employer to deduct these costs.
341

minimum income for households with lump sums established by law every year, accordingly to the number of persons within the family but also stimulates work, as the employment of a household family member leads to the increase by 15% of the social aid entitlement. Granting the guaranteed minimum income represents a complementary measure to the allocation of other benefits such as: medical insurance, emergency aid and heating aid. Romania does not have a non-contributory social protection scheme specifically for the elderly, but they are eligible for the minimum-income guarantee program, which provides financial support to households whose income falls below a minimum threshold. The threshold is a function of household size and income; the amount of the benefit is adjusted to make up the difference between the minimum income threshold and actual household income The state-defined minimum income guarantee is adjusted to inflation.
1.2.1. Recent reforms
1.3.1 Reforms made before July 2008
The pension system in Romania was affected by many reforms in the previous years, aiming at improving the sustainability of the system that faces structural demographic changes due to the increasing share of aged population. Until 2000, the following eligibility criteria were in force (based on the 1977 Pension Law): - Age of retirement, for full pension rights – 62 for men and 57 for women; - length of service – minimum 30 years for men 25 for women; if the length of service criteria was fulfilled, retirement could even be done at the age of 60 for men and 55 for women. - employees with a length of service of at least 10-15 years who have reached retirement age have a right to a pension calculated accordingly to their length of service, -special working groups benefit from certain privileges vis-à-vis early retirement, - women with a length of service of 25 years and who have more than 3 children for whom they have interrupted work, may retire 1-3 years earlier. - supplementary pension is 5% of the employee’s monthly wage; - calculation formula of the pension amount from a computation was dependent only on the best
consecutive five years in the preceding ten in service - all pensions are not taxable. Starting 2001, by new Pension Law 19/2000 the first stage of the pension reform was implemented aiming to cease the long-term fiscal imbalances of the social security budget, by measures like:
a slow increase of the retirement age from 57 to 60 years for women and from 62 to 65 years for men, in a gradual approach until 2014;
introducing a new formula for computing pensions, based on the contributions paid during the whole active life
granting additional pension points in order to stimulate pensioners' participation in the labour market even after meeting the cumulative criteria for retirement,
increasing the minimum contribution period for both genders from 10 to 15 years until 2014;
net pension income (difference between gross pension income and health social insurance contribution) is taxed for the amount exceeding the legal threshold.
The main benefits provided by the pension system were for old age, disability and survivors. But the law also introduced some social benefits paid out of the public pension fund, like indemnities for maternity leave, indemnities for recovery after work accidents and holidays for retired persons.
342

Also the farmers, who never contributed to the system, were granted the right to receive a pension for old age. Starting 2002 irrespective of the social insurance contributions quotas (set annually in the Insurance Budget Law accordingly to labor working condition), the individual contribution quota, is 9,5%, regardless of the working conditions, which represents one third of the total quota. In 2003, to the social insurance contribution quotas approved by law is added a quota of 0.5% - which represents the insurance for work accidents and professional diseases: this type of contribution is owed by employers as well as by every insured person who enters a contract for in himself/herself against this type of risks. - When establishing the maximum ceiling for computing the base rate for social insurance contributions is taken into account the value corresponding to that of 5 national gross average wages. - By Law is set up the minimum level of the monthly income insured in the case of insured that submit insurance declarations or, sign insurance contracts. The second stage of the reform was initiated in 2005 aimed at reforming the system by creating a multi-pillar framework, while continuing the consolidation of the public pension pillar. A key element in consolidating the public pension system) was the externalization of the non-contributive services, such as: -the payment of the farmers' pensions was transferred to the state budget, starting with 2005; -the payment of indemnity for maternity, indemnity for child´s raise with an age below 2 years (3 years respectively for the children with disability),indemnity for sick child care and medical allowances were transferred to the state budget, respectively to the health social insurance fund, starting 2006. The private pension systems (Pillar II and III) were introduced in order to consolidate and increase the long-term sustainability of the pension’s system
Starting January 2007 the tax base for pension contribution enlarged as it consists of monthly gross income, instead of monthly gross salary (including other incomes over the base salary) . Also, extending the tax base included new income categories: auditing activities, administration councils, incentives, payment by hour, and clinical indemnity for doctors. The ceiling of 5 average gross salaries for the value of social security contribution paid on an annual basis for individual contributions and the ceiling of 3 pension points were eliminated.
343
1.3.2 New pension reforms in 2009
Due to increasing imbalances in the insurance budget registered in the last years, the huge deficit recorded in 7 months 2009 and taken into account the up-ward trend of the pension costs projections in long term, the necessity for a new pension reform become urgent.
Under the Agreement with International Monetary Fund and European Commission (March 2009) Romanian government assumed the reform of the pension system starting 2010 and is committed to ensure the approval of the new pension legislation by law by end-December 2009.
The reform aim at balancing the PAYG system in medium and long term and smooth the inequities across the pension beneficiares.
The draft of the law was completed in September and the main measures refer to:
1. change the pension indexation by decoupling the pension increase from the salary development, using only price indexation or a combination of price indexation and a percent of real wage increase
2. increase retirement ages for women to equalize women retirement ages, in line with changes in life expectancy starting 2015,
3. revisit early retirement regime to ensure an actuarially fair regime, 4. more restrictive eligibility criteria for invalidity pensions, especially for third
invalidity degree, 5. enlarging contributory categories from self-employment sector (build an integrate data
base using House of Pension data with Fiscal Administration data), 6. eliminate the special systems (military, police, intelligence service ) and fully integrate
them in the public pension system, thus increasing the number of contributors to public pension scheme
7. increase retirement age for military at 60 for men and women (from 55),
The estimates for the measures above shows the pension related costs will strongly reduce and stabilise to the revenues level starting 2004 (at 6-6.5% in GDP). The fiscal balance of the pension system budget enhance, but the replacement rates are strongly diminished if using only price indexation. An alternative scenario was built taking into account a mix indexation formula (pension increase both with inflation and half of the increase in real wage) . In this scenario the pension costs will stabilize at 7-8% in GDP in 2060 and the replacement rates will ensure the adequacy of the pension system.
Description of the effective constant policy All the enacted pension reforms until 1st July 2008 were taken into consideration. The retirement age increases was taken accordingly to the enacted legislation. The pension point value was linked accordingly to 2008 Budget Law to the wide-economy gross salary (which represents about 95,3% of wide-economy gross wage), while the contributions, according to Pension Law are related to wide-economy gross wage. Other revenues (interests, increases for delaying the contribution payment) and other expenditure (organizing and functioning of the public system, financing certain
344

investment, etc) differences were considered as a constant percentage in pension expenditure, as observed in the past years´ executions of the Social Insurance Budget. By Law, a quota of 3 percent out of state social security budget revenue is directed to a reserve fund, only if there are no debts to State Budget. According to Ministry of Labor, until now there are no assets from reserve fund, so we have considered that in the following years assets from PAYG system are zero.
2. Pension expenditure projections
2.1. Extent of the coverage of pension schemes in the projection
The following projections cover the public statutory pension scheme, special pension schemes and mandatory private pension schemes (implemented this year). Though, due to a strong governmental promotion, non-mandatory private pension schemes experienced a strong growth only during this year182, there is no reliable data available to provide further projections for non-mandatory pension schemes. For mandatory private pension schemes we computed the revenues to 2nd Pillar183 according to the methodology in use and we estimate the payments using the international methodology, as the mechanism by which benefits will be paid under the scheme will be discussed in 2009. The projections cover the PAYG beneficiaries of old age and early pensions (together), disability and survivors pensions (together). For the special pension systems and farmer´s pensions (funded by State Budget) because of the lack in data we did not divided into old age and early pensions, disability and survivors. For social pensions (under Minimum Guarantee Income provisions) we have considered the historical data as percent in GDP and increase it according to the demographic and labour market developments. Taxation is considered only for PAYG pension, as we have no national methodology for private pension’s schemes payments. By Law only the difference between pension gross benefit, the contribution for health insurance and the threshold is subject to personal income tax (by a tax rate of 16% starting 2005). The threshold is set up by law every year and is not linked to a specific indicator, so what we could estimate on long term only is taxes as a fixed percent determined on historical data.
2.2. Overview of the projection results
182 In 3 quarters 2008 the number of contributors to non mandatory private pension schemes has doubled as compare to December 2007 to about 110,5 thousands by the end of October this year and the net value of assets reached 11 million euros. 183 In 3 quarters 2008, the second pillar registered about 3.5 million persons and net assets of 51 million euros.
345

The long-term forecasts for pension expenditure took into account the EUROPOP 2008 demographic forecast, prepared by Eurostat, and the long term macroeconomic forecast of DG ECFIN, as well as the current legislation in force at 1st July 2008. In terms of demography, in the long term, Romania will face major challenges related to ageing population as, despite a life expectancy on the up - to a relatively close level to the EU average, the fertility rate is amongst the lowest in the European Union. The Eurostat demographic forecast for Romania shows a significant decrease of population by 4.6 million persons in 2060 as compared to 2008. The age category composition of the population will be deeply affected: the share of the population at working age (15-64 years) will go significantly down. The number of young population is diminishing, while the share of population over 65 years old will double in 2060. The dependency rate forecast shows a significant deterioration: the share of population over 65 in total population at working age (age 15-64) will grow from 21% in 2008 to 65% in 2060 and the total dependency rate (population under 15 and over 64) as share in GDP is likely to double at the end of the forecasting interval. Under these circumstances, the projected gross pension spending for the statutory pension schemes (PAYG and apecial pension schemes) as a percentage of GDP in the baseline scenario will increase by 9,2 percentage points from 6.6% in 2007 to 15,8% in 2060.
Table 1: Projected gross pension spending, tax on pension and contributions (% of GDP) 2000 2007 2020 2030 2040 2050 2060 Peak year
* Social security pensions 0.7 6.6 9.4 10,4 12,6 14,8 15,8 2060 Old-age and early pensions
0.5 5.3 7,4 8,8 11.2 13,4 14,2 2060
Other Pensions 0.1 1.3 1.5 1.6 1.5 1,5 1,6 2060 Occupational pensions 0.0 0.0 0.0 0.0 0.0 0.0 0.0 : Private pensions 0.0 : : : 0,4 1,3 1,9 2060 Mandatory private 0.0 0.0 : : 0,4 1,3 1,9 2060 Non-Mandatory private
0.0 : : : : : : :
Total pension expenditure
0.7 6.6 8,8 10,4 12.6 14,8 15,8 2060
Taxes on public pensions
0.0 0.002 0.01 0.01 0.01 0.01 0.01 2060
Taxes on private pensions
0.0 : : : : : : :
The pension costs more than double in 2060 due to the indexation formula that link all the pensions to wages and to the accelerating process of aging. According to Eurostat forecast, the share of population over 65 in total population at working age (15-64) will grow from 21% in 2008 to 65% in 2060. Even if now the pension benefit and the share of pension costs in GDP are among the lowest in EU in the future we expect that the number of pensioners will increase due both to life expectancy development and to the high share of ˝young˝ pensioners as the actual legislation is quite permissive in that sense. In 2005-2008 the real retirement age was about 54 year, and less than a half of the PAYG pensioners retired at the statutory retirement age.
The system can not be sustainable in long term as the number of contributors will continue to decrease. In 1990 the number of contributors was over 8 million, in 2008 were
346

registered only 5 million that account for less than a half of active population. The special pensions add another pressure to the general budget as the benefits are in average 3-5 times higher than in PAYG system. Economic old-age dependency ratio will be 3 times higher in 2060 compare to 2008. If nothing changes the pension system will collapse, as there will be no domestic resources for funding it.
Table 2: Projected gross public pension spending: by scheme (as % of GDP) 2000 2007 2020 2030 2040 2050 2060 Peak year *
Total social security pensions
0.7 6.6 8,8 10,4 12,6 14,8 15,8 2060
of which Public sector employees : : : : : : : :
Private sector employees : : : : : : : : Farmers 1,0 0,9 0,1 0,0 0,0 0,0 0,0 2000
Self-employed : : : : : : : : Others(military) 0,6 0,6 0,7 0,8 0,8 0,8 0,9 2060
As by Law there is a unified insurance system there are not specifically data for pension awarded to public sector or private sector employees. There are available data for pension expenditure separately for special schemes (military), farmers and PAYG beneficiaries.
The farmers pension spending will diminish over time as it addressed to a special category of farmers working in co-operatives before 1990. They have never contribute to the social security system and their pension even if increased in the last years represents in 2008 less than half of PAYG pensions. For self employed, the Law specify that they have to close a declaration with House of Pension. According to statistical data by 2007 only about 10% of self employees (if compare to the data of Fiscal administration) joined the insurance system However they declare only a portion of their real earnings and by Law, their contribution relates to minimum ¼ of their declared income, as they pay the entire contribution rate (for employer and employee). When introducing Pillar 2, starting 2008 we have noticed that their share (in number and earnings) increased significantly (from 3.4 million in July 2008 to 4.4 million in July 2009).184 According to special systems law, military, police, intelligence service have a special computation scheme that link the pension to the last salary in a proportion that can vary from 60% to 100% (if they retire after their statutory retirement age: 55 years). Their pensions are paid from the State Budget and as their salaries are higher than the economy average; their pensions are extremely high compare to PAYG average. To these pensions we add other special schemes for magistrates, parliamentary, aeronautic personnel for which State Budget pays the difference from the value computed as percent of their last salary before retirement and the state pension granted by Social Insurance Budget.
184 That is the reason why in our projections we have increased their share so that we start with a share of insured persons in total employment of about 67% and we end with 93% in 2060
347

2.3. Description of main driving forces
This part provides more details about the development of public pension expenditures (Table 3). It uses a standard decomposition of a ratio of pension expenditures to GDP into the dependency, coverage and benefit ratio and an employment rate:
65=
64−15 ×
+×Pension Exp .
GDP Population PopulationWorking People
4 4 4 8+65
4 4 4 7 6 Population
Dependency Ratio4444 84444 7
of PensionersRatio
6Number
Coverage4 4 4
−15 8 4 44
1/76
People×64 Population
Working
REmployment ate444 8444 76
GDPAverage Pension
Benefit Ratio
Note: 'Average pension' = social security pension expenditure divided by the number of pensioners
Table 3 shows results of this decomposition. Table 3: Factors behind the public pension expenditures between 2007 and 2060 (in percentage points
of GDP) 2007-20 2020-30 2030-40 2040-50 2050-60 2007-60
Public pensions to GDP in a starting year *
2,2 1.6 2.2 2,2 1,0 9,2
Dependence ratio 1.6 1.5 3.5 4.0 3.0 13.6 Coverage ratio -1.5 -0.3 - 0.8 -0.9 -1.4 -4.9
1/Employment rate -0.2 0.3 0.3 0.1 -0.2 0.3 Benefit ratio 2.2 0.1 -0.3 -0.6 -0.3 1.7
* The starting year is 2007 for the column 2007-20 and 2020 for the column 2020-30, etc
In contrast, coverage ratio will decrease steadily over time. The main reason should be found in the slow increase of the retirement age, but also structural reasons as the effect of forced retiring in the ailing industry in the late 90's will gradually disappear as well the pensioners coming from co-operatives. So that in early 20's we will see the lowest level of pensioners. In the future the actual non-contributively persons (estimated at 1.5-2.3 million), the majority working in the grey economy will ask for a social aid as they will not be eligible for a public pension. An additional decline in the coverage ratio occurs in later years when the total population is also lowering. Decreasing population has also an impact on number of disability pensions which decline and that of widows’/widowers’ pensions which stagnate. A limited impact on expenditure per GDP will have the employment rate which is projected to slightly increase over the projection horizon. Benefit ratio will remain stable in the outer decades as it is assumed a constant ratio between wages and pensions Benefit ratio increase in the first decade due to increase in the pension point value from 37.5% of average wage in 2007 to 45% of average wage in 2009. Starting late ´30 benefit ratio slightly decrease due to the provision that reduce the PAYG pension proportional to the percent of contribution directed to 2nd Pillar. Replacement rate increase by 7.2 percentage points in 2060 compare to 2007 due to the following factors:_ - the link between point pension (the base to compute pension benefits) and average gross salary (by Law 37,5% in 2007, 45% in October 2008 and until 2060).
348

- increase in contribution period and changes in the structure of pensioners (less disability pension as the most of them are the result of restructuring economic activities in 1990-2002). -the expenditures with farmers pension will continuously decrease up to 0 in 2025, but the military pension that are link to their pay will increase over time. A slight decrease is observed after 2030 because we introduce the effect of reducing the point value due to Pillar 2 pensions (by (28,9-x)/28,9 where x=2% in 2008 up to 6% in 2016 until 2060) proportionally with the age group.
Table 4: Replacement rate and coverage by pension scheme (in %)185 2000 2007 2020 2030 2040 2050 2060
Social security scheme 29.6 36.5 48,4 48,2 46,8 44,6 43,6 Coverage * 100.0 100.0 100.0 100.0 100.0 100.0 100.0
Occupational scheme 0.0 0.0 0.0 0.0 0.0 0.0 0.0 Coverage 0.0 0.0 0.0 0.0 0.0 0.0 0.0
Private scheme 0.0 : : 0,1 1,5 3,8 5,0: Coverage 0.0 : : 1,5 20 40 48
* Coverage of each pension scheme is calculated as a ratio of the number of pensioners within the scheme and the total number of pensioners in the country.
We suppose a strong decrease in the number of pensioners for disability, as in fact the greatest part of them are the result of restructuring economic activities during 1990-2002. The increase in retirement age also contributes to the diminishing trend.
Table 5: Number of pensioners and contributors in the Social security scheme (in 1000), population over 65 and total employment (in 1000) and related ratios (%)
2000 2007 2020 2030 2040 2050 2060 Number of pensioners (I) 6110 5710 5271 5652 6307 6736 6445 Number of people aged 65+ (II)
2961 3204 3631 4060 4890 5613 5916
Ratio of (I) and (II) 206 178 145 139 129 120 109 Number of contributors (III) : 6136 6630 6464 6185 5689 5297 Employment(IV) 9765 8837 8624 7851 6862 5912 5222 Ratio of (III) and (IV) : 69 77 82 90 96 101 Ratio of (III) and (I) 'support ratio'
: 107 126 114 98 84 82
The ratio of pensioners over people aged +65 decrease over time due to increase in retirement age and reducing the number of disability pensions due to aging process with less young people while the number of survivor’s pensions will remain stable.
Due to demographic development characteristic to an ageing population the number of PAYG pensioners will exceed in early ´40 the number of contributors to the system. The support ratio is seen to decrease deeply, by 23 percent in 2060 compare to 2007, even if we suppose a increase in the self employed participation to the system (due to unexpected Pillar 2 participation increase in 2008-2009 that is attributable to this segment). The evolution suggest the urgent need for implementing a sound pension reform, in order to balance the system, by increasing the real retirement age.
185 Coverage of each pension scheme is calculated as a ratio of the number of pensioners within the scheme and the total number of pensioners in the country.
349

2.4 Sensitivity analysis
The sensitivity analysis of the pension expenditure projections was carried using different macroeconomic or demographic assumptions. Each sensitivity scenario was computed in line with the baseline scenario changing only one parameter. The results are synthesized in the table below and show relative low deviations from the baseline. The public pension expenditure include all pensions paid by the general state budget (PAYG pensions, farmer´s pensions and special pensions)
Table 6: Total and public pension expenditures under different scenarios (deviation from baseline
scenario 2007 2020 2030 2040 2050 2060
Total Pension Expenditure Baseline 6.6 8,8 10,8 13,0 16,0 17,6 Higher life expectancy 0,0 0,0 0,1 0,2 0,3 0,4 Higher lab. productivity 0,0 0,0 0,0 0,0 0,0 0,0 Higher interest rate 0,0 0,0 0,0 0,0 0,1 0,2 Higher emp. rate 0,0 -0.1 -0.1 -0,2 -0,2 -0,3 Higher emp. of older workers 0,0 -0,2 -0,3 -0,3 -0,4 -0,4 Zero migration 0,0 0,0 0,0 0,1 0,3 0,5
Public Pension Expenditure Baseline 6.6 8,8 10,4 12,6 14,8 15,8 Higher life expectancy 0,0 0,0 0,1 0,2 0,3 0,3 Higher lab. productivity 0,0 0,0 0,0 0,0 0,0 0,0 Higher interest rate 0,0 0,0 0,0 0,0 0,0 0,0 Higher emp. rate 0,0 -0.1 -0.1 -0,2 -0,2 -0,3 Higher emp. of older workers 0,0 -0,2 -0,3 -0,3 -0,4 -0,4 Zero migration 0,0 0,0 0,0 0,1 0,3 0,5
The results of the 6 scenarios show that in order to lessen the pressure of the ageing costs in the context of a shrinking population, there is a need for policy measures aiming at increase the share of the population at work. An increase of only 1 pp in employment rate, or an increase of 5 pp in older workers employment, reduce the share of public pension spending in GDP by 0.3 percent, respectively 0.4 percent compare to baseline scenario. In contrast a zero migration policy will have sound negative effects in real economy as it implies a reduced labour force, lowering economic growth rates along with increasing pension costs share in GDP. A higher life expectancy leads to increasing the pension expenditure as well the interest rate growth that affects the private pensions.
Higher labour costs have only a marginal effect because the pension benefits increase in line with wages.
350

Slovenia (Report prepared by Dusan Kidric, Tomaz Kraighrt and Slaven Mickovic)
1. Overview of the pension system
1.1. Description of the pension and invalidity insurance
1.1.1. Mandatory pension insurance
Pension and invalidity insurance system in Republic of Slovenia is based on inter-generational contract and is therefore a pay-as-you-go (PAYG) system. The system is also uniform and mandatory for all employed persons and other persons generating certain income from employment or other gainful activity, while inactive persons can join the system voluntarily. They are all included in the compulsory insurance scheme under the same act, i.e. the Pension and Invalidity Insurance Act (ZPIZ-1), and covered by the same insurance provider - the Institute of Pension and Invalidity Insurance of Slovenia (ZPIZ). – Rights Rights provided under the compulsory insurance scheme include:
• rights to pensions (old-age, invalidity, survivor’s, widow/widower’s and partial widow/widower’s pension),
• entitlements under invalidity insurance (for the waiting period and during occupational rehabilitation; during the waiting for reassignment to another appropriate job; due to part-time work; due to a lower salary at some other appropriate job; to a partial invalidity pension; during occupational rehabilitation; for the temporary benefit and disability benefit; reimbursement of travel expenses),
• supplementary rights (assistance and attendance allowance, disability allowance, supplementary allowance to a pension),
• other rights (transitional allowance, maintenance allowance, holiday bonus or the right to a lump-sum yearly bonus) and
• rights under statutory provisions of ZPIZ-1 Act and special laws or regulations (a right to the farmers’ pension under FOAIA (Farmers’ Old-Age Insurance Act), military pensions under the military act, advance pension payments under the act of the Government of the Republic of Slovenia, the right to pensions under special regulations and a right to state pension).
– Financing of the compulsory pension insurance The social security contribution rates are 15.5% and 8.85% of gross wage for insured persons and employers respectively. From the national budget and other sources is paid the difference between the Institute’s revenue from contributions and other sources, and its outgoing. In the projection exercise old-age, invalidity, survivor’s, widow/widower’s and partial widow/widower’s pensions are included. Not included are benefits deriving from rights other than pensions.
351

1.1.2.
1.1.3. Supplementary pension insurance
Supplementary pension insurance was introduced in Slovenia with the pension reform adopted in the year 1999 and enforced in 2000. At the time being Slovenia does not have mandatory (II. pillar) supplementary pension insurance within the meaning of the World Bank classification. There were two kinds of supplementary pension insurance systems that were introduced with the 2000 reform:
• Compulsory supplementary pension insurance: Although the name of this system includes the words “compulsory supplementary” in its essence the system is part of the I. pillar pension insurance. More precisely this system should be called “mandatory” supplementary pension system as its purpose was and still is to replace the old ‘insurance period with increase (bonus)’ and is intended for people working in demanding jobs and professions where due to the specifics of their work they cannot be expected to work until their full retirement age. This system provides certain categories of workers with a right to early retirement and so-called bridging over pension.
• Voluntary supplementary pension insurance: Voluntary supplementary pension insurance represents collecting of funds on personal accounts of persons insured under this form of insurance with the purpose of providing them, upon attaining certain age or in other cases, defined by the pension scheme, with supplementary pensions or other rights stipulated by Pension and Invalidity Insurance Act (ZPIZ-1). Currently 55,35% of all persons insured under mandatory pension insurance are participating also in the voluntary supplementary pension insurance.
ZPIZ-1 sets out two kinds of supplementary pension insurance. First is collective insurance in which workers can be included via their employer that fully or in part finances the pension scheme. Second one is individual insurance where insured person pays contributions for himself. Main Characteristics of the system are: it includes only people insured or claiming rights under mandatory pension insurance, it is based on defined contribution system, worker himself decides whether he wants to be included into collective insurance established by his employer (a precondition of a waiting period no longer than 1 year may be stipulate), gender equality is ensured with regards to the acquisition of the rights, contributor (employer or individual) is entitled to tax relieves for the paid in premiums, an insured person assumes the investment risk with guaranteed returns on the paid-in net voluntary supplementary pension insurance premium. Supplementary pension insurance is established by a pension scheme (plan). Pension scheme (plan) must be approved by the minister, responsible for labour. Only then the contributor to a supplementary pension scheme can claim tax relieves (up to certain limits) for the paid in premiums. Employer forms supplementary pension insurance for his employees by forming a pension scheme (plan) and by setting up a closed – end mutual pension fund or by joining a pension scheme operated by a pension company, insurance company or an open – end mutual pension fund. The pension scheme (plan) has to be formed in conformity with the collective agreement or the contract on the pension scheme formation and signed by the employer and the employee as contractual parties thereto.
352
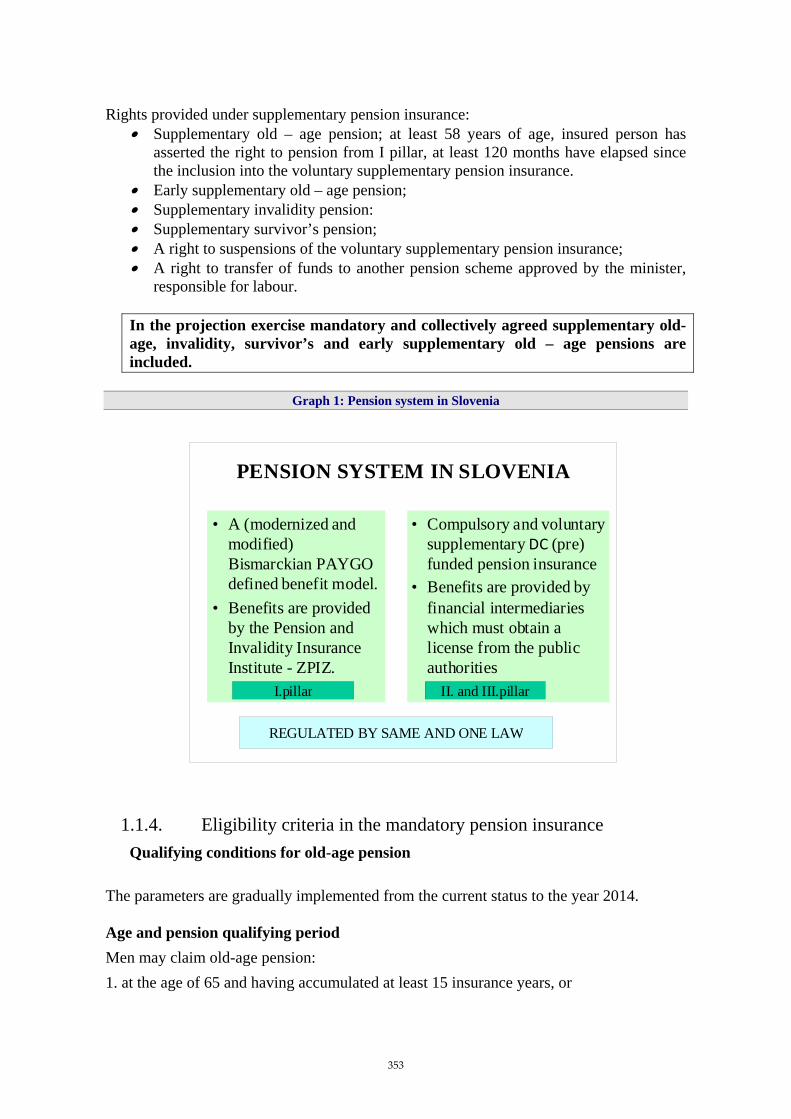
Rights provided under supplementary pension insurance: • Supplementary old – age pension; at least 58 years of age, insured person has
asserted the right to pension from I pillar, at least 120 months have elapsed since the inclusion into the voluntary supplementary pension insurance.
• Early supplementary old – age pension; • Supplementary invalidity pension: • Supplementary survivor’s pension; • A right to suspensions of the voluntary supplementary pension insurance; • A right to transfer of funds to another pension scheme approved by the minister,
responsible for labour. In the projection exercise mandatory and collectively agreed supplementary old-age, invalidity, survivor’s and early supplementary old – age pensions are included.
Graph 1: Pension system in Slovenia
PENSION SYSTEM IN SLOVENIA
• A (modernized andmodified) Bismarckian PAYGOdefined benefit model.
• Benefits are providedby the Pension andInvalidity InsuranceInstitute - ZPIZ.
• Compulsory and voluntary supplementary DC (pre) funded pension insurance
• Benefits are provided by financial intermediaries which must obtain a license from the public authorities
I.pillar II. and III.pillar
REGULATED BY SAME AND ONE LAW
1.1.4. Eligibility criteria in the mandatory pension insurance Qualifying conditions for old-age pension
he parameters are gradually implemented from the current status to the year 2014.
od
T Age and pension qualifying periMen may claim old-age pension: 1. at the age of 65 and having accumulated at least 15 insurance years, or
353

2. at the age of 63 and having accumulated 20 pension qualifying years, or 40 pension qualifying years.
t the age of 63 and having completed at least 15 insurance years but less than 20 years;
years; or
r pension-relevant-eriods which are taken into account in calculation of pension amount.
3. at the age of 58 and having accumulated Women are qualified for old-age pension: 1. aor 2. at the age of 61 and having completed 20 or more pension qualifying3. at the age of 58 and having completed 38 pension qualifying years. Beside the retirement age and pension qualifying periods, there are othep
Graph 2: Periods, nsion calculation which are relevant for pePension qualifying period
an insurance period and a special qualifying period, which serve as a basis for determination of the age conditions for entitlement to pension
Insurance period Special qualifying period
a period in which th by compulsory or voluntary pension and invalidity insurance and periods for which
contributions have been paid
periods taken into account in the pension qualifying period regardless of payment of contributions
e insured person was covered
Purchased period Granted qualifying period
a period during which an insured person was not covered by compulsory or voluntary
ension and invalidity insurance, but which pis taken into account in the insurance period
on condition of payment of contributions
a period during which an insured person was not covered by compulsory pension and invalidity
insurance, but which is taken into account in the assessment (accounting)
period
Years of service
military service study other veterans war victims
Added qualifying period
an insurancenot taking into account the purchased periodsstudies and milita
period
of ry
service or added qualifying period
n of
acquisition of the right to old-age pension
a period during whichan insured person was not covered by insurance but whichis taken into account in determinatiothe pension qualifying period for the
assessment (accounting) period a period taken into account in the determination of total accrual rates for assessment (calculation)
of pension
354
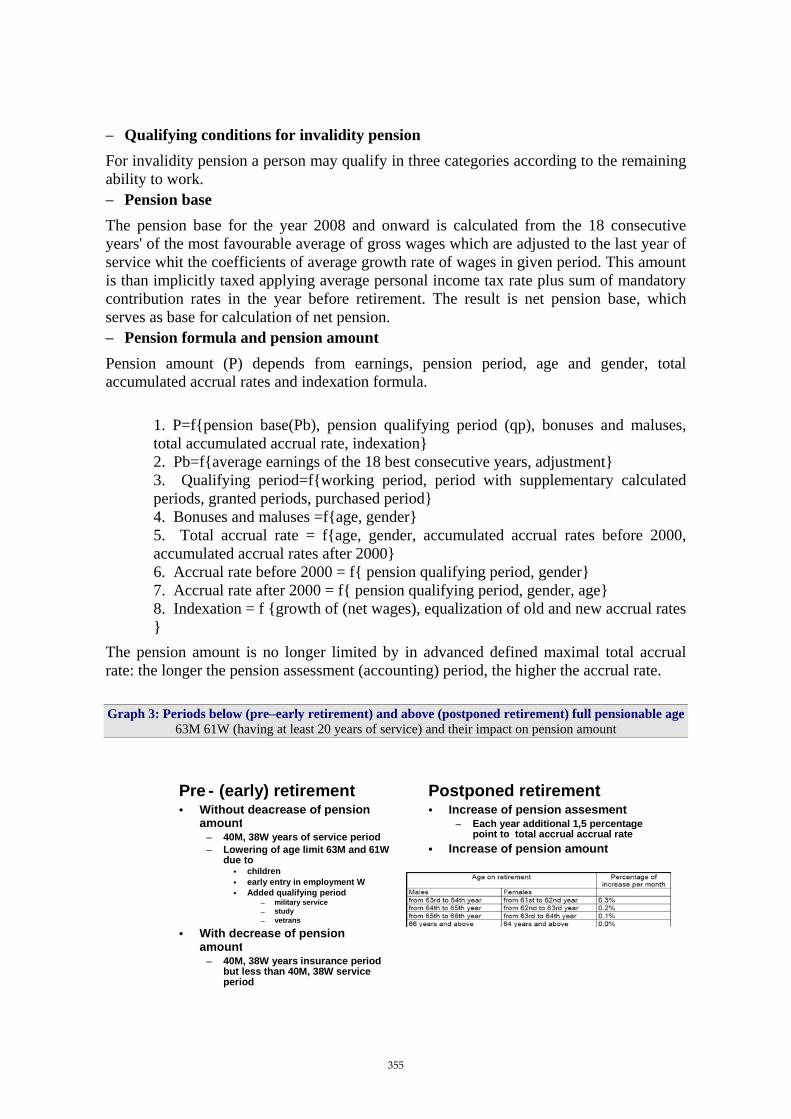
– Qualifying conditions for invalidity pension For invalidity pension a person may qualify in three categories according to the remaining
ent. The result is net pension base, which .
nsion period, age and gender, total ccumulated accrual rates and indexation formula.
g period (qp), bonuses and maluses,
eriod with supplementary calculated }
r, accumulated accrual rates before 2000,
Indexation = f {growth of (net wages), equalization of old and new accrual rates
al te: the longer the pension assessment (accounting) period, the higher the accrual rate.
ability to work. – Pension base The pension base for the year 2008 and onward is calculated from the 18 consecutive years' of the most favourable average of gross wages which are adjusted to the last year of service whit the coefficients of average growth rate of wages in given period. This amount is than implicitly taxed applying average personal income tax rate plus sum of mandatory contribution rates in the year before retiremserves as base for calculation of net pension– Pension formula and pension amount Pension amount (P) depends from earnings, pea
1. P=f{pension base(Pb), pension qualifyintotal accumulated accrual rate, indexation} 2. Pb=f{average earnings of the 18 best consecutive years, adjustment} 3. Qualifying period=f{working period, pperiods, granted periods, purchased period4. Bonuses and maluses =f{age, gender} 5. Total accrual rate = f{age, gendeaccumulated accrual rates after 2000} 6. Accrual rate before 2000 = f{ pension qualifying period, gender} 7. Accrual rate after 2000 = f{ pension qualifying period, gender, age} 8. }
The pension amount is no longer limited by in advanced defined maximal total accrura Graph 3: P onable age eriods below (pre–early retirement) and above (postponed retirement) full pensi
63M 61W (having at least 20 years of service) and their impact on pension amount
Pre - (early) retirement• Without deacrease of pension
amount– 40M, 38W years of service period– Lowering of age limit 63M and 61W
due to • children• early entry in employment W• Added qualifying period
– military service– study– vetrans
• With decrease of pensionamount
– 40M, 38W years insurance periodbut less than 40M, 38W service
Postponed retirement• Increase of pension assesment
period
– Each year additional 1,5 percentage point to total accrual accrual rate
• Increase of pension amount
355

Indexation of pensions and other benefits
mation of the yearly gross wage rate is done in
ccrual rate
This indexation is applied for all pensions, except for those assigned in the current year.
1.2. Recent reforms of the pension system included in the projections
Act) there has not been any major changes in mandatory
border activity of EU based pension providers was incorporated in Slovenian legislation.
1.2.1. Description of the effective constant policy
sions) is performed at a higher level, which also results in a relative pension increase.
2. ension expenditure projections
social security earning related
ic pensions, (farmers, military,
The old-age net pension is indexed
1. Yearly by the same growth rate as it is estimated growth rate of average gross wage in the current year. EstiNovember of the current year.
2. The estimated growth rate is reduced by the coefficient between total accrual rate for man for 40 years of service in year before the current year and total afor man for 40 years of service in the two years before the current year.
Since 2000 reform (ZPIZ-1pension insurance system. Last major change in the legislation governing supplementary pension insurance was enacted in 2006 by the implementation of Directive 2003/41/EC of the European Parliament and of the Council of 3 June 2003 on the activities and supervision of institutions for occupational retirement provision. Some changes were made to the investment policy (among others the preparation of Statement of investment policy) and the provisions on cross
In addition to the Pension and Disability Insurance Act, the pension situation and perspectives are also affected by other regulations. In 2006, Slovenia changed the Personal Income Tax Act, thereby stipulating a different personal income tax scale. The average personal income tax rate decreased and net wages of employees therefore increased. Through the determination of the pension base, the level of pension indexation is linked to the personal income tax rate; when the tax rate changes, the pension base is not adjusted in the same but in the next year. When the personal income tax rate decreases (and net wages increase), pensions do not increase at the same rate and the net replacement rate deteriorates. When the average personal income tax rate increases, the result is reverse; net wages do not increase at the same rate as gross wages and indexation of pensions (which are net pen
P
2.1. Extent of the coverage of the pension schemes in the projections − The country pension model was explicitly projected
pensions and related public pension expenditures. • Not included are non-earning related publ
national) and supplements to the pensions
356
− Beside those, the questionnaire also includes private voluntary pensions, which comprise supplementary pensions: mandatory supplementary pensions, private collective agreed supplementary pensions and private individual supplementary
neutrality). Even though the indexation rule is relatively
al rate. he expected development of occupational and non-mandatory private pension
pensions
2.2. Overview of projection results − Given that there were no major changes in the pension system in the period
between 2005 and 2008 and that the parameters remained the same as in the period to 2005, the projection of gross public pension expenditure is very similar to that from 2005. As measured by its share of GDP, expenditure increased by around 8 p.p. The starting year (2007) is lower than projected due to the lower growth of wages compared with the productivity growth, which, given the pension indexation formula, had a similar effect as if pensions had been indexed at a lower growth rate than wages. In the total period to 2060, wages were assumed to grow at the same rate as pensions (with the exception of the reduction of the indexation coefficient due to the rule that the pensions of newly retired pensioners whose parameters are less favourable should not differ from the existing pensions – the principle of actuarialfavourable for pensioners, the net replacement rate decreases due to a drop in the annual accru
Tspending to GDP.
− The projected 70% participation of the active population until 2030 in voluntary insurance schemes represents the increase of the present participation for approximately 20 p.points. In the projection it is supposed that newly employed will join voluntary insurance schemes more frequently as it is now. the cap of approximately of 70 % is given while the share of lower wage earner will prevent 100% inclusion. The basic assumptions for the development of other elements of the voluntary pension insurance schemes remained the same:, premiums increase
ectly, while the number e to double-counting, though
annually according to the growth of wages (the model and its assumptions are shown separately).
− The first supplementary pensions will be payable in 2011. The volume of payments is low and will only reach 0.77% of GDP until 2060. The data on the voluntary insurance are presented as a non-mandatory private scheme because the databases do not support separate presentations and projections. The volume of mandatory private pension schemes accounts for around 7% of all voluntary insurance. In the assets, the starting point is presented corrof the insured persons is somewhat overestimated duit does not have any impact on the estimated expenditure.
The expected development of taxes on pensions to GDP. − As Slovenian pensioners receive net pensions (the implicit taxation is made when
fixing the pension base), no taxes are calculated for pensions under the public scheme. Taxes on non-mandatory private pensions were calculated under the assumption that annuities are taxed at the last personal income tax rate in force. As the expenditure for voluntary pensions is only projected to account for 0.77% of GDP in 2060, and even less before that year, the amount of taxes and their share are insignificant as well. The share is shown in the questionnaire.
357

Table 1: Projected gr ensi end x o ion ntr ns (oss p on sp ing, ta n pens and co ibutio % of GDP)
2000 2007 2020 2030 2040 2050 2060 Peak year[1]
Social security 13,2710,91% 9,85% 11,09% % 16,12% 18,19% 18,62% 2060 pensions
7,4 7,01% 8,4 10,44% 12,93% 14,70% 15,05% Old-age and early pensions
7% 4% 2060
Other Pensions 3,44% 2,84% 2,66% 2,83% 3,20% 3,49% 3,57% 2060
Occupational pe nsions
Private pensions 0,00% 0,00% 0,08% 0,26% 0,48% 0,69% 0,78% 2060
Mandatory private 0,00% 0,00% 0,00% 0,00% 0,00% 0,00% 0,00%
Non-Mandatory private 0,00% 0,00% 0,08% 0,26% 0,48% 0,69% 0,78% 2060
Total pension expenditure 10,91% 9,85% 11,17% 13,52% 16,61% 18,88% 19,40% 2060
2.3. Description of main driving forces behind the projection results and their implications for main items from a pension questionnaire
The main driving forces behind the ratio of public pension expenditures to GDP etween 2007 and 2050 and during specific sub periods.
ent ratio186, we should raise
res), the benefit ratio would not have to be additionally reduced in this period.
dual and not yet allocated state assets were earmarked to finance pensions as well.
b
− The main factor behind the ratio of public pension expenditures remains dependency ratio. Only for the period after 2050 we can observe a slight prevalence of the coverage ratio. If the decrease in the benefit ratio and the coverage ratio did not have a reversed impact in this period, the increase in expenditure would be even more pronounced. The dependency ratio reflects the unfavorable demographic structure and cannot be improved with Slovenia’s own population in this period. In the period 2007–20, the weight of the dependency ratio is already decreasing, but the dependency ratio still has the most important share. Since the employment potential will be largely exhausted already in the first period, given the projected high employmemployment by increasing the retirement age.
− In the period until 2020, a greater coverage ratio also had a large impact on closing the gap between the expenditure level in this period and the initial expenditure level (0.90 ppt. together with the employment ratio). If we increased the coverage ratio and the employment ratio even more in this period (through appropriate policy measu
− In the whole period until 2060, the relative weight of impact of the dependency ratio can only be reduced with a significant decrease of the coverage ratio and increase of employment ratio. The benefit ratio is on the limit where it poses a social problem yet, even though the indexation mechanism looks favourable for pensioners. Further decreases of the benefit ratio as a result of more restrictive indexation formula could only be envisaged if assets from indivi
186 The overview of projection of activity and retirement is given on the page 21 of country fiche.
358

Table 2: Factors behind the public pension exp between 2007 and 2060 (in percentage points enditures
of GDP) 2007-20 2020-30 2030-40 2040-50 2050-60 2008-60
Difference to the starting year 2007 (in ppt)
1,13 2,18 2,88 2,09 0,44 8,61
Dependence ratio 3,17 2,39 2,72 1,99 0,12 10,24
Coverage ratio -0,96 0,08 0,06 0,37 0,28 -0,15
1/Employment rate -0,33 0,08 0,11 -0,24 0,03 -0,31
Benefit ratio -0,75 -0,37 -0,01 -0,03 0,01 -1,18
As already explained in the description of the model, in Slovenia it is only possible to make a projection for the average net replacement rate (net average pension divided by net average net wage). The decrease in the average net replacement rate is a result of the relatively favourable indexation and the applied principle of actuarial neutrality. The profile of pensions by years will also increase in the future, which an assumption is made
over is too small. Therefore they do not play the role of the omplementary benefit.
on the basis of the expected retirement of the insured with a better wage record. Private pension schemes provide insufficient supplementary pensions and the share of the active population they cc
Table 3: Re ment nd co e by pension sch %place rate a verag eme (in )187 2000 2007 2020 2030 2040 2050 2060
Social security scheme 68,10% 63,61% 57,68% 55,48% 56,01% 56,40% 56,83%
Coverage 100,00% 100,00% 100,00% 100,00% 100,00% 100,00% 100,00%
Occupational scheme
Coverage
Private scheme
1,85% 2,34% 2,84% 3,25% 3,52%
Coverage
59,87% 76,98% 74,99% 74,38% 74,72% 74,43%
− The principle of the average increases in gender- and age-specific retirement ratios
by pension categories over the last five years used in the projection of the number of pensioners (see forward) signifies a reduction in disability and old-age pension ratios up to the age of 64 for both genders, as well as in family pension ratios at the age of 75 and over for women, while family pension ratios for other age groups and ratios for widow’s and state pensions for women, as well as for family adult’s, widow’s and state pensions for men are expected to remain more or less at
187 Coverage of each pension scheme is calculated as a ratio of the number of pensioners within the scheme and the total number of pensioners in the country.
359

the present level. Due to the aforementioned principle of residuality, the old-age pension ratios after the age of 65 for women should more or less increase (a higher number of old-age and a lower number of disability, family and widow’s pensions as a result of high employment and a better education structure of women), while for men they are expected to first increase and then stabilize, at the age up to 69 somewhat below and at the age of 70 and over at approximately the
7, while
tors is hardly sustainable and demands further changes in the retirement policy.
present level. − As a consequence of such retirement ratio dynamics and in line with the
population projection predicting a drop in the number of people in younger and a rise in the number of people in older age groups, the number of disability pensions is expected to decline more or less steadily in the future, while the number of widow’s pensions will steadily increase (as a result of the increase in the old population with more or less unchanged ratios). Due to the decline in the ratios for women, the number of family pensions is expected first to decline and then rise slowly again due to the increase in the number of women aged over 65. The numbers of old-age pensioners expected to increase at a somewhat slower rate than the population group aged 65 and over. Because of assumed direct proportionality with relatively low employment rates given by Commission, the number of contributors is supposed to be more or less constantly declining to rich a level which will be in the year 2060 about 30 percents lower than in 200the number of social security pensioner will be about 50 percents higher.
− The contributor to pensioners ratio will be lower than 1 (one). On our opinion, the situation when the number of pensioners would be higher than the number of contribu
Table 4: Number 1000), population of pensioners and contributors in the Social security scheme (in over 6 total ymen )5 and emplo t (in 1000) and related ratios (%
2000 2007 2020 2030 2040 2050 2060
Number of pensioners 467.448 518.805 609.742 688.273 754.441 769.352 729.729(I)
Number of people aged 278.230 319.631 420.217 511.533 569.366 610.430 594.70365+ (II)
Ratio of (I) and (II) 168,01% 162,31% 145,10% 134,55% 132,51% 126,03% 122,70%
Number of contributors 839.381 878.205 875.022 805.871 733.509 666.179 619.867(III)
Employment (IV) 901.000 976.513 962.123 886.657 807.147 731.849 679.297
Ratio of (III) and (IV) 93,16% 89,93% 90,95% 90,89% 90,88% 91,03% 91,25%
Ratio of (III) and (I) 'support ratio' 1,80 1,69 1,44 1,17 0,97 0,87 0,85
− Slovenia introduced capital-funded voluntary pension insurance schemes in 2000.
Since then the persons insured under compulsory pension insurance schemes can participate in voluntary insurance schemes; for those who perform heavy work and work which is harmful to health participation is mandatory. The first annuities from the voluntary insurance will be payable in 2011. The assets and liabilities of
360

the voluntary insurance schemes are shown in the questionnaire. The volume of assets increases rapidly, for the number of insured persons rises and the annuities
nd cannot compensate for the shortfall of financial resources for public pensions.
are not payable yet. − Other resources available for the public pension scheme are part of the assets
received by a special fund in the process of the privatization of state-owned assets. For the starting year the projection uses data on the volume of assets in this fund. They are projected to increase at a 3% rate a year until 2006. The projection does not foresee drawing from this fund, as no decision has yet been made to this end. However, the assets from this “reserve demographic fund” are low a
Table 5 ts of pen unds eserv of G: Asse sion f and r es, (% DP) 2000 0 0 0 2007 202 203 204 2050 2060
Publi 6,9% 6,6% 7,7% 9,7% 12,1% 14,7% c Pension funds :
Of which liquid financial assets, non-consolidated
: : : : : : :
Of assets, consolidated
: 6,9% 6,6% 7,7% 9,7% 12,1% 14,7% which liquid financial
Occupational pensions : : : : : : :
Private pensions : 3,6% 12,2% 18,0% 22,7% 25,9% 27,2%
All pensions : 10,4% 18,8% 25,7% 32,3% 38,0% 41,9%
Ta A pension funds and reserves, (GDP IN MILLIONS €) ble 6: ssets of
GDP IN MILLIONS € 33.541 51.021,4 58.79 63.4 68.26 75.100 07
,8 7,7 16,3 4,1 35,5 20 20 2020 2030 2040 2050 2060
Public Pension funds : 2.308,7 3.390,5 4.556,5 6.123,6 8.229,6 11.059,8
Of assets, consolidated
: 2.308,7 3.390,5 4.556,5 6.123,6 8.229,6 11.059,8 which liquid financial
Private pensions : 1.191,6 6.225,6 10.575,9 14.377,7 17.689,4 20.448,3
All pensions : 3.500,3 9.616,1 15.132,4 20.501,3 25.919,0 31.508,1
2.4. Sensitivity analysis
In the period from 2008 ll 2020 the reduction of the stock of pension payment is 7,41%.
The built-in mechanisms in the pension formula and other pension regulation in the ongoing reform (see sub chapter “Reforms incorporated in the model” in the part 3) partially compensate the increase in the number of pensioners. The main effect is due to the instrument of actuarial neutrality in which the reduction of all pension is enacted by the coefficient between accrual rate for 40 years pension period for man in the given year divided by accrual rate for 40 years pension period for man in the precedent year. The yearly indexation reduction factor from 2008 on is in the first year is 0,993865 which correspond to 0,61% of indexation and it is increasing each year.ti
361

Table 7: Total and public pension expenditures under different scenarios (deviation from baseline scenario) (% of GDP)
in millions € 2007 2020 2030 2040 2050 2060
Total Pension Expenditure
Baseline 3.304,6 5.700,0 7.951,9 10.532,0 12.888,8 14.573,2
Higher life expectancy 3.304,6 5.719,6 8.021,4 10.696,6 13.190,3 15.030,5
Higher lab. productivity 3.304,6 5.852,6 8.360,2 11.334,5 14.196,1 16.430,7
Zero migration scenario 3.304,6 5.671,6 7.886,1 10.366,1 12.454,6 13.707,8
Higher emp. rate 3.304,6 5.701,7 7.969,2 10.560,1 12.925,3 14.613,2
Higher emp. of older workers 3.304,6 5.717,5 8.080,6 10.732,6 13.148,4 14.865,9
Public Pension Expenditure
Baseline 3.304,6 5.659,4 7.801,8 10.225,1 12.415,9 13.990,9
Higher life expectancy 3.304,6 5.679,0 7.871,3 10.389,7 12.717,5 14.448,2
Higher lab. productivity 3.304,6 5.812,0 8.210,1 11.027,6 13.723,3 15.848,5
Zero migration scenario 3.304,6 5.631,0 7.736,1 10.059,2 11.981,7 13.125,6
Higher emp. rate 3.304,6 5.661,1 7.819,1 10.253,2 12.452,5 14.030,9
Higher emp. of older workers 3.304,6 5.676,9 7.930,5 10.425,7 12.675,6 14.283,6
Table 8: Total and public pension expenditures under different scenarios (deviation from baseline scenario) (in millions €)
% GDP 2007 2020 2030 2040 2050 2060
Total Pension Expenditure
Baseline 9,85% 11,17% 13,52% 16,61% 18,88% 19,40%
Higher life expectancy 0,00 0,04 0,11 0,24 0,41 0,57 Higher lab. productivity 0,00 0,00 -0,02 -0,04 -0,08 -0,11 Zero migration scenario 0,00 0,28 0,74 1,54 2,52 3,19 Higher emp. rate 0,00 -0,15 -0,15 -0,18 -0,20 -0,21 Higher emp. of older workers 0,00 -0,13 0,01 0,02 0,08 0,12
Public Pension Expenditure
Baseline 9,85% 11,09% 13,27% 16,12% 18,19% 18,62%
Higher life expectancy 0,00 0,04 0,11 0,24 0,41 0,57 Higher lab. productivity 0,00 0,00 0,00 -0,01 -0,01 -0,02 Zero migration scenario 0,00 0,28 0,72 1,49 2,40 3,00 Higher emp. rate 0,00 -0,14 -0,15 -0,18 -0,19 -0,20 Higher emp. of older workers 0,00 -0,13 0,01 0,03 0,09 0,13 GDP (millions of €) 33.541,8 51.020,9 58.795,4 63.412,4 68.260,9 75.132,6 Higher life expectancy 33.541,8 51.035,1 58.840,9 63.491,6 68.368,7 75.266,8 Higher lab. productivity 33.541,8 52.399,1 61.888,6 68.423,3 75.503,3 85.184,9 Zero migration scenario 33.541,8 49.533,5 55.291,3 57.121,7 58.207,3 60.696,9 Higher emp. rate 33.541,8 51.712,3 59.600,1 64.289,7 69.189,3 76.157,0 Higher emp. of older workers 33.541,8 51.778,2 59.707,2 64.526,9 69.352,6 76.187,6
362

2.5. Description of the changes in comparison with the 2001 and 2006 projections
Table 9: Decomposition of the change (in %) in public pension expenditure to GDP between 2007 and 2050 under the 2001, 2006 and 2009 projection exercises
% Change 2007- 2050
Dependence ratio
Coverage ratio
Employment rate
Benefit ratio
Pension/GDP – 2006[1] 6,5 8,9 0,1 -0,6 -1,9 Pension/GDP - 2009 8,3 10,3 -0,45 -0,38 -1,15
As no major changes in the pension regulation were enacted in the period from 2004, all changes in comparison with the 2006 projection were described in the precedent chapters.
363

Slovakia (Report prepared by Marek Porubsky)
1. Overview of the pension system
Slovak pension system consists of three pillars. Currently, the first pillar is the fundamental part, providing old age, disability, survivor and orphan benefits. It is a mandatory, pay-as-you-go (PAYG), defined benefit and earning related pension scheme run by the government. In an effort to decrease pension costs in the long run, the government introduced the second pillar in January 2005. It is a fully funded, defined contribution, privately managed188 pension scheme. Within the transitory period (from January 2005 until June 2006), people participating in the first pillar could decide to join the fully funded pillar (mixed pension scheme). In that period those who entered the labour market for the first time, the fully funded pillar was mandatory with no possibility to opt out. However, this is no longer true as government decided to adopt fundamental changes regarding the second pillar in 2008:
• temporary opening up of the second pillar during the first half of 2008 – within the transitory period from 1 January 2008 to 30 June 2008, it was possible for all participants to leave the fully funded pillar. At the same time, however, the individuals who did not yet participate in the fully funded pillar were allowed to join it
• the minimum period of participation to become entitled for pension benefits from both PAYG and fully funded pillar has been extended from 10 to 15 years
• second pillar became voluntary for newcomers to the labour market, with the default participation only in the PAYG system i.e. in order to participate in the second pillar, individual must send the application within six month since his/her first entry into the labour market
The third pillar was introduced in 1996 as a supplementary part of the pension system. It is a voluntary, fully funded, contribution defined, privately managed pension scheme. Participation in the third pillar is supported by tax incentives in the form of tax allowance. The third pillar is, due to lack of data not covered in the long-term pension projection.
Table 1: Three pillars of the Slovak pension system
1st pillar Mandatory Reformed PAYG–defined benefit system (earnings related)
2nd pillar Originally mandatory for new workers, currently voluntary Fully Funded Pension scheme
3rd pillar Voluntary Supplementary Pension scheme + other financial products
1.1. Pension contributions
Pension contributions are levied as a percentage of the individual’s gross wage189 up to a ceiling190 of four times the average wage in the economy. These contributions are tax 188 Five private pension companies. 189 In the whole document we use the term assessment base.
364

exempted191, as Slovakia does not tax either pension contributions or pension benefits to/from the first and the second pillar. The sum of individual’s pension contributions is the same regardless of whether he/she participates in the mixed (in both first and second pillar) or solely in PAYG pension scheme. The introduction of the funded pillar in the beginning of 2005 has only split the first pillar employer’s contribution (14 percent) into a portion that goes to the public system (5%) and a portion that goes to a private fund (9%)192.
Table 2: Pension contributions (% of gross wage) pay-as-you-go scheme mixed pension scheme
Paid by employer 21.75 21.75 Pension insurance 17.00 17.00
- old age insurance1 14.00 5.00 to PAYG
9.00 to funded pillar - disability insurance 3.00 3.00 Reserve fund2 4.75 4.75 Paid by employee 7.00 7.00 Pension insurance 7.00 7.00 - old age insurance* 4.00 4.00 - disability insurance 3.00 3.00 Total 28.75 28.75
1The employer is required to pay 5% to PAYG on behalf of employees who join funded pillar and the remaining 9% will flow to 2nd pillar
In January 2008, the maximum assessment base was increased from three to four times the average wage in the economy. In spite of the fact that the system is earning related, no additional pension rights from first pillar will result from this measure in future – only second pillar pensions will be affected as more savings will accumulate. Participants in the second pillar can choose to invest their contributions into three possible funds – conservative, balanced and equity fund. The whole system is strongly regulated (more investing restrictions compared to e.g. mutual funds) and the supervision is carried out by the Central bank. Moreover, at least 15 years before reaching statutory retirement age all accumulated savings in the equity fund must be transferred either to conservative or balanced fund. Similarly, 7 years before reaching statutory retirement age all savings and contributions must be placed in the conservative fund.
1.2. Statutory retirement age and early retirement
Until 2003 the retirement age was 60 years for men and 53-57 years for women (depending on the number of children). As of 2004 the retirement age is gradually converging to 62 for both men and women. The common retirement age of 62 years for all groups will be reached in 2025.
190 Maximum assessment base. 191 Only the third pillar is EET scheme, i.e. benefits are taxed. 192 For those who participate in the mixed pension system.
365

Graph 1: Statutory retirement age in Slovakia
52
53
54
55
56
57
58
59
60
61
62
63
2000
2001
2002
2003
2004
2005
2006
2007
2008
2009
2010
2011
2012
2013
2014
2015
2016
2017
2018
2019
2020
2021
2022
2023
2024
2025
2026
2027
2028
2029
2030
MENWOMEN - no childWOMEN - 1 childWOMEN - 2 childrenWOMEN - 3 -4 childrenWOMEN - 5 children and more
Pensioners are allowed to retire before reaching the statutory retirement age. In that case, the old-age pension is reduced by 6% per year193. On the other hand the pension is increased by 6% per year for every additional working year above the retirement age. As in the recent years (since its introduction in 2004) early retirement was used excessively, stricter rules regarding early pension entitlements were adopted more recently. Since January 2008, it is not possible to be entitled for the early old age pension more than two years before reaching the statutory retirement age.
1.3. Pension benefit calculation
The old-age benefit from first pillar is based on a point system i.e. earnings related principle. Three variables determine the old age pension benefit – length of career in years, average personal wage point which is basically the individuals average lifetime position relatively to average wage in the economy (according to law cannot exceed the value of 3194) and current point value. Current point value was initially (at the time of PAYG reform in 2004) calculated as a residual so as a person with 40 years of service and average personal wage point equal to 1 (person earning average wage for the whole career) will receive pension with circa 50% replacement rate. In order to keep the replacement rate stable for all new pensioners, the current point value is annually indexed to average wage increase. More details about the pension formulas are provided in the annex. Disability pensions are calculated similarly as old age pensions. The disability pensioner is given credit for all the years between the time of disability and the statutory retirement age. Widow and widower benefits are based on 60 percent of the pension that the worker would have been entitled to at the time of death or 60 percent of the pension that the worker had already been receiving. Orphan’s pensions are given to children who have lost a parent and who are under the age of 26, and attending school or preparing for their profession. Orphan’s benefits are 40 percent of the pension benefits, which would have been awarded to the worker. They were 193 More specifically, in the law the „malus“ is defined as 0.5% for every 30 days below the retirement age (i.e. if one retires 61 days before reaching the statutory retirement age, his/her pension is lower by 1.5%). 194 This originally reflected that the assessment base ceiling was 3 times the average wage. Increase in the ceiling to 4 times the average wage in 2008 has not led to change in the limit on average personal wage point.
366

increased from 30 to 40 percent in August 2006. The sum of widow and orphans’ benefits cannot exceed 100 percent of the pension. Minimum pension benefits There is no direct restriction on the minimum amount of pension benefits. The system limits the minimum pension benefits only indirectly - through the definition of the minimum assessment base for paying contributions. Since minimum insurable earnings are equal to minimum wage which is approximately 40 percent of average wage, an individual can generally earn no less than 0.4 point per year of contribution, so that after 40 years of contributions, the pension would then be half of the minimum wage. If an individual contributes fewer years, the pension will be significantly less than half of the minimum wage. However, individual’s earnings pensions as well as those who do not qualify for pensions may apply for social assistance which is provided at the minimum subsistence level, which is about 2/3 of minimum wage. Social assistance expenditures are included in the long-term projections. Pension benefits in the mixed system (first and second pillar) In the mixed system, first pillar pension benefits are calculated with the same formula as for those solely from the PAYG system. However, pension entitlements are reduced by 50% for those years in the mixed system195 (since also 50% of pension contributions were not PAYG revenue in those years). The funded system requires that pensioner’s life annuity must be at least equal to 60 percent of the subsistence minimum. The rest of the account (if any) may be withdrawn either as a lump sum or in the form of a programmed withdrawal.
1.4. Pension indexation
Since 2004, pension benefits in Slovakia are indexed by the Swiss formula – i.e. 50 percent of inflation growth and 50 percent of nominal wage growth. From the point of view of long-term projections we think that it is reasonable to assume that Swiss formula will hold. Since 2009, the indexation date will be changed from July 1st to January 1st – which leads to two indexations within 6 months in this particular year.
1.5. Summary of main legislative changes compared to 2006 projection round
Revenue side of the first pillar • Increase of the pension contributions assessment base ceiling – from 3 to 4 times
the average wage (2008) • Opening of the second pillar (January 2008 - June 2008) – hundred thousand
individuals196 returned back to solely one pillar system during this period • Change in the minimum required contributory period from 10 to 15 years (2008) –
this measure affected mostly older participants of the second pillar as it created incentives for this group to return back to one pillar scheme during the aforementioned temporary opening of the second pillar
195 If an individual participated in the mixed system 30 years out of his/her 40 year working career, his/her pension entitlements for the public pension (first pillar) will be reduced by 50% in those particular 30 years. 196 Out of 1.5 million.
367

• Change in the character of the second pillar from mandatory to voluntary for new labour market entrants (2008)
Expenditure side of the first pillar
• Change in the date of pension indexation (2009) – increase of expenditures • Opening of the second pillar (January 2008 - June 2008) – with the return of
individuals, their accumulated savings were transferred to first pillar. This also means retrieving back full accrued rights from PAYG for pension benefits in the future (their accrued rights are exactly the same as if they never switched to mixed pension system)
• Introduction of an age limit concerning the early old age benefit entitlement – not earlier than 2 years before reaching statutory retirement age (2008)
• Increase of the orphan benefits from 30 to 40 percent of the pension benefits which would have been awarded to the worker (2006)
2. Pension expenditure projections
2.1. The extent of the coverage of the pension schemes in the projections
Long-term pension projections cover nearly 100% of pension expenditures in Slovakia i.e. old age, disability and survivor pensions both from the first and from the second pillar. Similarly as in the previous round of projections, the third pillar is not included in the projections because of data unavailability. On the other hand, compared to the previous round, social assistance expenditures (state budget expenditures) have been included.
2.2. Overview of projection results
Public pension expenditure (first pillar) in Slovakia is projected to rise from 6.8% of GDP in 2007197 to 10.2% of GDP in 2060 (by 3.4% of GDP) over the period 2007-2060. This relatively modest increase is mainly due to pension reforms adopted in 2004 (parametrical reform of PAYG) and 2005 (introduction of the fully funded second pillar).
197 Including social assistance benefits.
368

Graph 2: Pension expenditure as % of GDP – first and second pillar
0123456789
10111213
2007
2009
2011
2013
2015
2017
2019
2021
2023
2025
2027
2029
2031
2033
2035
2037
2039
2041
2043
2045
2047
2049
2051
2053
2055
2057
2059
second pillar - fully fundedfirst pillar - PAYG
Source: Financial Policy Institute
Expenditures of the second pillar will gradually grow as participants of the mixed scheme start reaching retirement age. First pensions from the funded pillar are expected to be paid in year 2020 as the minimum required contributory period is 15 years (this condition was changed in 2008 from 10 years). During the period 2007-2020 public pension spending as a % of GDP will decrease due to increase in statutory retirement age from 60 to 62 for males and from 53-57 (depending on number of children raised) to 62 for females. Another reason which contributes to decrease of pension to GDP ratio is the economic growth which will be higher compared to increase of pension expenditure. This results implicitly from the indexation formula as pensions are indexed only partially to real wages (50%)198.
Table 3: Projected gross pension spending, tax on pension and contributions (% of GDP) 2007 2020 2030 2040 2050 2060 Peak
year1 Social security pensions 6.8 6.3 7.3 8.3 9.4 10.2 2060 Old-age and early pensions 4.3 3.6 4.1 4.8 5.6 6.2 2060
Other Pensions 2.5 2.7 3.2 3.5 3.8 4.1 2060 Occupational pensions 0.0 0.0 0.0 0.0 0.0 0.0 : Private pensions 0.0 0.1 0.5 1.0 1.7 2.2 2060 Mandatory private 0.0 0.1 0.5 1.0 1.7 2.2 2060 Non-Mandatory private : : : : : : : Total pension expenditure 6.8 6.5 7.8 9.3 11.1 12.4 2060 Taxes on public pensions 0.0 0.0 0.0 0.0 0.0 0.0 : Taxes on private pensions 0.0 0.0 0.0 0.0 0.0 0.0 : Social security revenue decrease2 1.0 1.4 1.6 1.7 1.7 1.8 2060
1 This column represents a Peak year, i.e. the year in which the particular variable reaches its maximum over the interval 2000 to 2060 2 Revenue decline due to second pillar introduction i.e. redirecting part of social security revenue to fully funded pension scheme outside GG sector
Pension benefits (also pension contributions) both from the first and the second pillar are exempted from personal income tax. Thus tax revenue increase from rising pensions is zero.
198 Swiss formula for pension benefits indexation: indexation = 0.5w + 0.5i as w ≈ r + i then : indexation ≈ 0.5r + i w – average nominal wage growth, r – average real wage growth, i – inflation growth as measured by CPI.
369

Transformation costs resulting from introduction of the fully funded pillar According to the assumptions of the AWG, pension contributions to GDP remain constant over the projected period. However if a country introduces fully funded scheme redirecting part of existing pension contributions (PAYG) to private pension funds, it will face transition cost. Thus when assessing the long-term impacts of fully funded pillar introduction in Slovakia, revenues decline resulting from redirecting part of the first pillar pension contributions to private pension funds has to be included as well. Graph 3 : Transformation costs and benefits in
particular year Graph 4: Cumulative impact of introduction fully
funded pension pillar
-4,5%
-4,0%
-3,5%
-3,0%
-2,5%
-2,0%
-1,5%
-1,0%
-0,5%
0,0%
2007
2009
2011
2013
2015
2017
2019
2021
2023
2025
2027
2029
2031
2033
2035
2037
2039
2041
2043
2045
2047
2049
2051
2053
2055
2057
2059
-50%
-45%
-40%
-35%
-30%
-25%
-20%
-15%
-10%
-5%
0%
2007
2009
2011
2013
2015
2017
2019
2021
2023
2025
2027
2029
2031
2033
2035
2037
2039
2041
2043
2045
2047
2049
2051
2053
2055
2057
2059
decrease of PAYG expendituresdecrease of PAYG revenuestransformation costs
transformation benefits
cumulative transformation costs (real interest rate of 3%)
cumulative trasformation costs - without interests
Source: Financial Policy Institute Source: Financial Policy Institute
Because of the fully funded pillar introduction in 2005, first pillar revenues have declined by 1% of GDP on an annual basis. Since more people will participate in the fully funded pillar199 in the future, the above-mentioned revenue decline will be around 1.8% of GDP in 2060. At the same time, pension entitlements from the first pillar will gradually decline, as the funded scheme will grow. Hence, comparing both revenue and expenditure losses of the first pillar, we can calculate the overall impact (costs and benefits) of the fully funded pillar introduction. However, cumulative transformation benefits will outweigh transformation costs after 2100.
2.3. Description of the main driving forces behind the projection results and their implications for the main items from the pension questionnaire
This part provides more details about the main driving forces of pension expenditures as a percent of GDP based on its breakdown into four indicators: dependency ratio, coverage ratio, employment rate and benefit ratio.
444 8444 76444 8444 764444 84444 76444 8444 76 RatioBenefitRateEmploymentRatioCoverageRatioDependency
PeopleWorkingGDP
PensionAveragePeopleWorking
PopulationPopulation
PensionersofNumberPopulationPopulation
GDPExpPension ×−×
+×
−+=
/1
6415656415
65.
Note: 'Average pension' = social security pension expenditure divided by the number of pensioners
199 As in 2008 the character of second pillar changed from mandatory to voluntary for newcomers on the labour market, in our projections we assumed 95% entry rate (instead of 100% entry rate used in the previous round of pension projections in 2006).
370

Demography Over the projected horizon, the main and single driving force of public pension expenditures increase is the demographic development i.e. growth of dependency ratio as shown in table 3. This is mainly due to the projected rise in life expectancy and a low fertility rate. All other indicators have positive impact and mitigate the negative effects of demographic development. Increase of the statutory retirement age and rise in the effective retirement age As already mentioned before, over the period 2007-2020 public pension spending will decrease due to increase in statutory retirement age. This is reflected both in the coverage ratio and employment rate as less people will retire and thus remain in the labour market. Catching up with the developed countries Slovakia still has a relatively high unemployment rate. Because of the catching up with developed countries employment rate and GDP is expected to grow faster – especially in the 2007-2020 period. Higher GDP then pushes down the pension expenditure to GDP ratio as shown in table 3. Introduction of fully funded pillar and pension indexation Positive impact of the fully funded pillar together with the impact of the indexation is reflected in the gradual decline of the benefit ratio. Because existing pensions are indexed to 50% of real wages growth, the pension expenditures as a percentage of GDP will decline. At the same time with the increased importance of the second pillar, the first pillar’s pension expenditure will decrease. Table 4: Factors behind the public pension expenditures between 2007 and 2060 (in percentage points
of GDP) 2007-20 2020-30 2030-40 2040-50 2050-60 2007-60
Public pensions to GDP in a starting year * -0.5 1.0 1.0 1.1 0.8 3.4
Dependence ratio 2.7 2.2 1.7 3.0 2.1 11.7 Coverage ratio -1.6 -0.7 -0.2 -0.8 -0.6 -3.9
1/Employment rate -0.7 0.0 0.2 0.0 -0.1 -0.6 Benefit ratio -0.3 -0.4 -0.6 -0.7 -0.5 -2.4
* The starting year is 2007 for the column 2007-20 and 2020 for the column 2020-30, etc
Replacement rate has not been calculated. The pension model provides only indirect information on replacement rates of males/females that are switchers/non-switchers to mixed pension system. Only the benefit ratio is calculated directly by the model (average pension/average wage).
Table 5: Replacement rate and coverage by pension scheme (in %) 2007 2020 2030 2040 2050 2060
Social security scheme : : : : : : Coverage * 100.0 100.0 100.0 100.0 100.0 100.0
Occupational scheme : : : : : : Coverage 0.0 0.0 0.0 0.0 0.0 0.0
Private scheme : : : : : : Coverage 0.0 4.9 20.3 40.0 52.0 57.3
* Coverage of each pension scheme is calculated as a ratio of the number of pensioners within the scheme and the total number of pensioners in the country
The impact of population ageing on number of pensioners and contributors is provided in table 5.
371
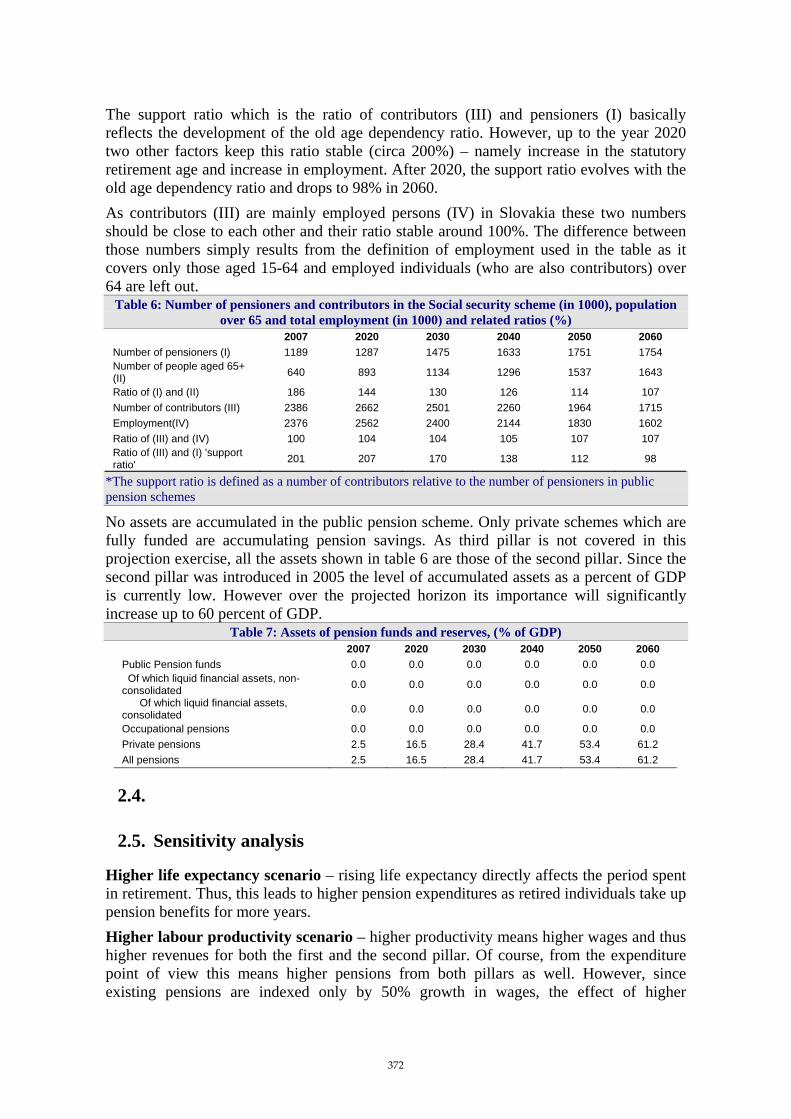
The support ratio which is the ratio of contributors (III) and pensioners (I) basically reflects the development of the old age dependency ratio. However, up to the year 2020 two other factors keep this ratio stable (circa 200%) – namely increase in the statutory retirement age and increase in employment. After 2020, the support ratio evolves with the old age dependency ratio and drops to 98% in 2060. As contributors (III) are mainly employed persons (IV) in Slovakia these two numbers should be close to each other and their ratio stable around 100%. The difference between those numbers simply results from the definition of employment used in the table as it covers only those aged 15-64 and employed individuals (who are also contributors) over 64 are left out.
Table 6: Number of pensioners and contributors in the Social security scheme (in 1000), population over 65 and total employment (in 1000) and related ratios (%)
2007 2020 2030 2040 2050 2060 Number of pensioners (I) 1189 1287 1475 1633 1751 1754 Number of people aged 65+ (II) 640 893 1134 1296 1537 1643
Ratio of (I) and (II) 186 144 130 126 114 107 Number of contributors (III) 2386 2662 2501 2260 1964 1715 Employment(IV) 2376 2562 2400 2144 1830 1602 Ratio of (III) and (IV) 100 104 104 105 107 107 Ratio of (III) and (I) 'support ratio' 201 207 170 138 112 98
*The support ratio is defined as a number of contributors relative to the number of pensioners in public pension schemes
No assets are accumulated in the public pension scheme. Only private schemes which are fully funded are accumulating pension savings. As third pillar is not covered in this projection exercise, all the assets shown in table 6 are those of the second pillar. Since the second pillar was introduced in 2005 the level of accumulated assets as a percent of GDP is currently low. However over the projected horizon its importance will significantly increase up to 60 percent of GDP.
Table 7: Assets of pension funds and reserves, (% of GDP) 2007 2020 2030 2040 2050 2060
Public Pension funds 0.0 0.0 0.0 0.0 0.0 0.0 Of which liquid financial assets, non-consolidated 0.0 0.0 0.0 0.0 0.0 0.0
Of which liquid financial assets, consolidated 0.0 0.0 0.0 0.0 0.0 0.0
Occupational pensions 0.0 0.0 0.0 0.0 0.0 0.0 Private pensions 2.5 16.5 28.4 41.7 53.4 61.2 All pensions 2.5 16.5 28.4 41.7 53.4 61.2
2.4.
2.5. Sensitivity analysis
Higher life expectancy scenario – rising life expectancy directly affects the period spent in retirement. Thus, this leads to higher pension expenditures as retired individuals take up pension benefits for more years. Higher labour productivity scenario – higher productivity means higher wages and thus higher revenues for both the first and the second pillar. Of course, from the expenditure point of view this means higher pensions from both pillars as well. However, since existing pensions are indexed only by 50% growth in wages, the effect of higher
372

productivity on GDP is stronger. Thus pension as a percent of GDP are lower compared to baseline scenario. Higher interest rates scenario - has no impact on public pension spending, but allow for higher annuities from the private pension funds. In 2060, the difference in private pension expenditure will amount to 0.7 per cent of GDP. Zero migration scenario - assumes no migration from or into the country. The pension expenditures to GDP in this scenario are much higher compared to baseline scenario. This mainly results from much lower employment and GDP.
Table 8: Total and public pension expenditures under different scenarios (deviation from baseline scenario)
2007 2020 2030 2040 2050 2060 Total Pension Expenditure
Baseline 6.8 6.5 7.8 9.3 11.1 12.4 Higher life expectancy 6.8 6.5 7.8 9.4 11.4 12.8 Higher lab. productivity 6.8 6.4 7.7 9.1 10.9 12.2 Higher interest rate 6.8 6.5 7.8 9.5 11.6 13.1 Higher employment rate 6.8 6.4 7.7 9.2 11.1 12.4 Higher employment of older workers 6.8 6.4 7.7 9.2 11.0 12.4 Zero migration 6.8 6.5 7.8 9.5 11.5 13.1
Public Pension Expenditure Baseline 6.8 6.3 7.3 8.3 9.4 10.2 Higher life expectancy 6.8 6.3 7.4 8.4 9.7 10.6 Higher lab. productivity 6.8 6.3 7.2 8.2 9.3 10.1 Higher interest rate 6.8 6.3 7.3 8.3 9.4 10.2 Higher employment rate 6.8 6.2 7.2 8.2 9.3 10.2 Higher employment of older workers 6.8 6.2 7.2 8.2 9.3 10.2 Zero migration 6.8 6.3 7.4 8.4 9.8 10.8
2.6. Description of the changes in comparison with the 2001 and 2006 projections
In comparison to the previous round of projections in 2006, there are three main sources of results worsening – demography projections, labour market assumptions and changes in the legislation. Concerning the calculation, the same model (PROST) has been used as in the previous round. Table 9: Decomposition of the change (in %) in public pension expenditure to GDP between 2007 and
2050 under the 2001, 2006 and 2009 projection exercises % Change to
2050 Dependence
ratio Coverage
ratio Employment
effect Benefit ratio
Pension/GDP – 2001 * #N/A #N/A #N/A #N/A #N/A Pension/GDP – 2006 ** 1.5 9.0 -2.5 -1.3 -3.1 Pension/GDP - 2009 *** 2.6 9.6 -3.3 -0.4 -2.4
* Decomposition period 2001-2050, ** Decomposition period 2004-2050, *** Decomposition period 2007-2050
As the demographic and labour market projections worsened compared to the previous round of projections, their impact on dependence ratio and employment shown in table above is straightforward. The two following charts show the changes in life expectancy and employment rate.
373

Graph 5: Life expectancy at birth Graph 6: Employment rate
50
55
60
65
70
75
80
85
90
95
100
1950
1955
1960
1965
1970
1975
1980
1985
1990
1995
2000
2005
2010
2015
2020
2025
2030
2035
2040
2045
2050
50
55
60
65
70
75
80
85
90
95
100Life expectancy at birth - males 2004Life expectancy at birth - males 2008Life expectancy at birth - females 2004Life expectancy at birth - females 2008
40,0
45,0
50,0
55,0
60,0
65,0
70,0
75,0
80,0
2007
2009
2011
2013
2015
2017
2019
2021
2023
2025
2027
2029
2031
2033
2035
2037
2039
2041
2043
2045
2047
2049
Employment rate (15-64) 2008
Employment rate (15-64) 2005
EUROPOP2008 AWG baseline assumptions
The lower positive impact of benefit ratio compared to 2004 projection, can be attributed to a legislative change concerning the second pillar. As already mentioned in the first chapter of this document, in 2008, the second pillar was opened and people were allowed to switch from the mixed back to solely first pillar pension system. At the same time, the character of the second pillar has been changed from mandatory to voluntary for newcomers on the labour market. Both these measures affect the long-term projections of public pension expenditure as (1) accrued rights from the PAYG increased200 and (2) not every new labour market entrant will join the second pillar (in our projections we assume 95% entry rate).
200 The government decided to provide full pension rights from the PAYG to those who switch back to solely PAYG pension scheme – their pensions in future will be exactly the same as if they never joined the second pillar. In exchange for that, all accumulated assets of these people will be transferred to first pillar (government`s one off revenue).
374

Finland (Report prepared by Jorma Tuukkanen and Jussi Huopaniemi)
1. Overview of the pension system n system
1.1. The Finnish pension system: an overview 1.1. The Finnish pension system: an overview
The Finnish public pension system (the first pillar) is made up of two statutory pension schemes: one is the national pension scheme guaranteeing a minimum pension to all residents whereas the other is an employment-based, earnings related pension scheme.
The Finnish public pension system (the first pillar) is made up of two statutory pension schemes: one is the national pension scheme guaranteeing a minimum pension to all residents whereas the other is an employment-based, earnings related pension scheme. Voluntary pension schemes (the second and third pillar) have played a minor role in Finland due to the relatively high net replacement ratio of public pensions, the lack of pension ceilings and full coverage of the systems.
Voluntary pension schemes (the second and third pillar) have played a minor role in Finland due to the relatively high net replacement ratio of public pensions, the lack of pension ceilings and full coverage of the systems. The statutory schemes are closely linked together, with the amount of national pension depending on the size of the earnings-related pension benefits. Increases in the earnings-related pension reduce the national pension by 50 per cent. If the earnings-related pension is above a defined level, the national pension is not paid at all. Therefore only about half of pensioners who get earnings-related pension get also national pension. At the same time there are 0,1 million pensioners getting only national pension. Taking in addition all pension types into account the total number of pensioners in 2007 was roughly 1.3 million.
The statutory schemes are closely linked together, with the amount of national pension depending on the size of the earnings-related pension benefits. Increases in the earnings-related pension reduce the national pension by 50 per cent. If the earnings-related pension is above a defined level, the national pension is not paid at all. Therefore only about half of pensioners who get earnings-related pension get also national pension. At the same time there are 0,1 million pensioners getting only national pension. Taking in addition all pension types into account the total number of pensioners in 2007 was roughly 1.3 million. In diagram 1 the structure of the integrated total pension is displayed at different wage levels and durations of working histories. As the earnings-related pension schemes gain in maturity, which raises the level of earnings-related pensions, more and more people will enter the region where the national pension plays a very modest role.
In diagram 1 the structure of the integrated total pension is displayed at different wage levels and durations of working histories. As the earnings-related pension schemes gain in maturity, which raises the level of earnings-related pensions, more and more people will enter the region where the national pension plays a very modest role.
Diagram 1. Integration of Pensions
Wages and yrs in empl.
Pension
Earnings-related pensionNational pension
375

Total expenditure on pension benefits in 2007 was 10,7 % of GDP. Payments in statutory pensions amounted to 10,2 % of GDP, of which earnings-related pensions accounted for 88 per cent and the basic national pensions for the rest. In the future, the role of the national pensions in the total pension coverage will diminish as the level of earnings-related pensions will rise. Pension-tested national pensions are administered by the Social Insurance Institution supervised by Parliament. The national pension system is totally based on the PAYG-system; these pensions are financed partly by contributions of employers and partly from the state budget. The purchasing power of national pensions is kept intact by indexation to the consumer price index. The full level of pension has also been occasionally raised, last in 2008. The earnings-related pension system is based on a tripartite arrangement, consisting of employees, employers and the government. Private employees belong to six different sector-related schemes run by private pension institutions. There are about 60 pension institutions of very different sizes. The pension companies compete with each other in the free market. The Finnish Centre for Pensions is the statutory central body of the private sector pension schemes. The Ministry of Social Affairs and Health is in charge of the general supervision of the earnings-related schemes. Employees in central and local government as well as employees of the Finnish Evangelical-Lutheran Church have their own earnings-related schemes. The schemes for central government employees are managed by the State Treasury under the general supervision of the Ministry of Finance, whereas the Local Government Pension Institute administers the scheme for local government employees. The financing of earnings-related pensions is a combination of a fully funded and a pay-as-you-go system based on pension contributions from both employers and employees. A part of earnings-relates pensions are financed from the state budget; the central government contributes toward farmers’, self-employed and seamens' pension funding to the degree that contributions are not sufficient. The pre-funded scheme covers approximately one quarter of earnings-related pension outlays, the rest (3/4) is financed through the PAYG system. Despite the partially funded system in pensions, Finland’s earnings-related pension scheme is entirely of the defined-benefit type. The pre-funding is collective in the sense that it has no direct effect on the size of the pension. The main purpose of the pre-funding is to smoothen pension contributions in the coming years. The financial position in the earnings-related pension schemes is fairly good as the system is running on surpluses. The annual surplus has been some 3 per cent in relation to GDP. The market value of the pension fund’s assets was 67,9 per cent of GDP at the end of 2007. The earnings-related pension is accumulated according to the following rules. Pensions accrue from the age of 18 to 52 at the rate of 1.5 per cent of wages a year, from 53 to 62 at 1.9 per cent and from 63 to 68 at 4.5 per cent a year without any cap. The retirement age is flexible (62-68). There are two indices in the earnings-related pension system. The first (pre-retirement index) adjusts past earnings to the present level when computing the pension at the time of retirement. This “wage coefficient” puts a weight of 80 per cent on wages and 20 per cent on prices. The other index (post-retirement index) aims at keeping the purchasing power of earnings-related pensions ahead of inflation. This index has a weight of 80 per cent on
376

consumer prices and 20 per cent on wages. The life-expectancy coefficient adjusts the pensions upon retirement to the changes in longevity as of 2010. Statutory pensions (the first pillar) are taxed as earned income (progressive tax rate) with pension allowance applying for smaller pensions. The taxation arrangement of earnings-related pensions is of the EET type. The contributions to pension schemes and investment incomes of the pension institutions are exempted from taxation. Tax treatment of supplementary pensions arranged by the employer (the second pillar) is the same as that of statutory pensions (the first pillar). Self-acquired voluntary pensions (the third pillar) are taxed in the capital income taxation regime with a flat tax rate (28 %), and pension contributions can also be deducted to a certain amount from taxation within the capital income taxation regime. Pension reform (2005) The aim of the pension reform is to keep the pension expenditure in check and safeguard the pension promise made to the citizens. Through the reform, it is possible to retire on an old-age pension flexibly between the ages 62 and 68 years. The reform increases the actuarial fairness, as pensions are calculated on the basis of the life-time-earnings. Continued participation in working life is rewarded with an accelerated accrual, as pension rights accrue at the rate 4.5 per cent of wage a year between the ages 63 and 68 (the normal accrual rate is 1,5). The previous pension ceiling (60 per cent of the wage) was abolished. The introduction of life-expectancy coefficient keeps the pension expenditure in check, if the longevity increases. The unemployment pension was abolished. 201 The age limit for the part-time pension was increased from 56 years to 58 years. The pre-funding of pensions is increased by 2013, which increases the sustainability of pension system. The pension reform halves the long-term rise in pension contribution rate (from 10 per cent to 5 per cent of wages).
2. Pension expenditure projections
2.1. Coverage of the pension schemes in the projections
The Finnish public pension system (the first pillar) is made up of two statutory pension schemes: one is the national pension scheme guaranteeing a minimum pension to all residents whereas the other is an employment-based, earnings related pension scheme. The projection models cover fully the public pension schemes (the earnings-related and national basic pensions). Supplemental pension components – the pensioners’ care allowances and pensioners housing allowances – paid by the Social Insurance Institute are not included in the social security pensions used in the AWG- projections for Finland. The pensioners’ care allowance is intended as compensation for specific services and home care and is included in the long-term care projections. The expenditure on pensioners’ housing allowance, which is not included in this exercise, was 0,2 % of GDP in 2007. Three per cent of pensioners are receiving the income support designed to supplement a person’s income in cases where that income is not sufficient to meet reasonable living costs. This assistance may also be paid when the payment of other social security payment 201 It was decided that the unemployment pension will be phased out by 2014. It is therefore available only to those borne in 1949 and earlier. In the national accounts framework, unemployment pension expenditure is included in social security pension expenditure and thus also in the pension projection exercise.
377
is delayed. This allowance, as well as the voluntary pensions schemes (the second and third pillar), which play a very minor role in Finland, are not included in this exercise.
2.2. Overview of projection results
The projections of pension expenditure are based on assumptions on population, employment and productivity commonly agreed by the Ageing Working Group of the Economic Policy Committee. In Finland the population is ageing during the next twenty years faster than in any other EU Member State. This is due to the exceptionally big post-war cohorts and increased longevity. Working-age population will start to diminish in 2010, when the first large cohort reaches the age of 65. The old-age dependency ratio nearly doubles from the present by the year 2030, when it is the second highest (after Germany) in the EU. After this, the old-age dependency ratio rises only slightly so that it is below the EU average in 2060. In the baseline projection, pension expenditure in relation to GDP increases from 10,0 per cent in 2007 to 14,0 per cent in 2033, after which the figure turns to slight decrease so that it is 13,4 per cent in 2060. The pension projections are based on the new pension rules (pension reform 2005). The main driving force behind the rapid increase in pension expenditure over the next twenty years is the fastest change in the old-dependency ratio in the EU. The earnings-related old-age pensions increase most. The share of earnings-relate disability and survivors’ pensions will decrease. The role of income tested basic pensions (national pensions) will diminish in total pension expenditure Table 2). The future need for basic pension is limited by increased coverage and rising level of earnings-related pensions. These two schemes are closely linked with the amount of basic national pension depending on the earnings-related pension benefits (See page 2). The pension reform (2005) encourages to postpone retirement for example with increased accruals (4,5 % of wage per annum) from the age of 63 to 68. Abolishing some early exit routes affects in the same direction. The assumption on higher employment rate among older people automatically means that the share of disability pension expenditure will decrease in the future. The health status of older workers is assumed to improve in line with the increase in life-expectancy, which also decreases the disability pensions. Taxes on pensions are assumed to increase at the same rate as pensions. The average tax rate on pensions is kept constant (18 %).
378

Table 1: Projected gross pension spending, tax on pension and contributions (% of GDP) 2000 2007 2020 2030 2040 2050 2060 Peak
year * Social security pensions 10.1 10.0 12.6 13.9 13.6 13.3 13.4 2033 Old-age and early pensions
7.1 7.5 10.5 12.1 11.9 11.7 12.0 2033
Other Pensions 2.9 2.5 2.1 1.9 1.7 1.6 1.4 : Occupational pensions : : : : : : : : Private pensions : : : : : : : : Mandatory private : : : : : : : : Non-Mandatory private : : : : : : : : Total pension expenditure 10.1 10.0 12.6 13.9 13.6 13.3 13.4 2033 Taxes on public pensions 1.8 1.8 2.3 2.5 2.5 2.4 2.4 2033 Taxes on private pensions : : : : : : : :
* This column represents a Peak year, i.e. the year in which the particular variable reaches its maximum over the interval 2000 to 2060.
The change in pension expenditure is the fastest in the private sector pension scheme, where the earnings-related pensions in relation to GDP are projected to increase from 4,7 per cent in 2007 to 7,6 per cent in 2030, after which the figure increases very modestly so that the peak (8,2 %) is at the end of the period. By contrast the public sector (local and central government) pensions (% of GDP) are projected to increase only slightly by 2029 and decrease thereafter. The pension reforms have reduced most the generosity of pensions in the public sector, where the level of pensions will gradually converge that of private sector. The farmers pension expenditure share is projected to be halved by 2060.
379
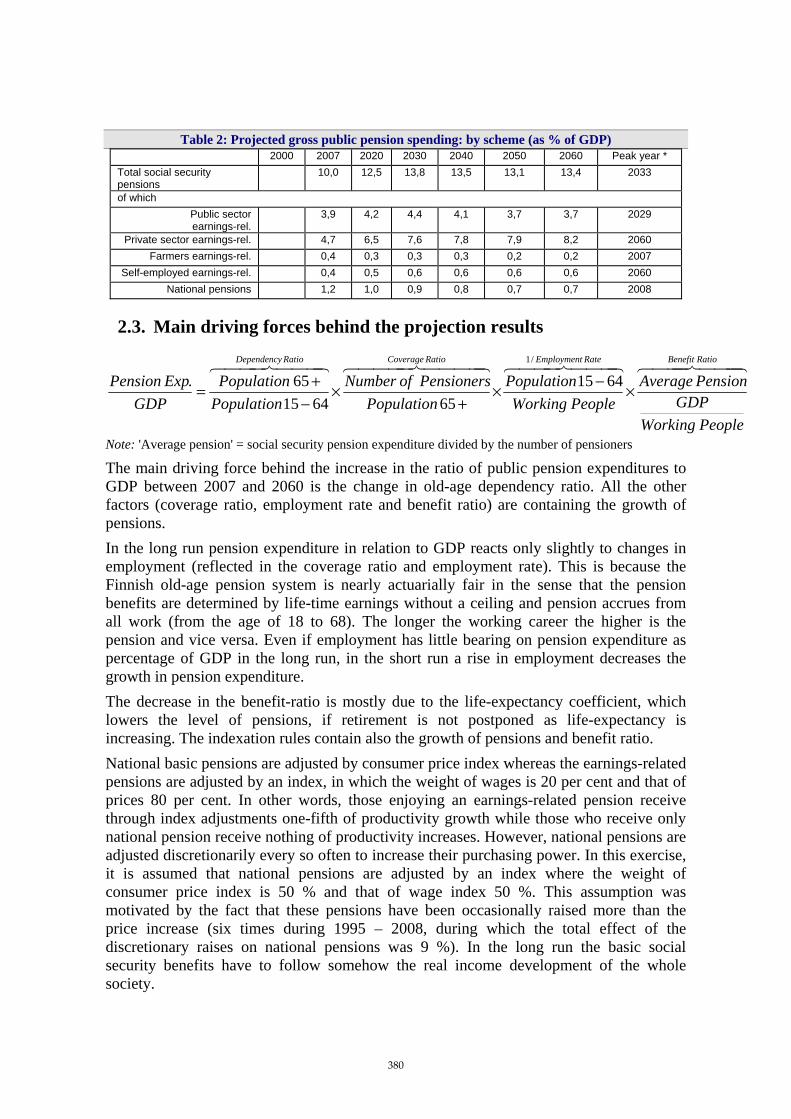
Table 2: Projected gross public pension spending: by scheme (as % of GDP)
2000 2007 2020 2030 2040 2050 2060 Peak year * Total social security pensions
10,0 12,5 13,8 13,5 13,1 13,4 2033
of which Public sector earnings-rel.
3,9 4,2 4,4 4,1 3,7 3,7 2029
Private sector earnings-rel. 4,7 6,5 7,6 7,8 7,9 8,2 2060 Farmers earnings-rel. 0,4 0,3 0,3 0,3 0,2 0,2 2007
Self-employed earnings-rel. 0,4 0,5 0,6 0,6 0,6 0,6 2060 National pensions 1,2 1,0 0,9 0,8 0,7 0,7 2008
2.3. Main driving forces behind the projection results
444 8444 76444 8444 764444 84444 76444 8444 76 RatioBenefitRateEmploymentRatioCoverageRatioDependency
PeopleWorkingGDP
PensionAveragePeopleWorking
PopulationPopulation
PensionersofNumberPopulationPopulation
GDPExpPension ×−×
+×
−+=
/1
6415656415
65.
Note: 'Average pension' = social security pension expenditure divided by the number of pensioners
The main driving force behind the increase in the ratio of public pension expenditures to GDP between 2007 and 2060 is the change in old-age dependency ratio. All the other factors (coverage ratio, employment rate and benefit ratio) are containing the growth of pensions. In the long run pension expenditure in relation to GDP reacts only slightly to changes in employment (reflected in the coverage ratio and employment rate). This is because the Finnish old-age pension system is nearly actuarially fair in the sense that the pension benefits are determined by life-time earnings without a ceiling and pension accrues from all work (from the age of 18 to 68). The longer the working career the higher is the pension and vice versa. Even if employment has little bearing on pension expenditure as percentage of GDP in the long run, in the short run a rise in employment decreases the growth in pension expenditure. The decrease in the benefit-ratio is mostly due to the life-expectancy coefficient, which lowers the level of pensions, if retirement is not postponed as life-expectancy is increasing. The indexation rules contain also the growth of pensions and benefit ratio. National basic pensions are adjusted by consumer price index whereas the earnings-related pensions are adjusted by an index, in which the weight of wages is 20 per cent and that of prices 80 per cent. In other words, those enjoying an earnings-related pension receive through index adjustments one-fifth of productivity growth while those who receive only national pension receive nothing of productivity increases. However, national pensions are adjusted discretionarily every so often to increase their purchasing power. In this exercise, it is assumed that national pensions are adjusted by an index where the weight of consumer price index is 50 % and that of wage index 50 %. This assumption was motivated by the fact that these pensions have been occasionally raised more than the price increase (six times during 1995 – 2008, during which the total effect of the discretionary raises on national pensions was 9 %). In the long run the basic social security benefits have to follow somehow the real income development of the whole society.
380
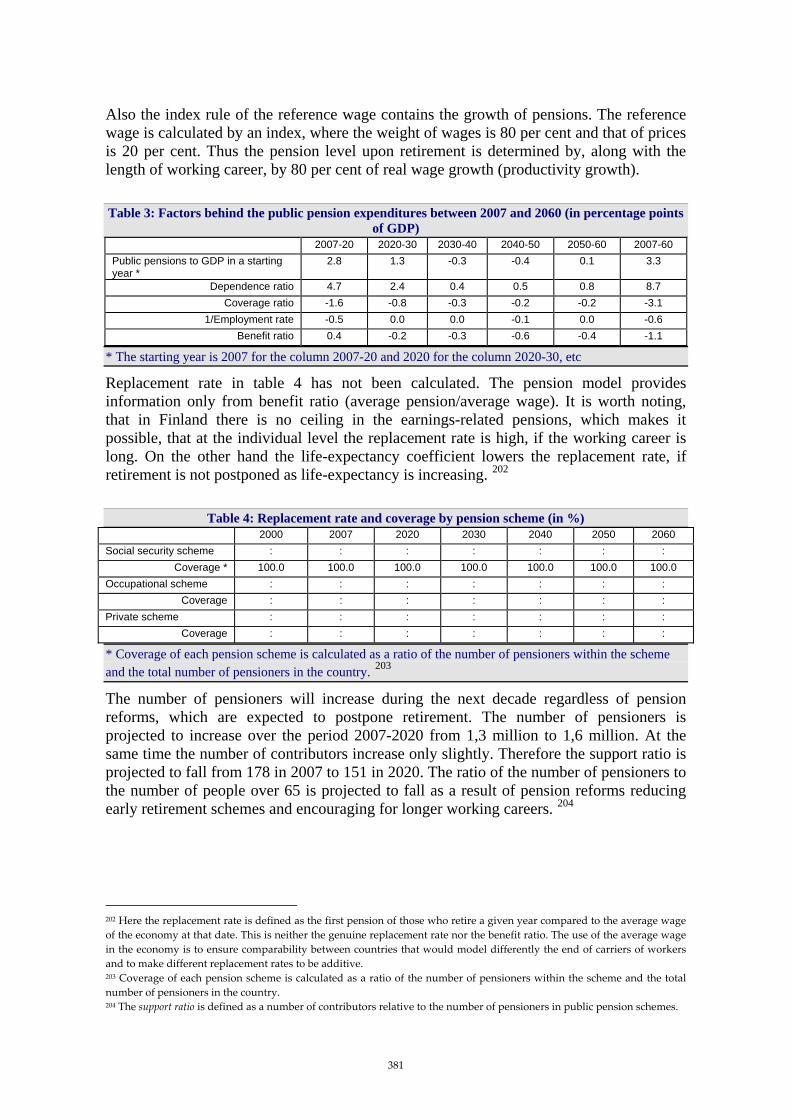
Also the index rule of the reference wage contains the growth of pensions. The reference wage is calculated by an index, where the weight of wages is 80 per cent and that of prices is 20 per cent. Thus the pension level upon retirement is determined by, along with the length of working career, by 80 per cent of real wage growth (productivity growth). Table 3: Factors behind the public pension expenditures between 2007 and 2060 (in percentage points
of GDP) 2007-20 2020-30 2030-40 2040-50 2050-60 2007-60
Public pensions to GDP in a starting year *
2.8 1.3 -0.3 -0.4 0.1 3.3
Dependence ratio 4.7 2.4 0.4 0.5 0.8 8.7 Coverage ratio -1.6 -0.8 -0.3 -0.2 -0.2 -3.1
1/Employment rate -0.5 0.0 0.0 -0.1 0.0 -0.6 Benefit ratio 0.4 -0.2 -0.3 -0.6 -0.4 -1.1
* The starting year is 2007 for the column 2007-20 and 2020 for the column 2020-30, etc
Replacement rate in table 4 has not been calculated. The pension model provides information only from benefit ratio (average pension/average wage). It is worth noting, that in Finland there is no ceiling in the earnings-related pensions, which makes it possible, that at the individual level the replacement rate is high, if the working career is long. On the other hand the life-expectancy coefficient lowers the replacement rate, if retirement is not postponed as life-expectancy is increasing. 202
Table 4: Replacement rate and coverage by pension scheme (in %) 2000 2007 2020 2030 2040 2050 2060
Social security scheme : : : : : : : Coverage * 100.0 100.0 100.0 100.0 100.0 100.0 100.0
Occupational scheme : : : : : : : Coverage : : : : : : :
Private scheme : : : : : : : Coverage : : : : : : :
* Coverage of each pension scheme is calculated as a ratio of the number of pensioners within the scheme and the total number of pensioners in the country. 203
The number of pensioners will increase during the next decade regardless of pension reforms, which are expected to postpone retirement. The number of pensioners is projected to increase over the period 2007-2020 from 1,3 million to 1,6 million. At the same time the number of contributors increase only slightly. Therefore the support ratio is projected to fall from 178 in 2007 to 151 in 2020. The ratio of the number of pensioners to the number of people over 65 is projected to fall as a result of pension reforms reducing early retirement schemes and encouraging for longer working careers. 204
202 Here the replacement rate is defined as the first pension of those who retire a given year compared to the average wage of the economy at that date. This is neither the genuine replacement rate nor the benefit ratio. The use of the average wage in the economy is to ensure comparability between countries that would model differently the end of carriers of workers and to make different replacement rates to be additive. 203 Coverage of each pension scheme is calculated as a ratio of the number of pensioners within the scheme and the total number of pensioners in the country. 204 The support ratio is defined as a number of contributors relative to the number of pensioners in public pension schemes.
381

Table 5: Number of pensioners and contributors in the Social security scheme (in 1000), population over 65 and total employment (in 1000) and related ratios (%)
2000 2007 2020 2030 2040 2050 2060 Number of pensioners (I) 1232 1331 1609 1742 1735 1724 1748 Number of people aged 65+ (II)
767 869 1233 1421 1447 1460 1503
Ratio of (I) and (II) 161 153 131 123 120 118 116 Number of contributors (III) : 2376 2427 2355 2331 2295 2233 Employment (IV) 2350 2474 2476 2397 2384 2335 2273 Ratio of (III) and (IV) : 96 98 98 98 98 98 Ratio of (III) and (I) 'support ratio'
: 178 151 135 134 133 128
Finland’s earnings-related pension system is a partially pre-funded, defined-benefit system in which the benefits are determined according to the length of employment history and the level of earnings. The pre-funding is collective and it does not affect directly the level of pension; rather it is intended to even out the pension contribution rate over time. Table 6: Pension expenditure and contributions in the earnings-related pension schemes, % of wages
2007 2020 2030 2040 2050 2060 Expenditure 22,7 29,6 33,2 32,8 32,1 32,7 Contributions 22,4 25,4 27,4 27,8 27,8 28,0
Within the national accounts framework, the pension funds in the private and local government sector are counted as social security funds. By contrast, the State Pension fund is part of the central government. The market value of pension fund assets in the end of 2007 Billion euro % of GDP Private sector 85,0 47,5 Local government 24,3 13,6 Social security funds, total 109,3 61,1 Central government 12,1 6,7 TOTAL 121,4 67,9 In the private sector the pre-funding and contribution rates are based on actuarial rules. The contribution is divided into two main parts; the PAYG component (3/4 of contribution), which is used to finance the pension expenditure according to the pay-as-to-go system and the funding part ¼ of contribution determined according to certain actuarial principles. The higher is the rate of return on pension fund assets the lower is the contribution rate and vice versa. ( 1 ) Assets (t+1) = Assets ( t ) + Surplus ( t ) ( 2 ) Surplus = Contributions + Investment incomes + Transfer from central government + Transfer from unemployment insurance fund – Pension expenditure – Administrative costs. Most of the private sector pension funds’ income (94 %) is made up of contributions and investment income. The central government contributes toward farmers’, self-employed and seamens’ pensions funding to the degree that contributions are not sufficient. The unemployment insurance fund, which handles earnings-related unemployment insurance, finances pension rights incurred during periods of unemployment. Administrative costs are roughly 4 per cent of pension expenditure.
382
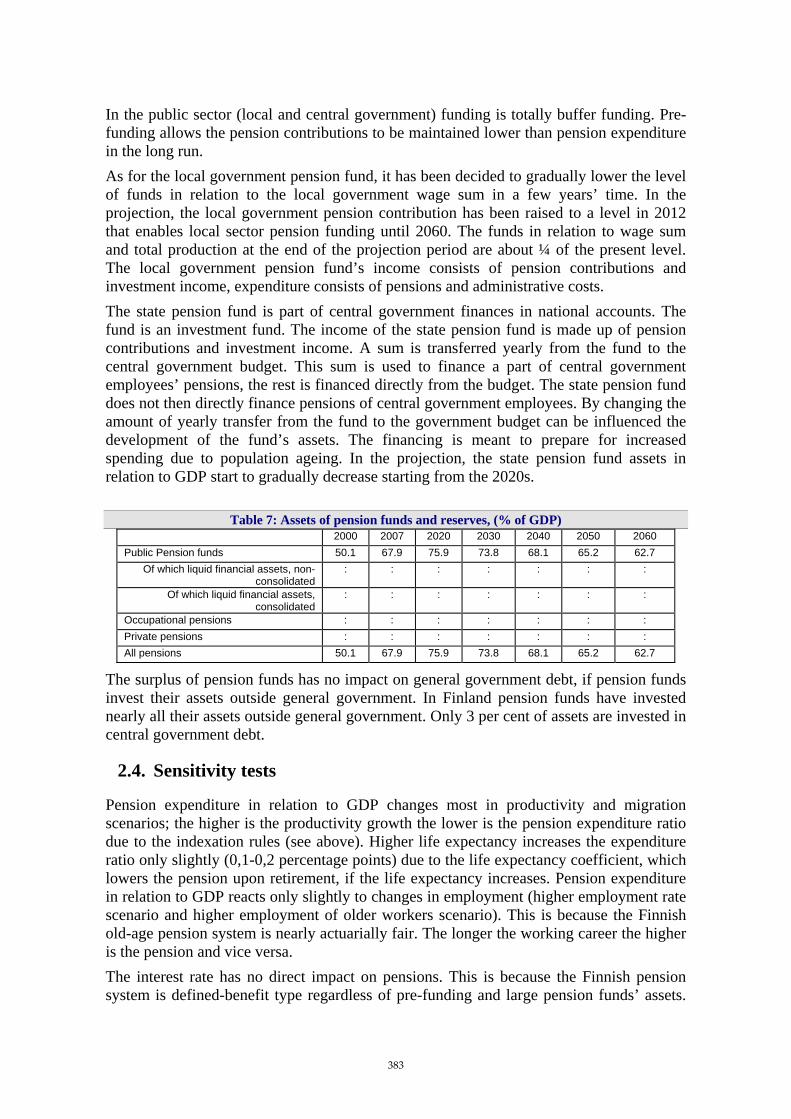
In the public sector (local and central government) funding is totally buffer funding. Pre-funding allows the pension contributions to be maintained lower than pension expenditure in the long run. As for the local government pension fund, it has been decided to gradually lower the level of funds in relation to the local government wage sum in a few years’ time. In the projection, the local government pension contribution has been raised to a level in 2012 that enables local sector pension funding until 2060. The funds in relation to wage sum and total production at the end of the projection period are about ¼ of the present level. The local government pension fund’s income consists of pension contributions and investment income, expenditure consists of pensions and administrative costs. The state pension fund is part of central government finances in national accounts. The fund is an investment fund. The income of the state pension fund is made up of pension contributions and investment income. A sum is transferred yearly from the fund to the central government budget. This sum is used to finance a part of central government employees’ pensions, the rest is financed directly from the budget. The state pension fund does not then directly finance pensions of central government employees. By changing the amount of yearly transfer from the fund to the government budget can be influenced the development of the fund’s assets. The financing is meant to prepare for increased spending due to population ageing. In the projection, the state pension fund assets in relation to GDP start to gradually decrease starting from the 2020s.
Table 7: Assets of pension funds and reserves, (% of GDP) 2000 2007 2020 2030 2040 2050 2060
Public Pension funds 50.1 67.9 75.9 73.8 68.1 65.2 62.7 Of which liquid financial assets, non-
consolidated : : : : : : :
Of which liquid financial assets, consolidated
: : : : : : :
Occupational pensions : : : : : : : Private pensions : : : : : : : All pensions 50.1 67.9 75.9 73.8 68.1 65.2 62.7
The surplus of pension funds has no impact on general government debt, if pension funds invest their assets outside general government. In Finland pension funds have invested nearly all their assets outside general government. Only 3 per cent of assets are invested in central government debt.
2.4. Sensitivity tests
Pension expenditure in relation to GDP changes most in productivity and migration scenarios; the higher is the productivity growth the lower is the pension expenditure ratio due to the indexation rules (see above). Higher life expectancy increases the expenditure ratio only slightly (0,1-0,2 percentage points) due to the life expectancy coefficient, which lowers the pension upon retirement, if the life expectancy increases. Pension expenditure in relation to GDP reacts only slightly to changes in employment (higher employment rate scenario and higher employment of older workers scenario). This is because the Finnish old-age pension system is nearly actuarially fair. The longer the working career the higher is the pension and vice versa. The interest rate has no direct impact on pensions. This is because the Finnish pension system is defined-benefit type regardless of pre-funding and large pension funds’ assets.
383

Indirectly the higher interest rate (rate of return on pension assets) increases slightly (0,1 % of GDP) pension expenditure. Instead the rate of return on pension funds’ assets has a remarkable impact on the financial sustainability of the pension system and the whole general government through lowering the contribution rate. If the real interest (rate of return) is 1 percentage points higher than in the baseline scenario (3%), the contributions as a share of wages are 2 percentage points lower in the long run. In relation to GDP this is 0,7 per cent.
Table 8: Pension contributions in earnings-related pension schemes, % of wages 2007 2020 2030 2040 2050 2060 Baseline 22,4 25,4 27,4 27,8 27,8 28,0 4 % interest rate 22,4 24,4 25,7 25,8 25,8 26,1
Table 9: Total and public pension expenditures under different scenarios
2007 2020 2030 2040 2050 2060 Total Pension Expenditure
Baseline 10.0 12.6 13.9 13.6 13.3 13.4 Higher life expectancy 10.0 12.7 14.0 13.7 13.4 13.5
Higher lab. productivity 10.0 12.5 13.6 13.2 12.8 12.9 Higher interest rate 10.0 12.7 14.0 13.7 13.4 13.5 Higher emp. rate 10.0 12.4 13.8 13.5 13.1 13.3 Higher emp. of older workers 10.0 12.4 13.8 13.5 13.1 13.3 Zero migration 10.0 12.9 14.5 14.3 13.9 14.0
Public Pension Expenditure Baseline 10.0 12.6 13.9 13.6 13.3 13.4 Higher life expectancy 10.0 12.7 14.0 13.7 13.4 13.5
Higher lab. productivity 10.0 12.5 13.6 13.2 12.8 12.9 Higher interest rate 10.0 12.7 14.0 13.7 13.4 13.5 Higher emp. rate 10.0 12.4 13.8 13.5 13.1 13.3 Higher emp. of older workers 10.0 12.4 13.8 13.5 13.1 13.3 Zero migration 10.0 12.9 14.5 14.3 13.9 14.0
The differences in the development of the ratio of total pension expenditures to GDP between the 2006 and 2009 projections are very minor. Both pension projections are based on a very similar population and employment projection. In addition the legislation has not changed after 2005, when the pension reform was introduced.
Table 10: Decomposition of the change (in %) in public pension expenditure to GDP between 2007 and 2050 under the 2001, 2006 and 2009 projection exercises
% Change to 2050
Dependence ratio
Coverage ratio
Employment effect
Benefit ratio
Pension/GDP – 2001 * 5.0 6.6 -1.3 -0.1 -0.1 Pension/GDP – 2006 ** 3.3 8.8 -3.1 -0.9 -0.8 Pension/GDP - 2009 *** 3.4 7.9 -2.9 -0.6 -0.7
* Decomposition period 2001-2050, ** Decomposition period 2004-2050, *** Decomposition period 2007-2050
The coverage for both projection (2006 and 2009) is the same. However, the interpretation of constant policy assumption was changed, compared with the 2006 projection exercise. In the 2009 scenario, it was assumed that the national pension benefits are annually adjusted by fifty-fifty index, where the weight of prices and wages is 50 % from 2011
384

onwards. The 2006 projection followed tightly the legislation according to which national pensions were adjusted “only” by the consumer price index. This change of interpretation of constant policy assumption was motivated by the fact that these basic pensions have been occasionally raised more than the price increase. In the long run the basic social security benefits have to follow somehow the real income development of the whole society. Regarding the policy related changes in table 9, there was a discretional increase in national pension level over the change of price index (20 € per month) as of 1.1.2008. Also, the municipal cost-of-living classification was discontinued as of the same date. This affected over half of the national pension beneficiaries raising their pensions. The effect of these changes is roughly 0,1 % of GDP. Table 11: Decomposition of the difference between 2006 and 2009 public pension projection (%GDP)
2000 2005 2007 2020 2030 2040 2050 Ageing report 2006 10,4 10,5 12,9 14,0 13,8 13,7
Change in assumptions -0,5 -0,5 -0,3 -0,5 -0,7 Improvement in the coverage or
in the modelling none
Change in the interpretation of constant policy
0 0 0 0,1 0,1 0,2 0,2
Policy related changes 0,0 0,1 0,1 0,1 0,1 Ageing report 2009 10,0 12,6 13,9 13,6 13,3
385
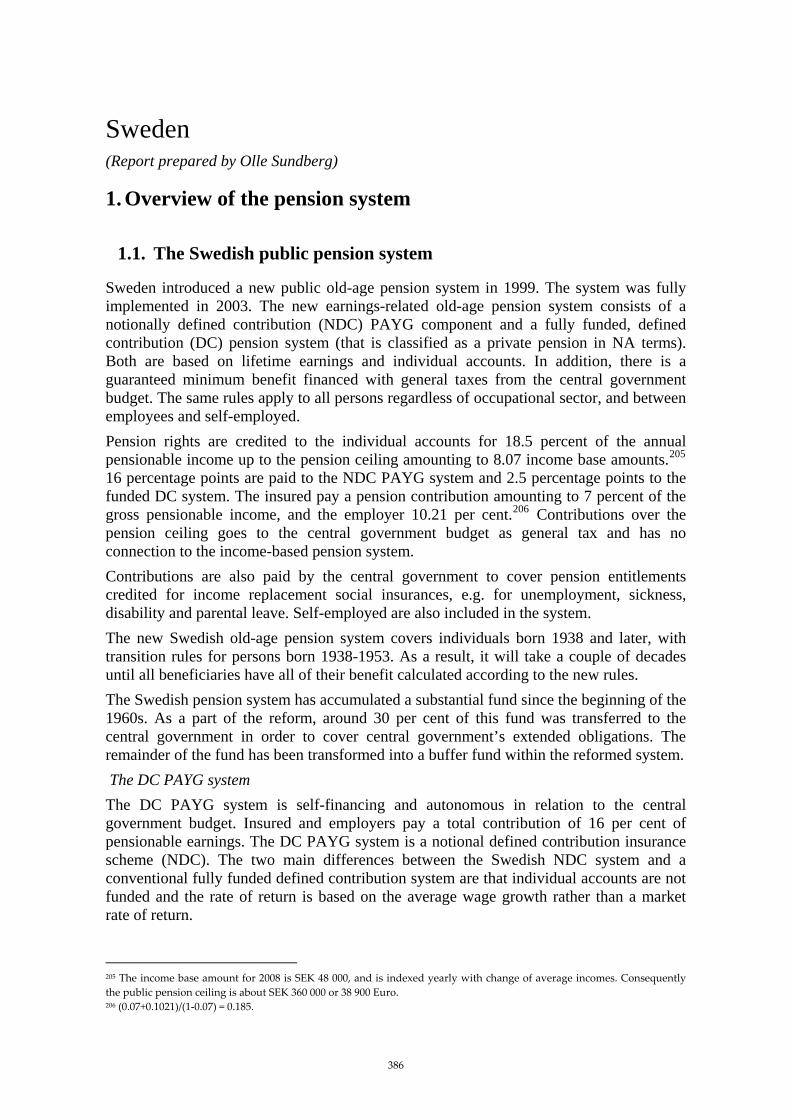
Sweden (Report prepared by Olle Sundberg)
1. Overview of the pension system
1.1. The Swedish public pension system
Sweden introduced a new public old-age pension system in 1999. The system was fully implemented in 2003. The new earnings-related old-age pension system consists of a notionally defined contribution (NDC) PAYG component and a fully funded, defined contribution (DC) pension system (that is classified as a private pension in NA terms). Both are based on lifetime earnings and individual accounts. In addition, there is a guaranteed minimum benefit financed with general taxes from the central government budget. The same rules apply to all persons regardless of occupational sector, and between employees and self-employed. Pension rights are credited to the individual accounts for 18.5 percent of the annual pensionable income up to the pension ceiling amounting to 8.07 income base amounts.205 16 percentage points are paid to the NDC PAYG system and 2.5 percentage points to the funded DC system. The insured pay a pension contribution amounting to 7 percent of the gross pensionable income, and the employer 10.21 per cent.206 Contributions over the pension ceiling goes to the central government budget as general tax and has no connection to the income-based pension system. Contributions are also paid by the central government to cover pension entitlements credited for income replacement social insurances, e.g. for unemployment, sickness, disability and parental leave. Self-employed are also included in the system. The new Swedish old-age pension system covers individuals born 1938 and later, with transition rules for persons born 1938-1953. As a result, it will take a couple of decades until all beneficiaries have all of their benefit calculated according to the new rules. The Swedish pension system has accumulated a substantial fund since the beginning of the 1960s. As a part of the reform, around 30 per cent of this fund was transferred to the central government in order to cover central government’s extended obligations. The remainder of the fund has been transformed into a buffer fund within the reformed system. The DC PAYG system The DC PAYG system is self-financing and autonomous in relation to the central government budget. Insured and employers pay a total contribution of 16 per cent of pensionable earnings. The DC PAYG system is a notional defined contribution insurance scheme (NDC). The two main differences between the Swedish NDC system and a conventional fully funded defined contribution system are that individual accounts are not funded and the rate of return is based on the average wage growth rather than a market rate of return.
205 The income base amount for 2008 is SEK 48 000, and is indexed yearly with change of average incomes. Consequently the public pension ceiling is about SEK 360 000 or 38 900 Euro. 206 (0.07+0.1021)/(1-0.07) = 0.185.
386
Furthermore, contributions are used to pay current pensions, as in any PAYG setting, and individual account values represent only a claim on a future pension. The account value at the end of each year consists of contributions accumulated during the year plus the accumulated value from the previous years; the latter (as a primary rule) is indexed by the average rate of growth of earnings per contributor. Although there is no pre-funding, the system may increase/decrease the existing buffer fund due to demographic changes (i.e. the age structure). The retirement age is flexible and individuals can claim benefits from the age of 61. The DC PAYG pension system works on an actuarial basis. At the time of retirement an annuity is calculated by dividing the individual’s account value by a divisor reflecting unisex life expectancy at the specific date of retirement. The PAYG-pensions is on average indexed by wages. The system is front-loaded, though, and the pensioners receive a share of the real economic growth in advance. Technically this is achieved by calculating the annuity factor with a 1.6 per cent discount factor, resulting in a higher initial benefit than a straightforward application the actuarial principles imply. The indexation is then reduced during the pay-out time by subtracting 1.6 per cent from the yearly income indexation.207 The potential financial instability created by the increasing longevity is, to a large extent, counteracted by the divisor reflecting the changing life expectancy. The individual can counteract the negative effect on the annuity caused by increasing life expectancy by postponing the date of retirement. In these calculations the retirement age is fixed to 65 years. In addition, the system is also equipped with an automatic balancing mechanism that will secure the financial stability of the system. Regardless of the demographic or economic development the system will be able to finance its obligations with a fixed contribution rate and fixed rules for calculation of benefits. This is achieved by reducing the rate of indexing, if necessary. The automatic activation of the balancing mechanism is based on the pension system annual reports that are published by the Swedish Social Insurance Agency. If the current liabilities of the system are greater than the calculated assets the balancing is activated. There are also plans to implement legislation for redistribution of pension fees if the PAYG system becomes over-consolidated. As decisions have not yet been taken, this mechanism is not implemented in the current calculations.208 Basic security and the guarantee pension There is a minimum guarantee benefit, the guarantee pension, that is financed by general revenues from the central government budget. The benefit is graduated to make it possible to have a small guarantee component, while receiving the main part of a benefit from the two earnings-related systems. The benefit is proportionally reduced if the number of residence years in Sweden falls short of 40. E.g. a person with 39 years of residence achieves 39/40-parts of the full benefit. The guarantee pension together with the means-tested housing supplement for pensioners is higher than the minimum income standard. All forms of basic security benefits for the elderly can be received from the age of 65, not earlier. The guarantee pension is price indexed and fully taxed. In the AWG calculations income indexations is assumed though. The benefit amounts to maximum 2.13 price base amounts
207 More details about the indexation can be found in appendix 1. 208 More information about the automatic balancing can be found in appendix 1.
387

(PBA) (EUR 9 400 year 2008) for single households and 1.90 PBA:s per person (EUR 8 400 year 2008) for cohabitants.209 The guarantee pension is reduced for individuals having other types of public old-age pension income or survivor benefits, but is not reduced by wage income, capital income, occupational pension or private pension insurance. For low incomes the benefit is reduced krona by krona, and for higher incomes the benefit is reduced with 48 per cent. Thus the guarantee pension is fully phased out when the income pension reaches 3.07 PBA:s for single households and 2.72 PBA:s for cohabitants. Housing supplement for pensioners (BTP) is subject to means testing and is affected by housing costs, income and capital. The housing supplement amounts to 93 percent of housing costs up to SEK 5 000 a month (EUR 540) for single persons and 2500 (EUR 270) for couples. The amount is tax free. If the pensioner’s income after deduction for reasonable housing costs is under an acceptable level, a special housing supplement may be granted. This benefit applies mainly to those with high housing costs. There is also a program, maintenance support for the elderly, which ensure that pensioners with very low income, usually immigrants with few years of residence in Sweden, not becomes dependent, in the long term, on social assistance from social services. This support is means-tested, tax free, and its size depends on the income and housing costs of the beneficiary and his/her partner. As this benefit is small, it is not included in the current AWG calculations. Tax status The main part of the benefits is subject to income tax from 2003. The former pension system contained a special tax deduction for pensioners, which was abolished from 2003. In the new system, the special tax deduction and the flat-rate pension have been replaced by the taxable guarantee benefit. The level has been set so that the benefit after tax will be at least as high as before the reform. The conversion from net to gross guarantee benefits explains why the guarantee level, and hence total pension benefits, increased strongly in 2003. From 2009 a new tax deductions for retired will be introduced. As this rule will be in place after the AWG cut off date, it’s not implemented in the current calculations. Early retirement, disability and survivor’s pension The majority of the population retires at age 65 due to legislation in the former pension system and earlier labour market agreements. Under the Employment Protection Act, an employee is entitled to stay in employment until his/her 67th birthday. The average age for withdrawal from the labour market is, however, estimated to age 63.1 in year 2007.210 It is possible to retire at the age of 61 in the new pension system, but the loss is twofold for the individual. First, the benefit is based upon lifetime contributions, which implies that all years with earnings are important. Second, the level of the benefit is calculated in proportion to cohort-specific life expectancy from the date of retirement. Leaving early implies a lower (notional) pension capital and a longer period for payments and therefore the benefit will be lower per annum compared with a later retirement age. The reformed pension system is individual-based. The previous widow’s pension has been replaced by a new, temporary and gender-neutral, so called adjustment allowance.
209 The price base amount 2008 is SEK 41 000, and is indexed by the change of the consumer price index. The assumed exchange rate is SEK 9.2501 per EURO. 210 Average age for persons leaving the work force, working at age 50, including disability pensioners. The average age for withdrawal of public pension was 64.6 years 2007. Source: The Swedish Social Insurance Agency.
388
However, due to the long transition period, widow’s pensions will continue to be paid out for several decades. In the new system, a survivor will receive adjustment allowance for 12 months, but the adjustment allowance payments continue as long as the survivor has children younger than 12 years. The size of the adjustment allowance as well as the widow’s pension is based upon the deceased’s earnings. Disability benefits, which are equivalent to disability pensions in most European countries, are not covered by the pension scheme but by the sickness insurance scheme. Also persons with disability benefits accumulate pension entitlements in the DC PAYG and the funded premium pension system. Contributions are paid from the central government budget. Old-age pension benefits for disabled persons, as for everyone else, are based on lifetime earnings. Disability pensions are reported in the group 'Other pensions', and are fully income indexed in the AWG calculations.
1.2. Occupational pensions
More than 90% of all employees, both public and private-sector employees, in Sweden are covered by collective agreements between the unions and the employers’ confederations. Membership in the schemes is mandatory for all employers and employees working in an industry covered by such an agreement. The collective agreements include occupational pension schemes financed through employers’ contributions, which provide pension in addition to the public system, but also pension compensation for incomes above the public system pension ceiling. Thus, these schemes are most important for high-income earners. There are four major occupational plans: blue-collar workers in the private sector, white-collar workers in the private sector, central government employees and local government employees. Recently, these four occupational systems have been reformed from defined benefit to defined contribution. As in the public system there are long transitional periods.
1.3. Private pensions
1.3.1. The funded premium pension system
One part of the public pension is a defined contribution fully funded system, based on contribution rate of 2.5 per cent of earnings, following the same transition rules as the PAYG system. Individuals choose from a large number of mutual funds, how to invest their contributions. The individual mutual funds earn a market rate of return. At retirement, at any age from 61 years, individuals can choose a fixed or variable annuity, in part or in full. Due to a decision from Eurostat, the premium pension has been reclassified from 2007 as belonging to the private sector rather than to general government. The reclassification brings about a reduction of general government net lending by approximately 1 percentage point of GDP, as measured by the European system of national accounts (ESA-95).
1.3.2. Voluntary private pensions
Private pension savings differ from other forms of private savings in that they are tax-deductible. The maximum deduction allowed is half a price base amount (PBA) plus 5 percent of the portion of earned income exceeding 10, but not 20 PBA (i.e. SEK 20 500 to SEK 41 000 in 2008). In 2005, approximately 38 per cent of the population between 20
389

and 64 years, made tax-deductions for private pension savings. Since self-employed persons, whose economic activity takes the form of private business or partnership, are not employed in their company – a necessary condition for an occupational pension – the regulations governing their pension savings come under private pension savings rules. A tax-deduction of half a PBA plus 35 per cent of business income is allowed. The total deduction may not exceed 10.5 PBA:s.211
2. Pension expenditure projections
2.1. Extent of the coverage of the pension schemes in the projections
The projections include the public income pension and the means tested guarantee pension, as well as disability and survivors pensions. The calculations also include occupational and private pension schemes. Compared to the AWG calculations in 2006 the public funded premium pension is now reclassified as a private pension scheme due to a decision from Eurostat. Apart from the population living in Sweden the calculations also cover individuals with Swedish pension rights living abroad.
2.2. Overview of the projection results
Projected gross pension spending from the social security pensions as a percentage of GDP will increase by 0.1 percentage points from 9.3% in 2007 to 9.4% in 2060 in the baseline scenario. One reason for the low increase is that the premium pension has been reclassified to the private sector. As the first payouts from the premium pension were made in 2003, the system will grow in importance throughout the whole period until 2060 as the system is gradually maturing. Also, the widows pension is being phased out. The importance of occupational pensions will grow. The reason is that the coverage, mainly as a result of higher participation rate for women until 1995, results in a higher expenditure to GDP ratio until approximately 2030. After 2030 the share will decrease slightly, as the effect of the ageing population will dominate. The non-mandatory pensions to GDP ratio in 2060 will remain at the same level as today. The increasing share in the next twenty years is the result of already funded money. The savings is likely to decrease as a result of less favourable tax rules and the growing importance of other more attractive investment alternatives.
211 The maximum amount for employed will be reduced to SEK 12 000 from 2009 (thus after the cut off date for the AWG calculations). In real terms the brackets has been unchanged or lowered during the last 20 years. Thus, the brackets in the AWG calculations are price indexed.
390
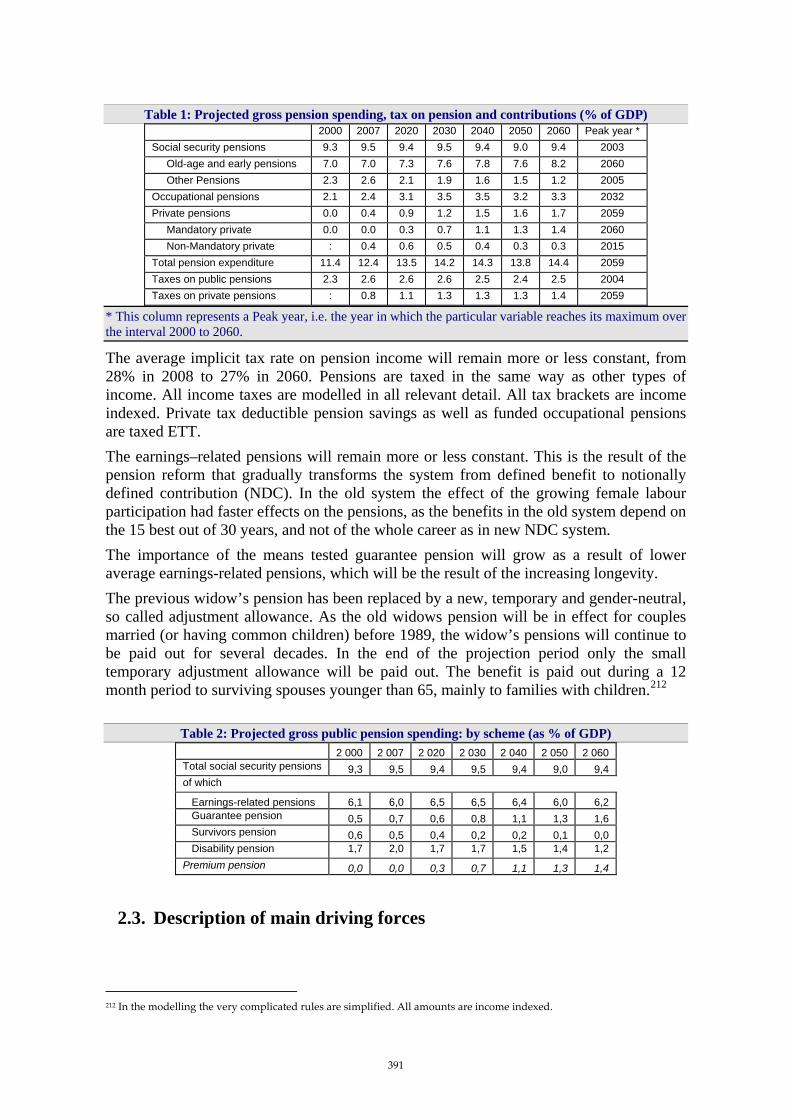
Table 1: Projected gross pension spending, tax on pension and contributions (% of GDP) 2000 2007 2020 2030 2040 2050 2060 Peak year *
Social security pensions 9.3 9.5 9.4 9.5 9.4 9.0 9.4 2003 Old-age and early pensions 7.0 7.0 7.3 7.6 7.8 7.6 8.2 2060 Other Pensions 2.3 2.6 2.1 1.9 1.6 1.5 1.2 2005 Occupational pensions 2.1 2.4 3.1 3.5 3.5 3.2 3.3 2032 Private pensions 0.0 0.4 0.9 1.2 1.5 1.6 1.7 2059 Mandatory private 0.0 0.0 0.3 0.7 1.1 1.3 1.4 2060 Non-Mandatory private : 0.4 0.6 0.5 0.4 0.3 0.3 2015 Total pension expenditure 11.4 12.4 13.5 14.2 14.3 13.8 14.4 2059 Taxes on public pensions 2.3 2.6 2.6 2.6 2.5 2.4 2.5 2004 Taxes on private pensions : 0.8 1.1 1.3 1.3 1.3 1.4 2059
* This column represents a Peak year, i.e. the year in which the particular variable reaches its maximum over the interval 2000 to 2060.
The average implicit tax rate on pension income will remain more or less constant, from 28% in 2008 to 27% in 2060. Pensions are taxed in the same way as other types of income. All income taxes are modelled in all relevant detail. All tax brackets are income indexed. Private tax deductible pension savings as well as funded occupational pensions are taxed ETT. The earnings–related pensions will remain more or less constant. This is the result of the pension reform that gradually transforms the system from defined benefit to notionally defined contribution (NDC). In the old system the effect of the growing female labour participation had faster effects on the pensions, as the benefits in the old system depend on the 15 best out of 30 years, and not of the whole career as in new NDC system. The importance of the means tested guarantee pension will grow as a result of lower average earnings-related pensions, which will be the result of the increasing longevity. The previous widow’s pension has been replaced by a new, temporary and gender-neutral, so called adjustment allowance. As the old widows pension will be in effect for couples married (or having common children) before 1989, the widow’s pensions will continue to be paid out for several decades. In the end of the projection period only the small temporary adjustment allowance will be paid out. The benefit is paid out during a 12 month period to surviving spouses younger than 65, mainly to families with children.212
Table 2: Projected gross public pension spending: by scheme (as % of GDP) 2 000 2 007 2 020 2 030 2 040 2 050 2 060 Total social security pensions 9,3 9,5 9,4 9,5 9,4 9,0 9,4 of which Earnings-related pensions 6,1 6,0 6,5 6,5 6,4 6,0 6,2 Guarantee pension 0,5 0,7 0,6 0,8 1,1 1,3 1,6 Survivors pension 0,6 0,5 0,4 0,2 0,2 0,1 0,0 Disability pension 1,7 2,0 1,7 1,7 1,5 1,4 1,2 Premium pension 0,0 0,0 0,3 0,7 1,1 1,3 1,4
2.3. Description of main driving forces
212 In the modelling the very complicated rules are simplified. All amounts are income indexed.
391

This part provides more details about the development of public pension expenditures (Table 3). It uses a standard decomposition of a ratio of pension expenditures to GDP into the dependency, coverage and benefit ratio and an employment effect.
444 8444 76444 8444 764444 84444 76444 8444 76 RatioBenefitRateEmploymentRatioCoverageRatioDependency
PeopleWorkingGDP
PensionAveragePeopleWorking
PopulationPopulation
PensionersofNumberPopulationPopulation
GDPExpPension ×−×
+×
−+=
/1
6415656415
65.
Note: 'Average pension' = social security pension expenditure divided by the number of pensioners
The only factor that increases the public pension expenditures is the dependency ratio. The increase is higher in the beginning of the projection, but is positive the whole period until 2060. The continued rise or the dependency ratio is due to the increased longevity. Also net migration and fertility rates are positive, and working population continues to grow until approximately 2050. The demographical change measured by the dependency ratio is the only positive factor, and is more or less of the same magnitude as the other three factors together. The coverage ratio, the employment effect and the benefit ratio act as offsetting factors counterbalancing the effect of the demography. The coverage ratio will decrease as a result of fewer individuals with pensions younger than 65. The most striking feature is the decreasing benefit ratio. Several factors contribute to this. The reformed NDC income pension system works on an actuarial basis. At the time of retirement an annuity is calculated by dividing the individual’s account value by a divisor reflecting unisex life expectancy at the specific date of retirement, thus offsetting the effect of the increased longevity. Another important factor is the reclassification of the premium pension from the government to the private sector, which decreases the public benefit ratio, but increases the private, thus leaving the total benefit ratio unchanged. Also other factors contribute, e.g. the phasing out of the widows pension. The employment effect is the result of both increasing participation rate and lower unemployment rate in the beginning of the forecasted period. After 2020 this effect is close to zero. Table 3: Factors behind the public pension expenditures between 2007 and 2060 (in percentage points
of GDP) 2007-20 2020-30 2030-40 2040-50 2050-60 2007-60
Public pensions to GDP in a starting year * -0.1 0.1 -0.1 -0.3 0.3 -0.1 Dependence ratio 2.5 1.0 0.8 0.3 1.0 5.6
Coverage ratio -0.3 0.2 -0.1 0.1 -0.2 -0.4 1/Employment rate -0.4 0.0 0.0 0.0 0.0 -0.4
Benefit ratio -1.5 -1.1 -0.8 -0.6 -0.4 -4.3
* The starting year is 2007 for the column 2007-20 and 2020 for the column 2020-30, etc
The evolution of the replacement ratio, i.e. first pension of those who retire in a given year over an average wage of the economy, is reported in Table 4. The replacement rate from the public pensions will decrease as a result of the growing longevity that reduces the annuity. As the old system is being phased out, and only one part of the new system, the NDC income pension, is reported as a public pension, the public replacement rate will
392
decrease significantly.213 When taking the private premium pension into account, the replacement rate increases about 8 p.p. Part of the fast decrease until 2020 is explained by the fact that the old ATP-system where more generous for some individuals. As all individuals that retires after 2017 will be entirely in the new system, the decrease after 2020 will be more moderate and mainly driven by the increasing longevity. The calculations include pensions to individuals with Swedish pension rights living abroad. Many emigrants have only spent a minor part of their careers in Sweden, and their benefits are thus relatively low. The replacement rate for Swedish pensioners living in Sweden is consequently 4-5 p.p. higher than the numbers in table 4. After some years as retired the replacement rate from the public income pension will be lower, as the system is front-loaded, i.e. the pensioners receive a share of the real economic growth in advance. Technically this is achieved by calculating the annuity factor with a 1.6 per cent discount factor, resulting in a higher initial benefit than a straightforward application the actuarial principles imply. The indexation is then reduced during the pay-out time by subtracting 1.6 per cent from the yearly income indexation. Also the replacement rate from occupational pensions is expected decrease in the future, as a result of the higher longevity and the growing importance of funded defined contribution components. In the AWG calculations only occupational pensions to individuals who also receive public pensions at the same time are considered. Thus, different types of early retirement option programs in collective agreements, agreed disability pensions etc are not included. The replacement rate from the mandatory private premium pension will increase rapidly from zero to about 7-8 p.p. 2030 as the system is maturing. As the premium pension is funded and earns a market rate of return that is assumed to be higher than the income growth, the replacement rate is expected to resist the effect of the increasing longevity. The replacement rate for Private voluntary pensions, for the individuals who have it, is high. This is explained by the fact that most recipients chooses to get the saving paid out during a 5 year period. This means that the benefit ratio will be substantially lower after 5 years as retired.
213 Of technical reasons the housing supplement for pensioners is not included in the replacement rates in table 4.
393

Table 4: Replacement rate and coverage by pension scheme (in %)214 2000 2007 2020 2030 2040 2050 2060
Social security scheme : 49.1 37.0 35.8 33.1 31.6 31.2 Coverage * 100.0 100.0 100.0 100.0 100.0 100.0 100.0
Occupational scheme 14.2 17.3 20.6 19.6 17.0 15.5 15.5 Coverage 56.9 55.2 66.1 71.8 77.8 82.0 86.2
Private scheme, mandatory : 0,9 4,8 7,2 8,7 8,3 8,1 Coverage 0.0 100.0 100.0 100.0 100.0 100.0 100.0
Private scheme, voluntary 18,7 12,9 9,5 7,2 5,8 4,8 Coverage
Total all pensions 51 51 50 48 45 44 Coverage
* Coverage of each pension scheme is calculated as a ratio of the number of pensioners within the scheme and the total number of pensioners in the country.
We have seen that the ageing of the Swedish society is the driving force of the future development of pension expenditures in relation to GDP. Table 5 shows, that until 2060, the number of pensioners will increase by 76 %. At the same time the umber of contributors will grow by 5% and employment by 8 %. The combined effect of this is that the support ratio, i.e. the number of contributors per pensioner, will decrease from 2.57 to 1.54. The number of pensioners substantially exceeds the number of individuals aged 65+. One reason to this is that the calculations also cover individuals with Swedish pensions living abroad. Thus, the number of pensioners is 2,9 millions in the zero migration alternative. Another reason that the number of pensioners exceeds the population 65+, is that disability pensioners and individuals with survivors benefits is included. Also the number of contributors exceed the number of employed, as contributions are also paid by the central government to cover pension entitlements credited for income replacement social insurances, e.g. for unemployment, sickness, disability and parental leave. Self-employed are also included in the system.
Table 5: Number of pensioners and contributors in the Social security scheme (in 1000), population over 65 and total employment (in 1000) and related ratios (%)
2000 2007 2020 2030 2040 2050 2060 Number of pensioners (I) 1897 2167 2716 3117 3400 3552 3807 Number of people aged 65+ (II) 1533 1581 2050 2313 2541 2638 2893 Ratio of (I) and (II) 1.24 1.37 1.32 1.35 1.34 1.35 1.32 Number of contributors (III) 5244 5569 5693 5761 5801 5923 5849 Employment(IV) 4050 4444 4704 4759 4806 4879 4805 Ratio of (III) and (IV) 1.29 1.25 1.21 1.21 1.21 1.21 1.22 Ratio of (III) and (I) 'support ratio' 2.76 2.57 2.10 1.85 1.71 1.67 1.54
The Swedish pension system has accumulated a substantial buffer fund since the beginning of the 1960s. As a part of the reform, around 30 per cent of this fund was transferred to the central government in order to cover central government’s extended obligations. The remainder of the fund has been transformed into a buffer fund within the reformed system. Although there is no pre-funding, the system may accumulate a buffer fund due to variations in the demographic structure of the Swedish population, as the contributions will be higher than the expenditures (including administrative costs). Due to
214 Coverage of each pension scheme is calculated as a ratio of the number of pensioners within the scheme and the total number of pensioners in the country.
394

a government decision in 2001 the public pension fund was allowed to invest a bigger share of the assets in the stock market. Thus the non-consolidated part of the fund is expected to grow, and the consolidated share to decrease. Also the occupational funds are projected to grow. Recently, the occupational systems have been reformed from defined benefit to defined contribution, thus accumulating substantial funds. As in the public system there are long transitional periods. The funds are taxed ETT. The private funds in the premium pension system are increasing fast. As the system was introduced in 2003, the funds will grow as a share of GDP until 2040 to 2050 when the ratio levels out round 35% of GDP. The premium pension funds are EET, but there is administrative cost, both for the administration of the system and the mutual funds, that is charged to the funds.215
Table 6: Assets of pension funds and reserves, (% of GDP) 2000 2007 2020 2030 2040 2050 2060
Public Pension funds 32.2 29.3 30.0 31.0 31.5 35.4 40.5 Of which liquid financial assets, non-
consolidated 15.6 20.4 22.4 23.4 23.8 26.7 30.5
Of which liquid financial assets, consolidated
16.6 8.9 7.6 7.6 7.8 8.7 10.0
Occupational pensions 2.0 12.4 21.3 21.7 17.9 14.0 9.3 Private pensions 1.6 11.1 22.8 30.1 34.0 35.3 35.3 All pensions 35.9 52.8 74.1 82.8 83.4 84.7 85.1
2.4. Sensitivity analysis
Sensitivity analysis shows that apart from the zero migration and the higher interest scenarios, calculated pension expenditures to GDP stay within a small band around the baseline scenario. For most of the scenarios the deviation fluctuates of +/- 0.4 p.p around the baseline scenario. The biggest difference is in the zero migrations scenario, which results in 1.6 p.p. higher expenditure to GDP ratio by 2060. One reason to this is that the number of retired will increase relatively the number of working. Another reason is that the public income pension is growing with average wages, but the contributions with the sum of wages, that is dependent on the level of employment. In the real world the results should be different because of the automatic balancing mechanism. In the current model simulations this mechanism is switched off though.216 If the balancing is activated the indexation will be lowered, and consequently the paid out pensions will decrease, until the financial stability of the system is recovered. Also other pension components are affected. The reason to the higher GDP-share in the high interest alternative, plus 1.1 p.p., is that the premium pensions, as well as funded occupational pensions, will increase. The individual mutual funds earn a market rate of return, which means that higher interest also means higher pensions. As long as the interest rate is higher than the income growth, the premium pension will grow faster than GDP.
215 Due to technical problems it’s not possible to report the funds from the voluntary private pension savings. 216 To calculate the balance ratio the model demands very careful calibration, as the so called balance ratio is very close to one, i.e. the level where the indexation is engaged.
395

The small effects within the higher life expectancy scenario, it that the public income pension as well as occupational and private funded pensions are adjusted on an actuarial basis, thus compensating for the increase in the longevity. When the actuarial pensions decreasing, the means tested guarantee pension and the housing supplement will increase, thus explaining the increase in the pensions to GDP ratio. In the higher labour productivity scenario, as well as in the higher employment scenarios, the higher income growth result in higher pensions, but they are growing in the same pace as GDP.
Table 7: Total and public pension expenditures under different scenarios 2007 2020 2030 2040 2050 2060
Total Pension Expenditure Baseline 12.4 13.5 14.2 14.3 13.8 14.4 Higher life expectancy 12.4 13.4 14.2 14.4 14.0 14.7 Higher lab. productivity 12.4 13.4 14.0 14.0 13.4 14.0 Higher interest rate 12.4 13.7 14.7 15.1 14.8 15.5 Higher emp. rate 12.4 13.3 14.0 14.2 13.7 14.3 Higher emp. of older workers 12.4 13.3 14.0 14.2 13.6 14.2 Zero migration 12.4 14.1 15.5 16.1 15.5 16.0
Public Pension Expenditure Baseline 9.5 9.4 9.5 9.4 9.0 9.4 Higher life expectancy 9.5 9.4 9.5 9.4 9.2 9.6 Higher lab. productivity 9.5 9.4 9.4 9.2 8.9 9.2 Higher interest rate 9.5 9.4 9.5 9.4 9.1 9.4 Higher emp. rate 9.5 9.3 9.4 9.3 9.0 9.3 Higher emp. of older workers 9.5 9.3 9.3 9.3 8.9 9.2 Zero migration 9.5 9.8 10.2 10.3 9.9 10.1
2.5. Description of the changes in comparison with the 2001 and 2006 projections
Compared to the 2006 projections the public pensions to GDP ratio will be significantly lower. The decrease in GDP ratio until 2050 is to a large extent explained by the reclassification of the funded premium pension in the national accounts from of the government to the private sector. This explains the most of the decrease in the benefit ratio. Compared to 2006 the changes in the dependency ratio, the coverage ratio and the employment effect are relatively small. No reforms that will effect the picture has been done.
396
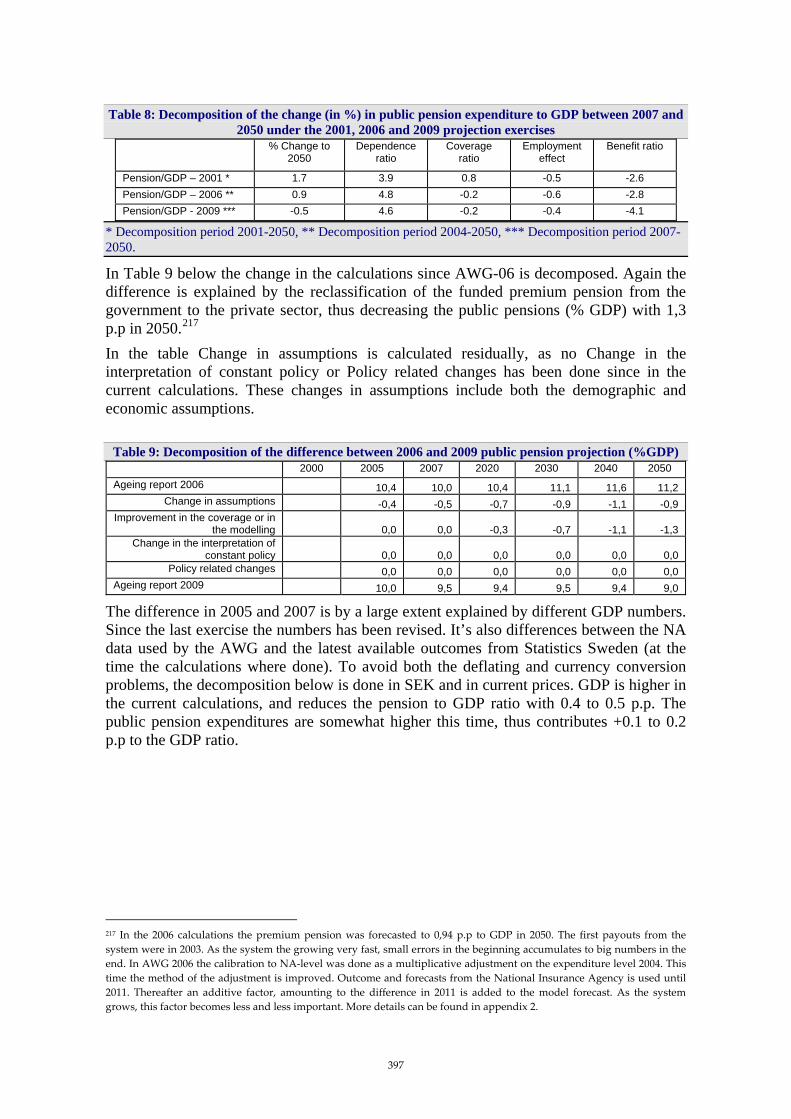
Table 8: Decomposition of the change (in %) in public pension expenditure to GDP between 2007 and 2050 under the 2001, 2006 and 2009 projection exercises
% Change to 2050
Dependence ratio
Coverage ratio
Employment effect
Benefit ratio
Pension/GDP – 2001 * 1.7 3.9 0.8 -0.5 -2.6 Pension/GDP – 2006 ** 0.9 4.8 -0.2 -0.6 -2.8 Pension/GDP - 2009 *** -0.5 4.6 -0.2 -0.4 -4.1
* Decomposition period 2001-2050, ** Decomposition period 2004-2050, *** Decomposition period 2007-2050.
In Table 9 below the change in the calculations since AWG-06 is decomposed. Again the difference is explained by the reclassification of the funded premium pension from the government to the private sector, thus decreasing the public pensions (% GDP) with 1,3 p.p in 2050.217 In the table Change in assumptions is calculated residually, as no Change in the interpretation of constant policy or Policy related changes has been done since in the current calculations. These changes in assumptions include both the demographic and economic assumptions.
Table 9: Decomposition of the difference between 2006 and 2009 public pension projection (%GDP) 2000 2005 2007 2020 2030 2040 2050
Ageing report 2006 10,4 10,0 10,4 11,1 11,6 11,2 Change in assumptions -0,4 -0,5 -0,7 -0,9 -1,1 -0,9
Improvement in the coverage or in the modelling
0,0 0,0 -0,3 -0,7 -1,1 -1,3
Change in the interpretation of constant policy
0,0 0,0 0,0 0,0 0,0 0,0
Policy related changes 0,0 0,0 0,0 0,0 0,0 0,0 Ageing report 2009 10,0 9,5 9,4 9,5 9,4 9,0
The difference in 2005 and 2007 is by a large extent explained by different GDP numbers. Since the last exercise the numbers has been revised. It’s also differences between the NA data used by the AWG and the latest available outcomes from Statistics Sweden (at the time the calculations where done). To avoid both the deflating and currency conversion problems, the decomposition below is done in SEK and in current prices. GDP is higher in the current calculations, and reduces the pension to GDP ratio with 0.4 to 0.5 p.p. The public pension expenditures are somewhat higher this time, thus contributes +0.1 to 0.2 p.p to the GDP ratio.
217 In the 2006 calculations the premium pension was forecasted to 0,94 p.p to GDP in 2050. The first payouts from the system were in 2003. As the system the growing very fast, small errors in the beginning accumulates to big numbers in the end. In AWG 2006 the calibration to NA-level was done as a multiplicative adjustment on the expenditure level 2004. This time the method of the adjustment is improved. Outcome and forecasts from the National Insurance Agency is used until 2011. Thereafter an additive factor, amounting to the difference in 2011 is added to the model forecast. As the system grows, this factor becomes less and less important. More details can be found in appendix 2.
397

Table 10: Decomposition of the difference between 2006 and 2008 public pension projections (%GDP), (Current prices and SEK)
2005 2007 Ageing report 2006 10.37 9.95 Revised pension expenditures 0.19 0.10 Revised GDP -0.43 -0.53 Ageing report 2009 Actual NA, current prices, SEK 10.13 9.52 AWG 2008 NA, Fixed price, Euros 10.0 9.5
398

United Kingdom (Report prepared by Kerstin Greeb and Geraldine Koh)
1. Overview of the pension system
The UK pension system can be divided into three tiers: Tier I is provided by the state and consists of a basic level of pension provision to which everyone either contributes or has access. It consists of the flat rate (contributory) Basic State Pension and means-tested supplements through the Pension Credit, which provides a minimum level of retirement income. Tier II is also provided by the state but is earnings-related and as such is less redistributive than Tier I. It consists of the State Second Pension (S2P), of which people can opt out. Both Tier I and II are unfunded pension schemes, operating on a ‘pay-as-you-go’ basis through the National Insurance (NI) system. Tier III consists of private pensions, which are voluntary pension arrangements that are not directly funded by the state. If certain criteria are met, these can be subject to tax exemption. A number of additional benefits for old persons are covered in this report, namely winter fuel payments, free TV licences and Christmas bonuses. Note that private pensions are not covered in the UK pension projections and the rest of this report excludes them.
1.1. The UK Pension System
State Pension Age Receipt of state pension benefits depends on an individual’s age. The current State Pension Age (SPA) is 65 for men and 60 for women. Between 2010 and 2020 the SPA for women will increase to 65. This change was already factored into the UK’s pension projections for the 2006 EPC projections. The Pension Act 2007 sets out further increases for the SPA for men and women from 65 to 66 between 2024 and 2026, 67 between 2034 and 2036, and 68 between 2044 and 2046. These changes are taken into account in the latest set of pension projections presented in this report. TIER I: The Basic State Pension The full Basic State Pension (BSP) in financial year 2008/09 is £90.70 per week for a single person and £145.05 for married couples. However, receipt is based on someone’s National Insurance Contribution (NIC) history. At present a man will receive a full BSP after making contributions for 44 of the 49 years between age 16 and 65 while a women currently only needs to make contributions for 39 years in order to receive a full pension – due to the lower retirement age. If someone does not have a full contribution record then they receive a partial award. Under reforms also included in the Pension Act 2007 and due to be introduced in 2010 the number of contributing years required to receive a full BSP will be reduced to 30.
399

The BSP currently increases in line with prices, however, in future BSP will be indexed to National Average Earnings, starting from a point during the next Parliament; the projections assume 2012. These reforms were not included in the 2006 EPC projections, but are included in the latest projections. The Pension Credit The contribution-based BSP is not the minimum income that the Government guarantees to pensioners in the UK. This minimum income guarantee is given by means-tested benefits, of which the Pension Credit is the most important. It is available to people aged 60 and over and it tops up the income of people with low and moderate incomes. The Pension Credit has two elements: the Guarantee Credit and the Savings Credit (which is only available to people aged 65 and over). These two components add up to a benefit, which tops people’s income up to a level of income and then is tapered away at 40 pence for every £1 extra of pre-benefit income above a particular level. The Guarantee Credit tops peoples’ income up to £124.05 per week for a single person in 2008/09. For individuals above age 65 this is combined with the Savings Credit to ensure that the effective withdrawal rate of the Pension Credit (Guarantee Credit and Savings Credit) is 40 per cent if pre-benefit income is above the ‘savings credit threshold’, which is currently slightly higher than the BSP. The minimum age for access to Pension Credit will rise in line with changes to the State Pension Age explained above. As with BSP, the Pension Act 2007 states that the Pension Credit will be indexed in line with earnings until 2015, after which the Savings Credit will be increased in line with prices, while the Guarantee Credit level will continue to be uprated with earnings. TIER II State Second Pension Since 1978, the UK has had a mandatory second tier earnings-related pension system for employees. This system requires all employees either to be members of the S2P or to make equivalent private savings in a contracted-out pension. For the purpose of calculating S2P entitlement, earnings are divided into 3 separate bands, which in April 2008 were:
- £4,680 and £13,500 - £13,500 and £31,100 - £31,100 and £40,040.
For an individual with potential total membership of S2P of 49 years, pension accrual will be:
- 40% / 49 for earnings in the first band - 10% / 49 for earnings in the second band - 20% / 49 for earnings in the third band.
In addition where earnings are below the first band, the individual is treated as if they earned at the lower threshold of this band. What part of income pension rights accrue on and what the accrual rate is are determined by the income band structure given by the system of National Insurance contributions.
400

Public service pensions The Government provides occupational pension schemes to public sector employees, which are unfunded. The main schemes cover the National Health Service, teachers, civil service, armed forces, police, fire fighters, judiciary and the Atomic Energy Authority. Receipts are based on the various pension schemes and factors such as years in service and earnings. Other pensioner benefits The other benefits included in the projections are:
- Winter Fuel Payments, paid at a flat rate of £200 for people aged 60 to 79, and £300 for those aged 80 or over.
- Free TV licences for people aged 75 or over. - Christmas Bonus, a flat £10 paid once a year for those receiving the State Pension.
These benefits are not systematically increased each year, though the value of Free TV licences rises in line with TV licence fees, currently assumed to increase at 1.5 percentage points above Retail Price inflation. No distinction is made between the general state pension and disability and survivor pensions for individuals above state pension age. The projections do therefore not show these separately, but they do include benefits to disabled persons and survivors.
2. Pension expenditure projections
As table 1 shows, gross social security pensions will increase from 6.6% of GDP in 2007 to 9.3% of GDP by 2060. The increase is relatively constant between 2007 and 2050 and slightly elevated thereafter. This pattern is the result of the 2007 pension reforms. Increases in the State Pension Age are planned for each of the decades up to 2050, which exercises downward pressure on pension expenditure. Until 2046, when the last increase has taken place, this offsets upward pressure in pension expenditure from linking Basic State Pension and Pension Credit to earnings. After 2046, the projected pension expenditure therefore increases at a higher rate.
Table 1: Projected gross pension spending, tax on pension and contributions (% of GDP) 2007 2020 2030 2040 2050 2060 Peak
year Social security pensions 6.6 6.9 7.6 8.0 8.1 9.3 2060
Old-age and early pensions
5.8 6.5 7.3 7.8 7.9 9.1 2060
Other Pensions N/a N/a N/a N/a N/a N/a N/a Occupational pensions N/a N/a N/a N/a N/a N/a N/a
Private pensions N/a N/a N/a N/a N/a N/a N/a Mandatory private N/a N/a N/a N/a N/a N/a N/a
Non-Mandatory private N/a N/a N/a N/a N/a N/a N/a Total pension
expenditure 6.6 6.9 7.6 8.0 8.1 9.3 2060
Taxes on public pensions
N/a N/a N/a N/a N/a N/a N/a
Taxes on private pensions
N/a N/a N/a N/a N/a N/a N/a
Table 2 breaks pension expenditure down by the different elements of the pension system. Indexing Basic State Pension in line with earnings and increasing the coverage by
401

reducing the number of contributory years necessary to acquire full entitlement will increase expenditure. However, by being more generous it will also reduce the need for means-tested benefits and therefore reduce Pension Credit expenditure.
Table 2: Projected gross public pension spending: by scheme (as % of GDP) 2007 2020 2030 2040 2050 2060 Peak
year Total social security
pensions 6.6 6.9 7.6 8.0 8.1 9.3 2060
Basic State Pension 3.5 3.6 4.0 4.4 4.3 4.8 2060 Pension Credit 0.5 0.3 0.2 0.2 0.1 0.1 2007
S2P (and SERPS) 0.8 1.0 1.1 1.4 1.6 2.2 2060 Public sector employees 1.6 1.9 2.1 2.0 2.0 2.1 2060
Other 0.2 0.1 0.1 0.1 0.1 0.1 2007
Table 3 shows the factors driving pension expenditure. The main driver for the projected increase in expenditure is the increase in the relative number of pensioners, as illustrated by the increase in the dependence ratio. Another contributing factor is increased labour market participation (and therefore build up of pension rights) among females. Table 3: Factors behind the public pension expenditures between 2007 and 2060 (in percentage points
of GDP) 2007-20 2020-30 2030-40 2040-50 2050-60 2007-60
Dependence ratio 1.2 1.1 0.9 0.2 1.0 4.4 Coverage ratio N/a N/a N/a N/a N/a N/a
1/Employment rate N/a N/a N/a N/a N/a N/a Benefit ratio N/a N/a N/a N/a N/a N/a
The increase in the dependency ratio is driven by the increase in the number of pensioners, as shown in table 4. One interesting aspect shown by the numbers is the drop in the ratio of the number of pensioners versus the number of people aged 65+. As the State Pension Age increases to 65 for females by 2020 and then to 68 for everyone by 2046, the proportion of people receiving state pensions before age 65 will drop.
Table 4: Number of pensioners and contributors in the Social security scheme (in 1000), population over 65 and total employment (in 1000) and related ratios (%)
2007 2020 2030 2040 2050 2060 Number of pensioners (I) 12,100 13,600 15,600 17,300 17,300 19,300
Number of people aged 65+ (II)
9,700 12,000 14,200 16,200 17,100 19,000
Ratio of (I) and (II) 1.2 1.1 1.1 1.1 1.0 1.0 Number of contributors (III) N/a N/a N/a N/a N/a N/a
Employment(IV) 28,900 30,700 31,400 32,500 33,500 33,500 Ratio of (III) and (IV) N/a N/a N/a N/a N/a N/a
Ratio of (III) and (I) 'support ratio'
N/a N/a N/a N/a N/a N/a
Sensitivity analysis Table 5 shows the pension projections for the following sensitivity scenarios:
• High life expectancy (+1 year in 2060) • Higher labour productivity growth (+0.25 p.p.) • Higher interest rate • Higher employment rate of older workers (+5%, higher participation) • Higher employment rate (+1%, lower unemployment) • Zero migration
402

Table 5: Total and public pension expenditures under different scenarios (deviation from baseline
scenario) 2007 2020 2030 2040 2050 2060
Baseline 6.6 6.9 7.6 8.0 8.1 9.3 Higher life expectancy 6.6 6.9 7.7 8.2 8.3 9.6
Higher lab. productivity 6.6 7.0 7.6 8.0 8.1 9.2 Higher interest rate 6.6 6.9 7.6 8.0 8.1 9.3
Higher emp. rate 6.6 6.8 7.5 8.0 8.0 9.2 Higher emp. of older workers 6.6 6.8 7.5 8.0 8.0 9.2
Zero migration 6.6 7.4 8.5 9.7 10.2 11.6
Higher life expectancy: As life expectancy increases and entitlement periods lengthen pension expenditure also increases. Compared to the baseline scenario, the higher life expectancy scenario therefore also shows higher total pension spending. Higher labour productivity: The impact of assuming higher labour productivity is limited. While pension expenditure increases as state pensions are indexed in line with earnings, GDP also increases. As share of GDP, therefore, total pension expenditure under this scenario is only slightly below the baseline projection. Higher employment rates of older workers; higher employment rates of all workers: Both scenarios based on higher employment rates are slightly below the baseline projections, but the difference is small. Higher employment rates increase individuals’ pension rights (putting upward pressure on pension spending), however by increasing individuals’ pensions they reduce the amount of means-tested pension payments (asserting downward pressure on pension spending). Zero migration: This scenario significantly reduces the number of workers relative to the number of pensioners and therefore significantly increases the total pension expenditure as share of GDP when compared to the baseline scenario. Comparison with 2006 projections As table 6 shows, the latest projections are lower than the 2006. This is the result of a number of factors, working to some extend in opposite directions.
Table 6: Comparison of 2006 and 2009 baseline pension projections 2020 2030 2040 2050 2060
2009 projection 6.9 7.6 8.0 8.1 9.3 2006 projection 6.9 7.9 8.4 8.6 -
As explained above, the 2007 pension reforms have had a mixed effect – increases in the State Pension Age reduced projected pension expenditure, while making the system more generous increased pension expenditure. Overall, this slightly increased projected pension expenditure. However, this effect was more than offset by the difference in the dependency ratio of Eurostat’s population projections for the 2009 and 2006 projections. As table 7 shows, the
403

old-age dependency ratio218 over the entire projection period is lower for the 2009 projection exercise than it was for the 2006 projection exercise.
Table 7: Old-age dependency ratio in the 2006 and 2009 projection exercises 2010 2020 2040 2050
2009 projection 24.7 28.6 36.9 38.0 2006 projection 25.1 30.3 43.6 45.0
218 Ratio of those aged 65+ to those aged 15-64.
404

Norway (Report prepared by Yngvar Dyvi)
1. Overview of the pension system
1.1. Elements in the Norwegian old age pension system
The Norwegian pension system consists of the following elements: • A universal Social security old age pensions system • Contractual early retirement scheme (AFP), covering about 80 per cent of
employees approaching retirement. • Mandatory government occupational pension schemes • Mandatory (as from 2006) private sector occupational pension schemes • Private individual pension schemes.
Social security old age pensions include a minimum income guarantee and an earnings-based benefit. It is financed on a pay-as-you-go basis. On average, but depending on income and time of retirement, social security old age pensions amount to 55 per cent of average income throughout the work-career. A new (reformed) old age pension system is to be gradually phased in from 2010. Main elements of the reform of the social security old age pension system are: The expenditure risk associated with increases in longevity is shifted from tax payers to each cohort of pensioners through an actuarial mechanism. The new system converts the implicit pension wealth of accumulated entitlements into an annuity over the average expected remaining lifetime. An increase in the expected number of retirement years reduces the annual benefit so that the present value of total expected pension benefits is nearly invariant to changes in the cohort’s remaining life expectancy and the individual’s retirement age. The statutory retirement age of 67 years is replaced with a flexible retirement age from the age of 62 years. The government occupational pension schemes supplement the social security old age pension system by guaranteeing government sector employees gross pension benefits of at least 2/3 of final gross wages from the age of 67 (in practice 65 or earlier), given at least 30 years of service . On average, and less depending on income, the government occupational pension schemes together with the social security old age pension, amounts to near 75 - 80 per cent of work income. The central government occupational pension scheme is financed by employee contributions (2 per cent of wages) and transfers from the state budget. Local government occupational pension schemes are funded systems, with premiums from employees at 2 per cent of wages and additional funding provided by employers. The pension funds may be administered by insurance companies or locally. Mandatory private sector occupational pension were introduced in 2006, but non-mandatory defined benefit schemes (and since 2001 also defined contribution schemes) have existed for a long time. The introduction was a part of the pension reform process.
405
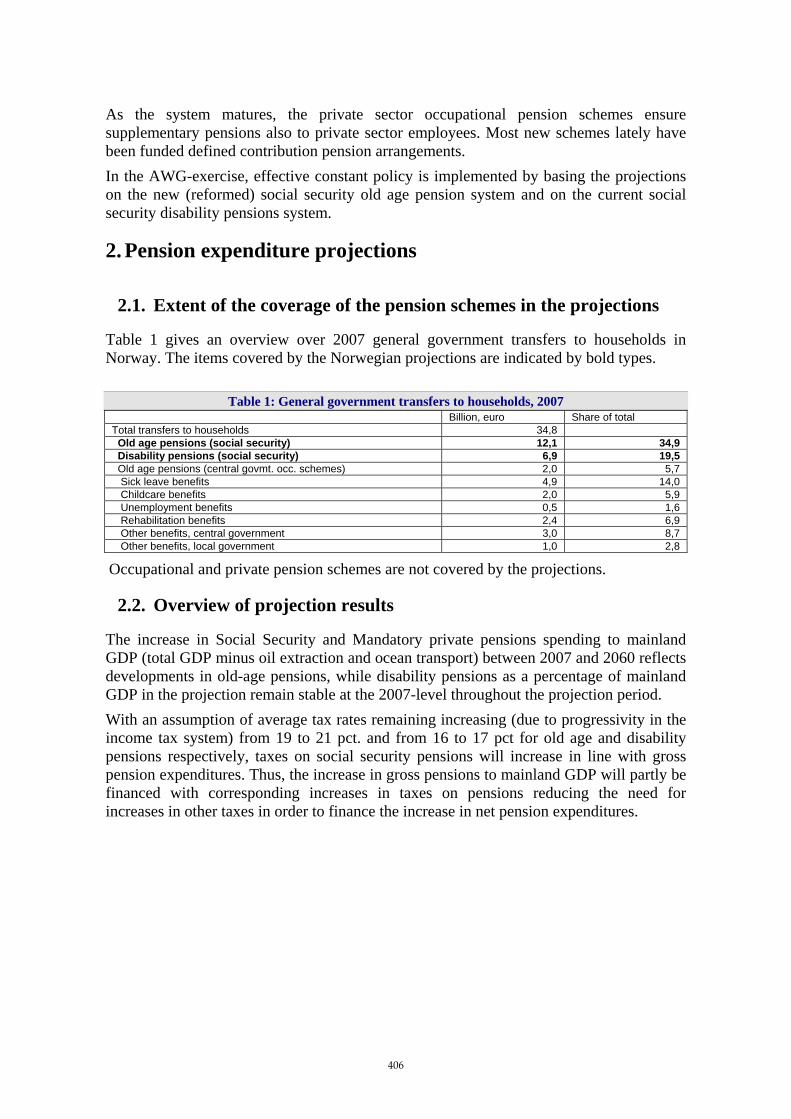
As the system matures, the private sector occupational pension schemes ensure supplementary pensions also to private sector employees. Most new schemes lately have been funded defined contribution pension arrangements. In the AWG-exercise, effective constant policy is implemented by basing the projections on the new (reformed) social security old age pension system and on the current social security disability pensions system.
2. Pension expenditure projections
2.1. Extent of the coverage of the pension schemes in the projections
Table 1 gives an overview over 2007 general government transfers to households in Norway. The items covered by the Norwegian projections are indicated by bold types.
Table 1: General government transfers to households, 2007 Billion, euro Share of total Total transfers to households 34,8 Old age pensions (social security) 12,1 34,9 Disability pensions (social security) 6,9 19,5 Old age pensions (central govmt. occ. schemes) 2,0 5,7 Sick leave benefits 4,9 14,0 Childcare benefits 2,0 5,9 Unemployment benefits 0,5 1,6 Rehabilitation benefits 2,4 6,9 Other benefits, central government 3,0 8,7 Other benefits, local government 1,0 2,8
Occupational and private pension schemes are not covered by the projections.
2.2. Overview of projection results
The increase in Social Security and Mandatory private pensions spending to mainland GDP (total GDP minus oil extraction and ocean transport) between 2007 and 2060 reflects developments in old-age pensions, while disability pensions as a percentage of mainland GDP in the projection remain stable at the 2007-level throughout the projection period. With an assumption of average tax rates remaining increasing (due to progressivity in the income tax system) from 19 to 21 pct. and from 16 to 17 pct for old age and disability pensions respectively, taxes on social security pensions will increase in line with gross pension expenditures. Thus, the increase in gross pensions to mainland GDP will partly be financed with corresponding increases in taxes on pensions reducing the need for increases in other taxes in order to finance the increase in net pension expenditures.
406

Table 2: Projected gross pension spending, tax on pension and contributions (% of mainland GDP) 2000 2007 2020 2030 2040 2050 2060 Peak year
* Social security pensions 6.2 8.9 11.5 12.7 13.4 13.3 13.6 2060 Old-age and early pensions
3.9 5.7 8.2 9.4 10.3 10.2 10.4 2060
Other Pensions 2.3 3.2 3.2 3.3 3.1 3.2 3.2 2029 Occupational pensions : : : : : : : : Private pensions : : : : : : : : Mandatory private : : : : : : : : Non-Mandatory private : : : : : : : : Total pension expenditure : : : : : : : : Taxes on public pensions : : : : : : : : Taxes on private pensions : : : : : : : :
* This column represents a Peak year, i.e. the year in which the particular variable reaches its maximum over the interval 2000 to 2060.
2.3. Description of main driving forces behind the projection results and their implications for main items from a pension questionnaire
Table 3 provides more details about the development of public pension expenditures It uses a standard decomposition of a ratio of pension expenditures to mainland GDP into the dependency, coverage and benefit ratio and an employment rate:
444 8444 76444 8444 764444 84444 76444 8444 76 RatioBenefitRateEmploymentRatioCoverageRatioDependency
PeopleWorkingGDP
PensionAveragePeopleWorking
PopulationPopulation
PensionersofNumberPopulationPopulation
GDPExpPension ×−×
+×
−+=
/1
6415656415
65.
Population ageing in line with the EUROSTAT demographic projections is the main driving force behind the increase in old age pensions. This is in accordance with projections based on national demographic projections. With increases in expected lifetime, the conversion of the implicit pension wealth of accumulated entitlements into an annuity over the average expected remaining lifetime implies that developments in the benefit ratio will counteract the contribution of ageing on old age pension expenditures. Table 3: Factors behind the public pension expenditures between 2007 and 2060 (in percentage points
of mainland GDP) 2007-20 2020-30 2030-40 2040-50 2050-60 2007-60
Public pensions to GDP in a starting year *
2.7 1.2 0.7 -0.1 0.3 4.7
Dependence ratio 2.5 2.4 2.1 0.4 0.8 8.2 Coverage ratio 0.0 -0.6 -0.7 0.0 0.1 -1.2
1/Employment rate 0.2 0.1 0.0 0.0 0.0 0.3 Benefit ratio -0.2 -0.5 -0.7 -0.5 -0.6 -2.4
* The starting year is 2007 for the column 2007-20 and 2020 for the column 2020-30, etc
407

Table 4: Replacement rate and coverage by pension scheme (in %)219 2000 2007 2020 2030 2040 2050 2060
Social security scheme : : : : : : : Coverage * 100.0 100.0 100.0 100.0 100.0 100.0 100.0
Occupational scheme : : : : : : : Coverage : : : : : : :
Private scheme : : : : : : : Coverage : : : : : : :
* Coverage of each pension scheme is calculated as a ratio of the number of pensioners within the scheme and the total number of pensioners in the country.
The assumption of constant group-specific entry rates to the disability pension schemes implies a substantially lower projected growth in the number of disability pensioners compared to the 2000 - 2007 period. A more marked postponement of retirement and a corresponding stronger decrease in the coverage ratio compared to the baseline projections, would – as reflected in national projections and in line with the annuity mechanisms described above – lead to offsetting increases in the benefit ratio leaving the old age pension expenditures more or less unchanged compared to the baseline scenario. A more marked postponement of retirement and a corresponding increase in the employment rate would however contribute to a reduction in the pension to mainland GDP ratio, reflecting increases in employment, private sector income and tax bases.
Table 5: Number of pensioners and contributors in the Social security scheme (in 1000), population over 65 and total employment (in 1000) and related ratios (%)
2000 2007 2020 2030 2040 2050 2060 Number of pensioners (I) 889 939 1286 1504 1683 1783 1909 Number of people aged 65+ (II)
683 686 937 1157 1363 1439 1534
Ratio of (I) and (II) 130 137 137 130 124 124 124 Number of contributors (III) : : : : : : : Employment(IV) 2239 2374 2484 2517 2532 2597 2612 Ratio of (III) and (IV) : : : : : : :
Ratio of (III) and (I) 'support ratio' : : : : : : :
The Government Pension Fund was established with effect from 1 January 2006, encompassing the former Government Petroleum and National Insurance Scheme Funds. The purpose of the Fund is to strengthen general long-term considerations in the use of government petroleum revenues and to facilitate government savings to meet future increases in government expenditures, of which age related increases in pensions and health and long term care services constitute major components. The revenues of the Government Pension Fund – Global consists of the State’s cash flow from petroleum activities, which is transferred from the central government budget, the return on the Fund’s capital, and net results of financial transactions associated with state ownership in petroleum activities. The revenue of the Government Pension Fund – Norway is the return on the capital under management. The Ministry of Finance is responsible for the Management of the Fund, while the operational management is left with Norges Bank (Fund – Global) and Folketrygdfondet (Fund – Norway). 219 Coverage of each pension scheme is calculated as a ratio of the number of pensioners within the scheme and the total number of pensioners in the country.
408

The Government Pension Fund is growing rapidly and is becoming one of the world’s largest funds. Presently, the value of the Fund assets comes close to the size of the Norwegian GDP, and the return on the Fund will make considerable contributions to the funding of state expenditure in coming years.
Table 6: Assets of pension funds and reserves, (% of GDP) 2000 2007 2020 2030 2040 2050 2060
Public Pension funds : : : : : : : Of which liquid financial assets, non-
consolidated : : : : : : :
Of which liquid financial assets, consolidated
: : : : : : :
Occupational pensions : : : : : : : Private pensions : : : : : : : All pensions : : : : : : :
2.4. Sensitivity analysis
Table 7 illustrates the sensitivity of pension schemes to different economic assumptions. Important factors may be summarised as follows:
− Higher life expectancy contributes to an increase in the number old age pensioners. The effect of pension expenditures is counteracted by the conversion of the implicit pension wealth of accumulated entitlements into an annuity over an increased average expected remaining lifetime.
− In the higher labour productivity scenario, wage indexation contributes to higher pension expenditures. However, corresponding increases in private sector income and tax bases leaves the pension to mainland GDP ratio unchanged compared to the baseline projections
− Higher interest rates will have no effects on pension expenditures in the MOSART-model.
− Zero migration lowers pension expenditures, but the associated stronger decrease in mainland GDP implies an increase in the pension to mainland GDP ratio. The model-simulations imply that lower migration leads to an increase in the average pension.
Table 7: Total and public pension expenditures under different scenarios (deviation from baseline
scenario) 2007 2020 2030 2040 2050 2060
Public Pension Expenditure Baseline 8.9 11.5 12.7 13.4 13.3 13.6 Higher life expectancy 8.9 11.6 13.0 13.7 13.6 13.8 Higher lab. productivity 8.9 11.5 12.7 13.4 13.3 13.6 Higher interest rate 8.9 11.5 12.7 13.4 13.3 13.6 Higher emp. rate 8.9 11.4 12.5 13.2 13.1 13.3 Higher emp. of older workers #N/A #N/A #N/A #N/A #N/A #N/A Zero migration 8.9 12.2 14.0 15.1 14.9 14.9
2.5. Description of the changes in comparison with the 2001 and 2006 projections
Norway did not take in pert in the 2001 and 2006 projections.
409