Embed Size (px)
Citation preview
People living in bad
housing – numbers
and health impacts
Date: August 2013
Prepared for: Shelter
By: Matt Barnes, Carl Cullinane, Sara Scott and Hannah Silvester
At NatCen Social Research we believe that social research has the power to make life better. By really understanding the complexity of people’s lives and what they think about the issues that affect them, we give the public a powerful and influential role in shaping decisions and services that can make a difference to everyone. And as an independent, not for profit organisation we’re able to put all our time and energy into delivering social research that works for society.
NatCen Social Research 35 Northampton Square London EC1V 0AX T 020 7250 1866 www.natcen.ac.uk A Company Limited by Guarantee Registered in England No.4392418. A Charity registered in England and Wales (1091768) and Scotland (SC038454)
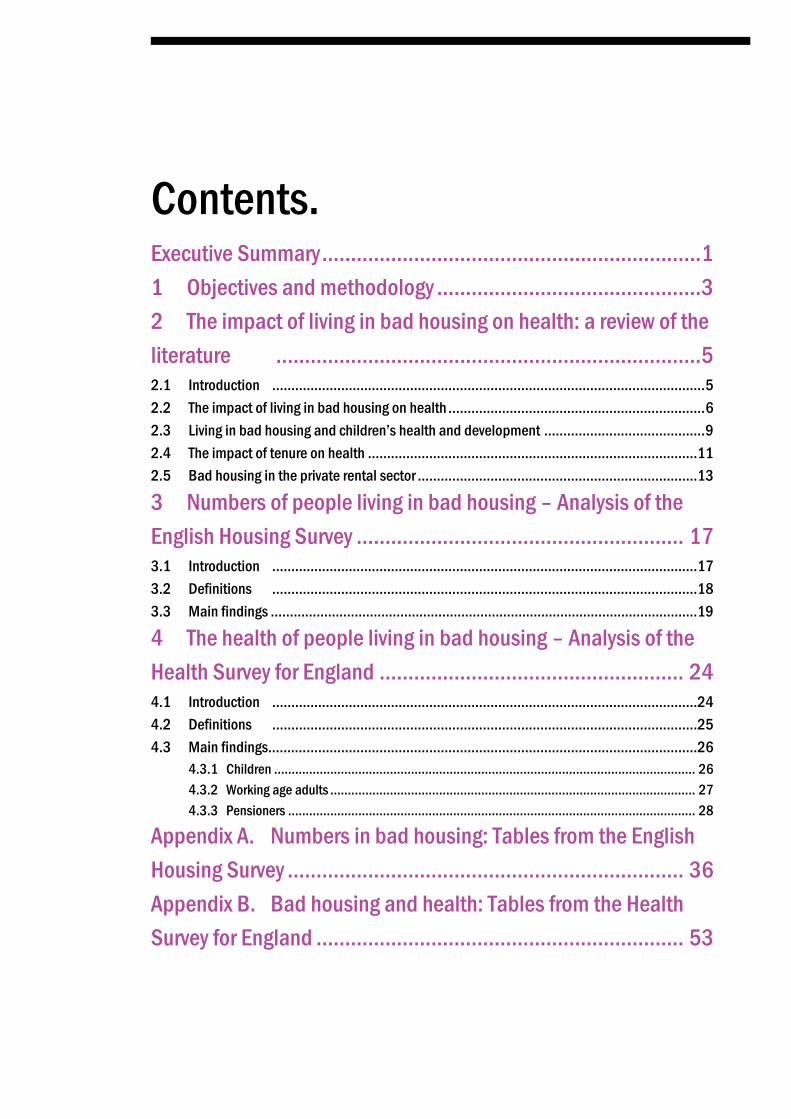
Contents.
Executive Summary .................................................................. 1
1 Objectives and methodology .............................................. 3
2 The impact of living in bad housing on health: a review of the
literature .......................................................................... 5
2.1 Introduction ................................................................................................................. 5
2.2 The impact of living in bad housing on health ................................................................... 6
2.3 Living in bad housing and children’s health and development .......................................... 9
2.4 The impact of tenure on health ......................................................................................11
2.5 Bad housing in the private rental sector .........................................................................13
3 Numbers of people living in bad housing – Analysis of the
English Housing Survey ......................................................... 17
3.1 Introduction ...............................................................................................................17
3.2 Definitions ...............................................................................................................18
3.3 Main findings ………………………………………………………………………………………………….19
4 The health of people living in bad housing – Analysis of the
Health Survey for England ..................................................... 24
4.1 Introduction ...............................................................................................................24
4.2 Definitions ...............................................................................................................25
4.3 Main findings………. ......................................................................................................26
4.3.1 Children ........................................................................................................................ 26
4.3.2 Working age adults ........................................................................................................ 27
4.3.3 Pensioners .................................................................................................................... 28
Appendix A. Numbers in bad housing: Tables from the English
Housing Survey ..................................................................... 36
Appendix B. Bad housing and health: Tables from the Health
Survey for England ................................................................ 53
Tables
Table A.1 Number of people in bad housing by life stage, tenure, region .................. 37
Table A.2 Number of people in bad housing by life stage and tenure ........................ 38
Table A.3 Number of people in bad housing by life stage and region ........................ 39
Table A.4 Number of people in bad housing by tenure and region ............................ 42
Table A.5 Number of households in bad housing by life stage, tenure, region .......... 45
Table A.6 Number of households in bad housing by life stage and tenure ................ 46
Table A.7 Number of households in bad housing by life stage and region ................ 47
Table A.8 Number of households in bad housing by tenure and region..................... 50
Table B.1 Children’s health by bad housing and tenure ............................................ 53
Table B.2 Working age adult’s health by bad housing and tenure ............................. 55
Table B.3 Pensioner’s health by bad housing ........................................................... 58
Figures
Figure 2.1 Direct and indirect (hard and soft) ways in which housing can affect health . .................................................................................................................. 6 Figure 3.1 People living in bad housing .................................................................... 19 Figure 3.2 People living in bad housing, by tenure type ............................................ 19 Figure 3.3 Children living in bad housing, by tenure type .......................................... 20 Figure 3.4 Pensioners living in bad housing, by tenure type ..................................... 20 Figure 3.5 People living in bad housing, by region .................................................... 21 Figure 3.6 People living in non-decent housing, by region ........................................ 21 Figure 3.7 People living in overcrowded housing, by region ..................................... 22 Figure 3.8 Percentage of people living in bad housing, by age and region ............... 22 Figure 3.9 Percentage of people living in bad housing, by tenure and region ........... 23 Figure 4.1 Children with fair/bad/very bad health by bad housing status, by tenure .. 26 Figure 4.2 Children with health problems by bad housing status .............................. 27 Figure 4.3 Working age adults with fair/bad/very bad health by bad housing status, by tenure ................................................................................................................ 27 Figure 4.4 Working age adults with health problems by bad housing status ............. 28 Figure 4.5 Pensioner health by bad housing status .................................................. 28
NatCen Social Research | People living in bad housing – numbers and health impacts 1
Executive Summary
This study uses new evidence from two large-scale representative surveys to explore the number of people living in bad housing and the link between bad housing and health. It begins with a short review of previous research in this area. The impact of housing on health: A review of the literature
Housing is one of many personal, social and environmental impacts on health and health inequalities. The complex interaction of these factors means that it can be difficult to identify the specific impact of housing.
Studies have shown impacts on physical health. Poor conditions such as overcrowding, damp, indoor pollutants and cold have all been shown to be associated with physical illnesses including eczema, hypothermia and heart disease. Respiratory health has been shown to be particularly affected in both adults and children.
Physical features of housing can also impact on mental health as families try to cope with the stress of living in cold, damp conditions.
It is not just the physical aspect of housing but also the security it brings – or lack of it - which can have an impact. Children in families who have to move frequently are at particular risk of poor outcomes. Studies highlighting the experience of families in temporary accommodation report a range of health problems such as depression, eczema and asthma.
Although there is little specific evidence on health and private renting, there is strong evidence on the health impacts of bad housing, particularly on children. The fact that bad housing conditions remain so prevalent in the private rental sector is therefore a legitimate cause for concern.
The number of people living in bad housing: Evidence from the English Housing Survey The English Housing Survey (EHS) is commissioned by the Department for Communities and Local Government (DCLG) and explores the quality of housing in England. The key findings from this analysis are:
Around three in ten people live in bad housing (3.6 million children, 9.2 million working age adults and 2 million pensioners).
Bad housing is more common among those in private rented properties. Four in ten (3.3 million) private rented tenants live in bad housing.
Over 975,000 children living in social rented housing are living in bad housing. Approximately 845,000 children living in private rented housing are living in bad housing. And over 1.7 million children living in owner occupied housing are living in bad housing.
Overcrowding is more likely to affect those in social rented properties while living in non-decent housing is more common among those in the private rented sector.
Children are most likely to live in overcrowded housing compared to working age adults and pensioners. Overcrowding is also more common among those living in London.
2 NatCen Social Research | People living in bad housing – numbers and health impacts
The link between bad housing and health: Evidence from the Health Survey for England The Health Survey for England (HSE) is an annual survey that monitors the health of the nation. The NHS and the Department of Health use this series to track progress towards national health targets and develop, monitor and evaluate health policy. The key findings from this analysis are:
Children living in bad housing are disproportionately more likely to suffer from poorer general health, poorer respiratory health and asthma – with children from private rented housing more likely to have poorer general health and wheezing problems.
A similar picture emerges for working-age adults, as those living in bad housing are disproportionately at greater risk of poorer general health, low mental wellbeing and respiratory problems including asthma and breathlessness.
The association between living in bad housing and having health problems is particularly acute among those above retirement age.
It is noticeable that there is less distinction between the health of people living in good and bad housing in the social rented sector. This is likely to be because of a higher concentration of more disadvantaged households in that sector, resulting in a wider range of factors that can impact on health irrespective of whether you live in bad housing or not.
NatCen Social Research | People living in bad housing – numbers and health impacts 3
1 Objectives and methodology
In 2006, NatCen carried out a piece of research for Shelter assessing the numbers of children living in bad housing in Britain. The findings from this work were published in a Shelter report called ‘Against the Odds’. This new report provides updated figures on the topic of bad housing. This cannot be a direct update, as the Families and Children Study (FACS), which was the source for the 2006 work, has been discontinued. Instead, new data sources are used to explore:
The numbers of people living in bad housing, using the English Housing Survey; and
The health (both mental and physical) of people living in bad housing, using the Health Survey for England
The methodology used in this report is a literature review of existing research into the impact of housing quality on health outcomes, and new secondary analysis of survey data to explore the mental and physical health of those living in bad housing. The literature review explores the impacts of living in bad housing (defined for the literature review as a range of issues from poor conditions and overcrowding – see Section 2 for details) on physical and mental health, and wellbeing. This has a particular focus on the impacts of people living in private rented accommodation and addresses the following questions:
How does living in bad housing impact on health?
What are the health impacts on children?
Are impacts affected by differences in housing tenure?
What is specifically known about bad housing in the private rented sector?
The literature review is supplemented by secondary analysis of data from two large-scale household surveys: the English Housing Survey and the Health Survey for England. The English Housing Survey (EHS) is commissioned by the Department for Communities and Local Government (DCLG) and explores the quality of housing in England. The EHS is used to explore the following research questions:
What proportion (and numbers) of people (and families) live in bad housing?
How does this differ across life stage, tenure and region?
For this part of the work, a narrower definition of bad housing was used (see box below). The Health Survey for England (HSE) is an annual survey that monitors the health of the nation. The NHS and the Department of Health use this series to track progress towards national health targets and develop, monitor and evaluate health policy. The HSE is used to answer the following research questions:
Does the health of people who live in bad housing differ from those who do not?
Does the health of people who live in bad housing vary by tenure?
The main findings are presented in the body of the report. The full analysis tables, which include estimates for individuals and families, can be found in the appendices. It is important to note that the data analysis presents simple associations between living in bad housing and health. It does not take into account other factors that could influence these associations, nor does it provide evidence of causation or even
4 NatCen Social Research | People living in bad housing – numbers and health impacts
direction of causation. For example, living in bad housing could impact on people’s health as damp conditions could trigger respiratory illnesses, but likewise people with ill health may be more likely to live in bad housing if they cannot work due to their illness and therefore are unable to afford reasonable housing. Furthermore, the findings in this report cannot be directly compared to the findings in the aforementioned ‘Against the odds’ report. This is because the reports use different definitions of bad housing, and different measures of health, as a result of using two different survey datasets. Definitions of bad housing
Secondary data analysis
i) Analysis using the English Housing Survey defined people to be living in bad housing
if:
They were overcrowded against the bedroom standard, or
Their housing failed to meet the Decent Homes Standard
The basic principles of the Decent Homes Standard are:
It must meet the current statutory minimum standard for housing (see ’Health and Safety Hazards’, below)
Health and Safety Hazards: the Housing Health and Safety Rating System (HHSRS) is a system designed to show whether dwellings pose a risk to the health and safety of their occupants. It focuses upon threats to health and safety rather than degrees of comfort and convenience.
It must be in a reasonable state of repair
It must have reasonably modern facilities and services
It provides a reasonable degree of thermal comfort (effective insulation and efficient heating)
ii) Analysis using the Health Survey for England focused on the link between living in bad
housing and health, and defined people to be living in bad housing if:
They thought their accommodation had ‘condensation’ and ‘mould or fungus’
Literature review
For the purposes of the literature review, the definition of bad housing was expanded to
include neighbourhood factors such as lack of access to amenities, green space or
places to play, or the presence of environmental pollution. Social and psychological
factors such as security of tenure, and levels of community cohesion and safety were
also considered.
NatCen Social Research | People living in bad housing – numbers and health impacts 5
2 The impact of living in bad housing on health: a
review of the literature
Summary
Housing is one of many personal, social and environmental impacts on health and health inequalities. The complex interaction of these factors means that it can be difficult to identify the specific impact of housing.
Studies have regularly shown impacts on physical health. Poor conditions such as overcrowding, damp, indoor pollutants (such as excess particulates from cooking or smoking) and cold have all been shown to be associated with physical illnesses including eczema, hypothermia and heart disease. Respiratory health has been shown to be particularly affected in both adults and children.
Physical features of housing can also impact on mental health as families try to cope with the stress of living in cold, damp conditions.
Children in families who have to move frequently are at particular risk of poor outcomes. Studies highlighting the experience of families in temporary accommodation report a range of health problems such as depression, eczema and asthma.
Although there is little specific evidence on health and private renting, there is strong evidence on the health impacts of living in bad housing, particularly on children. The fact that bad housing conditions remain so prevalent in the private rental sector is therefore a legitimate cause for concern.
2.1 Introduction In this section we provide an overview of the literature on the impacts of living in bad housing on physical and mental health and wellbeing. Our literature review addresses the following questions:
How does living in bad housing impact on health?
What are the health impacts on children?
Are impacts affected by differences in housing tenure?
What is specifically known about bad housing in the private rented sector?
Definition of terms
Any definition of bad housing needs to encompass a range of factors. The obvious ones are physical conditions: housing may be deemed to be bad if it is damp, infested, cold, or in a bad state of repair. Housing may also be bad if it is unable to adequately accommodate the number of people inhabiting it i.e. if they are experiencing overcrowding. The environment in which the housing is located is also important. Relevant neighbourhood factors include access to amenities, green-space, places to play and environmental pollution. There are also social/psychological factors which contribute to housing being experienced as good or bad. Security of tenure, the status people attach to housing and the levels of community safety and cohesion in an area are all important features.
6 NatCen Social Research | People living in bad housing – numbers and health impacts
The United Nations (1991) recognise the basic human right to housing as the right not just to basic shelter, but to ‘adequate housing.’ They define adequacy in terms of legal security of tenure; availability of services, materials, facilities, and infrastructure; affordability; habitability; accessibility; location and cultural adequacy. Just as housing is not just concerned with shelter, health is not just about the absence of tangible illness. Housing can and does have an impact on peoples’ physical health, but it also impacts directly and indirectly on mental health and wellbeing. In this brief overview of the literature we first consider the direct and indirect impacts of housing on health and wellbeing, before focusing more specifically on what is known about living in bad housing in the private rented sector and its effects on particular groups.
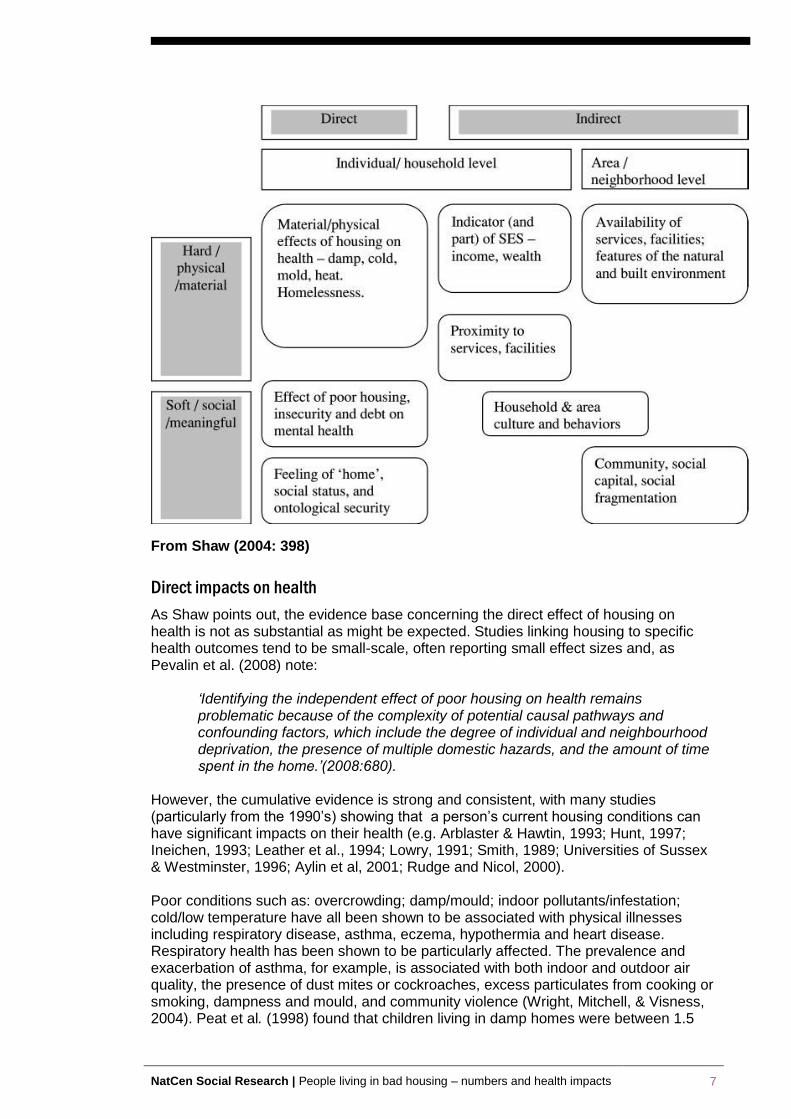
2.2 The impact of living in bad housing on health The relationship between housing conditions and health has been of policy interest since 1842 when Chadwick noted the low life expectancy of cellar dwellers. The 1998 Acheson Report identified housing and environment as priority areas for reducing health inequalities, concerns echoed a decade later by Marmot in 2010. There is a wide range of personal, social and environmental factors which influence health and contribute to health inequalities (Marmot, 2010). These are frequently interrelated: for example, poverty often goes hand in hand with other health threats such as living in a poor neighbourhood and being out of work. It can therefore be surprisingly difficult to isolate the impacts of any one variable (in this case, bad housing) on health outcomes (Hunt, 1997). Nevertheless, as Marsh et al (2000) point out, given the large proportion of time spent within the home, housing is both a key environmental influence upon health and a key health resource. There is evidence that certain types of household are more likely than others to be living in bad housing and that issues such as poverty, family size and ethnicity interact with housing options. In particular lone parent families, large families (with three or more dependent children) and BME families are more likely to experience bad housing (Barnes et al, 2006). BME households tend to live in more overcrowded conditions, and overcrowding is most severe among Pakistani, Bangladeshi and black African households. These three groups also have the highest numbers of children on average. Overcrowding may also be related to multi-generational living arrangements, the shortage of large properties in the social sector, clustering in areas where overcrowding is particularly severe (such as London), and low incomes. (HC/CIH, 2008, p. 8) In her 2004 review of the effects of housing on health, Shaw differentiates between direct and indirect impacts. The direct or ‘hard’ ways in which housing can affect health involve the material conditions of housing, and at the extreme, the impact of homelessness. But housing also impacts via indirect or ‘soft’ factors: the sense of security, status and belonging associated with a person’s home that contributes to their mental health and wellbeing. Shaw’s model is reproduced below:
Figure 2.1 Direct and indirect (hard and soft) ways in which housing can
affect health
NatCen Social Research | People living in bad housing – numbers and health impacts 7
From Shaw (2004: 398)
Direct impacts on health
As Shaw points out, the evidence base concerning the direct effect of housing on health is not as substantial as might be expected. Studies linking housing to specific health outcomes tend to be small-scale, often reporting small effect sizes and, as Pevalin et al. (2008) note:
‘Identifying the independent effect of poor housing on health remains problematic because of the complexity of potential causal pathways and confounding factors, which include the degree of individual and neighbourhood deprivation, the presence of multiple domestic hazards, and the amount of time spent in the home.’(2008:680).
However, the cumulative evidence is strong and consistent, with many studies (particularly from the 1990’s) showing that a person’s current housing conditions can have significant impacts on their health (e.g. Arblaster & Hawtin, 1993; Hunt, 1997; Ineichen, 1993; Leather et al., 1994; Lowry, 1991; Smith, 1989; Universities of Sussex & Westminster, 1996; Aylin et al, 2001; Rudge and Nicol, 2000). Poor conditions such as: overcrowding; damp/mould; indoor pollutants/infestation; cold/low temperature have all been shown to be associated with physical illnesses including respiratory disease, asthma, eczema, hypothermia and heart disease. Respiratory health has been shown to be particularly affected. The prevalence and exacerbation of asthma, for example, is associated with both indoor and outdoor air quality, the presence of dust mites or cockroaches, excess particulates from cooking or smoking, dampness and mould, and community violence (Wright, Mitchell, & Visness, 2004). Peat et al. (1998) found that children living in damp homes were between 1.5
8 NatCen Social Research | People living in bad housing – numbers and health impacts
and 3.5 times at greater risk of symptoms of cough and wheezing than children in non-damp homes. Cold homes are also a health risk. Poorly constructed and older housing is generally difficult and expensive to heat, which can have health consequences, particularly during the colder months (Wilkinson et al., 2001). The Royal Commission on Environmental Pollution (2007) concluded that cold was the main factor underlying the higher annual death rate between December and March, with vulnerable groups such as older people and young children at particular risk (Aylin et al, 2001). Houses in a poor state of repair also present a higher risk of domestic injury. Injuries and deaths due to house fires specifically have been shown to have a steep social gradient with the most disadvantaged groups being more likely to come to harm. As Shaw points out, much of this is likely to be explained by the type, quality and condition of the housing in which people can afford to live. (2004:406). Physical features of housing can also impact on mental health. Macintyre et al (2003) found that coping with damp, problems with keeping the house warm, noise and poor state of repair, were associated with higher levels of anxiety and depression. Studies have suggested that features of housing design which affect the level of social contact and support people enjoy also influence mental health (Halpern, 1995; Weich et al, 2002). Housing can have direct but softer impacts on health in terms of how people think about their home. A home provides more than physical shelter: it can confer a sense of safety, security and control (Dupuis, 1998). Where this sense is compromised through living in bad housing or insecurity of tenure, there can be direct effects on mental health (Dunn, 2002; Blackman et al, 2001). Most of the studies cited above have explored the links between current housing conditions and current health. Some have taken a longer term perspective, using longitudinal data to explore the links between living in bad housing during childhood and later health impacts. These show that bad housing conditions in early life can affect health in adulthood. Dedman et al (2001) found that, after controlling for socio-economic status, housing conditions during childhood may contribute to adult health status. For example, overcrowding in early childhood has been associated with short stature in adulthood (Kuh & Wadsworth, 1989; Montgomery et al.,1996). Overcrowding combined with other poor conditions in childhood (such as lack of hot water and other amenities) has been linked to later respiratory problems (Britten et al, 1987; Mann et al.,1992). Barnes et al (2010) undertook the only British study which has tracked the outcomes of children living in bad housing over time. Using data from the Families and Children Survey (FACS) between 2001 and 2005, they show that the longer children live in bad housing the more vulnerable they are to a range of poor outcomes. Children experiencing persistent bad housing (i.e. for three or more years out of five) often had worse outcomes than those children who merely experienced housing problems on a temporary basis (i.e. for one or two years). This was the case for all three of the housing problems considered (overcrowding, accommodation in poor state of repair and inadequately heated) and the relationships persisted after controlling for other factors such as income poverty. This longitudinal evidence also indicates that the problem of bad housing is likely to be more widespread than official point in time estimates would suggest. For example, while one in seven children were living in overcrowded homes in 2004, as many as one in four children had suffered from overcrowding on at least one occasion during the period 2001 to 2005.
NatCen Social Research | People living in bad housing – numbers and health impacts 9
In recent years there has been a growing interest in the cumulative effects of socio-economic circumstances over the life-course. This is based on an understanding that an individual’s health outcomes are affected not just by what happens in their childhood but on the conditions that they experience throughout life (Power and Hertzman, 1997; Kuh and Ben-Schlomo, 1997). Marsh et al (2000) used National Child Development Study (NCDS) data to explore the cohort’s experience of housing deprivation from childhood to age 33.1 This found that whilst at age 7, 51 per cent of the cohort suffered at least one housing deprivation. This fell to 20 per cent by age 23, but rose again to 32 per cent at age 33 (when most cohort members had formed their own families). 22 per cent of the cohort had never suffered any housing deprivation, whilst 1.4 per cent were experiencing some form of housing deprivation at every life stage. Marsh et al’s analysis indicated that housing deprivation was associated with poor health outcomes, independently of other variables, with multiple housing deprivation leading to a 25 per cent (on average) greater risk of disability or severe ill health across the life course. They concluded that the probability of ill health increased with both greater and more sustained experience of housing deprivation.
Indirect impacts on health
Shaw (2004) argues that there are indirect factors related to housing which have an impact on health, such as the neighbourhood and environment in which the housing is located, and the culture, reputation and social capital associated with housing. Studies have shown that neighbourhood characteristics impact on health (Pickett and Pearl, 2001; Macintyre and Ellaway, 2003), including the risk of injury to children (Haynes et al, 2003). The level of social cohesion in an area can affect health (Kawachi and Berkman, 2000) and neighbourhoods also influence people’s health behaviour by enabling/limiting access to healthy behaviour (e.g. places to exercise) or through neighbourhood norms (e.g. smoking).
2.3 Living in bad housing and children’s health and
development Data from the 2005 Families and Children Survey (FACS) suggested that one in five children (2.3 million children) were living in ‘bad housing’ in Britain. Bad housing was defined as living in accommodation that is temporary, overcrowded or unfit. Overcrowding was the most prevalent of the adverse housing conditions with 14 per cent affected. Eight per cent of children lived in unfit accommodation, and one per cent had lived in temporary accommodation in the previous year. Children living in bad housing were more likely to have poor heath, with children more likely to have respiratory problems if they lived in overcrowded or unfit dwellings. One in twenty children (five per cent) who lived in bad housing and one in fifteen children (seven per cent) who lived in acutely bad housing suffered from poor health, compared to three per cent of children who did not live in bad housing. Children who lived in acutely bad housing were over twice as likely to have visited A&E more than once in the last year compared to children who did not live in bad housing. In addition mothers were more likely to have clinical depression if they lived in bad housing. Ten per cent of mothers who lived in acutely bad housing suffered from clinical depression (Barnes et al, 2006). Housing quality: A review by Levanthal and Newman (2010) focuses on the impact of housing on children’s health and development. They point out that most of the
1 The NCDS is based on all those born in Great Britain between 3 and 9 March 1958. Data have been
collected on this cohort at age 7, 11, 16, 23, 33.
10 NatCen Social Research | People living in bad housing – numbers and health impacts
evidence linking housing quality and children's health and wellbeing comes largely from non-experimental studies of non-representative samples of low-income families (e.g., Evans, 2004). There is however, a vast literature on environmental exposures in the home and children's health. An extensive body of research shows an association between children's asthma and poor air quality (e.g., smoke) and exposure to allergens (Wu & Takaro, 2007). Related research finds associations between the presence of dampness and mould and poor respiratory health in children including asthma (Fisk, Lei-Gomez, & Mendell, 2007). A number of studies explore associations between poor quality housing and childhood injuries (Evans and English, 2002; Krieger and Higgins, 2002), although several are more concerned with neighbourhood characteristics rather than the quality of the homes themselves (O'Campo et al 2000; Shenassa et al, 2004). A US study of hospital discharges for children under six years of age over a 10-year period found that older housing was associated with more burns and falls (Shenassa, et al,2004). However, other studies fail to find an association between housing quality and children's injury (Vaughan, et al 2004), and a review by Lyons et al (2007) concludes that the evidence is unclear. There is some research suggesting that housing quality may indirectly influence children's development. Bartlett (1998) reported increased stress and family conflict and fewer opportunities for stimulating and supportive family interactions. Sandel and Wright (2007) argue that the psychological stress associated with poor housing is likely to contribute to its association with adverse physical health outcomes, such as asthma. However, as Leventhal and Newman observe, ‘despite the sizable number of studies that find an association between housing quality and child development, of note is the striking number of studies that find no such association’ (e.g., Murray et al., 2007; Tavernier et al., 2006; Vaughan et al., 2004). Overcrowding: Much of the research on overcrowding focuses on adults rather than children (Evans, 2003; Newman, 2008) and as Leventhal and Newman point out, there is surprisingly little research on the links between overcrowding and children’s wellbeing. A number of studies find a relationship between overcrowding and children's poor physical health due to infection. Overcrowded living conditions are associated with children's respiratory problems (Baker et al., 1998; Mann, Wadsworth & Colley, 1992) and overcrowding during childhood is also associated with gastrointestinal problems in both the short and long term (Galpin, Walker & Dubiel,1992; McCallion et al., 1996). Studies have found associations between overcrowding and children's schooling outcomes. A French study observed a link between overcrowded housing and repeating a grade in elementary and middle school (Goux & Maurin, 2005). Maxwell (1996) found that pre-school children in the most crowded living conditions had the most behavioural problems as rated by their teachers. A longitudinal study by Conley (2001) found that crowded living conditions during childhood were associated with lower levels of completed schooling by age 25. Evans (2001) found that parents in overcrowded homes were less responsive and harsher than parents in less crowded housing conditions. A 2005 report by Shelter, based on responses from 505 overcrowded families, illustrates the day-to-day impact on children and families of living in overcrowded conditions. Almost all overcrowded families said they were forced to adopt uncomfortable or irregular sleeping arrangements, with almost three-quarters (74 per cent) having children sharing a bedroom with a parent or parents. Families reported that overcrowding harmed family relationships, noting a lack of privacy and overcrowding was a cause of fighting and arguing among their children. In respect of
NatCen Social Research | People living in bad housing – numbers and health impacts 11
health, the families in Shelter’s study particularly highlighted depression, anxiety or stress as result of cramped living conditions. Three-quarters of severely overcrowded families also strongly agreed that their children’s health was affected by their living conditions. For many families, overcrowding was exacerbated by the lack of outdoor space and places for children to play. Frequent moves and temporary homes: Moving house can be positive for health, if families are moving from bad housing or neighbourhoods to somewhere better (Pevalin, 2008). However, frequent moves associated with insecure housing, can be detrimental to children’s health and development. Levanthal and Newman reported that moving has short-term negative associations with school achievement and functioning among children and adolescents (Pribesh and Downey, 1999; Simpson and Fowler, 1994; Wood et al.,1993). Several studies find that moving is associated with lower educational attainment by late adolescence (Astone and McLanahan, 1994; Hagan et al., 1996) although this can depend on the quality of the move (Hango, 2006). Moving has adverse associations with children's and adolescents' behavioural and adjustment problems (Adam and Chase-Lansdale, 2002; Hendershott, 1989) and there is evidence that residential mobility has a negative association with both peer and sibling relations (Haynie et al, 2006; Stoneman et al., 1999). Parental support has been shown to mitigate the negative effects of moving (Hendershott, 1989), whereas lack of support may exacerbate the difficulties (Hagan et al., 1996). Across studies, there is some indication that the negative impacts increase with the frequency of moves and that frequent movers are more likely to be victims of violence, vandalism or burglary, less likely to be registered with a GP, and children do less well at school (Cole et al, 2005). Life in temporary accommodation has been shown to have detrimental effects on families and children. A report by Shelter (2005) based on a survey of 417 homeless families highlights the stress, insecurity, inconvenience and expense of living in temporary accommodation; which take their toll on people’s health and wellbeing. Most households in their survey (78 per cent) reported a specific health problem, such as depression, eczema or asthma. Almost half (49 per cent) of households said that their health had suffered due to living in temporary accommodation. More than half (56 per cent) said they were suffering from depression. The survey results show that the longer respondents have been living in temporary accommodation, the greater their health problems. The survey found that living in temporary accommodation resulted in more frequent use of health services. About two fifths (38 per cent) of people surveyed reported more frequent visits to their GP or hospital since becoming homeless. Those who had been living in temporary accommodation for more than a year reported more health problems and greater use of health services. Neighbourhood and environment: In recent years, there has been an increased interest in the health impacts of access to green-spaces such as parks and playgrounds, and recreational facilities. Evidence shows that children who have better access to such places are more likely to be physically active, and less likely to be overweight, compared to those living in neighbourhoods with reduced access to such facilities (Gordon-Larsen et al,2006). Children and young people’s perceptions of their neighbourhood are also associated with levels of activity (Hume et al., 2005). The perceptions of parents toward the neighbourhood are also an important determinant of levels of activity. Where parents perceived the neighbourhood to be safe for walking and cycling, children were more likely to undertake these activities (Timperio et al., 2004).
2.4 The impact of tenure on health
12 NatCen Social Research | People living in bad housing – numbers and health impacts
Housing tenure has been found by a number of studies to be related to health outcomes. The primary distinction that has been made in research is between renters and owner occupiers. Ghodsian and Fogelman (1988) used NCDS data to look at the impact of housing and circumstances on a range of outcomes, including health. They found that self-rated health at age 23 was related to housing tenure, with those who had lived in owner occupied homes throughout their lives more likely to rate their health excellent/good than others were. These differences between tenure groups were similar to those found between social class groups. Studies have also found associations between tenure and mortality, with renters dying earlier than owners. Filakti and Fox (1995) used census data to show that the mortality gap between those in social housing and owner occupiers widened between the early 1970’s and the 1980’s. In the early 70’s, the chances of dying before the age of 65 were 35 per cent higher for men in social housing compared to owners, widening to 62 per cent in the 80’s. Although death rates had declined in all groups by the time of the 1991 census, the falls were greatest among owner occupiers (Harding et al., 1997). These differences can partly be explained by the differences in wealth between renters and owners. There is extremely strong evidence that health inequalities are linked to differences in social class and income (Marmot, 2010). Housing tenure is often used as a proxy indicator of wealth, and research has shown that greater housing wealth in Britain is clearly and incrementally related to higher life expectancy (Shaw et al, 1999). However, housing tenure has been shown to have an effect on health independently of social class. Gould and Jones (1996) show that, within each social class group, housing tenure is associated with self- reported illness, and psychosocial problems have also been shown to be more prevalent among renters than owner occupiers (Lewis and Booth, 1992). Shaw (2004) suggests that morbidity and mortality differences are likely to be due in part to ‘residualisation’ i.e. the decline in the availability of social housing means that those who are housed in it are the most vulnerable and sick. Pevalin et al (2008) highlight the change in policy emphasis from social housing to owner occupation which has reduced the availability of decent social housing. They point out that:
‘Changes in the size and composition of the social housing sector have created socially excluded estates, characterised by poverty, poor infrastructure and substandard housing. This can pose problems for vulnerable groups—particularly the elderly, the very young and those with chronic long-term health problems—who are especially at risk due to the lengthy periods that they spend indoors’.(2008:681)
There is evidence which suggests that the different meanings people attach to tenure types, in terms of their status and satisfaction, have an impact on health and wellbeing. Macintyre et al (2000) conducted a study in Scotland which explored this with people in owner occupied and social rented homes. Owners were more likely to be male, married/cohabiting, slightly younger, with higher incomes, and more likely to be in paid employment and non-manual jobs. They were also more likely to report mastery and autonomy—“I can do what I want when I want with my own home”—as well as having higher self-esteem, have greater overall life satisfaction, and be more likely to be satisfied with their homes. The general health of owners was better: they reported less limiting longstanding illness, lower depression and anxiety, and fewer symptoms in the past month. The authors noted that ‘tenure was still a significant predictor of measures in four health domains after controlling for social class and income, suggesting that it is not solely associated with health because it is a marker for these other, underlying, material assets’ (Macintyre et al, 2001;330)
NatCen Social Research | People living in bad housing – numbers and health impacts 13
A later study by the same team (Macintyre et al 2003) explored the aspects of peoples’ homes and area environments which might affect their health. They found that those in social rented dwellings were more likely than owner occupiers to be exposed to health damaging features of the environment such as damp, noise, crime and vandalism, and less likely to have access to health promoting features of the environment such as gardens and local amenities. The researchers found that when these environmental variables were taken into account, the health differences between tenure types substantially reduced and concluded that measures to improve the quality of housing and the local environment can reduce health inequalities. A recent Australian study by Baker et al (2013) looked at the mental health effects of housing tenure. They found that, while mental health varies significantly between tenure types, once tenure population differences are accounted for there is little evidence of an intrinsic relationship between tenure and mental health. As well as tenure having an impact on health, there is evidence that people’s health affects both the tenure type and the quality of housing they occupy. Easterlow et al (2000) found that people with health problems are disproportionately more likely to occupy the least health-promoting sectors of the housing stock which may exacerbate their health problems. People with health problems are more likely to be excluded from owner occupation and less likely to be able to move. Ruel et al (2010) similarly found in the US that while health was not the main reason residents gave for entering public housing, the majority of public housing residents entered public housing already ill. Substandard housing conditions, long tenure in public housing, and having had a worse living situation prior to public housing were not associated with an increased risk of a health condition diagnosed after entry into public housing. Ruel et al suggest that public housing may have provided a safety net for the very unhealthy poor. There are a number of studies using longitudinal data which find that growing up in an owned rather than a rented home has a positive effect on a wide range of children's outcomes (e.g., Aaronson, 2000; Conley, 2001; Green & White, 1997; Boyle, 2002; Haurin et al 2000, 2002). Outcomes include better health (Fogelman et al., 1989), lower levels of problem behaviour (Boyle, 2002), and better educational achievement (Haurin et al., 2002; Conley, 2001; Aaronson, 2000). However, more recent analyses have strongly questioned the validity of the ‘homeownership effect’ which have concluded that there is little evidence of an independent homeownership effect on health after accounting for other key variables such as income and family stability. (Galster et al, 2007; Barker and Miller,2009; Holupka and Newman, 2010).
2.5 Bad housing in the private rental sector After years of decline, the private rental sector (PRS) in England has significantly increased over the past twenty years. The proportion of households renting from private landlords rose from 9 per cent in 1991 to 16 per cent in 2009/10, and the number of private tenants increased by over 80 per cent. Over the same period, the share of renting households who live in the PRS increased from 29 per cent to 48 per cent, while the proportion in social housing declined from 71 per cent to 52 per cent (Kemp, 2011). Around 8.5 million people in England now rent privately. Almost a third of renting households are families with children, and nearly half are older than 35 (Shelter, 2012). As Rugg and Rhodes (2008) point out, many people will have some experience of renting privately during the course of their lives: perhaps as a student; when forming a new household; after relationship breakdown; when moving to change jobs; or as a
14 NatCen Social Research | People living in bad housing – numbers and health impacts
long-term home. Rugg and Rhodes found that 21 per cent of private renters had been
living at their current address for five or more years. However, ‘churn’ in the PRS is
high, reflecting the short-term nature of many of the uses of the PRS: 40 per cent of
PRS households had been living at their current address for less than twelve months. The private rental sector has sometimes been viewed as providing ‘residual’ accommodation for those unable to be accommodated in the owner occupied or social rental sectors. However, Kemp (2011) argues that far from being residual, the PRS in England plays a disproportionately important role in accommodating households living in poverty. Despite its growth, in the UK the contemporary PRS remains what Rugg and Rhodes term ‘a cottage industry’, dominated by individual landlords renting one or two properties. In 2011, 89 per cent of landlords were private individual landlords responsible for 71 per cent of dwellings in the sector. Twenty-two per cent of landlords had let properties for three years or less with two-thirds (69 per cent) for 10 years or less. Only 8 per cent of all landlords in the private rented sector were full-time landlords with the remainder part-time landlords (DCLG, 2011a)
Housing conditions in the private rented sector
Property conditions in the private rented sector, while improving, are still worse than in either social housing or owner occupation. According to the English Housing Survey, in 2011, 5.4 million dwellings (24 per cent) were non-decent, a reduction of well over 500 thousand compared with 2010. The rate was lowest in the social rented sector (17 per cent) and highest in the private rented sector (35 per cent). The percentage of private rented properties that failed each component of the decent homes standard was: minimum standard for housing (21 per cent), thermal comfort (15 per cent), repair (9 per cent) and modern facilities (3 per cent). Private rented dwellings were also more likely than those in other tenures to experience damp problems, and were more likely to be older stock (DCLG, 2013). Conditions have improved in the PRS, particularly with an increase in newer homes being available for rent. However, it is not necessarily the case that conditions have improved throughout the sector and Rugg and Rhodes note that the failure to meet statutory standards appears disproportionately to affect households defined as ‘vulnerable’. These are households in receipt of at least one of the main means-tested or disability related benefits. In 2009, 47 per cent of vulnerable PRS households were in properties that failed to meet the decent homes standard incorporating the HHSRS definition (DCLG, 2011b). Kemp (2011) found that low-income households in the PRS fare worse in terms of housing conditions than those living in social housing. Disrepair is a much greater problem for poor households in the PRS than for those living in social housing and owner occupiers, and a much lower proportion of the PRS stock in which the poor are living meets the official ‘decent homes’ standard. However, Kemp noted that some aspects of property conditions are also worse for non-poor private tenants than for low-income households in social housing or owner-occupation. For example, overcrowding is relatively static in the owner-occupied sector, while it is rising in the social rented sector and rising dramatically in the private rented sector (Cookson and Sillet, 2009, p. 3).
NatCen Social Research | People living in bad housing – numbers and health impacts 15
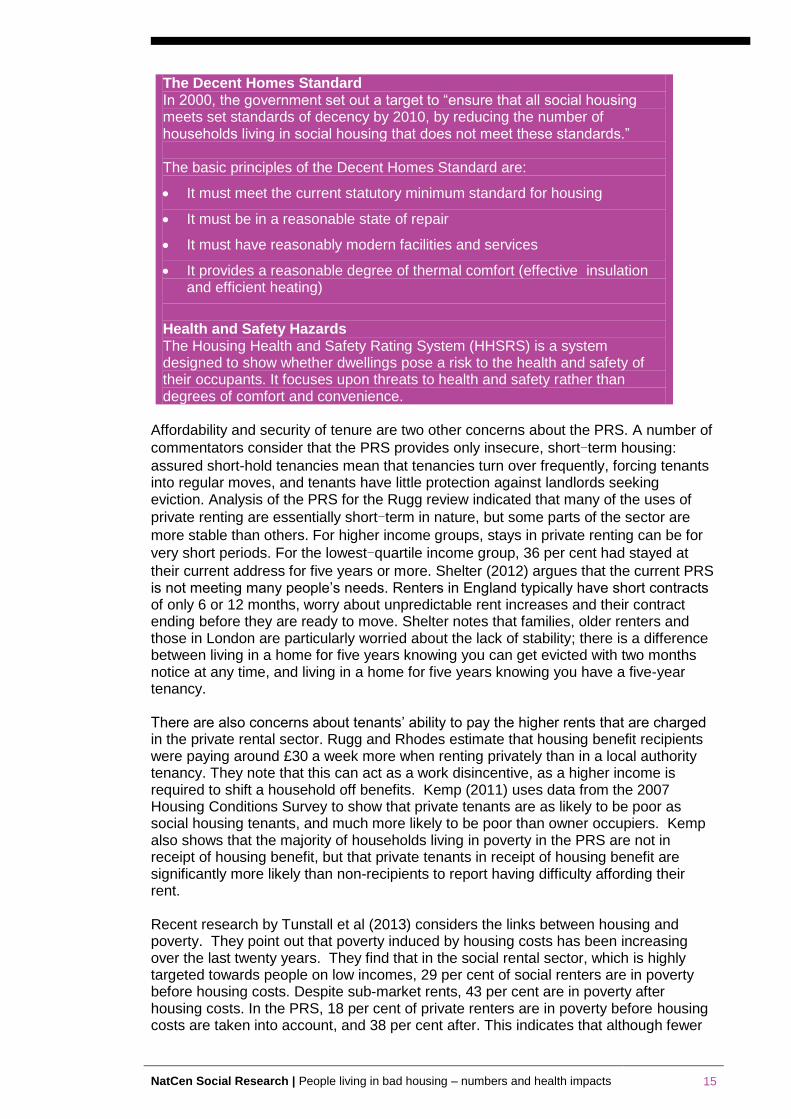
The Decent Homes Standard In 2000, the government set out a target to “ensure that all social housing meets set standards of decency by 2010, by reducing the number of households living in social housing that does not meet these standards.” The basic principles of the Decent Homes Standard are:
It must meet the current statutory minimum standard for housing
It must be in a reasonable state of repair
It must have reasonably modern facilities and services
It provides a reasonable degree of thermal comfort (effective insulation and efficient heating)
Health and Safety Hazards The Housing Health and Safety Rating System (HHSRS) is a system designed to show whether dwellings pose a risk to the health and safety of their occupants. It focuses upon threats to health and safety rather than degrees of comfort and convenience.
Affordability and security of tenure are two other concerns about the PRS. A number of
commentators consider that the PRS provides only insecure, short-term housing:
assured short-hold tenancies mean that tenancies turn over frequently, forcing tenants into regular moves, and tenants have little protection against landlords seeking eviction. Analysis of the PRS for the Rugg review indicated that many of the uses of
private renting are essentially short-term in nature, but some parts of the sector are
more stable than others. For higher income groups, stays in private renting can be for
very short periods. For the lowest-quartile income group, 36 per cent had stayed at
their current address for five years or more. Shelter (2012) argues that the current PRS is not meeting many people’s needs. Renters in England typically have short contracts of only 6 or 12 months, worry about unpredictable rent increases and their contract ending before they are ready to move. Shelter notes that families, older renters and those in London are particularly worried about the lack of stability; there is a difference between living in a home for five years knowing you can get evicted with two months notice at any time, and living in a home for five years knowing you have a five-year tenancy. There are also concerns about tenants’ ability to pay the higher rents that are charged in the private rental sector. Rugg and Rhodes estimate that housing benefit recipients were paying around £30 a week more when renting privately than in a local authority tenancy. They note that this can act as a work disincentive, as a higher income is required to shift a household off benefits. Kemp (2011) uses data from the 2007 Housing Conditions Survey to show that private tenants are as likely to be poor as social housing tenants, and much more likely to be poor than owner occupiers. Kemp also shows that the majority of households living in poverty in the PRS are not in receipt of housing benefit, but that private tenants in receipt of housing benefit are significantly more likely than non-recipients to report having difficulty affording their rent. Recent research by Tunstall et al (2013) considers the links between housing and poverty. They point out that poverty induced by housing costs has been increasing over the last twenty years. They find that in the social rental sector, which is highly targeted towards people on low incomes, 29 per cent of social renters are in poverty before housing costs. Despite sub-market rents, 43 per cent are in poverty after housing costs. In the PRS, 18 per cent of private renters are in poverty before housing costs are taken into account, and 38 per cent after. This indicates that although fewer
16 NatCen Social Research | People living in bad housing – numbers and health impacts
private than social tenants are poor when they start to rent, the higher housing costs in the PRS pushes a higher proportion of them into poverty.
Health and the private rented sector
There is a lack of research on the health effects of living in the private rented sector, although there are studies showing that many of the bad housing conditions that impact on health are more prevalent in the private rental sector (PRS). Pevalin et al (2008) found that although private and social renters are more likely to report housing problems than owner occupiers, private renters on average report the most. There are few studies looking specifically at the health effects on children of social or privately rented housing. There are studies from the US which suggest that ‘subsidised housing’ (i.e. public housing intended to be of decent quality and affordable) has short- and long-term positive associations with children's educational and economic attainment, compared with children from low-income families who live in housing in the private rental sector. Yet other studies report inconsistent associations between subsidised housing and favourable health outcomes, although Levanthal and Newman (2010) note that it is unclear which particular housing features are the source of these positive effects since housing subsidies are intended to provide a package of benefits: physically decent, uncrowded, and affordable housing. They also observe that public housing may provide greater residential stability compared with other forms of rented accommodation. In the UK, data from the 2005 Families and Children survey showed that children in privately rented accommodation were over twice as likely to live in overcrowded accommodation, five times more likely to live in unfit housing and almost three times more likely to live in bad housing than children in owner occupied housing (Barnes et al, 2006). Although there is little specific evidence on health and private renting, there is strong evidence on the health impacts of living in bad housing, particularly on children. The fact that bad housing conditions remain so prevalent in the private rental sector is therefore a legitimate cause for concern.
NatCen Social Research | People living in bad housing – numbers and health impacts 17
3 Numbers of people living in bad housing –
Analysis of the English Housing Survey
Summary
The key findings from this chapter are:
Around three in ten people live in bad housing (3.6 million children, 9.2 million working age adults and 2 million pensioners).
Bad housing is more common among those in private rented properties. Four in ten (3.3 million) private rented tenants live in bad housing.
Over 975,000 children living in social rented housing are living in bad housing. Approximately 845,000 children living in private rented housing are living in bad housing. And over 1.7 million children living in owner occupied housing are living in bad housing.
Overcrowding is more likely to affect those in social rented properties while living in non-decent housing is more common among those in private rented accommodation.
Children are most likely to live in overcrowded housing compared with working age adults and pensioners. Overcrowding is also more common among those living in London.
3.1 Introduction The English Housing Survey (EHS) is commissioned by the Department for Communities and Local Government (DCLG) and explores the quality of housing in England. This large scale survey, currently undertaken by NatCen, collects data from over 13,000 households and about around 40,000 individuals every year. It provides valuable information and evidence to inform the development and monitoring of DCLG's housing policies. Results from the survey are also used by a wide range of other users including other government departments; local authorities; housing associations; charities; landlords; academics; construction industry professionals; consultants; and the general public. This chapter reports analysis of the latest available EHS dataset, covering the period 2010-11. The EHS is used to look at three measures of housing: i) A non-decent home, according to the official Decent Homes Standard ii) An overcrowded home, according to the official Bedroom Standard iii) ‘Bad housing’, defined as a non-decent home or an overcrowded home The data is used to answer the following key questions:
Overall what proportion (and numbers) of people (and families) live in bad housing?
How does this differ across life stage, tenure and region?
The chapter provides a succinct summary of the key headline findings of individuals living in bad housing. Analyses of families living in bad housing can be found in Appendix A, along with estimates grossed to population numbers.
18 NatCen Social Research | People living in bad housing – numbers and health impacts
3.2 Definitions The following definitions are used in the analysis.
Non-decent home A non-decent home is one that fails to meet all of the following four criteria: i) meets the current statutory minimum standard for housing. From April 2006 the fitness standard was replaced by the Housing Health and Safety Rating System (HHSRS). Dwellings posing a Category 1 hazard are non-decent on this criterion based on an assessment of 15 hazards: 1. Excess cold 2. Falling on level surfaces 3. Falling on stairs etc 4. Radiation 5. Flames, hot surfaces etc 6. Crowding and space 7. Fire 8. Dampness and mould growth 9. Noise 10. Falling between levels 11. Electrical safety 12. Carbon monoxide and fuel combustion products 13. Personal hygiene, sanitation and drainage 14. Lead 15. Domestic hygiene pests and refuse ii) is in a reasonable state of repair (related to the age and condition of a range of building components including walls, roofs, windows, doors, chimneys, electrics and heating systems). iii) has reasonably modern facilities and services (related to the age, size and layout/location of the kitchen, bathroom and WC and any common areas for blocks of flats, and to noise insulation). iv) provides a reasonable degree of thermal comfort (related to insulation and heating efficiency).2
Overcrowding Overcrowding is measured using the official ‘bedroom standard’ approach. The bedroom standard allocates a separate bedroom to each married or cohabiting couple, any other person aged 21 or over, each pair of adolescents aged 10-20 of the same sex, and each pair of children aged under 10. Any unpaired person is allocated a separate bedroom. This is then compared with the actual number of bedrooms, which is self-reported. Any household with a bedroom standard allocation higher than the number of actual bedrooms is said to be overcrowded.
Bad housing For this report, Bad Housing is defined as accommodation that is overcrowded according to the bedroom standard or is a non-decent home under the Decent Homes Standard.
2 The detailed definition for each of these criteria is included in A Decent Home: Definition and guidance for implementation, Communities and Local Government, June 2006.
NatCen Social Research | People living in bad housing – numbers and health impacts 19
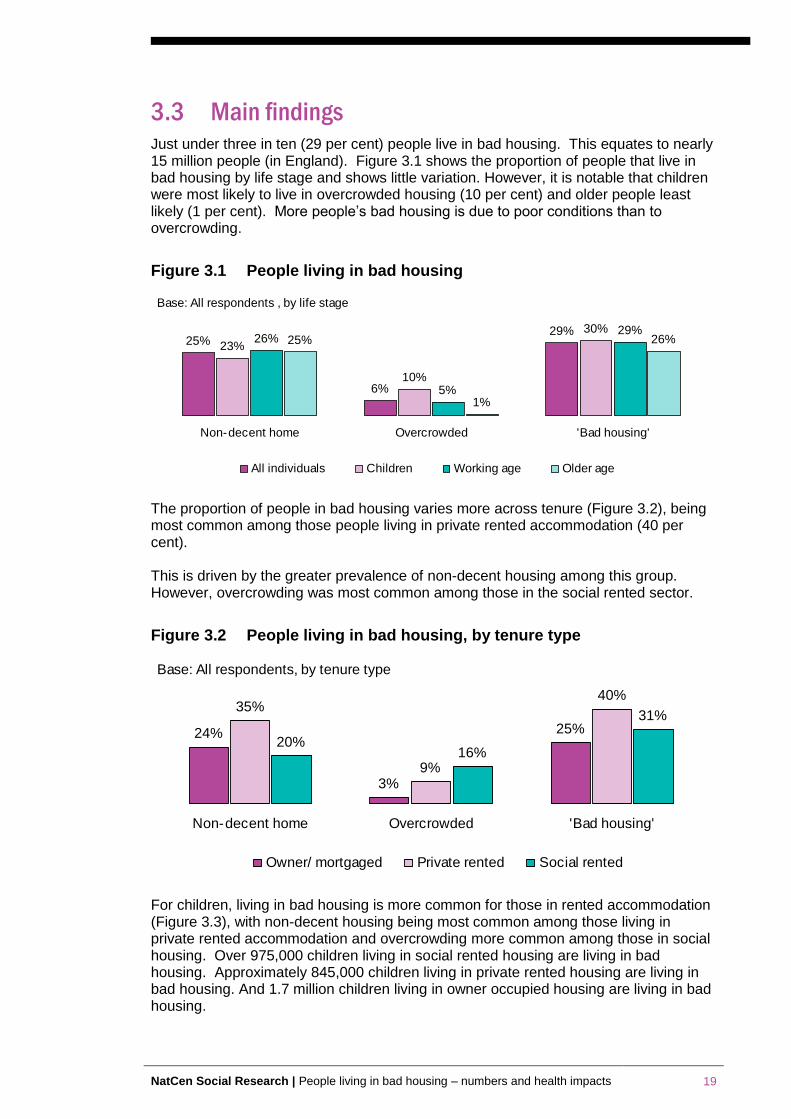
3.3 Main findings Just under three in ten (29 per cent) people live in bad housing. This equates to nearly 15 million people (in England). Figure 3.1 shows the proportion of people that live in bad housing by life stage and shows little variation. However, it is notable that children were most likely to live in overcrowded housing (10 per cent) and older people least likely (1 per cent). More people’s bad housing is due to poor conditions than to overcrowding.
Figure 3.1 People living in bad housing
25%
6%
29%
23%
10%
30%26%
5%
29%25%
1%
26%
Non-decent home Overcrowded 'Bad housing'
All individuals Children Working age Older age
Base: All respondents , by life stage
The proportion of people in bad housing varies more across tenure (Figure 3.2), being most common among those people living in private rented accommodation (40 per cent). This is driven by the greater prevalence of non-decent housing among this group. However, overcrowding was most common among those in the social rented sector.
Figure 3.2 People living in bad housing, by tenure type
24%
3%
25%
35%
9%
40%
20%16%
31%
Non-decent home Overcrowded 'Bad housing'
Owner/ mortgaged Private rented Social rented
Base: All respondents, by tenure type
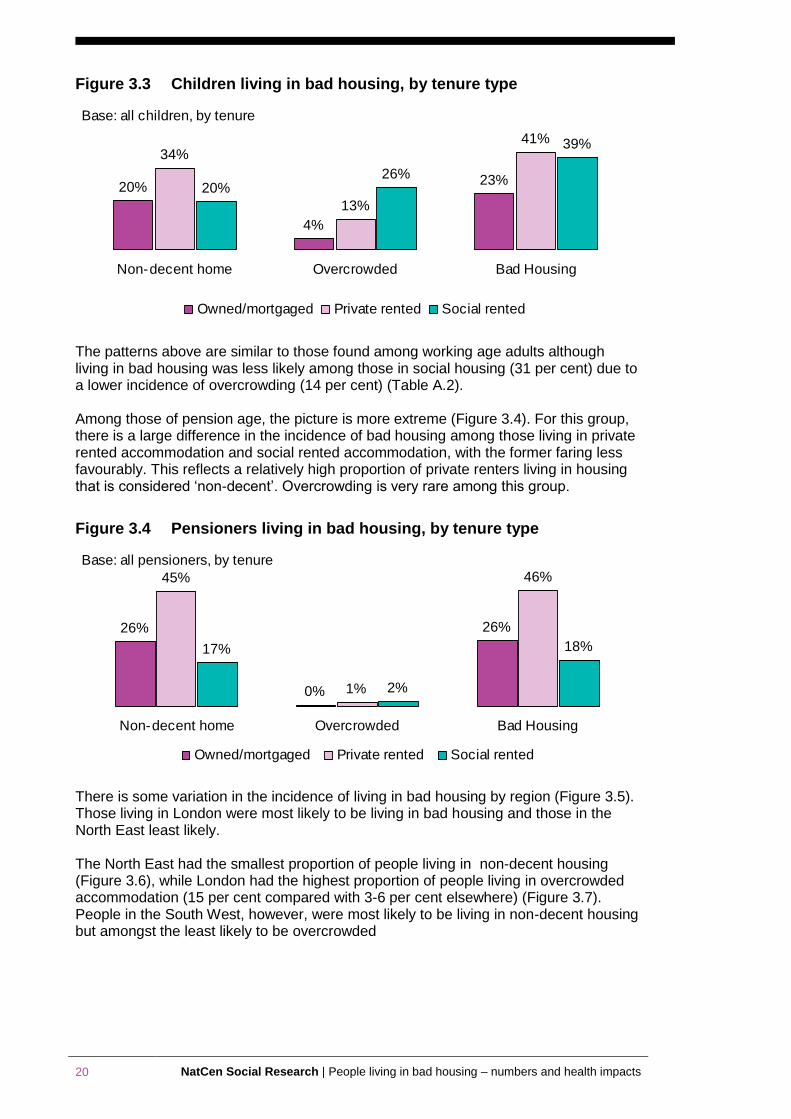
For children, living in bad housing is more common for those in rented accommodation (Figure 3.3), with non-decent housing being most common among those living in private rented accommodation and overcrowding more common among those in social housing. Over 975,000 children living in social rented housing are living in bad housing. Approximately 845,000 children living in private rented housing are living in bad housing. And 1.7 million children living in owner occupied housing are living in bad housing.
20 NatCen Social Research | People living in bad housing – numbers and health impacts
Figure 3.3 Children living in bad housing, by tenure type
20%
4%
23%
34%
13%
41%
20%26%
39%
Non-decent home Overcrowded Bad Housing
Owned/mortgaged Private rented Social rented
Base: all children, by tenure
The patterns above are similar to those found among working age adults although living in bad housing was less likely among those in social housing (31 per cent) due to a lower incidence of overcrowding (14 per cent) (Table A.2). Among those of pension age, the picture is more extreme (Figure 3.4). For this group, there is a large difference in the incidence of bad housing among those living in private rented accommodation and social rented accommodation, with the former faring less favourably. This reflects a relatively high proportion of private renters living in housing that is considered ‘non-decent’. Overcrowding is very rare among this group.
Figure 3.4 Pensioners living in bad housing, by tenure type
26%
0%
26%
45%
1%
46%
17%
2%
18%
Non-decent home Overcrowded Bad Housing
Owned/mortgaged Private rented Social rented
Base: all pensioners, by tenure
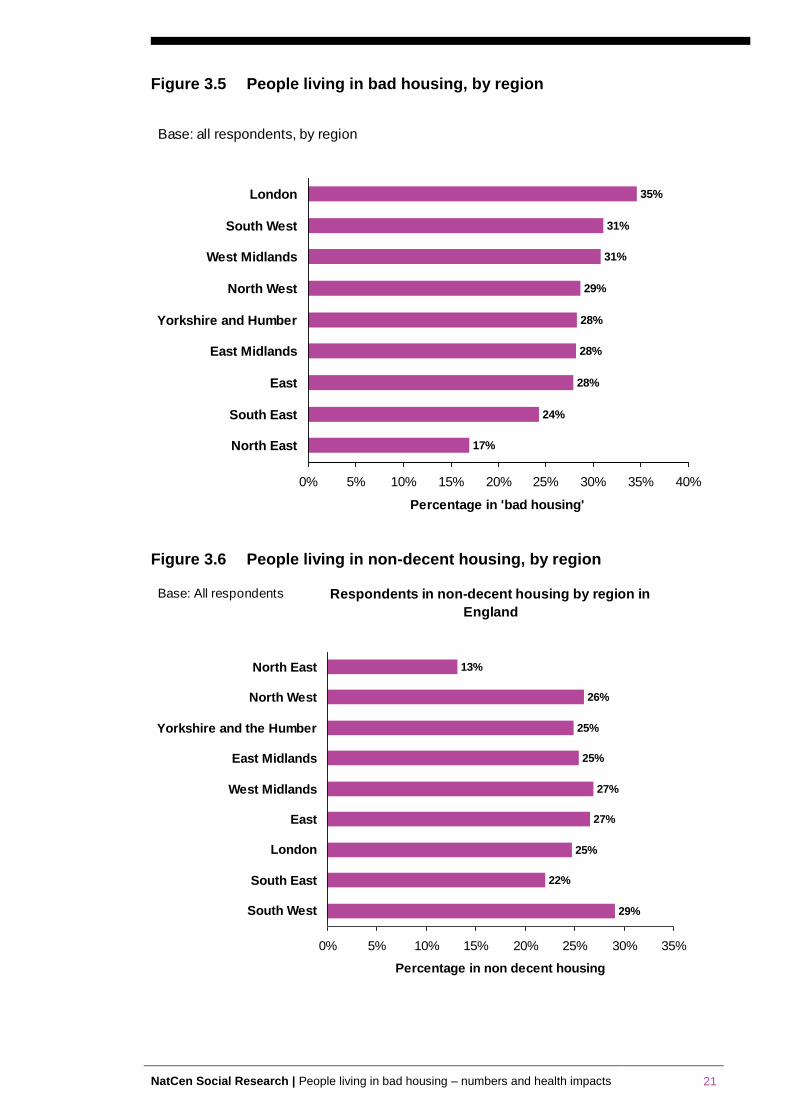
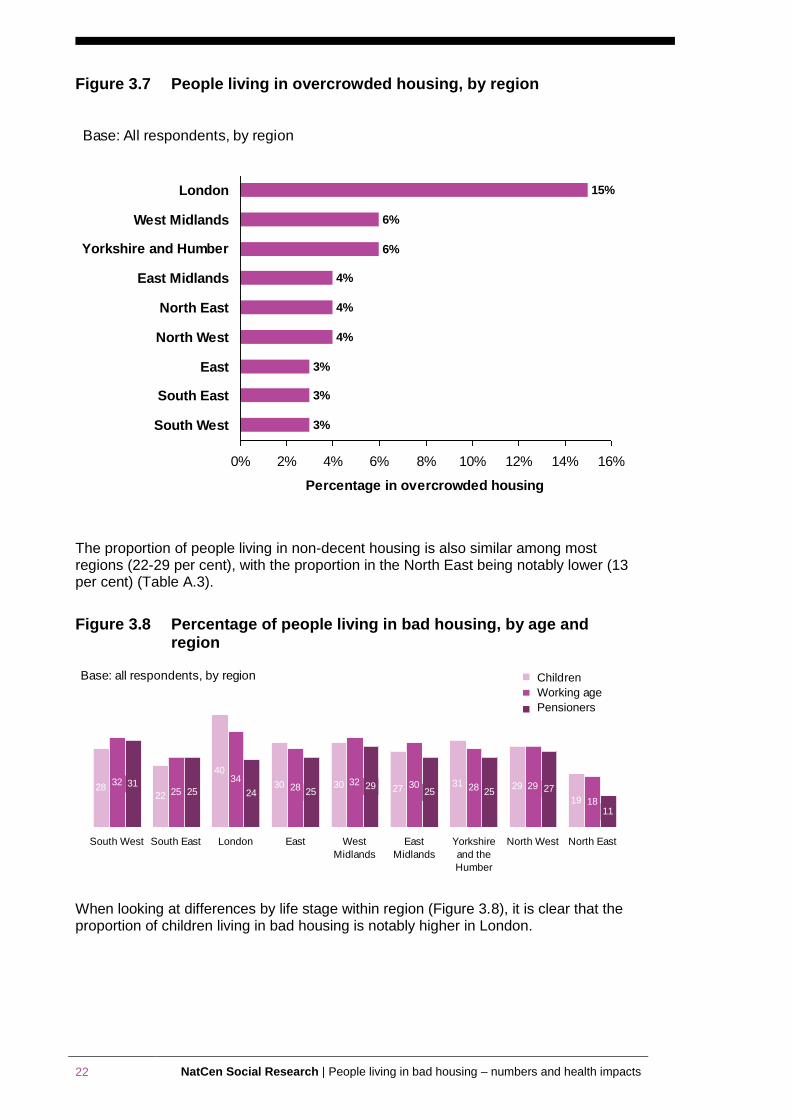
There is some variation in the incidence of living in bad housing by region (Figure 3.5). Those living in London were most likely to be living in bad housing and those in the North East least likely. The North East had the smallest proportion of people living in non-decent housing (Figure 3.6), while London had the highest proportion of people living in overcrowded accommodation (15 per cent compared with 3-6 per cent elsewhere) (Figure 3.7). People in the South West, however, were most likely to be living in non-decent housing but amongst the least likely to be overcrowded
NatCen Social Research | People living in bad housing – numbers and health impacts 21
Figure 3.5 People living in bad housing, by region
35%
31%
31%
29%
28%
28%
28%
24%
17%
0% 5% 10% 15% 20% 25% 30% 35% 40%
London
South West
West Midlands
North West
Yorkshire and Humber
East Midlands
East
South East
North East
Percentage in 'bad housing'
Base: all respondents, by region
Figure 3.6 People living in non-decent housing, by region
13%
26%
25%
25%
27%
27%
25%
22%
29%
0% 5% 10% 15% 20% 25% 30% 35%
North East
North West
Yorkshire and the Humber
East Midlands
West Midlands
East
London
South East
South West
Percentage in non decent housing
Base: All respondents Respondents in non-decent housing by region in
England
22 NatCen Social Research | People living in bad housing – numbers and health impacts
Figure 3.7 People living in overcrowded housing, by region
15%
6%
6%
4%
4%
4%
3%
3%
3%
0% 2% 4% 6% 8% 10% 12% 14% 16%
London
West Midlands
Yorkshire and Humber
East Midlands
North East
North West
East
South East
South West
Percentage in overcrowded housing
Base: All respondents, by region
The proportion of people living in non-decent housing is also similar among most regions (22-29 per cent), with the proportion in the North East being notably lower (13 per cent) (Table A.3).
Figure 3.8 Percentage of people living in bad housing, by age and region
11
27252529
25242531
18
2928303228
34
2532
19
2931273030
40
2228
North EastNorth WestYorkshire
and the
Humber
East
Midlands
West
Midlands
EastLondonSouth EastSouth West
Base: all respondents, by region Children
Working age
Pensioners
When looking at differences by life stage within region (Figure 3.8), it is clear that the proportion of children living in bad housing is notably higher in London.
NatCen Social Research | People living in bad housing – numbers and health impacts 23
Figure 3.9 Percentage of people living in bad housing, by tenure and region
14
26262528272722
27 26
47
3941413940
32
45
2123253033
24
46
27
37
North EastNorth WestYorkshire
and the
Humber
East
Midlands
West
Midlands
EastLondonSouth EastSouth West
Base: all respondents, by region Social rented Private rented Owner/ mortgaged
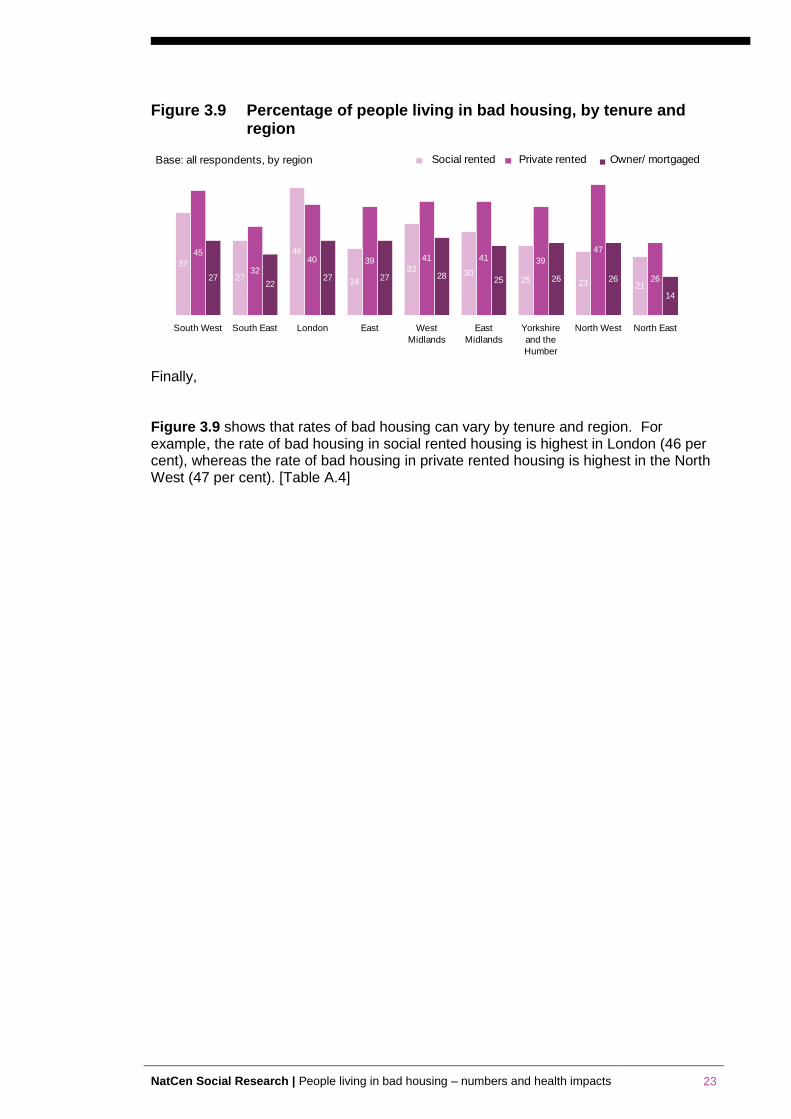
Finally, Figure 3.9 shows that rates of bad housing can vary by tenure and region. For example, the rate of bad housing in social rented housing is highest in London (46 per cent), whereas the rate of bad housing in private rented housing is highest in the North West (47 per cent). [Table A.4]
24 NatCen Social Research | People living in bad housing – numbers and health impacts
4 The health of people living in bad housing –
Analysis of the Health Survey for England
Summary
The key findings from this chapter are:
Children living in bad housing are particularly more likely to suffer from poorer general health, respiratory health and asthma – with children living in private rented housing more likely to have poorer general health and wheezing problems
A similar, if not more stark, picture emerges for working-age adults, as those living in bad housing are disproportionately at greater risk of poorer general health, low mental wellbeing and respiratory problems including asthma and breathlessness
The association between living in bad housing and health problems is particularly acute among those above retirement age
It is noticeable that there is less distinction between the health of people living in good and bad housing in the social rented sector. This is likely to be because of a higher concentration of more disadvantaged households in that sector, resulting in a wider range of factors that can impact on health irrespective of whether you live in bad housing or not
4.1 Introduction This chapter explores the health of people living in bad housing using analysis of data from the Health Survey for England (HSE). The HSE is an annual survey that monitors the health of the nation. It is an authoritative source of health statistics, with trends going back to 1993. The NHS and the Department of Health use this series to track progress towards national health targets and develop, monitor and evaluate health policy. The survey records trends in the public's health, estimates the proportion of people who have specific health conditions, and tells us about the prevalence of risk factors associated with these health conditions. NatCen runs the survey in partnership with University College London (UCL). This chapter uses data from the 2010 HSE survey, as it included questions on housing conditions. The definition of bad housing in this chapter focuses on whether the house has damp or mould. The survey also contained specific questions on respiratory health and lung function. The survey collected information from over 5,550 children and nearly 8,500 adults. The data is used to answer the following research questions:
Does the health of people who live in bad housing differ from those who do not live in bad housing? The analysis looks separately at the health of children, working age adults and pensioners.
Does the health of people who live in bad housing vary by tenure? The analysis looks separately at the health of people who live in owner occupier, private rented and social rented housing.
NatCen Social Research | People living in bad housing – numbers and health impacts 25
4.2 Definitions The definitions used in the analysis are summarised below.
Bad housing according to ‘condensation’ and ‘mould or fungus’
The following questions were used to identify homes with ‘condensation’ and ‘mould or fungus’.
During the winter months, does condensation form on the windows or walls of any room in your home, apart from bathrooms or toilets?
During the winter months, are there patches of mould or fungus in any room in your home, apart from bathrooms or toilets?
Two groups of homes were compared:
1. Homes with ‘condensation’ and ‘mould or fungus’ (‘bad housing’)
2. Homes without ‘condensation’ and without ‘mould or fungus’ (‘good housing’)
Health of children
Both the general health and respiratory health of children is explored. General health is measured as:
Parent’s assessment of their child’s health
Respiratory health is measured as:
Having problems with breathing, apart from when they have a cold or are exercising
How the problems with breathing have affected their daily life, by limiting them in terms of physical activity, home life, and social activity
Suffering from asthma
The MRC breathlessness scale. This is a measure created by the Medical Research Council, to gauge the disability associated with breathlessness by identifying breathlessness that occurs when it should not
Health of adults
As with children’s health, the health of adults is measured using general health and respiratory health, using the same definitions as above. In addition, the analysis looks at whether the adults have:
A longstanding illness and how this illness affects them in their daily life
Psychological health problems, which is measured as a score of 4+ on the General Health Questionnaire (GHQ)
Low mental wellbeing according to the Warwick Edinburgh Mental Wellbeing Scale
26 NatCen Social Research | People living in bad housing – numbers and health impacts
4.3 Main findings The findings are presented separately for the three life stages: children, working-age adults and pensioners.
4.3.1 Children
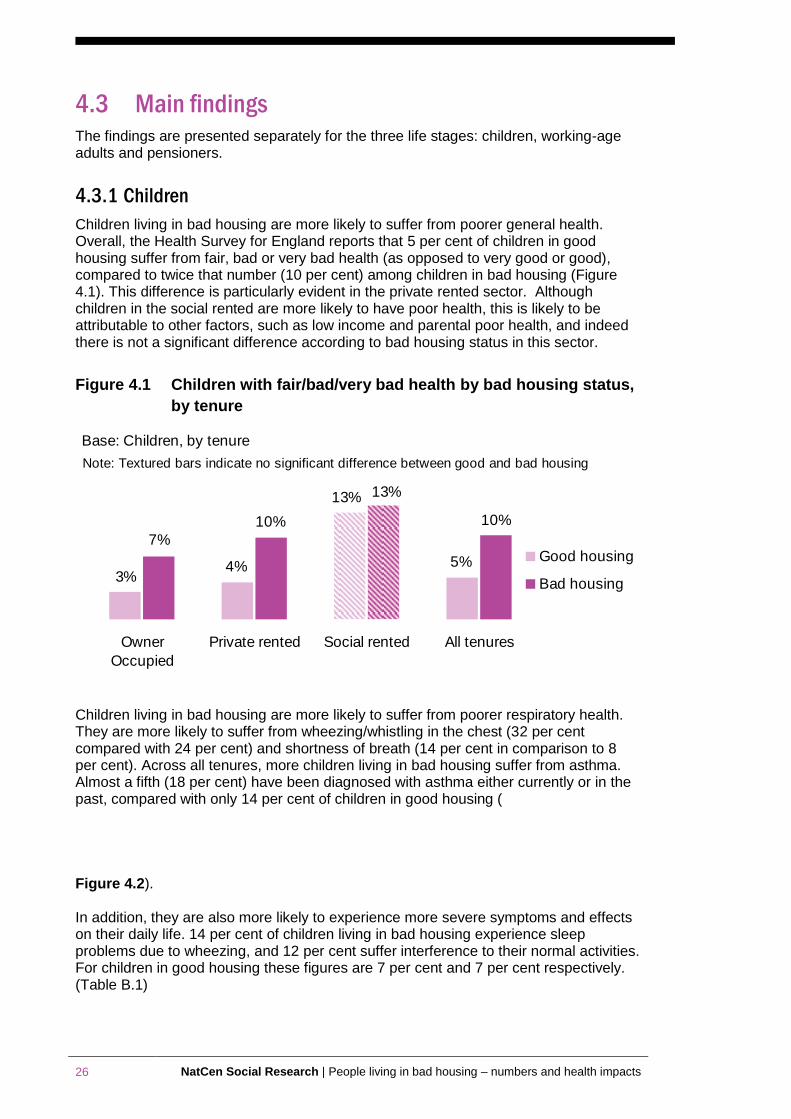
Children living in bad housing are more likely to suffer from poorer general health. Overall, the Health Survey for England reports that 5 per cent of children in good housing suffer from fair, bad or very bad health (as opposed to very good or good), compared to twice that number (10 per cent) among children in bad housing (Figure 4.1). This difference is particularly evident in the private rented sector. Although children in the social rented are more likely to have poor health, this is likely to be attributable to other factors, such as low income and parental poor health, and indeed there is not a significant difference according to bad housing status in this sector.
Figure 4.1 Children with fair/bad/very bad health by bad housing status,
by tenure
5%
13%
4%3%
10%
13%
10%
7%
Owner
Occupied
Private rented Social rented All tenures
Good housing
Bad housing
Base: Children, by tenure
Note: Textured bars indicate no significant difference between good and bad housing
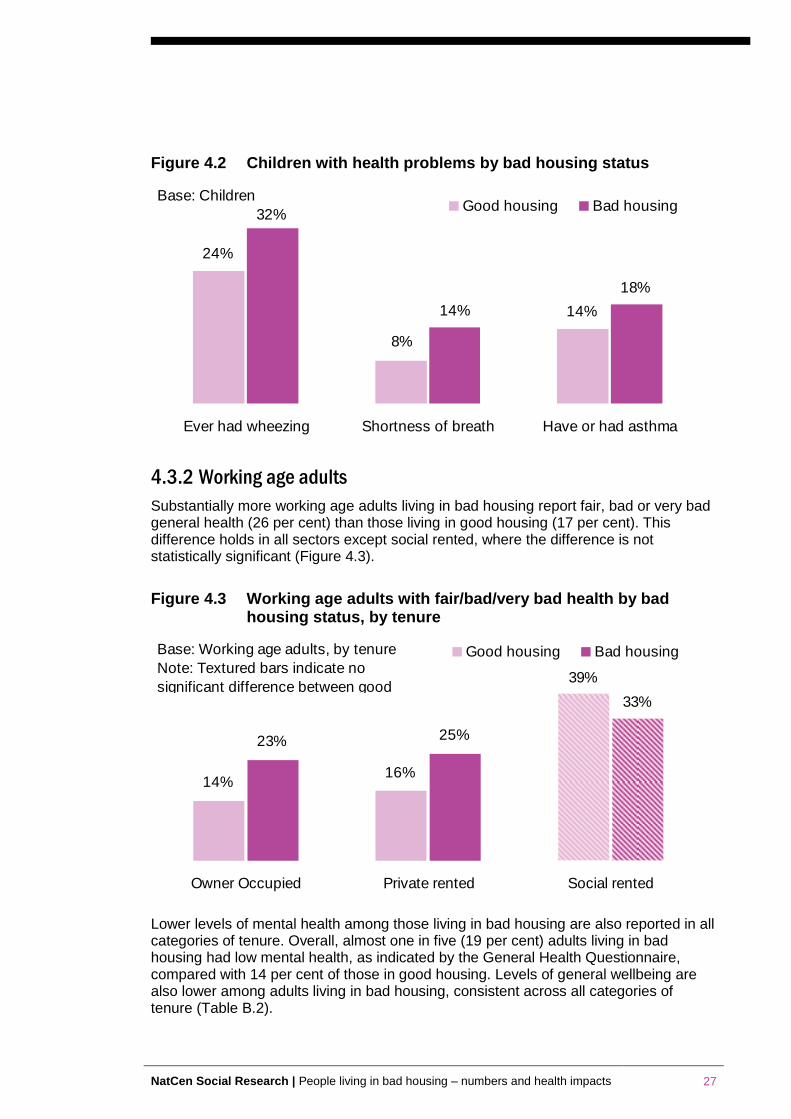
Children living in bad housing are more likely to suffer from poorer respiratory health. They are more likely to suffer from wheezing/whistling in the chest (32 per cent compared with 24 per cent) and shortness of breath (14 per cent in comparison to 8 per cent). Across all tenures, more children living in bad housing suffer from asthma. Almost a fifth (18 per cent) have been diagnosed with asthma either currently or in the past, compared with only 14 per cent of children in good housing (
Figure 4.2). In addition, they are also more likely to experience more severe symptoms and effects on their daily life. 14 per cent of children living in bad housing experience sleep problems due to wheezing, and 12 per cent suffer interference to their normal activities. For children in good housing these figures are 7 per cent and 7 per cent respectively. (Table B.1)
NatCen Social Research | People living in bad housing – numbers and health impacts 27
Figure 4.2 Children with health problems by bad housing status
32%
24%
8%
14%14%
18%
Ever had wheezing Shortness of breath Have or had asthma
Good housing Bad housingBase: Children
4.3.2 Working age adults
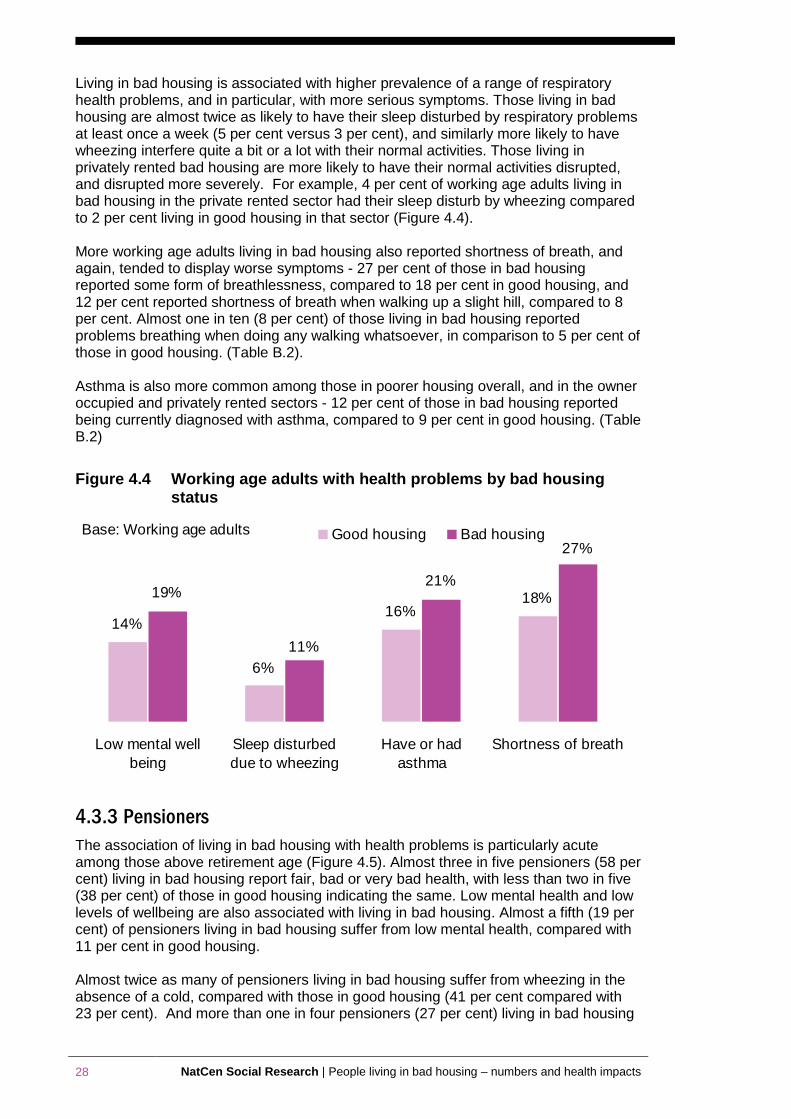
Substantially more working age adults living in bad housing report fair, bad or very bad general health (26 per cent) than those living in good housing (17 per cent). This difference holds in all sectors except social rented, where the difference is not statistically significant (Figure 4.3).
Figure 4.3 Working age adults with fair/bad/very bad health by bad housing status, by tenure
39%
14%16%
23% 25%
33%
Owner Occupied Private rented Social rented
Good housing Bad housingBase: Working age adults, by tenure
Note: Textured bars indicate no
significant difference between good
Lower levels of mental health among those living in bad housing are also reported in all categories of tenure. Overall, almost one in five (19 per cent) adults living in bad housing had low mental health, as indicated by the General Health Questionnaire, compared with 14 per cent of those in good housing. Levels of general wellbeing are also lower among adults living in bad housing, consistent across all categories of tenure (Table B.2).
28 NatCen Social Research | People living in bad housing – numbers and health impacts
Living in bad housing is associated with higher prevalence of a range of respiratory health problems, and in particular, with more serious symptoms. Those living in bad housing are almost twice as likely to have their sleep disturbed by respiratory problems at least once a week (5 per cent versus 3 per cent), and similarly more likely to have wheezing interfere quite a bit or a lot with their normal activities. Those living in privately rented bad housing are more likely to have their normal activities disrupted, and disrupted more severely. For example, 4 per cent of working age adults living in bad housing in the private rented sector had their sleep disturb by wheezing compared to 2 per cent living in good housing in that sector (Figure 4.4). More working age adults living in bad housing also reported shortness of breath, and again, tended to display worse symptoms - 27 per cent of those in bad housing reported some form of breathlessness, compared to 18 per cent in good housing, and 12 per cent reported shortness of breath when walking up a slight hill, compared to 8 per cent. Almost one in ten (8 per cent) of those living in bad housing reported problems breathing when doing any walking whatsoever, in comparison to 5 per cent of those in good housing. (Table B.2). Asthma is also more common among those in poorer housing overall, and in the owner occupied and privately rented sectors - 12 per cent of those in bad housing reported being currently diagnosed with asthma, compared to 9 per cent in good housing. (Table B.2)
Figure 4.4 Working age adults with health problems by bad housing status
11%
18%16%
6%
14%
19%21%
27%
Low mental well
being
Sleep disturbed
due to wheezing
Have or had
asthma
Shortness of breath
Good housing Bad housingBase: Working age adults
4.3.3 Pensioners
The association of living in bad housing with health problems is particularly acute among those above retirement age (Figure 4.5). Almost three in five pensioners (58 per cent) living in bad housing report fair, bad or very bad health, with less than two in five (38 per cent) of those in good housing indicating the same. Low mental health and low levels of wellbeing are also associated with living in bad housing. Almost a fifth (19 per cent) of pensioners living in bad housing suffer from low mental health, compared with 11 per cent in good housing. Almost twice as many of pensioners living in bad housing suffer from wheezing in the absence of a cold, compared with those in good housing (41 per cent compared with 23 per cent). And more than one in four pensioners (27 per cent) living in bad housing
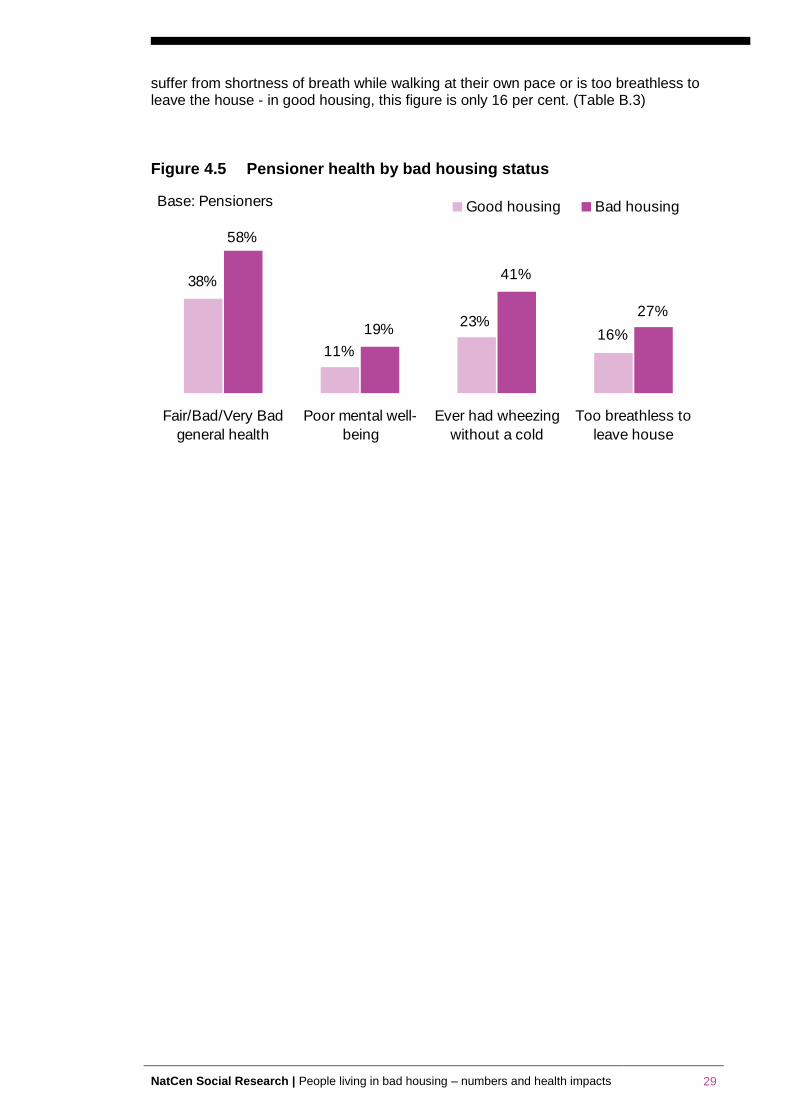
NatCen Social Research | People living in bad housing – numbers and health impacts 29
suffer from shortness of breath while walking at their own pace or is too breathless to leave the house - in good housing, this figure is only 16 per cent. (Table B.3)
Figure 4.5 Pensioner health by bad housing status
58%
16%23%
11%
38%
19%
41%
27%
Fair/Bad/Very Bad
general health
Poor mental well-
being
Ever had wheezing
without a cold
Too breathless to
leave house
Good housing Bad housingBase: Pensioners
30 NatCen Social Research | People living in bad housing – numbers and health impacts
References
Aaronson, D. (2000) A note on the benefits of homeownership. Journal of Urban Economics, 47, 356−369.
Acevedo-Garcia D. (2000) Residential segregation and the epidemiology of infectious diseases. Soc. Sci. Med. 51:1143–61
Adam, E. K., & Chase-Lansdale, L. (2002) Home sweet home(s): Parental separations, residential moves, and adjustment problems in low-income adolescent girls. Developmental Psychology, 38, 792−805.
Aylin P, Morris S, Wakefield J, Grossinho A, Jarrup L, Elliott P. (2001) Temperature, housing, deprivation and their relationship to excess winter mortality in Great Britain. Int. J. Epidemiol. 30:1100–8
Acheson Report (1998) Independent Inquiry into Inequalities in Health: Report. London, Stationery Office.
Arblaster, L. & Hawtin, M. (1993) Health, Housing and Social Policy. London, Socialist Health Association.
Astone, N. M., & McLanahan, S. S. (1994) Family structure, residential mobility, and school drop out: A research note. Demography, 31, 575−584
Baker, E., Bentley, R., Mason, K. (2013) The Mental Health Effects of Housing Tenure: Causal or Compositional?, Urban Studies 50(2): 426-442
Baker, D., Taylor, H., Henderson, J., & The ALSPAC Study Team (1998) Inequality in infant morbidity: Causes and consequences in England in the 1990s. Journal of Epidemiology and Community Health, 52, 451−458
Barker, D., & Miller, E. A. (2009) Homeownership and child welfare. Real Estate Economics, 37, 279−303
Barnes, M., Lyon, N., and Conolly, A. (2006) The Living Standards of Children in Bad Housing: Evidence from the Families and Children Study (FACS) 2004. National Centre for Social Research http://www.natcen.ac.uk/media/492166/living%20standards%20kids%20in%20bad%20housing%20report.pdf
Barnes, M., Butt, S. and Tomaszewski, W. (2010) 'The Duration of Bad Housing and Children's Well-being in Britain', Housing Studies http://dx.doi.org/10.1080/02673037.2010.512749
Bartlett, S. (1998). Does inadequate housing perpetuate children's poverty? Childhood, 5, 403−420.
Blackman T, Harvey J, Lawrence M, Simon A. (2001) Neighbourhood renewal and health: evidence from a local case study. Health Place 7:93–103
Boyle, M. (2002) Home ownership and the emotional and behavioral problems of children and youth. Child Development, 73, 883–892. Child Development, 7, 883–892
Britten, N., Davies, J. & Colley, J. (1987) Early respiratory experience and subsequent cough and peak expiratory low rate in 36 year old men and women, British Medical Journal, 294, pp. 1317–1319.
Chadwick, E. (1842) Report on the Sanitary Conditions of the Labouring Population of Great Britain (London, HMSO).
Cole, I et al (2005) A review of the evidence base on frequent moving among disadvantaged groups, Social Exclusion Unit.
Conley, D. (2001) A room with a view or a room of one's own? Housing and social stratification, Sociological Forum 16(2): 263-280
NatCen Social Research | People living in bad housing – numbers and health impacts 31
Cookson, A. and Sillet, J. (2009) Room to Move, London: Local Government Information Unit.
Credland, S. and Lewis, H (2004) Sick and tired: the impact of temporary accommodation on the health of homeless families, Shelter http://england.shelter.org.uk/__data/assets/pdf_file/0005/66416/Sick_and_tired.pdf
Dedman D, Gunnell D, Davey Smith G, Frankel S. (2001) Childhood housing conditions and later mortality in the Boyd Orr cohort. J. Epidemiol. Community Health 55:10–15
Department for Communities and Local Government (2011a) Private Landlords Survey, October 2011 http://www.communities.gov.uk/documents/statistics/pdf/2010380.pdf
Department for Communities and Local Government (2011b) English Housing Survey: Headline Report 2009-10, London: DCLG
Department for Communities and Local Government (2013) English Housing Survey: Headline Report 2011-12, London: DCLG
de Santos, R. (2012) A better deal: towards more stable private renting, Shelter http://england.shelter.org.uk/__data/assets/pdf_file/0009/587178/A_better_deal_report.pdf
Dunn J. (2002) Housing and inequalities in health: a study of socioeconomic dimensions of housing and self reported health from a survey of Vancouver residents. J. Epidemiol. Community Health 56:671–81
Dupuis A. (1998) Home, home ownership and the search for ontological security. Sociol. Rev. 46:25–47
Easterlow, D., Smith, S.J., Mallinson, S. (2000) Housing for health: The role of owner occupation, Housing Studies 15(3): 367-386
Ellaway A and Macintyre S. (1998) Does housing tenure predict health in the UK because it exposes people to different levels of housing related hazards in the home or its surroundings? Health Place 4:141–50
Evans, G. (2001) Environmental stress and health. In A. Baum, T. Revenson, & J. Singer (Eds.), Handbook of health psychology (pp. 365−385). Mahwah, NJ: Erlbaum
Evans, G. W. (2003) The built environment and mental health. Journal of Urban Health, 80(4), 536−555.
Evans, G. (2004) The environment of childhood poverty. American Psychologist, 59, 77−92.
Evans, G. W., and English, K. (2002) The environment of poverty: Multiple stressor exposure, psychophysiological stress, and socioemotional adjustment. Child Development, 1238−1248.
Evans J, Hyndman S, Stewart-Brown S, Smith D and Petersen S. (2000) An epidemiological study of the relative importance of damp housing in relation to adult health. J.Epidemiol. Community Health 54:677–86
Filakti H and Fox J. (1995) Differences in mortality by housing tenure and by car access from the OPCS Longitudinal Study. Popul. Trends 81:27–30
Fisk, W. J., Lei-Gomez, Q., and Mendell, M. J. (2007) Meta-analyses of the associations of respiratory health effects with dampness and mold in homes. Indoor Air, 17, 284−296.
Galpin, O. P., Walker, C. J., and Dubiel, A. J. (1992) Helicobacter pylori infection and overcrowding in childhood. Lancet, 339−361
32 NatCen Social Research | People living in bad housing – numbers and health impacts
Galster, G., Marcotte, D.E., Mendell, M.B., Wolman, H. and Augustine, N. (2007) The impact of parental homeownership on children's outcomes during early adulthood, Housing Policy Debate 18(4): 785-827
Gemmell, I. (2001) Indoor heating, house conditions, and health. J. Epidemiol. Community Health 55:928–29
Ghodsian, M. and Fogelman, K. (1988) A longitudinal study of housing circumstances in childhood and early adulthood, NCDS User Support Group Working Paper, 29.
Gibson M, Petticrew M, Bambra C, Sowden A. J, Wright K. E and Whitehead M. (2011) Housing and health inequalities: a synthesis of systematic reviews of interventions aimed at different pathways linking housing and health, Health Place 17(1):175-84.
Gould, M.I., and Jones, K (1996) Analysing perceived limiting long term illness using UK Census micro data. Social Science Medicine 42, 6 857-869
Goux, D. and Maurin, E. (2005). The effect of overcrowded housing on children's performance at school. Journal of Public Economics, 89, 797−819
Gordon-Larsen, P., Nelson, M., Page, P. and Popkin, B (2006) Inequality in the Built Environment Underlies Key Health Disparities in Physical Activity and Obesity Pediatrics Vol. 117 No. 2 February 1, 2006 pp. 417 -424
Green, R. and White, M. (1997). Measuring the benefits of homeowning: Effects on children. Journal of Urban Economics, 41, 441−461
Hagan, J., MacMillian, R. and Wheaton, B. (1996). New kid in town: Social capital and the life course effects of family migration on children. American Sociological Review, 61, 368−385.
Halpern D. 1995. More Than Bricks and Mortar? London: Taylor & Francis.
Hango, D. W. (2006) The long-term effect of childhood residential mobility on educational attainment. Sociological Quarterly, 47, 631−664.
Harding, S., Bethune, A., Maxwell, R., and Brown, J.,(1997) Mortality trends using the longitudinal study. In: Drever, F., Whitehead, M. (Eds.), Health Inequalities: Decennial Supplement DS Series No. 15. The Stationery Office, London.
Haurin, D., Parcel, T., and Haurin, R. J. (2002). Does homeownership affect child outcomes? Real Estate Economics, 30, 635−666.
Haurin, D., Parcel, T., and Haurin, R. J. (2000). The impact of homeownership on child outcomes. Social Science Research Network Electronic Paper Collection. http://papers.ssrn.com/sol3/papers.cfm?abstract_id=218969
Haynie, D., South, S., and Bose, S. (2006) The company you keep: Adolescent mobility and peer behavior. Sociological Inquiry, 76, 397−426.
Haynes R, Reading R, and Gale S. (2003) Household and neighbourhood risks for injury to 5–14 year old children. Soc. Sci. Med. 57:625–36
Hendershott, A. B. (1989). Residential mobility, social support and adolescent self concept. Adolescence, 24, 217−232
Holupka, C. S. and Newman, S. J. (2010). The effects of homeownership on children's outcomes: real effects or self-selection? Paper presented at the mid-year research meeting of the American Real Estate and Urban Economics Association, Washington, DC, May 2010.
Housing Corporation and Chartered Institute of Housing (HC/CIH) (2008)
Housing Needs and Aspirations of Ethnic Minority Communities, Coventry: Chartered Institute of Housing.
NatCen Social Research | People living in bad housing – numbers and health impacts 33
Hume C, Salmon J. and Ball K (2005) Children's perceptions of their home and neighbourhood environments, and their association with objectively measured physical activity: a qualitative and quantitative study. Health Educ Res 2005, 20:1-13.
Hunt, S. (1997) Housing-related disorders, in: J. Charlton & M. Murphy (Eds) The Health of Adult Britain 1841–1994, 1: Suppl 12 (London: The Stationery Office).
Ineichen, B. (1993) Homes and Health: How Housing and Health Interact. London: E & FN Spon.
Kawachi I and Berkman L. (2000) Social cohesion, social capital, and health. pp. 174–90
Kemp, P.A. (2011) Low-income Tenants in the Private Rental Housing Market, Housing Studies 26(7-8): 1019-1034
Krieger, J., and Higgins, D. (2002). Housing and health: Time again for public health action. American Journal of Public Health, 92, 758−768
Kuh, D. and Wadsworth, M. (1989) Parental height, childhood environment and subsequent adult height in a national birth cohort, International Journal of Epidemiology, 18, pp. 663–667.
Kuh D and Ben-Shlomo Y (1997) A Life Course Approach to Chronic Disease Epidemiology. Oxford: Oxford Univ. Press
Leather, P., Mackintosh, S. and Rolfe, S., (1994) Papering over the Cracks. Housing Conditions and the Nation’s Health. The National Housing Forum, London.
Leventhal, T. and Newman, S. (2010) Housing and child development, Children and Youth Services Review 32(9): 1165-1174
Lewis, G. and Booth, M. (1992) Regional differences in mental health in Great Britain. Journal of Epidemiology and Community Health 46, 608–611
London Assembly (2011) Bleak Houses: Improving London's private rented housing. London Assembly Report to the Housing and Planning Committee, December 2011
Lowry, S. (1991) Housing and Health (London: BMJ).
Lyons, R., John, A., Brophy, S., Jones, S., Johansen, A., Kemp, A., et al. (2007). Modification of the home environment for the reduction of injuries. Evidence-based child health. A Cochrane Review Journal, 2, 899−928
Macintyre S, Ellaway A, Hiscock R, Kearns A, Der G, Mackay L. (2003) What features of the home and the area might help to explain observed relationships between housing tenure and health? Evidence from the west of Scotland. Health Place 9:207–18
Macintyre S, Hiscock R, Kearns A. and Ellaway A. (2001) Housing tenure and car access: further exploration of the nature of their relations with health in a UK setting, J Epidemiol Community Health 55(5):330-1.
Mann, S.L., Wadsworth, M.E.J. and Colley, J.R.T. (1992) Accumulation of factors in influencing respiratory illness in members of a national birth cohort and their offspring, Journal of Epidemiology and Community Health, 46, pp. 286–290.
Marmot review (2010) Fair Society, Healthy Lives, Strategic Review of Health Inequalities in England post 2010
Marsh, A., Gordon, D., Pantazis, C. and Heslop, P. (1999) Home Sweet Home? The Impact of Poor Housing on Health. Bristol. The Policy Press).
Marsh, A., Gordon, D., Heslop, P., and Pantazis, C. (2000): Housing Deprivation and Health: A Longitudinal Analysis, Housing Studies, 15:3, 411-428
34 NatCen Social Research | People living in bad housing – numbers and health impacts
McCallion, W., Murray, L., Bailie, A., Dalzell, A., O'Reilly, D., & Bamford, K. (1996) Helicobacter pylori infection in children: Relation with current household living conditions. Gut, 39(18–21).
Maxwell, L. (1996) Multiple effects of home and day care crowding. Environment and Behavior, 28, 494−511
Mitchell, F., Neuburger, J., Radebe, D and Rayne, R (2004) Living in limbo: survey of homeless households living in temporary accommodation, Shelter http://england.shelter.org.uk/__data/assets/pdf_file/0020/66404/Living_in_limbo.pdf
Montgomery, S., Bartley, M. and Wilkinson, R. (1996) The association of slow growth in childhood with family conflict. NCDS User Support Group Working Paper 48.
Murray, C., Poletti, G., Kebadze, T., Morris, J., Woodcock, A., Johnston, S., et al. (2007) Study of modifiable risk factors for asthma exacerbations: Virum infection andallergen exposure increase the risk of asthma hospital admissions in children. Thorax, 61, 376−382
Newman, S. (2008) Does housing matter for poor families? A critical summary of research and issues still to be resolved. Journal of Policy Analysis and Management, 27(4), 895−925.
O'Campo, P., Rao, R. P., Gielan, A. C., Royalty, W., and Wilson, M. (2000) Injury-producing events among children in low-income communities: The role of community characteristics. Journal of Urban Health, 77(1), 34−49.
OPDM (2004) The impact of overcrowding on health and education: A review of the evidence and literature
Peat J., Dickerson J and Li J. (1998) Effects of damp and mould in the home respiratory health: a review of the literature. Allergy 53:120–28
Pevalin, D.J., Taylor, M.P. and Todd, J. (2008) The dynamics of unhealthy housing in the UK: A panel data analysis, Housing Studies 23(5): 679-695
Pickett K and Pearl M. (2001) Multilevel analyses of neighbourhood socioeconomic context and health outcomes: a critical review. J. Epidemiol. Community Health 55:111–22
Power, C. and Hertzman, C. (1997) Social and biological pathways linking early life and adult disease, in: M. Marmot & M. Wadsworth (Eds) Fetal and early childhood environment: long-term health implications, British Medical Bulletin, 53(1), pp. 210–223.
Pribesh, S., and Downey, D. B. (1999) Why are residential and school moves associated with poor school performance? Demography, 36, 521−534
Rudge, J. and Nicol, F. (Eds) (2000) Cutting the Cost of Cold: Affordable Warmth for Healthier Homes. London and New York: E & FN Spon.
Ruel E, Oakley D, Wilson G.E, Maddox R. (2010) Is public housing the cause of poor health or a safety net for the unhealthy poor?, Journal of Urban Health 87(5):827-38
Rugg, J and Rhodes, D. (2008) The private Rented Sector: its contribution and potential, Centre for Housing Policy, University of York (UK grey review) http://www.york.ac.uk/media/chp/documents/2008/prsreviewweb.pdf
Sandel, M., and Wright, R. (2007). When home is where the stress is: Expanding the dimensions of housing that influence asthma morbidity. Archives of Disease in Childhood, 91, 942−948
Shaw, M. (2004) Housing and Public Health. Annual Review of Public Health 2004, 25: 397-418
Shaw M, Dorling D and Brimblecombe N. (1999) Life chances in Britain by housing wealth and for the homeless and vulnerably housed. Environ. Plan. A 31:2239–48
NatCen Social Research | People living in bad housing – numbers and health impacts 35
Shelter (2005) Full house? How overcrowded housing affects families, Shelter http://england.shelter.org.uk/__data/assets/pdf_file/0016/66400/Full_house_reportL.pdf
Shenassa, E. D., Stubbendick, A., and Brown, M. J. (2004) Social disparities in housing and related pediatric injury: A multilevel study. American Journal of Public Health, 94, 633−639.
Simpson, G. A., and Fowler, M. G. (1994) Geographic mobility and children's emotional/ behavioral adjustment and school functioning. American Academy of Pediatrics, 93,303−309
Smith, S.J. (1989) Housing and health: a review and research agenda. Discussion Paper 27, Centre for Housing Research, University of Glasgow, Glasgow
Stoneman, Z., Brody, G. H., Churchill, S. L., and Winn, L. L. (1999) Effects of residential instability on Head Start children and their relationships with older siblings: Influence of child emotionality and conflict between family caregivers. Child Development, 70, 1246−1262.
Tavernier, G., Fletcher, G., Gee, I., Watson, A., Blacklock, G., Francis, H., et al. (2006) IPEADAM Study: Indoor endotoxin exposure, family status, and some housing characteristics in English children. Journal of Allergy and Clinical Immunology, 117, 656−662.
Thompson, H., Petticrew, M. and Morrison, D. (2002) Housing improvement and health gain: a summary and systematic review. MRC Social and Public Health Sciences Unit, University of Glasgow
Timperio A, Crawford D, Telford A and Salmon J (2004) Perceptions about the local neighborhood and walking and cycling among children. Prev Med 2004, 38:39-47.
Tunstall, R., Bevan, M., Bradshaw, J., Croucher, K., Duffy, S., Hunter C., Jones A, Rugg, J, Wallace A, and Wilcox S (2013) The Links between Housing and poverty, Joseph Rowntree Foundation
United Nations (1991) The Right to Adequate Housing. UN Comm. Econ.,Soc. Cult. Rights.
Universities of Sussex & Westminster (1996) The Real Cost of Poor Homes (London, Royal Institution of Chartered Surveyors).
Vaughan, E., Anderson, C., Agran, P., & Winn, D. (2004) Cultural differences in young children's vulnerability to injuries: A risk and protection perspective. Health Psychology, 23, 289−298.
Weich S, Blanchard M, Prince M, Burton E, Erens B, Sproston K. (2002) Mental health and the built environment: crosssectional survey of individual and contextual risk factors for depression. Br. J. Psychiatry 180:428–33
Wilkinson R. (1996) Unhealthy Societies: The Afflictions of Inequality. London: Routledge
Wilkinson, P., Landon, M., Armstrong, B., Stevenson, S., Pattenden, S., McKee, M. and Fletcher, T. (2001) Cold Comfort: The Social and Environmental Determinants of Excess Winter Deaths in England, 1986–96. Bristol: Policy Press.
Wood, D., Halfon, N., Scarlata, D., Newacheck, P. and Nessim, S. (1993) Impact of family relocation on children's growth, development, school function, and behavior. Journal of the American Medical Association, 270(11), 1334−1338
Wright, R.J., Mitchell, H., Visness, C.M., Cohen, S., Stout, J., Evans, R., and Gold, D.R (2004) Community Violence and Asthma Morbidity: The Inner-City Asthma Study. American Journal of Public Health: April 2004, Vol. 94, No. 4, pp. 625-632.
Wu, F., & Takaro, T. (2007) Childhood asthma and environmental interventions. Environmental Health Perspectives, 115, 971−975.
36 NatCen Social Research | People living in bad housing – numbers and health impacts
Appendix A. Numbers in bad housing: Tables from
the English Housing Survey
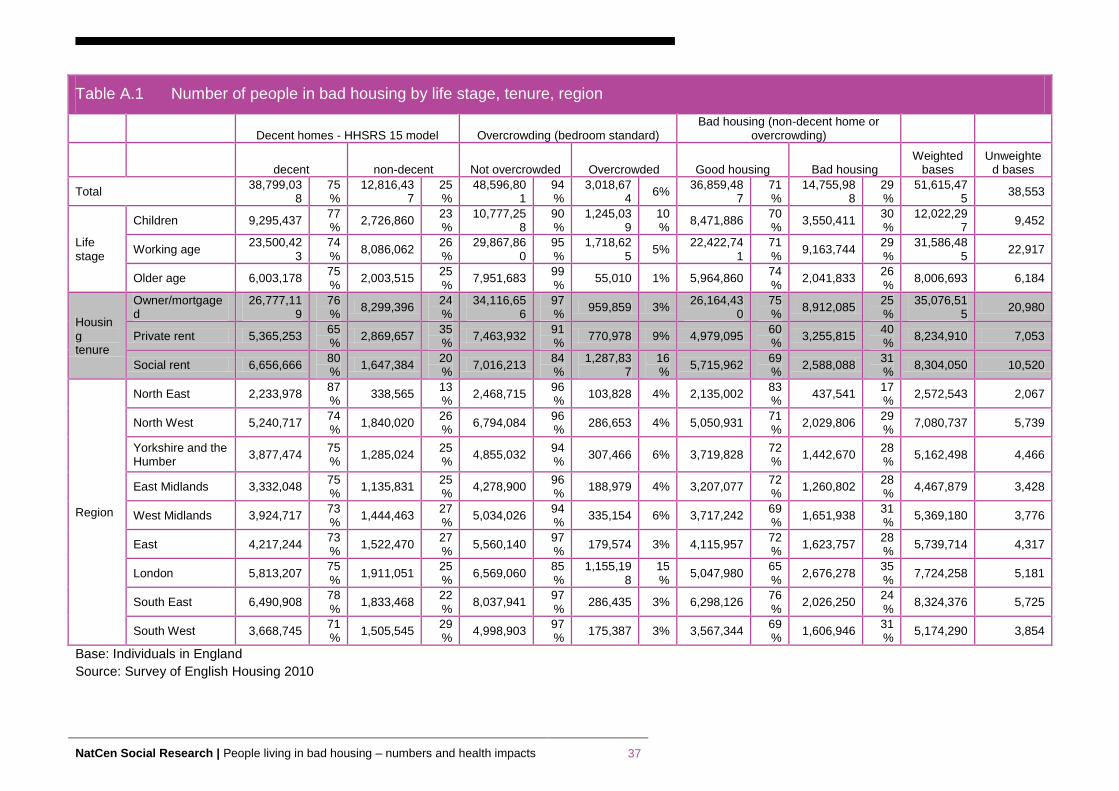
NatCen Social Research | People living in bad housing – numbers and health impacts 37
Table A.1 Number of people in bad housing by life stage, tenure, region
Decent homes - HHSRS 15 model Overcrowding (bedroom standard) Bad housing (non-decent home or
overcrowding)
decent non-decent Not overcrowded Overcrowded Good housing Bad housing
Weighted bases
Unweighted bases
Total 38,799,03
8 75%
12,816,437
25%
48,596,801
94%
3,018,674
6% 36,859,48
7 71%
14,755,988
29%
51,615,475
38,553
Life stage
Children 9,295,437 77%
2,726,860 23%
10,777,258
90%
1,245,039
10%
8,471,886 70%
3,550,411 30%
12,022,297
9,452
Working age 23,500,42
3 74%
8,086,062 26%
29,867,860
95%
1,718,625
5% 22,422,74
1 71%
9,163,744 29%
31,586,485
22,917
Older age 6,003,178 75%
2,003,515 25%
7,951,683 99%
55,010 1% 5,964,860 74%
2,041,833 26%
8,006,693 6,184
Housing tenure
Owner/mortgaged
26,777,119
76%
8,299,396 24%
34,116,656
97%
959,859 3% 26,164,43
0 75%
8,912,085 25%
35,076,515
20,980
Private rent 5,365,253 65%
2,869,657 35%
7,463,932 91%
770,978 9% 4,979,095 60%
3,255,815 40%
8,234,910 7,053
Social rent 6,656,666 80%
1,647,384 20%
7,016,213 84%
1,287,837
16%
5,715,962 69%
2,588,088 31%
8,304,050 10,520
Region
North East 2,233,978 87%
338,565 13%
2,468,715 96%
103,828 4% 2,135,002 83%
437,541 17%
2,572,543 2,067
North West 5,240,717 74%
1,840,020 26%
6,794,084 96%
286,653 4% 5,050,931 71%
2,029,806 29%
7,080,737 5,739
Yorkshire and the Humber
3,877,474 75%
1,285,024 25%
4,855,032 94%
307,466 6% 3,719,828 72%
1,442,670 28%
5,162,498 4,466
East Midlands 3,332,048 75%
1,135,831 25%
4,278,900 96%
188,979 4% 3,207,077 72%
1,260,802 28%
4,467,879 3,428
West Midlands 3,924,717 73%
1,444,463 27%
5,034,026 94%
335,154 6% 3,717,242 69%
1,651,938 31%
5,369,180 3,776
East 4,217,244 73%
1,522,470 27%
5,560,140 97%
179,574 3% 4,115,957 72%
1,623,757 28%
5,739,714 4,317
London 5,813,207 75%
1,911,051 25%
6,569,060 85%
1,155,198
15%
5,047,980 65%
2,676,278 35%
7,724,258 5,181
South East 6,490,908 78%
1,833,468 22%
8,037,941 97%
286,435 3% 6,298,126 76%
2,026,250 24%
8,324,376 5,725
South West 3,668,745 71%
1,505,545 29%
4,998,903 97%
175,387 3% 3,567,344 69%
1,606,946 31%
5,174,290 3,854
Base: Individuals in England
Source: Survey of English Housing 2010
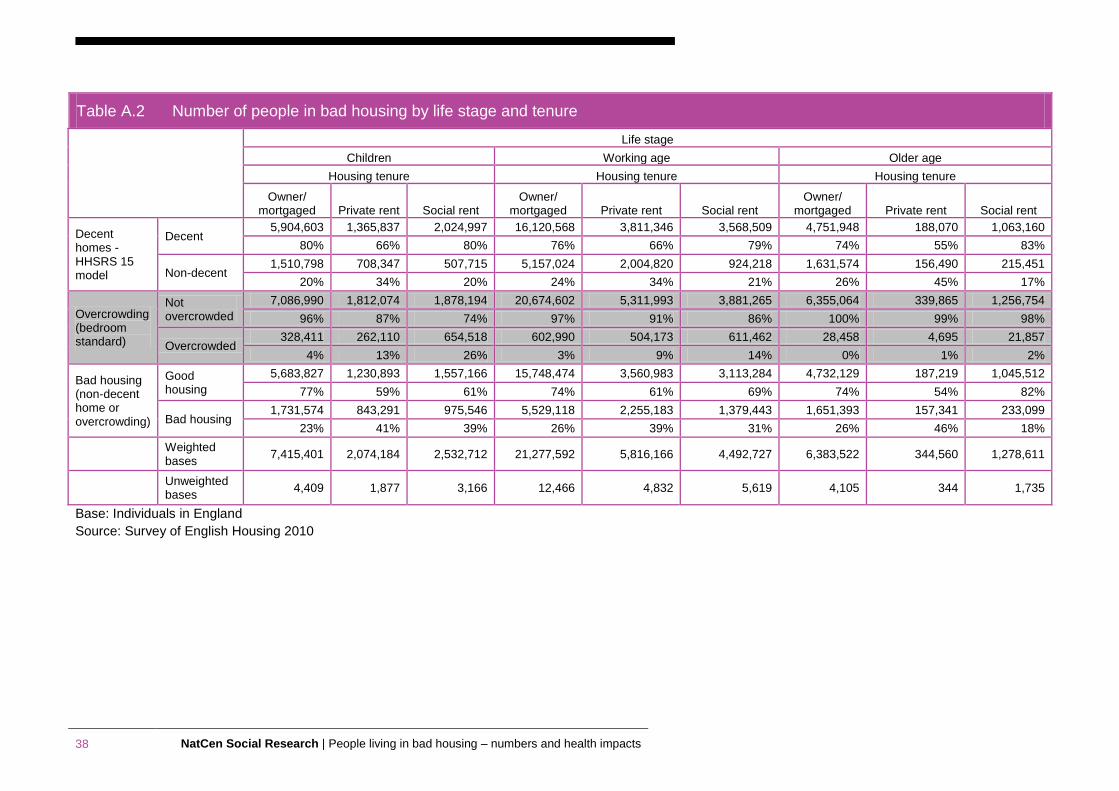
38 NatCen Social Research | People living in bad housing – numbers and health impacts
Table A.2 Number of people in bad housing by life stage and tenure
Life stage
Children Working age Older age
Housing tenure Housing tenure Housing tenure
Owner/ mortgaged Private rent Social rent
Owner/ mortgaged Private rent Social rent
Owner/ mortgaged Private rent Social rent
Decent homes - HHSRS 15 model
Decent 5,904,603 1,365,837 2,024,997 16,120,568 3,811,346 3,568,509 4,751,948 188,070 1,063,160
80% 66% 80% 76% 66% 79% 74% 55% 83%
Non-decent 1,510,798 708,347 507,715 5,157,024 2,004,820 924,218 1,631,574 156,490 215,451
20% 34% 20% 24% 34% 21% 26% 45% 17%
Overcrowding (bedroom standard)
Not overcrowded
7,086,990 1,812,074 1,878,194 20,674,602 5,311,993 3,881,265 6,355,064 339,865 1,256,754
96% 87% 74% 97% 91% 86% 100% 99% 98%
Overcrowded 328,411 262,110 654,518 602,990 504,173 611,462 28,458 4,695 21,857
4% 13% 26% 3% 9% 14% 0% 1% 2%
Bad housing (non-decent home or overcrowding)
Good housing
5,683,827 1,230,893 1,557,166 15,748,474 3,560,983 3,113,284 4,732,129 187,219 1,045,512
77% 59% 61% 74% 61% 69% 74% 54% 82%
Bad housing 1,731,574 843,291 975,546 5,529,118 2,255,183 1,379,443 1,651,393 157,341 233,099
23% 41% 39% 26% 39% 31% 26% 46% 18%
Weighted bases
7,415,401 2,074,184 2,532,712 21,277,592 5,816,166 4,492,727 6,383,522 344,560 1,278,611
Unweighted bases
4,409 1,877 3,166 12,466 4,832 5,619 4,105 344 1,735
Base: Individuals in England
Source: Survey of English Housing 2010
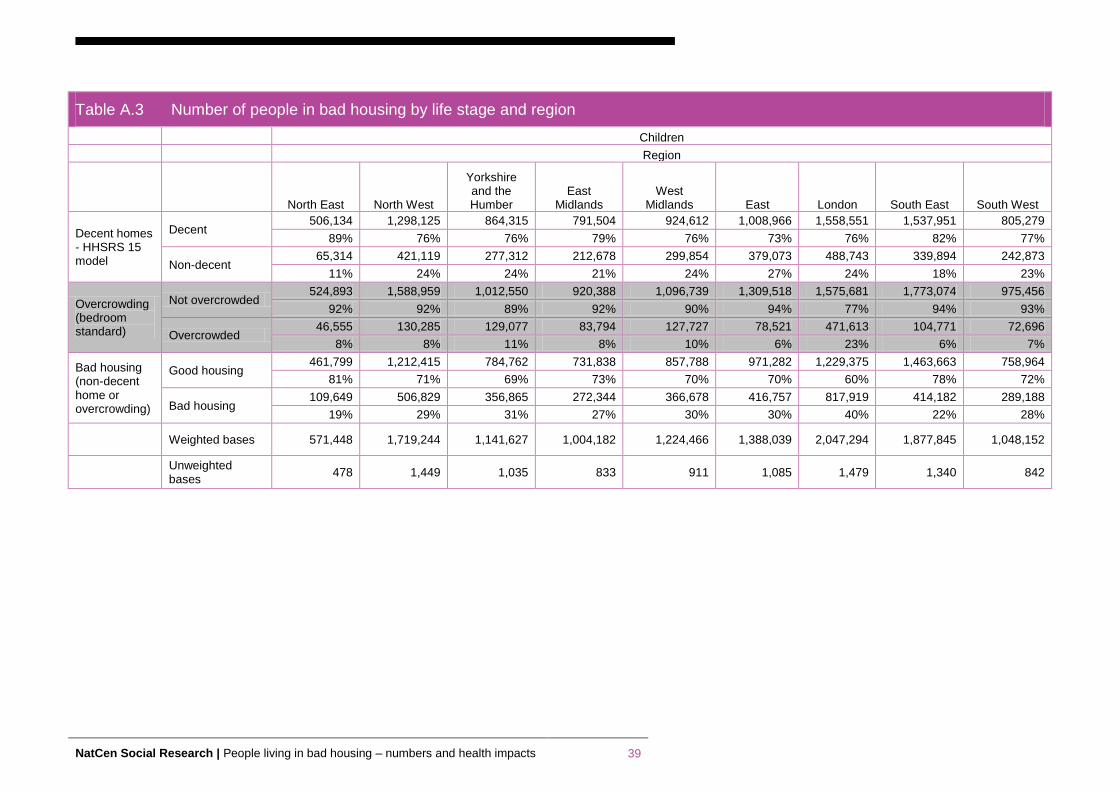
NatCen Social Research | People living in bad housing – numbers and health impacts 39
Table A.3 Number of people in bad housing by life stage and region
Children
Region
North East North West
Yorkshire and the Humber
East Midlands
West Midlands East London South East South West
Decent homes - HHSRS 15 model
Decent 506,134 1,298,125 864,315 791,504 924,612 1,008,966 1,558,551 1,537,951 805,279
89% 76% 76% 79% 76% 73% 76% 82% 77%
Non-decent 65,314 421,119 277,312 212,678 299,854 379,073 488,743 339,894 242,873
11% 24% 24% 21% 24% 27% 24% 18% 23%
Overcrowding (bedroom standard)
Not overcrowded 524,893 1,588,959 1,012,550 920,388 1,096,739 1,309,518 1,575,681 1,773,074 975,456
92% 92% 89% 92% 90% 94% 77% 94% 93%
Overcrowded 46,555 130,285 129,077 83,794 127,727 78,521 471,613 104,771 72,696
8% 8% 11% 8% 10% 6% 23% 6% 7%
Bad housing (non-decent home or overcrowding)
Good housing 461,799 1,212,415 784,762 731,838 857,788 971,282 1,229,375 1,463,663 758,964
81% 71% 69% 73% 70% 70% 60% 78% 72%
Bad housing 109,649 506,829 356,865 272,344 366,678 416,757 817,919 414,182 289,188
19% 29% 31% 27% 30% 30% 40% 22% 28%
Weighted bases 571,448 1,719,244 1,141,627 1,004,182 1,224,466 1,388,039 2,047,294 1,877,845 1,048,152
Unweighted bases
478 1,449 1,035 833 911 1,085 1,479 1,340 842
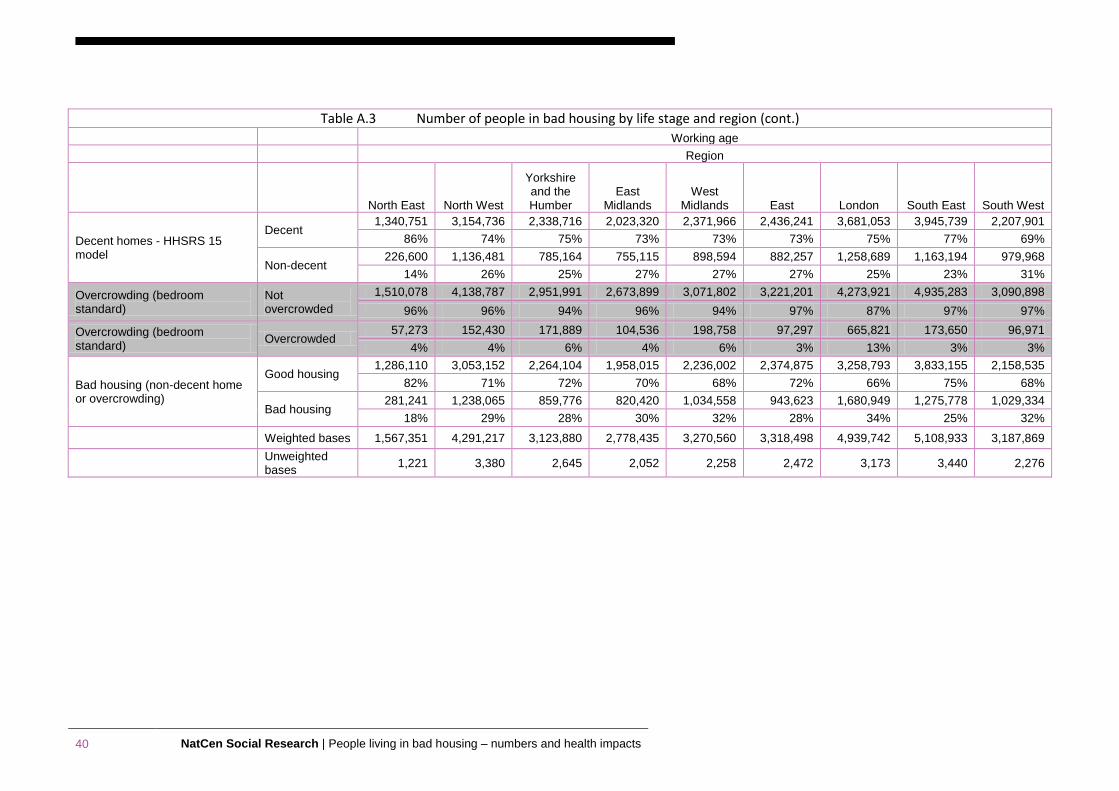
40 NatCen Social Research | People living in bad housing – numbers and health impacts
Table A.3 Number of people in bad housing by life stage and region (cont.) Working age
Region
North East North West
Yorkshire and the Humber
East Midlands
West Midlands East London South East South West
Decent homes - HHSRS 15 model
Decent 1,340,751 3,154,736 2,338,716 2,023,320 2,371,966 2,436,241 3,681,053 3,945,739 2,207,901
86% 74% 75% 73% 73% 73% 75% 77% 69%
Non-decent 226,600 1,136,481 785,164 755,115 898,594 882,257 1,258,689 1,163,194 979,968
14% 26% 25% 27% 27% 27% 25% 23% 31%
Overcrowding (bedroom standard)
Not overcrowded
1,510,078 4,138,787 2,951,991 2,673,899 3,071,802 3,221,201 4,273,921 4,935,283 3,090,898
96% 96% 94% 96% 94% 97% 87% 97% 97%
Overcrowding (bedroom standard)
Overcrowded 57,273 152,430 171,889 104,536 198,758 97,297 665,821 173,650 96,971
4% 4% 6% 4% 6% 3% 13% 3% 3%
Bad housing (non-decent home or overcrowding)
Good housing 1,286,110 3,053,152 2,264,104 1,958,015 2,236,002 2,374,875 3,258,793 3,833,155 2,158,535
82% 71% 72% 70% 68% 72% 66% 75% 68%
Bad housing 281,241 1,238,065 859,776 820,420 1,034,558 943,623 1,680,949 1,275,778 1,029,334
18% 29% 28% 30% 32% 28% 34% 25% 32%
Weighted bases 1,567,351 4,291,217 3,123,880 2,778,435 3,270,560 3,318,498 4,939,742 5,108,933 3,187,869
Unweighted bases
1,221 3,380 2,645 2,052 2,258 2,472 3,173 3,440 2,276
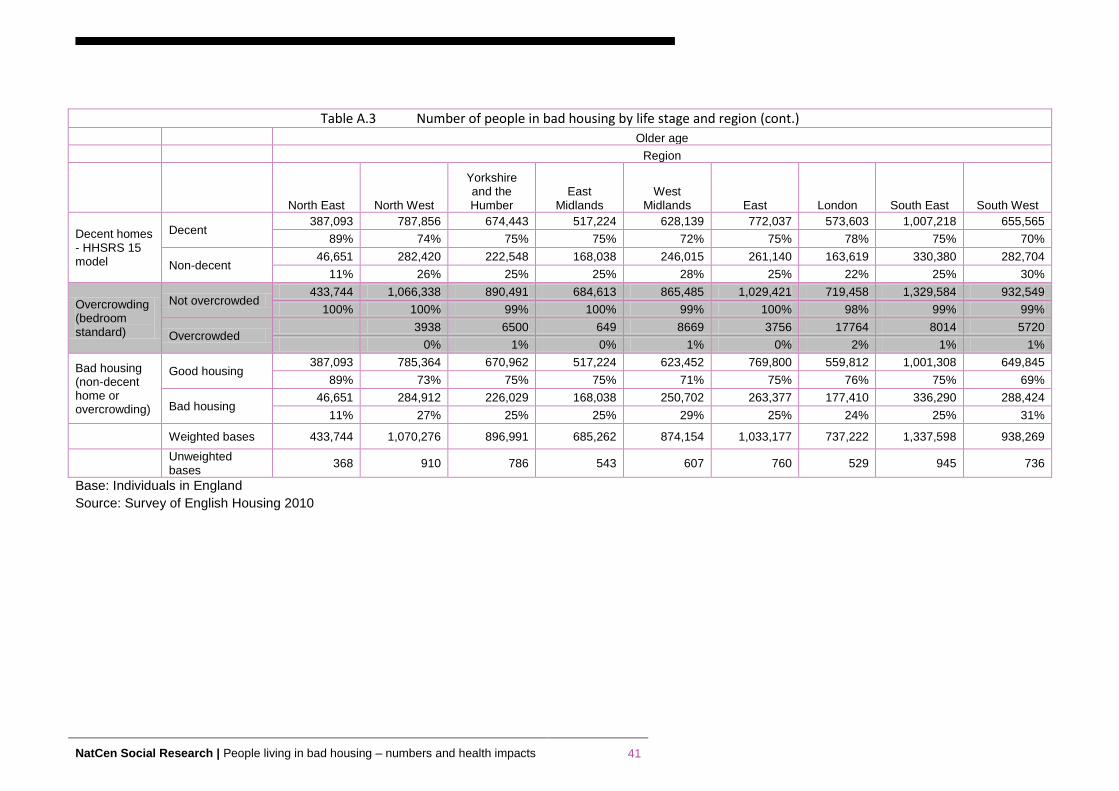
NatCen Social Research | People living in bad housing – numbers and health impacts 41
Table A.3 Number of people in bad housing by life stage and region (cont.) Older age
Region
North East North West
Yorkshire and the Humber
East Midlands
West Midlands East London South East South West
Decent homes - HHSRS 15 model
Decent 387,093 787,856 674,443 517,224 628,139 772,037 573,603 1,007,218 655,565
89% 74% 75% 75% 72% 75% 78% 75% 70%
Non-decent 46,651 282,420 222,548 168,038 246,015 261,140 163,619 330,380 282,704
11% 26% 25% 25% 28% 25% 22% 25% 30%
Overcrowding (bedroom standard)
Not overcrowded 433,744 1,066,338 890,491 684,613 865,485 1,029,421 719,458 1,329,584 932,549
100% 100% 99% 100% 99% 100% 98% 99% 99%
Overcrowded 3938 6500 649 8669 3756 17764 8014 5720
0% 1% 0% 1% 0% 2% 1% 1%
Bad housing (non-decent home or overcrowding)
Good housing 387,093 785,364 670,962 517,224 623,452 769,800 559,812 1,001,308 649,845
89% 73% 75% 75% 71% 75% 76% 75% 69%
Bad housing 46,651 284,912 226,029 168,038 250,702 263,377 177,410 336,290 288,424
11% 27% 25% 25% 29% 25% 24% 25% 31%
Weighted bases 433,744 1,070,276 896,991 685,262 874,154 1,033,177 737,222 1,337,598 938,269
Unweighted bases
368 910 786 543 607 760 529 945 736
Base: Individuals in England
Source: Survey of English Housing 2010
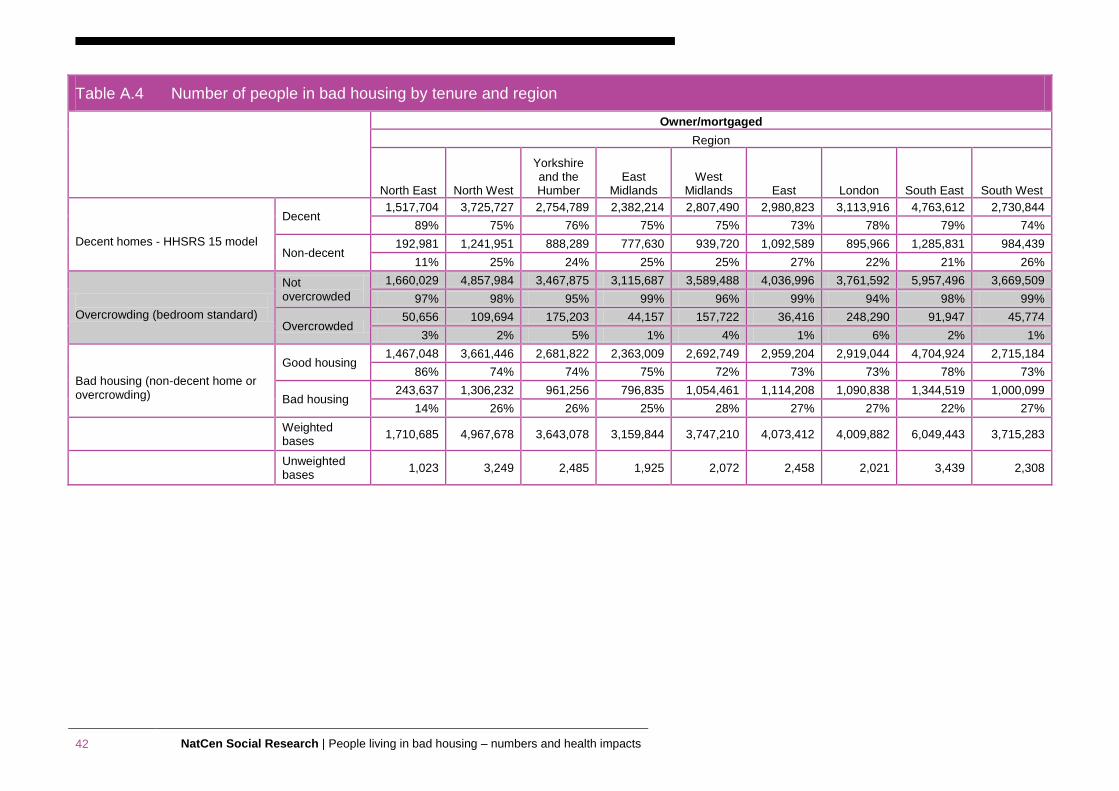
42 NatCen Social Research | People living in bad housing – numbers and health impacts
Table A.4 Number of people in bad housing by tenure and region
Owner/mortgaged
Region
North East North West
Yorkshire and the Humber
East Midlands
West Midlands East London South East South West
Decent homes - HHSRS 15 model
Decent 1,517,704 3,725,727 2,754,789 2,382,214 2,807,490 2,980,823 3,113,916 4,763,612 2,730,844
89% 75% 76% 75% 75% 73% 78% 79% 74%
Non-decent 192,981 1,241,951 888,289 777,630 939,720 1,092,589 895,966 1,285,831 984,439
11% 25% 24% 25% 25% 27% 22% 21% 26%
Overcrowding (bedroom standard)
Not overcrowded
1,660,029 4,857,984 3,467,875 3,115,687 3,589,488 4,036,996 3,761,592 5,957,496 3,669,509
97% 98% 95% 99% 96% 99% 94% 98% 99%
Overcrowded 50,656 109,694 175,203 44,157 157,722 36,416 248,290 91,947 45,774
3% 2% 5% 1% 4% 1% 6% 2% 1%
Bad housing (non-decent home or overcrowding)
Good housing 1,467,048 3,661,446 2,681,822 2,363,009 2,692,749 2,959,204 2,919,044 4,704,924 2,715,184
86% 74% 74% 75% 72% 73% 73% 78% 73%
Bad housing 243,637 1,306,232 961,256 796,835 1,054,461 1,114,208 1,090,838 1,344,519 1,000,099
14% 26% 26% 25% 28% 27% 27% 22% 27%
Weighted bases
1,710,685 4,967,678 3,643,078 3,159,844 3,747,210 4,073,412 4,009,882 6,049,443 3,715,283
Unweighted bases
1,023 3,249 2,485 1,925 2,072 2,458 2,021 3,439 2,308
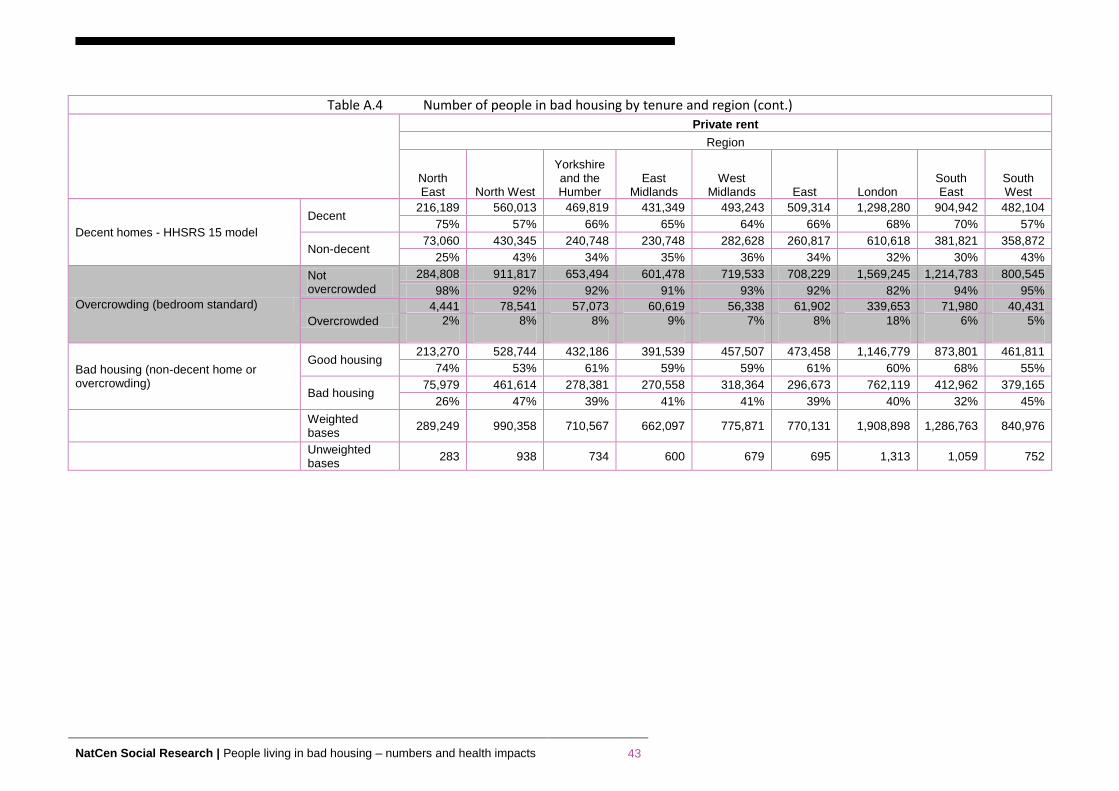
NatCen Social Research | People living in bad housing – numbers and health impacts 43
Table A.4 Number of people in bad housing by tenure and region (cont.)
Private rent
Region
North East North West
Yorkshire and the Humber
East Midlands
West Midlands East London
South East
South West
Decent homes - HHSRS 15 model
Decent 216,189 560,013 469,819 431,349 493,243 509,314 1,298,280 904,942 482,104
75% 57% 66% 65% 64% 66% 68% 70% 57%
Non-decent 73,060 430,345 240,748 230,748 282,628 260,817 610,618 381,821 358,872
25% 43% 34% 35% 36% 34% 32% 30% 43%
Overcrowding (bedroom standard)
Not overcrowded
284,808 911,817 653,494 601,478 719,533 708,229 1,569,245 1,214,783 800,545
98% 92% 92% 91% 93% 92% 82% 94% 95%
Overcrowded
4,441 78,541 57,073 60,619 56,338 61,902 339,653 71,980 40,431
2% 8% 8% 9% 7% 8% 18% 6% 5%
Bad housing (non-decent home or overcrowding)
Good housing 213,270 528,744 432,186 391,539 457,507 473,458 1,146,779 873,801 461,811
74% 53% 61% 59% 59% 61% 60% 68% 55%
Bad housing 75,979 461,614 278,381 270,558 318,364 296,673 762,119 412,962 379,165
26% 47% 39% 41% 41% 39% 40% 32% 45%
Weighted bases
289,249 990,358 710,567 662,097 775,871 770,131 1,908,898 1,286,763 840,976
Unweighted bases
283 938 734 600 679 695 1,313 1,059 752
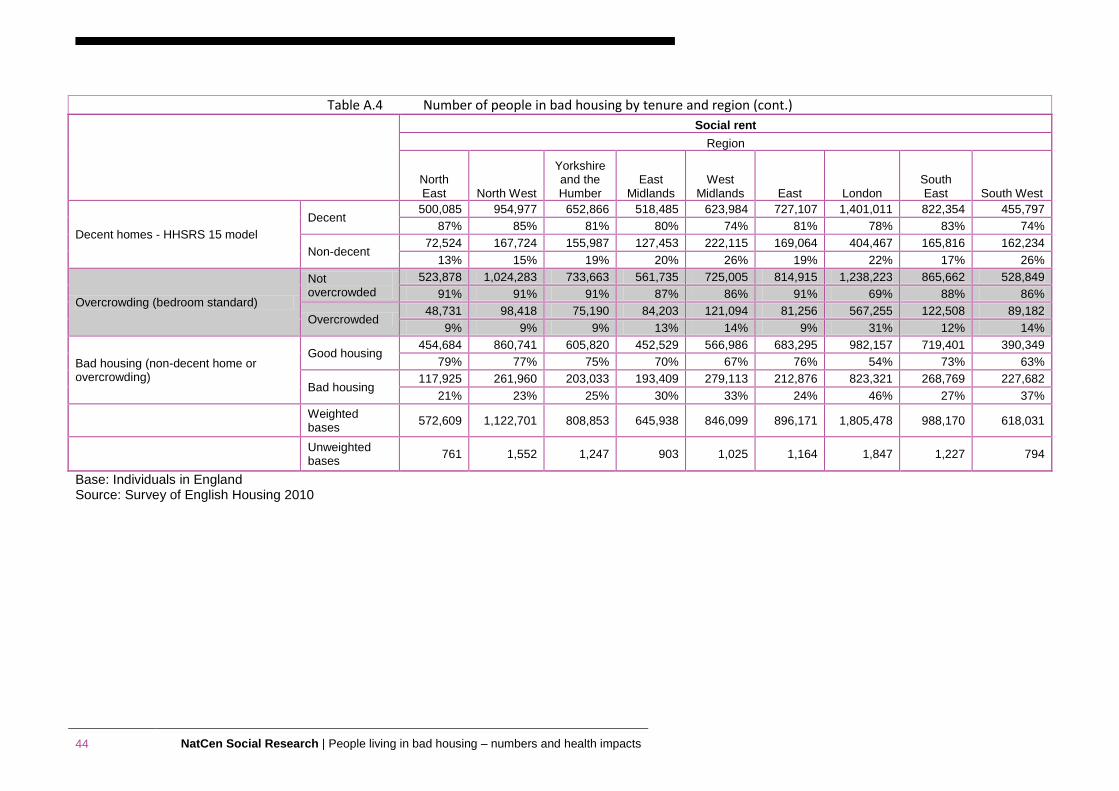
44 NatCen Social Research | People living in bad housing – numbers and health impacts
Table A.4 Number of people in bad housing by tenure and region (cont.)
Social rent
Region
North East North West
Yorkshire and the Humber
East Midlands
West Midlands East London
South East South West
Decent homes - HHSRS 15 model
Decent 500,085 954,977 652,866 518,485 623,984 727,107 1,401,011 822,354 455,797
87% 85% 81% 80% 74% 81% 78% 83% 74%
Non-decent 72,524 167,724 155,987 127,453 222,115 169,064 404,467 165,816 162,234
13% 15% 19% 20% 26% 19% 22% 17% 26%
Overcrowding (bedroom standard)
Not overcrowded
523,878 1,024,283 733,663 561,735 725,005 814,915 1,238,223 865,662 528,849
91% 91% 91% 87% 86% 91% 69% 88% 86%
Overcrowded 48,731 98,418 75,190 84,203 121,094 81,256 567,255 122,508 89,182
9% 9% 9% 13% 14% 9% 31% 12% 14%
Bad housing (non-decent home or overcrowding)
Good housing 454,684 860,741 605,820 452,529 566,986 683,295 982,157 719,401 390,349
79% 77% 75% 70% 67% 76% 54% 73% 63%
Bad housing 117,925 261,960 203,033 193,409 279,113 212,876 823,321 268,769 227,682
21% 23% 25% 30% 33% 24% 46% 27% 37%
Weighted bases
572,609 1,122,701 808,853 645,938 846,099 896,171 1,805,478 988,170 618,031
Unweighted bases
761 1,552 1,247 903 1,025 1,164 1,847 1,227 794
Base: Individuals in England Source: Survey of English Housing 2010
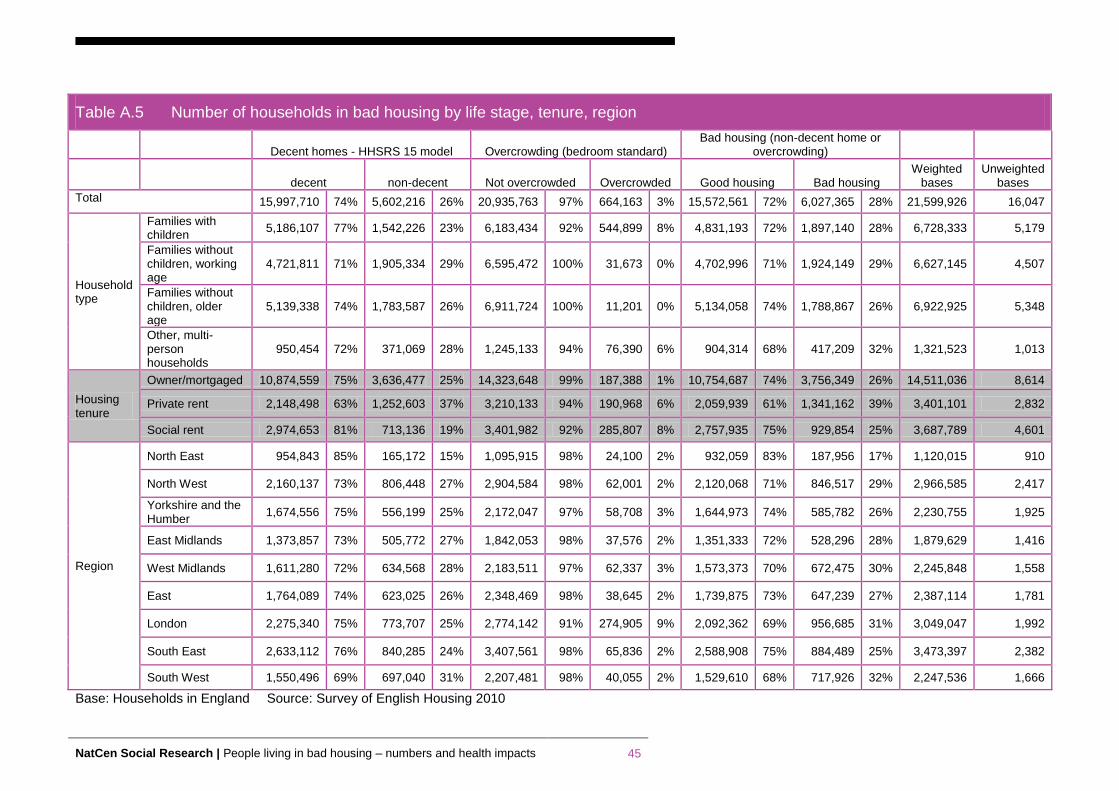
NatCen Social Research | People living in bad housing – numbers and health impacts 45
Table A.5 Number of households in bad housing by life stage, tenure, region
Decent homes - HHSRS 15 model Overcrowding (bedroom standard) Bad housing (non-decent home or
overcrowding)
decent non-decent Not overcrowded Overcrowded Good housing Bad housing
Weighted bases
Unweighted bases
Total 15,997,710 74% 5,602,216 26% 20,935,763 97% 664,163 3% 15,572,561 72% 6,027,365 28% 21,599,926 16,047
Household type
Families with children
5,186,107 77% 1,542,226 23% 6,183,434 92% 544,899 8% 4,831,193 72% 1,897,140 28% 6,728,333 5,179
Families without children, working age
4,721,811 71% 1,905,334 29% 6,595,472 100% 31,673 0% 4,702,996 71% 1,924,149 29% 6,627,145 4,507
Families without children, older age
5,139,338 74% 1,783,587 26% 6,911,724 100% 11,201 0% 5,134,058 74% 1,788,867 26% 6,922,925 5,348
Other, multi-person households
950,454 72% 371,069 28% 1,245,133 94% 76,390 6% 904,314 68% 417,209 32% 1,321,523 1,013
Housing tenure
Owner/mortgaged 10,874,559 75% 3,636,477 25% 14,323,648 99% 187,388 1% 10,754,687 74% 3,756,349 26% 14,511,036 8,614
Private rent 2,148,498 63% 1,252,603 37% 3,210,133 94% 190,968 6% 2,059,939 61% 1,341,162 39% 3,401,101 2,832
Social rent 2,974,653 81% 713,136 19% 3,401,982 92% 285,807 8% 2,757,935 75% 929,854 25% 3,687,789 4,601
Region
North East 954,843 85% 165,172 15% 1,095,915 98% 24,100 2% 932,059 83% 187,956 17% 1,120,015 910
North West 2,160,137 73% 806,448 27% 2,904,584 98% 62,001 2% 2,120,068 71% 846,517 29% 2,966,585 2,417
Yorkshire and the Humber
1,674,556 75% 556,199 25% 2,172,047 97% 58,708 3% 1,644,973 74% 585,782 26% 2,230,755 1,925
East Midlands 1,373,857 73% 505,772 27% 1,842,053 98% 37,576 2% 1,351,333 72% 528,296 28% 1,879,629 1,416
West Midlands 1,611,280 72% 634,568 28% 2,183,511 97% 62,337 3% 1,573,373 70% 672,475 30% 2,245,848 1,558
East 1,764,089 74% 623,025 26% 2,348,469 98% 38,645 2% 1,739,875 73% 647,239 27% 2,387,114 1,781
London 2,275,340 75% 773,707 25% 2,774,142 91% 274,905 9% 2,092,362 69% 956,685 31% 3,049,047 1,992
South East 2,633,112 76% 840,285 24% 3,407,561 98% 65,836 2% 2,588,908 75% 884,489 25% 3,473,397 2,382
South West 1,550,496 69% 697,040 31% 2,207,481 98% 40,055 2% 1,529,610 68% 717,926 32% 2,247,536 1,666
Base: Households in England Source: Survey of English Housing 2010
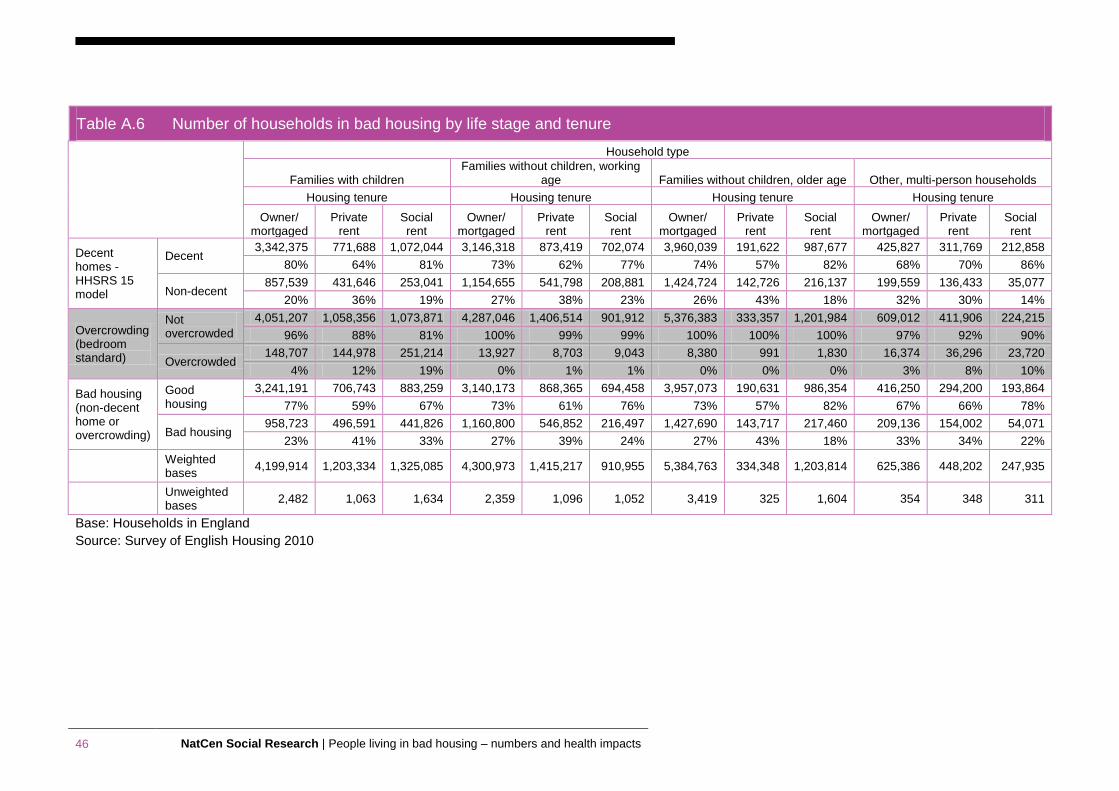
46 NatCen Social Research | People living in bad housing – numbers and health impacts
Base: Households in England
Source: Survey of English Housing 2010
Table A.6 Number of households in bad housing by life stage and tenure
Household type
Families with children Families without children, working
age Families without children, older age Other, multi-person households
Housing tenure Housing tenure Housing tenure Housing tenure
Owner/ mortgaged
Private rent
Social rent
Owner/ mortgaged
Private rent
Social rent
Owner/ mortgaged
Private rent
Social rent
Owner/ mortgaged
Private rent
Social rent
Decent homes - HHSRS 15 model
Decent 3,342,375 771,688 1,072,044 3,146,318 873,419 702,074 3,960,039 191,622 987,677 425,827 311,769 212,858
80% 64% 81% 73% 62% 77% 74% 57% 82% 68% 70% 86%
Non-decent 857,539 431,646 253,041 1,154,655 541,798 208,881 1,424,724 142,726 216,137 199,559 136,433 35,077
20% 36% 19% 27% 38% 23% 26% 43% 18% 32% 30% 14%
Overcrowding (bedroom standard)
Not overcrowded
4,051,207 1,058,356 1,073,871 4,287,046 1,406,514 901,912 5,376,383 333,357 1,201,984 609,012 411,906 224,215
96% 88% 81% 100% 99% 99% 100% 100% 100% 97% 92% 90%
Overcrowded 148,707 144,978 251,214 13,927 8,703 9,043 8,380 991 1,830 16,374 36,296 23,720
4% 12% 19% 0% 1% 1% 0% 0% 0% 3% 8% 10%
Bad housing (non-decent home or overcrowding)
Good housing
3,241,191 706,743 883,259 3,140,173 868,365 694,458 3,957,073 190,631 986,354 416,250 294,200 193,864
77% 59% 67% 73% 61% 76% 73% 57% 82% 67% 66% 78%
Bad housing 958,723 496,591 441,826 1,160,800 546,852 216,497 1,427,690 143,717 217,460 209,136 154,002 54,071
23% 41% 33% 27% 39% 24% 27% 43% 18% 33% 34% 22%
Weighted bases
4,199,914 1,203,334 1,325,085 4,300,973 1,415,217 910,955 5,384,763 334,348 1,203,814 625,386 448,202 247,935
Unweighted bases
2,482 1,063 1,634 2,359 1,096 1,052 3,419 325 1,604 354 348 311
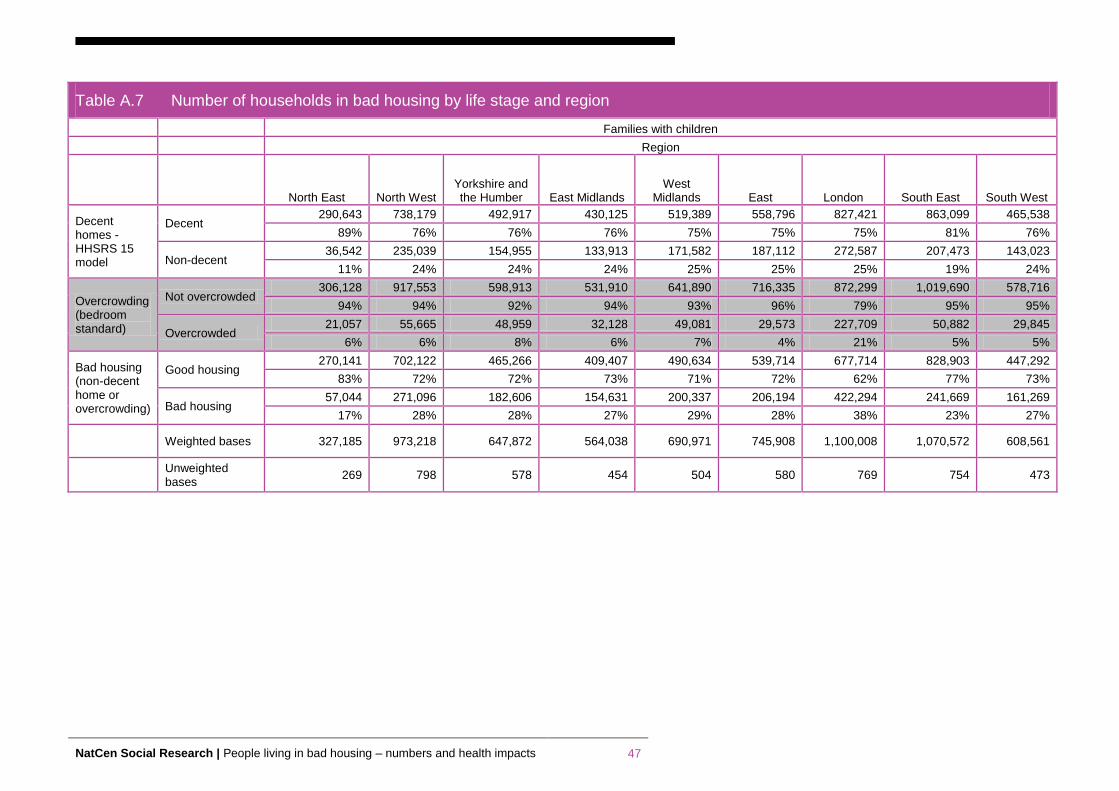
NatCen Social Research | People living in bad housing – numbers and health impacts 47
Table A.7 Number of households in bad housing by life stage and region
Families with children
Region
North East North West Yorkshire and the Humber East Midlands
West Midlands East London South East South West
Decent homes - HHSRS 15 model
Decent 290,643 738,179 492,917 430,125 519,389 558,796 827,421 863,099 465,538
89% 76% 76% 76% 75% 75% 75% 81% 76%
Non-decent 36,542 235,039 154,955 133,913 171,582 187,112 272,587 207,473 143,023
11% 24% 24% 24% 25% 25% 25% 19% 24%
Overcrowding (bedroom standard)
Not overcrowded 306,128 917,553 598,913 531,910 641,890 716,335 872,299 1,019,690 578,716
94% 94% 92% 94% 93% 96% 79% 95% 95%
Overcrowded 21,057 55,665 48,959 32,128 49,081 29,573 227,709 50,882 29,845
6% 6% 8% 6% 7% 4% 21% 5% 5%
Bad housing (non-decent home or overcrowding)
Good housing 270,141 702,122 465,266 409,407 490,634 539,714 677,714 828,903 447,292
83% 72% 72% 73% 71% 72% 62% 77% 73%
Bad housing 57,044 271,096 182,606 154,631 200,337 206,194 422,294 241,669 161,269
17% 28% 28% 27% 29% 28% 38% 23% 27%
Weighted bases 327,185 973,218 647,872 564,038 690,971 745,908 1,100,008 1,070,572 608,561
Unweighted bases
269 798 578 454 504 580 769 754 473
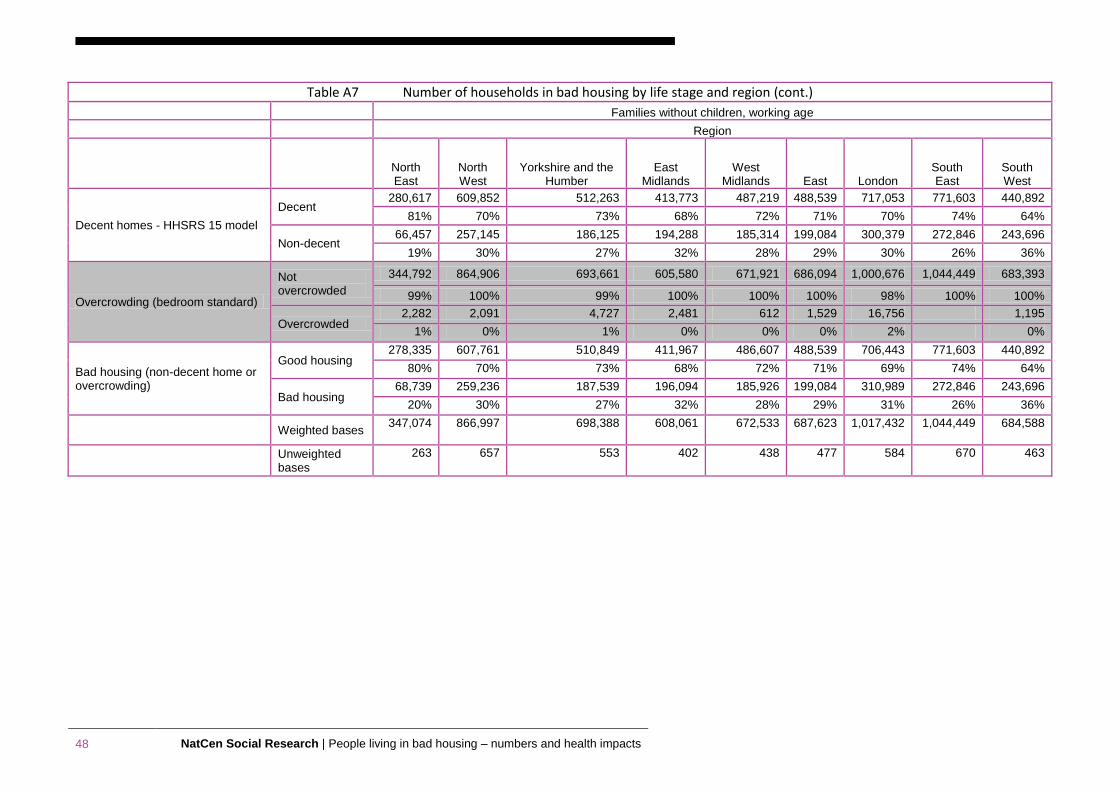
48 NatCen Social Research | People living in bad housing – numbers and health impacts
Table A7 Number of households in bad housing by life stage and region (cont.) Families without children, working age
Region
North East
North West
Yorkshire and the Humber
East Midlands
West Midlands East London
South East
South West
Decent homes - HHSRS 15 model
Decent 280,617 609,852 512,263 413,773 487,219 488,539 717,053 771,603 440,892
81% 70% 73% 68% 72% 71% 70% 74% 64%
Non-decent 66,457 257,145 186,125 194,288 185,314 199,084 300,379 272,846 243,696
19% 30% 27% 32% 28% 29% 30% 26% 36%
Overcrowding (bedroom standard)
Not overcrowded
344,792 864,906 693,661 605,580 671,921 686,094 1,000,676 1,044,449 683,393
99% 100% 99% 100% 100% 100% 98% 100% 100%
Overcrowded 2,282 2,091 4,727 2,481 612 1,529 16,756 1,195
1% 0% 1% 0% 0% 0% 2% 0%
Bad housing (non-decent home or overcrowding)
Good housing 278,335 607,761 510,849 411,967 486,607 488,539 706,443 771,603 440,892
80% 70% 73% 68% 72% 71% 69% 74% 64%
Bad housing 68,739 259,236 187,539 196,094 185,926 199,084 310,989 272,846 243,696
20% 30% 27% 32% 28% 29% 31% 26% 36%
Weighted bases 347,074 866,997 698,388 608,061 672,533 687,623 1,017,432 1,044,449 684,588
Unweighted bases
263 657 553 402 438 477 584 670 463
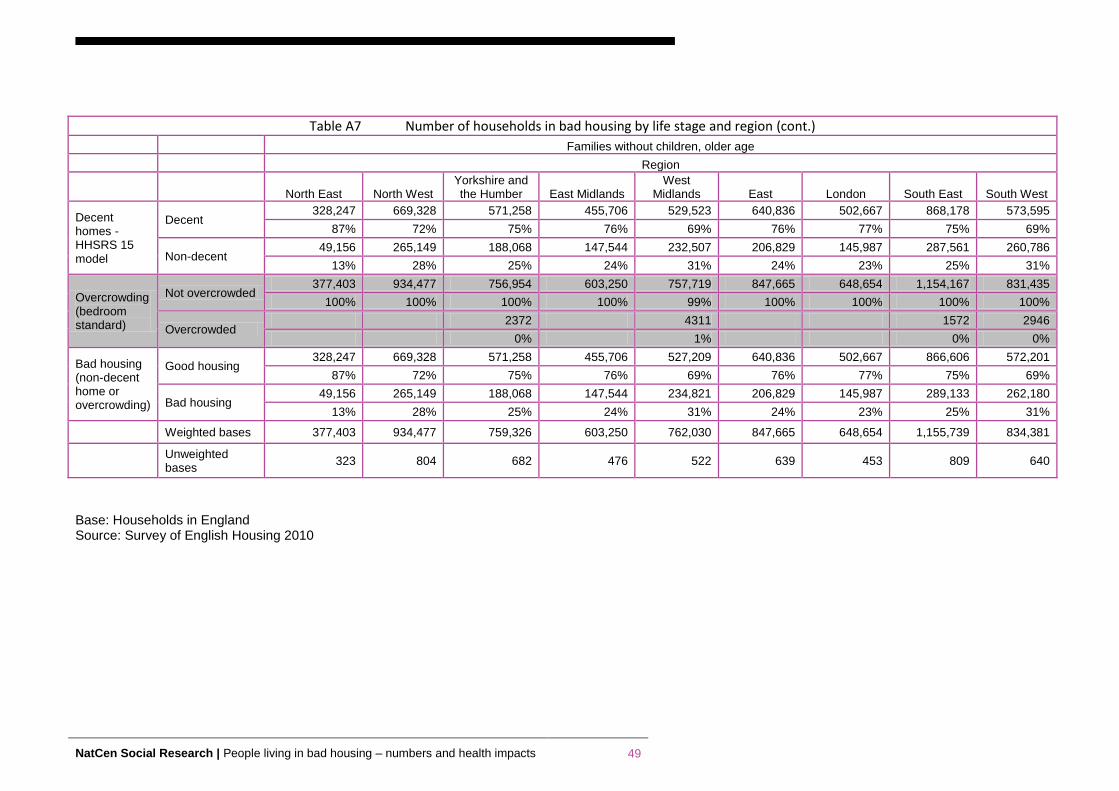
NatCen Social Research | People living in bad housing – numbers and health impacts 49
Base: Households in England Source: Survey of English Housing 2010
Table A7 Number of households in bad housing by life stage and region (cont.) Families without children, older age
Region
North East North West Yorkshire and the Humber East Midlands
West Midlands East London South East South West
Decent homes - HHSRS 15 model
Decent 328,247 669,328 571,258 455,706 529,523 640,836 502,667 868,178 573,595
87% 72% 75% 76% 69% 76% 77% 75% 69%
Non-decent 49,156 265,149 188,068 147,544 232,507 206,829 145,987 287,561 260,786
13% 28% 25% 24% 31% 24% 23% 25% 31%
Overcrowding (bedroom standard)
Not overcrowded 377,403 934,477 756,954 603,250 757,719 847,665 648,654 1,154,167 831,435
100% 100% 100% 100% 99% 100% 100% 100% 100%
Overcrowded 2372 4311 1572 2946
0% 1% 0% 0%
Bad housing (non-decent home or overcrowding)
Good housing 328,247 669,328 571,258 455,706 527,209 640,836 502,667 866,606 572,201
87% 72% 75% 76% 69% 76% 77% 75% 69%
Bad housing 49,156 265,149 188,068 147,544 234,821 206,829 145,987 289,133 262,180
13% 28% 25% 24% 31% 24% 23% 25% 31%
Weighted bases 377,403 934,477 759,326 603,250 762,030 847,665 648,654 1,155,739 834,381
Unweighted bases
323 804 682 476 522 639 453 809 640
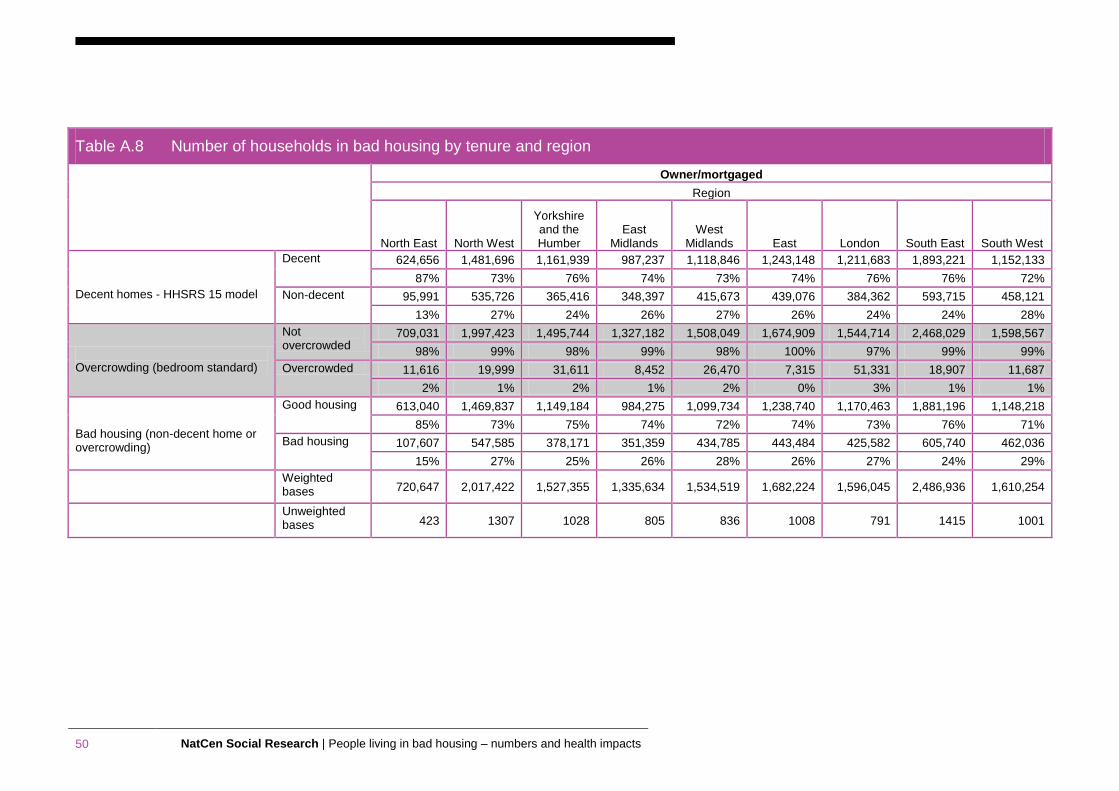
50 NatCen Social Research | People living in bad housing – numbers and health impacts
Table A.8 Number of households in bad housing by tenure and region
Owner/mortgaged
Region
North East North West
Yorkshire and the Humber
East Midlands
West Midlands East London South East South West
Decent homes - HHSRS 15 model
Decent 624,656 1,481,696 1,161,939 987,237 1,118,846 1,243,148 1,211,683 1,893,221 1,152,133
87% 73% 76% 74% 73% 74% 76% 76% 72%
Non-decent 95,991 535,726 365,416 348,397 415,673 439,076 384,362 593,715 458,121
13% 27% 24% 26% 27% 26% 24% 24% 28%
Overcrowding (bedroom standard)
Not overcrowded
709,031 1,997,423 1,495,744 1,327,182 1,508,049 1,674,909 1,544,714 2,468,029 1,598,567
98% 99% 98% 99% 98% 100% 97% 99% 99%
Overcrowded 11,616 19,999 31,611 8,452 26,470 7,315 51,331 18,907 11,687
2% 1% 2% 1% 2% 0% 3% 1% 1%
Bad housing (non-decent home or overcrowding)
Good housing 613,040 1,469,837 1,149,184 984,275 1,099,734 1,238,740 1,170,463 1,881,196 1,148,218
85% 73% 75% 74% 72% 74% 73% 76% 71%
Bad housing 107,607 547,585 378,171 351,359 434,785 443,484 425,582 605,740 462,036
15% 27% 25% 26% 28% 26% 27% 24% 29%
Weighted bases 720,647 2,017,422 1,527,355 1,335,634 1,534,519 1,682,224 1,596,045 2,486,936 1,610,254
Unweighted bases 423 1307 1028 805 836 1008 791 1415 1001
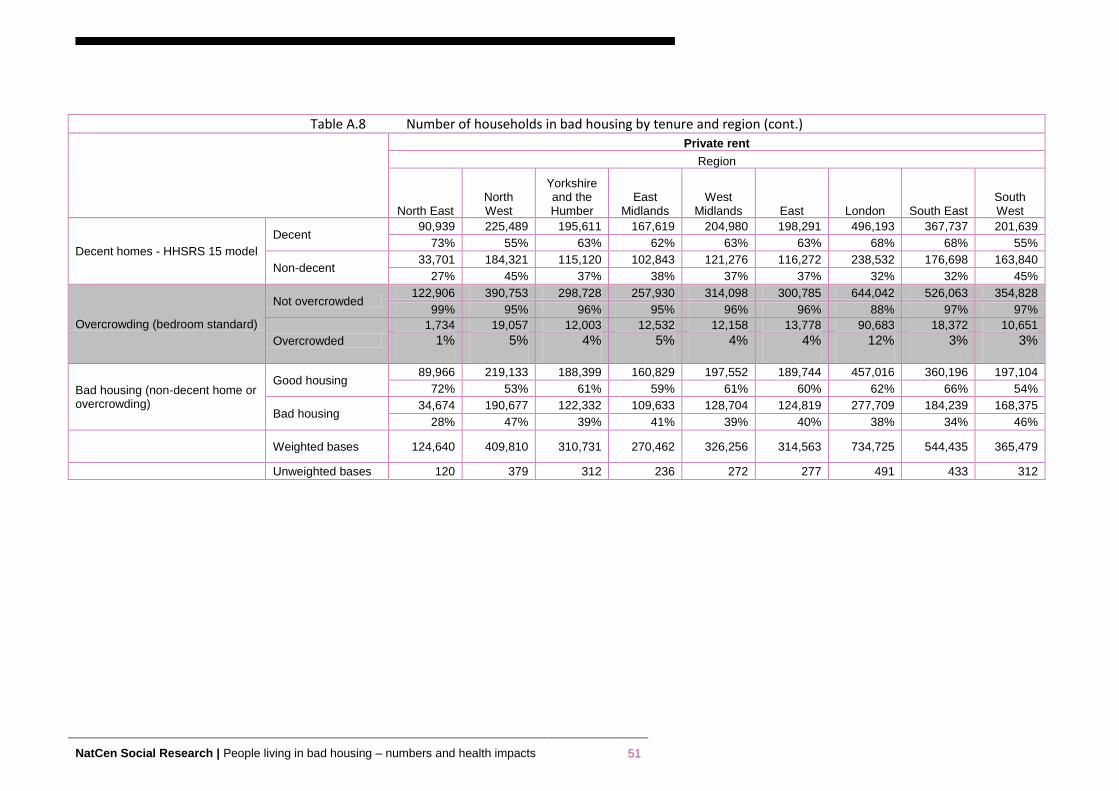
NatCen Social Research | People living in bad housing – numbers and health impacts 51
Table A.8 Number of households in bad housing by tenure and region (cont.)
Private rent
Region
North East North West
Yorkshire and the Humber
East Midlands
West Midlands East London South East
South West
Decent homes - HHSRS 15 model
Decent 90,939 225,489 195,611 167,619 204,980 198,291 496,193 367,737 201,639
73% 55% 63% 62% 63% 63% 68% 68% 55%
Non-decent 33,701 184,321 115,120 102,843 121,276 116,272 238,532 176,698 163,840
27% 45% 37% 38% 37% 37% 32% 32% 45%
Overcrowding (bedroom standard)
Not overcrowded 122,906 390,753 298,728 257,930 314,098 300,785 644,042 526,063 354,828
99% 95% 96% 95% 96% 96% 88% 97% 97%
Overcrowded
1,734 19,057 12,003 12,532 12,158 13,778 90,683 18,372 10,651
1% 5% 4% 5% 4% 4% 12% 3% 3%
Bad housing (non-decent home or overcrowding)
Good housing 89,966 219,133 188,399 160,829 197,552 189,744 457,016 360,196 197,104
72% 53% 61% 59% 61% 60% 62% 66% 54%
Bad housing 34,674 190,677 122,332 109,633 128,704 124,819 277,709 184,239 168,375
28% 47% 39% 41% 39% 40% 38% 34% 46%
Weighted bases 124,640 409,810 310,731 270,462 326,256 314,563 734,725 544,435 365,479
Unweighted bases 120 379 312 236 272 277 491 433 312
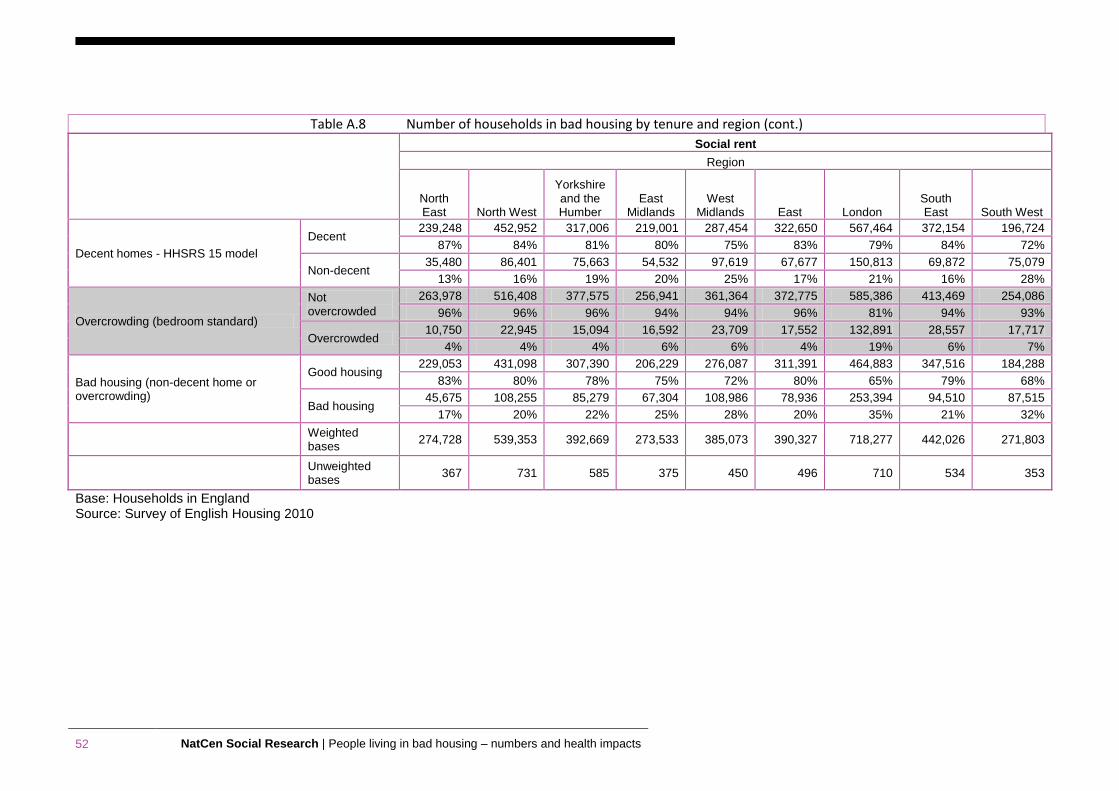
52 NatCen Social Research | People living in bad housing – numbers and health impacts
Table A.8 Number of households in bad housing by tenure and region (cont.)
Social rent
Region
North East North West
Yorkshire and the Humber
East Midlands
West Midlands East London
South East South West
Decent homes - HHSRS 15 model
Decent 239,248 452,952 317,006 219,001 287,454 322,650 567,464 372,154 196,724
87% 84% 81% 80% 75% 83% 79% 84% 72%
Non-decent 35,480 86,401 75,663 54,532 97,619 67,677 150,813 69,872 75,079
13% 16% 19% 20% 25% 17% 21% 16% 28%
Overcrowding (bedroom standard)
Not overcrowded
263,978 516,408 377,575 256,941 361,364 372,775 585,386 413,469 254,086
96% 96% 96% 94% 94% 96% 81% 94% 93%
Overcrowded 10,750 22,945 15,094 16,592 23,709 17,552 132,891 28,557 17,717
4% 4% 4% 6% 6% 4% 19% 6% 7%
Bad housing (non-decent home or overcrowding)
Good housing 229,053 431,098 307,390 206,229 276,087 311,391 464,883 347,516 184,288
83% 80% 78% 75% 72% 80% 65% 79% 68%
Bad housing 45,675 108,255 85,279 67,304 108,986 78,936 253,394 94,510 87,515
17% 20% 22% 25% 28% 20% 35% 21% 32%
Weighted bases
274,728 539,353 392,669 273,533 385,073 390,327 718,277 442,026 271,803
Unweighted bases
367 731 585 375 450 496 710 534 353
Base: Households in England Source: Survey of English Housing 2010
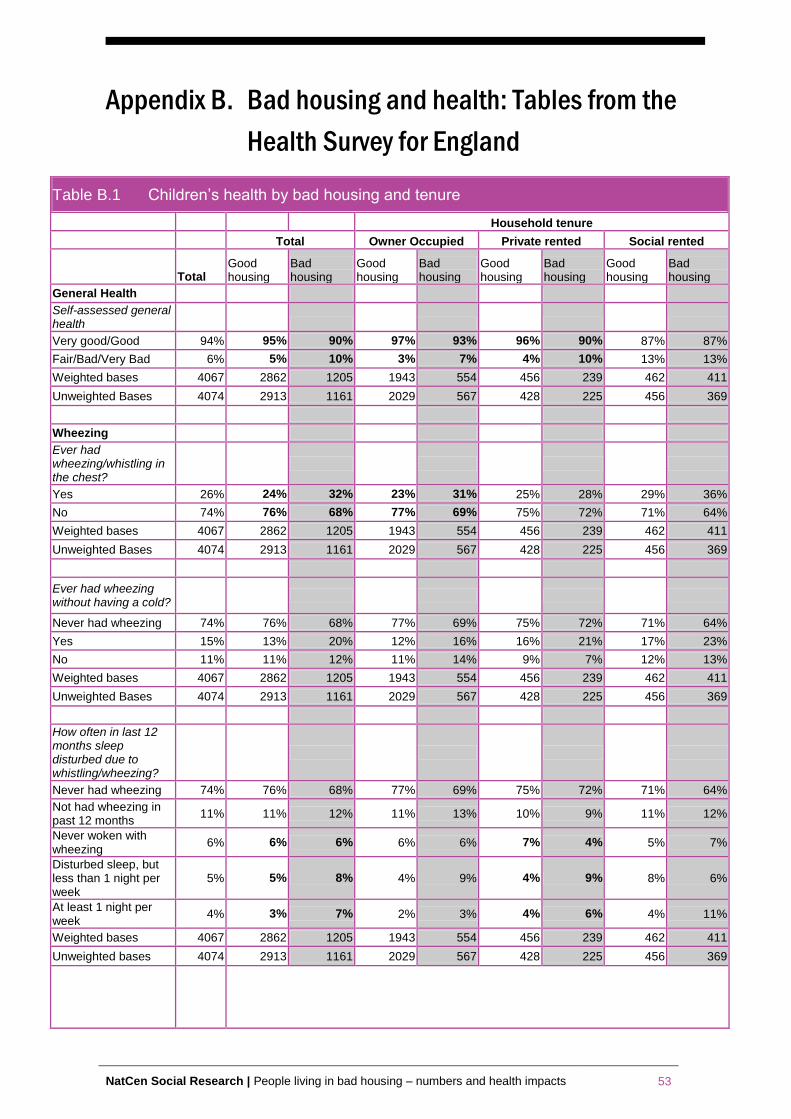
NatCen Social Research | People living in bad housing – numbers and health impacts 53
Appendix B. Bad housing and health: Tables from the
Health Survey for England
Table B.1 Children’s health by bad housing and tenure
Household tenure
Total Owner Occupied Private rented Social rented
Total Good housing
Bad housing
Good housing
Bad housing
Good housing
Bad housing
Good housing
Bad housing
General Health
Self-assessed general health
Very good/Good 94% 95% 90% 97% 93% 96% 90% 87% 87%
Fair/Bad/Very Bad 6% 5% 10% 3% 7% 4% 10% 13% 13%
Weighted bases 4067 2862 1205 1943 554 456 239 462 411
Unweighted Bases 4074 2913 1161 2029 567 428 225 456 369
Wheezing
Ever had wheezing/whistling in the chest?
Yes 26% 24% 32% 23% 31% 25% 28% 29% 36%
No 74% 76% 68% 77% 69% 75% 72% 71% 64%
Weighted bases 4067 2862 1205 1943 554 456 239 462 411
Unweighted Bases 4074 2913 1161 2029 567 428 225 456 369
Ever had wheezing without having a cold?
Never had wheezing 74% 76% 68% 77% 69% 75% 72% 71% 64%
Yes 15% 13% 20% 12% 16% 16% 21% 17% 23%
No 11% 11% 12% 11% 14% 9% 7% 12% 13%
Weighted bases 4067 2862 1205 1943 554 456 239 462 411
Unweighted Bases 4074 2913 1161 2029 567 428 225 456 369
How often in last 12 months sleep disturbed due to whistling/wheezing?
Never had wheezing 74% 76% 68% 77% 69% 75% 72% 71% 64%
Not had wheezing in past 12 months
11% 11% 12% 11% 13% 10% 9% 11% 12%
Never woken with wheezing
6% 6% 6% 6% 6% 7% 4% 5% 7%
Disturbed sleep, but less than 1 night per week
5% 5% 8% 4% 9% 4% 9% 8% 6%
At least 1 night per week
4% 3% 7% 2% 3% 4% 6% 4% 11%
Weighted bases 4067 2862 1205 1943 554 456 239 462 411
Unweighted bases 4074 2913 1161 2029 567 428 225 456 369
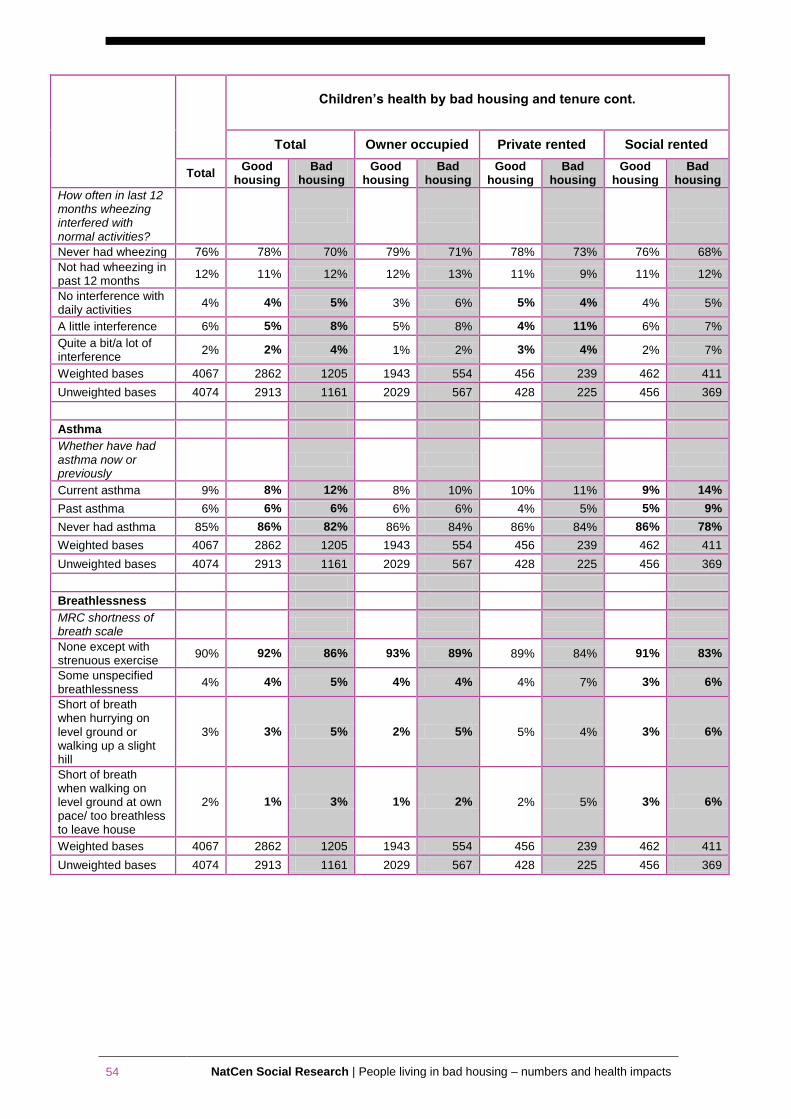
54 NatCen Social Research | People living in bad housing – numbers and health impacts
Children’s health by bad housing and tenure cont.
Total Owner occupied Private rented Social rented
Total Good
housing Bad
housing Good
housing Bad
housing Good
housing Bad
housing Good
housing Bad
housing
How often in last 12 months wheezing interfered with normal activities?
Never had wheezing 76% 78% 70% 79% 71% 78% 73% 76% 68%
Not had wheezing in past 12 months
12% 11% 12% 12% 13% 11% 9% 11% 12%
No interference with daily activities
4% 4% 5% 3% 6% 5% 4% 4% 5%
A little interference 6% 5% 8% 5% 8% 4% 11% 6% 7%
Quite a bit/a lot of interference
2% 2% 4% 1% 2% 3% 4% 2% 7%
Weighted bases 4067 2862 1205 1943 554 456 239 462 411
Unweighted bases 4074 2913 1161 2029 567 428 225 456 369
Asthma
Whether have had asthma now or previously
Current asthma 9% 8% 12% 8% 10% 10% 11% 9% 14%
Past asthma 6% 6% 6% 6% 6% 4% 5% 5% 9%
Never had asthma 85% 86% 82% 86% 84% 86% 84% 86% 78%
Weighted bases 4067 2862 1205 1943 554 456 239 462 411
Unweighted bases 4074 2913 1161 2029 567 428 225 456 369
Breathlessness
MRC shortness of breath scale
None except with strenuous exercise
90% 92% 86% 93% 89% 89% 84% 91% 83%
Some unspecified breathlessness
4% 4% 5% 4% 4% 4% 7% 3% 6%
Short of breath when hurrying on level ground or walking up a slight hill
3% 3% 5% 2% 5% 5% 4% 3% 6%
Short of breath when walking on level ground at own pace/ too breathless to leave house
2% 1% 3% 1% 2% 2% 5% 3% 6%
Weighted bases 4067 2862 1205 1943 554 456 239 462 411
Unweighted bases 4074 2913 1161 2029 567 428 225 456 369
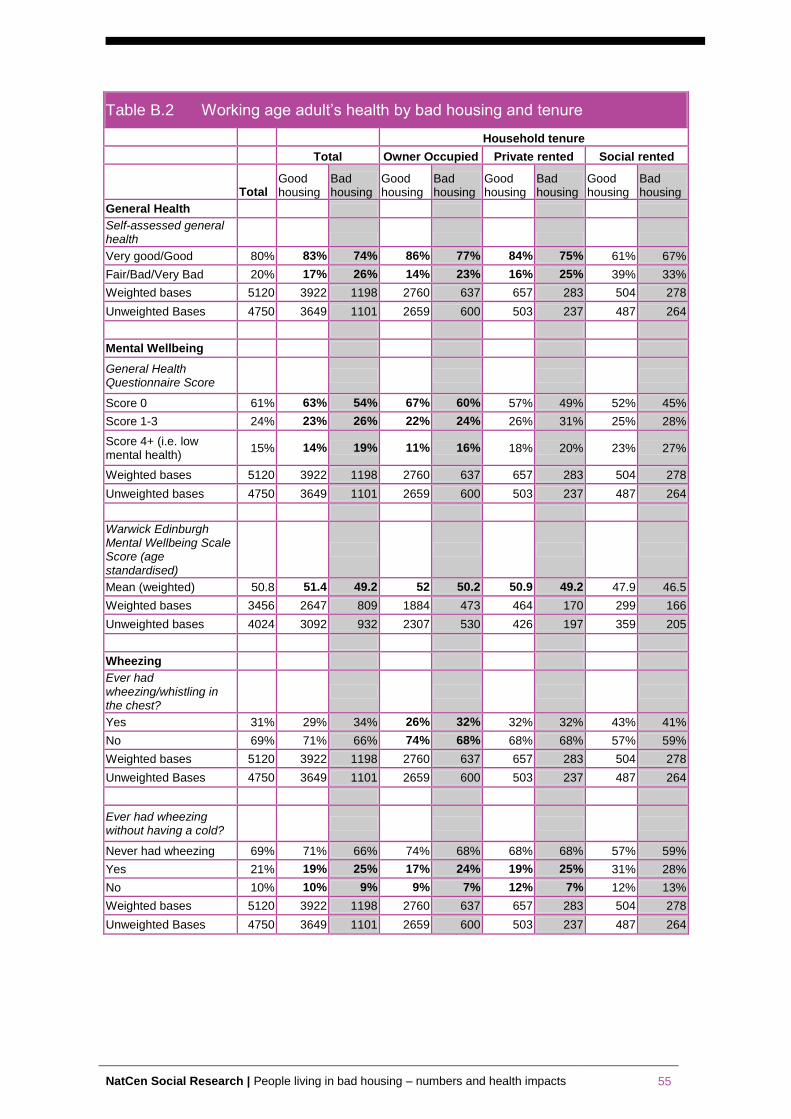
NatCen Social Research | People living in bad housing – numbers and health impacts 55
Table B.2 Working age adult’s health by bad housing and tenure
Household tenure
Total Owner Occupied Private rented Social rented
Total Good housing
Bad housing
Good housing
Bad housing
Good housing
Bad housing
Good housing
Bad housing
General Health
Self-assessed general health
Very good/Good 80% 83% 74% 86% 77% 84% 75% 61% 67%
Fair/Bad/Very Bad 20% 17% 26% 14% 23% 16% 25% 39% 33%
Weighted bases 5120 3922 1198 2760 637 657 283 504 278
Unweighted Bases 4750 3649 1101 2659 600 503 237 487 264
Mental Wellbeing
General Health Questionnaire Score
Score 0 61% 63% 54% 67% 60% 57% 49% 52% 45%
Score 1-3 24% 23% 26% 22% 24% 26% 31% 25% 28%
Score 4+ (i.e. low mental health)
15% 14% 19% 11% 16% 18% 20% 23% 27%
Weighted bases 5120 3922 1198 2760 637 657 283 504 278
Unweighted bases 4750 3649 1101 2659 600 503 237 487 264
Warwick Edinburgh Mental Wellbeing Scale Score (age standardised)
Mean (weighted) 50.8 51.4 49.2 52 50.2 50.9 49.2 47.9 46.5
Weighted bases 3456 2647 809 1884 473 464 170 299 166
Unweighted bases 4024 3092 932 2307 530 426 197 359 205
Wheezing
Ever had wheezing/whistling in the chest?
Yes 31% 29% 34% 26% 32% 32% 32% 43% 41%
No 69% 71% 66% 74% 68% 68% 68% 57% 59%
Weighted bases 5120 3922 1198 2760 637 657 283 504 278
Unweighted Bases 4750 3649 1101 2659 600 503 237 487 264
Ever had wheezing without having a cold?
Never had wheezing 69% 71% 66% 74% 68% 68% 68% 57% 59%
Yes 21% 19% 25% 17% 24% 19% 25% 31% 28%
No 10% 10% 9% 9% 7% 12% 7% 12% 13%
Weighted bases 5120 3922 1198 2760 637 657 283 504 278
Unweighted Bases 4750 3649 1101 2659 600 503 237 487 264
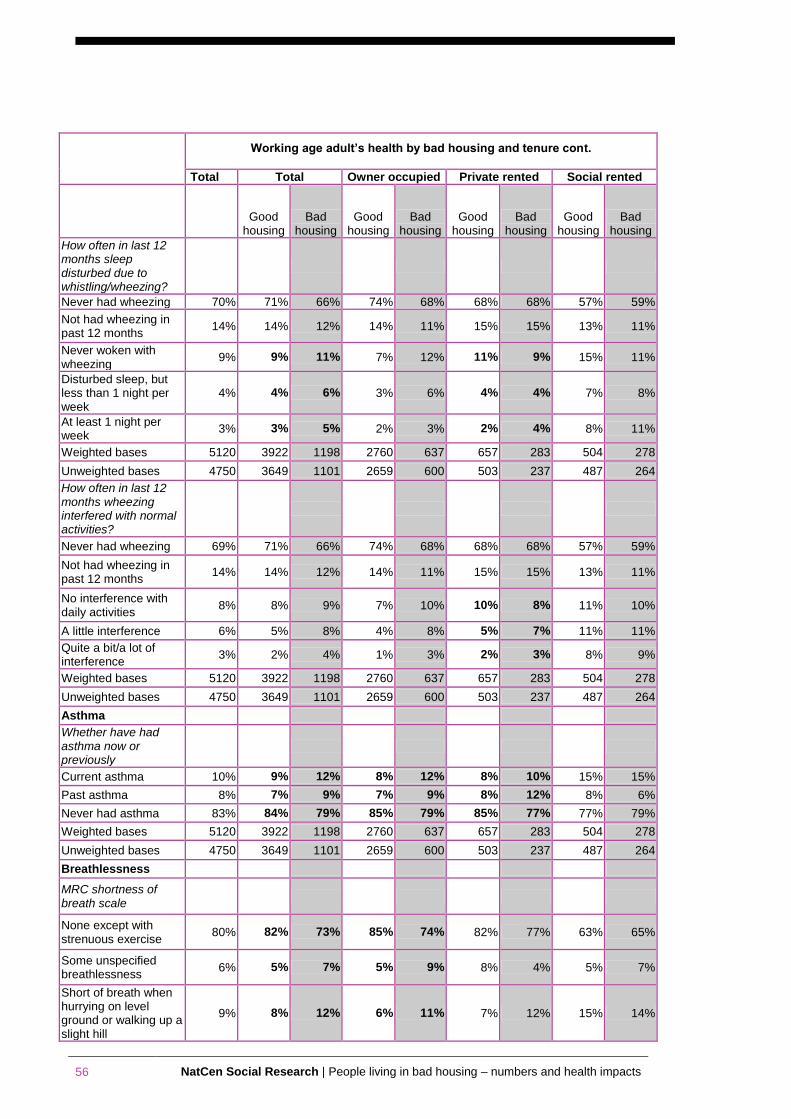
56 NatCen Social Research | People living in bad housing – numbers and health impacts
Working age adult’s health by bad housing and tenure cont.
Total Total Owner occupied Private rented Social rented
Good
housing Bad
housing Good
housing Bad
housing Good
housing Bad
housing Good
housing Bad
housing
How often in last 12 months sleep disturbed due to whistling/wheezing?
Never had wheezing 70% 71% 66% 74% 68% 68% 68% 57% 59%
Not had wheezing in past 12 months
14% 14% 12% 14% 11% 15% 15% 13% 11%
Never woken with wheezing
9% 9% 11% 7% 12% 11% 9% 15% 11%
Disturbed sleep, but less than 1 night per week
4% 4% 6% 3% 6% 4% 4% 7% 8%
At least 1 night per week
3% 3% 5% 2% 3% 2% 4% 8% 11%
Weighted bases 5120 3922 1198 2760 637 657 283 504 278
Unweighted bases 4750 3649 1101 2659 600 503 237 487 264
How often in last 12 months wheezing interfered with normal activities?
Never had wheezing 69% 71% 66% 74% 68% 68% 68% 57% 59%
Not had wheezing in past 12 months
14% 14% 12% 14% 11% 15% 15% 13% 11%
No interference with daily activities
8% 8% 9% 7% 10% 10% 8% 11% 10%
A little interference 6% 5% 8% 4% 8% 5% 7% 11% 11%
Quite a bit/a lot of interference
3% 2% 4% 1% 3% 2% 3% 8% 9%
Weighted bases 5120 3922 1198 2760 637 657 283 504 278
Unweighted bases 4750 3649 1101 2659 600 503 237 487 264
Asthma
Whether have had asthma now or previously
Current asthma 10% 9% 12% 8% 12% 8% 10% 15% 15%
Past asthma 8% 7% 9% 7% 9% 8% 12% 8% 6%
Never had asthma 83% 84% 79% 85% 79% 85% 77% 77% 79%
Weighted bases 5120 3922 1198 2760 637 657 283 504 278
Unweighted bases 4750 3649 1101 2659 600 503 237 487 264
Breathlessness
MRC shortness of breath scale
None except with strenuous exercise
80% 82% 73% 85% 74% 82% 77% 63% 65%
Some unspecified breathlessness
6% 5% 7% 5% 9% 8% 4% 5% 7%
Short of breath when hurrying on level ground or walking up a slight hill
9% 8% 12% 6% 11% 7% 12% 15% 14%
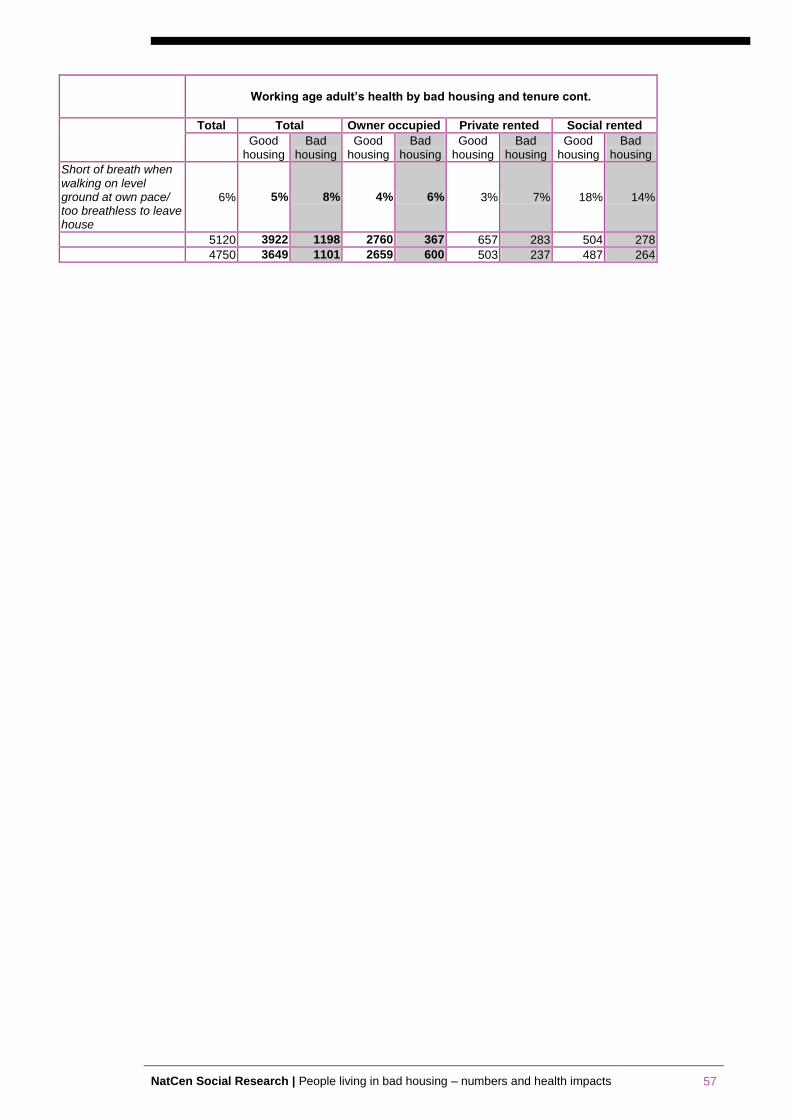
NatCen Social Research | People living in bad housing – numbers and health impacts 57
Working age adult’s health by bad housing and tenure cont.
Total Total Owner occupied Private rented Social rented
Good
housing Bad
housing Good
housing Bad
housing Good
housing Bad
housing Good
housing Bad
housing
Short of breath when walking on level ground at own pace/ too breathless to leave house
6% 5% 8% 4% 6% 3% 7% 18% 14%
5120 3922 1198 2760 367 657 283 504 278
4750 3649 1101 2659 600 503 237 487 264
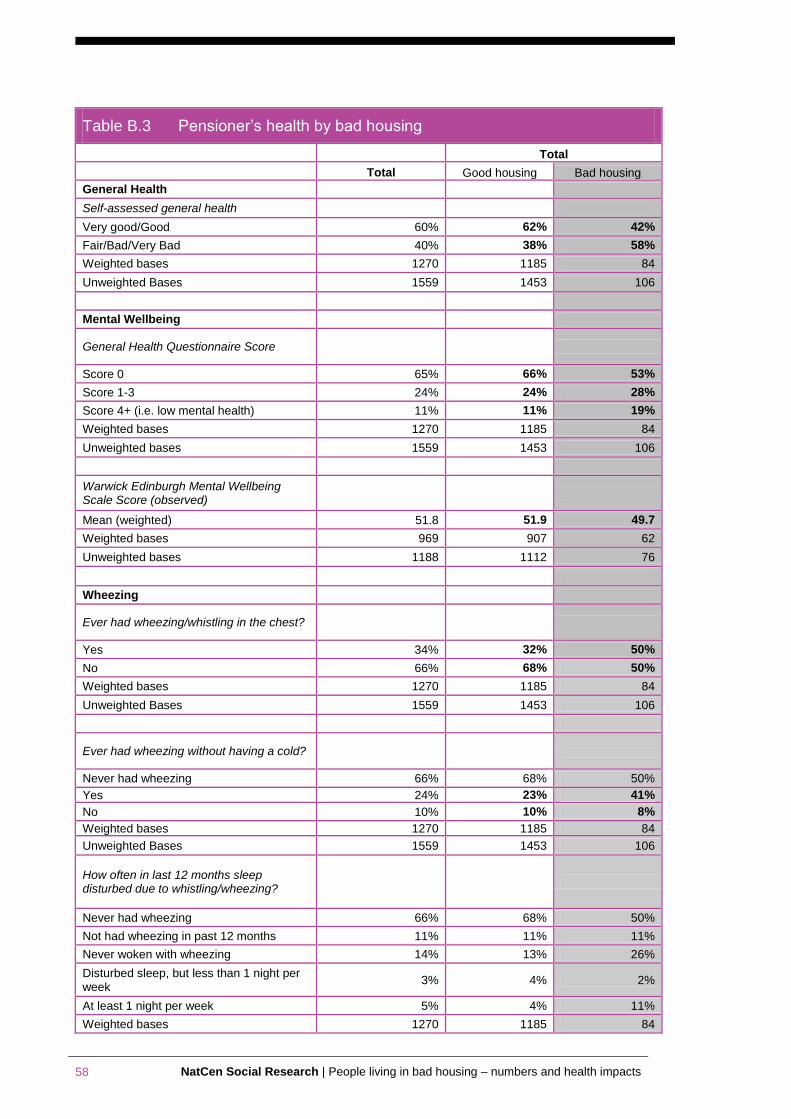
58 NatCen Social Research | People living in bad housing – numbers and health impacts
Table B.3 Pensioner’s health by bad housing
Total
Total Good housing Bad housing
General Health
Self-assessed general health
Very good/Good 60% 62% 42%
Fair/Bad/Very Bad 40% 38% 58%
Weighted bases 1270 1185 84
Unweighted Bases 1559 1453 106
Mental Wellbeing
General Health Questionnaire Score
Score 0 65% 66% 53%
Score 1-3 24% 24% 28%
Score 4+ (i.e. low mental health) 11% 11% 19%
Weighted bases 1270 1185 84
Unweighted bases 1559 1453 106
Warwick Edinburgh Mental Wellbeing Scale Score (observed)
Mean (weighted) 51.8 51.9 49.7
Weighted bases 969 907 62
Unweighted bases 1188 1112 76
Wheezing
Ever had wheezing/whistling in the chest?
Yes 34% 32% 50%
No 66% 68% 50%
Weighted bases 1270 1185 84
Unweighted Bases 1559 1453 106
Ever had wheezing without having a cold?
Never had wheezing 66% 68% 50%
Yes 24% 23% 41%
No 10% 10% 8%
Weighted bases 1270 1185 84
Unweighted Bases 1559 1453 106
How often in last 12 months sleep disturbed due to whistling/wheezing?
Never had wheezing 66% 68% 50%
Not had wheezing in past 12 months 11% 11% 11%
Never woken with wheezing 14% 13% 26%
Disturbed sleep, but less than 1 night per week
3% 4% 2%
At least 1 night per week 5% 4% 11%
Weighted bases 1270 1185 84
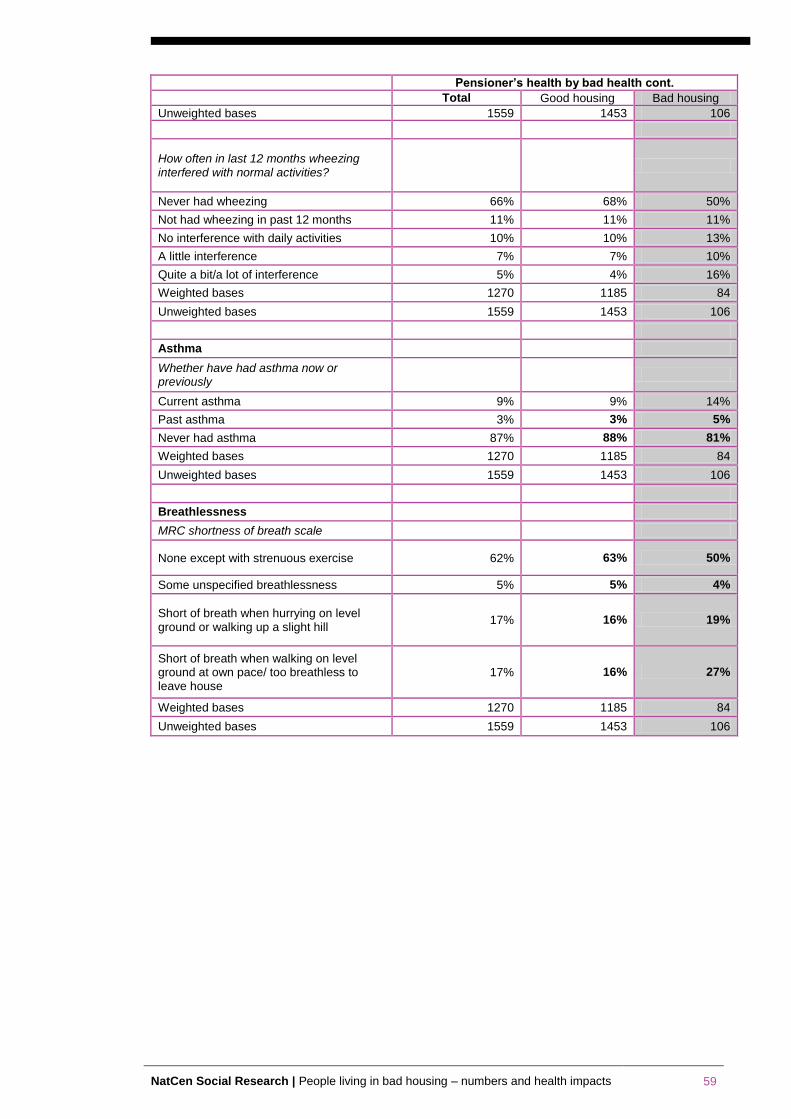
NatCen Social Research | People living in bad housing – numbers and health impacts 59
Pensioner’s health by bad health cont.
Total Good housing Bad housing
Unweighted bases 1559 1453 106
How often in last 12 months wheezing interfered with normal activities?
Never had wheezing 66% 68% 50%
Not had wheezing in past 12 months 11% 11% 11%
No interference with daily activities 10% 10% 13%
A little interference 7% 7% 10%
Quite a bit/a lot of interference 5% 4% 16%
Weighted bases 1270 1185 84
Unweighted bases 1559 1453 106
Asthma
Whether have had asthma now or previously
Current asthma 9% 9% 14%
Past asthma 3% 3% 5%
Never had asthma 87% 88% 81%
Weighted bases 1270 1185 84
Unweighted bases 1559 1453 106
Breathlessness
MRC shortness of breath scale
None except with strenuous exercise 62% 63% 50%
Some unspecified breathlessness 5% 5% 4%
Short of breath when hurrying on level ground or walking up a slight hill
17% 16% 19%
Short of breath when walking on level ground at own pace/ too breathless to leave house
17% 16% 27%
Weighted bases 1270 1185 84
Unweighted bases 1559 1453 106