Embed Size (px)
Citation preview

Consultant’s Report
Project Number: SC 102911 April 2014
The People’s Republic of China: Knowledge Work on Credit Growth in Microfinance and Rural Finance
Prepared by David Lucock
For Asian Development Bank
This consultant’s report does not necessarily reflect the views of ADB or the Government concerned, and ADB and the Government cannot be held liable for its contents. (For project preparatory technical assistance: All the views expressed herein may not be incorporated into the proposed project’s design.

TABLE OF CONTENTS page no.
EXECUTIVE SUMMARY I. INTRODUCTION 1 II. OUTLINE AND DESCRIPTION OF FINANCIAL INSTITUTIONS 1 A. Outline of the Banking Sector 1 B. Rural and Micro Financial Services 2 C. Regulated Rural and Micro Banking Institutions 5
1. Agricultural Development Bank of China 5 2. Agricultural Bank of China 6
3. Rural Credit Cooperatives 7 4. Rural Mutual Fund Cooperatives 8
5. Postal Savings Bank of China 9 6. Village or Township Banks 10
7. Loan Companies 15 D. Non-Banking (Shadow Banking) Institutions 15
1. Description of and Concerns over Shadow Banking 15 2. Microcredit Companies 17 3. Credit Guarantee Companies 22
4. Microfinance Institutions – Poverty Alleviation Focus 24 III. POLICY, REGULATION, SUPERVISION AND CONTROLS 24 IV. DEMOGRAPHICS OF FINANCIAL SERVICES 27 1. Provincial Comparisons 27 2. Comparison of Urban and Rural Incomes and Expenditures 28 3. Analysis of County Level Loans and Deposits 31 4. Household Surveys of Financial Service Access 34 V. OPPORTUNITIES AND CONSTRAINTS IN RURAL AND
MICRO FINANCIAL SYSTEMS 37 A. The Cooperative Financial Institutions 38 B. Commercial Bank Rural Service Outlets 40 C. Village or Township Banks 40 D. Microcredit Companies and Other MFIs 42 Appendix A: Terms of Reference Appendix B: List of References Appendix C: tables (in Word and Excel) Table A.1: Total Assets of Banking Institutions 2008-2012 (CNY 100 million) Table A.2: Banking Institutions Structural Changes: 2008-2012 Table A.3: Aggregate RCC Balance Sheets 2007-2012) Table A.4.a: Information on MCCs: September 2013 Table A.4.b: Information on MCCs: September 2011 Table A.5.a Financial Statements: China Foundation for Poverty Alleviation (CFPA) Table A.5.b CFPA Performance Ratios 2008-2012 Table A.6: Population and GDP Data by Province and Autonomous Region: 2011 Table A.7a Cash Revenues and Expenditures per Capita: Rural Households end 2012 Table A.7b Rural Households per Capita Net Sources of Cash Income and Expenditures:
end 2012 Table A.7c Rural Household per Capita Incomes and Expenditures Appendix D: Persons Met 3-8 March 2014

ABBREVIATIONS
ABC - Agriculture Bank of China ADB - Asian Development Bank ADBC - Agriculture Development Bank of China AIC - Administration for Industry and Commerce ATM - Automated teller machine BoC - Bank of China CAR - Capital adequacy ratio CBRC - China Banking Regulatory Commission CFPA - China Foundation for Poverty Alleviation CGC - Credit guarantee company CNY - Yuan – currency unit IT - Information technology JSC - Joint stock company JSCB - Joint stock commercial bank LCB - Large commercial bank LDR - Loan to deposit ratio MCC Microcredit company MFI - Microfinance institution MSE - Micro and small enterprise NBFI - Non-bank financial institution NDRC - National Development and Reform Commission NPL - Non-performing loan PBC - People’s Bank of China PBOC - People’s Bank of China POFA - Provincial Office for Financial Affairs POS - Point of sale PRC - People’s Republic of China PSBC - Postal Savings Bank of China RCB - Rural commercial bank RCoB - Rural cooperative bank RCC - Rural credit cooperatives RMCC - Rural mutual credit cooperatives TA - Technical assistance VTB - Village or township bank
CURRENCY EQUIVALENTS (as of 30 March 2014)
Currency unit – yuan (CNY) CNY1.00 = $0.16066 $1.00 = CNY6.22416

EXECUTIVE SUMMARY This report is the result of a desk study, conducted November 2013-March 2014 and a site visit 2-8 March 2014, of rural and micro finance systems of the People’s Republic of China (PRC). The main sources of information were websites operated by the government, banks, professional bodies, researchers and donors plus discussions with key stakeholders. The study focused on six financial systems, namely (i) commercial banks, including the Postal Savings Bank of China (PSBC), (ii) financial cooperatives – mainly rural credit cooperatives (RCCs) but also rural mutual credit cooperatives (RMCC), (iii) village or township banks (VTBs), (iv) microcredit companies (MCCs), and (v) poverty alleviation microfinance institutions (PAMFIs). People’s Bank of China (PBOC) is the central bank that formulates and implements monetary policy; maintains the banking sector payment, clearing and settlement systems; and manages official foreign exchange rates and reserves. PBOC has full autonomy in applying monetary instruments and setting the interest rate structure for commercial banks. From April 2003, the China Banking Regulatory Commission (CBRC) became responsible for the regulation and supervision of banks, asset management companies, and trust and investment companies as well as other deposit-taking financial institutions, taking over the supervisory role from PBOC. CBRC charges each supervised institution a fee of one percent of paid up capital of the financial institution subject to a fee adjustment related to level of risk and market focus. Prior to 2000, rural lending was predominantly through banks, especially the Agricultural Bank of China (ABC), and more than 50,000 RCCs that operated effectively as ABC branches. The massive closure of bank branch outlets and non-viable RCCs in the early 2000’s lead to many rural households and businesses having little or no access to financial services. In 2005, PBOC designed and tested microcredit companies (MCCs) to compete with RCCs. Later, in December 2006, CBRC changed market-entry requirements for rural banking aiming to further improve the quality of financial services, increase competition in rural areas, and encourage the entry of private capital. Legal and regulatory formats were established for these new types of financial institutions. A target of 1,294 such institutions (including 1,027 VTBs) was to be in place within three years. Then in 2007 the government transformed the Postal Savings and Remittance Bureau (PSRB) into the Postal Savings Bank of China (PSBC), with the mandate to develop commercially viable loan products for rural enterprises, migrant workers, and farmers. The banking system is dominated by 3 policy banks, 5 large commercial banks (LCBs) that include ABC, and 12 joint-stock commercial banks (JSCBs) that hold 73% of total banking assets. These banks are fully government-owned except that the LCBs and JSCBs are divesting stock to private capital as they become listed on the Shanghai and Hong Kong stock exchanges. There has been a decline in the number of RCCs accompanied by an increase in number of city and rural commercial banks and rural cooperative banks that were formed out of restructured RCCs. The 484 banks formed out of RCC restructuring now hold 15% of total banking assets while the RCCs now hold 6%. Although there has been a large increase in number of VTBs, their share of total banking sector assets is much less than 1%, as is that of the non-banking sector MCCs. Over the period 2008-2012, total assets of bank institutions grew at an annual rate of almost 20%, which was above the annual growth rate of 14.4% reported for (nominal) gross domestic product (GDP) for the same period. The rural commercial banks and city commercial banks, in contrast, grew at a rate of more than 30% per annum. Within this latter group of banks there are some with inclusive policies of agricultural and MSE lending as well as investments in VTBs.

As at the end of 2013 total lending through banking institutions was CNY76.63 trillion. Lending as a proportion of GDP remains high: it was 124.8% of GDP in 2009 and an estimated 122.1% end of 2013. The share of rural lending, county and below, has shown a small relative increase over the past three years. It was 22.2% of total lending in 2011 and has risen to 22.5% as at the end of 2013. This proportion also approximates the rural household share (23%) of total household disposable income that in in 2013 was CNY8,896 for a rural household and CNY26,955 for an urban household. For most banking institutions, the loan portfolio is not allowed to exceed 75% of total deposits i.e. a loan to deposit ratio (LDR) of 0.75. At the end of 2013, total deposits amounted to CNY107.06 trillion yielding a bank sector LDR of 0.716. As at the end of 2013, CBRC reported that NPLs in the banking sector amounted to CNY592.1 billion, 0.77% of total loans outstanding, and the overall return on equity for the industry was 19.2%. The focus of this paper is rural and micro financial services. PBOC defines rural as lending to administrative counties and below. There is no single definition for micro lending but in banking statistics there is a category of micro and small enterprises that shows an average loan size of CNY1.2 million. Some financial institutions define micro as loans less than CNY100,000. A small commercial bank that caters to microcredit has an average loan size of CNY235,000. The Microfinance Market Database calculates microcredit as being up to 2.5 times GDP per capita. According to this definition a micro loan would be up to CNY100,000. Statistics on household revenues and expenditures provide indications of loan size needs and loan service capacity. There are significant differences between rural and urban households in revenue and expenditure patterns. Urban household per capita income is almost 2.5 times that of a rural household. Another major difference is that wages comprise 64% of urban incomes compared to 31% for a rural household while, conversely, household businesses provide 9% of urban household income compared to 59% for a rural household. For rural households, wages, and non-agricultural businesses and transfer incomes have become more important over recent years whereas agricultural sources of income have declined in importance. The size of rural household net cash surpluses in 19 of the poorest provinces shows feasible loan sizes based solely on business activities in the range of CNY3,400-10,000. The inclusion of all other income sources, especially wages and transfer incomes, allows further borrowing of up to CNY33,800. These calculations indicate there is a substantial demand for rural loans in the range of CNY3,000-40,000. These loan sizes are much smaller than the average loan size of MCCs and VTBs (CNY275,000-600,000) that were formed to meet rural credit needs. The availability of acceptable collateral for borrowing also affects rural household access to credit. Wages can be of a part-time and seasonal nature and agricultural income is highly variable. Assets held in rural locations are usually less valuable and marketable in the case of loan default. The lack of acceptable loan collateral combined with a low level of disposable cash surplus means rural credit services is not an attractive market – it is a niche market that tends to be ignored. A number of household surveys show the dependence of rural households on informal sources of credit and that loan charges for formal and informal borrowing are higher for rural households. Surveys carried out during 2003 to 2005 indicated that commercial bank lending to agricultural households was almost non-existent, that RCCs were providing 15-33% of total credit needs, and that informal credit provided the balance of 67-85% of total credit. Interest charges paid by rural households on formal lending were 7.3% compared to 5.8% for urban households and for informal borrowing 25.7% and 18.9% respectively.

A further survey in 2012, carried out by Southwestern University of Finance and Economics, Chengdu, China, indicated that formal household borrowing nationwide amounted to CNY19.2 trillion and informal borrowing was CNY8.6 trillion with 35% of the informal borrowing being used for agriculture and business and 44% for housing. The survey indicated there were 38 million (17% of the total) urban households with formal loans compared to 25.5 million (12%) rural households. Of the 133 million households accessing informal finance, 49 million (22% of all urban households) were urban and 84 million (41% of all rural households) were rural. Another survey in 2012, carried out by PBOC and local authorities, suggested that 98 million rural households, 66% of those surveyed, were credit-worthy. An analysis of county level lending and deposit-taking data 2006-2012 suggests that 45% of rural population is under-served with credit and that 20% of higher income rural households absorb more than 54% of formal borrowing. Furthermore the data show that those counties with the fastest growth in borrowing and loan size per capita also have LDRs that exceed 1.50 while the slower growth and smaller loan size group has an average LDR of 0.56. These results show a transfer of financial resources to the more wealthy households and a relative decrease in access to credit by the lower income households. An analysis of survey and county data indicates a gap of between 10-17 million households and microenterprises that need access to formal credit amounting to CNY1.3-2.3 trillion. This additional demand co-exists along with 41-48 million rural households that would still need to access informal credit with an average loan size of CNY36,000. Existing financial institutions (banks and MFIs) are unable to meet the scale and dimensions of this market demand at present. Much of the need for financial service access, however, is not simply credit. The need is often for quick and convenient access to cash at relatively low cost. Government policy is encouraging the development and extension of electronic banking services that include money transfers and remittances, payment of invoices, as well as access to cash and deposit services through automated teller machines (ATMs) and point-of-service (POS) outlets. In addition, the insurance industry has 183 million rural households with insurance cover, which is mainly life and property cover. The future requirement for a rural financial system is one that is able to offer a wide range of services through electronic systems either directly or through a partner full-service bank or through a correspondent bank. The RCCs, with an estimated 70 million rural and urban borrowers, remain the largest provider of small-scale rural credit with 70% of loans being for less than CNY50,000. The RCCs, however, are still under reconstruction and remain under governmental control – most are not true cooperatives. The number of RMCCs encouraged under the reforms of 2005-2007 has reached less than 50. Associated RMCC concerns are the lack of an apex control and financing structure and inadequate reporting. RMCCs have a reliance on wealthy households to provide much of their capital. The PSBC, with a network of 39,000 outlets, 70% of which are in rural areas, had a loan portfolio of CNY540 billion in 2012 and a cumulative clientele of 4.5 million borrowers. Farmer loan size is up to CNY50,000. PSBC is a licensed commercial bank. Now that the interest rate cap on lending has been removed, PSBC will face more competition in its lending program. Although the VTBs are autonomous legal entities able to provide loan and deposit services, they tend to be operated as branches by their parent bank owners. There are now more than 1,000 VTBs with an aggregate loan portfolio of more than CNY320 billion. Their average loan size of more than CNY275,000 places them outside the service needs of low income households. The requirement that they achieve and maintain an LDR of 0.75 within five

years of startup encourages them to serve higher rather than lower income locations. To be able to provide real microfinancial services, the VTBs need to operate as autonomous units with a cost structure and range of products, and their pricing, quite separate and different from their parent bank. MCCs, under PBOC oversight, are able to provide credit only and have shown rapid growth to reach 7,839 units by the end of 2013 with CNY819 billion in loans outstanding and CNY713 billion in equity. With an average loan size that is estimated to be in the range of CNY400,000-600,000 they provide very little microcredit. Although there is a legal process that provides for an MCC to become a VTB, so as to allow deposit-taking, none of the MCCs have elected to do this. The process requires an MCC to accept a minority shareholding in the transformed VTB by a commercial bank, leading to a loss of institutional ownership and control for the MCC owners. There are a small number of donors supporting MCCs and PAMFIs that provide a majority of their loans of a size less than CNY50,000. Internationally, many such institutions eventually become deposit-taking institutions and some of these even become banks. Unfortunately there is no legal process in the PRC that would allow this evolution and this acts as a deterrent to MCC/VTBs reaching large numbers of households seeking microfinancial services. MCC supervision and control is carried out through provincial governmental offices. There is no standardized reporting and control system and there are regulatory variations among the provinces. Since MCCs are considered part of the shadow banking sector and since some MCCs appear to be involved, directly or indirectly, in internet banking, CBRC is studying the system to determine whether additional safeguards are required. There appear to be a number of business models that could be used to achieve a much greater outreach of rural and micro financial services. These include (i) the PSBC, which would need to become more competitive in its marketing of loan products, (ii) those city and rural commercial banks that have a clear policy of rural and agriculture-related lending, (iii) a select number of RCCs that adhere to sound cooperative principles, (iv) VTBs that could amalgamate under an affiliated ownership structure and focus on a microfinance market niche, and (v) affiliated MCCs that could be enabled, under amended legislation, to become VTBs and continue to service low income households and microenterprises on a greater scale. The absence of consistent data concerning numbers of borrowers by institution and by province makes it impossible at this stage to ascertain with accuracy loan sizes and outreach of financial services in terms of households, farms and businesses. Furthermore the absence of financial statements for individual financial institutions or groups of financial institutions makes it impossible to show the growth, composition and funding of assets and liabilities and institutional financial performance. The lack of data not only inhibits sector analysis but also prevents the measured allocation of resources to institutional investments that have high potential or to areas in need of assistance. Improved flows of information should be seen as a priority.

1
I. INTRODUCTION 1 This Final Report follows the Draft Report presented end of December 2013. The report, written for the Economics Unit of the Asian Development Bank Resident Mission in the People’s Republic of China, now presents more comprehensive information obtained from access to additional reference points and through a series of meetings with key governmental, donor and private sector practitioners in Beijing during the first week of March 2014. The Terms of Reference for the Assignment are attached as Appendix A. A list of reference data sources obtained through government, private sector and donor websites are listed in Appendix B. Appendix C contains tables referred to in the report and Appendix D presents a list of institutions and persons met in Beijing.
II. OUTLINE AND DESCRIPTION OF FINANCIAL INSTITUTIONS A. Outline of the Banking Sector 2 The banking system is dominated by 3 policy banks, 5 large commercial banks (LCBs) that include the Agricultural Bank of China (ABC), and 12 joint-stock commercial banks (JSCBs) as outlined in Table A.1 attached. The policy banks (that include China Development Bank - CDB) are fully government-owned. The LCBs and JSCBs were fully government-owned but are divesting stock to private capital as are the city commercial banks and rural commercial banks that were owned earlier by local authorities following the restructuring of the rural credit cooperatives (RCC). The RCCs are under government control: some have been closed down, some converted to rural commercial and rural cooperative banks, and some restructured as more viable RCC-type financial institutions. 3 Table A.2 shows that the policy banks, LCBs and JSCBs held 73% of total assets and employed 61% of the 3.3 million staff working in bank institutions.1 The Table also shows the decline in number of RCCs accompanied by the increase in number of city and rural commercial banks and rural cooperative banks that were formed out of restructured RCCs. The banks formed out of RCC restructuring now hold 15% of total banking assets while the RCCs now hold 6%. There has been a large increase in number of village and township banks (VTB) but their share of total banking sector assets is much less than 1%. 4 Total loans outstanding in the banking sector amounted to CNY76.63 trillion as at the end of 2013. For most banking institutions, the loan portfolio is not allowed to exceed 75% of total deposits i.e. a loan to deposit ratio (LDR) of 0.75. At the end of 2013, total deposits amounted to CNY107.06 trillion yielding a bank sector LDR of 0.716. Recently, it was announced that banking institutions can deduct their lending to micro and small enterprises (MSE) that is People’s Bank of China (PBOC) funded from total lending in the calculation of their LDR limit.2 5 PBOC is the central bank that formulates and implements monetary policy, maintains the banking sector payment, clearing and settlement systems, and manages official foreign exchange rates and reserves. According to the 1995 central bank law, PBOC has full autonomy in applying monetary instruments and setting the interest rate structure for commercial banks. From April 2003, the China Banking Regulatory Commission (CBRC) became responsible for the regulation and supervision of banks, asset management companies, and trust and investment companies as well as other deposit-taking financial institutions, taking over the supervisory role from PBOC. CBRC charges each supervised 1 Bank institutions include policy banks, LCBs, JSCBs, city commercial banks, rural commercial banks, rural cooperative banks, foreign banks, RCCs, PSBC, VTBs, RMCCs, and loan companies. 2 CBRC notice: 29 August 2013.

2
institution a fee of one percent of paid up capital of the financial institution subject to a fee adjustment related to level of risk. The supervision fee for rural mutual credit cooperatives (RMCC) has been waived and for village or township banks (VTB) and loan companies is set at half the normal charge rate. 6 Prior to 20 July 2013, the lending rate of commercial banks was capped at a benchmark lending rate of 6%, while financial cooperatives, village or township banks (VTBs) and microcredit companies (MCCs) were allowed to charge up to four times the benchmark rate on their lending. Apart from a floor rate on mortgage lending there is now no restriction on lending interest rates. The benchmark rate for deposits, however, remains until a system of deposit insurance is in force. As at the end of 2013, CBRC reported that NPLs in the banking sector amounted to CNY592.1 billion, 0.77% of total loans outstanding, and the return on equity for the industry was 19.2%. B. Rural and Micro Financial Services 7 Table 1 below shows total lending with a sub-division of county and below that is broadly designated (by PBOC) as agro-linked lending. Some of the lending in this subdivision, however, would not normally be defined as rural 3 and many of the rural loans are for more than CNY20 million.
Table 1: Total and Rural Lending 2009-2013 (CNY trillion)
2009 2010 2011 2012 2013
1. All loans outstanding: RMB & FX 42.56 50.92 54.79 67.29 76.632. Small/medium loans (SME) 14.44 18.68 21.77 22.36 n.a. Micro/small loans (MSE) 5.84 7.55 10.76 11.58 12.823. All inclusive agro-linked lending 9.14 11.77 14.60 17.62 n.a. Rural lending: county & below 9.14 9.91 12.15 14.54 17.29 Rural household lending 2.51 2.60 3.10 3.62 4.50 Agricultural lending 1.94 2.30 2.42 2.73 3.04 Other rural lending 4.68 5.01 6.63 8.19 9.75 Source: PBOC Statistical Reports on Uses of Loans by Financial Institutions Note: MSE lending data excludes rural commercial banks, rural cooperative banks and VTBs. 8 Total lending through banking institutions was 124.8% of GDP in 2009 and 129.6% in 2012 and an estimated 134.7% end of 2013.4 The share of rural lending, county and below, has shown a small relative increase over the past three years. It was 22.2% of total lending in 2011 and has risen to 22.5% as at the end of 2013. This proportion also approximates the rural household share (23%) of total household disposable income. Similarly, the share of rural household and agricultural lending, at 9.5% of total lending in 2011, has increased slightly to 9.8% of total lending in 2013. Significantly, there was an increase in the share of lending to micro and small enterprises (MSE) from 13.7% of total lending in 2009 to 19.6% in 2011 but a subsequent decline to 16.7% in 2013. 9 The massive closure of bank branch outlets and non-viable RCCs in the early 2000’s lead to many rural households and businesses having little or no access to financial 3 For example, there are more than 33 large towns with an average population of more than one million persons that are under county jurisdiction and therefore classified as rural. 4 Based on the preliminary official GDP in 2013 of CNY56,884.5 billion. In comparison, total lending as a percentage of GDP is 55% for India and 59% for the USA.

3
services. In 2005, PBOC designed and tested microcredit companies (MCCs) to compete with RCCs. Later, in December 2006, CBRC changed market-entry requirements for rural banking aiming to further improve the quality of financial services, increase competition in rural areas, and encourage the entry of private capital. The government established legal and regulatory formats for village or township banks (VTB), loan companies, and rural mutual credit cooperatives (RMCCs).5 A target of 1,294 such institutions (including 1,027 VTBs) was to be in place within three years.6 At around the same time, PBOC piloted and encouraged the development of credit-only microcredit companies (MCCs). Then in 2007 the government transformed the Postal Savings and Remittance Bureau into the Postal Savings Bank of China (PSBC), with the mandate to develop commercially viable loan products for rural enterprises, migrant workers, and farmers. 10 Beginning in October 2007, VTBs, loan companies, and RMCCs were piloted in 6 provinces and then expanded to 31 provinces, autonomous regions and municipalities. Large and medium-scale commercial banks, many with foreign shareholding, have been investing in VTBs as also have RCCs, RCBs and rural cooperative banks (RCoBs. To complement these institutional changes, many of the commercial banks have expanded their ATM and point-of-service (POS) terminals into rural areas. 11 Table 2 below provides an outline and estimate of outreach of rural credit to 80 million households, MSEs and smallholder farmers. Since the data do not include all banks, Table 2 can be seen as an under-estimate of outreach.7 The data can be compared to that outlined in Table 1 above that shows, end of 2013, CNY17.29 trillion in county and below lending - much of which is to SMEs with an average loan size of around CNY20 million.8 The majority of borrowers (88%) in Table 2 are serviced through the RCCs. In 2010, it was estimated that 82.42 million rural households (33.5% of 240 million rural households) accessed such “cooperative” credit.9 A later CBRC estimate indicates there are approximately 70 million RCC borrowers and that 70% of RCC credit is for a loan size of less than CNY50,00. The table indicates that about 35% of rural households have formal credit access. Since dormant loans may be included in the totals and some institutions show cumulative rather than outstanding numbers, the figures in Table 2 should be taken as indicative only. Neither PBOC or CBRC present information on numbers of borrowers. 12 Table 2 includes Harbin Bank as an example of a city commercial bank that lends to farmers, MSEs and other sized enterprises. Harbin Bank has 304 branches of which 254 are in rural locations. In addition Harbin Bank has ownership in 24 VTBs. Average farmer loan size is CNT27,200 and average MSE loan size is CNY168,750. Harbin Bank has support linkages with PlaNet, Accion and IFC and has recently raised $1.1 billion in an initial public offering through the Hong Kong stock exchange. Harbin Bank is of interest because it is developing a balanced rural and urban financial service strategy that includes agricultural and microenterprises. 13 Long Jiang Bank is another example of a progressive commercial city bank that was formed out of the RCC system and now has 156 outlets and ownership in 11 VTBs. Long
5 Unfortunately, data for these new-type financial institutions are not shown separately and, furthermore, often lumped in with PSBC data despite each institution being different in size and operational systems. 6 July 2009, CBRC issued the “2009–2011 Overall Work Arrangements on New-Type Rural Financial Institutions” At end-2012, 691 new-type institutions were operating including 635 VTBs, 10 LCs and 46 RMCCs. 7 The China Financial Stability Reports 2011-2013 show that in 2011 81.85 million rural households received an average loan of CNY 18,600 and in 2012, 110 million rural households had an average loan of CNY 16,000. These data do not include MSE lending. 8 PBOC Annual Report 2012, page 212. 9 China Financial Stability Report, 2010. It is not clear whether the reference is to RCCs only or includes rural commercial banks and rural cooperative banks – both of which have been formed out of restructured RCCs.

4
Jiang Bank has a strong focus on the agricultural commodity supply chain and micro and small enterprises with a large agroindustrial enterprise holding a 20% equity share.
Table 2: Estimates of Amounts of Rural and Micro Credit by Selected Institutions
Institution Data Year
Borrowers No.
Loans out CNY billion
Avg. loan balanceCNY
RCC/RCB/RCoBs a/. 2012 70,000,000 5,300.00 75,700 ABC b/. 2012 5,800,000 134,48 23,200 Harbin Bank 2012 348,100 79.93 235,000 PSBC b/. 2013 1,350,000 97.20 72,000 VTBs c/. 2013 1,090,000 317.50 291,300 MCCs c/. 2013 1,255,750 753.40 600,000 PAMFIs d/. 2010 193,400 1.06 5,500 Total 80,038,250 6,683.57 83,500 Sources: China Papers on Inclusiveness No. 7 August 2012 and CBRC Bulletins, ABC Annual Report 2012. a/. Includes CNY2.6 trillion in rural household lending. Financial data as for end 2012, number of borrowers as at end 2009. b/. PSCB estimated at 30% of the 4.5 million active borrowers being rural. The average loan size of CNY60,000 in 2007 is CPI adjusted to CNY72,000 in 2013. c/. Estimates subject to verification. ABC data mainly comprises Huinong card lending. d/. PAMFIs = Poverty alleviation MFIs 14 The data for the VTBs and MCCs are not verified. The data for ABC does not include county corporate borrowers and the county MSE/retail borrowers. The China Paper on Inclusiveness, 2012, suggested that the average loan balance of an MCC borrower was in the range of CNY400,000-600,000 which indicates most of MCC lending is for micro and small enterprises. The upper estimate of loan size was used in Table 2. No information is available on the split between rural and urban lending for either the VTBs or MCCs. Since some provinces require that 70% of MCC lending is for agriculture and there is the requirement that a MCC transforming to a VTB must have had agricultural lending as 60% of its loan portfolio, MCC lending might be mainly rural. The table includes data from 44 microfinance institutions (MFI) involved in poverty alleviation. These MFIs (and the MCCs) do not report to CBRC. 15 In 2012, efforts were made by PBOC and local authorities to establish credit information files for 148 million rural households in 2,484 counties. Of this total, 97.84 million (66%) rural households were recognized as being credit-worthy. In the same year, more than 110 million rural households with credit information files acquired loans, with an outstanding value of CNY1.76 trillion: an average loan per borrower of CNY16,000.10 In 2012 the national credit information database contained information on 823 million persons and 18.588 million corporations and institutions. 16 At the end of 2012, bank cards issued in rural areas reached 1.353 billion (out of a rural population of 651 million). There were 4.1672 million terminals for bank cards covering 78 percent of villages and there was a total of CNY80 trillion in rural card transactions in the year. There were 72.52 million deposit withdrawals through 670,000 rural service outlets for an amount totaling CNY23.6 billion: an average CNY325 per withdrawal. Nationally, a card coverage of 43.5% of the population was reported.11 It is presumed that the 97.84 million
10 China Financial Stability Report 2013, page 129. Three year data show 65% of this borrowing is for consumption. 11 PBOC Annual Report 2012.

5
rural households that were deemed creditworthy could gain access to bank cards. This is 47% of the rural population. 17 Table 2 shows average loan sizes per borrower in the range of CNY5,500-600,000. A definition of microcredit used by the international Microfinance Exchange Market is that a microcredit loan is up to 2.5 times the gross annual national income per capita of a country. The GDP per capita in the PRC was CNY41,805 ($6,770) in 2013.12 This indicates that a microcredit loan would be up to CNY104,500 ($16,925). Indeed there is some consensus that a microloan is up to CNY100,000 in size.13 This threshold can be compared to the disposable income per capita, in 2013, of CNY26,955 for an urban household and CNY8,896 for a rural household.14 Applying the 2.5 times criteria to rural households would indicate that a rural microcredit loan would be up to CNY22,240 compared to CNY67,390 for an urban household. Table 2 indicates that apart from the PAMFIs (i) very little of the rural lending is microcredit, and (ii) much of the lending is to higher income households. 18 In August 2008, PBOC announced that the credit line size of guaranteed microloans extended to individuals by relevant financial institutions was to be increased from CNY20,000 to CNY50,000 ($7,930). The credit lines of new guaranteed microloans extended to small labor-intensive enterprises was also increased from CNY1,000,000 to CNY2,000,000 ($317,500). It is presumed that this latter amount relates to both micro and small enterprises. This would indicate that a micro/small enterprise (MSE) loan size is up to CNY2 million.15 19 MSE lending and guidelines for banking institutions were issued September 2013.16 Earlier the categorization was small and medium enterprises (SME). As at end of July 2013, total MSE lending amounted to CNY16.5 trillion or 22.5% of all bank lending. At that time, there were 13.022 million MSE borrowers and the average loan balance per borrower was CNY1.267 million ($201,000). Data provided for 290,000 SMEs in 2012 showed an average loan size of CNY19.3 million. A breakdown into rural and urban lending was not provided. 20 The data in Table 2 covers only credit. Rural electronic payments of CNY80 trillion in 2012 dwarf loans outstanding of CNY6.66 trillion shown in Table 2. Furthermore Table 2 does not take into account insurance services. In 2012 there were 183 million rural households that took out insurance cover of CNY900.6 billion (an average insured value of only CNY4,921) with 28 million of these households making claims for an average CNY526.17 Total assets of the insurance industry amount to CNY7.35 trillion: equivalent to 5.6% of total assets of all banking institutions. Most insurance cover is for life (57%) followed by property (34%), health (6%) and accident (3%). There is very little credit insurance. These data show the importance of rural financial institutions being able to provide electronic banking and access to insurance services. C. Regulated Rural and Micro Banking Institutions
1. Agricultural Development Bank of China 21 The Agricultural Development Bank of China (ADBC) is a policy bank for the provision of policy-related financial services for agricultural activities, rural areas, and
12 Based on National Bureau of Statistics GDP Published :2013 -01-19. 13 Du Xiaoshan, Deputy Director, Rural Development Institute of the China Academy for Social Sciences 14 China Statistical Yearbook 15 CBRC has set the maximum value of a microloan in coastal areas at CNY300,000. 16 Guidelines on Further Enhancing Financial Services for Small- and Micro-Sized Enterprises (CBRC: Yin Jian Fa No. 37, 2013). 17 China Financial Stability Report 2013.

6
farmers. Its primary goal is poverty alleviation-oriented loans in rural areas as well as safeguarding China’s food security. Thus a great deal of its lending is focused on loans for grain, cotton and oil purchases as well as lending to leading agricultural enterprises and developing infrastructure in rural areas. ADBC is also involved in new initiatives to enhance the scope of credit availability in rural areas, with a particular focus on MSEs in the western regions of the country. 22 As at the end of 2011, ADBC had CNY18,311.49 billion in total loans outstanding – 33% of all banking sector lending. A selection of lending in 2011, that provides an indication of loan sizes, is summarized in Table 3 below.
Table 3: Outline of ADBC Lending 2011
Loan purpose Lending
CNY billion Borrowers
No. Avg. loan size CNY million
Agribusiness: fruits, herbs, forestry 26.191 1,137 23.035 Cotton processing 35.155 514 68.395 Processing: grains, edible oils 830.599 19,210 43.237 Agribusiness: MSE & cooperatives 7.587 1,720 4.411 Rural infrastructure a/. 73.977 896 82.563 Water conservation a/. 35.904 256 140.250 Countryside construction a/. 207.698 987 210.433 Rural circulation system a/. 19.352 444 43.585
Source: ADBC Annual Report 2011 a/. Refers to projects as borrowers
2. Agricultural Bank of China
23 The Agricultural Bank of China (ABC) is a majority owned18 state commercial bank holding 10% of total lending through the banking system. ABC has 23,472 service outlets and an electronic banking network reaching every county in China. It provides debit card (Huinong) services offering cash deposits and withdrawals, transfer settlements, collection of rural social and medical insurance, payment of rural public utilities, and receipt of state subsidies.19 Since 2008, ABC has invested in and holds majority ownership in six VTBs. In 2010, ABC started to provide wholesale loans to a few PAMFIs in rural China. In the same year, ABC had 5.8 million rural household borrowers. 24 The 2012 Annual Report outlines ABC’s County Area Banking Business profile which is described as rural. Of total corporate and MSE lending by ABC, 33% is county (rural). The report shows CNY134.484 billion in lending to rural households with 98% of this through 128 million Huinong electronic cards. In addition there was CNY626.577 billion in retail lending and CNY1,400 billion in rural corporate lending. The LDR for rural banking was 0.45 compared to 0.57 for non-rural banking; indicating a lower level of financial intermediation in rural areas. Rural loan sizes are not given, but for the whole bank the average loan balance for a corporate borrower was CNY59.6 million and for a MSE CNY13.79 million – comprising loans outstanding of CNY599.8 billion to 43,497 MSEs. 18 Foreign institutional investors hold 17% of total shares. 19 RaboBank bought into 1.1% of ABC’s $22.1 billion IPO in 2010. Rabo Development experts are advising on customer segmentation and product development; agricultural value chain solutions; agricultural sector knowledge and credit policies; credit risk management for rural lending; and e-banking.

7
3. Rural Credit Cooperatives 25 In 1955, there were more than 150,000 RCCs covering almost all townships.20 Then in 1958, theses RCCs were merged with branches of ABC and placed under the control of the commune. In 1996, the RCCs were separated from ABC and restored as independent financial institutions. RCCs were and still are the dominant supplier of rural credit. Most have operated not as true member-owned cooperatives but as a government conduit, through ABC, for credit. The history of changing responsibilities and the conflicting roles of the PBOC, CBRC and ABC, contributed to the lack of clear lines of oversight and accumulating losses within the RCCs.21 Furthermore, by 2000, much of the lending had moved away from the needs of low income farm households towards asset-backed larger-scale investments.22 Cumulative operating losses and high NPLs reaching 50% of the loan portfolio lead to the closure and restructuring of many RCCs that started in 2003 and is still ongoing.23 26 RCCs have been reorganized, with the stronger ones (mostly in economically developed regions, with a relatively healthy financial status) being restructured as provincial rural commercial banks or rural co-operative banks, and the remaining individual RCCs (mainly in less-developed areas) being merged with other RCCs into county-or-provincial-level RCC unions. The provincial rural commercial banks formed out of RCCs are no longer managed as cooperatives. Local authorities continue to play an important role in the management of RCCs.24 The focus is on the commercialization of the RCC system. Most of the RCCs now have access to the PBOC payments system. 27 RCCs are a part of the rural cooperative financial system that consists of 147 rural cooperative banks and 1,927 RCCs. In addition, more than 300 of the 337 rural commercial banks have been established through the restructuring of RCCs. 25 These RCBs are the fastest growing bank institution: over the period 2008-2012 annual asset growth has been 65% compared to 19% for all other bank institutions. In 2008 total RCC assets were CNY5,211 billion with lending of CNY1,247 billion compared to total assets of CNY7,953 billion and lending of CNY2,089 billion end of 2012. (Table A.3 attached). The annual growth rate in total RCC assets over five years has been 11% and the return on equity has averaged 12.8%. Total RCC assets declined from 15.8% of GDP in 2008 to 14.2% in 2012. The loan portfolio, however, remained constant at 4% of GDP. The consolidated RCC debt to equity ratio exceeded 7:1 in 2012. There is little scope for additional borrowing to stimulate asset growth. More injections of equity are needed. 28 Separately, urban credit cooperatives had started up in 1979 and experienced fast growth though to 1995 when PBOC decided to re-form them as commercial banks. In 2000, urban credit cooperatives were given three options (i) to be acquired by city commercial
20 China Statistical Information and Consultancy Centre, 1990 21 Don’t Drown the Seedlings: Lessons for Savings and Credit Union Development from the Experience in East and Central Asia: ADB Project Number: 36027, Final Report May 2006 22 In 2006, microcredit lending to farmers was 30% of the loan portfolio: Jia X. & P. Guo (2008), “Evolution of rural finance in China: institutional ‘lock-in’ or gradualism?”, Savings and Development 4 (XXXII): 279-299. 23 In 2002, the equity of the RCCs was negative CNY 27.418 billion. China Financial Stability Report; Special Topic II, Reform and Development of the Rural Financial System. 24 Financial Inclusion in the People’s Republic of China An analysis of existing research and public data A joint publication of CGAP and the Working Group on Inclusive Finance in China 25 Due to restructuring the number of RCCs declined from 30,438 as at the end of 2005, to 4,965 end of 2008 and 1,927 end of 2012.
8
banks, or (ii) be acquired by joint stock commercial banks, or (iii) to merge with RCCs.26 In 2008, there were just 22 urban credit cooperatives with CNY4.69 billion in equity and CNY80.37 billion in total assets left. By 2012, there were no urban credit cooperatives remaining. 29 According to standard cooperative principles, credit cooperatives should be supervised by a congress, council, and board made up of democratically elected members who exercise the necessary governance and internal controls of their cooperative. In fact, the majority of RCCs did not establish such organizations. RCCs were led by ABC and essentially controlled by local government. Hence, farmers generally regarded them as an independent government entity rather than cooperatives. The country also regarded them as entities similar to state-owned financial institutions.27 30 The financial statistics of the RCCs tend to confirm that they do not operate fully as cooperatives in terms of ownership and governance. The aggregate loan portfolio in 2012 was only 29% of total assets compared to 47% of total assets held with other financial institutions as deposits and 19% held as reserves and government bonds. These are not typical financial ratios for a cooperative where the loan portfolio is usually in excess of 80% of total assets. Their ongoing restructuring may account for these atypical ratios though. As part of their financial rehabilitation, RCCs (under a pilot project) have been provided with central bank notes to hold as assets and be redeemed (encashed) subject to the achievement of set financial performance targets. 31 Financial information on the RCCs is rather opaque. An example is that the annual growth in equity exceeds the annual profit after tax yet there is no declared increase in paid up capital. There are also unexplained differences between the PBOC and the CBRC information on RCCs. While both show the same profit after tax figures, there are differences in the total asset and equity figures. For example in 2012, CBRC shows CNY7,552.1 billion in total assets and CNY401.4 billion in equity compared to CNY7,384.58 billion and CNY877 billion respectively shown by PBOC. It appears also that there is no clear separation between RCC and cooperative agro-based lending. In 2012 it was stated that agro-linked cooperative lending was CNY5.3 trillion.28 In the same year, total RCC lending was CNY2.088 trillion. This suggests that agro-linked lending through the rural cooperative banks and the rural commercial banks was included in the larger total. 32 Since 2010, the Ministry of Finance (MOF) has implemented a preferred sales tax29 of 3% for rural credit cooperatives, and disbursed CNY8.85 billion to those RCCs suffering losses from subsidies related to inflation-proof savings.30
4. Rural Mutual Fund Cooperatives 33 RMCCs are one of the three new types of financial institutions. At end of 2012 there were 50 RMCCs that appear to be similar in function to a member-operated credit union. An RMCC must have no less than 10 members. If serving a county or municipality the minimum required capital is CNY300,000 and for a township it is CNY100,000. Members are the
26 Zuo, Xuejin. (2001) ‘The Development of Credit Unions in China, Financial Sector Reform in China,’ Conference Paper. September 11-13, 2001, John F. Kennedy School of Government, Harvard University 27 The Chinese Economy, vol. 43, no. 3, May-June 2010, pp. 59-67. 28 China Monetary Policy Report Fourth Quarter 2012: PBOC 6 March 2013. It is also stated in the reports that rural cooperative financial institutions refer to rural commercial banks, rural cooperative banks, and rural credit cooperatives. 29 This is a tax on interest revenues. There is a proposal to change this to a VAT-type tax in the near future. 30 China Financial Stability Report 2013, page 176

9
principle source of share capital and no shareholder/member can hold more than 10% of total share capital. RMCCs are allowed to borrow from banks and attract donations. 34 It has been suggested 31 that RMCCs could leverage their capital five to six times by borrowing at a discounted rate from PBOC. This suggestion does not take into account the risk that the RMCC could eventually become a financing conduit of Government with members losing control of their cooperative; as happened with the RCCs. Another concern is that there does not appear to be a head institution (a secondary cooperative) owned by the RMCCs themselves able to act as an industry self-regulating and support body. Nor is there a bank that is willing to act as a partial financier and controller of its (would be) partner RMCCs. 32 35 A documented review of the Xinhe RMCC (referenced in The Chinese Economy Vol. 43) showed that RMCCs face high start up costs; Xinhe paid CNY500,000 to establish an office and equipment plus outlays for business promotion. Since two thirds of members paid the minimum subscription of CNY2,000, larger shareholder members who subscribed an average of almost CNY30,000 were required. Paid up capital of CNY3.6 million through 335 members was augmented by CNY5.8 million in deposits. 36 CBRC must approve the registration and work plan of a new RMCC and also supervises RMCCs. Should an RMCC wish to increase its number of members, it must first obtain permission from CBRC. It appears that an RMCC must also obtain permission from CBRC if it wishes to borrow institutional funds. To compete with RCCs, the RMCCs tend to charge a lesser interest rate on their lending.33 RMCCs are required to pay the 5% business tax on their loan interest revenues. In the Xinhe RMCC, the average loan size in 2010 was CNY163,900. 37 The Xinhe RMCC highlights potential strengths and weaknesses of the RMCC system. Financial services respond to member’s needs and are provided quickly but are restricted to loans and deposits. Membership increases require regulatory approval and this constrains the pace of growth. A drive to increase membership so as to obtain more funds for lending raises the risk of pyramid-style financing with new members financing the old. Financing for asset growth is largely member-derived. This often leads credit cooperatives to seek members with higher incomes rather than membership from lower income households. 5. Postal Savings Bank of China
38 In 2007 the government transformed the Postal Savings and Remittance Bureau (PSRB) into the Postal Savings Bank of China (PSBC) with capital of CNY20 billion, with the mandate to develop commercially viable loan products for rural enterprises, migrant workers, and farmers. PSBC now has total assets of CNY5.4 trillion and 116,759 staff including 35,000 loan officers. PSBC is listed as the seventh largest commercial bank. The loan portfolio at only 20% of total assets reflects the non-lending activities of PSBC. At the end of 2011, total deposits amounted to CNY3.4 trillion in 1,043 million accounts: 9.6% of all banking sector deposits. The average deposit balance was in the range of CNY3,097-3,264 during 2007-2011. 34 39 In its mission statement, PSBC says it is aiming to become a large famous modern commercial bank with a core business of retail banking. The mission of PSBC is stated as
31 The Chinese Economy, vol. 43, no. 3, May-June 2010, pp. 59-67. 32 Similar to the relationship between Land Bank of the Philippines and its partner cooperatives. 33 Xinhe RMCC located in Jinyun county, Lishui municipality, Zhejiang Province, charged 8.19% in 2009 compared to 8.41% through the local RCC. 34 PSBC data is difficult to analyze as most information is provided on a cumulative basis.

10
being to provide basic financial services to customers, especially to low income people and people in the rural area. At end of 2009 PSBC MIX Market data showed 1.57 million active borrowers with total loans outstanding of CNY126.513 billion: an average loan account balance of CNY80,510. At the end of 2010 there were 1.93 million borrowers with total loans outstanding of CNY92.385 billion and an average loan account balance of CNY47,960. By November 2013, microfinance loans outstanding stood at CNY540 billion to an estimated 4.5 million active borrowers. 35 Farmer loans are up to CNY50,000. Loans to MSEs average CNY300,000 in size and for SMEs average CNY2.7 million. In 2010 there were 4,591 credit service outlets out of a total 36,000 offices. There are now 39,000 office outlets with 70% of these in county and village locations. 40 PSBC makes loans to cooperatives of up to CNY300 million and makes personal consumer loans of up to CNY25 million. In addition, PSBC operates remittance, pension and insurance premium payment services and, to facilitate non-cash payment services, introduced a bank card (named Funong) starting in 2011. In 2012, PSBC handled 62% of all remittances in the country. The total number of financial service customers exceeds 500 million. The German institution Gesellschaft für Internationale Zusammenarbeit (GIZ) provided technical assistance to PSBC through to 2013.
6. Village or Township Banks a. Operations 41 Following a startup of 91 VTBs in 2008, the 1,000th VTB was established October 2013.36 VTBs are one of the three new style banks for which Government provided legislation in 2007. VTBs are often referred to as village banks or community banks.37 A VTB must be founded by a banking institution that holds not less than 15% of the share capital. This ownership linkage to a bank facilitates CBRC supervision. In addition, a single natural person, or a non-banking financial institution, can be a shareholder but hold not more than 20% of total share capital. 42 The registered capital required of VTBs established in cities and counties is not less than CNY3 million while VTBs established in towns and townships must have a registered capital of not less than CNY1 million.38 The amount of injected capital varies according to the founding institution and geographic location. In 2010, the average capital injected in a VTB by large commercial banks was CNY89 million compared to CNY52 million for city commercial bank owners and CNY40 million for RCCs.39 The overall average capital investment was CNY56 million. 43 As at the end of 2010, 35% of VTB ownership was held by City Commercial Banks, Rural Cooperative Banks, Rural Commercial Banks, and RCCs. These banking organizations, largely formed out of the restructuring of RCCs, saw VTBs as an opportunity 35 This is based on a cumulative total of 15 million loans for a total of CNY1.8 trillion showing an average of CNY120,000. The calculated total of 4.5 million borrowers is unverified and seems high compared to 2010 data. 36 As at end February 2014, there were 1070 VTBs with 1,080 branches covering 57.6% of counties. 37 Financial sector discussants talk of “community banks” in a way that includes banks that provide local/community grassroots level services – especially to SMEs and households. Generally, the institutions include urban and rural commercial banks, rural cooperative banks, RCCs, and VTBs. 38 In comparison, the minimum registered capital of a large-scale commercial bank is CNY 1 billion, CNY100 million for a medium-scale urban commercial bank, and CNY20 million for a Rural Cooperative Bank. 39 Research on the Development of Village and Township Banks (VTBs) in China (China Papers on Inclusiveness No. 5), China Banking Association, Working Group on Inclusive Finance in China: October 2011

11
to compete against the larger banks for local business and expansion into new locations. It is considered easier to establish a new VTB rather than a new branch and, furthermore with the VTB being a legal entity, it is also possible to attract new investors to the VTB, most of which are private. A further advantage was, that prior to the removal of interest rate caps, VTBs could charge an interest rate up to four times that of the official cap. The larger banks, some with foreign partnerships, have also entered the VTB market and have substantial plans for expansion. In general, the VTBs are still being operated as branches of the founder banks and do not operate as autonomous financial institutions. 44 Bank of China (BoC), a large commercial bank, is working on joint ventures with foreign partners to accelerate the flow of credit to rural areas. In March 2010, BoC and Fullerton Financial Holdings (owned by Temasek 40), set out a plan to invest CNY20 billion in the establishment of 400 VTBs. As of May 2012, there were 18 such joint venture VTBs and a plan to establish 178 VTBs by the end of 2013. BoC shareholding in the VTBs will be 80% with Fullerton holding the remaining 20%. China Construction Bank, in partnership with the Spanish Santander Bank, had established 26 VTBs by the end of 2012 with plans to establish 100 VTBs in the near future. These plans fit well with the regulation that allows owners of at least 30 VTBs to unite these under a single management unit (para 63 below). 45 As at end of August 2013, total assets of more than 900 VTBs were CNY520.4 billion. This included lending of CNY317.5 billion made up of rural household loans of CNY122.8 billion, MSE loans of CNY159.8 billion, and other loans of CNY34.9 billion. Total lending of all VTBs was 0.4% of lending of CNY74,990 billion by all bank institutions in September 2013. As at August 2013, the average loan size for VTB rural household loans was CNY276,500 ($46,000). This loan size, and the national average for MSE loan size of CNY1.3 million, have been used to calculate the number of VTB borrowers and average loan size. The growth in number of VTBs and their lending is outlined in Table 4 below.
Table 4: Village or Township Bank Growth 2009-2013
Indicator December 2009
December 2011
August 2013
VTBs: No. 148 726 900+ Total assets: CNY million n.a. n.a. 520,400 Total loans outstanding “ “ 18,100 131,600 317,500 Farm/rural household loans “ “ 6,550 43,550 122,800 MSE loans “ “ 9,120 63,150 159,800 Other loans “ “ 2,430 24,900 34,900 Estimated borrowers: No 57,500 402,650 1,094,300 Source: CBRC news bulletins 46 The VTB average loan size is estimated at CNY290,000 ($48,300) overall. This is well above a common definition for a micro loan (as discussed in para 17) and well above the average loan size of the RCCs (Table 2 above). Much of the future loan growth of VTBs, especially in rural areas, will depend on their ability to make smaller loans efficiently. 47 The VTB share of rural lending (county and below) for all banking institutions was 2.2% and for rural households it was 3.4%. The outreach of the VTBs in 2013 is estimated as being slightly more than one million borrowers: about 0.5% of rural households. In mid 2010 the LDR of 192 VTBs was an average 0.86. Later data are not shown. This indicates that the VTBs are heavily dependent on equity capital and deposits for their asset growth.
40 Temasek also holds 4.8% of BoC.

12
Mid-2010, the consolidated equity of CNY10.78 billion plus deposits of CNY40.664 billion comprised 83% of total equity and liabilities of CNY62.154 billion for 192 VTBs. 48 This finding is borne out by looking at information provided by ABC41 for six rural banks (VTBs) that it has established – mostly with a 51% shareholding – over the period 2008-2012. For the older VTBs, the LDR was 0.66 in 2012. Of their increase in assets since startup, 87% has been funded by deposits, 10% by retained earnings and 3% by borrowing. These earlier VTBs had startup equity of CNY20-30 million. The last two VTBs have started with equity of CNY210 million and CNY100 million. These equity inputs show that the regulatory minimum startup capital requirements are irrelevant. The reliance on deposit-taking and profitability lead VTBs to operate in higher income locations. 49 Relaxing or removing the LDR requirement and encouraging VTBs to borrow could increase the rate of loan growth as shown in Table 5 below and lead to a large improvement in broader financial intermediation. The table shows the present position of a mature VTB with an LDR of 0.75 and very little borrowing. Loans outstanding of CNY65 million are 55% of total assets and the CAR is 38%. Column “B” shows the position where there is no specific LDR requirement and also no change in the amount of equity (CNY30 million) or deposits (CNY87 million). In this example, the VTB borrows CNY123 million using the loan portfolio of CNY175 million as collateral. This is borrowing of 70% of receivables. Loans outstanding are then 73% of total assets and the CAR is 15.5%. Cash equivalent to 22% of liabilities provides sufficient liquidity for operations. All of these ratios are of an internationally accepted standard.
Table 5: Alternative Balance Sheets (CNY million) Present “B” Assets:
Cash 18 42 Placements 28 5 Loans outstanding 65 175 Other assets 7 18 Total assets 118 240 Liabilities: Deposits 87 87 Borrowing 1 123 Equity 30 30 Total liabilities 118 240 Ratios: Loans/total assets % 55 73 LDR 0.75 2.01 Liquidity/liabilities % 52 22 CAR % 38.7 15.5 Source: Consultant calculations
50 Column “B” shows a much larger loan portfolio and a higher level of rural financial intermediation. The larger amount of lending (2.7 times greater) provides scope for a more diversified loan portfolio that can include, and encourage, microcredit. The LDR of column “B” can move towards 0.75 later but this would be the result of (i) a need to increase deposits as a source of funds, and (ii) a growing demand from customers for a more diversified range of deposit instruments that includes term and savings deposits and current accounts needed to facilitate electronic banking. The changes need to be market driven. 41 Agricultural Bank of China Annual Report 2012.

13
b. Ownership and management issues 51 Under regulations, banks are encouraged to be the main shareholder of a VTB. Although the regulation specifies a minimum holding by a bank of 15%, in practice, for control purposes, banks will hold more than 50%. There are a number of issues that arise from this regulatory requirement and these tend to lead to the VTBs being operated as branches rather than as separate institutions. 52 Establishing a single new financial institution (VTB) and setting up financial service outlets in rural and less-densely populated urban areas is costly and has a longer cost recovery period than establishing bank branches. Close control over costs and the locations of the service outlets is essential and can not be guaranteed under a minority shareholding. Furthermore there is the concern that the new service outlet will draw business away from an established bank branch operating in the same area. Market segmentation is a challenge. 53 The founding bank will seek to ensure that the operating procedures of its VTB subsidiary are of an acceptable standard. This usually means that the procedures of the founding bank are copied into those of the VTB. There can be disadvantages in this particularly where they affect the operating autonomy of the VTB. The clientele of the VTB may be different from those of the parent bank and consequently the VTB manager needs to have more discretionary authority than, for example, a bank branch manager. This applies especially to micro loan management where loan decisions are made in less than a week and are often based more on borrower enterprise cash flow than borrower asset security. 54 There are substantial benefits in a VTB having a strong parent bank. Without strong institutional backing, a VTB will have difficulty in the mobilization of deposits. Since VTBs are not part of the bank clearing system they rely on correspondent banks to provide related electronic banking services to their customers. Through a parent bank, the VTB will be able to provide customers with electronic loan repayment services, money transfers into and out of customer accounts and access to ATMs and POS outlets. b. Regulations and supervision 55 VTBs may engage in some or all of the following businesses with the approval of the CBRC local offices:
(i) taking deposits from the general public; (ii) granting short-term, medium-term and long-term loans; (iii) handling domestic settlements; (iv) handing the acceptance and discounting of negotiable instruments; (v) engaging in inter-bank lending; (vi) engaging in bank card business; (vii) acting as an agent for issuing, honoring and underwriting government bonds; (viii) acting as an agent for receipt and payment of money and for insurance firms; (ix) other businesses as approved by the banking regulatory authority.
56 A VTB can act as an agent for financial institutions including policy banks, commercial banks, insurance companies, and securities firms in accordance with applicable regulations and rules and is entitled to open branches within its mandated operating area. 57 The outstanding balance of loans made to a person may not exceed 5 per cent of the VTB’s net capital. The credit balance authorized to a business group customer may not

14
exceed 10 per cent of the VTB’s net capital. The capital adequacy ratio shall be no less than 8 per cent at any time and its adequacy ratio of provisions for impaired assets shall be no less than 100 per cent. Prior to the removal of interest rate caps, a VTB was allowed to charge an interest rate on its lending that was up to four times the loan interest cap set for banks. There are a number of regulatory and operational concerns facing VTBs. These are listed as follows: 58 Capital requirements: the small amounts of required registered capital facilitate market entry but are irrelevant for institutional investors such as banks that are looking for larger-sized investments and are required to take up VTB ownership. Nor is the small minimum capital requirement consistent with the full list of business activities allowed for a VTB. Furthermore, the capital adequacy ratio needs to be revised upwards to (i) take Basel III recommendations into account, and (ii) take into account the managerial and financial risks associated with small and semi-autonomous financial institutions.42 59 Loan to deposit ratio: the initial five year exemption from the LDR ceiling of 0.75 raises uncertainty concerning the financing of asset growth especially since many startup VTBs have a LDR of around 2.00 and find it difficult to raise rural deposits – especially in poorer areas. There may need to be a different LDR ceiling, if any, set for VTBs that allows them to service localities with low income and rural households. VTBs should not be seen as simply being mini-banks and should not have administrative limits set on their loan growth. To ensure their financial stability and encourage credit growth, VTBs should be allowed to borrow (preferably on medium to long terms) and this debt should be related to debt servicing capacity, not deposit-taking. Rather than rely on an LDR indicator, deposit-taking limits should be related to the amount of equity held by the VTB. 60 Deposit insurance: when deposit insurance is introduced, special arrangements will be needed to allow the participation of VTBs. In particular a liquid refinancing mechanism will be needed that is accessible in the event of deposit runs. VTBs at present do not have direct access to the inter-bank money market. 61 Credit bureau access: arrangements are needed, not only to allow VTBs to access credit information on their own account, but also to input information about their own borrowers. At present this data flow occurs only through agreement with the VTB founding bank(s). 62 Operational concerns and opportunities: There are three related issues: (i) VTBs do not participate in the bank clearing system and rely on correspondent banks (if available) to access required services. (ii) apparently most VTBs rely on the IT platform of their parent bank for their management information system and many of these systems are not suitable for VTB operations. Since appropriate IT systems are quite expensive (especially if the VTB is carrying out all allowable business activities), they may need to be rolled out for, and shared by, a number of participating VTBs and this suggests the need to achieve a scale of operations and the need for ownership, by a bank and investors, of many linked VTBs, and (iii) in turn this raises the need for specialist and well-trained staff. 63 In May 2010, CBRC issued guidelines that allow banks that own at least 30 rural financial institutions (VTBs) to consolidate these VTBs under a single management unit. At present there is no legislation that allows a holding company to own independent legal financial institutions – this may be promulgated in the future. While this guideline helps to meet the operational concerns raised above, it needs to be checked whether it fully enables VTBs to participate in the payments and settlements and national credit reference systems. 42 As at February 2014, the aggregate VTB CAR was 23.6%.

15
64 There can be significant investment and operational benefits to encourage banks to participate in VTB holdings – not simply as part of a branching structure but as fully autonomous institutions. Firstly, it allows a bank to adopt a more appropriate and differential pricing of financial products. A focus on micro and small lending requires a different approach to loan evaluation and management compared to medium-large loans. This is especially the case for non-collateralized or group lending. A VTB can become cost-efficient in micro and small loan management and direct larger loans to a parent or partner bank. Cost efficiencies also occur through a lower wage structure for staff and less elaborate office setups including sub-branches. Product pricing for rural customers that takes into account distance for travel and competition from other institutions is quite different from the product pricing for urban customers. There are many international examples of VTB-type MFIs that make microloans, reach large numbers of low-income households, return more than 20% on equity, and maintain a CAR greater than 15%. 65 Taxation: Compared with cooperatives, VTBs operate at a tax disadvantage as they are required, as are banks, to pay the 25% income tax for which cooperatives are exempt and pay a 5% business tax compared to 3% for the cooperatives. If VTBs were to service lower income households and businesses, especially in rural areas, some tax relief could be justified. 66 Market information: At present it is difficult for a VTB investor or financier to obtain information about financial services currently provided at provincial and county, and below, levels. This information is needed to enable investors to set out business plans, determine the feasibility of such investments and calculate the amounts and sources of financing needed. This concern over lack of information applies to the development of all rural financial services. 7. Loan Companies 67 Loan companies are the third type of new financial institution. There were 6 of these companies with 45 staff at the end of 2008 and 14 companies at the end of 2012. No other data has been discovered. They do not appear to exhibit substantial growth. Their institutional arrangement and financial products on offer suggests they face substantial competition from the more loosely regulated MCCs. D. Non-Banking (Shadow Banking) Institutions
1. Description of and Concerns Over Shadow Banking
68 Shadow banking can be defined broadly as all credit intermediation involving entities and activities outside the regular banking sector.43 Table 6 sets out a list of institutions involved in such credit intermediation. The table splits shadow banking into three sections in diminishing order of risk to the banking sector.44 This shows that broad shadow banking at the end of 2012 was equivalent to 43% of total loans outstanding in the banking sector compared to 34% end of 2010. The increase in amount of shadow banking is at least partly the result of monetary tightening and regulations imposed on banks that include (i) the LDR restriction, (ii) the (now discontinued) interest rate cap on lending by commercial banks, (iii) a capped band of interest rates payable on deposits, and (iv) quotas and controls on bank lending that have lead to banks providing finance through less formal and alternative
43 This is a definition provided by the international Financial Stability Board (FSB), located in Basel. 44 For a full description of the credit intermediation products see the source document.

16
channels. The growth in wealth management products (WMPs) and lack of transparency is mentioned as a concern.45 69 The growth of peer to peer (P2P) investing and lending, linked to WMPs, through internet services is not reflected in Table 6 as much of this has occurred from 2013 onwards. P2P is described further in paras. 87-92 below.
Table 6: Composition and Growth of Shadow Banking: 2010-2012 Credit intermediation products 2010 2012
CNY CNY % Entrusted loans CNY trillion 4.3 6.5 18.3Trust loans " 1.6 3.0 8.4Informal lending " 2.9 3.4 9.6Off-balance sheet banks' WMPs " 1.1 2.8 7.9WMPs by securities firms " 0.1 1.2 3.4Credit by financial guaranty companies " 1.1 2.3 6.5Financial leasing loans " 0.3 0.6 1.7Microcredit company (MCC) loans " 0.2 0.6 1.7Pawn shop loans " 0.1 0.1 0.3
Core shadow banking " 11.7 20.5 57.7Finance companies loans " 0.8 1.0 2.8Undiscounted bankers' acceptances " 4.8 7.3 20.5Asset-backed bonds " 0.01 0.03 0.1
Broad shadow banking " 17.31 28.83 81.1Corporate bonds " 3.6 6.7 18.9
Non-bank credit intermediation " 20.91 35.53 100.0
Loans outstanding: banking institutions " 50.92 67.29 Core shadow banking comparison % 23 30 Broad shadow banking comparison " 34 43 Total non-bank credit intermediation " 41 53
Source: Moody's Investor Service, 13 May 2013 and PBOC Annual Statistics WMP = wealth management products 70 As Table 6 indicates, the risks of shadow banking relate mainly to the commercial banks. There are, however, spillover risks that can affect smaller financial institutions that provide agricultural and microenterprise financial services - especially MFIs such as microcredit companies (MCCs) and VTBs that are linked to banks either through borrowing and/or through equity ownership. These MFIs could be influenced to take over some of the lending of banks that either face lending restrictions due to the LDR or are unable to properly price riskier loans. Loans that are small for a commercial bank will be outside the management capability of MFIs that lack legal and valuation skills thus leading to loan losses. Since MFIs could use credit guarantee companies (CGC) to offset risk, closer reporting and monitoring of CGCs is also warranted.
45 Compared to Table 6, the China Monetary Policy Report first quarter 2013 shows CNY 6.7 trillion invested in 31,000 WMPs as at end of 2012: an increase of 64.4% over the previous year.

17
71 As at the end of 2012 in the shadow banking sector, there were 6,080 microcredit companies (MCC) with a loan balance CNY592.1 billion; 6,084 pawn shops, with a pawning balance CNY70.61 billion and more than 8,590 CGCs. In addition there were 16,000 pilot projects of impoverished villages mutual development funds - a few of which are organized as MFIs – with combined lending of less than CNY1 billion. 72 MFI safeguards that include improved reporting and monitoring of loan size and safer CARs or debt to equity ratios may be needed. Improvements may be needed in the systems of off-site supervision or control of MFIs. Care is needed, however, to ensure that the regulatory compliance cost to MFIs is minimal and does not lead to an increased cost of financial intermediation as MFIs can play a valuable role in the provision of financial services to low-income households, farmers and microenterprises. 2. Microcredit Companies
a. Present status and conditions
73 A MCC is legislated as a non-deposit-taking company set up by a natural person, legal person or other social organization, mainly doing the business of microlending. MCCs exist under regulations issued by CBRC in May 2008 following pilot testing by PBOC that started in 2005. As at the end of 2013, there were 7,839 MCCs with total capital of CNY713.3 billion and loans outstanding of CNY819.1 billion. Tables A.4.a and A.4.b contain information on the numbers of MCCs by province as at September 2011 and September 2013. Over the two years, lending through MCCs has doubled and the number of MCCs has almost doubled. The paidup capital of the MCCs increased by CNY282.82 billion from September 2011 to September 2013. The increase in lending was CNY417.5 billion. This shows that most of the increase in lending was funded by the equity capital increase: total lending was 1.13 times capital. 74 The ratio of lending to capital investment has changed significantly for MCCs in Hainan, Henan and MCCs in the municipalities of Beijing, Shanghai and Tianjin. Over the last three months of 2013, for example, the increase in lending in Hainan was more than 15 times the increase in invested capital compared to a ratio of 1.05 times in September 2013. Such a large change could be related to the growth in internet banking referred to later in paragraphs 87-92. Against such increases, MCC lending in seven provinces declined in the last three months of 2013. 75 On a provincial per capita basis, the amount of MCC lending tends to be more as GDP per capita increases and decreases as the proportion of agricultural population increases. In 11 provinces with an average 84% of agriculture population, the average GDP per capita is CNY24,340 and the average MCC lending is CNY351 per capita. In 15 other provinces with an average 57% of agriculture population, MCC lending is CNY685 per capita compared to a GDP per capita of CNY41,878. These figures indicate MCCs are not reaching poorer locations. MCC lending has exceeded these statistical indicators in Guangxi, Anhui, Sichuan and Jiangxi provinces but apparently under-performed in the wealthier Shandong, Jilin, Heilongjiang and Guangdong provinces. 46 76 The regulation of MCCs is under the mandate of PBOC but carried out through the provincial governments that appoint its financial service or other relevant authority as the regulator. This is usually the Provincial Office for Financial Affairs (POFA). The regulation, supervision and reporting requirements of MCCs are not standardized nationally and are not consistently adequate. Since CBRC does not supervise MCCs it does not include them in its
46 No information is available on the allocation of credit to agriculture or rural households or on the number of borrowers in total and by sector.

18
statistics on banks and nonbank financial institutions. CBRC is, however, studying ways to improve the regulation and oversight of MCCs.47 At present the MCCs do not have access to the credit information bureau except for the pilot financial reform zone in Wenzhou where PBOC has granted 15 MCCs in Wenzhou access to the credit information system as a trial. 77 An MCC can have the legal form of a limited liability company or a joint stock company and its shareholders can be a natural person, an enterprise, legal person or a social organization. MCCs must have a minimum registered capital of CNY5 million or CNY10 million, depending on whether the entity is registered as a limited liability company or as a joint stock company (JSC). There are differences between the provinces with minimum limited liability company capital being in the range of CNY5-50 million and for JSCs CNY10-100 million. Provinces have also set their own requirements for founder qualifications and for maximum shareholding for an investor (ranging between 10-40% of capital). There are also restrictions on share transfers within the first three years of operations and on increases in share capital. 78 The process of application, approval and registration of an MCC is not easy. First, an official application shall be filed with the provincial authority in charge. After approval, founding investors have to apply for a business license with the local Administration for Industry and Commerce (AIC). Additionally, permission must be obtained from the public security authority, the CBRC and the PBOC. This process involves many steps at the provincial level. MCCs eventually have to apply at county level to obtain a license to operate in that county. If they wish to extend their operations to another county, they have to apply again and another independent entity has to be set up. An elimination of this re-registering process and the ability to operate at the provincial level would allow MCCs to serve more customers and to realize economies of scale. 79 The high capital requirements and difficult licensing procedures may be considered unnecessary for firms in which the shareholders bear all the risk. If these measures are designed to prevent “credit runs” and associated systemic risk there are other procedures and requirements that can be applied in a more cost-efficient manner. The involvement of MCCs in P2P activities does, however, pose investor and reputational risks. 80 An MCC loan to one customer can not exceed 5% of its net capital. Some provinces have gone beyond this and require that their MCCs provide a certain percentage (around 70%) of their capital to agricultural clients and limit the credit balance to individual customers to 1% of capital and, in some cases, have set a maximum loan size. Since the average size of equity capital per MCC by province is between CNY21-287 million (excepting Qinghai and Tibet), the maximum loan size to an individual can be within the range of CNY210,000 to CNY2.8 million. Apart from the donor-supported MCCs, there is no adherence or recognition of Responsible Lender guidelines.48 81 There are restrictions on funding. The base rule stipulates that major capital sources of an MCC shall be the capital contributed by its shareholders, plus donated capital and additional capital that can be financed by no more than two banking institutions. Furthermore, the balance of capital financed by banking institution(s) shall not exceed 50% of the net capital of an MCC. Such a debt: equity ratio of 0.5 : 1.0 severely restricts the borrowing capacity of an MCC.49 This does not seem to be the only restriction. As at October
47 CBRC has no authority over provincial governments. Furthermore a bank loan to an MCC is regarded by CBRC as a loan to a commercial company; not a financial institution. 48 The guidelines commonly cover the ability of the borrower to repay the loan, transparent costs of loans, a right of redress through a complaint mechanism, and appropriate loan design. 49 Internationally, well-performing MFIs have debt : equity ratios up to 5.0 : 1.0.

19
2010, total borrowing of MCCs was only CNY17 billion and less than 9% of total equity funding. This suggests a difficulty for MCCs to borrow funds from banking institutions. 82 In March 2012, ADB announced the Microfinance Wholesale Lending Facility50 of CNY130 million. The project outputs are (i) development of selective partner banks' wholesale lending capacity to MCCs, including establishing prudent business processes and safeguards to ensure both financial and social performance of MCCs; (ii) strengthened financial and institutional capabilities of MCCs, including enhanced gender equity aspects; and (iii) effective regulatory oversight for the MCC market through strengthened relationships among MCCs, local banks, and local government regulators. 83 Banks are reluctant to lend to MCCs because very little is known of their legitimacy of operations, governance, internal controls and performance. This reluctance is supported by perceived deficiencies in their system of supervision and their enforced compliance with regulations that can vary by province. These deficiencies will also stand in the way of MCCs seeking to issue bonds. These concerns may also restrict the access of MCCs to the bond market, which was encouraged in a PBOC circular 7 January 2014.
b. MCC business models and relationships to internet funds
84 MCCs are taxed as commercial entities and have to pay 5.5% sales tax plus 25% enterprise tax on income. MCCs can be grouped into four broad business models. The number of MCCs within each of these business models is unknown. One model, closely linked to local government, comprises MCCs with a focus on development. Loan sizes are around CNY2 million. A second model is MCCs that operate similarly to money lenders and charge interest rates as high as 40% on loans that commonly range in size from CNY10,000-500,000. A third model is the donor-supported MCCs that generally make loans of less than CNY50,000 and charge up to 2% per month on lending. This is the only model that fits the government-intended mandate of rural small lending. There are less than 20 of these MCCs. The fourth model does not follow the more traditional MCC concept - it is the fastest growing group of MCCs that is involved in peer-to-peer (P2P) lending and borrowing through the internet. There are also businesses that are not registered as MCCs that operate in P2P lending. 85 Since the public are not aware of the differences between these MCC models, there is some reputational risk associated with the MCC concept. The fundamental operating differences between the different MCC business models also explain the difficulty of establishing a standardized and cost-effective system of regulation, supervision and monitoring of MCCs. There do not appear to be clear operating boundaries between MCCs involved in P2P lending to identified clientele and internet-based financiers involved in P2P lending to clientele through wealth management funds. 86 The provinces with the greatest numbers of MCCs are said to be working to establish a ratings infrastructure for MCCs and some system of differentiation. Some areas, such as Tianjin, already require a yearly rating report and audit report to be submitted to the local POFA. Additionally, in Jiangsu, Inner Mongolia, and Yunnan, POFAs either own state-owned enterprises that do ratings or have internal rating standards and schemes for regulatory purposes. 87 P2P institutions, including wealth management funds and MCCs, are a part of the internet banking system that has developed outside the official banking sector to meet a demand for “microcredit” that is not being met by the banks. This segment of shadow banking comprises about 1,000 P2P institutions that include large players such as Lufax, 50 ADB Project Number 45907-014.

20
Renrendai, and Ali Finance (which is part of the Alibaba group). The essence of P2P lending is borrowing or lending money through the Internet. Most of the loans are non-collateralized. 88 The most successful P2P model is the Alibaba Yu’e Bao wealth management fund. Within six months, following a start-up in June 2013, the fund reached 43.03 million users in more than 2,000 counties and cities in 31 provinces. With investor funding of CNY185.3 billion, Yu’e Bao is the largest single public fund in China. The fund allows small investments of as little as CNY1 whereas wealth management funds operated by banks usually require a minimum investment of CNY50,000. Interest rates paid to investors can vary and can be as high as 7% per annum. Returns are much higher than the 0.35% interest rates offered by major banks on current accounts and the 3.25% rate for one-year deposits. Following the success of Yu’e Bao, Baidu, which operates China’s most popular search engine, has launched its own online wealth management product – Baifa. Another Internet firm, NetEase, has launched a similar product named Tianjin. Lufax, another P2P firm operating for more than 12 months, attracts funds by paying 8.6% to investors and onlends these funds to enterprises by adding on a commission of 2% per month. Loans sizes are in the range of $8,000-160,000 and the minimum investment in Lufax is $1,500. 89 In the MCC P2P model the majority of MCCs are lending to a relatively small number of borrowers (10-15) that the MCC owners know well or are able to obtain valid credit information on. P2P institutions also assist investor/lenders to find borrowers and charge a commission for this service. The better P2P institutions also provide an evaluation of borrowers so as to reduce credit risk and this evaluation is often based on a computerized system of risk assessment. 90 The annual loan turnover of P2Ps has grown from CNY5.6 billion in 2012 to reach CNY105 billion in 2013.51 Their average onlending rate is 19.7%. The limited access to credit information of individual borrowers on P2P platforms raises credit risk as does inadequate risk diversification and a predominance of investment by the MCCs in risk (loan) assets. There have also been suggestions that funds from new investors are simply providing liquidity needed when prior borrowers are not repaying loans on time – as in a Ponzi scheme. 91 In 2013, 74 P2Ps became bankrupt 52 with CNY1.5 billion in overdue loans due to increased P2P competition and risky lending practices. Lufax management indicated that bad loans, on an industry basis, were about 1% of total P2P lending in 2013 but expects this proportion to increase steadily to not less than 6%.53 Some observers forecast up to 90% of P2Ps could become non-viable. The P2P industry is vulnerable to changes in government liquidity policy and the impact of this on borrower repayment. 92 China Commercial Credit is an example of an MCC that has established a P2P unit that charges a commission of 1-2% to match lenders with borrowers. China Commercial Credit is developing a business model whereby a partnering MCC would provide a loan guarantee at an additional cost to the end-borrower of 4-5%. Total loan charges paid by the end-borrower would be 24-30%. The target is to reach CNY1.5 billion in lending by 2016. At the end of 2013, China Commercial Credit had CNY560 million in loans with 2.3% of these being non-performing.
51 According to the website www.wangdaizhijia.com. These amounts are still small in relation to CNY72 trillion in lending through the banking system. 52 Information on the number of these that were MCCs in not available. 53 Lufax CEO interview with Bloomberg 14 January 2014.

21
c. MCC transformation to a village or township bank
93 To overcome problems of access to funding, an MCC has an option to transform into a VTB in accordance with procedures established by CBRC as follows:
(i) MCCs must have operated for more than three years; (ii) MCC must have been operating profitably for at least two years; (iii) MCCs must accurately classify risks with a NPL ratio less than 2%; (iv) MCCs should have a full provision for bad loans and the adequacy ratio of
loan-loss provision must be over 130%; (v) During the last four quarters, the ratio of loan balance to total assets should
exceed 75%. All of these loans should be provided entirely in the county; (vi) The ratio of agriculture-related loan balance to total loans during the last four
quarters should not be less than 60%; (vii) The mortgaged assets of the MCCs should not exceed 10% of total assets.
94 As at March 2014, no MCCs have transformed into a VTB arrangement. There are business constraints to the transformation of an MCC to a VTB. 95 Firstly, MCCs operating successfully as P2Ps are unlikely to need deposits as a source of funds. In the reporting of P2Ps the use of the word depositor and investor is inter-changeable. Furthermore, if a P2P MCC were to become a VTB, there would be problems of investor or depositor flight that could be difficult to address through a deposit insurance fund: their sources of funding could be highly volatile. 96 Secondly, there is little point in a MCC transforming into a single VTB that is not allowed to expand its operations beyond its geographical county area of registration as this geographic limit is already faced by an MCC. Since the average equity of an MCC is almost twice that of a single VTB a limit on the operating boundary is a concern. The eventual VTB would be over-capitalized in relation to lending opportunities. 97 Thirdly, the formation of a VTB requires a founder bank to hold not less than 15% of the shares in the new VTB. It is unlikely that a bank would be prepared to accept a minority position. This means that a founding bank would want at least 50% of the VTB shares and this would require the MCC shareholders to accept a minority position and, possibly, a dilution of share value. Logically, MCC owners are unwilling to consider such a transfer and loss of control. 98 An alternative, as practiced in other countries, would be to allow an MCC to take a majority shareholding in a VTB or, preferably, a group of VTBs. Minority shares could be held by bank/institutional shareholders that would provide management and IT expertise.54 There are a small number of MCCs in China that would be able to make such a transition. These need to be identified and encouraged to make the transition. Regulatory and supervisory changes will be needed. This is discussed in the next section.
d. The need for a sustainable and evolving MCC to VTB model 99 There are both short term and longer term aspects to the financing of microcredit growth. MCCs have been restricted by regulations that limit borrowing to 50% of their equity. This has meant that most asset growth has been funded by increases in equity rather than through borrowed funds. The increased loan outreach of MCCs has been achieved in the past by the granting of a large number of MCC operating licenses. To offset geographical 54 The best example of this ownership and transformation is the ACLEDA Bank in Cambodia that started life as an NGO/MFI and is now the second largest bank in Cambodia.

22
operating restrictions, MCCs obtain profit through non-disclosure of the real costs of loans, by making large loans, and by earning fees and commissions on transactions through P2P activities. Current regulations do not encourage MCCs to act responsibly and do not encourage MCCs to meet credit needs of low income households and smallholder farmers. 100 Since traditional MCCs are not allowed to borrow more than a fixed proportion of their equity, asset growth can not increase at a rate more than their earnings rate. Under this conservative model, the rate of earnings regulates loan growth. If retained earnings are 7% of equity each year then loan growth is also restricted to 7% per annum unless there is a relative increase in debt liabilities. 101 The microcredit potential in PRC suggests a 30% annual growth rate in lending is feasible. To enable such a growth rate not only requires an increase in the retained earnings of MCCs but also a change in the method of financing asset growth. It is suggested that MCC borrowing be related to the value of assets held by MCCs. Since the major asset of an MCC is usually its loan portfolio, then the amount of borrowing would be related to the net value of the loan portfolio. 102 An analysis of four MCCs55 that are addressing credit needs of low income households shows their potential for expansion.
(i) individually they reach 1,000-8,600 borrowers with average loan size in the range of CNY28,000-48,000. Annual growth in number of borrowers is 17-22%;
(ii) their lending interest rate is close to 23% and their operating expenses, not including
cost of funds and loan loss, are an average 13.5%; (iii) they earn a profit in the third year following startup and by year five have a return on
equity of more than 14%;
103 The aggregate summarized financial statement of the four MCCs is:
CNY million Loans outstanding 436 Total assets 494
Borrowing 177 Total liabilities 29 Total equity 288 Number of active borrowers = 14,000, average loan size CNY31,000 104 These four MCCs have a combined equity base of CNY288 million and a CAR of more than 60%. They have the capacity to service borrowings of CNY490 million which represents 70% of a CNY700 million loan portfolio. Such a loan growth of 60% becomes feasible with the removal of the borrowing to equity restriction. To scale up to reach one million borrowers and CNY31 billion in lending would require CNY22 billion in borrowing. 105 Relevant authorities, including CBRC, need to identify and promote the activities of MCCs (and PAMFIs) that meet the financial needs of rural households and devise ways that would enable them to also provide deposit services. Regulations will need to be adjusted, 55 These are being supported by MicroCred China (Groupe PlaNet Finance), Accion International, and Opportunity International China. These organizations have vast and successful microfinance operational experience.

23
and supervision and reporting improved, to allow better-performing MCCs as VTB owners to expand their geographical outreach. 3. Credit Guarantee Companies 106 Credit Guarantee Credit Guarantee Companies56 (CGC) emerged after the passing of a Law on Credit Guarantees in 1995 and were encouraged to develop in order to support government policy persuading banks to lend to SMEs and disadvantaged groups. CGCs are in three forms (i) policy CGCs, essentially related to national and provincial government programs; (ii) mutual CGCs that are mainly funded by contributions from local industrial and commercial federations, private enterprise umbrella associations, and local governments; and (iii) commercial CGCs that target successful local MSEs, especially those that are in need of medium-term growth and short-term working capital. CBRC regulations state that the cost of a credit guarantee cannot exceed 50 percent of the benchmark lending rate – in effect 3%. 107 The National Development and Reform Commission (NDRC) is responsible for CGC national policy formulation, planning, development and approval of new programs.57 Furthermore, a range of different ministries and agencies take the lead in sponsoring the creation of policy CGCs for the specific social groups under their patronage. In 2009, CBRC exercised its supervisory functions mostly on commercial CGCs leaving policy and mutual CGCs primarily to report to their sponsoring ministries or local governments. At the time, there was an expectation that CGCs of all types would be mainstreamed under the formal regulatory framework of CBRC. 108 KPMG58 reports that, during the credit rating review process of observed banks, where a borrower has a credit score insufficient to meet the internal requirements for a bank loan, the bank will reject the loan application. However, if the proposed borrower is close to an acceptable mark, the bank may offer the borrower the option to engage an approved CGC to purchase a credit guarantee. In the second scenario, if a borrower’s collateral is insufficient to meet the loan to value requirements of a bank, the bank may then exercise the option to require the borrower to purchase a credit guarantee. Guarantees are mainly provided on an individual borrower, rather than a loan portfolio, basis. 109 KPMG also noted that banks are conscious of the repayment risk of a CGC and will typically restrict their relationships to a limited number of vetted and approved credit guarantee companies with a preference for the 19% of CGCs that are state-owned. These CGCs will usually have registered capital of between CNY100-300 million. 110 Table 7 below shows the growth of CGCs 2009-2011. In 2011, 84% of CGC guaranteed lending was to an estimated 205,300 SMEs with an average loan guarantee per borrower of CNY4.8 million. This was equivalent to 4.5% of total SME lending of CNY21.77 trillion at that time and less than 1% of the estimated 13 million MSEs with bank loans. The size of CGC-guaranteed loans indicates that borrowers covered by CGCs tend to be small to medium, rather than micro, in size. From 2010 to 2011 there was no increase in loan guarantee per CGC (CNY150 million) nor in number of borrowers per CGC (28). 56 This section does not include the unofficial/informal non-credit guarantee firms that are not authorized to provide guarantees against loans provided by banking institutions. Non-CGCs have collected deposits and borrowed funds from the public in defiance of government policy and government is looking for ways to curtail their activities. In 2010 there were an estimated 13,000 non-CGCs with guarantees of CNY840 billion. 57 For example: The Outline of the Plan for the Reform and Development of the Pearl River Delta (2008-2020). The National Development and Reform Commission, December 2008 planned to set up credit guarantee funds for medium and small enterprises and regional re-guarantee institutions. 58 KPMG Banking Survey 2012.

24
Table 7: Growth of Credit Guarantee Companies 2009-2011
2009 2010 2011
CGCs: No. 5,547 6,030 8,402 Total assets CNY billion n.a. 592.5 931.1 Total net assets “ “ n.a. 479.8 785.8 Bank loans guaranteed “ “ 555.1 911.8 1,174.7 SME loans guaranteed “ “ 405.8 689.4 985.7 Other loans guaranteed “ “ 149.3 203.7 289.0 SME Loans guaranteed: No. 89,700 142,000 205,300 Source: CBRC News Bulletins 111 Information on the performance of 5,547 CGCs is provided for 2009.59 There were 5,938 loan defaults for an amount equal to 0.28% of the total guarantee and 0.88% of CGC total capital of CNY338.9 billion. The average default claim was CNY501,800 and the charge rate was mainly in the range of 1%-2% of the guaranteed loan amount. Apart from the commercial CGCs, the volume of guaranteed lending was often not more than 1% of the loan portfolio of the financial institutions using CGC services. The aggregate net profit after taxes for the CGCs was CNY4.45 billion which was less than 2% of their paid up capital. 112 A cursory review of the CGCs indicates the following:
(i) they are not addressing the needs of lending to micro to small borrowers as guarantees based on due diligence focus on larger firms and there has been no effort in devising systems of guarantee appropriate for smaller firms;
(ii) their outreach in terms of total number of MSE borrowers and number of borrowers per CGC is very small;
(iii) both their profitability and profit retention required to build reserves are inadequate.
113 There may be substantial differences in operating performance between the three types of CGCs. Policy CGCs are characterized by a strong government presence in both funding and administration.60 While all CGCs combined reported an overall profit in 2009, this was mainly the result of the profits achieved by mutual and commercial CGCs as most policy CGCs operate at a loss and survive as a result of government subsidies. These differences between the CGCs need to be analyzed in detail because there appears to be substantial potential to expand the outreach of well-performing CGCs especially in rural microlending. 114 Commercial CGCs are attracting foreign investment. Working with local branches of BOC, the Fullerton Investment & Credit Guarantee Co. Ltd has operated in the SME credit guarantee sector since 2008. Fullerton charges an average 3% commission and reportedly became profitable after two years of operations. The Zhenzhen Credit Orienwise Group, known as the first comprehensive non-governmental corporation in the business of guarantees, investment and consulting, has attracted investments worth $100 million from a number of foreign investors, including ADB, Carlyle, Citigroup and GE.
59 Working Group on Inclusive Finance in China: Guarantee Funds for Inclusive Finance in China. China Papers on Inclusiveness No. 3 April 2011, by Peter Situ. 60 As at 2004, all of the 2,188 CGCs were financed by government.

25
4. Microfinance Institutions – Poverty Alleviation Focus 115 Such MFIs (designated as PAMFIs in Table 2 above) have relatively little outreach in the PRC. They tend to depend on foreign equity and borrowing for their growth. A review of the largest MFI, China Foundation for Poverty Alleviation (CFPA), shows the operational strengths and weaknesses of PAMFIs. 116 Over the period 2008 to 2012, the loan portfolio of CFPA grew from CNY104 million to CNY837 million. The number of borrowers increased from 26,900 in 2008 to reach 130,700 in 2012: an annual increase of 37%. More than 90% of these borrowers are women. The average loan size is CNY6,550 and there are 260 borrowers per staff. Operating expenses are 13% of the loan portfolio. All of these indicators are very good by international standards. Tables A.5.a. and A.5.b.(attached) contain the financial statements and performance ratios for the foundation. 117 Financing of asset growth over the last four years has been through borrowing (77%), increased equity (20%) and retained earnings (3%). The loan portfolio is now 95% of total borrowing. There is no longer the possibility to borrow more in the near future as there is insufficient collateral margin on the loan portfolio. Continued growth is therefore dependent on increased injections of equity and, given the relatively low earnings rate, additional equity will be difficult to find. At this juncture, it is normal for such an MFI to obtain permission to become a deposit-taking institution but this is not an option in China unless the MFI chooses to become a VTB. And this option could be difficult as there may be a limit of 20% on ownership of CFPA in the new VTB.61 This financing conundrum eventually faces every successful MFI just as it faces the MCC system. It highlights the need for a good return on equity, access to long term borrowing and, eventually, deposit mobilization.
III. POLICY, REGULATION, SUPERVISION AND CONTROLS 118 In June 2012, CBRC held the meeting of Rural Small and Medium-Sized Financial Institutions in Quanzhou, Fujian to initiate three projects of (i) financial inclusion in villages and communities, (ii) transparent credit, and (iii) financial innovation for rural residents.62 This initiative is to replace the traditional one-dimension credit demand by a more diversified demand that includes savings, borrowing, clearing, and asset management. The former funding needs related to traditional agricultural production are to be broadened into structural funding needs covering business expansion, consumption and education. The new initiative recognizes and aims to meet the need of rural customers for more financial education including detailed information on financial knowledge, financial products and market development. 119 The initiative can be seen as an acknowledgement of the need to support financial institutions that are able to provide a full range of financial services, not just credit, and are able to work closely with rural households and businesses to improve their financial literacy and access to services. This in turn suggests that for credit-only institutions such as MCCs, and to a certain extent RMCCs, have to develop closer operational linkages with full-service banking institutions. It also suggests the need to develop the potential of VTBs to provide a more complete set of financial services. The ability of these financial institutions to provide electronic banking services, and the implementation of appropriate supervision and controls, will be of key importance. 61 In many internationally successful transformations of MFIs in banks or deposit-taking institutions, the original NGO owner holds a majority share of the newly formed institution. 62 Mr. ZHOU Mubing, vice chairman of the CBRC.

26
120 A number of policy, regulatory and control issues could be examined. 121 Full information on services and performance of financial institutions: While the provinces show data on GDP, and urban and rural population, there is almost no information provided, on a provincial basis, of the activities of the new forms of rural financial institutions (i) in terms of numbers and financial values of rural versus urban borrower and deposit accounts, (ii) the performance of their loan portfolios, and (iii) their sources of finance in terms of deposit-taking, institutional borrowing, retained earnings and equity capital. This information is not provided publicly by each legal rural finance institution. At present it is impossible to assess the customer profiles of the institutions individually or in aggregate and difficult to measure their outreach according to number of households or farming and non-farming enterprises. There is no information on loan access by gender – a critical data deficiency given the migration of male workers to urban areas and a rising demand for non-farm microcredit.63 122 Lack of information is a concern from the viewpoints of (i) economic development, (ii) financial inclusion, and (iii) supervision and controls of non-bank rural financial institutions. Without proper data, it is difficult for development agencies and banks to determine where resources should be directed and also to measure the impact of resource allocation. From the viewpoint of efficient financial intermediation it is vital that resources are available to those RFIs that perform efficiently. At present, data provision seems to be limited to total assets, total liabilities, equity and profit after tax. For many financial institutions discussed above in this report, even these data are missing.64 123 Standardized supervision and controls: Prudential requirements for, and the supervision of, MCCs is not standardized on a national basis. It is not known (i) whether MCCs are required to follow a standardized chart of accounts and presentation of financial statements, and (ii) whether there is an adequate system of off-site supervision in place that is able to identify potential areas of risk and cope with the different forms of MCCs. 124 This lack of standardization makes national planning and policy analysis more difficult and less effective. It also makes it more difficult for potential providers of wholesale funds to identify those MCCs that can intermediate funds efficiently to their borrowers. A further, and major, concern is that the absence of a standardized reporting system prevents the incorporation and use of an early warning system that is needed to identify those MCCs at risk (and badly managed) and ensure that necessary steps are taken to rehabilitate them or withdraw their license on a timely basis. 125 Restriction on MCC shareholding: Shares held by any single shareholder (whether natural person, legal person or any other social organization) and any of its related parties shall not exceed 10% of the total registered capital of a microcredit company. This makes it very difficult for a single sponsor to establish an MCC and also makes it more difficult to obtain agreement from the shareholders to transform the MCC into a VTB. 126 Amount of MCC capital and borrowing limits: The average paid-up capital for an MCC, based on June 2013 data, was CNY74.6 million with a range in averages among the provinces of CNY5.0-200 million. In no province was the average debt to equity ratio more than 0.7:1.0. This shows a very low level of financial leverage and intermediation and a high level of aversion to financial risk. The reasons for this conservative approach are unclear. The result is that MCCs are restricted in the expansion of their loan portfolio. 63 RCC loans are usually to heads of households, more than 94% of which are designated as male. 64 In many Asian countries, the banking regulator requires deposit-taking institutions to publish their financial statements through accessible media such as newspapers.

27
127 The loan deposit ratio (LDR): the limit of 75% could be seen as restrictive both for financial institutions prepared to provide wholesale lines of credit to MFIs (such as VTBs, MCCs, RMCCs) and for the recipient MFIs themselves. Furthermore, MCCs are not allowed to borrow an amount that is more than 50% of their capital. The effect of the LDR and borrowing limits should be examined through the use of financial models so as to determine the effects of these regulations on the access of rural households to small-scale financial services and microcredit. 128 Capital adequacy ratio: CBRC has formulated required CARs for banks in response to Basel III. The CARs for various MFIs discussed in this report, however, are not detailed and also appear to be inadequate in the face of their financial structures and potential credit, liquidity and operational risks as well as risk arising from exposure to natural disasters and/or disease. 129 Taxation: Several papers have outlined the apparent inequitable arrangement whereby financial cooperatives are exempt from income tax but MFIs, that could provide smaller-sized loans, are not. The tax regime should take into account the costs to an MFI of the social mobilization that is required as an adjunct to the provision of financial services. Social preparation is highly relevant in the provision of financial services to low income households in more remote locations and where consumers are financially illiterate.
IV. DEMOGRAPHICS OF FINANCIAL SERVICES 1. Provincial Comparisons 130 Provincial data (Table A.6 attached) show an inverse relationship between the amount of primary or agricultural GDP as a proportion of total GDP and income per capita. In general, the provinces with a higher reliance on the primary sector have a lower income per capita. The provinces of Shanxi and Ningxia are exceptions: they have both a low proportion of primary GDP and lower than average GDP per capita. 131 Data was also compiled based on cash revenues and expenditures per capita for rural households for each province as shown in Table A.7a. attached. Table A.7b (also attached) then shows net cash incomes obtained after deducting expenditures from each revenue item.65 These data confirm the inverse relationship between income per capita and agriculture as a source of income. The 19 provinces with below average rural household consumption per capita include all 17 provinces that have a higher than average proportion of agricultural population. Within this group of 19 provinces there are a total of 249 million households of which 197 million are rural or agriculture. The lists and scoring of all provinces, based on Table A.7b, are outlined in Table 8 below. The higher the ranking score indicates a higher number of lower than average indicators.
65 Table A.7c, also attached, shows base data by province for population and proportions of rural and agricultural population.

28
Table 8: List of Lower Income Provinces Based on Household Cash Revenues and Expenses
Below provincial average: Above avg. Ranking Province Cash Consumption Wages Household % agriculture score balance business Households
Shaanxi x X x x x 5 Guangxi x X x x x 5Yunnan x X x x x 5 Anhui x X x x x 5 Qinghai x X x x x 5Gansu x X x x x 5 Sichuan x X x x x 5 Shanxi x X x x x 5Guizhou x X x x x 5 Chongqing X x x x 4 Henan X x x x 4Hubei X x x x 4 Ningxia x X x x 4 Hainan X x x x 4Tibet X x x 3 Hunan x X x 3Xinjiang x X x 3 Hebei X x x 3 Jilin x x 2Jiangxi X x 2 I. Mongolia x x 2 Heilongjiang x x 2Beijing x 1 Guangdong x 1 Shanghai x 1Liaoning 0 Jiangsu 0 Zheijiang 0Fujian 0 Shandong 0 Tianjin 0
Count 15 19 19 18 17 Data source: National Bureau of Statistics 2012. Table derived from Table A.7b attached. 2. Comparison of Urban and Rural Incomes and Expenditures 132 As a result of economic reforms there has been a rapid growth in the urbanization of the population. In 2000, 36.2% of the population was urban; in 2012 it was 51.8%. This has resulted from the migration of rural workers to urban areas. In 2010, 48.7% of disposable income of a rural household was from incoming remittances.66 This indicates the need to
66 National Bureau of Statistics of China. (2011). Basic Conditions of Rural Households, Cat. no. China Statistical Yearbook 2011, Table 10-18, National Bureau of Statistics of China, Beijing.

29
improve access to payment services in rural communities through financial institutions able to provide such services.67 133 Since 2009, there have been significant changes in the rural demography. The rural population has declined steadily from 693.8 million in 2009 to reach 642.2 million in 2012: a decline of more than 2% per annum. This shift has lead to an increased reliance of many rural households on remittances from workers who have moved to urban locations and, possibly, lead to increased unemployment among the rural population among those unable to find work in, or move to, urban locations. In 2006, there were 249 million rural households including 200 million involved in agriculture with 349 million agricultural workers. In 2012 there were about 206-210 million rural households – based on 3.1 persons per rural household. These urban shifts are fully in line with the Government’s policy of urbanization. These demographic dynamics must be taken into account very carefully when assessing the demand and supply for, and the types of, rural and micro financial services. 134 There are substantial differences between rural and urban household incomes. In 2012, the disposable net income per capita for urban households was CNY24,565 compared to CNY7,917 for rural households.68 Differences exist not only in the amounts but also in the sources of incomes as outlined in Table 9 below. Urban household per capita income is almost 2.5 times that of a rural household. The gap has narrowed slightly over the last five years with an annual average growth in urban income of 12.5% compare to 13.7% for rural incomes. The major differences are that wages comprise 64% of urban incomes compared to 31% for a rural household while, conversely, household businesses provide 9% of urban household income compared to 59% for a rural household. The other major difference is that urban household transfer incomes are almost eight times larger than that for rural households.69
Table 9: Household Income Per Capita: Urban and Rural (CNY) 2007 2008 2009 2010 2011 2012Urban households Total income 14,909 17,068 18,858 21,033 23,979 26,959 Wages 10,235 11,299 12,382 13,708 15,412 17,336 Household business 941 1,454 1,529 1,714 2,210 2,548 Transfer income 3,385 3,928 4,515 5,092 5,709 6,368 Property income 349 387 432 520 649 707 Rural households Total income 5,791 6,701 7,116 8,120 9,833 10,991 Wages 1,596 1,854 2,061 2,431 2,963 3,447 Household business 3,777 4,302 4,404 4,937 5,940 6,461 Transfer income 290 397 483 549 701 833 Property income 128 148 167 202 229 249Data source: National Bureau of Statistics Note: Data includes cash and non-cash incomes
67 The cost of internal remittances is high. PSBC, handling most remittances, charges 1% of remitted amount to the sender and 5% to the recipient. 68 National Bureau of Statistics of China. (2011, February) Statistical Communiqué of the People's Republic of China on the 2010 National Economic and Social Development. 69 Transfer incomes mainly include education and health services, pensions and subsidies. Since rural migrant workers in urban locations are still registered as “rural” their remittances are included in rural household wages

30
135 These differences in amounts and sources must be taken into account when considering loan products and access to financial services. An urban household is able to use wages as collateral against a loan and also is likely to pay a lower rate of interest on borrowing: there tends to be more competition among financial institutions in urban areas and urban borrowers have more saleable assets that can be used as loan collateral. It is also likely that much of rural wages is from seasonal and part-time labor and therefore difficult to use as loan collateral. 136 As seen in Table 10 below, there have been changes in the sources of cash revenues for rural households. Wages provided 35% of income in 2012 compared to 32% in 2007 and transfer revenue increased from 10% of total income in 2007 to reach 15% in 2012. Household businesses as a source of revenue declined from 60% in 2007 to become 54% in 2012 – mainly due to a decline in agricultural income. Non-agricultural business sources of revenue, however, increased from 22% to reach 25% over the same period – most of this increase was in trade and transportation. In summary, wages, non-agricultural businesses and transfer incomes have become more important to a rural household whereas agricultural sources of income have declined in importance.
Table 10: Sources of Cash Revenue: Rural Households per Capita (CNY)
2007 2008 2009 2010 2011 2012 Total cash income 4,958 5,737 6,270 7,089 8,639 9,787Wages 1,595 1,851 2,058 2,428 2,960 3,444Household business 2,978 3,370 3,591 3,955 4,810 5,313 Agricultural sales 1,362 1,504 1,678 1,870 2,191 2,481 Forestry 65 72 76 95 119 125 Livestock 806 984 951 985 1,209 1,246 Fisheries 91 102 106 114 118 138 Non-agriculture 655 709 781 891 1,173 1,323Property 101 127 148 168 186 219Transfers 284 389 473 537 683 811Data source: National Bureau of Statistics 137 Table 11 below shows the net income (revenues minus expenditures) for each source of rural household income on a national basis. Over the period 2007-2012, the increase in wages represents 61% of the increase in net income while household businesses account for 33% of the increase. The growth in household business, 75% of which is in the primary sector, has declined in comparison to the increase in household expenditures.
Table 11: Rural Households: Cash Incomes and Expenditures per Capita (CNY) 2007 2008 2009 2010 2011 2012
Net income sources 3,339.6 3,800.1 4,281.2 4,833.9 5,652.7 6,512.4Wages 1,595.3 1,850.6 2,057.8 2,427.9 2,959.7 3,443.5Household business 1,679.4 1,807.9 2,026.1 2,189.2 2,529.5 2,820.2Transfer (9.3) 46.6 87.8 97.7 (10.1) 39.3Property 74.2 95.0 109.5 119.1 173.5 209.4Less: consumption (2,767.1) (3,159.4) (3,504.8) (3,859.3) (4,733.4) (5,414.5)Savings & investment 572.5 640.7 776.4 974.6 919.3 1,098.0Data source: National Bureau of Statistics

31
138 A comparison of provincial GDP per capita (Table A.6 attached) with per capita cash incomes from rural household businesses and wages, and consumption expenditure, shows significant correlation between the four variables. Per capita consumption is highly correlated to GDP per capita. There is a stronger relationship between wages and GDP per capita than between self or family-employed household business and GDP per capita.70 This indicates the need for investment (and lending) in businesses that create employment and wages which, at the rural level, tend to be private sector MSEs. The data are outlined in Table A.7c attached. 139 Data on household consumption show that the fastest growth in expenditures is in medical expenses (Table 12 below). In 2012, the average household spent CNY1,593 (3.1 persons times CNY513.8) on medical expenses: about CNY328 billion over 206 million rural households. For the whole of the country, health insurance premiums amounted to CNY86.3 billion in 2012. This indicates a large potential market for medical insurance. Internationally, many MFIs act as agents in providing their borrowers with access to low-cost health and life cover insurance policies.
Table 12: Consumption Expenses per Capita: Rural Households (CNY)
2007 2008 2009 2010 2011 2012
Consumption expenditures 2,767.1 3,159.4 3,504.8 3,859.3 4,733.4 5,414.5Food 967.6 1,135.2 1,180.7 1,313.2 1,651.3 1,863.1Clothing 192.6 211.1 231.9 263.4 341.1 396.1Residence 540.1 642.3 772.6 801.4 930.2 1,054.2Services 148.7 173.6 204.5 233.6 308.6 341.4Medical 210.2 246.0 287.5 326.0 436.8 513.8Transport, communications 328.4 360.2 402.9 461.1 547.0 652.8Recreation, education 305.7 314.5 340.6 366.7 396.4 445.5Other 73.9 76.7 84.1 94.0 122.0 147.5Data source: National Bureau of Statistics 140 Table 11 (and Table A.7b attached) can be used to indicate loan size and loan repayment capacities. Based on 3.1 persons per household, and national data, the average net income from a household business is CNY8,742. An assumption that 20% of this income would be a safe margin for loan servicing and applying an interest rate of 24% on borrowing, indicates a feasible loan size of CNY7,285.71 If all of the savings and investment surplus of CNY1,098 were available for loan servicing an additional loan amount of CNY14,182 could be serviced making a combined loan size of CNY21,467. The same calculations applied to the 19 poorest provinces (outlined in Table 8 above) shows feasible business loan sizes in the range of CNY3,400-10,000 and an additional loan size based on cash surplus of up to CNY33,800. These calculations indicate there is a substantial demand for rural loans in the range of CNY3,000-40,000. These loan sizes are much smaller than the average loan size of MCCs and VTBs that are in the range of CNY275,000-600,000. 70 CNY1.0 wage per capita has a multiplier effect on GDP per capita of CNY5.4 (1% level of significance) compared to CNY3.9 for household business (5% level of significance). Data based on 27 provinces. Inner Mongolia excluded from the analysis as a statistical outlier. 71 The calculation is CNY2,820 times 3.1 persons per household times 20% available for loan servicing divided by an interest rate of 24% = 2,820 x 3.1 x 0.2 / 0.24. An interest rate of 24% is considered relevant to such small loan sizes.

32
3. Analysis of County Level Loans and Deposits 141 A review of county level loans and deposits covering the period 2006-2012 was carried out on a sample of six provinces that included 124 cities and 266 counties. Information on population from the 2010 census of 108.9 million people for the cities and 148.8 million people in the counties was incorporated into the study.72 A comparison of city with county loans and deposits is shown in Table 13 below. Total lending and deposits were divided by total populations to derive average per capita data. 142 As would be expected, the average loan and average deposit per capita is much higher in the cities compared to counties. The average loan per capita is CNY40,068 for the cities compared to CNY16,989 for the counties. This is expected as the GDP per capita (represented by the level of deposits) appears much higher in the cities. What might not be so obvious is that loans as a proportion of deposits (the LDR) is much higher in city than in county locations and, furthermore, becomes higher as loan size increases.73 In addition, the growth rate of lending (from 2006 to 2012) increases as the LDR becomes larger.
Table 13: Comparisons of City to County Data
LDR Population Loan size/ Deposit/ Annual LDR range capita Capita growth
Avg. Avg. lending Avg. million CNY CNY %
Counties 0.29 - 0.74 0.56 70.78 7,509 13,518 13.95 0.75 - 1.50 1.07 61.43 17,581 16,440 21.78 > 1.50 2.04 16.60 55,222 27,050 22.67 Average/or total 1.05 148.80 16,989 16,234 20.04
Cities 0.29 - 0.74 0.59 18.90 12,364 20,815 19.86 0.75 - 1.50 1.12 58.10 32,201 28,826 24.95 > 1.50 1.90 24.86 79,523 41,940 25.90 Average/or total 1.31 101.86 40,068 30,540 25.10 Source of data: PBOC: County level loans and deposits. Comparisons are highly significant at 1% level of error. 143 This linkage of LDR to loan size and growth rate in lending applies not only to city versus county lending but also applies within county lending as shown in Table 14 below. For lending of up to CNY10,000 per capita the LDR is 0.56 compared to an LDR of 1.62 for average lending per capita of more than CNY20,000. For the 95 counties in the lowest lending range, the annual growth rate in lending was 14.6% per annum compared to 24.1% for 79 counties at the highest level. This suggests that the CBRC-mandated LDR of 0.75 is ignored by banks in their favored counties and, that an LDR indicator requirement can slow down the growth rate of lending to the detriment of lower income counties. 72 Using the government definition of county to be rural, the six province sample represented 38% of national rural population. 73 The CBRC-required LDR for banking institutions is not more than 0.75

33
Table 14: County Lending Linked to Deposits
Range in Population/ Loan size/ Deposit/ LDR Annual
Loan size/ Counties county capita capita growth capita Avg. Avg. Avg. lending CNY No. No. CNY CNY %
< 10,000 95 696,526 6,473 11,626 0.56 14.6010,000-19,999 92 550,445 14,244 15,684 0.91 22.30> 20,000 79 404,981 53,251 32,912 1.62 24.10Average/or total 266 559,415 16,989 16,234 1.05 20.04Source of data: PBOC - County level loans and deposits. 144 These data in Table 14 indicate:
(i) there are wide differences between counties in access to finance; (ii) 45% of the county population is in the smallest loan per capita group;
(iii) a higher population per county is not correlated to increased lending per
capita which further suggests a large proportion of county population is under-served;
(iv) the growth rate in lending is higher among higher income persons; (v) there is a flow of resources (deposits) to higher income regions as indicated
by the low LDR for the 95 counties compared to the higher LDR for the 79 provinces; and
(vi) there is also a flow of resources to higher income persons. The higher LDR
for the larger loan size category indicates this group is able to use non-financial assets as security for their borrowing. Conversely the lower group is not able to leverage their smaller amount of deposits. This suggests the need for less focus on collateralized lending among lower income households and more focus on cash flow-based lending.
145 Table 15 below verifies the relationship at the county and city levels between higher levels of LDR, larger loan size per capita and higher growth rates in lending. The minority county population of 16.6 million with an LDR above 1.50 has an average borrowing per capita of CNY55,222 compared to the larger group (47% of the county population) with an LDR average of less than 0.56 and average borrowing of CNY7,509. These differences apply to city and county populations and verify that higher income persons have a faster growth rate in borrowing compared to lower income persons.

34
1 2 3 4 5 6 7 8 9 10Population percentile
0%
10%
20%
30%
40%
50%
Sha
re o
f len
ding
County Lending Distribution
Table 15: City and County Lending Related to LDR
LDR Population Loan size/ Deposit/ Annual LDR range capita Capita growth
Avg. Avg. lending Avg. million CNY CNY %
Counties 0.29 - 0.74 0.56 70.78 7,509 13,518 13.95 0.75 - 1.50 1.07 61.43 17,581 16,440 21.78 > 1.50 2.04 16.60 55,222 27,050 22.67 Average/or total 1.05 148.80 16,989 16,234 20.04 Cities 0.29 - 0.74 0.59 18.90 12,364 20,815 19.86 0.75 - 1.50 1.12 58.10 32,201 28,826 24.95 > 1.50 1.90 24.86 79,523 41,940 25.90 Average/or total 1.31 101.86 40,068 30,540 25.10 Source of data: PBOC - County level loans and deposits. 146 As suggested in the text above, there is not an even distribution of lending across counties and their populations. Chart 1: County Loan Distribution
Chart 1 shows that 10% of the population holds 38% of borrowing, while 20% of the population holds 54% of total borrowing. The majority of the county population appears to be under-served in access to borrowing: 50% of population holds only 27% of total borrowing. The information in this section suggests that this under-served population is made up of a large number of lower-income households.
Source of data: PBOC -County level loans and deposits. 4. Household Surveys of Financial Service Access
147 The China Household Finance Survey74 covered 8,438 households in 80 counties. This highly useful survey has now been expanded to cover 270 counties and 26,000 households. The survey, mainly based on a July 2013 report, provides key findings:
(i) the statistical distributions are highly skewed. In 2010, the average rural household disposable income was CNY22,278 whereas the median was CNY10,580;
(ii) loan interest rates paid by rural households are much higher than for urban
households as shown in Table 16 below.
74 The China Household Finance Survey (CHFS) is provided by the Survey and Research Center of China Household Finance, Southwestern University of Finance and Economics, Chengdu, China. For more detail about the dataset, please see Gan et al (2013).

35
Table 16: Interest Rates Paid by Urban and Rural Borrowers
Source of borrowing Urban Rural Bank loan 5.8 7.3 Informal borrowing 18.9 25.7 Source: CHFS
(iii) rural household debt is not only more expensive than urban household debt but also is a larger proportion of household disposable income as shown in Table 17 below.
Table 17: Household Debt Related to Household Income
Household Income
CNY a/. Household Debt
CNY Debt as % Income
Urban household 70,876 100,815 142 Rural household 22,278 36,504 164 a/. Based on CHFS data
(iv) rural households are much more reliant on informal sources of finance than urban households as shown in Table 18 below. A large proportion (68%) of informal borrowing is from family and 83% of this lending bears no interest.
Table 18: Percentages of Borrowing Households by Sources of Finance
Family/Informal
Borrowing Formal
Borrowing Nationwide 33.5 14.4 Urban 22.3 17.3 Rural 40.9 12.4 Source: CHFS 148 The survey data have been analyzed and extrapolated in this report to estimate informal and formal demand for, and supply of, credit to urban and rural households. The survey shows that formal borrowing nationwide amounted to CNY19.2 trillion and informal borrowing was CNY8.6 trillion with 35% of the informal borrowing being used for agriculture and business and 44% for housing. The survey shows there were 3.19 persons per household for urban areas and 3.16 persons per household for rural areas. Based on the rural and urban populations in 2012 this indicates a total of 219 million urban households and 206 million rural households nationwide. Table 18 shows there were 38 million urban households with formal loans compared to 25.5 million rural households: a total 63.5 million households.75 Of the 133 million households accessing informal finance, 49 million were urban and 84 million were rural. These are the numbers of households that were unable to obtain formal finance or need to supplement their formal financing with other informal sources.76 There appears to be a substantial gap between the supply of and demand for formal finance in both rural and urban areas.
75 The total of 63.5 million households does not match the 78 million households (excluding MCCs and PAMFIs) shown earlier in Table 2. The differences could be due to sampling size and/or (in the case of Table 2) the inclusion of dormant borrowers and the practice of showing cumulative numbers of borrowers rather than simply showing the number of active outstanding borrowers. 76 The China Financial Stability Report 2013, page 129, estimated that there were 148 million credit-worthy rural households – around 70% of total rural households.
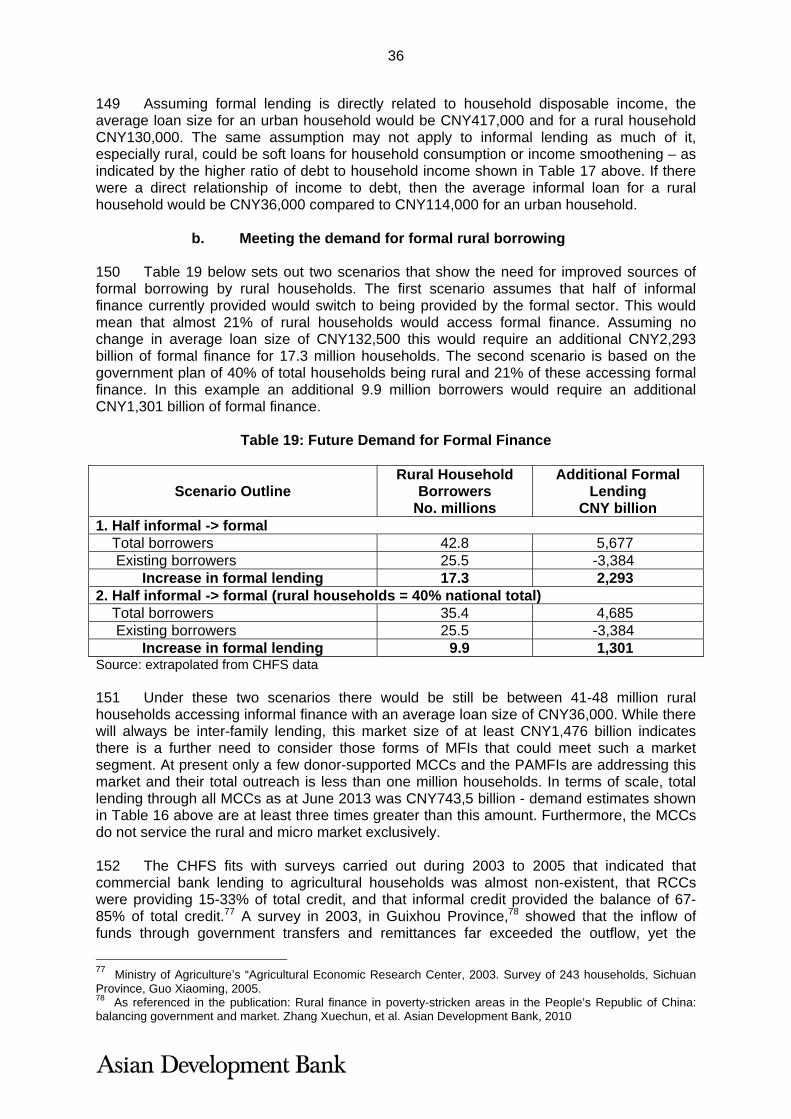
36
149 Assuming formal lending is directly related to household disposable income, the average loan size for an urban household would be CNY417,000 and for a rural household CNY130,000. The same assumption may not apply to informal lending as much of it, especially rural, could be soft loans for household consumption or income smoothening – as indicated by the higher ratio of debt to household income shown in Table 17 above. If there were a direct relationship of income to debt, then the average informal loan for a rural household would be CNY36,000 compared to CNY114,000 for an urban household. b. Meeting the demand for formal rural borrowing 150 Table 19 below sets out two scenarios that show the need for improved sources of formal borrowing by rural households. The first scenario assumes that half of informal finance currently provided would switch to being provided by the formal sector. This would mean that almost 21% of rural households would access formal finance. Assuming no change in average loan size of CNY132,500 this would require an additional CNY2,293 billion of formal finance for 17.3 million households. The second scenario is based on the government plan of 40% of total households being rural and 21% of these accessing formal finance. In this example an additional 9.9 million borrowers would require an additional CNY1,301 billion of formal finance.
Table 19: Future Demand for Formal Finance
Scenario Outline
Rural Household Borrowers
No. millions
Additional Formal Lending
CNY billion 1. Half informal -> formal Total borrowers 42.8 5,677 Existing borrowers 25.5 -3,384
Increase in formal lending 17.3 2,293 2. Half informal -> formal (rural households = 40% national total) Total borrowers 35.4 4,685 Existing borrowers 25.5 -3,384
Increase in formal lending 9.9 1,301 Source: extrapolated from CHFS data 151 Under these two scenarios there would be still be between 41-48 million rural households accessing informal finance with an average loan size of CNY36,000. While there will always be inter-family lending, this market size of at least CNY1,476 billion indicates there is a further need to consider those forms of MFIs that could meet such a market segment. At present only a few donor-supported MCCs and the PAMFIs are addressing this market and their total outreach is less than one million households. In terms of scale, total lending through all MCCs as at June 2013 was CNY743,5 billion - demand estimates shown in Table 16 above are at least three times greater than this amount. Furthermore, the MCCs do not service the rural and micro market exclusively. 152 The CHFS fits with surveys carried out during 2003 to 2005 that indicated that commercial bank lending to agricultural households was almost non-existent, that RCCs were providing 15-33% of total credit, and that informal credit provided the balance of 67-85% of total credit.77 A survey in 2003, in Guixhou Province,78 showed that the inflow of funds through government transfers and remittances far exceeded the outflow, yet the
77 Ministry of Agriculture’s “Agricultural Economic Research Center, 2003. Survey of 243 households, Sichuan Province, Guo Xiaoming, 2005. 78 As referenced in the publication: Rural finance in poverty-stricken areas in the People’s Republic of China: balancing government and market. Zhang Xuechun, et al. Asian Development Bank, 2010

37
demand for credit still could not be met. Finance shortages in the rural areas of Guizhou, were the result of inefficient credit allocation mechanisms. Since then, there is little evidence that farm smallholders and microenterprises (both from low income households) have benefitted from the introduction of the new forms of rural financial institutions, or restructured RCCs, which appear to have focused on enterprise rather than agricultural lending.
V. OPPORTUNITIES AND CONSTRAINTS IN RURAL AND MICRO FINANCIAL SYSTEMS
153 This paper indicates that a broad range of financial services is required by rural households. These required services include those through ATMs and POS outlets to enable access to savings and to facilitate cash payments. Rural service banks are expanding access to such services. Inward remittances are important for rural households. The cost of receiving remittances is high if obtained through PSBC and much lower if through a correspondent bank deposit account. At present, however, local rural financial institutions work with a limited range of correspondent banks and this restricts rural household access to payments and remittance services. 154 This paper shows that the introduction of new rural finance institutions (VTBs, MCCs and RMCCs) has had little impact on access to finance by lower income households and farmers. MCCs and VTBs are lending to MSEs but there is little lending of less than CNY50,000 to microenterprises and agriculture. While the larger-sized loans are very important for employment generation and wages, there appears to be an unmet demand for very small scale agriculture and household businesses. Finally, there appears scope to improve rural household access to health and accident insurance as a way to mitigate devastating financial risk for low-income families. Adjustments to the legal, management and operational spheres of the new rural finance institutions are needed. 155 The delivery mechanisms for the supply of a broader range of rural financial services are open issues. International experience shows that rural low-income households need (i) access to cash (liquidity), (ii) quick access to loans, and (iii) risk mitigation (insurance). The question arises - is it better to provide all of these services through a full-service financial institution or should some services, such as microcredit, be provided through special-purpose MFIs? Cost-effective and easy access to all services, not just credit, and increased financial inclusion are key issues as well as the promotion of efficient service delivery mechanisms. 156 The recent removal of interest rate controls on lending should lead to rural financial institutions being able to meet a broader demand for loans that covers the range from small farmers and low income households through to micro and small enterprises. Interest rates can now be adjusted to fit the relatively higher administrative cost of very small loans and the higher risk of agricultural loans. The interest rate adjustments however need to be supported by (i) an increase in number of staff and specialized training, (ii) the development of loan products that fit specific categories of borrowers, (iii) the development of group versus individual lending procedures, (iv) lending through business intermediaries that on-lend to farmers and farmer groups, and (v) working closely with farmer associations to improve the financial literacy of micro-borrowers, improve their access to production inputs and marketing outlets, and raise their standard of financial discipline and responsibility.79 157 This section outlines the strengths and weaknesses of six distinctly different systems that provide rural and micro financial services to rural households, smallholder farmers, and 79 The ADB TA-7996 REG: Innovative Financing for Agriculture and Food Value Chains (to end of 2014), is developing recommendations for improved agricultural financing in China.

38
microenterprises. Table 13 below provides an outline of these systems. In summary, the report indicates the greatest potential for expansion of rural financial services lies in (i) the financial “cooperative” system, (ii) the PSBC, (iii) amalgamations of VTBs operating through centralized management, and (iv) facilitating the transition of a certain category of MCC to become a VTB or licensed bank. A. The Cooperative Financial Institutions 158 The restructuring of the RCCs has been a commercially-oriented exercise. Overall, it appears that the financial service cooperatives are not controlled by individual members. The operational linkages between RCCs, RCBs and RCoBs are not clear yet there are substantial advantages in developing such linkages. As an example, a RCoB could act as an apex for RCCs that hold shares in the RCoB and, in turn, the RCoB could act as a financial clearing house for RCCs that have surplus or deficit funds. Concomitantly, the RCoB would exercise financial and management performance controls over its RCC members. How far such relationships have developed already is unknown. The ownership of RCCs, RCBs and RCoBs is, in general, unknown and this makes it difficult to discover required and acceptable forms of technical assistance. 159 RMCCs have been promoted by government as a way to satisfy grassroots credit needs of members. There is, however, a viewpoint that it is difficult for true credit co-operatives to establish themselves in modern China due to excessive government intervention and China’s peculiar political culture and social context.80 Whatever one may think about this position, there are other major issues related to the development of RMCCs. Firstly, the scale and speed of achieving significant outreach of services is important since a large unmet demand for services exists. Since true cooperatives are formed at the grassroots, they do not (and should not) respond to external attempts to increase their numbers and their membership beyond the growth rate wanted by members.81 This means that it will take a long time for RMCCs to show significant presence in the supply of rural financial services. 160 Secondly, integrated supervision and control of RMCCs is essential. Supervision through a government body, such as CBRC, and controls through a federated (apex) cooperative that is subscribed to and owned by RMCC members is needed. It is difficult and very costly to supervise large numbers of cooperatives. This secondary control element does not exist at present and would take significant effort and cost, on the part of RMCCs and the regulatory authority, to establish. 161 Thirdly a reliable management and financial rating system of RMCCs is needed if they wish to obtain external (but limited) finance to augment their member subscriptions, retained earnings and member deposits. The rating should be separate from the supervision system as the supervisory authority must remain independent of financing decisions of creditors. No control and financial performance indicators have been set for RMCCs. This plus their short operational history make it difficult for them to attract external finance.
80 Ong L. (2009), “ The communist party and financial institutions: institutional design of China’s post-reform rural credit cooperatives”, Pacific Affairs 82 (1): 251-278. 81 In many countries large numbers of financial cooperatives have been established in response to short-lived government programs. One Asian country with 22 million people has almost 23,000 financial cooperatives: data is unobtainable for more than 8,000 of these cooperatives.

39
Table 13: Summary Outline of Rural and Micro Financial Service Systems
Financial Service Systems
Outreach and Advantages
Limitations
1. Cooperative System: Rural Credit cooperatives (RCC), Rural Cooperative Banks (RCoB), Rural Commercial Banks (RCB), Rural Mutual Credit Cooperatives (RMCC)
Large volume of business provides a substantial base for expansion
Tax advantages compared to other financial institutions
Able to reach grassroots
Unclear distinctions between roles and functions of public vs. private ownership that affect infrastructure investment and management of each institution;
Clarification needed on existence of or need for RCC/RMCC apex(es); Lack of standardized reporting systems Inconsistencies in supervision & controls of RCCs among provinces; RCC member access to electronic banking services unknown RCC earning assets are small in relation to total assets Conflict between rapid growth and membership control
2. Commercial bank rural outlets
Can provide full range financial services including electronic banking, ATM and POS services
Not suited to microcredit disbursement and management: lack local information and presence
Market resistance to full cost recovery pricing of micro loans 3. Village or Township Banks (VTBs)
Diversified sources of funds compared to MCCs (deposits, borrowing, equity);
Potential for large outreach if VTBS allowed to become part of an affiliated branching structure without geographical restrictions plus full access to payments and credit reference systems
Access to clearing system only through owner or correspondent banks; Unable, at present, to independently provide full set of banking services IT platform not suited to small branching system Lack direct access to credit information system Interference of authorities in setting lending and deposit pricing A cap on LDR limits access to financial services At a tax disadvantage compared to RCCs;
4. Microcredit companies (MCCs)
Easy market entry Not permitted to act as financial service agents for commercial banks Borrowing cap restricts loan growth, leading to dependency on equity
finance Return on equity and retained earnings are low Allowed to provide credit services only Loan sizes appear large and not directed at low income households Lack of standardized reporting systems Inconsistencies in regulations, supervision & controls among provinces; Legal, ownership and management barriers to VTB transformation
5. Postal Savings Bank of China (PSBC)
National coverage with 39,000 outlets; Can operate low cost high volume:
financial services, IT support; Microloan size appropriate for rural
households, farmers and MSEs
Lack capability in loan evaluation and management Financial and managerial reporting system inadequate
6. Microfinancial Institutions (MFIs)
Reach low income households, farmers and microenterprises
Small outreach in number of borrowers High cost of credit to borrower Dependency on donor funding for asset growth Inability to provide electronic banking services

40
B. Commercial Bank Rural Service Outlets 162 Commercial banks such as ABC have increased their number of service outlets including ATMs and POS outlets in rural locations. The number of rural households using bank cards has increased substantially: the number accessing small loans, mainly for consumption and largely through bank cards, has increased from 67 million in 2009 to 110 million in 2012. There has been an increase in MSE lending but the amount of this through rural commercial bank branches is unknown. There has been no relative increase in other rural lending. 163 One way for a commercial bank to increase small-scale rural financial services would be for the bank to establish a subsidiary service unit that specializes in small-scale services. An example of this arrangement is the Units established by Bank Rakyat Indonesia as outlined in Box A below. This option is probably a better fit for the PSBC as it resembles current PSBC practices. It could also be adopted by the commercial banks, such as Harbin Bank, that already have a large number of rural service outlets and investment in VTBs.
Box A: The Bank Rakyat Indonesia Unit System
C. Village or Township Banks 164 Since their startup the emerging wisdom has been that individual VTBs with a limited branching structure and small number of customers are not an attractive investment and do not fully meet all financial service needs of the communities in which they are located. VTBs have been established more as parent bank branches than as autonomously operated financial institutions. To meet their original mandate of rural financial institutions, VTBs need to improve their range and volume of services and address financial needs of lower income households. Financially, this requires access to equity financing, as and when needed, and debt financing through deposits and borrowing. Access to long term stable borrowing is critical to their growth, especially in lower-income provinces. The development of such a stable core of borrowing is fully in line with the Basel III recommendation for a Net Stable Funding Ratio (NSFR) to be used as part of the assessment of financial institutional strengths. Operationally, it requires access to the payments and credit reference systems.
BRI, which is a 70% government-owned commercial bank, has more than 1,000 bank branches and sub-branches in cities and towns and 5,000 Units that operate at the village level. As at end of 2012, total BRI lending was $37.7 billion of which $11.1 billion was microcredit through the Unit system. On the same date, BRI deposit-taking amounted to $47 billion of which $12.9 billion was through the Units. The Units provided microcredit and savings services to 5.5 million borrowers with an average loan size of $1,980 and serviced 25 million deposit account holders with an average balance of $527. The maximum loan size through a Unit is $10,000. The Units are managed as a separate operational division within the bank and are supervised by an officer located in each BRI branch. Staff in the Units are under a separate and lower pay structure and the interest charge on loans is higher than for other BRI loans to reflect their smaller size and higher relative cost. The NPL of Unit loans is 1.09%: this is half that of lending carried out through BRI head office and the branches. The Unit system has been operating effectively since 1986. The Units have been successful because their management autonomy and pricing of services properly reflects and responds to the needs of their customers and the cost of operating in rural locations. The close daily monitoring of Unit activities and a highly appropriate staff training system have also been critical to the success of the Units.

41
165 Some regulatory requirements for VTBs should be amended to fit their peculiar operating structure. In particular, the LDR cap needs adjustment, the CAR is too small, and access to liquidity under conditions of stress need improvement. VTBs need to be encouraged to develop loan products and other financial services that are attractive to lower income households, microenterprises and smallholder farmers. They do not need subsidies. If allowed to operate commercially with full cost recovery, VTBs would be able to provide services to 30-50% of households within their operating areas. 166 VTBs have a large potential for growth. This growth potential could be assisted, firstly, by altering regulations that allow MCCs to transform into VTBs and, secondly, by the providing legislation that would allow the merging of VTBs into financial holding companies. There are many examples of successful VTB-type institutions in other countries as outlined in Box A above and Box B below. All of these institutions have a stable core of long term borrowing that supplements their strong equity position and deposit mobilization. 167 To increase their rural presence, commercial banks have been encouraged to invest in VTBs by requiring that a bank be a major investor. The customer outreach of VTBs,
Box B: The Transformation and Growth of Microfinancial Institutions (MFIs) There are interesting parallels in the development of microfinancial services in China compared to other countries. Allowing credit-only MFIs (such as MCCs) to become deposit-taking institutions (VTBs) has also been implemented successfully in Tajikistan and Cambodia. In Cambodia, ACLEDA Bank began as a credit-only institution but, in the space of 13 years, is now a multi-service bank with total assets of $1.9 billion, a loan portfolio of $1.2 billion and deposits of $1.46 billion. There are 315,000 active borrowers and 8,300 staff working in 238 service outlets. Also in Cambodia, there are a further seven MFIs that have been issued with deposit-taking licenses. These have the appearance of banks, modern IT platforms, between 74-173 branches each, and LDRs of around 2.4. Long term financing is provided on an on-going basis from foreign financial institutions. In Tajikistan, there is a process that allows credit-only MFIs (similar to MCCs) to become deposit-taking MFIs and, furthermore, allows these institutions to then participate in the bank deposit insurance scheme as well as to participate in the bank clearing system. This process is now in its second year. One MFI operates through 19 branches, another through 86 branches. In Bangladesh there are three MFIs that dominate microfinance. ASA is one of the most successful MFIs with 4.3 million borrowers and an average loan size per borrower of $150 under a loan portfolio of $566 million. Deposits are collected from borrowers: the LDR is 2.6. There are 21,000 staff and 3,000 service outlets. The return on equity is above 20%. These financial institutions are reaching around 30% of households with their services. Since they service low income households and microenterprises, including smallholder farmers, deposit volumes are low and there is a need to borrow funds for asset growth. Average loan size per borrower (apart from Bangladesh) is in the range of $1,000-$4,000 and loan portfolio growth is close to 30% per annum. Importantly, these financial institutions have a return on equity of around 20% and this enables them to retain earnings and maintain a satisfactory debt to equity balance. All of these institutions started up as NGOs and the original NGO remains a key shareholder.

42
however, is quite small and they are not reaching low income households, smallholder farmers and microenterprises. VTBs are acting as mini-banks and are not taking full advantage of the opportunities for market segmentation and outreach in rural locations. 168 Legislation that allows the legal incorporation of at least 30 VTBs into a business unit could lead to improved economies of scale and greater outreach by commercial banks of financial services across whole communities. In terms of supervision, this incorporation would requires the formulation of supervisory rules over financially affiliated companies, a strengthening of capital adequacy requirements, the avoidance of multiple calculations of capital and capital arbitrage, and procedures to reduce excessive leverage.82 D. Microcredit Companies and Other MFIs 169 Despite their rapid growth in numbers, very few of the MCCs are providing microcredit of less than CNY100,000 loan size and those that are addressing this market, including PAMFIs, face severe legal and management constraints that limit their outreach of services. A much better process of transformation into deposit-taking financial institutions is needed so that they are able to provide deposit, money transfer and bill payment services either in hard cash or electronically as well as to meet social and financial targets. Even if MCC/MFIs provide mobile phone banking or electronic banking services through a correspondent bank this is not a seamless operation and will require regulatory safeguards. The restriction on MCCs and PAMFIs acting as agents for banks limits their ability to partner with banks in the provision of services especially in remote or lowly populated locations that banks do not reach. Thirdly, the low rate of earnings of PAMFIs constrains their growth rate in microlending and restricts their access to borrowing and equity capital that is needed for asset growth.
82 China Financial Stability Report 2012, pages 175-176.