Embed Size (px)
Citation preview
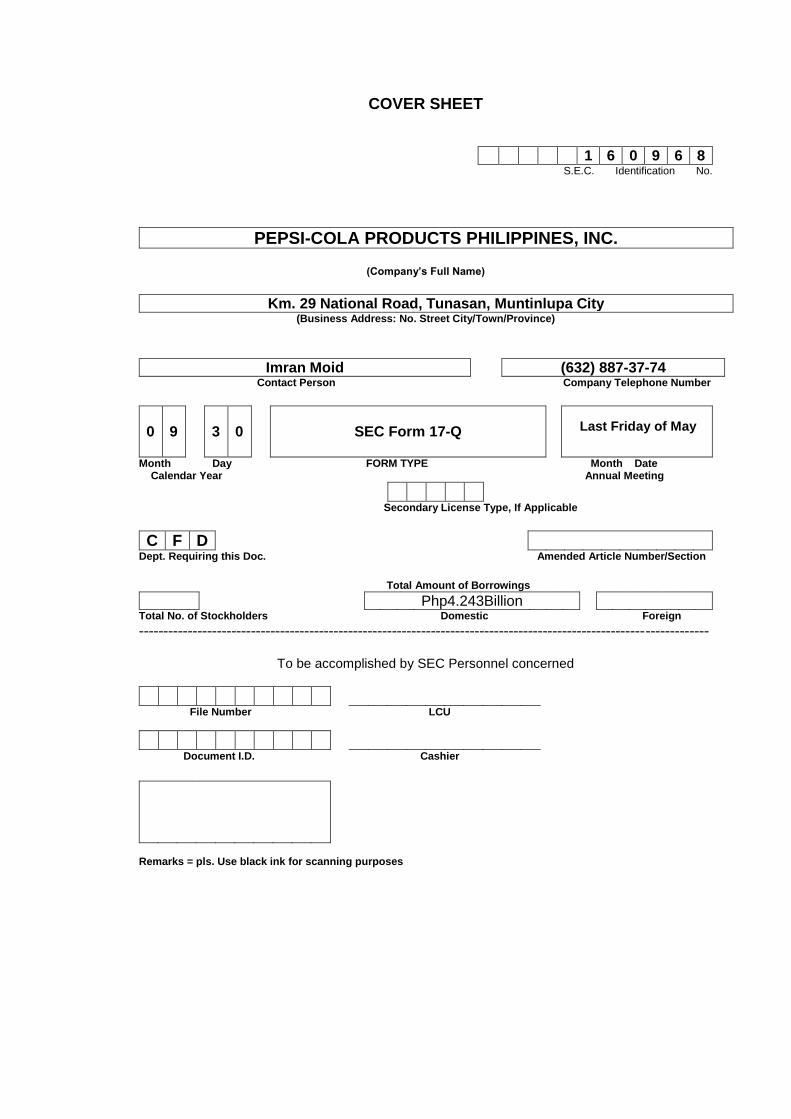
COVER SHEET
1 6 0 9 6 8 S.E.C. Identification No.
PEPSI-COLA PRODUCTS PHILIPPINES, INC.
(Company’s Full Name)
Km. 29 National Road, Tunasan, Muntinlupa City (Business Address: No. Street City/Town/Province)
Imran Moid (632) 887-37-74 Contact Person Company Telephone Number
0
9
3
0
SEC Form 17-Q
Last Friday of May
Month Day FORM TYPE Month Date Calendar Year Annual Meeting
Secondary License Type, If Applicable
C F D Dept. Requiring this Doc. Amended Article Number/Section
Total Amount of Borrowings
Php4.243Billion Total No. of Stockholders Domestic Foreign
---------------------------------------------------------------------------------------------------------------------
To be accomplished by SEC Personnel concerned
File Number LCU
Document I.D. Cashier
Remarks = pls. Use black ink for scanning purposes
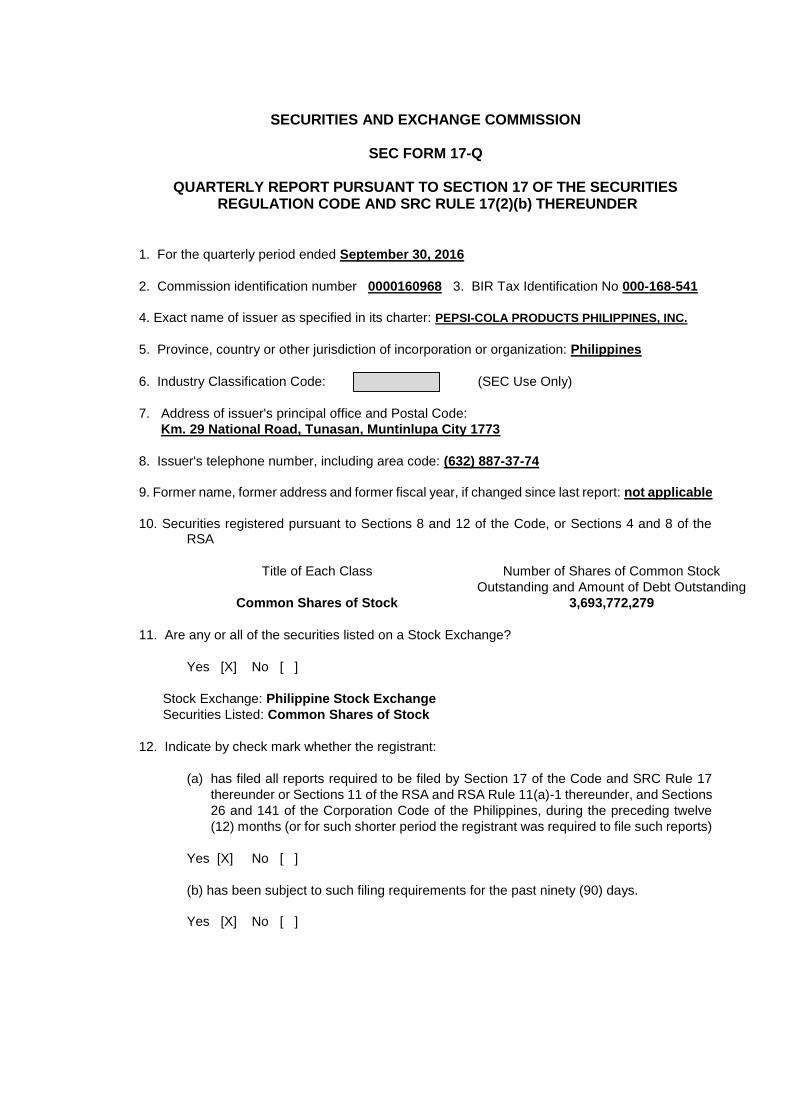
SECURITIES AND EXCHANGE COMMISSION
SEC FORM 17-Q
QUARTERLY REPORT PURSUANT TO SECTION 17 OF THE SECURITIES REGULATION CODE AND SRC RULE 17(2)(b) THEREUNDER
1. For the quarterly period ended September 30, 2016
2. Commission identification number 0000160968 3. BIR Tax Identification No 000-168-541
4. Exact name of issuer as specified in its charter: PEPSI-COLA PRODUCTS PHILIPPINES, INC.
5. Province, country or other jurisdiction of incorporation or organization: Philippines
6. Industry Classification Code: (SEC Use Only)
7. Address of issuer's principal office and Postal Code:
Km. 29 National Road, Tunasan, Muntinlupa City 1773
8. Issuer's telephone number, including area code: (632) 887-37-74
9. Former name, former address and former fiscal year, if changed since last report: not applicable
10. Securities registered pursuant to Sections 8 and 12 of the Code, or Sections 4 and 8 of the
RSA
Title of Each Class
Number of Shares of Common Stock
Outstanding and Amount of Debt Outstanding
Common Shares of Stock 3,693,772,279
11. Are any or all of the securities listed on a Stock Exchange?
Yes [X] No [ ]
Stock Exchange: Philippine Stock Exchange
Securities Listed: Common Shares of Stock
12. Indicate by check mark whether the registrant:
(a) has filed all reports required to be filed by Section 17 of the Code and SRC Rule 17
thereunder or Sections 11 of the RSA and RSA Rule 11(a)-1 thereunder, and Sections
26 and 141 of the Corporation Code of the Philippines, during the preceding twelve
(12) months (or for such shorter period the registrant was required to file such reports)
Yes [X] No [ ]
(b) has been subject to such filing requirements for the past ninety (90) days.
Yes [X] No [ ]
Part 1 - Financial Information Item 1. Financial Statements.
PEPSI-COLA PRODUCTS PHILIPPINES, INC.
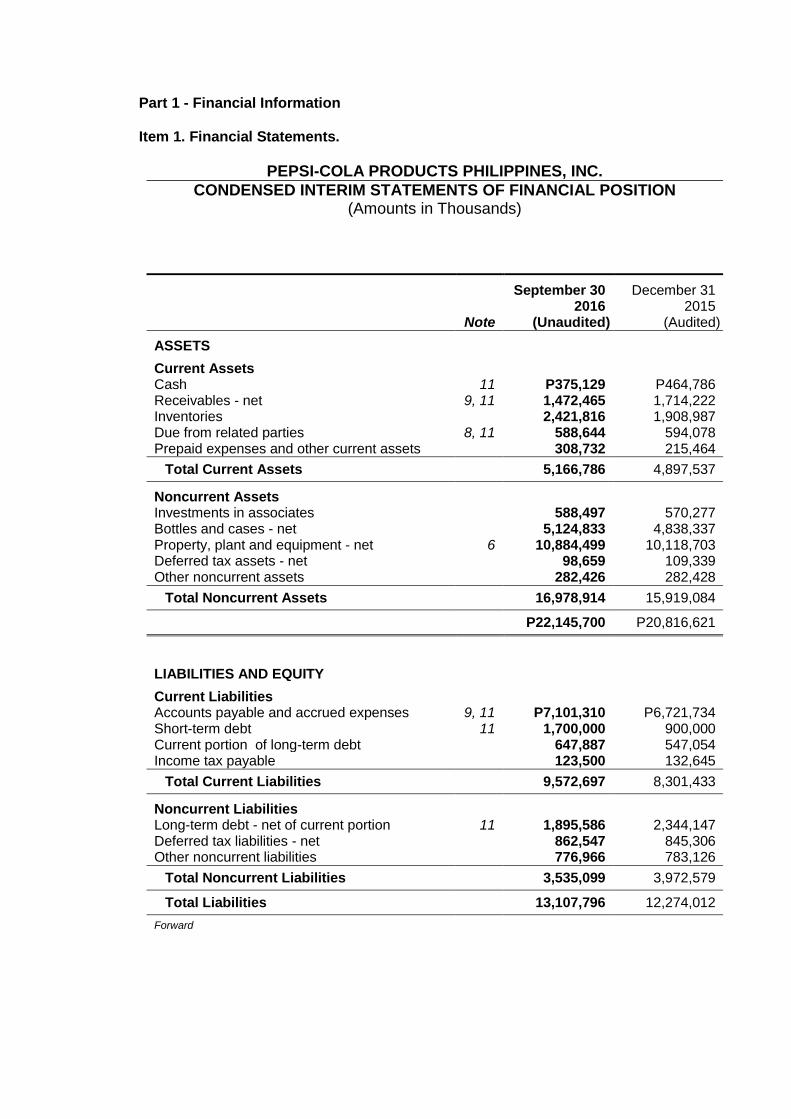
CONDENSED INTERIM STATEMENTS OF FINANCIAL POSITION (Amounts in Thousands)
September 30 December 31 2016 2015 Note (Unaudited) (Audited)
ASSETS
Current Assets Cash 11 P375,129 P464,786 Receivables - net 9, 11 1,472,465 1,714,222 Inventories 2,421,816 1,908,987 Due from related parties 8, 11 588,644 594,078 Prepaid expenses and other current assets 308,732 215,464
Total Current Assets 5,166,786 4,897,537
Noncurrent Assets Investments in associates 588,497 570,277 Bottles and cases - net 5,124,833 4,838,337 Property, plant and equipment - net 6 10,884,499 10,118,703 Deferred tax assets - net 98,659 109,339 Other noncurrent assets 282,426 282,428
Total Noncurrent Assets 16,978,914 15,919,084
P22,145,700 P20,816,621
LIABILITIES AND EQUITY
Current Liabilities Accounts payable and accrued expenses 9, 11 P7,101,310 P6,721,734 Short-term debt 11 1,700,000 900,000 Current portion of long-term debt 647,887 547,054 Income tax payable 123,500 132,645
Total Current Liabilities 9,572,697 8,301,433
Noncurrent Liabilities Long-term debt - net of current portion 11 1,895,586 2,344,147 Deferred tax liabilities - net 862,547 845,306 Other noncurrent liabilities 776,966 783,126
Total Noncurrent Liabilities 3,535,099 3,972,579
Total Liabilities 13,107,796 12,274,012
Forward
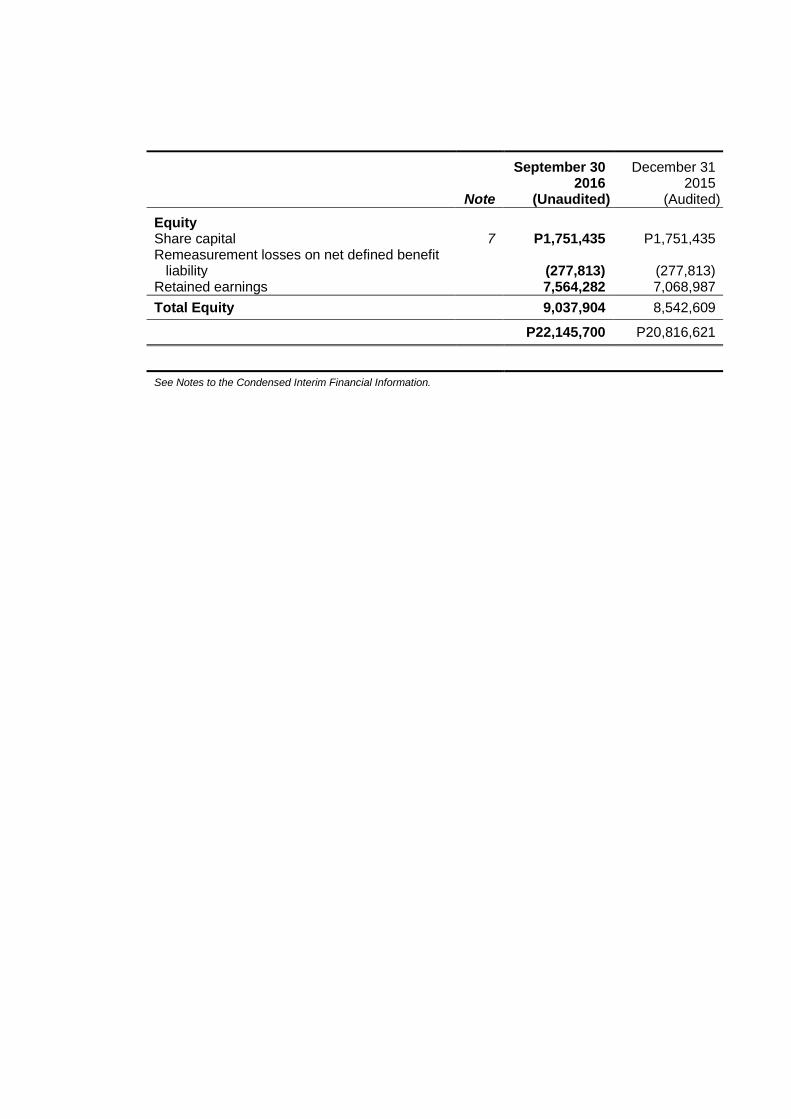
September 30 December 31 2016 2015 Note (Unaudited) (Audited)
Equity Share capital 7 P1,751,435 P1,751,435 Remeasurement losses on net defined benefit
liability (277,813) (277,813) Retained earnings 7,564,282 7,068,987
Total Equity 9,037,904 8,542,609
P22,145,700 P20,816,621
See Notes to the Condensed Interim Financial Information.
PEPSI-COLA PRODUCTS PHILIPPINES, INC.
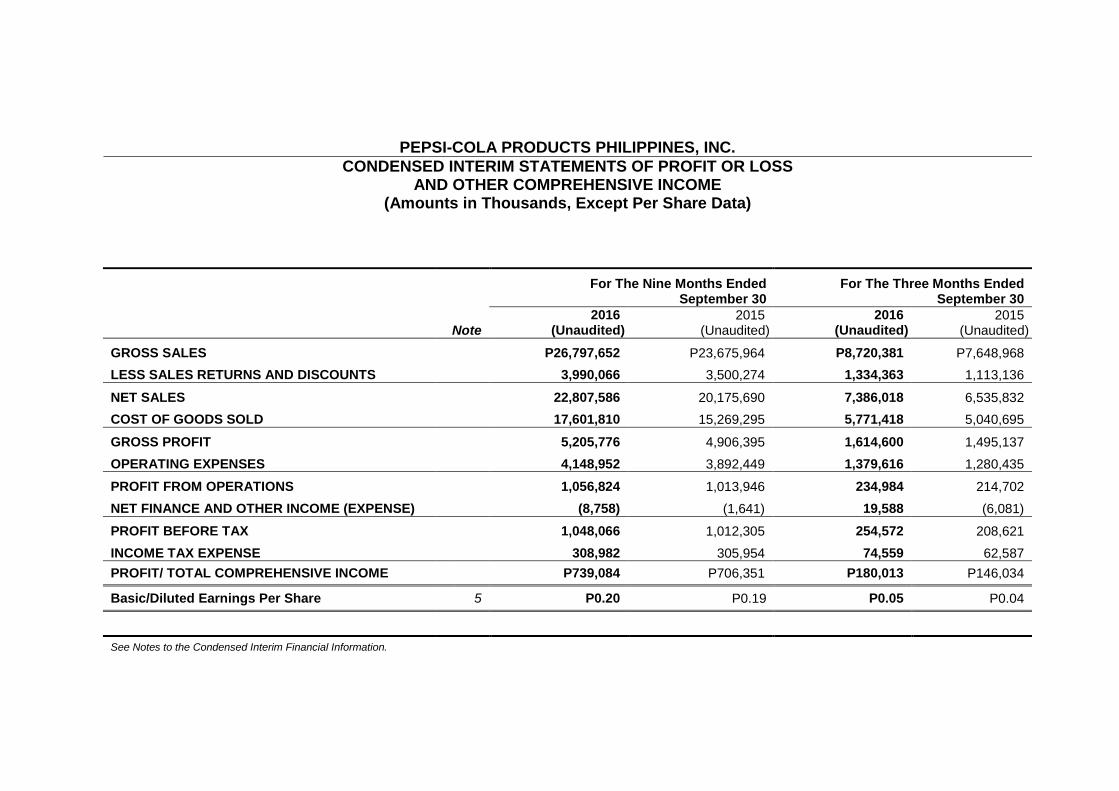
CONDENSED INTERIM STATEMENTS OF PROFIT OR LOSS AND OTHER COMPREHENSIVE INCOME
(Amounts in Thousands, Except Per Share Data)
For The Nine Months Ended
September 30 For The Three Months Ended
September 30
2016 2015 2016 2015 Note (Unaudited) (Unaudited) (Unaudited) (Unaudited)
GROSS SALES P26,797,652 P23,675,964 P8,720,381 P7,648,968
LESS SALES RETURNS AND DISCOUNTS 3,990,066 3,500,274 1,334,363 1,113,136
NET SALES 22,807,586 20,175,690 7,386,018 6,535,832
COST OF GOODS SOLD 17,601,810 15,269,295 5,771,418 5,040,695
GROSS PROFIT 5,205,776 4,906,395 1,614,600 1,495,137
OPERATING EXPENSES 4,148,952 3,892,449 1,379,616 1,280,435
PROFIT FROM OPERATIONS 1,056,824 1,013,946 234,984 214,702
NET FINANCE AND OTHER INCOME (EXPENSE) (8,758) (1,641) 19,588 (6,081)
PROFIT BEFORE TAX 1,048,066 1,012,305 254,572 208,621
INCOME TAX EXPENSE 308,982 305,954 74,559 62,587
PROFIT/ TOTAL COMPREHENSIVE INCOME P739,084 P706,351 P180,013 P146,034
Basic/Diluted Earnings Per Share 5 P0.20 P0.19 P0.05 P0.04
See Notes to the Condensed Interim Financial Information.
PEPSI-COLA PRODUCTS PHILIPPINES, INC.
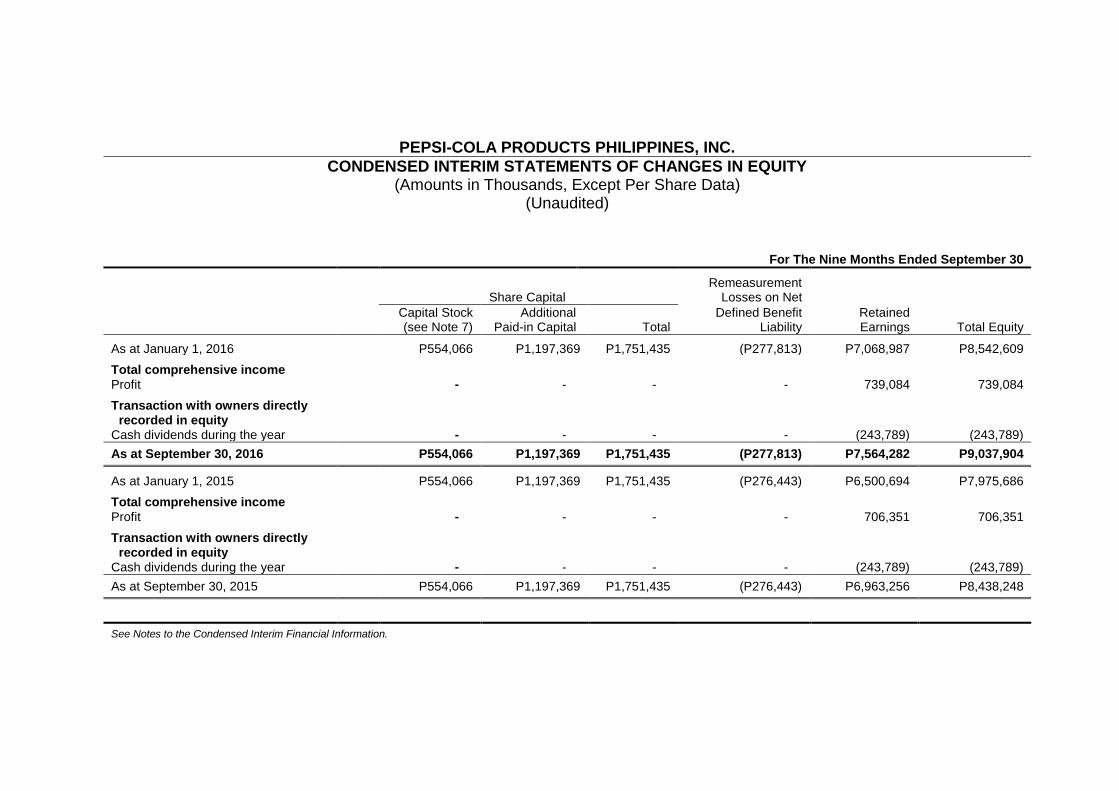
CONDENSED INTERIM STATEMENTS OF CHANGES IN EQUITY (Amounts in Thousands, Except Per Share Data)
(Unaudited)
For The Nine Months Ended September 30
Remeasurement Share Capital Losses on Net
Capital Stock (see Note 7)
Additional Paid-in Capital Total
Defined Benefit Liability
Retained Earnings Total Equity
As at January 1, 2016 P554,066 P1,197,369 P1,751,435 (P277,813) P7,068,987 P8,542,609
Total comprehensive income Profit - - - - 739,084 739,084
Transaction with owners directly recorded in equity
Cash dividends during the year - - - - (243,789) (243,789)
As at September 30, 2016 P554,066 P1,197,369 P1,751,435 (P277,813) P7,564,282 P9,037,904
As at January 1, 2015 P554,066 P1,197,369 P1,751,435 (P276,443) P6,500,694 P7,975,686
Total comprehensive income Profit - - - - 706,351 706,351
Transaction with owners directly recorded in equity
Cash dividends during the year - - - - (243,789) (243,789)
As at September 30, 2015 P554,066 P1,197,369 P1,751,435 (P276,443) P6,963,256 P8,438,248
See Notes to the Condensed Interim Financial Information.
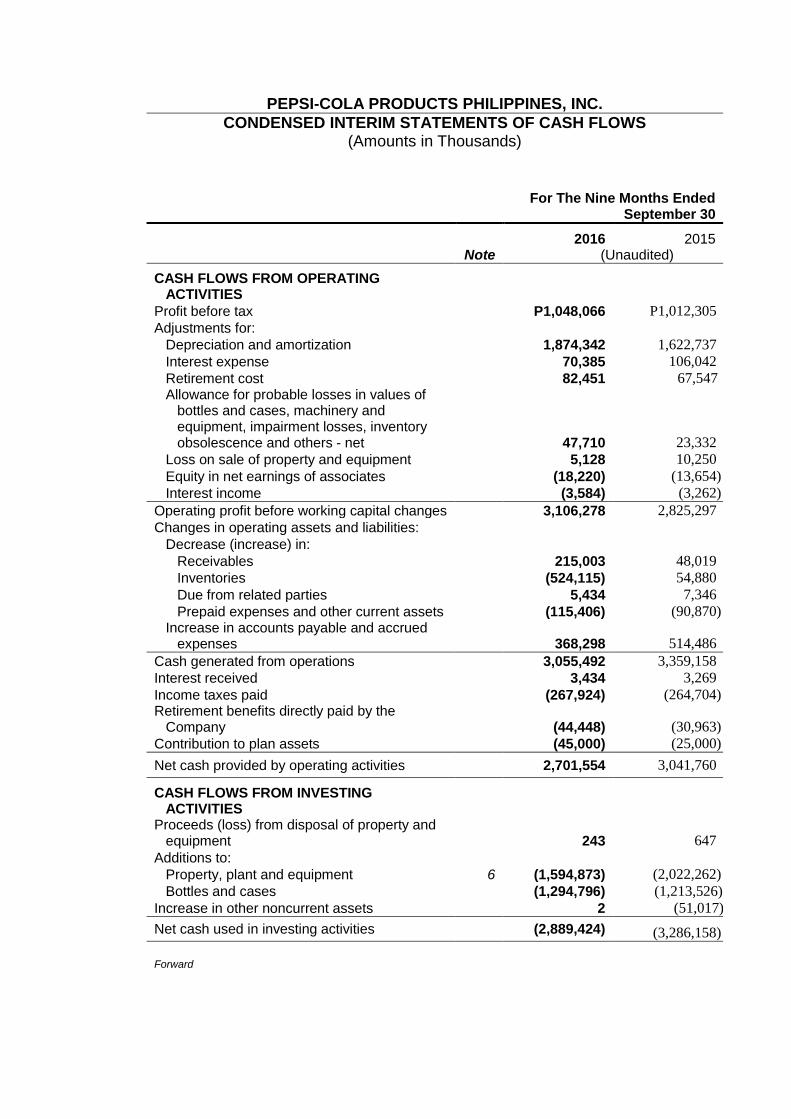
PEPSI-COLA PRODUCTS PHILIPPINES, INC.
CONDENSED INTERIM STATEMENTS OF CASH FLOWS (Amounts in Thousands)
For The Nine Months Ended
September 30
2016 2015 Note (Unaudited)
CASH FLOWS FROM OPERATING ACTIVITIES
Profit before tax P1,048,066 P1,012,305
Adjustments for:
Depreciation and amortization 1,874,342 1,622,737
Interest expense 70,385 106,042
Retirement cost 82,451 67,547 Allowance for probable losses in values of
bottles and cases, machinery and equipment, impairment losses, inventory obsolescence and others - net 47,710 23,332
Loss on sale of property and equipment 5,128 10,250
Equity in net earnings of associates (18,220) (13,654)
Interest income (3,584) (3,262)
Operating profit before working capital changes 3,106,278 2,825,297
Changes in operating assets and liabilities:
Decrease (increase) in:
Receivables 215,003 48,019
Inventories (524,115) 54,880
Due from related parties 5,434 7,346
Prepaid expenses and other current assets (115,406) (90,870) Increase in accounts payable and accrued
expenses 368,298 514,486
Cash generated from operations 3,055,492 3,359,158
Interest received 3,434 3,269
Income taxes paid (267,924) (264,704) Retirement benefits directly paid by the
Company (44,448) (30,963)
Contribution to plan assets (45,000) (25,000)
Net cash provided by operating activities 2,701,554 3,041,760
CASH FLOWS FROM INVESTING ACTIVITIES
Proceeds (loss) from disposal of property and equipment 243 647
Additions to:
Property, plant and equipment 6 (1,594,873) (2,022,262)
Bottles and cases (1,294,796) (1,213,526)
Increase in other noncurrent assets 2 (51,017)
Net cash used in investing activities (2,889,424) (3,286,158)
Forward (3,286,158)
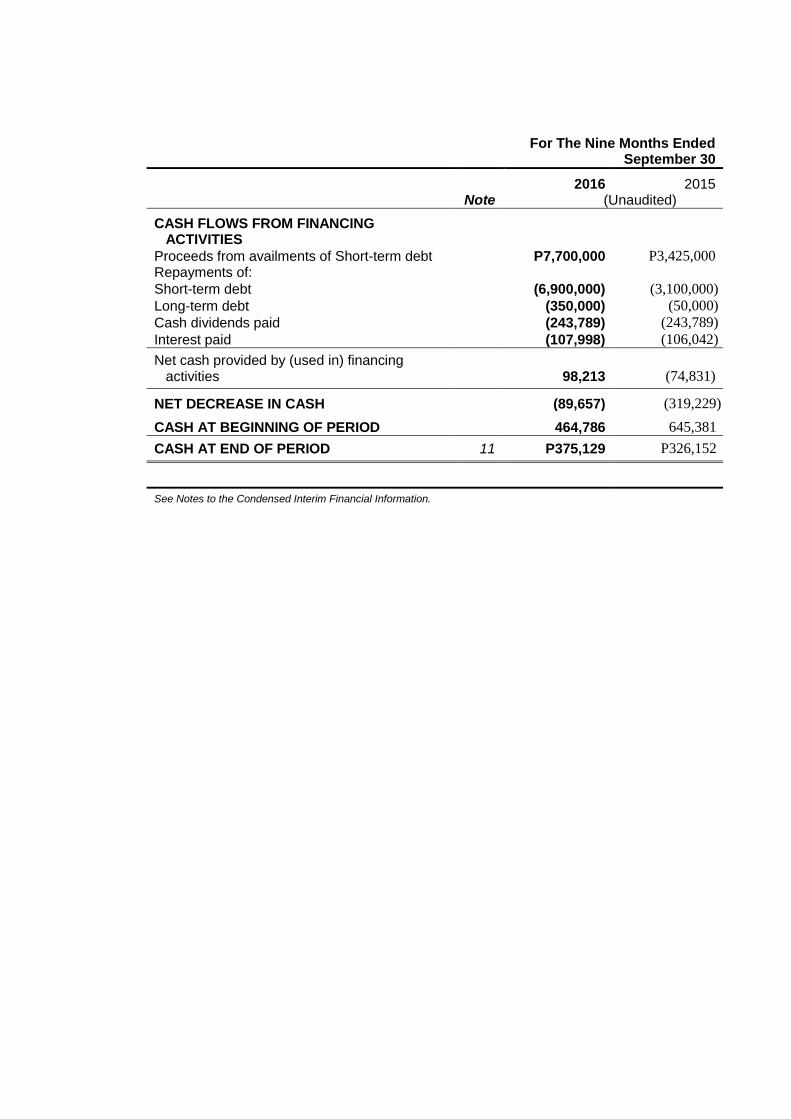
For The Nine Months Ended
September 30
2016 2015 Note (Unaudited)
CASH FLOWS FROM FINANCING ACTIVITIES
Proceeds from availments of Short-term debt P7,700,000 P3,425,000 Repayments of:
Short-term debt (6,900,000) (3,100,000)
Long-term debt (350,000) (50,000)
Cash dividends paid (243,789) (243,789)
Interest paid (107,998) (106,042)
Net cash provided by (used in) financing activities 98,213 (74,831)
NET DECREASE IN CASH (89,657) (319,229)
CASH AT BEGINNING OF PERIOD 464,786 645,381
CASH AT END OF PERIOD 11 P375,129 P326,152
See Notes to the Condensed Interim Financial Information.
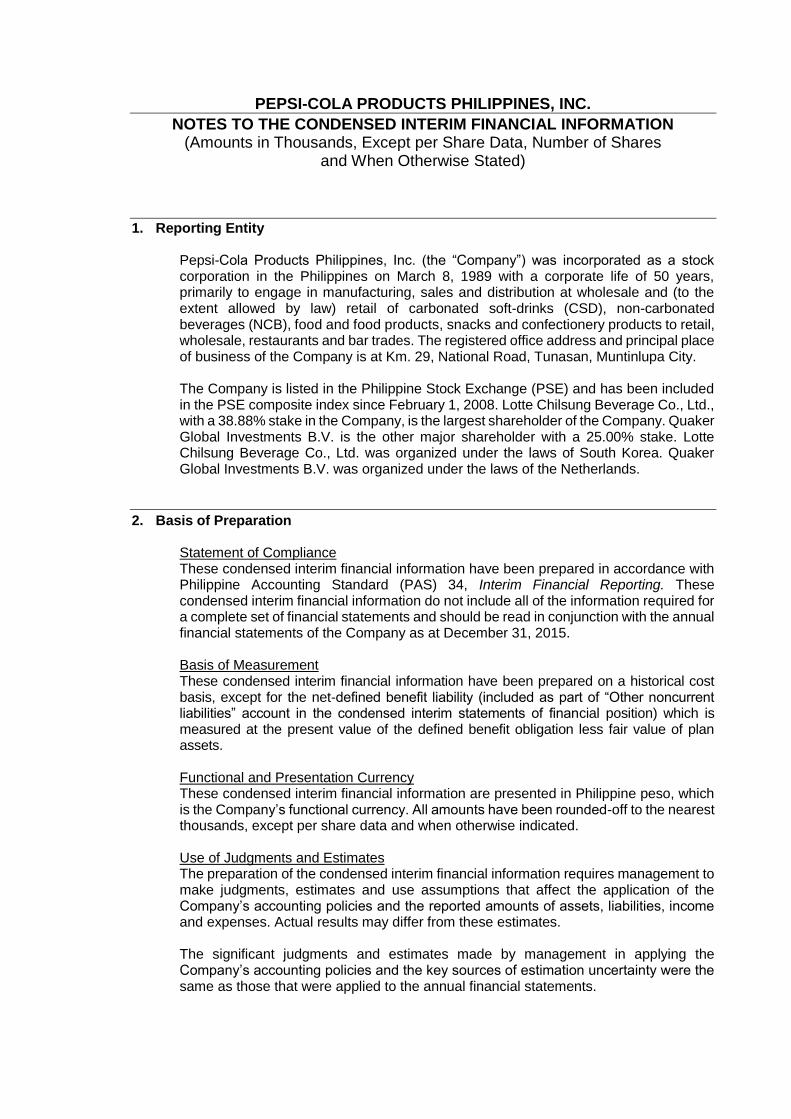
PEPSI-COLA PRODUCTS PHILIPPINES, INC.
NOTES TO THE CONDENSED INTERIM FINANCIAL INFORMATION (Amounts in Thousands, Except per Share Data, Number of Shares
and When Otherwise Stated)
1. Reporting Entity Pepsi-Cola Products Philippines, Inc. (the “Company”) was incorporated as a stock corporation in the Philippines on March 8, 1989 with a corporate life of 50 years, primarily to engage in manufacturing, sales and distribution at wholesale and (to the extent allowed by law) retail of carbonated soft-drinks (CSD), non-carbonated beverages (NCB), food and food products, snacks and confectionery products to retail, wholesale, restaurants and bar trades. The registered office address and principal place of business of the Company is at Km. 29, National Road, Tunasan, Muntinlupa City. The Company is listed in the Philippine Stock Exchange (PSE) and has been included in the PSE composite index since February 1, 2008. Lotte Chilsung Beverage Co., Ltd., with a 38.88% stake in the Company, is the largest shareholder of the Company. Quaker Global Investments B.V. is the other major shareholder with a 25.00% stake. Lotte Chilsung Beverage Co., Ltd. was organized under the laws of South Korea. Quaker Global Investments B.V. was organized under the laws of the Netherlands.
2. Basis of Preparation Statement of Compliance These condensed interim financial information have been prepared in accordance with Philippine Accounting Standard (PAS) 34, Interim Financial Reporting. These condensed interim financial information do not include all of the information required for a complete set of financial statements and should be read in conjunction with the annual financial statements of the Company as at December 31, 2015. Basis of Measurement These condensed interim financial information have been prepared on a historical cost basis, except for the net-defined benefit liability (included as part of “Other noncurrent liabilities” account in the condensed interim statements of financial position) which is measured at the present value of the defined benefit obligation less fair value of plan assets. Functional and Presentation Currency These condensed interim financial information are presented in Philippine peso, which is the Company’s functional currency. All amounts have been rounded-off to the nearest thousands, except per share data and when otherwise indicated. Use of Judgments and Estimates The preparation of the condensed interim financial information requires management to make judgments, estimates and use assumptions that affect the application of the Company’s accounting policies and the reported amounts of assets, liabilities, income and expenses. Actual results may differ from these estimates. The significant judgments and estimates made by management in applying the Company’s accounting policies and the key sources of estimation uncertainty were the same as those that were applied to the annual financial statements.
- 2 -
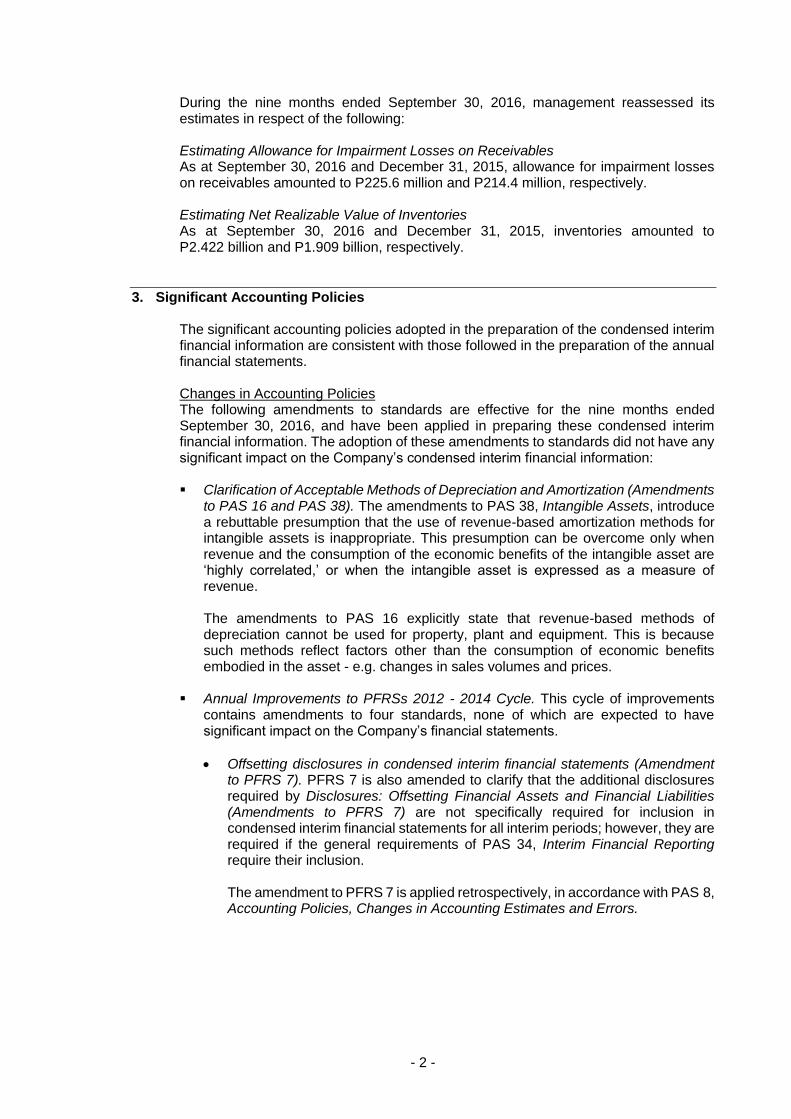
During the nine months ended September 30, 2016, management reassessed its estimates in respect of the following: Estimating Allowance for Impairment Losses on Receivables As at September 30, 2016 and December 31, 2015, allowance for impairment losses on receivables amounted to P225.6 million and P214.4 million, respectively. Estimating Net Realizable Value of Inventories As at September 30, 2016 and December 31, 2015, inventories amounted to P2.422 billion and P1.909 billion, respectively.
3. Significant Accounting Policies
The significant accounting policies adopted in the preparation of the condensed interim financial information are consistent with those followed in the preparation of the annual financial statements. Changes in Accounting Policies The following amendments to standards are effective for the nine months ended September 30, 2016, and have been applied in preparing these condensed interim financial information. The adoption of these amendments to standards did not have any significant impact on the Company’s condensed interim financial information: Clarification of Acceptable Methods of Depreciation and Amortization (Amendments
to PAS 16 and PAS 38). The amendments to PAS 38, Intangible Assets, introduce a rebuttable presumption that the use of revenue-based amortization methods for intangible assets is inappropriate. This presumption can be overcome only when revenue and the consumption of the economic benefits of the intangible asset are ‘highly correlated,’ or when the intangible asset is expressed as a measure of revenue. The amendments to PAS 16 explicitly state that revenue-based methods of depreciation cannot be used for property, plant and equipment. This is because such methods reflect factors other than the consumption of economic benefits embodied in the asset - e.g. changes in sales volumes and prices.
Annual Improvements to PFRSs 2012 - 2014 Cycle. This cycle of improvements contains amendments to four standards, none of which are expected to have significant impact on the Company’s financial statements.
Offsetting disclosures in condensed interim financial statements (Amendment to PFRS 7). PFRS 7 is also amended to clarify that the additional disclosures required by Disclosures: Offsetting Financial Assets and Financial Liabilities (Amendments to PFRS 7) are not specifically required for inclusion in condensed interim financial statements for all interim periods; however, they are required if the general requirements of PAS 34, Interim Financial Reporting require their inclusion. The amendment to PFRS 7 is applied retrospectively, in accordance with PAS 8, Accounting Policies, Changes in Accounting Estimates and Errors.
- 3 -
Disclosure of information “elsewhere in the interim financial report’ (Amendment to PAS 34). PAS 34 is amended to clarify that certain disclosures, if they are not included in the notes to interim financial statements, may be disclosed “elsewhere in the interim financial report” - i.e. incorporated by cross-reference from the interim financial statements to another part of the interim financial report (e.g. management commentary or risk report). The interim financial report is incomplete if the interim financial statements and any disclosure incorporated by cross‑ reference are not made available to users of the interim financial statements on the same terms and at the same time. The amendment to PAS 34 is applied retrospectively, in accordance with PAS 8.
Disclosure Initiative (Amendments to PAS 1, Presentation of Financial Statements) addresses some concerns expressed about existing presentation and disclosure requirements and to ensure that entities are able to use judgment when applying PAS 1. The amendments clarify that:
Information should not be obscured by aggregating or by providing immaterial information.
Materiality considerations apply to all parts of the financial statements, even when a standard requires a specific disclosure.
The list of line items to be presented in the statement of financial position and statement of profit or loss and other comprehensive income can be disaggregated and aggregated as relevant and additional guidance on subtotals in these statements.
An entity’s share of other comprehensive income of equity-accounted associates and joint ventures should be presented in aggregate as single line items based on whether or not it will subsequently be reclassified to profit or loss.
New Standards and Amendments to Standards Not Yet Adopted The new standards and amendments to standards discussed below is effective for annual periods beginning on or after January 1, 2018, and have not been applied in preparing these condensed interim financial information. To be Adopted on January 1, 2018 PFRS 9, Financial Instruments (2014). PFRS 9 (2014) replaces PAS 39, Financial
Instruments: Recognition and Measurement, and supersedes the previously published versions of PFRS 9 that introduced new classifications and measurement requirements (in 2009 and 2010) and a new hedge accounting model (in 2013). PFRS 9 includes revised guidance on the classification and measurement of financial assets, including a new expected credit loss model for calculating impairment, guidance on own credit risk on financial liabilities measured at fair value and supplements the new general hedge accounting requirements published in 2013. PFRS 9 incorporates new hedge accounting requirements that represent a major overhaul of hedge accounting and introduces significant improvements by aligning the accounting more closely with risk management. The new standard is to be applied retrospectively for annual periods beginning on or after January 1, 2018 with early adoption permitted.
- 4 -
The Company has decided not to early adopt PFRS 9 (2014) for its 2014 financial reporting. Based on management’s review, the new standard will potentially have an impact on the classification of its financial assets, but will have no significant impact on the measurement of its outstanding financial assets and financial liabilities.
Pending approval of local adoption of PFRS 15, Revenue from Contracts with
Customers PFRS 15, Revenue from Contracts with Customers, replaces PAS 11, Construction
Contracts, PAS 18, Revenue, IFRIC 13, Customer Loyalty Programmes, IFRIC 18, Transfer of Assets from Customers, and SIC-31, Revenue - Barter Transactions Involving Advertising Services. The new standard introduces a new revenue recognition model for contracts with customers which specifies that revenue should be recognized when (or as) a company transfers control of goods or services to a customer at the amount to which the company expects to be entitled. Depending on whether certain criteria are met, revenue is recognized over time, in a manner that best reflects the company’s performance, or at a point in time, when control of the goods or services is transferred to the customer. The standard does not apply to insurance contracts, financial instruments or lease contracts, which fall in the scope of other PFRSs. It also does not apply if two companies in the same line of business exchange non-monetary assets to facilitate sales to other parties. Furthermore, if a contract with a customer is partly in the scope of another PFRS, then the guidance on separation and measurement contained in the other PFRS takes precedence. However, the FRSC has yet to issue/approve this new revenue standard for local adoption pending completion of a study by the Philippine Interpretations Committee on its impact on the real estate industry. If approved, the standard is effective for annual periods beginning on or after January 1, 2018, with early adoption permitted.
Effective January 1, 2019 PFRS 16, Leases, supersedes PAS 17, Leases, and the following Philippine
Interpretations:
IFRIC 4, Determining whether an Arrangement contains a Lease;
SIC-15, Operating Leases-Incentives; and
SIC 27, Evaluating the Substance of Transactions Involving the Legal Form of a Lease.
The new standard introduces a single lease accounting model for lessees under which all major leases are recognized on-balance sheet, removing the lease classification test. Lease accounting for lessors essentially remains unchanged except for a number of details including the application of the new lease definition, new sale-and-leaseback guidance, new sub-lease guidance and new disclosure requirements. Practical expedients and targeted reliefs were introduced including an optional lessee exemption for short-term leases (leases with a term of 12 months or less) and low-value items, as well as the permission of portfolio-level accounting instead of applying the requirements to individual leases.
- 5 -
New estimates and judgmental thresholds that affect the identification, classification and measurement of lease transactions, as well as requirements to reassess certain key estimates and judgments at each reporting date were introduced. The standard is effective for annual periods beginning on or after January 1, 2019. Early adoption is not permitted until the FRSC has adopted the new revenue recognition standard, PFRS 15.
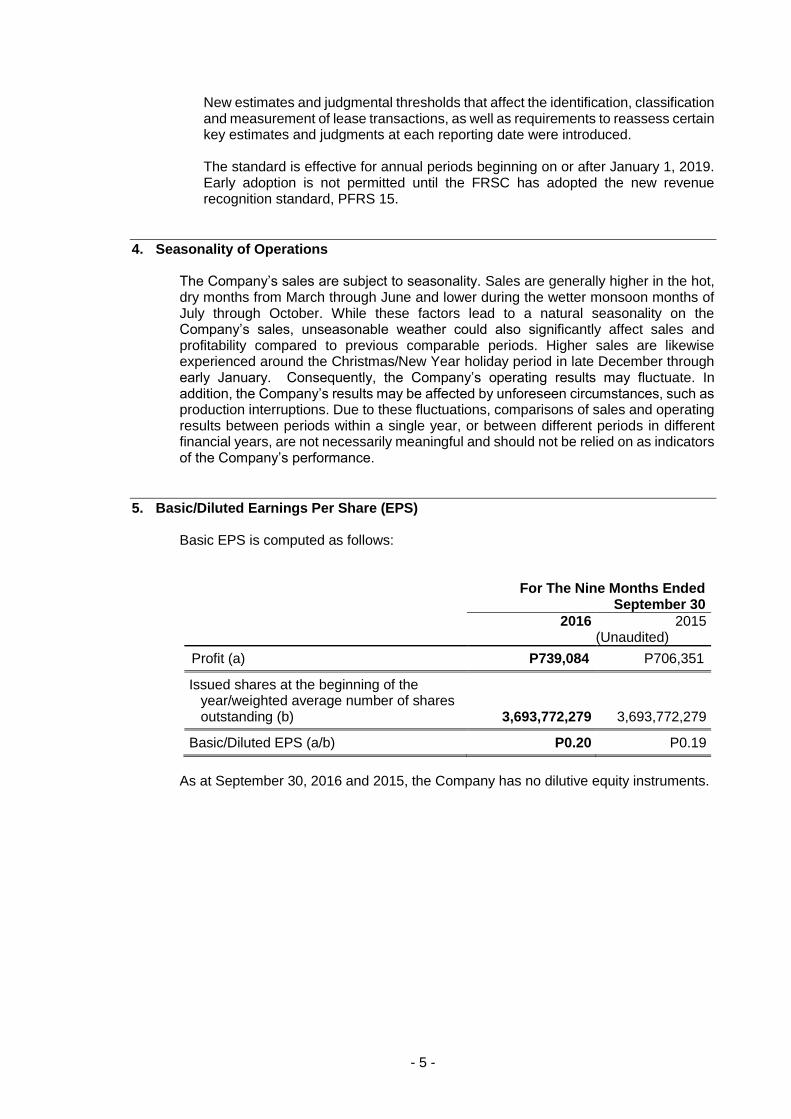
4. Seasonality of Operations The Company’s sales are subject to seasonality. Sales are generally higher in the hot, dry months from March through June and lower during the wetter monsoon months of July through October. While these factors lead to a natural seasonality on the Company’s sales, unseasonable weather could also significantly affect sales and profitability compared to previous comparable periods. Higher sales are likewise experienced around the Christmas/New Year holiday period in late December through early January. Consequently, the Company’s operating results may fluctuate. In addition, the Company’s results may be affected by unforeseen circumstances, such as production interruptions. Due to these fluctuations, comparisons of sales and operating results between periods within a single year, or between different periods in different financial years, are not necessarily meaningful and should not be relied on as indicators of the Company’s performance.
5. Basic/Diluted Earnings Per Share (EPS) Basic EPS is computed as follows:
For The Nine Months Ended
September 30
2016 2015 (Unaudited)
Profit (a) P739,084 P706,351
Issued shares at the beginning of the year/weighted average number of shares outstanding (b) 3,693,772,279 3,693,772,279
Basic/Diluted EPS (a/b) P0.20 P0.19
As at September 30, 2016 and 2015, the Company has no dilutive equity instruments.
- 6 -
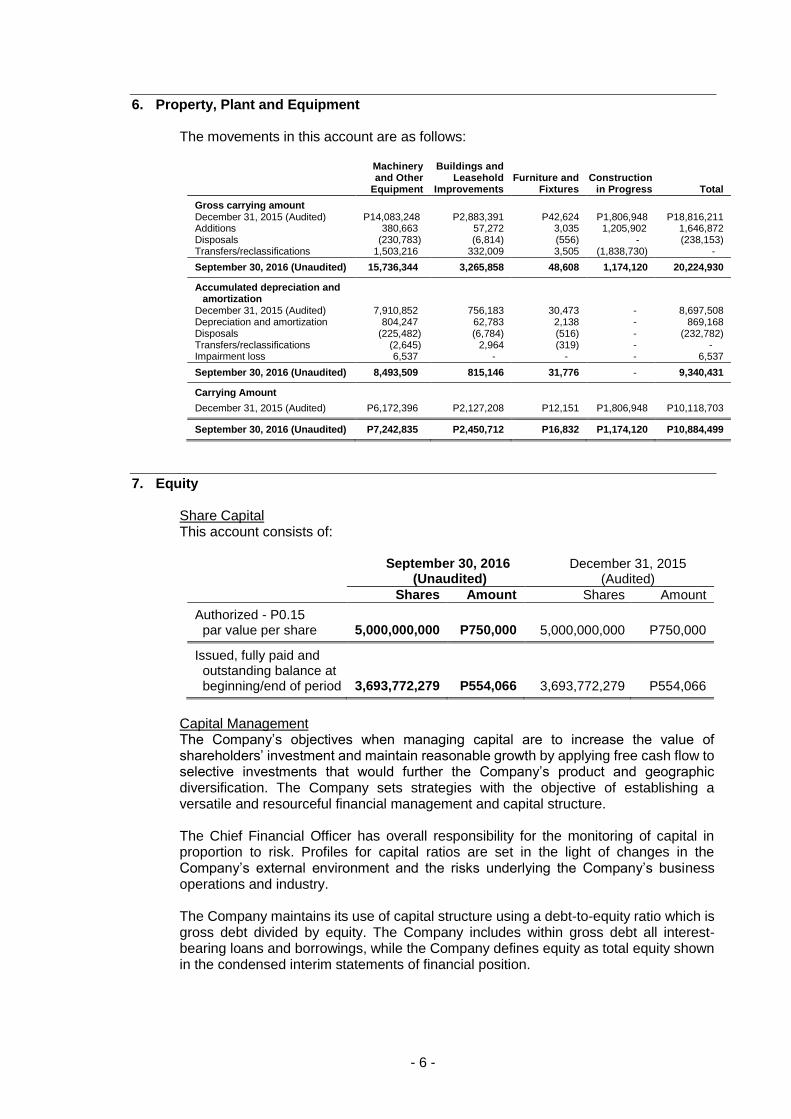
6. Property, Plant and Equipment The movements in this account are as follows:
Machinery and Other
Equipment
Buildings and Leasehold
Improvements Furniture and
Fixtures Construction
in Progress
Total
Gross carrying amount December 31, 2015 (Audited) P14,083,248 P2,883,391 P42,624 P1,806,948 P18,816,211 Additions 380,663 57,272 3,035 1,205,902 1,646,872 Disposals (230,783) (6,814) (556) - (238,153) Transfers/reclassifications 1,503,216 332,009 3,505 (1,838,730) -
September 30, 2016 (Unaudited) 15,736,344 3,265,858 48,608 1,174,120 20,224,930
Accumulated depreciation and amortization
December 31, 2015 (Audited) 7,910,852 756,183 30,473 - 8,697,508 Depreciation and amortization 804,247 62,783 2,138 - 869,168 Disposals (225,482) (6,784) (516) - (232,782) Transfers/reclassifications (2,645) 2,964 (319) - - Impairment loss 6,537 - - - 6,537
September 30, 2016 (Unaudited) 8,493,509 815,146 31,776 - 9,340,431
Carrying Amount
December 31, 2015 (Audited) P6,172,396 P2,127,208 P12,151 P1,806,948 P10,118,703
September 30, 2016 (Unaudited) P7,242,835 P2,450,712 P16,832 P1,174,120 P10,884,499
7. Equity Share Capital This account consists of:
September 30, 2016 December 31, 2015 (Unaudited) (Audited)
Shares Amount Shares Amount
Authorized - P0.15 par value per share 5,000,000,000 P750,000 5,000,000,000 P750,000
Issued, fully paid and outstanding balance at beginning/end of period 3,693,772,279 P554,066 3,693,772,279 P554,066
Capital Management The Company’s objectives when managing capital are to increase the value of shareholders’ investment and maintain reasonable growth by applying free cash flow to selective investments that would further the Company’s product and geographic diversification. The Company sets strategies with the objective of establishing a versatile and resourceful financial management and capital structure. The Chief Financial Officer has overall responsibility for the monitoring of capital in proportion to risk. Profiles for capital ratios are set in the light of changes in the Company’s external environment and the risks underlying the Company’s business operations and industry. The Company maintains its use of capital structure using a debt-to-equity ratio which is gross debt divided by equity. The Company includes within gross debt all interest-bearing loans and borrowings, while the Company defines equity as total equity shown in the condensed interim statements of financial position.
- 7 -
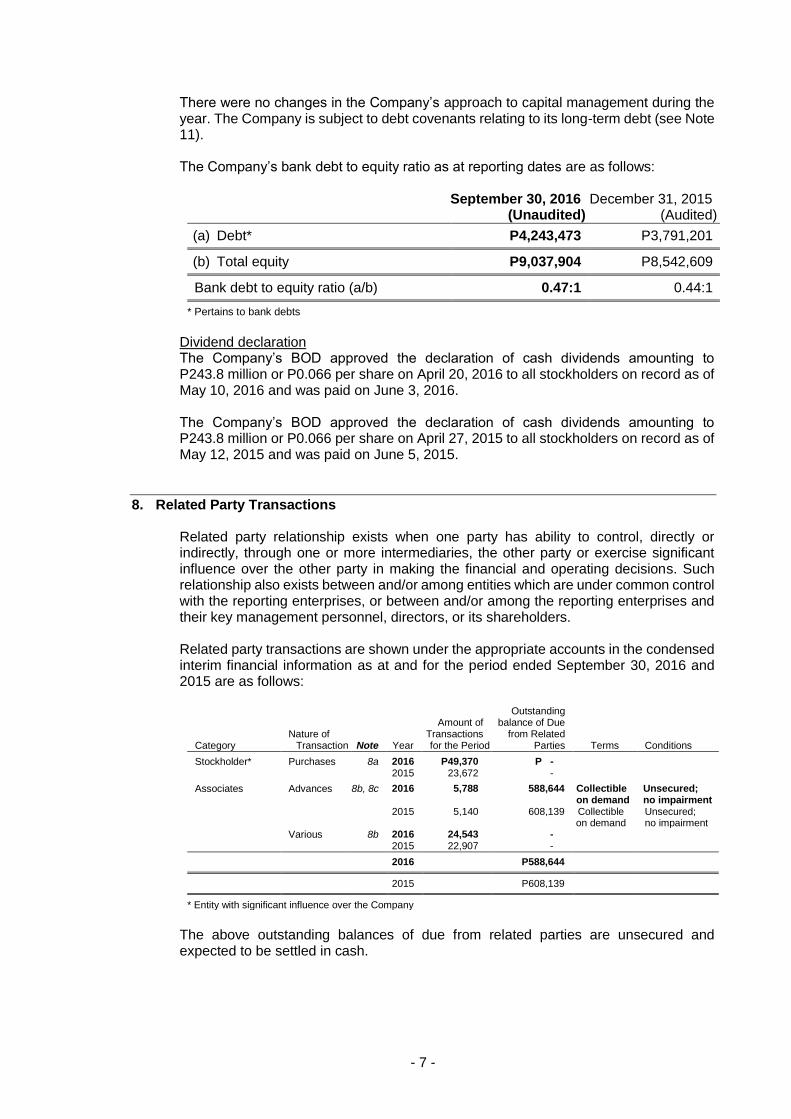
There were no changes in the Company’s approach to capital management during the year. The Company is subject to debt covenants relating to its long-term debt (see Note 11). The Company’s bank debt to equity ratio as at reporting dates are as follows:
September 30, 2016 December 31, 2015 (Unaudited) (Audited)
(a) Debt* P4,243,473 P3,791,201
(b) Total equity P9,037,904 P8,542,609
Bank debt to equity ratio (a/b) 0.47:1 0.44:1
* Pertains to bank debts
Dividend declaration The Company’s BOD approved the declaration of cash dividends amounting to P243.8 million or P0.066 per share on April 20, 2016 to all stockholders on record as of May 10, 2016 and was paid on June 3, 2016. The Company’s BOD approved the declaration of cash dividends amounting to P243.8 million or P0.066 per share on April 27, 2015 to all stockholders on record as of May 12, 2015 and was paid on June 5, 2015.
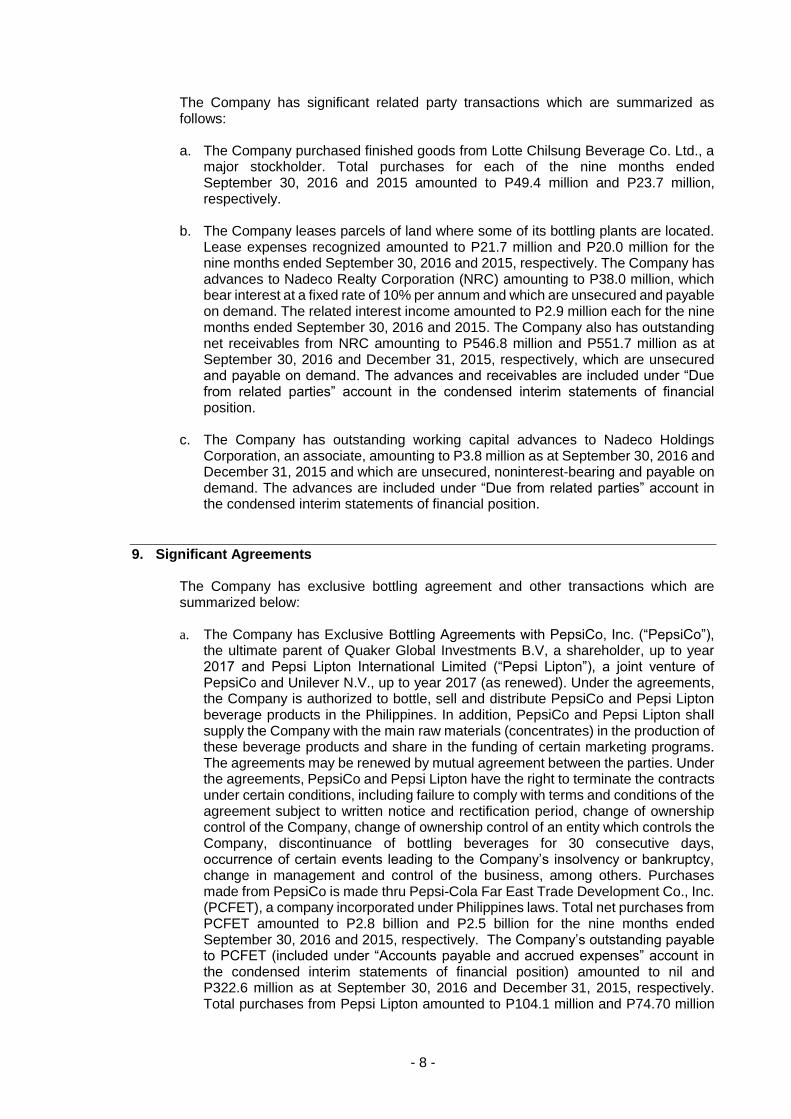
8. Related Party Transactions Related party relationship exists when one party has ability to control, directly or indirectly, through one or more intermediaries, the other party or exercise significant influence over the other party in making the financial and operating decisions. Such relationship also exists between and/or among entities which are under common control with the reporting enterprises, or between and/or among the reporting enterprises and their key management personnel, directors, or its shareholders. Related party transactions are shown under the appropriate accounts in the condensed interim financial information as at and for the period ended September 30, 2016 and 2015 are as follows:
Category Nature of
Transaction Note Year
Amount of Transactions for the Period
Outstanding balance of Due
from Related Parties Terms Conditions
Stockholder* Purchases 8a 2016 P49,370 P - 2015 23,672 -
Associates Advances 8b, 8c 2016 5,788 588,644 Collectible on demand
Unsecured; no impairment
2015 5,140 608,139 Collectible on demand
Unsecured; no impairment
Various 8b 2016 24,543 - 2015 22,907 -
2016 P588,644
2015 P608,139
* Entity with significant influence over the Company
The above outstanding balances of due from related parties are unsecured and expected to be settled in cash.
- 8 -
The Company has significant related party transactions which are summarized as follows: a. The Company purchased finished goods from Lotte Chilsung Beverage Co. Ltd., a
major stockholder. Total purchases for each of the nine months ended September 30, 2016 and 2015 amounted to P49.4 million and P23.7 million, respectively.
b. The Company leases parcels of land where some of its bottling plants are located.
Lease expenses recognized amounted to P21.7 million and P20.0 million for the nine months ended September 30, 2016 and 2015, respectively. The Company has advances to Nadeco Realty Corporation (NRC) amounting to P38.0 million, which bear interest at a fixed rate of 10% per annum and which are unsecured and payable on demand. The related interest income amounted to P2.9 million each for the nine months ended September 30, 2016 and 2015. The Company also has outstanding net receivables from NRC amounting to P546.8 million and P551.7 million as at September 30, 2016 and December 31, 2015, respectively, which are unsecured and payable on demand. The advances and receivables are included under “Due from related parties” account in the condensed interim statements of financial position.
c. The Company has outstanding working capital advances to Nadeco Holdings
Corporation, an associate, amounting to P3.8 million as at September 30, 2016 and December 31, 2015 and which are unsecured, noninterest-bearing and payable on demand. The advances are included under “Due from related parties” account in the condensed interim statements of financial position.
9. Significant Agreements The Company has exclusive bottling agreement and other transactions which are summarized below: a. The Company has Exclusive Bottling Agreements with PepsiCo, Inc. (“PepsiCo”),
the ultimate parent of Quaker Global Investments B.V, a shareholder, up to year 2017 and Pepsi Lipton International Limited (“Pepsi Lipton”), a joint venture of PepsiCo and Unilever N.V., up to year 2017 (as renewed). Under the agreements, the Company is authorized to bottle, sell and distribute PepsiCo and Pepsi Lipton beverage products in the Philippines. In addition, PepsiCo and Pepsi Lipton shall supply the Company with the main raw materials (concentrates) in the production of these beverage products and share in the funding of certain marketing programs. The agreements may be renewed by mutual agreement between the parties. Under the agreements, PepsiCo and Pepsi Lipton have the right to terminate the contracts under certain conditions, including failure to comply with terms and conditions of the agreement subject to written notice and rectification period, change of ownership control of the Company, change of ownership control of an entity which controls the Company, discontinuance of bottling beverages for 30 consecutive days, occurrence of certain events leading to the Company’s insolvency or bankruptcy, change in management and control of the business, among others. Purchases made from PepsiCo is made thru Pepsi-Cola Far East Trade Development Co., Inc. (PCFET), a company incorporated under Philippines laws. Total net purchases from PCFET amounted to P2.8 billion and P2.5 billion for the nine months ended September 30, 2016 and 2015, respectively. The Company’s outstanding payable to PCFET (included under “Accounts payable and accrued expenses” account in the condensed interim statements of financial position) amounted to nil and P322.6 million as at September 30, 2016 and December 31, 2015, respectively. Total purchases from Pepsi Lipton amounted to P104.1 million and P74.70 million
- 9 -
for each of the nine months ended September 30, 2016 and 2015, respectively. The Company’s outstanding payable to Pepsi Lipton (included under “Accounts payable and accrued expenses” account in the statements of financial position) amounted to P64.9 million and P25.8 million as at September 30, 2016 and December 31, 2015, respectively.
b. The Company has cooperative advertising and marketing programs with PepsiCo
and Pepsi Lipton thru PCFET that sets forth the agreed advertising and marketing activities and participation arrangement during the years covered by the bottling agreements. In certain instances, the Company pays for the said expenses and claims reimbursements from PepsiCo thru PCFET. The Company incurred marketing expenses amounting to P600.3 million and P572.6 million for the nine months ended September 30, 2016 and 2015, respectively. The Company’s outstanding receivable from PCFET included under “Receivables” account in the condensed interim statements of financial position, which are unsecured and are payable on demand, amounted to P118.3 million and P158.5 million as at September 30, 2016 and December 31, 2015, respectively.
c. On April 11, 2007, the Company entered into a Performance Agreement with
PepsiCo to meet certain marketing and investment levels from 2007 to 2017, as required by the bottling agreement with PepsiCo. The agreement requires the Company to: (1) spend a specified percentage with a minimum amount for the beverage products; (2) make certain investments based on a minimum percentage of the Company’s sales to expand the Company’s manufacturing capacity; (3) invest in a minimum number of coolers per year to support distribution expansion; and (4) expand the Company’s distribution capabilities in terms of the number of active routes, the number of new routes and the number of trucks used for distribution support.
d. On December 20, 2014, the Company has Exclusive Snacks Franchising
Appointment with The Concentrate Manufacturing Company of Ireland (“CMGI”), a Company incorporated in Ireland. Under the agreement, the Company is authorized to manufacture, process, package, distribute and sell the products within the territory in accordance with the agreement. In addition, CGMI shall supply the Company with the main raw materials in the production of these snacks products and share in the funding of certain marketing programs. The agreements may be renewed by mutual agreement between the parties. Under the agreements, CGMI has the right to terminate the contracts under certain conditions, including failure to comply with terms and conditions of the agreement subject to written notice and rectification period, change of ownership control of the Company, change of ownership control of an entity which controls the Company, discontinuance of manufacturing products for 30 consecutive days, among others.
e. On December 20, 2014, the Company entered into a Business Development
Agreement with CGMI to meet certain sales volume objectives through: (1) growing distribution through active sales and distribution system, (2) ensuring pack price competitive presence, and (3) growing salty share and volume. The agreement sets forth the agreed advertising and marketing activities and participation and purchase of seasoning during the years covered by the agreements. The Company incurred marketing expenses amounting to P65.3 million for the nine months ended September 30, 2016. Total net purchases from CGMI amounted to P66.6 million for the nine months ended September 30, 2016. The Company’s outstanding payable to CGMI (included under “Accounts payable and accrued expenses” account in the statements of financial position) amounted to P77.5 million and P6.6 million as at September 30, 2016 and December 31, 2015, respectively.
- 10 -
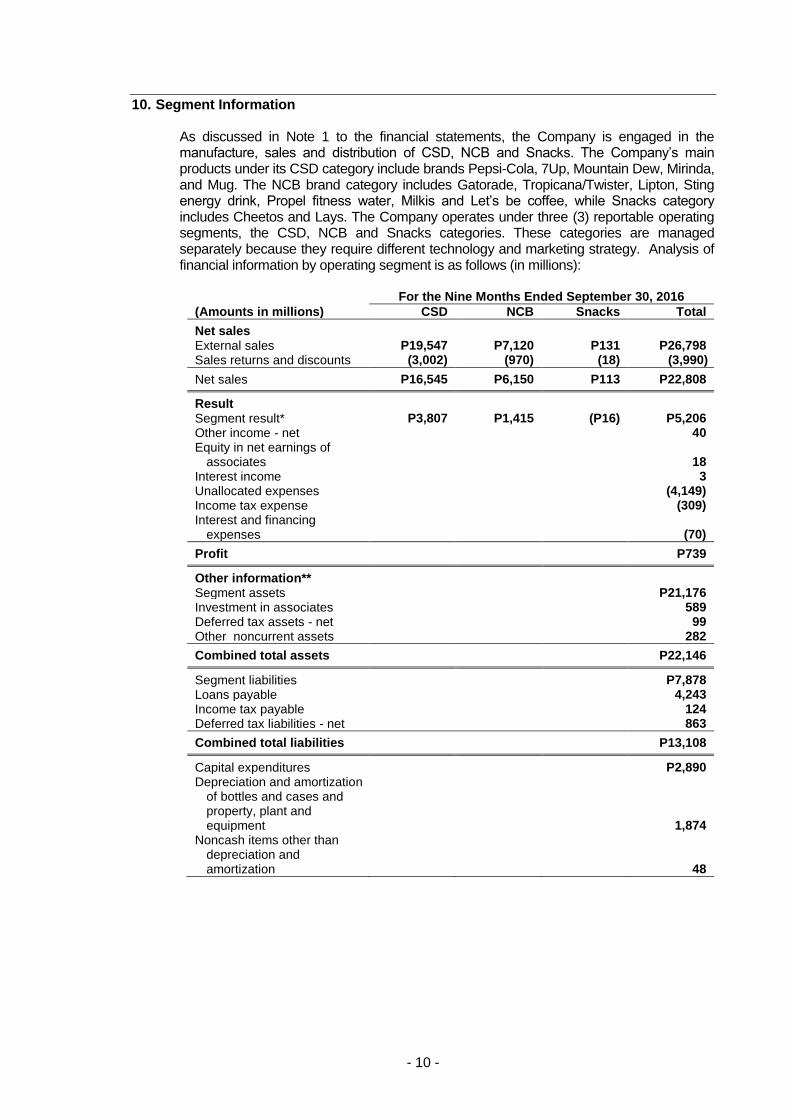
10. Segment Information As discussed in Note 1 to the financial statements, the Company is engaged in the manufacture, sales and distribution of CSD, NCB and Snacks. The Company’s main products under its CSD category include brands Pepsi-Cola, 7Up, Mountain Dew, Mirinda, and Mug. The NCB brand category includes Gatorade, Tropicana/Twister, Lipton, Sting energy drink, Propel fitness water, Milkis and Let’s be coffee, while Snacks category includes Cheetos and Lays. The Company operates under three (3) reportable operating segments, the CSD, NCB and Snacks categories. These categories are managed separately because they require different technology and marketing strategy. Analysis of financial information by operating segment is as follows (in millions):
For the Nine Months Ended September 30, 2016
(Amounts in millions) CSD NCB Snacks Total
Net sales External sales P19,547 P7,120 P131 P26,798 Sales returns and discounts (3,002) (970) (18) (3,990)
Net sales P16,545 P6,150 P113 P22,808
Result Segment result* P3,807 P1,415 (P16) P5,206 Other income - net 40 Equity in net earnings of
associates 18 Interest income 3 Unallocated expenses (4,149) Income tax expense (309) Interest and financing
expenses (70)
Profit P739
Other information** Segment assets P21,176 Investment in associates 589 Deferred tax assets - net 99 Other noncurrent assets 282
Combined total assets P22,146
Segment liabilities P7,878 Loans payable 4,243 Income tax payable 124 Deferred tax liabilities - net 863
Combined total liabilities P13,108
Capital expenditures P2,890 Depreciation and amortization
of bottles and cases and property, plant and equipment 1,874
Noncash items other than depreciation and amortization 48
- 11 -
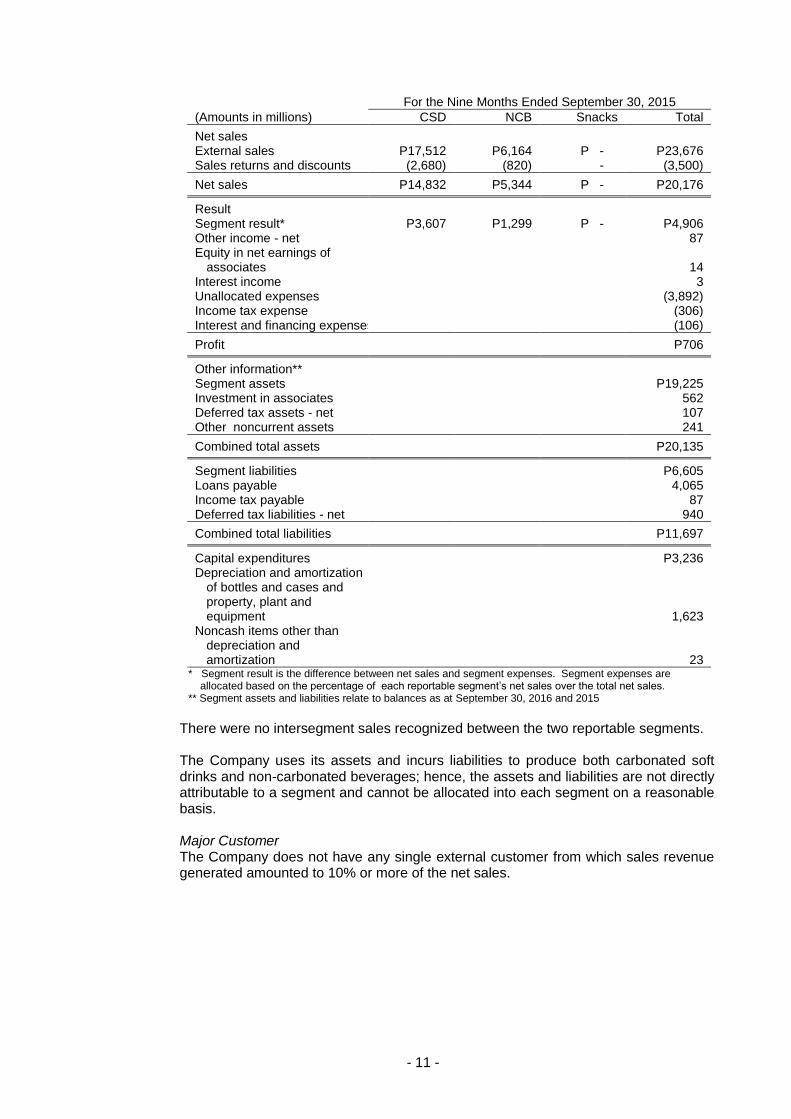
For the Nine Months Ended September 30, 2015
(Amounts in millions) CSD NCB Snacks Total
Net sales External sales P17,512 P6,164 P - P23,676 Sales returns and discounts (2,680) (820) - (3,500)
Net sales P14,832 P5,344 P - P20,176
Result Segment result* P3,607 P1,299 P - P4,906 Other income - net 87 Equity in net earnings of
associates 14 Interest income 3 Unallocated expenses (3,892) Income tax expense (306) Interest and financing expenses (106)
Profit P706
Other information** Segment assets P19,225 Investment in associates 562 Deferred tax assets - net 107 Other noncurrent assets 241
Combined total assets P20,135
Segment liabilities P6,605 Loans payable 4,065 Income tax payable 87 Deferred tax liabilities - net 940
Combined total liabilities P11,697
Capital expenditures P3,236 Depreciation and amortization
of bottles and cases and property, plant and equipment 1,623
Noncash items other than depreciation and amortization 23
* Segment result is the difference between net sales and segment expenses. Segment expenses are allocated based on the percentage of each reportable segment’s net sales over the total net sales.
** Segment assets and liabilities relate to balances as at September 30, 2016 and 2015
There were no intersegment sales recognized between the two reportable segments. The Company uses its assets and incurs liabilities to produce both carbonated soft drinks and non-carbonated beverages; hence, the assets and liabilities are not directly attributable to a segment and cannot be allocated into each segment on a reasonable basis. Major Customer The Company does not have any single external customer from which sales revenue generated amounted to 10% or more of the net sales.
- 12 -
11. Financial Instruments and Financial Risk Management Financial Instruments The Company’s financial instruments are measured as described below: Loans and Receivables. Loans and receivables are nonderivative financial assets with fixed or determinable payments that are not quoted in an active market. They are not entered into with the intention of immediate or short-term resale and are not designated as available for sale financial assets or at fair value through profit or loss (FVPL) financial assets. Loans and receivables are carried at amortized cost, less impairment in value. Amortization is determined using the effective interest method. Gains and losses are recognized in profit or loss when the loans and receivables are derecognized or impaired, as well as through amortization process. Cash includes cash on hands and in banks, which is stated at face value. The Company’s cash, receivables and due from related parties are included in this category. Other Financial Liabilities. This category pertains to financial liabilities that are not held for trading or not designated as at FVPL upon the inception of the liability. These include liabilities arising from operations or borrowings. All loans and borrowing are initially recognized at the fair value of the consideration received less directly attributable debt issuance costs. Debt issuance costs are amortized using the effective interest method and the unamortized portion of debt issuance costs are offset against the related carrying amount of the loan in the condensed interim statements of financial position. Such amortization is booked as part of “Net Finance and Other Income (Expense) - net” account in the condensed interim statements of profit or loss and other comprehensive income. After initial measurement, other financial liabilities are subsequently measured at amortized cost using the effective interest method. Amortized cost is calculated by taking into account any discount or premium on the issue and fees that are an integral part of the effective interest. When loan is paid, the related unamortized debt issuance costs at the date of repayment are charged against current operations. Gains and losses are recognized in profit or loss when the liabilities are derecognized or impaired, as well as through the amortization process. Included in this category are the Company’s short-term and long-term debt and accounts payable and accrued expenses that meet the above definition (other than liabilities covered by other PFRS, such as income tax payable and accrued retirement cost). Offsetting Financial Instruments. Financial assets and financial liabilities are offset and the net amount is presented in the statements of financial position when, and only when, the Company has an enforceable legal right to offset the amounts and intends either to settle on a net basis or to realize the asset and settle the liability simultaneously. This is not generally the case with master netting agreements and the related assets and liabilities are presented gross in the statements of financial position.
- 13 -
Financial Risk Management Overview The Company has exposure to the following risks from its use of financial instruments:
Credit Risk Liquidity Risk Market Risk
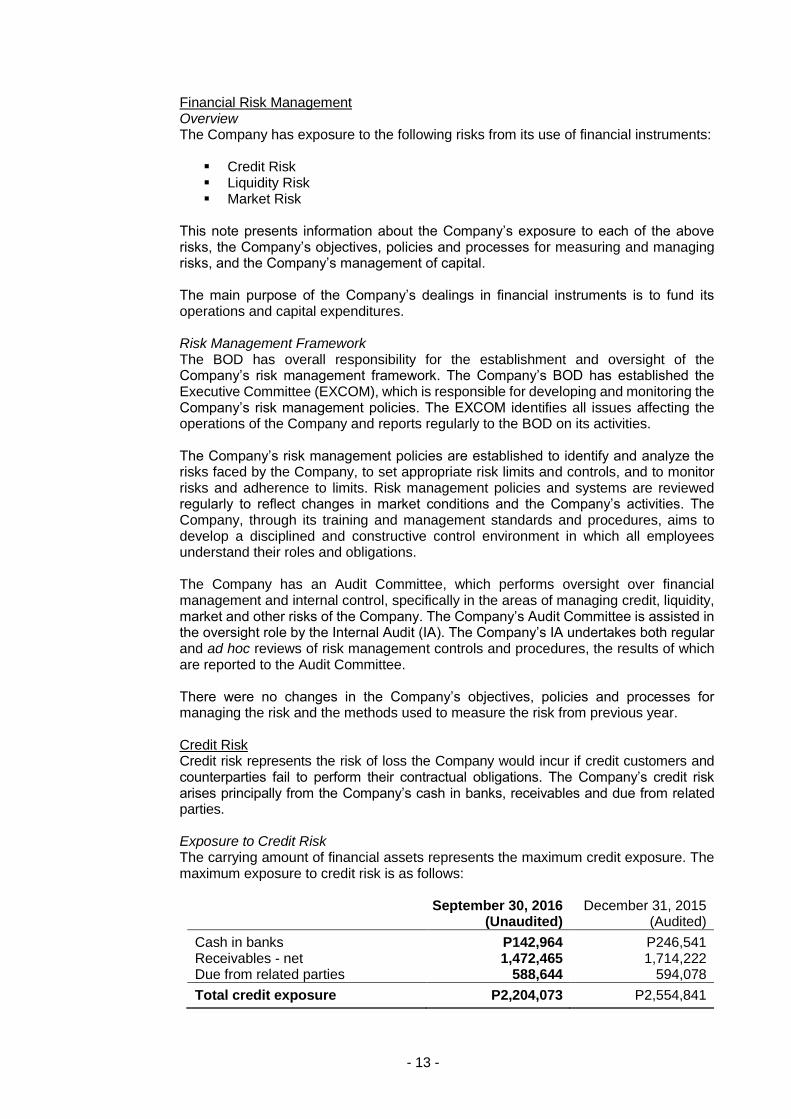
This note presents information about the Company’s exposure to each of the above risks, the Company’s objectives, policies and processes for measuring and managing risks, and the Company’s management of capital. The main purpose of the Company’s dealings in financial instruments is to fund its operations and capital expenditures. Risk Management Framework The BOD has overall responsibility for the establishment and oversight of the Company’s risk management framework. The Company’s BOD has established the Executive Committee (EXCOM), which is responsible for developing and monitoring the Company’s risk management policies. The EXCOM identifies all issues affecting the operations of the Company and reports regularly to the BOD on its activities. The Company’s risk management policies are established to identify and analyze the risks faced by the Company, to set appropriate risk limits and controls, and to monitor risks and adherence to limits. Risk management policies and systems are reviewed regularly to reflect changes in market conditions and the Company’s activities. The Company, through its training and management standards and procedures, aims to develop a disciplined and constructive control environment in which all employees understand their roles and obligations. The Company has an Audit Committee, which performs oversight over financial management and internal control, specifically in the areas of managing credit, liquidity, market and other risks of the Company. The Company’s Audit Committee is assisted in the oversight role by the Internal Audit (IA). The Company’s IA undertakes both regular and ad hoc reviews of risk management controls and procedures, the results of which are reported to the Audit Committee. There were no changes in the Company’s objectives, policies and processes for managing the risk and the methods used to measure the risk from previous year. Credit Risk Credit risk represents the risk of loss the Company would incur if credit customers and counterparties fail to perform their contractual obligations. The Company’s credit risk arises principally from the Company’s cash in banks, receivables and due from related parties. Exposure to Credit Risk The carrying amount of financial assets represents the maximum credit exposure. The maximum exposure to credit risk is as follows:
September 30, 2016 December 31, 2015 (Unaudited) (Audited)
Cash in banks P142,964 P246,541 Receivables - net 1,472,465 1,714,222 Due from related parties 588,644 594,078
Total credit exposure P2,204,073 P2,554,841
- 14 -
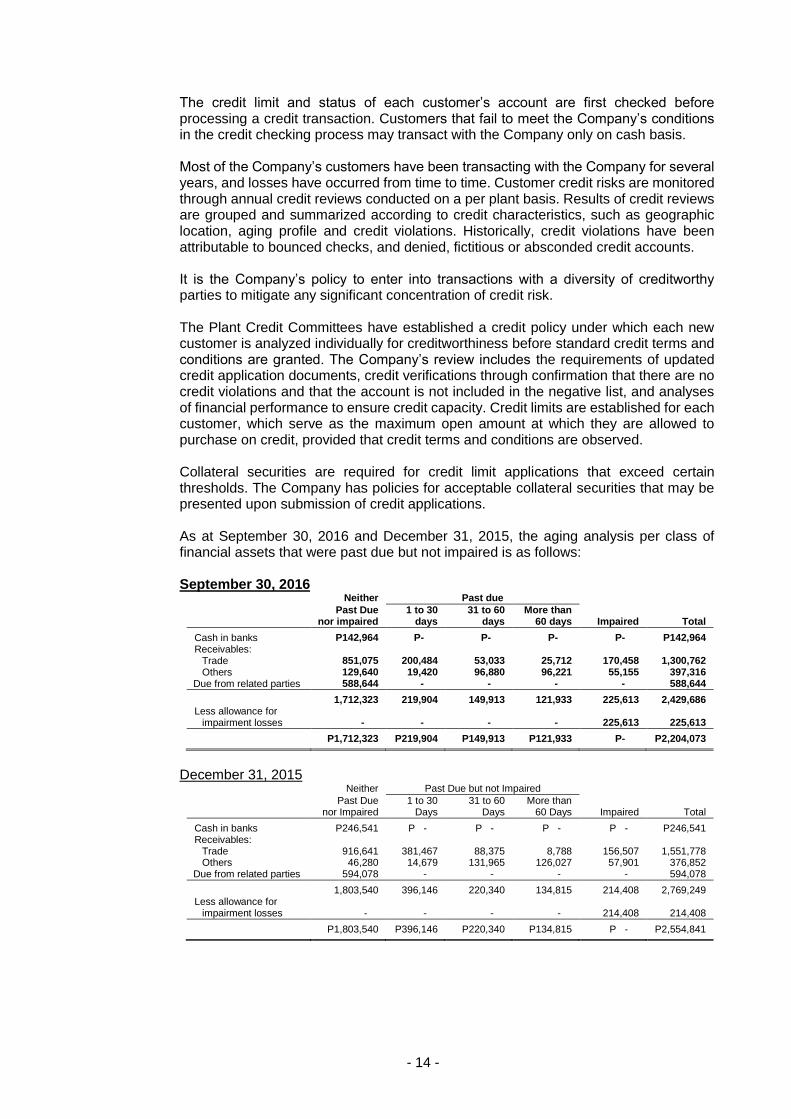
The credit limit and status of each customer’s account are first checked before processing a credit transaction. Customers that fail to meet the Company’s conditions in the credit checking process may transact with the Company only on cash basis. Most of the Company’s customers have been transacting with the Company for several years, and losses have occurred from time to time. Customer credit risks are monitored through annual credit reviews conducted on a per plant basis. Results of credit reviews are grouped and summarized according to credit characteristics, such as geographic location, aging profile and credit violations. Historically, credit violations have been attributable to bounced checks, and denied, fictitious or absconded credit accounts. It is the Company’s policy to enter into transactions with a diversity of creditworthy parties to mitigate any significant concentration of credit risk. The Plant Credit Committees have established a credit policy under which each new customer is analyzed individually for creditworthiness before standard credit terms and conditions are granted. The Company’s review includes the requirements of updated credit application documents, credit verifications through confirmation that there are no credit violations and that the account is not included in the negative list, and analyses of financial performance to ensure credit capacity. Credit limits are established for each customer, which serve as the maximum open amount at which they are allowed to purchase on credit, provided that credit terms and conditions are observed. Collateral securities are required for credit limit applications that exceed certain thresholds. The Company has policies for acceptable collateral securities that may be presented upon submission of credit applications. As at September 30, 2016 and December 31, 2015, the aging analysis per class of financial assets that were past due but not impaired is as follows: September 30, 2016
Neither Past due
Past Due
nor impaired 1 to 30
days 31 to 60
days More than
60 days Impaired Total
Cash in banks P142,964 P- P- P- P- P142,964 Receivables:
Trade 851,075 200,484 53,033 25,712 170,458 1,300,762 Others 129,640 19,420 96,880 96,221 55,155 397,316
Due from related parties 588,644 - - - - 588,644
1,712,323 219,904 149,913 121,933 225,613 2,429,686 Less allowance for
impairment losses - - - - 225,613 225,613
P1,712,323 P219,904 P149,913 P121,933 P- P2,204,073
December 31, 2015
Neither Past Due but not Impaired
Past Due
nor Impaired 1 to 30
Days 31 to 60
Days More than
60 Days Impaired Total
Cash in banks P246,541 P - P - P - P - P246,541 Receivables:
Trade 916,641 381,467 88,375 8,788 156,507 1,551,778 Others 46,280 14,679 131,965 126,027 57,901 376,852
Due from related parties 594,078 - - - - 594,078
1,803,540 396,146 220,340 134,815 214,408 2,769,249 Less allowance for
impairment losses - - - - 214,408 214,408
P1,803,540 P396,146 P220,340 P134,815 P - P2,554,841
- 15 -
As at September 30, 2016 and December 31, 2015, there was an impairment loss of P225.6 million and P214.4 million, respectively, relating to trade and other receivables. The Company believes that the unimpaired amounts that are past due by more than 30 days are still collectible, based on historic payment behavior and extensive analysis of customer credit risk. In addition, the Company believes that the amounts of financial assets that are neither past due nor impaired are collectible, based on historic payment behavior and extensive analysis of counterparties credit risk. The credit qualities of financial assets that were neither past due nor impaired are determined as follows: Cash in banks are based on the credit standing or rating of the counterparty. Total receivables and due from related parties are based on a combination of credit
standing or rating of the counterparty, historical experience and specific and collective credit risk assessment.
High grade cash in banks are deposited in local banks that are considered as top tier banks in the Philippines in terms of resources and profitability. Receivables and due from related parties are considered to be of high grade quality financial assets, where the counter parties have a very remote likelihood of default and have consistently exhibited good paying habits. High grade quality financial assets are those assessed as having minimal credit risk, otherwise they are of standard grade quality. Standard grade quality financial assets are those assessed as having minimal to regular instances of payment default due to ordinary/common collection issues. These accounts are typically not impaired as the counterparties generally respond to credit actions and update their payments accordingly. Liquidity Risk Liquidity risk is the risk that the Company will encounter difficulty in meeting financial obligations as they fall due. The Company manages liquidity risk by forecasting projected cash flows and maintaining a balance between continuity of funding and flexibility. Treasury controls and procedures are in place to ensure that sufficient cash is maintained to cover daily operational and working capital requirements, as well as capital expenditures and debt service payments. Management closely monitors the Company’s future and contingent obligations and sets up required cash reserves as necessary in accordance with internal requirements. In addition, the Company has the following credit facilities: The total commitment as at September 30, 2016 and December 31, 2015 under
the line of credit is P11.067 and P10.169 billion of which the Company had drawn P4.515 billion and P4.463 billion, respectively, under letters of credit short-term loans and long term loans. All facilities under the omnibus line bear interest at floating rates consisting of a margin over current Philippine treasury rates except for the long term loan which have a fixed interest rate; and
P1.105 billion domestic bills purchased line, which are available as at September 30, 2016 and December 31, 2015.
- 16 -
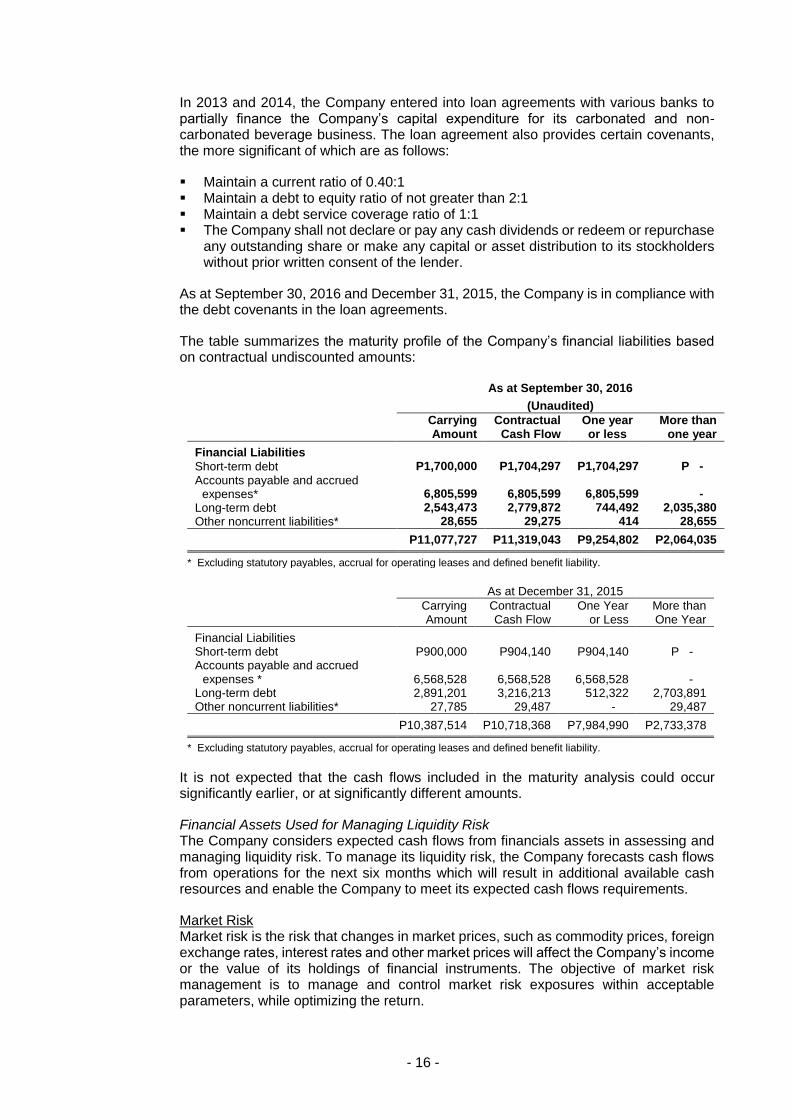
In 2013 and 2014, the Company entered into loan agreements with various banks to partially finance the Company’s capital expenditure for its carbonated and non-carbonated beverage business. The loan agreement also provides certain covenants, the more significant of which are as follows:
Maintain a current ratio of 0.40:1 Maintain a debt to equity ratio of not greater than 2:1 Maintain a debt service coverage ratio of 1:1 The Company shall not declare or pay any cash dividends or redeem or repurchase
any outstanding share or make any capital or asset distribution to its stockholders without prior written consent of the lender.
As at September 30, 2016 and December 31, 2015, the Company is in compliance with the debt covenants in the loan agreements.
The table summarizes the maturity profile of the Company’s financial liabilities based on contractual undiscounted amounts:
As at September 30, 2016
(Unaudited)
Carrying Amount
Contractual Cash Flow
One year or less
More than one year
Financial Liabilities Short-term debt P1,700,000 P1,704,297 P1,704,297 P -
Accounts payable and accrued expenses* 6,805,599 6,805,599 6,805,599 -
Long-term debt 2,543,473 2,779,872 744,492 2,035,380
Other noncurrent liabilities* 28,655 29,275 414 28,655
P11,077,727 P11,319,043 P9,254,802 P2,064,035
* Excluding statutory payables, accrual for operating leases and defined benefit liability.
As at December 31, 2015
Carrying Amount
Contractual Cash Flow
One Year or Less
More than One Year
Financial Liabilities Short-term debt P900,000 P904,140 P904,140 P - Accounts payable and accrued
expenses * 6,568,528 6,568,528 6,568,528 - Long-term debt 2,891,201 3,216,213 512,322 2,703,891 Other noncurrent liabilities* 27,785 29,487 - 29,487
P10,387,514 P10,718,368 P7,984,990 P2,733,378
* Excluding statutory payables, accrual for operating leases and defined benefit liability.
It is not expected that the cash flows included in the maturity analysis could occur significantly earlier, or at significantly different amounts.
Financial Assets Used for Managing Liquidity Risk The Company considers expected cash flows from financials assets in assessing and managing liquidity risk. To manage its liquidity risk, the Company forecasts cash flows from operations for the next six months which will result in additional available cash resources and enable the Company to meet its expected cash flows requirements.
Market Risk Market risk is the risk that changes in market prices, such as commodity prices, foreign exchange rates, interest rates and other market prices will affect the Company’s income or the value of its holdings of financial instruments. The objective of market risk management is to manage and control market risk exposures within acceptable parameters, while optimizing the return.
- 17 -
The Company is subject to various market risks, including risks from changes in commodity prices, interest rates and currency exchange rates.
Exposure to Commodity Prices The risk from commodity price changes relates to the Company’s ability to recover higher product costs through price increases to customers, which may be limited due to the competitive pricing environment that exists in the Philippine beverage market and the willingness of consumers to purchase the same volume of beverages at higher prices. The Company is exposed to changes in Philippine sugar prices.
The Company minimizes its exposure to risks in changes in commodity prices by entering into contracts with suppliers with duration ranging from six months to one year; with fixed volume commitment for the contract duration; and with stipulation for price adjustments depending on market prices. The Company has outstanding purchase commitment amounting to P5.118 billion and P7.179 billion as at September 30, 2016 and December 31, 2015, respectively. Because of these purchase commitments, the Company considers the exposure to commodity price risk to be insignificant.
Exposure to Interest Rate Risk The Company’s exposure to interest rates pertains to its cash in banks, short-term, long-term debt and finance lease obligation. These financial instruments bear fixed interest rates and accordingly, the Company is not significantly exposed to interest rate risk.
Foreign Currency Risk The Company is exposed to foreign currency risk on purchases that are denominated in currencies other than the Philippine peso, mostly in United States (U.S.) dollar. In respect of monetary assets and liabilities held in currencies other than the Philippine peso, the Company ensures that its exposure is kept to an acceptable level, by buying foreign currencies at spot rates where necessary to address short-term imbalances. The Company considered the exposure to foreign currency risk to be insignificant. Further, the Company does not hold any investment in foreign securities as at September 30, 2016 and December 31, 2015.
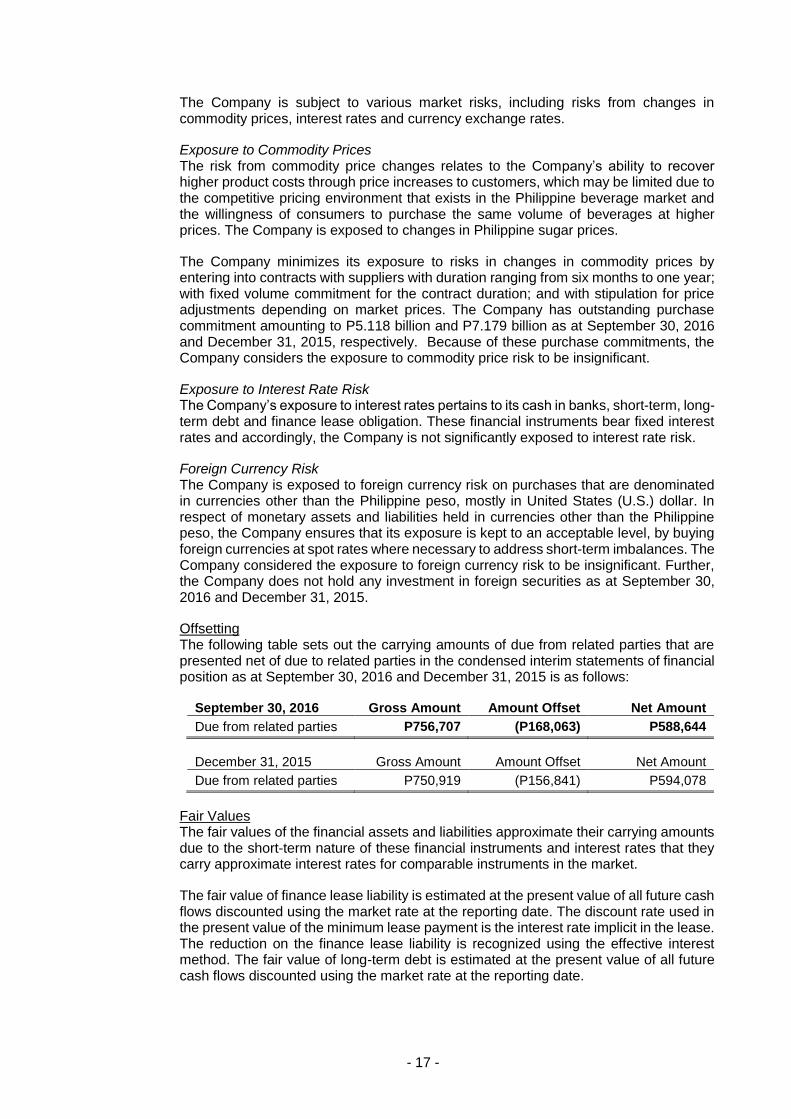
Offsetting The following table sets out the carrying amounts of due from related parties that are presented net of due to related parties in the condensed interim statements of financial position as at September 30, 2016 and December 31, 2015 is as follows:
September 30, 2016 Gross Amount Amount Offset Net Amount
Due from related parties P756,707 (P168,063) P588,644
December 31, 2015 Gross Amount Amount Offset Net Amount
Due from related parties P750,919 (P156,841) P594,078
Fair Values The fair values of the financial assets and liabilities approximate their carrying amounts due to the short-term nature of these financial instruments and interest rates that they carry approximate interest rates for comparable instruments in the market.
The fair value of finance lease liability is estimated at the present value of all future cash flows discounted using the market rate at the reporting date. The discount rate used in the present value of the minimum lease payment is the interest rate implicit in the lease. The reduction on the finance lease liability is recognized using the effective interest method. The fair value of long-term debt is estimated at the present value of all future cash flows discounted using the market rate at the reporting date.
- 18 -
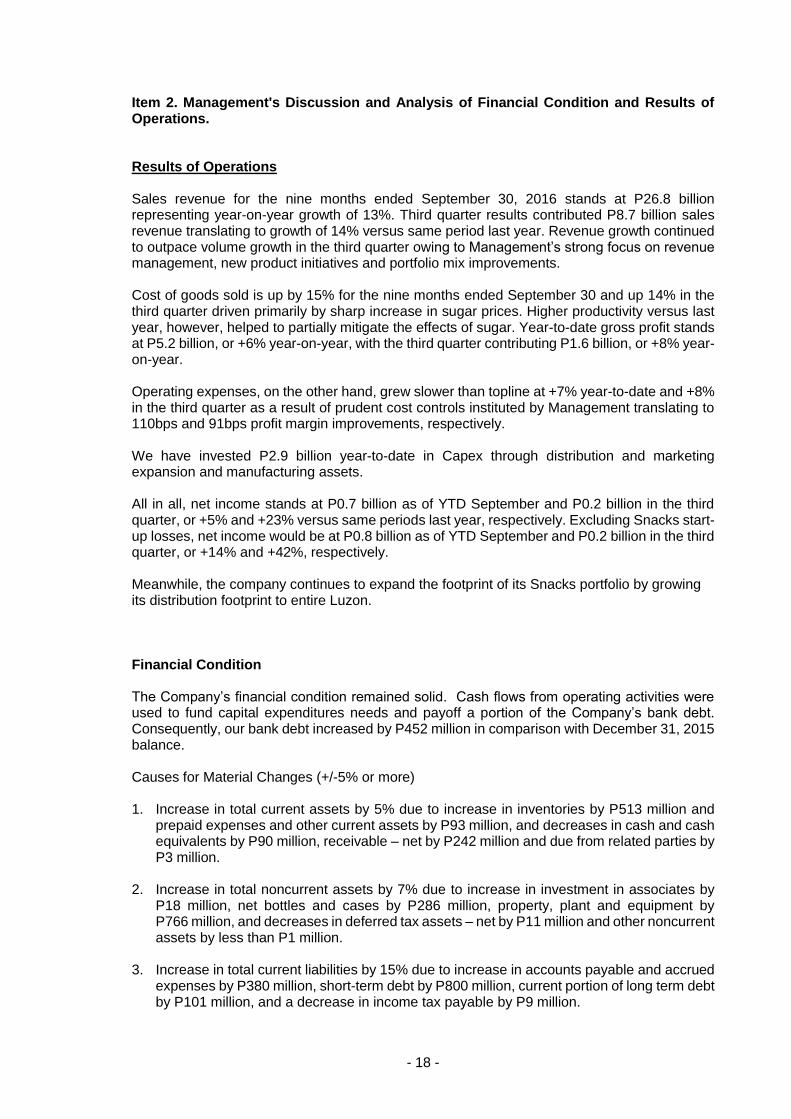
Item 2. Management's Discussion and Analysis of Financial Condition and Results of Operations. Results of Operations Sales revenue for the nine months ended September 30, 2016 stands at P26.8 billion representing year-on-year growth of 13%. Third quarter results contributed P8.7 billion sales revenue translating to growth of 14% versus same period last year. Revenue growth continued to outpace volume growth in the third quarter owing to Management’s strong focus on revenue management, new product initiatives and portfolio mix improvements. Cost of goods sold is up by 15% for the nine months ended September 30 and up 14% in the third quarter driven primarily by sharp increase in sugar prices. Higher productivity versus last year, however, helped to partially mitigate the effects of sugar. Year-to-date gross profit stands at P5.2 billion, or +6% year-on-year, with the third quarter contributing P1.6 billion, or +8% year-on-year. Operating expenses, on the other hand, grew slower than topline at +7% year-to-date and +8% in the third quarter as a result of prudent cost controls instituted by Management translating to 110bps and 91bps profit margin improvements, respectively. We have invested P2.9 billion year-to-date in Capex through distribution and marketing expansion and manufacturing assets. All in all, net income stands at P0.7 billion as of YTD September and P0.2 billion in the third quarter, or +5% and +23% versus same periods last year, respectively. Excluding Snacks start-up losses, net income would be at P0.8 billion as of YTD September and P0.2 billion in the third quarter, or +14% and +42%, respectively. Meanwhile, the company continues to expand the footprint of its Snacks portfolio by growing its distribution footprint to entire Luzon. Financial Condition The Company’s financial condition remained solid. Cash flows from operating activities were used to fund capital expenditures needs and payoff a portion of the Company’s bank debt. Consequently, our bank debt increased by P452 million in comparison with December 31, 2015 balance. Causes for Material Changes (+/-5% or more) 1. Increase in total current assets by 5% due to increase in inventories by P513 million and
prepaid expenses and other current assets by P93 million, and decreases in cash and cash equivalents by P90 million, receivable – net by P242 million and due from related parties by P3 million.
2. Increase in total noncurrent assets by 7% due to increase in investment in associates by P18 million, net bottles and cases by P286 million, property, plant and equipment by P766 million, and decreases in deferred tax assets – net by P11 million and other noncurrent assets by less than P1 million.
3. Increase in total current liabilities by 15% due to increase in accounts payable and accrued expenses by P380 million, short-term debt by P800 million, current portion of long term debt by P101 million, and a decrease in income tax payable by P9 million.
- 19 -
4. Decrease in total noncurrent liabilities by 11% due to decrease in long term-debt – net of
current portion by P449 million and other non-current liabilities by P6 million and an increase in deferred tax liabilities by P17 million.
Known Trends, Demands, or Uncertainties That May Affect Liquidity The Company is not aware of any trend that may affect its liquidity. Refer to Note 11 to the Condensed Interim Financial Statements for a discussion of the Company’s liquidity risk and financial risk management. Events That May Trigger Direct or Contingent Obligations The Company is not aware of any events that will trigger direct or contingent financial obligation that is material to the Company, including any default or acceleration of an obligation. Off-Balance Sheet Transactions To the Company’s knowledge, there are no material off-balance sheet transactions, arrangement, obligations (including contingent obligations), and other relationship of the Company with unconsolidated entities or other persons created during the reporting period. Material Commitments for Capital Expenditures The Company has ongoing definite corporate expansion projects approved by the BOD. As a result of this expansion program, the Company spent for property, plant and equipment as well as bottles and cases amounting to P1.59 billion and P1.29 billion for the six months ended June 30, 2016 and 2015, respectively. To this date, the Company continues to invest in major capital expenditures in order to complete the remaining expansion projects lined up in line with prior calendar year spending. Trends or Uncertainties That May Impact Results of Operations The Company’s performance will continue to hinge on the overall performance of the Philippine economy, the natural seasonality of operations, and the competitive environment of the beverage market in the Philippines. Refer to Note 11 to the Condensed Interim Financial Statements for a discussion of the Company’s Financial Risk Management. Significant Elements of Income or Loss that did not Arise from Continuing Operations There were no significant elements of income or loss that did not arise from continuing operations. Seasonality Aspects That May Affect Financial Conditions or Results of Operations Please refer to Note 4 to the Condensed Interim Financial Statements for a discussion of the seasonality of the Company’s operations.
- 20 -
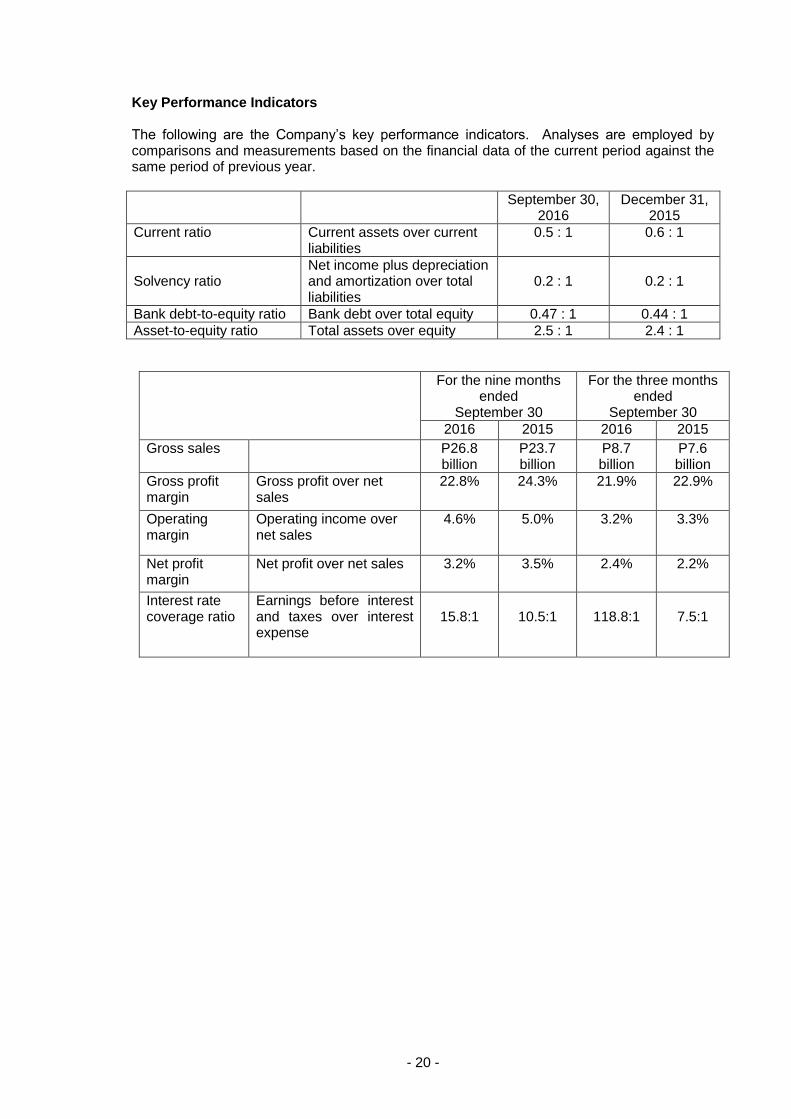
Key Performance Indicators The following are the Company’s key performance indicators. Analyses are employed by comparisons and measurements based on the financial data of the current period against the same period of previous year.
September 30, 2016
December 31, 2015
Current ratio Current assets over current liabilities
0.5 : 1 0.6 : 1
Solvency ratio Net income plus depreciation and amortization over total liabilities
0.2 : 1 0.2 : 1
Bank debt-to-equity ratio Bank debt over total equity 0.47 : 1 0.44 : 1
Asset-to-equity ratio Total assets over equity 2.5 : 1 2.4 : 1
For the nine months ended
September 30
For the three months ended
September 30
2016 2015 2016 2015
Gross sales P26.8 billion
P23.7 billion
P8.7 billion
P7.6 billion
Gross profit margin
Gross profit over net sales
22.8% 24.3% 21.9% 22.9%
Operating margin
Operating income over net sales
4.6% 5.0% 3.2% 3.3%
Net profit margin
Net profit over net sales 3.2% 3.5% 2.4% 2.2%
Interest rate coverage ratio
Earnings before interest and taxes over interest expense
15.8:1
10.5:1
118.8:1
7.5:1