Embed Size (px)
Citation preview
PepsiCo, Inc. - Climate Change 2020
C0. Introduction
C0.1
(C0.1) Give a general description and introduction to your organization.
PepsiCo products are enjoyed by consumers more than one billion times a day in more than 200 countries and territories around the world. PepsiCo generated more than $67billion in net revenue in 2019, driven by a complementary food and beverage portfolio that includes 22 brands that generate more than $1 billion each in estimated annualretail sales (e.g., Frito-Lay, Gatorade, Pepsi-Cola, Quaker and Tropicana). Our new vision is to be the global leader in convenient foods and beverages by Winning withPurpose. To advance this vision, we will focus on becoming Faster, Stronger and Better in everything we do. We will become better by continuing to integrate our purposeagenda into our business strategy and doing even more for the planet and our people. Winning with Purpose acknowledges PepsiCo’s leadership in integrating sustainabilitywith strategy for more than a decade, and conveys our belief that sustainability can be an even greater contributor to our success in the marketplace. Winning with Purposeaims to build a more sustainable food system by intensifying our efforts on critical initiatives including climate change.
This CDP Climate Questionnaire contains statements reflecting our views about our future performance that constitute “forward-looking statements” within the meaning of thePrivate Securities Litigation Reform Act of 1995. Forward-looking statements are generally identified through the inclusion of words such as “aim,” “anticipate,” “believe,”“drive,” “estimate,” “expect,” “goal,” “intend,” “may,” “plan,” “project,” “strategy,” “target” and “will” or similar statements or variations of such terms and other similarexpressions. Forward-looking statements inherently involve risks and uncertainties. For information on certain factors that could cause actual events or results to differmaterially from our expectations, please see PepsiCo’s filings with the Securities and Exchange Commission, including its most recent annual report on Form 10-K andsubsequent reports on Forms 10-Q and 8-K. Investors are cautioned not to place undue reliance on any such forward-looking statements, which speak only as of the datethey are made. PepsiCo undertakes no obligation to update any forward-looking statements, whether as a result of new information, future events or otherwise.
C0.2
(C0.2) State the start and end date of the year for which you are reporting data.
Start date End date Indicate if you are providing emissions data for past reportingyears
Select the number of past reporting years you will be providing emissions datafor
Reportingyear
January 12019
December 312019
No <Not Applicable>
C0.3
CDP Page of 751
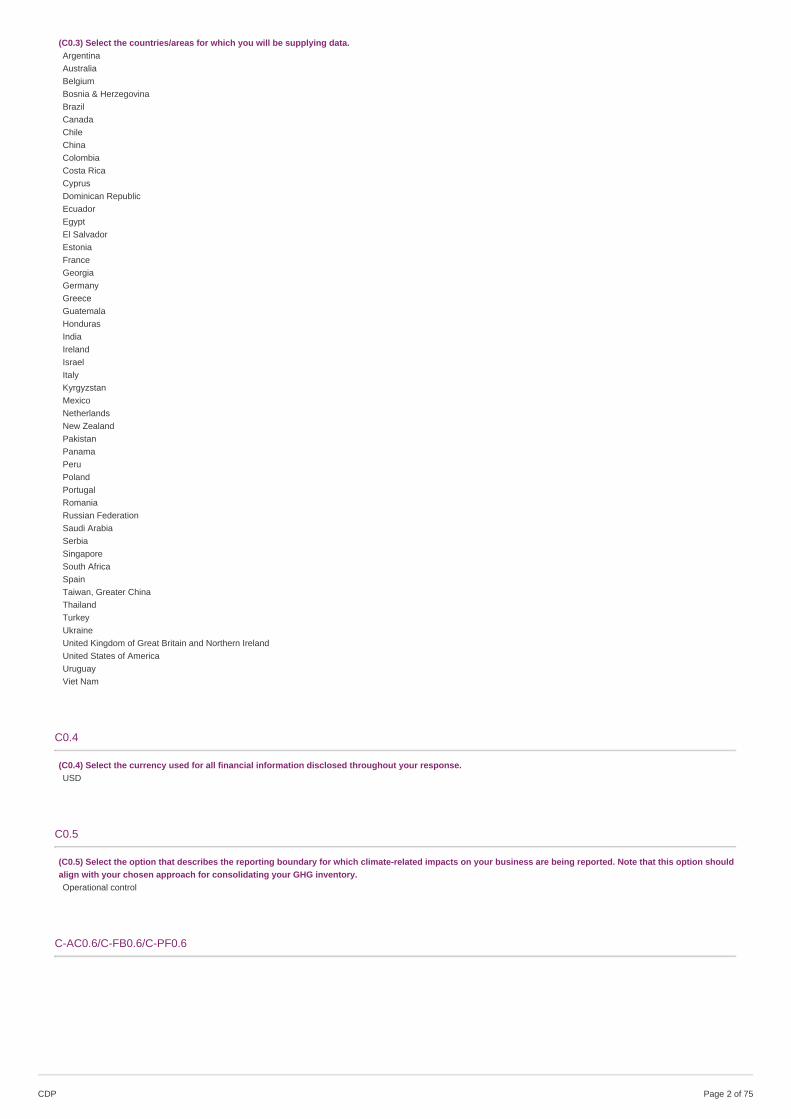
(C0.3) Select the countries/areas for which you will be supplying data.ArgentinaAustraliaBelgiumBosnia & HerzegovinaBrazilCanadaChileChinaColombiaCosta RicaCyprusDominican RepublicEcuadorEgyptEl SalvadorEstoniaFranceGeorgiaGermanyGreeceGuatemalaHondurasIndiaIrelandIsraelItalyKyrgyzstanMexicoNetherlandsNew ZealandPakistanPanamaPeruPolandPortugalRomaniaRussian FederationSaudi ArabiaSerbiaSingaporeSouth AfricaSpainTaiwan, Greater ChinaThailandTurkeyUkraineUnited Kingdom of Great Britain and Northern IrelandUnited States of AmericaUruguayViet Nam
C0.4
(C0.4) Select the currency used for all financial information disclosed throughout your response.USD
C0.5
(C0.5) Select the option that describes the reporting boundary for which climate-related impacts on your business are being reported. Note that this option shouldalign with your chosen approach for consolidating your GHG inventory.Operational control
C-AC0.6/C-FB0.6/C-PF0.6
CDP Page of 752

(C-AC0.6/C-FB0.6/C-PF0.6) Are emissions from agricultural/forestry, processing/manufacturing, distribution activities or emissions from the consumption of yourproducts – whether in your direct operations or in other parts of your value chain – relevant to your current CDP climate change disclosure?
Relevance
Agriculture/Forestry Elsewhere in the value chain only [Agriculture/Forestry/processing/manufacturing/Distribution only]
Processing/Manufacturing Both direct operations and elsewhere in the value chain [Processing/manufacturing/Distribution only]
Distribution Both direct operations and elsewhere in the value chain [Processing/manufacturing/Distribution only]
Consumption Yes [Consumption only]
C-AC0.6b/C-FB0.6b/C-PF0.6b
(C-AC0.6b/C-FB0.6b/C-PF0.6b) Why are emissions from agricultural/forestry activities undertaken on your own land not relevant to your current CDP climatechange disclosure?
Row 1
Primary reasonEvaluated but judged to be unimportant
Please explainPepsiCo owns/manages some agricultural land within our direct operations. Lands are usually used to grow crops for our products. The amount of land this represents inour overall agricultural supply chain is judged to be small and, therefore, de-Minimis. Due to internal complexities in collecting this data we are not reporting emissions fromcompany-owned agricultural land.
C-AC0.7/C-FB0.7/C-PF0.7
CDP Page of 753
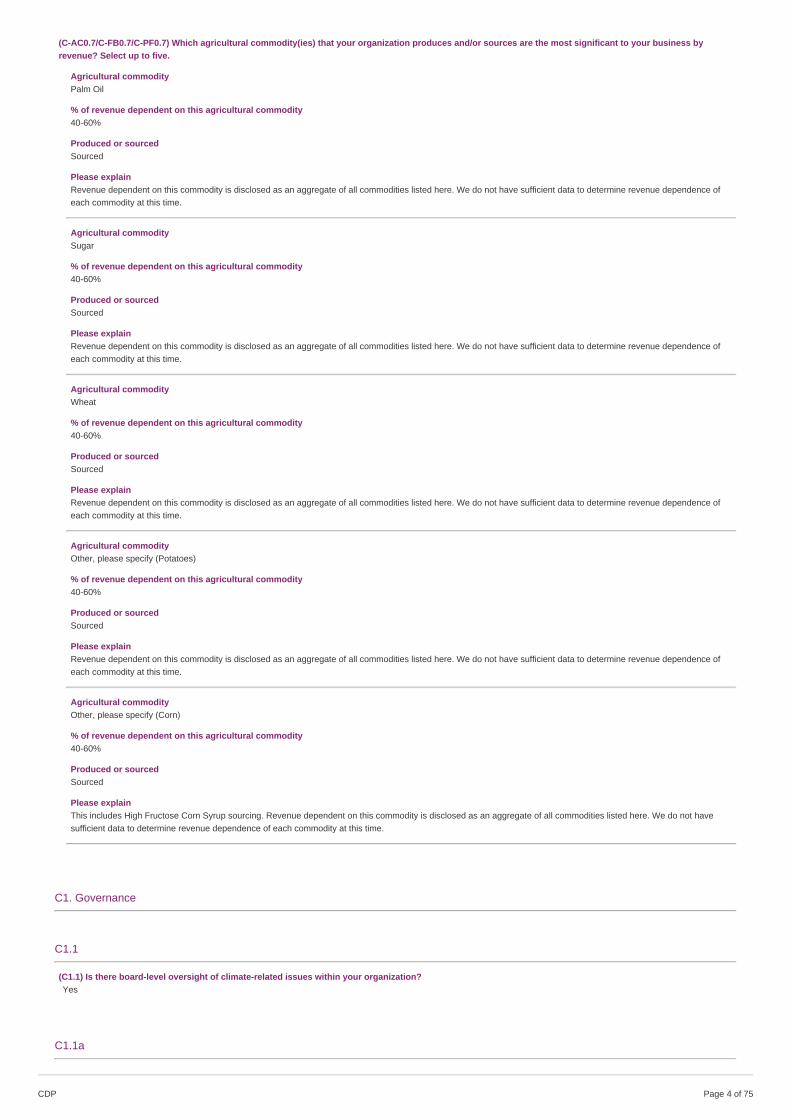
(C-AC0.7/C-FB0.7/C-PF0.7) Which agricultural commodity(ies) that your organization produces and/or sources are the most significant to your business byrevenue? Select up to five.
Agricultural commodityPalm Oil
% of revenue dependent on this agricultural commodity40-60%
Produced or sourcedSourced
Please explainRevenue dependent on this commodity is disclosed as an aggregate of all commodities listed here. We do not have sufficient data to determine revenue dependence ofeach commodity at this time.
Agricultural commoditySugar
% of revenue dependent on this agricultural commodity40-60%
Produced or sourcedSourced
Please explainRevenue dependent on this commodity is disclosed as an aggregate of all commodities listed here. We do not have sufficient data to determine revenue dependence ofeach commodity at this time.
Agricultural commodityWheat
% of revenue dependent on this agricultural commodity40-60%
Produced or sourcedSourced
Please explainRevenue dependent on this commodity is disclosed as an aggregate of all commodities listed here. We do not have sufficient data to determine revenue dependence ofeach commodity at this time.
Agricultural commodityOther, please specify (Potatoes)
% of revenue dependent on this agricultural commodity40-60%
Produced or sourcedSourced
Please explainRevenue dependent on this commodity is disclosed as an aggregate of all commodities listed here. We do not have sufficient data to determine revenue dependence ofeach commodity at this time.
Agricultural commodityOther, please specify (Corn)
% of revenue dependent on this agricultural commodity40-60%
Produced or sourcedSourced
Please explainThis includes High Fructose Corn Syrup sourcing. Revenue dependent on this commodity is disclosed as an aggregate of all commodities listed here. We do not havesufficient data to determine revenue dependence of each commodity at this time.
C1. Governance
C1.1
(C1.1) Is there board-level oversight of climate-related issues within your organization?Yes
C1.1a
CDP Page of 754
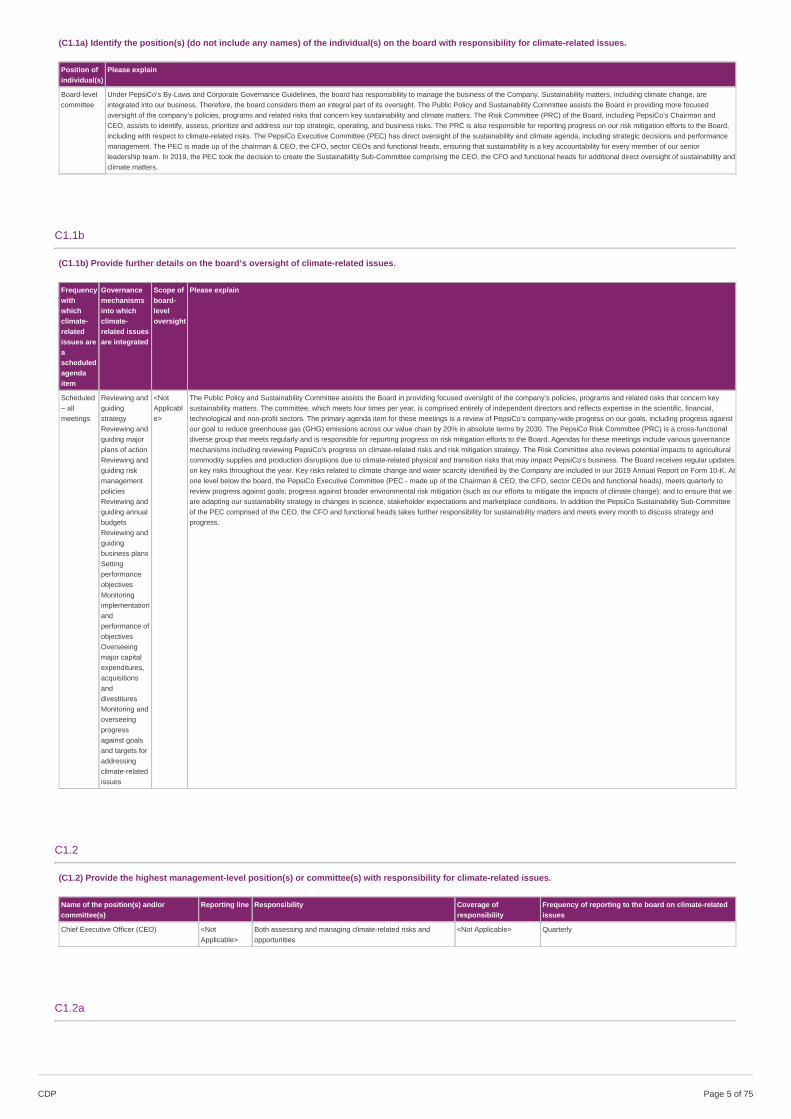
(C1.1a) Identify the position(s) (do not include any names) of the individual(s) on the board with responsibility for climate-related issues.
Position ofindividual(s)
Please explain
Board-levelcommittee
Under PepsiCo’s By-Laws and Corporate Governance Guidelines, the board has responsibility to manage the business of the Company. Sustainability matters, including climate change, areintegrated into our business. Therefore, the board considers them an integral part of its oversight. The Public Policy and Sustainability Committee assists the Board in providing more focusedoversight of the company’s policies, programs and related risks that concern key sustainability and climate matters. The Risk Committee (PRC) of the Board, including PepsiCo’s Chairman andCEO, assists to identify, assess, prioritize and address our top strategic, operating, and business risks. The PRC is also responsible for reporting progress on our risk mitigation efforts to the Board,including with respect to climate-related risks. The PepsiCo Executive Committee (PEC) has direct oversight of the sustainability and climate agenda, including strategic decisions and performancemanagement. The PEC is made up of the chairman & CEO, the CFO, sector CEOs and functional heads, ensuring that sustainability is a key accountability for every member of our seniorleadership team. In 2019, the PEC took the decision to create the Sustainability Sub-Committee comprising the CEO, the CFO and functional heads for additional direct oversight of sustainability andclimate matters.
C1.1b
(C1.1b) Provide further details on the board’s oversight of climate-related issues.
Frequencywithwhichclimate-relatedissues areascheduledagendaitem
Governancemechanismsinto whichclimate-related issuesare integrated
Scope ofboard-leveloversight
Please explain
Scheduled– allmeetings
Reviewing andguidingstrategyReviewing andguiding majorplans of actionReviewing andguiding riskmanagementpoliciesReviewing andguiding annualbudgetsReviewing andguidingbusiness plansSettingperformanceobjectivesMonitoringimplementationandperformance ofobjectivesOverseeingmajor capitalexpenditures,acquisitionsanddivestituresMonitoring andoverseeingprogressagainst goalsand targets foraddressingclimate-relatedissues
<NotApplicable>
The Public Policy and Sustainability Committee assists the Board in providing focused oversight of the company’s policies, programs and related risks that concern keysustainability matters. The committee, which meets four times per year, is comprised entirely of independent directors and reflects expertise in the scientific, financial,technological and non-profit sectors. The primary agenda item for these meetings is a review of PepsiCo’s company-wide progress on our goals, including progress againstour goal to reduce greenhouse gas (GHG) emissions across our value chain by 20% in absolute terms by 2030. The PepsiCo Risk Committee (PRC) is a cross-functionaldiverse group that meets regularly and is responsible for reporting progress on risk mitigation efforts to the Board. Agendas for these meetings include various governancemechanisms including reviewing PepsiCo's progress on climate-related risks and risk mitigation strategy. The Risk Committee also reviews potential impacts to agriculturalcommodity supplies and production disruptions due to climate-related physical and transition risks that may impact PepsiCo's business. The Board receives regular updateson key risks throughout the year. Key risks related to climate change and water scarcity identified by the Company are included in our 2019 Annual Report on Form 10-K. Atone level below the board, the PepsiCo Executive Committee (PEC - made up of the Chairman & CEO, the CFO, sector CEOs and functional heads), meets quarterly toreview progress against goals; progress against broader environmental risk mitigation (such as our efforts to mitigate the impacts of climate change); and to ensure that weare adapting our sustainability strategy to changes in science, stakeholder expectations and marketplace conditions. In addition the PepsiCo Sustainability Sub-Committeeof the PEC comprised of the CEO, the CFO and functional heads takes further responsibility for sustainability matters and meets every month to discuss strategy andprogress.
C1.2
(C1.2) Provide the highest management-level position(s) or committee(s) with responsibility for climate-related issues.
Name of the position(s) and/orcommittee(s)
Reporting line Responsibility Coverage ofresponsibility
Frequency of reporting to the board on climate-relatedissues
Chief Executive Officer (CEO) <NotApplicable>
Both assessing and managing climate-related risks andopportunities
<Not Applicable> Quarterly
C1.2a
CDP Page of 755

(C1.2a) Describe where in the organizational structure this/these position(s) and/or committees lie, what their associated responsibilities are, and how climate-related issues are monitored (do not include the names of individuals).
In 2019, PepsiCo’s CEO convened a PepsiCo Executive Committee Sustainability Subcommittee, which he chairs and which includes Executives, including PepsiCo’s ChiefSustainability Officer. The members of this committee were selected to ensure that key business functions that influence our sustainability performance are engaged inoverseeing our sustainability efforts at the highest level. The Sustainability Subcommittee meets every month and climate topics addressed include reviewing progressagainst our strategy as well as assessing and approving improvements to our strategy. One example of this is our recent commitment to raising our ambition in climatechange mitigation by signing the Business Ambition for 1.50C pledge.
In addition, PepsiCo’s Chief Sustainability Officer (CSO) oversees the company’s sustainability program. The CSO brings deep business knowledge and insights to guide thecompany’s sustainability led business transformation efforts, as well as an intimate understanding of the challenges and opportunities that lie at the intersection of food, theenvironment and people. The CSO is involved in the day-to-day management of our strategy toward delivery of our sustainability agenda, and their responsibilities includeproviding strategic direction, guidance and leadership on critical climate-related issues facing the company and actions the company must take. Climate-related issuesmonitoring and overseeing the delivery of our climate goal fall directly under the responsibilities of the Chief Sustainability Officer. The CSO is regularly apprised of ourprogress towards our climate goal and related issues. Based on this, the CSO is involved in aligning the PepsiCo Executive Committee (PEC) and the board on strategicdecisions toward mitigating climate risks, enhancing PepsiCo's reputation and positioning the business for future success.
The PepsiCo Risk Committee (PRC) comprised of the chairman & CEO, the CFO, the CSO and functional heads meet every quarter to identify, assess, prioritize, address,manage, monitor and communicate our top enterprise risks of which climate-related risks is one. The PRC is also responsible for reporting progress on our risk mitigationefforts to the Board.
C1.3
(C1.3) Do you provide incentives for the management of climate-related issues, including the attainment of targets?
Provide incentives for themanagement of climate-relatedissues
Comment
Row1
Yes Our corporate executive team has strategic objectives based on an individual executive’s role and accountabilities that are aligned with our sustainability agendaincluding our climate goal. Performance against these objectives impacts a portion of both annual and long-term incentives.
C1.3a
(C1.3a) Provide further details on the incentives provided for the management of climate-related issues (do not include the names of individuals).
Entitled toincentive
Type ofincentive
Activityinventivized
Comment
Corporateexecutiveteam
Monetaryreward
Emissionsreductiontarget
Our corporate executive team has strategic objectives based on an individual executive’s role and accountabilities that are aligned with our sustainability agenda includingour climate goal. Performance against these objectives impacts a portion of both annual and long-term incentives.
ChiefExecutiveOfficer(CEO)
Monetaryreward
Emissionsreductiontarget
Our executive officers, including our chairman and CEO, have strategic objectives based on an individual executive’s role and accountabilities that are aligned with oursustainability agenda including our climate goal. Performance against these objectives impacts a portion of both annual and long-term incentives.
ChiefSustainabilityOfficer(CSO)
Monetaryreward
Emissionsreductiontarget
Our executive officers, including our chairman and CEO, have strategic objectives based on an individual executive’s role and accountabilities that are aligned with oursustainability agenda including our climate goal. Performance against these objectives impacts a portion of both annual and long-term incentives.
Business unitmanager
Monetaryreward
Emissionsreductiontarget
Business unit managers have objectives based on their roles and accountabilities that are aligned with our sustainability agenda including climate. Performance againstthese objectives impacts a portion of both annual and long-term incentives.
Energymanager
Monetaryreward
Emissionsreductiontarget
Energy managers have annual energy and fuel reduction (as a proxy for greenhouse gas (GHG) emissions reduction) performance targets. PepsiCo has a pay-for-performance philosophy and the annual performance rating impacts annual merit increases, including bonuses. In addition, a wide range of complementary awardsrecognizes teams and associates for exceptional performance in sustainability, including projects that reduce GHG emissions.
Facilitiesmanager
Monetaryreward
Emissionsreductiontarget
Some facility managers have annual energy and fuel reduction (as a proxy for GHG emissions reduction) performance targets. PepsiCo has a pay-for-performancephilosophy and the annual performance rating impacts annual merit increases, including bonuses. In addition, a wide range of complementary awards recognizes teams andassociates for exceptional performance in sustainability, including projects that reduce GHG emissions.
Processoperationmanager
Monetaryreward
Emissionsreductiontarget
Some process operation managers have annual energy and fuel reduction (as a proxy for GHG emissions reduction) performance targets. PepsiCo has a pay-for-performance philosophy and the annual performance rating impacts annual merit increases, including bonuses. In addition, a wide range of complementary awardsrecognizes teams and associates for exceptional performance in sustainability, including projects that reduce GHG emissions.
C2. Risks and opportunities
C2.1
(C2.1) Does your organization have a process for identifying, assessing, and responding to climate-related risks and opportunities?Yes
C2.1a
CDP Page of 756
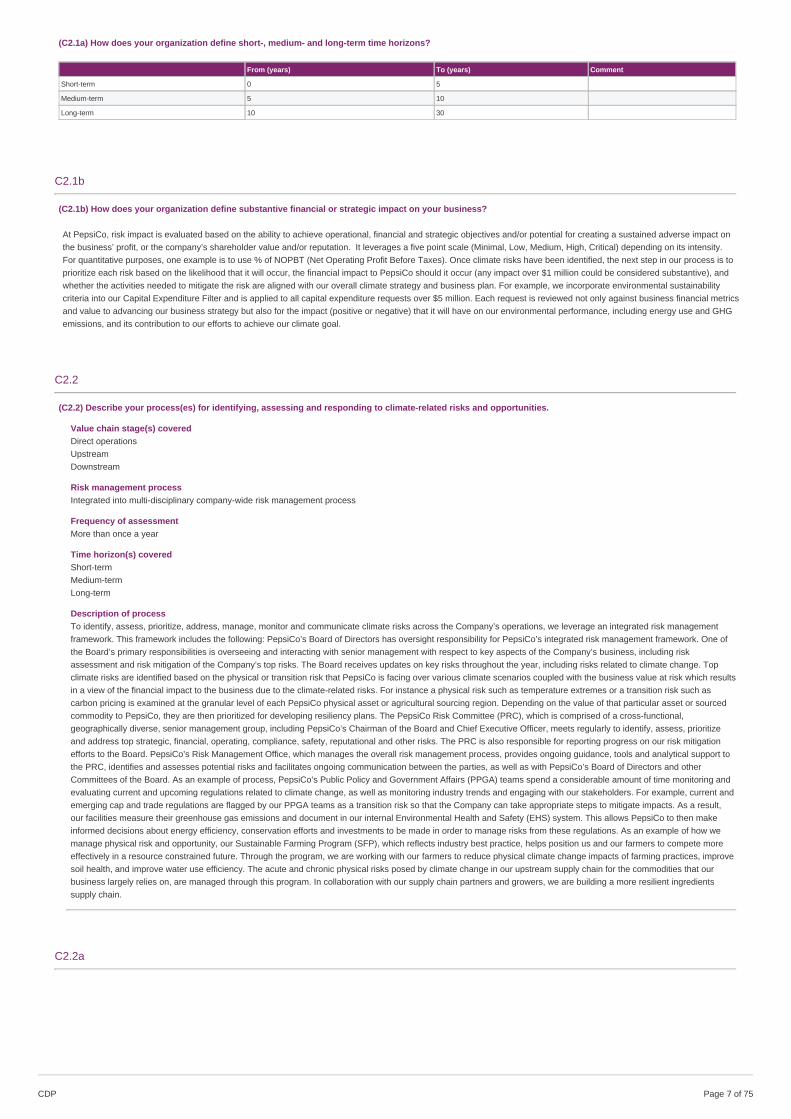
(C2.1a) How does your organization define short-, medium- and long-term time horizons?
From (years) To (years) Comment
Short-term 0 5
Medium-term 5 10
Long-term 10 30
C2.1b
(C2.1b) How does your organization define substantive financial or strategic impact on your business?
At PepsiCo, risk impact is evaluated based on the ability to achieve operational, financial and strategic objectives and/or potential for creating a sustained adverse impact onthe business’ profit, or the company’s shareholder value and/or reputation. It leverages a five point scale (Minimal, Low, Medium, High, Critical) depending on its intensity.For quantitative purposes, one example is to use % of NOPBT (Net Operating Profit Before Taxes). Once climate risks have been identified, the next step in our process is toprioritize each risk based on the likelihood that it will occur, the financial impact to PepsiCo should it occur (any impact over $1 million could be considered substantive), andwhether the activities needed to mitigate the risk are aligned with our overall climate strategy and business plan. For example, we incorporate environmental sustainabilitycriteria into our Capital Expenditure Filter and is applied to all capital expenditure requests over $5 million. Each request is reviewed not only against business financial metricsand value to advancing our business strategy but also for the impact (positive or negative) that it will have on our environmental performance, including energy use and GHGemissions, and its contribution to our efforts to achieve our climate goal.
C2.2
(C2.2) Describe your process(es) for identifying, assessing and responding to climate-related risks and opportunities.
Value chain stage(s) coveredDirect operationsUpstreamDownstream
Risk management processIntegrated into multi-disciplinary company-wide risk management process
Frequency of assessmentMore than once a year
Time horizon(s) coveredShort-termMedium-termLong-term
Description of processTo identify, assess, prioritize, address, manage, monitor and communicate climate risks across the Company’s operations, we leverage an integrated risk managementframework. This framework includes the following: PepsiCo’s Board of Directors has oversight responsibility for PepsiCo’s integrated risk management framework. One ofthe Board’s primary responsibilities is overseeing and interacting with senior management with respect to key aspects of the Company’s business, including riskassessment and risk mitigation of the Company’s top risks. The Board receives updates on key risks throughout the year, including risks related to climate change. Topclimate risks are identified based on the physical or transition risk that PepsiCo is facing over various climate scenarios coupled with the business value at risk which resultsin a view of the financial impact to the business due to the climate-related risks. For instance a physical risk such as temperature extremes or a transition risk such ascarbon pricing is examined at the granular level of each PepsiCo physical asset or agricultural sourcing region. Depending on the value of that particular asset or sourcedcommodity to PepsiCo, they are then prioritized for developing resiliency plans. The PepsiCo Risk Committee (PRC), which is comprised of a cross-functional,geographically diverse, senior management group, including PepsiCo’s Chairman of the Board and Chief Executive Officer, meets regularly to identify, assess, prioritizeand address top strategic, financial, operating, compliance, safety, reputational and other risks. The PRC is also responsible for reporting progress on our risk mitigationefforts to the Board. PepsiCo’s Risk Management Office, which manages the overall risk management process, provides ongoing guidance, tools and analytical support tothe PRC, identifies and assesses potential risks and facilitates ongoing communication between the parties, as well as with PepsiCo’s Board of Directors and otherCommittees of the Board. As an example of process, PepsiCo’s Public Policy and Government Affairs (PPGA) teams spend a considerable amount of time monitoring andevaluating current and upcoming regulations related to climate change, as well as monitoring industry trends and engaging with our stakeholders. For example, current andemerging cap and trade regulations are flagged by our PPGA teams as a transition risk so that the Company can take appropriate steps to mitigate impacts. As a result,our facilities measure their greenhouse gas emissions and document in our internal Environmental Health and Safety (EHS) system. This allows PepsiCo to then makeinformed decisions about energy efficiency, conservation efforts and investments to be made in order to manage risks from these regulations. As an example of how wemanage physical risk and opportunity, our Sustainable Farming Program (SFP), which reflects industry best practice, helps position us and our farmers to compete moreeffectively in a resource constrained future. Through the program, we are working with our farmers to reduce physical climate change impacts of farming practices, improvesoil health, and improve water use efficiency. The acute and chronic physical risks posed by climate change in our upstream supply chain for the commodities that ourbusiness largely relies on, are managed through this program. In collaboration with our supply chain partners and growers, we are building a more resilient ingredientssupply chain.
C2.2a
CDP Page of 757
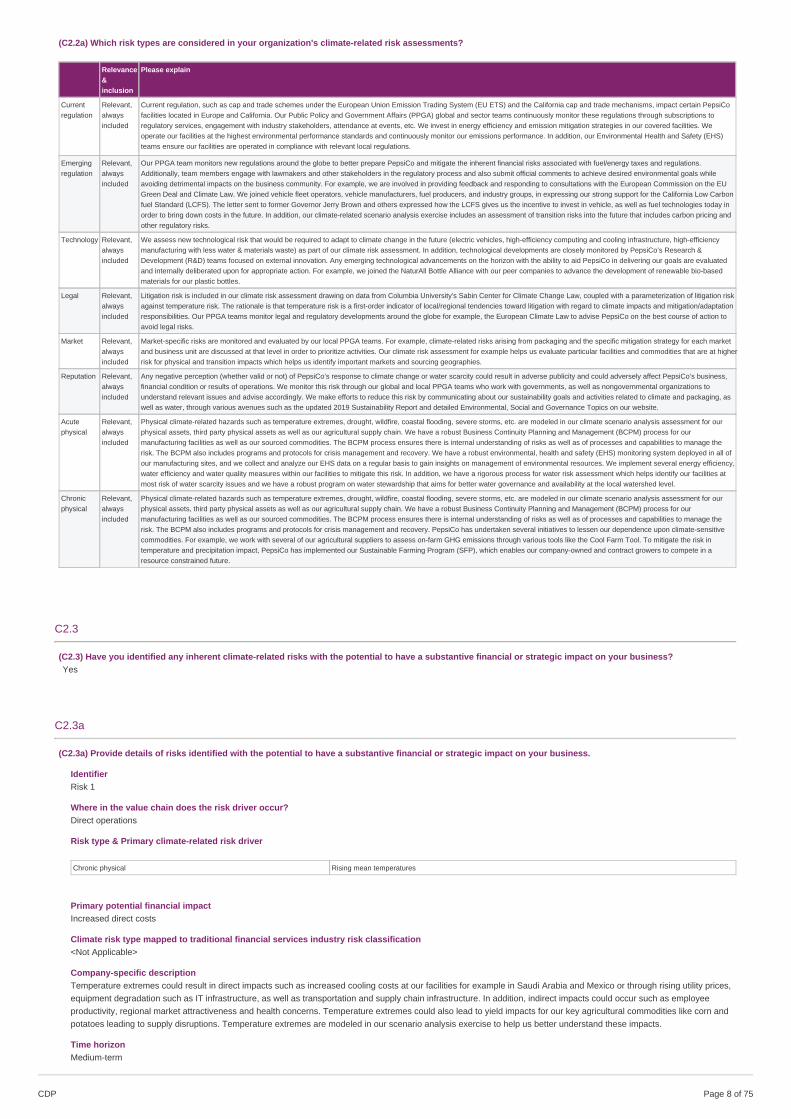
(C2.2a) Which risk types are considered in your organization's climate-related risk assessments?
Relevance&inclusion
Please explain
Currentregulation
Relevant,alwaysincluded
Current regulation, such as cap and trade schemes under the European Union Emission Trading System (EU ETS) and the California cap and trade mechanisms, impact certain PepsiCofacilities located in Europe and California. Our Public Policy and Government Affairs (PPGA) global and sector teams continuously monitor these regulations through subscriptions toregulatory services, engagement with industry stakeholders, attendance at events, etc. We invest in energy efficiency and emission mitigation strategies in our covered facilities. Weoperate our facilities at the highest environmental performance standards and continuously monitor our emissions performance. In addition, our Environmental Health and Safety (EHS)teams ensure our facilities are operated in compliance with relevant local regulations.
Emergingregulation
Relevant,alwaysincluded
Our PPGA team monitors new regulations around the globe to better prepare PepsiCo and mitigate the inherent financial risks associated with fuel/energy taxes and regulations.Additionally, team members engage with lawmakers and other stakeholders in the regulatory process and also submit official comments to achieve desired environmental goals whileavoiding detrimental impacts on the business community. For example, we are involved in providing feedback and responding to consultations with the European Commission on the EUGreen Deal and Climate Law. We joined vehicle fleet operators, vehicle manufacturers, fuel producers, and industry groups, in expressing our strong support for the California Low Carbonfuel Standard (LCFS). The letter sent to former Governor Jerry Brown and others expressed how the LCFS gives us the incentive to invest in vehicle, as well as fuel technologies today inorder to bring down costs in the future. In addition, our climate-related scenario analysis exercise includes an assessment of transition risks into the future that includes carbon pricing andother regulatory risks.
Technology Relevant,alwaysincluded
We assess new technological risk that would be required to adapt to climate change in the future (electric vehicles, high-efficiency computing and cooling infrastructure, high-efficiencymanufacturing with less water & materials waste) as part of our climate risk assessment. In addition, technological developments are closely monitored by PepsiCo’s Research &Development (R&D) teams focused on external innovation. Any emerging technological advancements on the horizon with the ability to aid PepsiCo in delivering our goals are evaluatedand internally deliberated upon for appropriate action. For example, we joined the NaturAll Bottle Alliance with our peer companies to advance the development of renewable bio-basedmaterials for our plastic bottles.
Legal Relevant,alwaysincluded
Litigation risk is included in our climate risk assessment drawing on data from Columbia University's Sabin Center for Climate Change Law, coupled with a parameterization of litigation riskagainst temperature risk. The rationale is that temperature risk is a first-order indicator of local/regional tendencies toward litigation with regard to climate impacts and mitigation/adaptationresponsibilities. Our PPGA teams monitor legal and regulatory developments around the globe for example, the European Climate Law to advise PepsiCo on the best course of action toavoid legal risks.
Market Relevant,alwaysincluded
Market-specific risks are monitored and evaluated by our local PPGA teams. For example, climate-related risks arising from packaging and the specific mitigation strategy for each marketand business unit are discussed at that level in order to prioritize activities. Our climate risk assessment for example helps us evaluate particular facilities and commodities that are at higherrisk for physical and transition impacts which helps us identify important markets and sourcing geographies.
Reputation Relevant,alwaysincluded
Any negative perception (whether valid or not) of PepsiCo’s response to climate change or water scarcity could result in adverse publicity and could adversely affect PepsiCo’s business,financial condition or results of operations. We monitor this risk through our global and local PPGA teams who work with governments, as well as nongovernmental organizations tounderstand relevant issues and advise accordingly. We make efforts to reduce this risk by communicating about our sustainability goals and activities related to climate and packaging, aswell as water, through various avenues such as the updated 2019 Sustainability Report and detailed Environmental, Social and Governance Topics on our website.
Acutephysical
Relevant,alwaysincluded
Physical climate-related hazards such as temperature extremes, drought, wildfire, coastal flooding, severe storms, etc. are modeled in our climate scenario analysis assessment for ourphysical assets, third party physical assets as well as our agricultural supply chain. We have a robust Business Continuity Planning and Management (BCPM) process for ourmanufacturing facilities as well as our sourced commodities. The BCPM process ensures there is internal understanding of risks as well as of processes and capabilities to manage therisk. The BCPM also includes programs and protocols for crisis management and recovery. We have a robust environmental, health and safety (EHS) monitoring system deployed in all ofour manufacturing sites, and we collect and analyze our EHS data on a regular basis to gain insights on management of environmental resources. We implement several energy efficiency,water efficiency and water quality measures within our facilities to mitigate this risk. In addition, we have a rigorous process for water risk assessment which helps identify our facilities atmost risk of water scarcity issues and we have a robust program on water stewardship that aims for better water governance and availability at the local watershed level.
Chronicphysical
Relevant,alwaysincluded
Physical climate-related hazards such as temperature extremes, drought, wildfire, coastal flooding, severe storms, etc. are modeled in our climate scenario analysis assessment for ourphysical assets, third party physical assets as well as our agricultural supply chain. We have a robust Business Continuity Planning and Management (BCPM) process for ourmanufacturing facilities as well as our sourced commodities. The BCPM process ensures there is internal understanding of risks as well as of processes and capabilities to manage therisk. The BCPM also includes programs and protocols for crisis management and recovery. PepsiCo has undertaken several initiatives to lessen our dependence upon climate-sensitivecommodities. For example, we work with several of our agricultural suppliers to assess on-farm GHG emissions through various tools like the Cool Farm Tool. To mitigate the risk intemperature and precipitation impact, PepsiCo has implemented our Sustainable Farming Program (SFP), which enables our company-owned and contract growers to compete in aresource constrained future.
C2.3
(C2.3) Have you identified any inherent climate-related risks with the potential to have a substantive financial or strategic impact on your business?Yes
C2.3a
(C2.3a) Provide details of risks identified with the potential to have a substantive financial or strategic impact on your business.
IdentifierRisk 1
Where in the value chain does the risk driver occur?Direct operations
Risk type & Primary climate-related risk driver
Chronic physical Rising mean temperatures
Primary potential financial impactIncreased direct costs
Climate risk type mapped to traditional financial services industry risk classification<Not Applicable>
Company-specific descriptionTemperature extremes could result in direct impacts such as increased cooling costs at our facilities for example in Saudi Arabia and Mexico or through rising utility prices,equipment degradation such as IT infrastructure, as well as transportation and supply chain infrastructure. In addition, indirect impacts could occur such as employeeproductivity, regional market attractiveness and health concerns. Temperature extremes could also lead to yield impacts for our key agricultural commodities like corn andpotatoes leading to supply disruptions. Temperature extremes are modeled in our scenario analysis exercise to help us better understand these impacts.
Time horizonMedium-term
CDP Page of 758

LikelihoodVirtually certain
Magnitude of impactHigh
Are you able to provide a potential financial impact figure?Yes, an estimated range
Potential financial impact figure (currency)<Not Applicable>
Potential financial impact figure – minimum (currency)1500000000
Potential financial impact figure – maximum (currency)1700000000
Explanation of financial impact figureFinancial impact is estimated based on a modeling of temperature extremes specific to our physical location of company-owned assets (manufacturing plants, warehouses,etc.) and third party assets (like franchises). Financial impacts are based on a modeling of the vulnerability or productivity decline of the assets and sourced commoditiesdue to temperature extremes linked to the value of the physical assets. The range provided here is based on two emissions scenarios RCP 4.5 and RCP 8.5 for the currentdecadal period from 2015-2025. These financial impact estimates are larger for longer time frames.
Cost of response to risk2125000000
Description of response and explanation of cost calculationBusiness Continuity Planning (BCP) is an integral part of PepsiCo’s risk management process for business disruptions. It consists of crisis management as well as recoveryprograms to build a strong resiliency plan and an understanding and acceptance of residual risk to the business. For example, for our manufacturing sites this meansconsidering spare capacity as well as investing in increasing capacity and efficiency at nearby sites and building strategic relationships with third party manufacturers,ensuring people accountability and planning for data and IT recovery. The cost of response is estimated based on evaluations of investments required for businesscontinuity planning (BCP) for one of our US facilities and scaled up to cover our top high risk sites for temperature extremes across the globe. Current BCP plan includesinvestments related to developing new third party manufacturers, investments in new lines as well as in throughput efficiencies. In 2019, BCP enhancements wereconducted for some of our top risk sites in North America, Asia and Europe. In the coming years, we will further refine this estimate by integrating climate risks within ourexisting BCPs and developing new BCPs for our high risk sites.
CommentOur current estimates of financial impact are based on high-level estimates to gain an understanding of focus areas or hotspots in our operations and agricultural supplychain. Deeper dive analysis of these hotspot areas will refine our estimates in the future.
IdentifierRisk 2
Where in the value chain does the risk driver occur?Upstream
Risk type & Primary climate-related risk driver
Chronic physical Changes in precipitation patterns and extreme variability in weather patterns
Primary potential financial impactIncreased direct costs
Climate risk type mapped to traditional financial services industry risk classification<Not Applicable>
Company-specific descriptionChanges in precipitation patters leading to droughts and extreme variability in weather patterns (convective storms) could result in direct impacts such as reduced wateravailability for growing of crops as well as increased price of water, reduction in water quality and yield impacts due to increasing likelihood of drought for our keycommodities such as corn, potatoes, and sugarcane in the US, Brazil, Turkey, India and Thailand. We may also experience indirect impacts such as regional economicimpacts. These impacts are all modeled in our scenario analysis to better understand the implications for our business.
Time horizonMedium-term
LikelihoodVery likely
Magnitude of impactHigh
Are you able to provide a potential financial impact figure?Yes, an estimated range
Potential financial impact figure (currency)<Not Applicable>
Potential financial impact figure – minimum (currency)212000000
Potential financial impact figure – maximum (currency)241000000
Explanation of financial impact figureFinancial impact is estimated based on a modeling of the probability of drought at our sourcing locations for most of our agricultural commodities like grains, sugars andvegetable oils. Financial impacts are based on a modeling of the probable yield decline of the sourced commodities due to drought or moisture availability for the crop. The
CDP Page of 759

range provided here is based on two emissions scenarios RCP 4.5 and RCP 8.5 for the current decadal period from 2015-2025. These financial impact estimates are largerfor longer time frames.
Cost of response to risk10500000
Description of response and explanation of cost calculationManagement efforts of our Global Public Policy and Government Affairs (PPGA) teams are to inform regulatory process and facilitate effective rule implementation withinPepsiCo. The teams monitor new regulations around the globe to better prepare PepsiCo and help mitigate the inherent financial risks associated with fuel/energy taxesand regulations. Additionally, team members engage with lawmakers and other stakeholders in the regulatory process and also submit official comments in an effort toachieve desired environmental goals while avoiding detrimental impacts on the business community. For example, we are one of the founding members of the ClimateLeadership Council which aims to promote a carbon dividends framework as the most cost-effective, equitable and politically-viable climate solution. No additionalmanagement costs. These costs are embedded into our global policy monitoring process.
CommentPepsiCo recognizes that climate change will impact its agricultural value chain in the near term. Such impacts will extend well beyond the farm gate and into factoryoperations and logistics. Our procurement team creates business continuity plans (BCPs) for our commodities that aims to build supply chain resiliency (approvals of newoils, blends, flex labeling options, new supplier approvals and qualifications, new growing areas, risk management for reputational risk). In addition, informed by our climaterisk assessment analysis our sustainable agriculture team is working on deep dive climate risk assessment for high risk areas and building adaptation strategies. This workwas started in 2019 and continues in 2020. Our work underway in Thailand and Vietnam for our agricultural supply has led to an understanding of crop growing suitability atour specific farms and the value of business at risk if we did nothing. We are currently in the process of developing adaptation strategies around suitable varietycharacteristics, farm management changes as well as sourcing strategies. The cost of management of this risk is based on our costs in Thailand and Vietnam and scalingthat up for all of our high risk commodities and geographies.
IdentifierRisk 3
Where in the value chain does the risk driver occur?Direct operations
Risk type & Primary climate-related risk driver
Emerging regulation Carbon pricing mechanisms
Primary potential financial impactIncreased direct costs
Climate risk type mapped to traditional financial services industry risk classification<Not Applicable>
Company-specific descriptionFuture carbon pricing mechanisms are modeled in our scenario analysis exercise as a transition risk. Our analysis utilizes carbon price projections for each of our physicalassets and the actual emissions associated with them are used to then understand carbon pricing risk for different temperature scenarios. Biofuel mandates, gasoline taxesand other taxes and regulations designed to lower the carbon profile of primary energy may affect our costs for energy and/or raw material inputs. For example emergingclean fuel standard regulation in Canada can impact our operating costs for our company-owned fleet in this country, as well as increase costs for third party logisticsprocurement for distribution of our products.
Time horizonMedium-term
LikelihoodVery likely
Magnitude of impactHigh
Are you able to provide a potential financial impact figure?Yes, an estimated range
Potential financial impact figure (currency)<Not Applicable>
Potential financial impact figure – minimum (currency)54000000
Potential financial impact figure – maximum (currency)84000000
Explanation of financial impact figureFinancial impact is estimated based on the projected carbon pricing probability by region and the operational asset specific greenhouse gas emissions information. Therange provided here is based on two emissions scenarios RCP 4.5 and RCP 8.5 for the current decadal period from 2015-2025. These financial impact estimates are largerfor longer time frames.
Cost of response to risk172000000
Description of response and explanation of cost calculationTo reduce carbon emissions and address the inherent financial risks of carbon pricing, PepsiCo invests in renewable energy and energy efficiency. We also ensure that ourfacilities have strong environmental management systems in place such as PepsiCo’s Global Environmental Health & Safety Management System (GEHMS). We expectthese management methods to reduce the risk to our business concerning increased operating costs over the next several years as we become more energy and carbonefficient through our investments and resource conservation program (ReCon). For example, in 2019 we completed analysis and internal consultation that led to theapproval in early 2020, of a new commitment to achieve 100% renewable electricity for our U.S. direct operations starting in 2020. Our Global Public Policy andGovernment Affairs (PPGA) teams monitor new regulations around the globe to better prepare PepsiCo and help mitigate the inherent financial risks associated withfuel/energy taxes and climate regulations. Additionally, team members engage with lawmakers and other stakeholders in the regulatory process and also submit officialcomments in an effort to achieve desired environmental goals while avoiding detrimental impacts on the business community. For example, we are actively involved incommunicating with the European Commission on the EU Green Deal and associated Climate Law. We are one of the founding members of the Climate Leadership
CDP Page of 7510
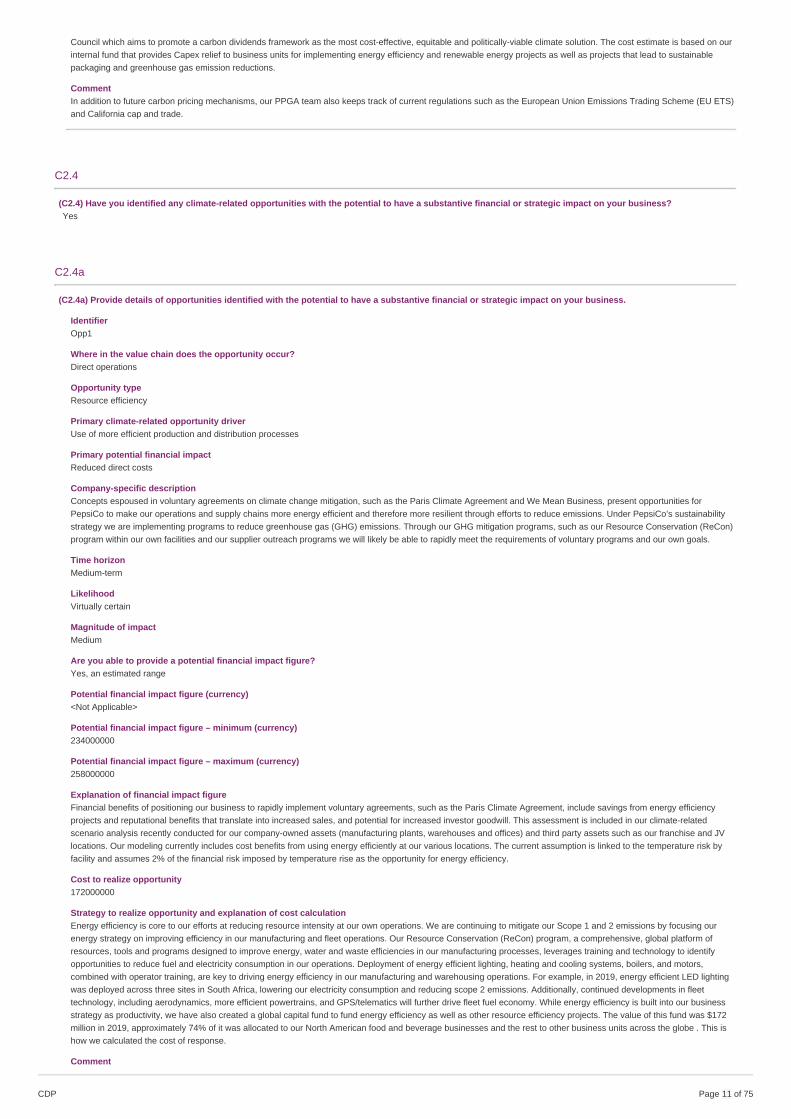
Council which aims to promote a carbon dividends framework as the most cost-effective, equitable and politically-viable climate solution. The cost estimate is based on ourinternal fund that provides Capex relief to business units for implementing energy efficiency and renewable energy projects as well as projects that lead to sustainablepackaging and greenhouse gas emission reductions.
CommentIn addition to future carbon pricing mechanisms, our PPGA team also keeps track of current regulations such as the European Union Emissions Trading Scheme (EU ETS)and California cap and trade.
C2.4
(C2.4) Have you identified any climate-related opportunities with the potential to have a substantive financial or strategic impact on your business?Yes
C2.4a
(C2.4a) Provide details of opportunities identified with the potential to have a substantive financial or strategic impact on your business.
IdentifierOpp1
Where in the value chain does the opportunity occur?Direct operations
Opportunity typeResource efficiency
Primary climate-related opportunity driverUse of more efficient production and distribution processes
Primary potential financial impactReduced direct costs
Company-specific descriptionConcepts espoused in voluntary agreements on climate change mitigation, such as the Paris Climate Agreement and We Mean Business, present opportunities forPepsiCo to make our operations and supply chains more energy efficient and therefore more resilient through efforts to reduce emissions. Under PepsiCo’s sustainabilitystrategy we are implementing programs to reduce greenhouse gas (GHG) emissions. Through our GHG mitigation programs, such as our Resource Conservation (ReCon)program within our own facilities and our supplier outreach programs we will likely be able to rapidly meet the requirements of voluntary programs and our own goals.
Time horizonMedium-term
LikelihoodVirtually certain
Magnitude of impactMedium
Are you able to provide a potential financial impact figure?Yes, an estimated range
Potential financial impact figure (currency)<Not Applicable>
Potential financial impact figure – minimum (currency)234000000
Potential financial impact figure – maximum (currency)258000000
Explanation of financial impact figureFinancial benefits of positioning our business to rapidly implement voluntary agreements, such as the Paris Climate Agreement, include savings from energy efficiencyprojects and reputational benefits that translate into increased sales, and potential for increased investor goodwill. This assessment is included in our climate-relatedscenario analysis recently conducted for our company-owned assets (manufacturing plants, warehouses and offices) and third party assets such as our franchise and JVlocations. Our modeling currently includes cost benefits from using energy efficiently at our various locations. The current assumption is linked to the temperature risk byfacility and assumes 2% of the financial risk imposed by temperature rise as the opportunity for energy efficiency.
Cost to realize opportunity172000000
Strategy to realize opportunity and explanation of cost calculationEnergy efficiency is core to our efforts at reducing resource intensity at our own operations. We are continuing to mitigate our Scope 1 and 2 emissions by focusing ourenergy strategy on improving efficiency in our manufacturing and fleet operations. Our Resource Conservation (ReCon) program, a comprehensive, global platform ofresources, tools and programs designed to improve energy, water and waste efficiencies in our manufacturing processes, leverages training and technology to identifyopportunities to reduce fuel and electricity consumption in our operations. Deployment of energy efficient lighting, heating and cooling systems, boilers, and motors,combined with operator training, are key to driving energy efficiency in our manufacturing and warehousing operations. For example, in 2019, energy efficient LED lightingwas deployed across three sites in South Africa, lowering our electricity consumption and reducing scope 2 emissions. Additionally, continued developments in fleettechnology, including aerodynamics, more efficient powertrains, and GPS/telematics will further drive fleet fuel economy. While energy efficiency is built into our businessstrategy as productivity, we have also created a global capital fund to fund energy efficiency as well as other resource efficiency projects. The value of this fund was $172million in 2019, approximately 74% of it was allocated to our North American food and beverage businesses and the rest to other business units across the globe . This ishow we calculated the cost of response.
Comment
CDP Page of 7511
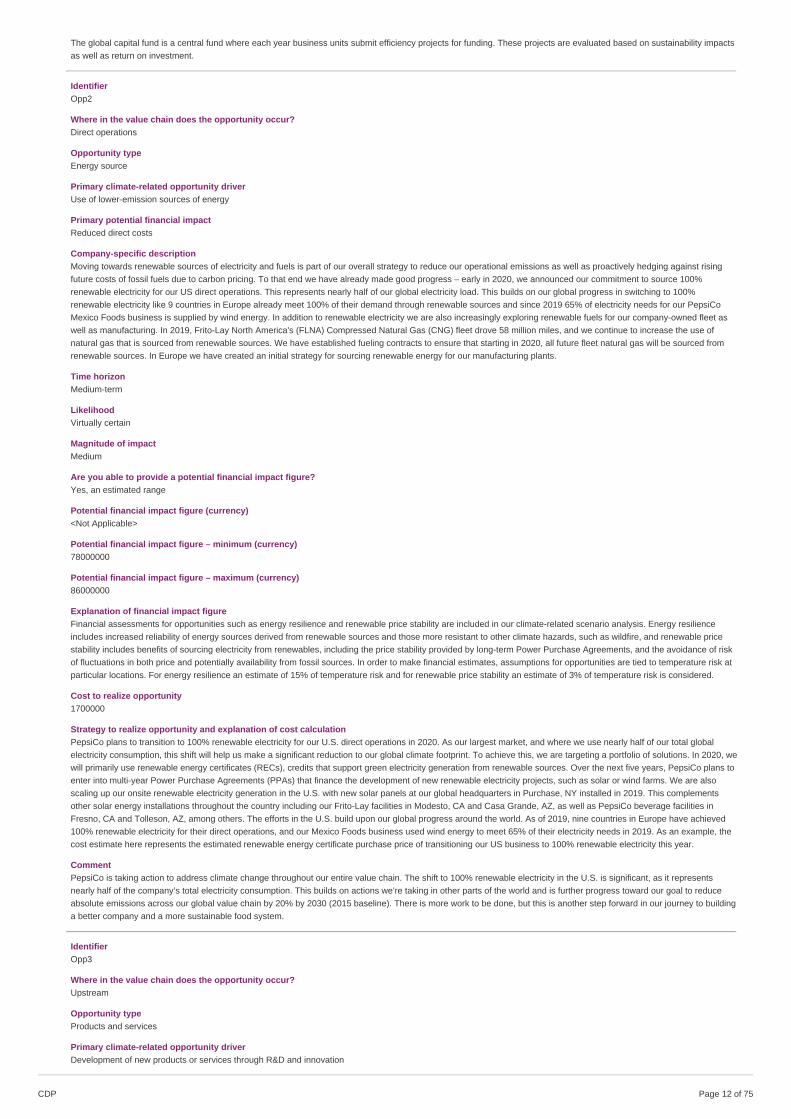
The global capital fund is a central fund where each year business units submit efficiency projects for funding. These projects are evaluated based on sustainability impactsas well as return on investment.
IdentifierOpp2
Where in the value chain does the opportunity occur?Direct operations
Opportunity typeEnergy source
Primary climate-related opportunity driverUse of lower-emission sources of energy
Primary potential financial impactReduced direct costs
Company-specific descriptionMoving towards renewable sources of electricity and fuels is part of our overall strategy to reduce our operational emissions as well as proactively hedging against risingfuture costs of fossil fuels due to carbon pricing. To that end we have already made good progress – early in 2020, we announced our commitment to source 100%renewable electricity for our US direct operations. This represents nearly half of our global electricity load. This builds on our global progress in switching to 100%renewable electricity like 9 countries in Europe already meet 100% of their demand through renewable sources and since 2019 65% of electricity needs for our PepsiCoMexico Foods business is supplied by wind energy. In addition to renewable electricity we are also increasingly exploring renewable fuels for our company-owned fleet aswell as manufacturing. In 2019, Frito-Lay North America's (FLNA) Compressed Natural Gas (CNG) fleet drove 58 million miles, and we continue to increase the use ofnatural gas that is sourced from renewable sources. We have established fueling contracts to ensure that starting in 2020, all future fleet natural gas will be sourced fromrenewable sources. In Europe we have created an initial strategy for sourcing renewable energy for our manufacturing plants.
Time horizonMedium-term
LikelihoodVirtually certain
Magnitude of impactMedium
Are you able to provide a potential financial impact figure?Yes, an estimated range
Potential financial impact figure (currency)<Not Applicable>
Potential financial impact figure – minimum (currency)78000000
Potential financial impact figure – maximum (currency)86000000
Explanation of financial impact figureFinancial assessments for opportunities such as energy resilience and renewable price stability are included in our climate-related scenario analysis. Energy resilienceincludes increased reliability of energy sources derived from renewable sources and those more resistant to other climate hazards, such as wildfire, and renewable pricestability includes benefits of sourcing electricity from renewables, including the price stability provided by long-term Power Purchase Agreements, and the avoidance of riskof fluctuations in both price and potentially availability from fossil sources. In order to make financial estimates, assumptions for opportunities are tied to temperature risk atparticular locations. For energy resilience an estimate of 15% of temperature risk and for renewable price stability an estimate of 3% of temperature risk is considered.
Cost to realize opportunity1700000
Strategy to realize opportunity and explanation of cost calculationPepsiCo plans to transition to 100% renewable electricity for our U.S. direct operations in 2020. As our largest market, and where we use nearly half of our total globalelectricity consumption, this shift will help us make a significant reduction to our global climate footprint. To achieve this, we are targeting a portfolio of solutions. In 2020, wewill primarily use renewable energy certificates (RECs), credits that support green electricity generation from renewable sources. Over the next five years, PepsiCo plans toenter into multi-year Power Purchase Agreements (PPAs) that finance the development of new renewable electricity projects, such as solar or wind farms. We are alsoscaling up our onsite renewable electricity generation in the U.S. with new solar panels at our global headquarters in Purchase, NY installed in 2019. This complementsother solar energy installations throughout the country including our Frito-Lay facilities in Modesto, CA and Casa Grande, AZ, as well as PepsiCo beverage facilities inFresno, CA and Tolleson, AZ, among others. The efforts in the U.S. build upon our global progress around the world. As of 2019, nine countries in Europe have achieved100% renewable electricity for their direct operations, and our Mexico Foods business used wind energy to meet 65% of their electricity needs in 2019. As an example, thecost estimate here represents the estimated renewable energy certificate purchase price of transitioning our US business to 100% renewable electricity this year.
CommentPepsiCo is taking action to address climate change throughout our entire value chain. The shift to 100% renewable electricity in the U.S. is significant, as it representsnearly half of the company’s total electricity consumption. This builds on actions we’re taking in other parts of the world and is further progress toward our goal to reduceabsolute emissions across our global value chain by 20% by 2030 (2015 baseline). There is more work to be done, but this is another step forward in our journey to buildinga better company and a more sustainable food system.
IdentifierOpp3
Where in the value chain does the opportunity occur?Upstream
Opportunity typeProducts and services
Primary climate-related opportunity driverDevelopment of new products or services through R&D and innovation
CDP Page of 7512

Primary potential financial impactIncreased revenues resulting from increased demand for products and services
Company-specific descriptionAccording to recent research sustainability-marketed products have led to 50% growth of consumer packaged goods between 2013 and 2018. This is new opportunity thatour R&D organization is keenly aware of and working towards. New products and exciting innovations drive PepsiCo’s success, and PepsiCo’s R&D organization is wherethose innovations are born. The organization is connected to consumers’ evolving needs, preferences and taste experiences, and use deep technical skills and insights todevelop more enjoyable and nutritious foods and beverages for more people, in more places. Product innovation towards lower environmental impact is an areacontinuously explored by our R&D teams including supporting our journey towards our sustainability goals like our product nutrition goals around reducing added sugars,sodium and saturated fat, our sustainable packaging goals including researching recyclability solutions and incorporation of recycled content in our product packaging, all ofwhich are also closely tied with our climate strategy and lead to GHG emission reductions. Improving product specifications to move towards increasingly energy efficientvending and cooling machines that we deploy in the marketplace. Our R&D organization is integral to our sustainability agenda
Time horizonMedium-term
LikelihoodVery likely
Magnitude of impactMedium-high
Are you able to provide a potential financial impact figure?Yes, a single figure estimate
Potential financial impact figure (currency)1900000000
Potential financial impact figure – minimum (currency)<Not Applicable>
Potential financial impact figure – maximum (currency)<Not Applicable>
Explanation of financial impact figurePepsiCo’s reputation and the behavior of consumers in choosing our products are important to the market cap and revenue generation of the Company. The 2019 netrevenues for PepsiCo were more than $67 billion. PepsiCo revenues are sensitive to changes in consumer preferences. For example, a one percent impact on PEP’smarket value (defined as our market capitalization) would equate to ~$1.8billion. Changes in consumer preferences, for example, due to a positive reaction to PepsiCo’sreputation, and the reputation of its products relative to the environment, could positively affect PepsiCo’s business, financial condition or results of operations although itwould be difficult to precisely identify the driving factors causing a change in consumer behavior.
Cost to realize opportunity148000
Strategy to realize opportunity and explanation of cost calculationPepsiCo has positioned itself advantageously versus competitors by adopting and implementing our sustainability program. We have an industry-leading goal to reduceemissions across our value chain. We continue to report against this goal annually in our Sustainability Report. We believe that continuing to deliver on these goals will leadto enhanced reputation, more sustainable growth and financial performance that will outperform our competitors. In 2019, we introduced Sustainable from the Start, anenvironmental sustainability impact assessment, including GHG impact assessment, into our new product development process. The program includes a toolkit andbusiness processes that help to build the capability within our various functions involved in product innovation (like R&D, marketing and insights) to understand theenvironmental and climate impacts of product design, and to make sustainable choices. In doing so, they are supporting our strategic, long-term vision to decouple ourbusiness from fossil fuels. Our estimated management cost is conservatively based on the development and maintenance of our tools related to the sustainable from thestart program. In addition, 2 full time employees and several other partners spend time on developing and implementing the program within the business.
CommentOur management cost estimate only covers the development and maintenance of our toolkit under the sustainable from the start program.
C3. Business Strategy
C3.1
(C3.1) Have climate-related risks and opportunities influenced your organization’s strategy and/or financial planning?Yes, and we have developed a low-carbon transition plan
C3.1a
(C3.1a) Does your organization use climate-related scenario analysis to inform its strategy?Yes, quantitative
C3.1b
CDP Page of 7513
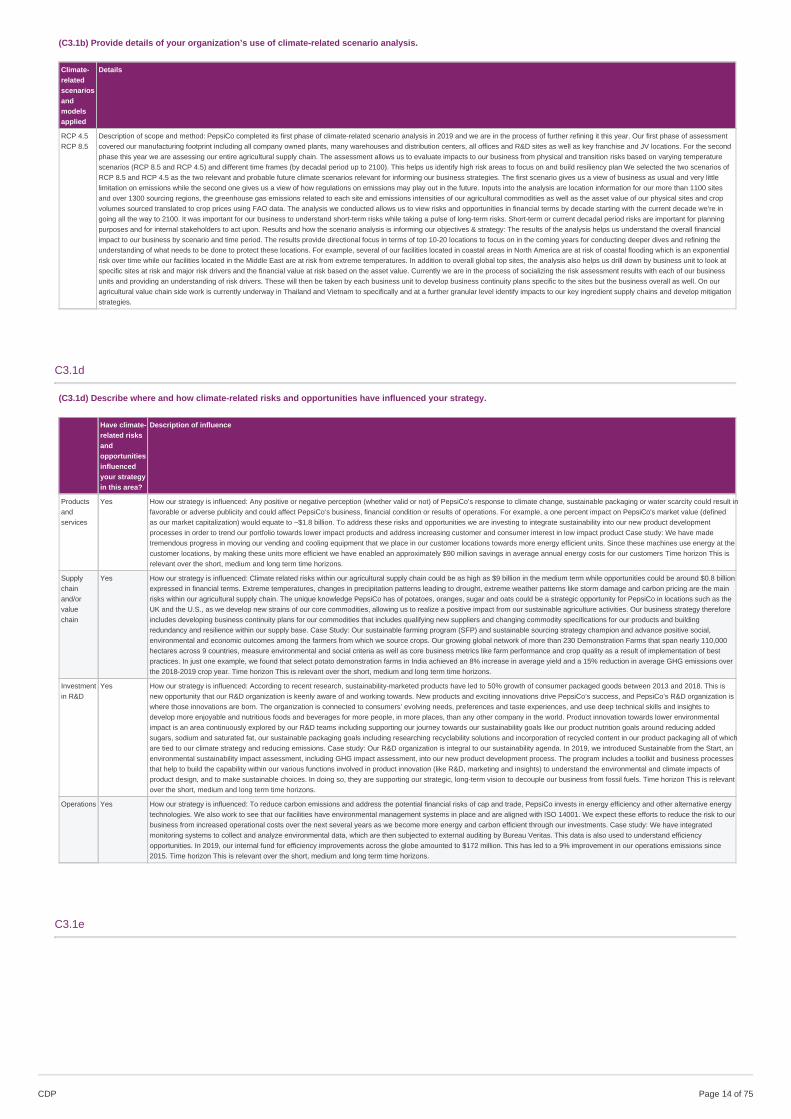
(C3.1b) Provide details of your organization’s use of climate-related scenario analysis.
Climate-relatedscenariosandmodelsapplied
Details
RCP 4.5RCP 8.5
Description of scope and method: PepsiCo completed its first phase of climate-related scenario analysis in 2019 and we are in the process of further refining it this year. Our first phase of assessmentcovered our manufacturing footprint including all company owned plants, many warehouses and distribution centers, all offices and R&D sites as well as key franchise and JV locations. For the secondphase this year we are assessing our entire agricultural supply chain. The assessment allows us to evaluate impacts to our business from physical and transition risks based on varying temperaturescenarios (RCP 8.5 and RCP 4.5) and different time frames (by decadal period up to 2100). This helps us identify high risk areas to focus on and build resiliency plan We selected the two scenarios ofRCP 8.5 and RCP 4.5 as the two relevant and probable future climate scenarios relevant for informing our business strategies. The first scenario gives us a view of business as usual and very littlelimitation on emissions while the second one gives us a view of how regulations on emissions may play out in the future. Inputs into the analysis are location information for our more than 1100 sitesand over 1300 sourcing regions, the greenhouse gas emissions related to each site and emissions intensities of our agricultural commodities as well as the asset value of our physical sites and cropvolumes sourced translated to crop prices using FAO data. The analysis we conducted allows us to view risks and opportunities in financial terms by decade starting with the current decade we’re ingoing all the way to 2100. It was important for our business to understand short-term risks while taking a pulse of long-term risks. Short-term or current decadal period risks are important for planningpurposes and for internal stakeholders to act upon. Results and how the scenario analysis is informing our objectives & strategy: The results of the analysis helps us understand the overall financialimpact to our business by scenario and time period. The results provide directional focus in terms of top 10-20 locations to focus on in the coming years for conducting deeper dives and refining theunderstanding of what needs to be done to protect these locations. For example, several of our facilities located in coastal areas in North America are at risk of coastal flooding which is an exponentialrisk over time while our facilities located in the Middle East are at risk from extreme temperatures. In addition to overall global top sites, the analysis also helps us drill down by business unit to look atspecific sites at risk and major risk drivers and the financial value at risk based on the asset value. Currently we are in the process of socializing the risk assessment results with each of our businessunits and providing an understanding of risk drivers. These will then be taken by each business unit to develop business continuity plans specific to the sites but the business overall as well. On ouragricultural value chain side work is currently underway in Thailand and Vietnam to specifically and at a further granular level identify impacts to our key ingredient supply chains and develop mitigationstrategies.
C3.1d
(C3.1d) Describe where and how climate-related risks and opportunities have influenced your strategy.
Have climate-related risksandopportunitiesinfluencedyour strategyin this area?
Description of influence
Productsandservices
Yes How our strategy is influenced: Any positive or negative perception (whether valid or not) of PepsiCo’s response to climate change, sustainable packaging or water scarcity could result infavorable or adverse publicity and could affect PepsiCo’s business, financial condition or results of operations. For example, a one percent impact on PepsiCo's market value (definedas our market capitalization) would equate to ~$1.8 billion. To address these risks and opportunities we are investing to integrate sustainability into our new product developmentprocesses in order to trend our portfolio towards lower impact products and address increasing customer and consumer interest in low impact product Case study: We have madetremendous progress in moving our vending and cooling equipment that we place in our customer locations towards more energy efficient units. Since these machines use energy at thecustomer locations, by making these units more efficient we have enabled an approximately $90 million savings in average annual energy costs for our customers Time horizon This isrelevant over the short, medium and long term time horizons.
Supplychainand/orvaluechain
Yes How our strategy is influenced: Climate related risks within our agricultural supply chain could be as high as $9 billion in the medium term while opportunities could be around $0.8 billionexpressed in financial terms. Extreme temperatures, changes in precipitation patterns leading to drought, extreme weather patterns like storm damage and carbon pricing are the mainrisks within our agricultural supply chain. The unique knowledge PepsiCo has of potatoes, oranges, sugar and oats could be a strategic opportunity for PepsiCo in locations such as theUK and the U.S., as we develop new strains of our core commodities, allowing us to realize a positive impact from our sustainable agriculture activities. Our business strategy thereforeincludes developing business continuity plans for our commodities that includes qualifying new suppliers and changing commodity specifications for our products and buildingredundancy and resilience within our supply base. Case Study: Our sustainable farming program (SFP) and sustainable sourcing strategy champion and advance positive social,environmental and economic outcomes among the farmers from which we source crops. Our growing global network of more than 230 Demonstration Farms that span nearly 110,000hectares across 9 countries, measure environmental and social criteria as well as core business metrics like farm performance and crop quality as a result of implementation of bestpractices. In just one example, we found that select potato demonstration farms in India achieved an 8% increase in average yield and a 15% reduction in average GHG emissions overthe 2018-2019 crop year. Time horizon This is relevant over the short, medium and long term time horizons.
Investmentin R&D
Yes How our strategy is influenced: According to recent research, sustainability-marketed products have led to 50% growth of consumer packaged goods between 2013 and 2018. This isnew opportunity that our R&D organization is keenly aware of and working towards. New products and exciting innovations drive PepsiCo’s success, and PepsiCo’s R&D organization iswhere those innovations are born. The organization is connected to consumers’ evolving needs, preferences and taste experiences, and use deep technical skills and insights todevelop more enjoyable and nutritious foods and beverages for more people, in more places, than any other company in the world. Product innovation towards lower environmentalimpact is an area continuously explored by our R&D teams including supporting our journey towards our sustainability goals like our product nutrition goals around reducing addedsugars, sodium and saturated fat, our sustainable packaging goals including researching recyclability solutions and incorporation of recycled content in our product packaging all of whichare tied to our climate strategy and reducing emissions. Case study: Our R&D organization is integral to our sustainability agenda. In 2019, we introduced Sustainable from the Start, anenvironmental sustainability impact assessment, including GHG impact assessment, into our new product development process. The program includes a toolkit and business processesthat help to build the capability within our various functions involved in product innovation (like R&D, marketing and insights) to understand the environmental and climate impacts ofproduct design, and to make sustainable choices. In doing so, they are supporting our strategic, long-term vision to decouple our business from fossil fuels. Time horizon This is relevantover the short, medium and long term time horizons.
Operations Yes How our strategy is influenced: To reduce carbon emissions and address the potential financial risks of cap and trade, PepsiCo invests in energy efficiency and other alternative energytechnologies. We also work to see that our facilities have environmental management systems in place and are aligned with ISO 14001. We expect these efforts to reduce the risk to ourbusiness from increased operational costs over the next several years as we become more energy and carbon efficient through our investments. Case study: We have integratedmonitoring systems to collect and analyze environmental data, which are then subjected to external auditing by Bureau Veritas. This data is also used to understand efficiencyopportunities. In 2019, our internal fund for efficiency improvements across the globe amounted to $172 million. This has led to a 9% improvement in our operations emissions since2015. Time horizon This is relevant over the short, medium and long term time horizons.
C3.1e
CDP Page of 7514
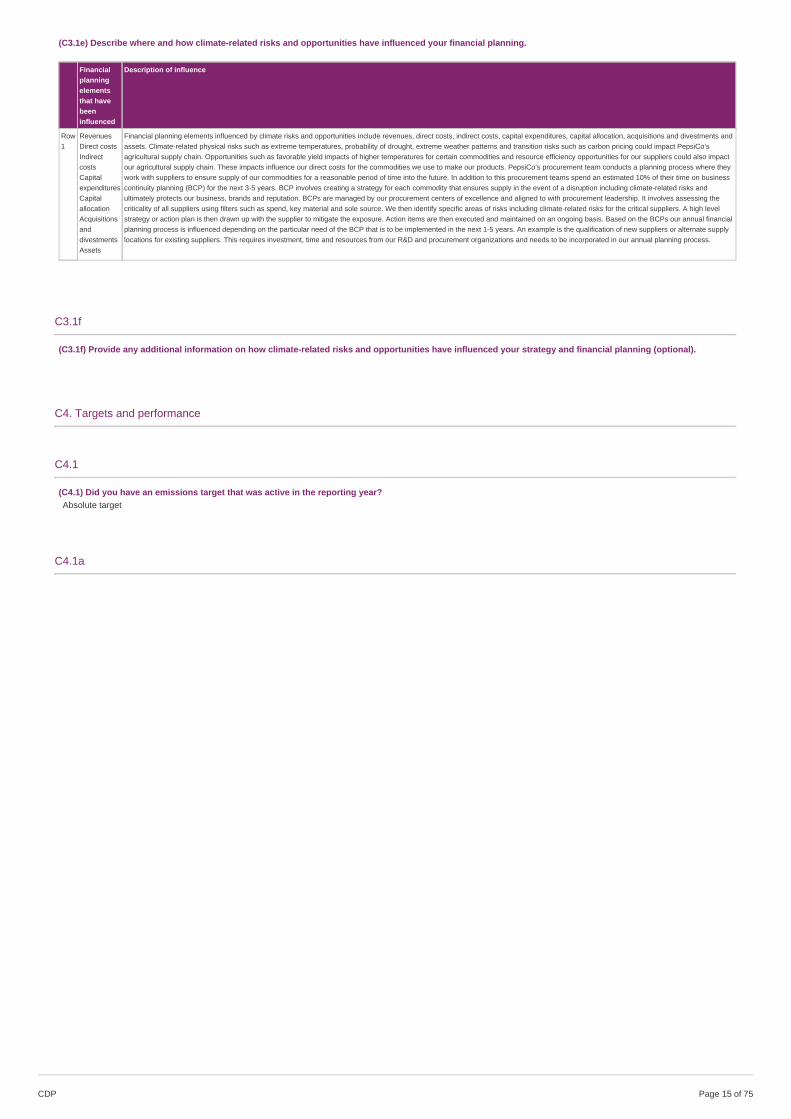
(C3.1e) Describe where and how climate-related risks and opportunities have influenced your financial planning.
Financialplanningelementsthat havebeeninfluenced
Description of influence
Row1
RevenuesDirect costsIndirectcostsCapitalexpendituresCapitalallocationAcquisitionsanddivestmentsAssets
Financial planning elements influenced by climate risks and opportunities include revenues, direct costs, indirect costs, capital expenditures, capital allocation, acquisitions and divestments andassets. Climate-related physical risks such as extreme temperatures, probability of drought, extreme weather patterns and transition risks such as carbon pricing could impact PepsiCo’sagricultural supply chain. Opportunities such as favorable yield impacts of higher temperatures for certain commodities and resource efficiency opportunities for our suppliers could also impactour agricultural supply chain. These impacts influence our direct costs for the commodities we use to make our products. PepsiCo’s procurement team conducts a planning process where theywork with suppliers to ensure supply of our commodities for a reasonable period of time into the future. In addition to this procurement teams spend an estimated 10% of their time on businesscontinuity planning (BCP) for the next 3-5 years. BCP involves creating a strategy for each commodity that ensures supply in the event of a disruption including climate-related risks andultimately protects our business, brands and reputation. BCPs are managed by our procurement centers of excellence and aligned to with procurement leadership. It involves assessing thecriticality of all suppliers using filters such as spend, key material and sole source. We then identify specific areas of risks including climate-related risks for the critical suppliers. A high levelstrategy or action plan is then drawn up with the supplier to mitigate the exposure. Action items are then executed and maintained on an ongoing basis. Based on the BCPs our annual financialplanning process is influenced depending on the particular need of the BCP that is to be implemented in the next 1-5 years. An example is the qualification of new suppliers or alternate supplylocations for existing suppliers. This requires investment, time and resources from our R&D and procurement organizations and needs to be incorporated in our annual planning process.
C3.1f
(C3.1f) Provide any additional information on how climate-related risks and opportunities have influenced your strategy and financial planning (optional).
C4. Targets and performance
C4.1
(C4.1) Did you have an emissions target that was active in the reporting year?Absolute target
C4.1a
CDP Page of 7515
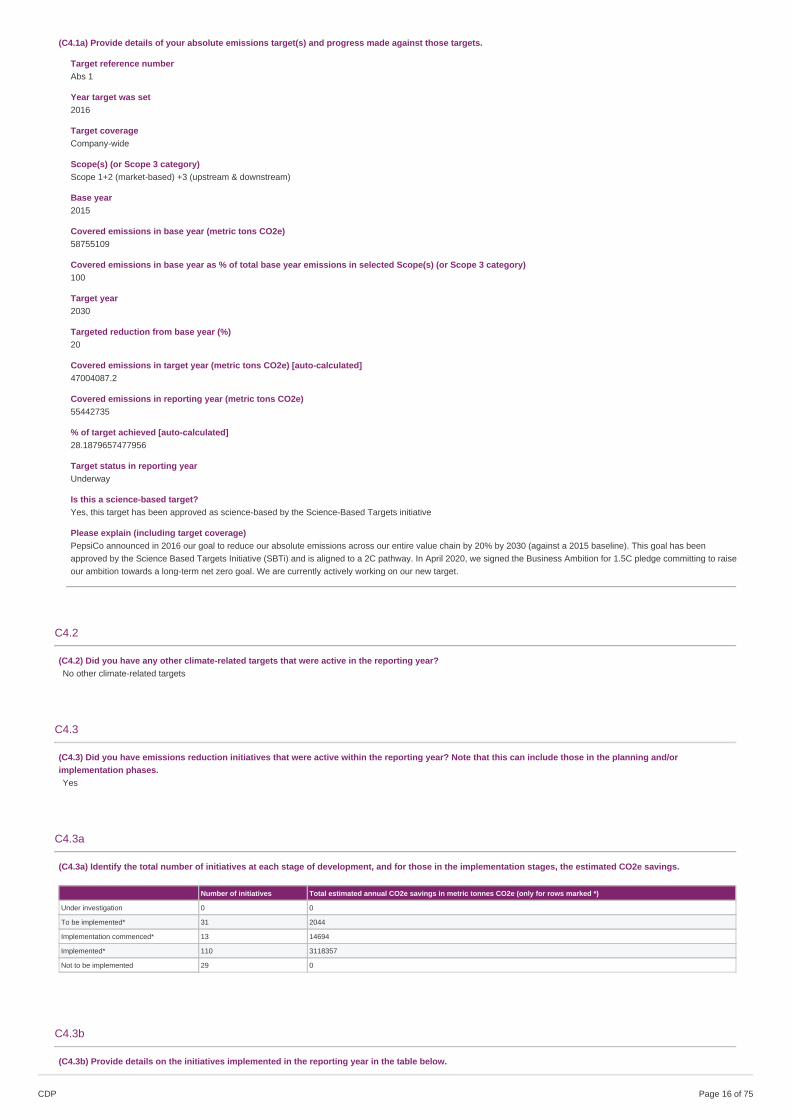
(C4.1a) Provide details of your absolute emissions target(s) and progress made against those targets.
Target reference numberAbs 1
Year target was set2016
Target coverageCompany-wide
Scope(s) (or Scope 3 category)Scope 1+2 (market-based) +3 (upstream & downstream)
Base year2015
Covered emissions in base year (metric tons CO2e)58755109
Covered emissions in base year as % of total base year emissions in selected Scope(s) (or Scope 3 category)100
Target year2030
Targeted reduction from base year (%)20
Covered emissions in target year (metric tons CO2e) [auto-calculated]47004087.2
Covered emissions in reporting year (metric tons CO2e)55442735
% of target achieved [auto-calculated]28.1879657477956
Target status in reporting yearUnderway
Is this a science-based target?Yes, this target has been approved as science-based by the Science-Based Targets initiative
Please explain (including target coverage)PepsiCo announced in 2016 our goal to reduce our absolute emissions across our entire value chain by 20% by 2030 (against a 2015 baseline). This goal has beenapproved by the Science Based Targets Initiative (SBTi) and is aligned to a 2C pathway. In April 2020, we signed the Business Ambition for 1.5C pledge committing to raiseour ambition towards a long-term net zero goal. We are currently actively working on our new target.
C4.2
(C4.2) Did you have any other climate-related targets that were active in the reporting year?No other climate-related targets
C4.3
(C4.3) Did you have emissions reduction initiatives that were active within the reporting year? Note that this can include those in the planning and/orimplementation phases.Yes
C4.3a
(C4.3a) Identify the total number of initiatives at each stage of development, and for those in the implementation stages, the estimated CO2e savings.
Number of initiatives Total estimated annual CO2e savings in metric tonnes CO2e (only for rows marked *)
Under investigation 0 0
To be implemented* 31 2044
Implementation commenced* 13 14694
Implemented* 110 3118357
Not to be implemented 29 0
C4.3b
(C4.3b) Provide details on the initiatives implemented in the reporting year in the table below.
CDP Page of 7516
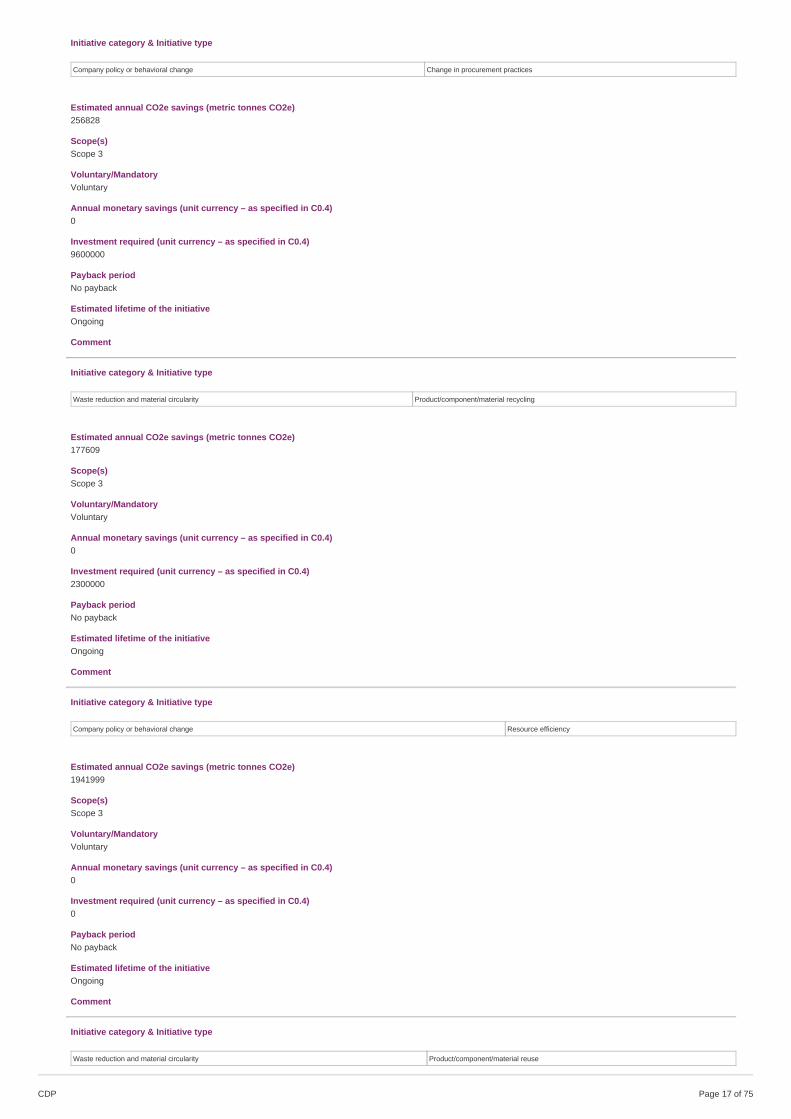
Initiative category & Initiative type
Company policy or behavioral change Change in procurement practices
Estimated annual CO2e savings (metric tonnes CO2e)256828
Scope(s)Scope 3
Voluntary/MandatoryVoluntary
Annual monetary savings (unit currency – as specified in C0.4)0
Investment required (unit currency – as specified in C0.4)9600000
Payback periodNo payback
Estimated lifetime of the initiativeOngoing
Comment
Initiative category & Initiative type
Waste reduction and material circularity Product/component/material recycling
Estimated annual CO2e savings (metric tonnes CO2e)177609
Scope(s)Scope 3
Voluntary/MandatoryVoluntary
Annual monetary savings (unit currency – as specified in C0.4)0
Investment required (unit currency – as specified in C0.4)2300000
Payback periodNo payback
Estimated lifetime of the initiativeOngoing
Comment
Initiative category & Initiative type
Company policy or behavioral change Resource efficiency
Estimated annual CO2e savings (metric tonnes CO2e)1941999
Scope(s)Scope 3
Voluntary/MandatoryVoluntary
Annual monetary savings (unit currency – as specified in C0.4)0
Investment required (unit currency – as specified in C0.4)0
Payback periodNo payback
Estimated lifetime of the initiativeOngoing
Comment
Initiative category & Initiative type
Waste reduction and material circularity Product/component/material reuse
CDP Page of 7517
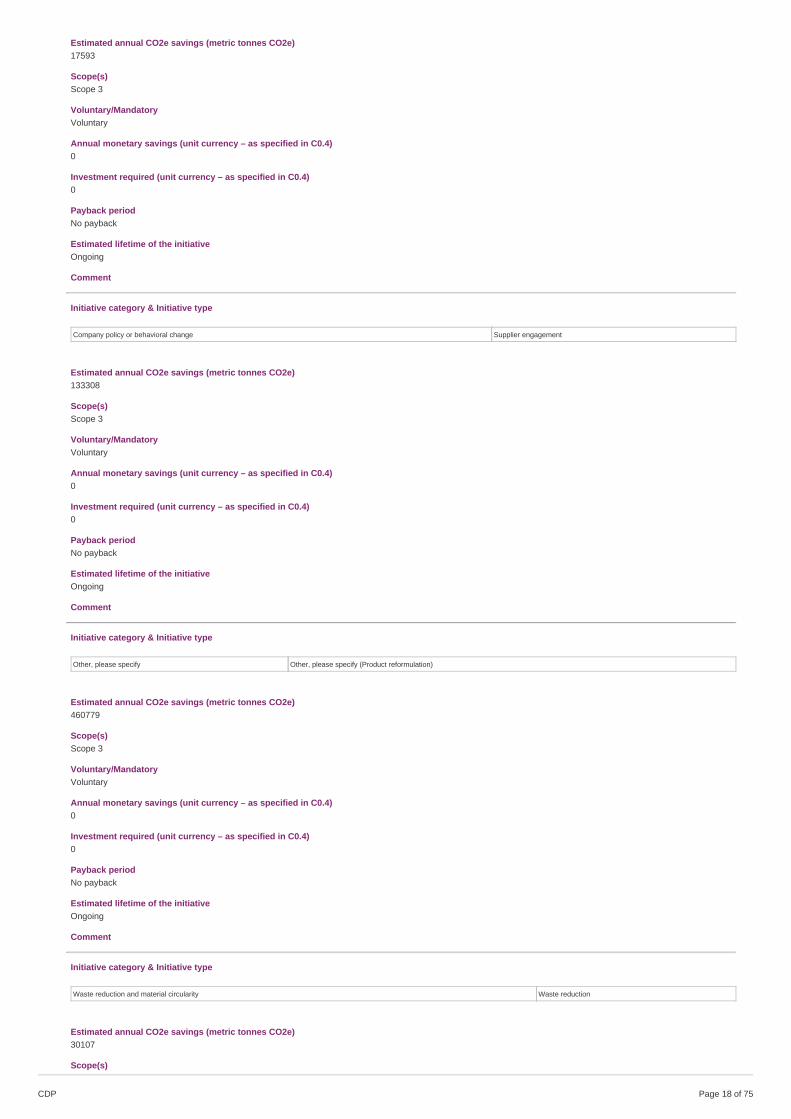
Estimated annual CO2e savings (metric tonnes CO2e)17593
Scope(s)Scope 3
Voluntary/MandatoryVoluntary
Annual monetary savings (unit currency – as specified in C0.4)0
Investment required (unit currency – as specified in C0.4)0
Payback periodNo payback
Estimated lifetime of the initiativeOngoing
Comment
Initiative category & Initiative type
Company policy or behavioral change Supplier engagement
Estimated annual CO2e savings (metric tonnes CO2e)133308
Scope(s)Scope 3
Voluntary/MandatoryVoluntary
Annual monetary savings (unit currency – as specified in C0.4)0
Investment required (unit currency – as specified in C0.4)0
Payback periodNo payback
Estimated lifetime of the initiativeOngoing
Comment
Initiative category & Initiative type
Other, please specify Other, please specify (Product reformulation)
Estimated annual CO2e savings (metric tonnes CO2e)460779
Scope(s)Scope 3
Voluntary/MandatoryVoluntary
Annual monetary savings (unit currency – as specified in C0.4)0
Investment required (unit currency – as specified in C0.4)0
Payback periodNo payback
Estimated lifetime of the initiativeOngoing
Comment
Initiative category & Initiative type
Waste reduction and material circularity Waste reduction
Estimated annual CO2e savings (metric tonnes CO2e)30107
Scope(s)
CDP Page of 7518
Scope 3
Voluntary/MandatoryVoluntary
Annual monetary savings (unit currency – as specified in C0.4)0
Investment required (unit currency – as specified in C0.4)0
Payback periodNo payback
Estimated lifetime of the initiativeOngoing
Comment
Initiative category & Initiative type
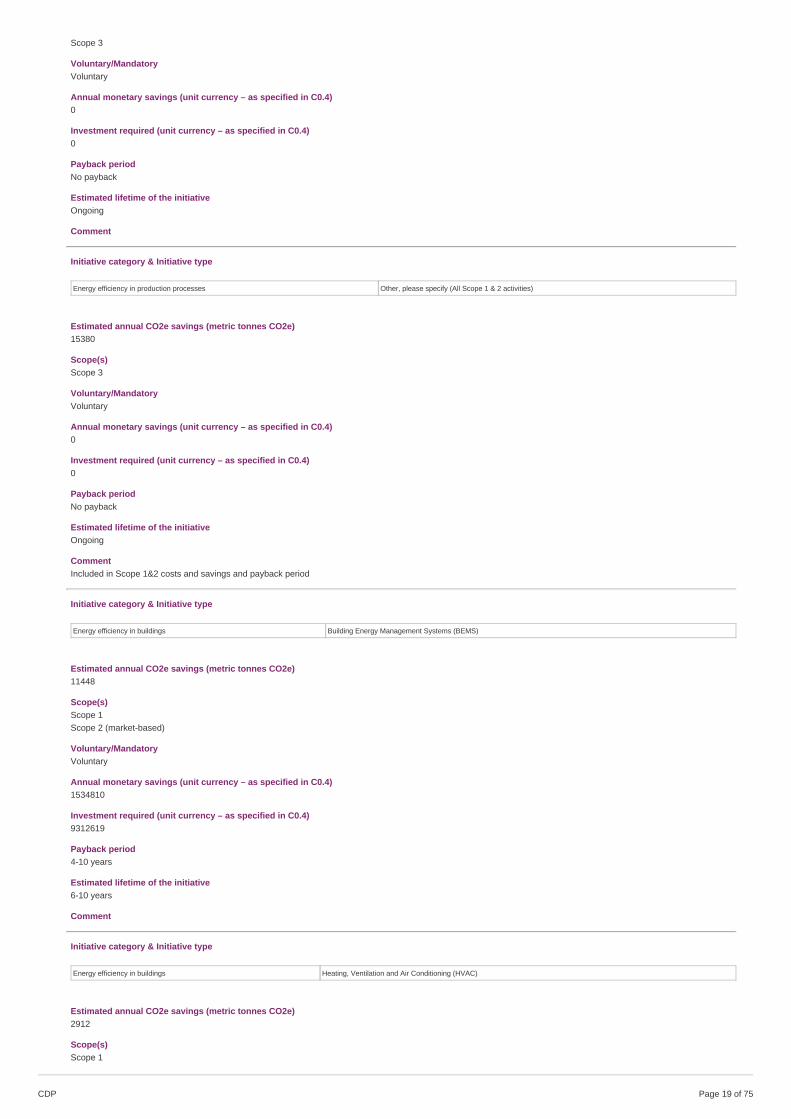
Energy efficiency in production processes Other, please specify (All Scope 1 & 2 activities)
Estimated annual CO2e savings (metric tonnes CO2e)15380
Scope(s)Scope 3
Voluntary/MandatoryVoluntary
Annual monetary savings (unit currency – as specified in C0.4)0
Investment required (unit currency – as specified in C0.4)0
Payback periodNo payback
Estimated lifetime of the initiativeOngoing
CommentIncluded in Scope 1&2 costs and savings and payback period
Initiative category & Initiative type
Energy efficiency in buildings Building Energy Management Systems (BEMS)
Estimated annual CO2e savings (metric tonnes CO2e)11448
Scope(s)Scope 1Scope 2 (market-based)
Voluntary/MandatoryVoluntary
Annual monetary savings (unit currency – as specified in C0.4)1534810
Investment required (unit currency – as specified in C0.4)9312619
Payback period4-10 years
Estimated lifetime of the initiative6-10 years
Comment
Initiative category & Initiative type
Energy efficiency in buildings Heating, Ventilation and Air Conditioning (HVAC)
Estimated annual CO2e savings (metric tonnes CO2e)2912
Scope(s)Scope 1
CDP Page of 7519
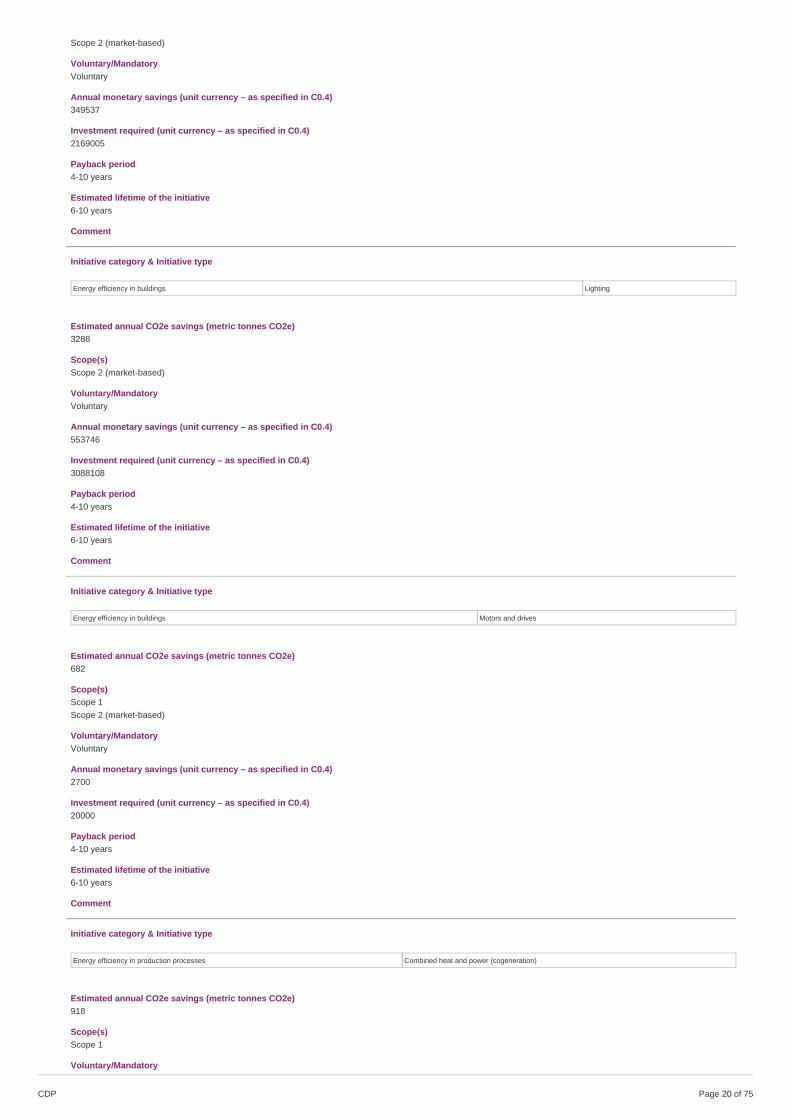
Scope 2 (market-based)
Voluntary/MandatoryVoluntary
Annual monetary savings (unit currency – as specified in C0.4)349537
Investment required (unit currency – as specified in C0.4)2169005
Payback period4-10 years
Estimated lifetime of the initiative6-10 years
Comment
Initiative category & Initiative type
Energy efficiency in buildings Lighting
Estimated annual CO2e savings (metric tonnes CO2e)3288
Scope(s)Scope 2 (market-based)
Voluntary/MandatoryVoluntary
Annual monetary savings (unit currency – as specified in C0.4)553746
Investment required (unit currency – as specified in C0.4)3088108
Payback period4-10 years
Estimated lifetime of the initiative6-10 years
Comment
Initiative category & Initiative type
Energy efficiency in buildings Motors and drives
Estimated annual CO2e savings (metric tonnes CO2e)682
Scope(s)Scope 1Scope 2 (market-based)
Voluntary/MandatoryVoluntary
Annual monetary savings (unit currency – as specified in C0.4)2700
Investment required (unit currency – as specified in C0.4)20000
Payback period4-10 years
Estimated lifetime of the initiative6-10 years
Comment
Initiative category & Initiative type
Energy efficiency in production processes Combined heat and power (cogeneration)
Estimated annual CO2e savings (metric tonnes CO2e)918
Scope(s)Scope 1
Voluntary/Mandatory
CDP Page of 7520
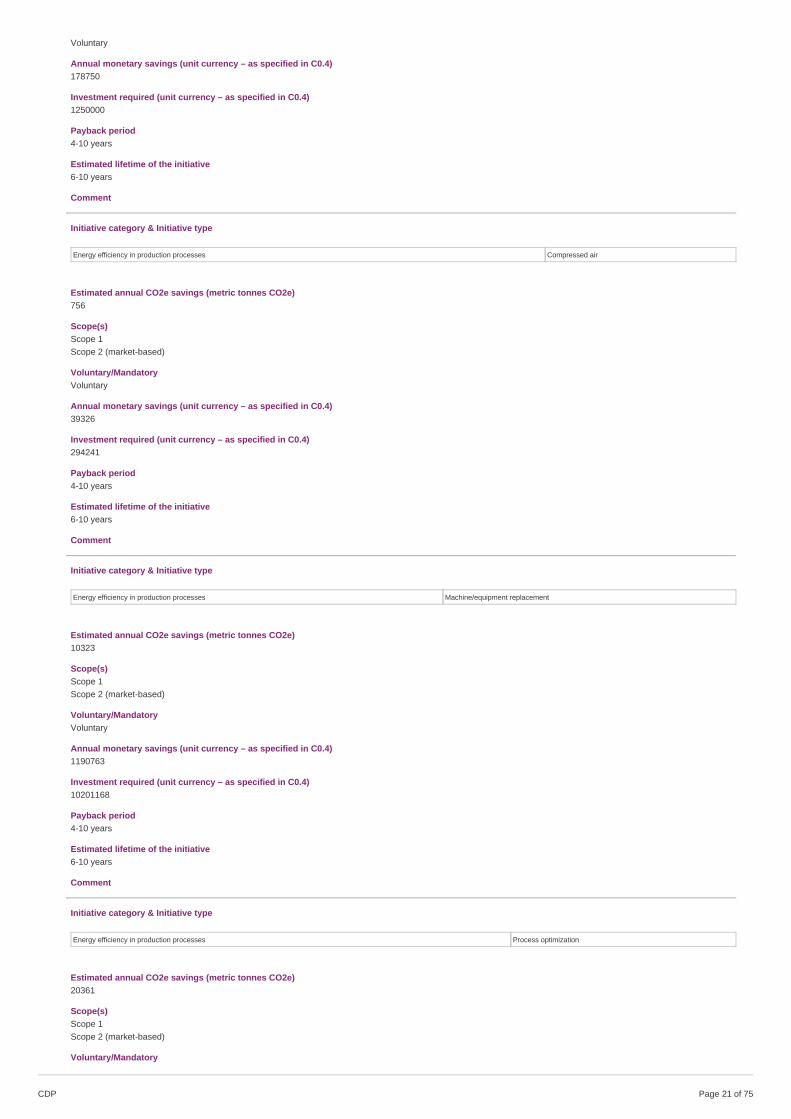
Voluntary
Annual monetary savings (unit currency – as specified in C0.4)178750
Investment required (unit currency – as specified in C0.4)1250000
Payback period4-10 years
Estimated lifetime of the initiative6-10 years
Comment
Initiative category & Initiative type
Energy efficiency in production processes Compressed air
Estimated annual CO2e savings (metric tonnes CO2e)756
Scope(s)Scope 1Scope 2 (market-based)
Voluntary/MandatoryVoluntary
Annual monetary savings (unit currency – as specified in C0.4)39326
Investment required (unit currency – as specified in C0.4)294241
Payback period4-10 years
Estimated lifetime of the initiative6-10 years
Comment
Initiative category & Initiative type
Energy efficiency in production processes Machine/equipment replacement
Estimated annual CO2e savings (metric tonnes CO2e)10323
Scope(s)Scope 1Scope 2 (market-based)
Voluntary/MandatoryVoluntary
Annual monetary savings (unit currency – as specified in C0.4)1190763
Investment required (unit currency – as specified in C0.4)10201168
Payback period4-10 years
Estimated lifetime of the initiative6-10 years
Comment
Initiative category & Initiative type
Energy efficiency in production processes Process optimization
Estimated annual CO2e savings (metric tonnes CO2e)20361
Scope(s)Scope 1Scope 2 (market-based)
Voluntary/Mandatory
CDP Page of 7521
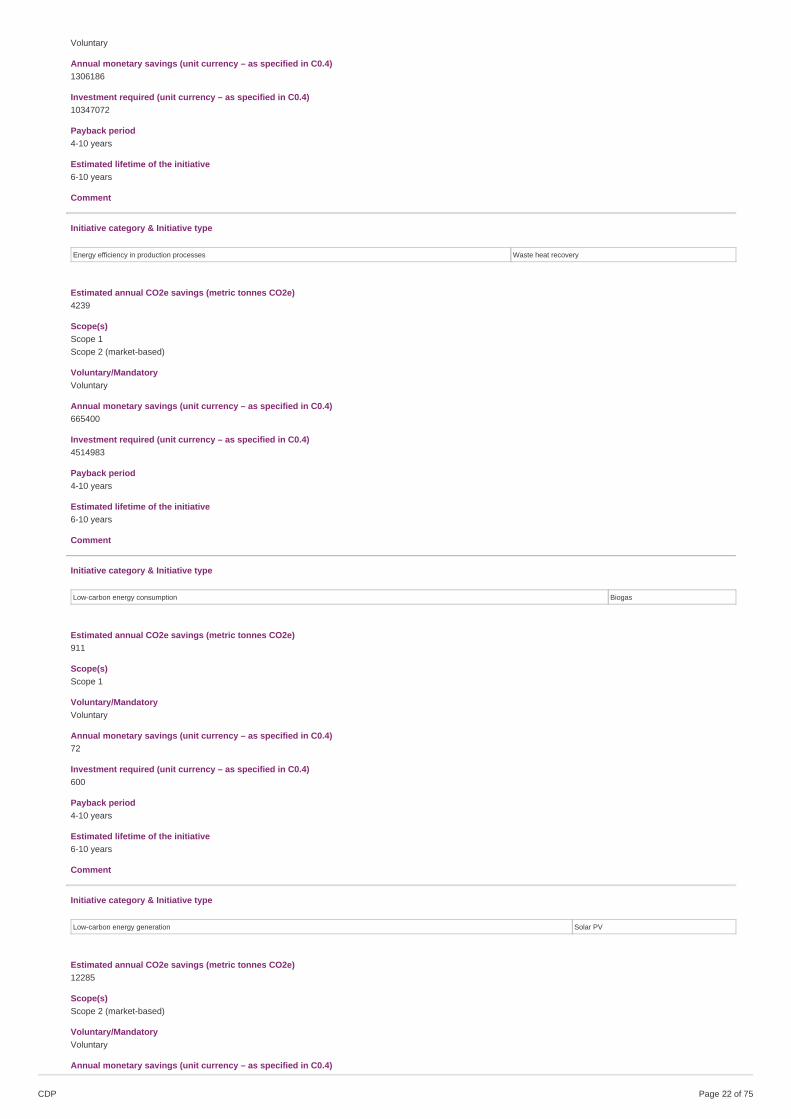
Voluntary
Annual monetary savings (unit currency – as specified in C0.4)1306186
Investment required (unit currency – as specified in C0.4)10347072
Payback period4-10 years
Estimated lifetime of the initiative6-10 years
Comment
Initiative category & Initiative type
Energy efficiency in production processes Waste heat recovery
Estimated annual CO2e savings (metric tonnes CO2e)4239
Scope(s)Scope 1Scope 2 (market-based)
Voluntary/MandatoryVoluntary
Annual monetary savings (unit currency – as specified in C0.4)665400
Investment required (unit currency – as specified in C0.4)4514983
Payback period4-10 years
Estimated lifetime of the initiative6-10 years
Comment
Initiative category & Initiative type
Low-carbon energy consumption Biogas
Estimated annual CO2e savings (metric tonnes CO2e)911
Scope(s)Scope 1
Voluntary/MandatoryVoluntary
Annual monetary savings (unit currency – as specified in C0.4)72
Investment required (unit currency – as specified in C0.4)600
Payback period4-10 years
Estimated lifetime of the initiative6-10 years
Comment
Initiative category & Initiative type
Low-carbon energy generation Solar PV
Estimated annual CO2e savings (metric tonnes CO2e)12285
Scope(s)Scope 2 (market-based)
Voluntary/MandatoryVoluntary
Annual monetary savings (unit currency – as specified in C0.4)
CDP Page of 7522
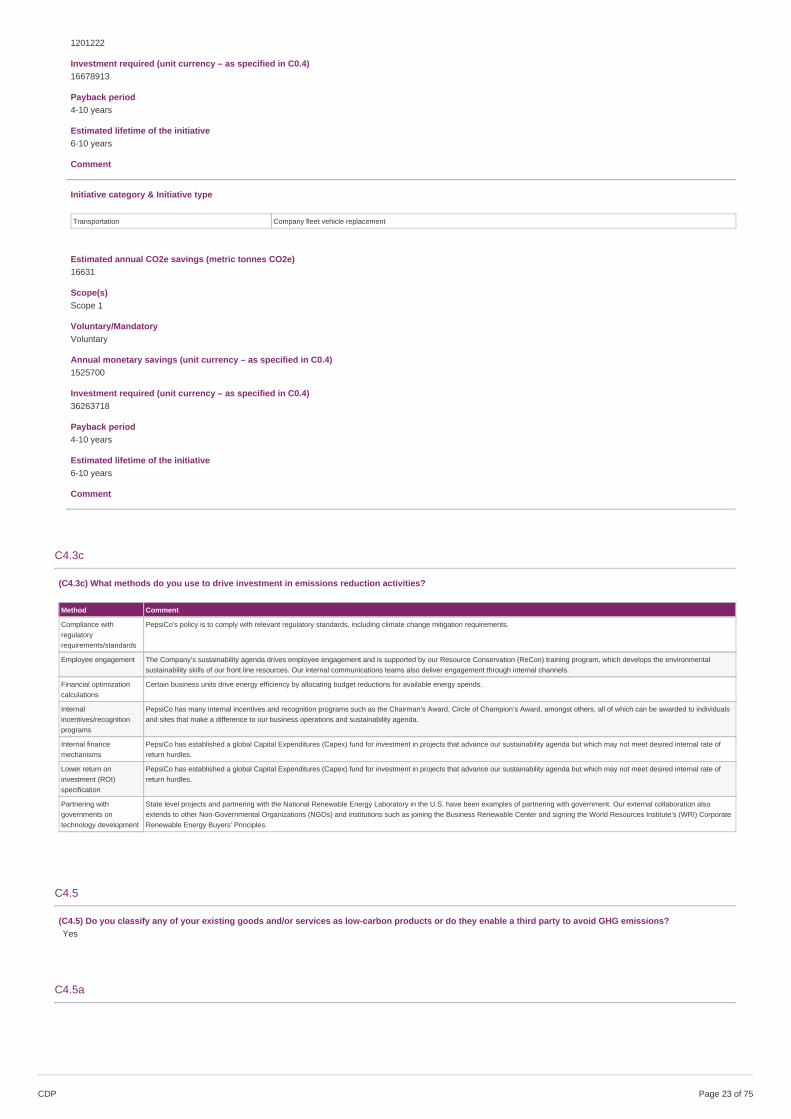
1201222
Investment required (unit currency – as specified in C0.4)16678913
Payback period4-10 years
Estimated lifetime of the initiative6-10 years
Comment
Initiative category & Initiative type
Transportation Company fleet vehicle replacement
Estimated annual CO2e savings (metric tonnes CO2e)16631
Scope(s)Scope 1
Voluntary/MandatoryVoluntary
Annual monetary savings (unit currency – as specified in C0.4)1525700
Investment required (unit currency – as specified in C0.4)36263718
Payback period4-10 years
Estimated lifetime of the initiative6-10 years
Comment
C4.3c
(C4.3c) What methods do you use to drive investment in emissions reduction activities?
Method Comment
Compliance withregulatoryrequirements/standards
PepsiCo's policy is to comply with relevant regulatory standards, including climate change mitigation requirements.
Employee engagement The Company’s sustainability agenda drives employee engagement and is supported by our Resource Conservation (ReCon) training program, which develops the environmentalsustainability skills of our front line resources. Our internal communications teams also deliver engagement through internal channels.
Financial optimizationcalculations
Certain business units drive energy efficiency by allocating budget reductions for available energy spends.
Internalincentives/recognitionprograms
PepsiCo has many internal incentives and recognition programs such as the Chairman’s Award, Circle of Champion’s Award, amongst others, all of which can be awarded to individualsand sites that make a difference to our business operations and sustainability agenda.
Internal financemechanisms
PepsiCo has established a global Capital Expenditures (Capex) fund for investment in projects that advance our sustainability agenda but which may not meet desired internal rate ofreturn hurdles.
Lower return oninvestment (ROI)specification
PepsiCo has established a global Capital Expenditures (Capex) fund for investment in projects that advance our sustainability agenda but which may not meet desired internal rate ofreturn hurdles.
Partnering withgovernments ontechnology development
State level projects and partnering with the National Renewable Energy Laboratory in the U.S. have been examples of partnering with government. Our external collaboration alsoextends to other Non-Governmental Organizations (NGOs) and institutions such as joining the Business Renewable Center and signing the World Resources Institute’s (WRI) CorporateRenewable Energy Buyers' Principles.
C4.5
(C4.5) Do you classify any of your existing goods and/or services as low-carbon products or do they enable a third party to avoid GHG emissions?Yes
C4.5a
CDP Page of 7523
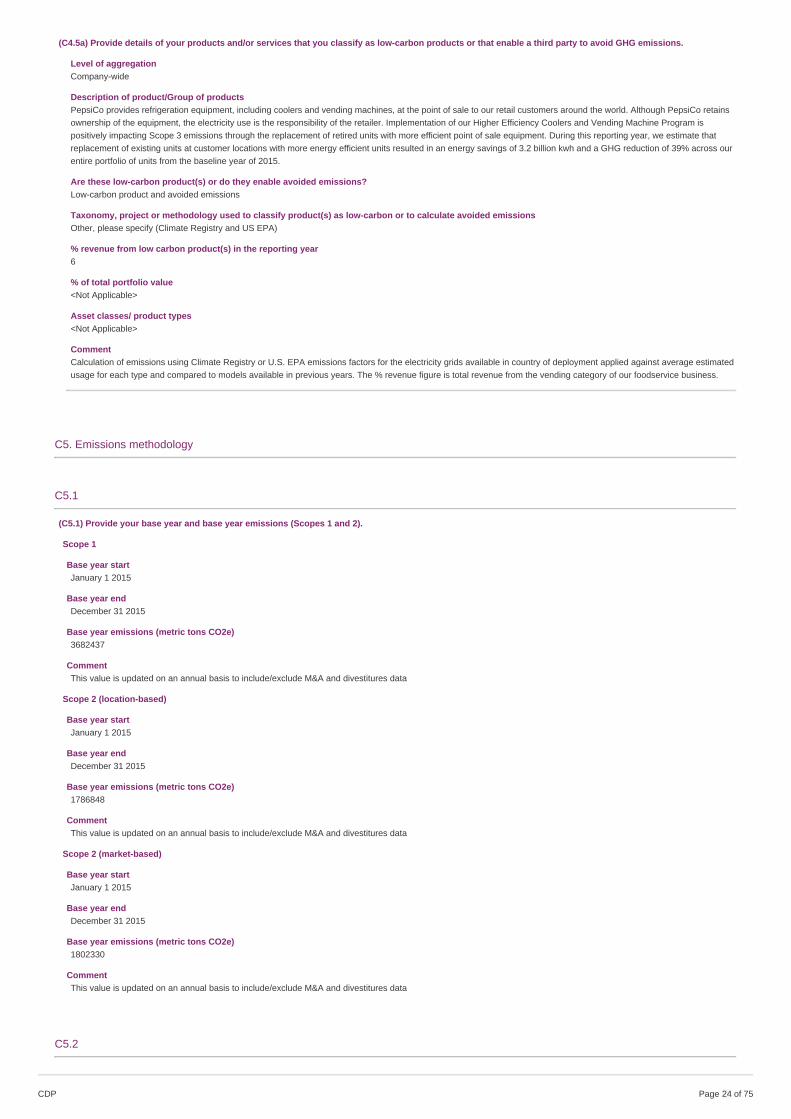
(C4.5a) Provide details of your products and/or services that you classify as low-carbon products or that enable a third party to avoid GHG emissions.
Level of aggregationCompany-wide
Description of product/Group of productsPepsiCo provides refrigeration equipment, including coolers and vending machines, at the point of sale to our retail customers around the world. Although PepsiCo retainsownership of the equipment, the electricity use is the responsibility of the retailer. Implementation of our Higher Efficiency Coolers and Vending Machine Program ispositively impacting Scope 3 emissions through the replacement of retired units with more efficient point of sale equipment. During this reporting year, we estimate thatreplacement of existing units at customer locations with more energy efficient units resulted in an energy savings of 3.2 billion kwh and a GHG reduction of 39% across ourentire portfolio of units from the baseline year of 2015.
Are these low-carbon product(s) or do they enable avoided emissions?Low-carbon product and avoided emissions
Taxonomy, project or methodology used to classify product(s) as low-carbon or to calculate avoided emissionsOther, please specify (Climate Registry and US EPA)
% revenue from low carbon product(s) in the reporting year6
% of total portfolio value<Not Applicable>
Asset classes/ product types<Not Applicable>
CommentCalculation of emissions using Climate Registry or U.S. EPA emissions factors for the electricity grids available in country of deployment applied against average estimatedusage for each type and compared to models available in previous years. The % revenue figure is total revenue from the vending category of our foodservice business.
C5. Emissions methodology
C5.1
(C5.1) Provide your base year and base year emissions (Scopes 1 and 2).
Scope 1
Base year startJanuary 1 2015
Base year endDecember 31 2015
Base year emissions (metric tons CO2e)3682437
CommentThis value is updated on an annual basis to include/exclude M&A and divestitures data
Scope 2 (location-based)
Base year startJanuary 1 2015
Base year endDecember 31 2015
Base year emissions (metric tons CO2e)1786848
CommentThis value is updated on an annual basis to include/exclude M&A and divestitures data
Scope 2 (market-based)
Base year startJanuary 1 2015
Base year endDecember 31 2015
Base year emissions (metric tons CO2e)1802330
CommentThis value is updated on an annual basis to include/exclude M&A and divestitures data
C5.2
CDP Page of 7524
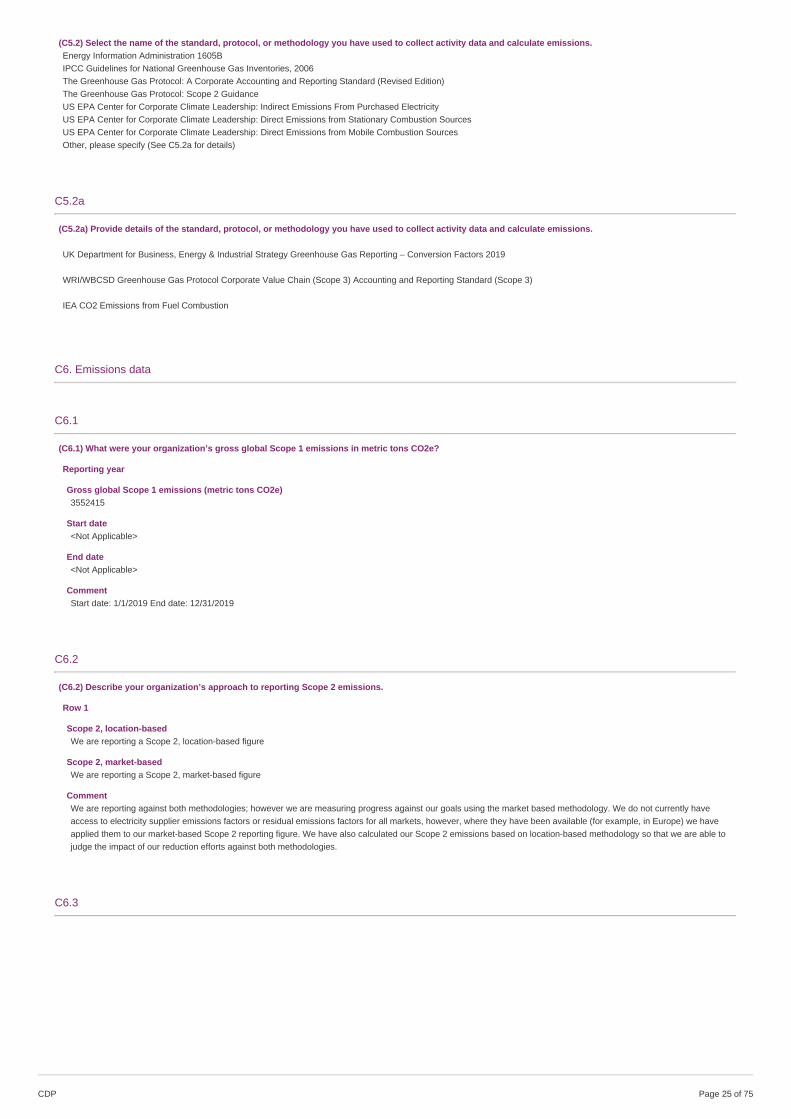
(C5.2) Select the name of the standard, protocol, or methodology you have used to collect activity data and calculate emissions.Energy Information Administration 1605BIPCC Guidelines for National Greenhouse Gas Inventories, 2006The Greenhouse Gas Protocol: A Corporate Accounting and Reporting Standard (Revised Edition)The Greenhouse Gas Protocol: Scope 2 GuidanceUS EPA Center for Corporate Climate Leadership: Indirect Emissions From Purchased ElectricityUS EPA Center for Corporate Climate Leadership: Direct Emissions from Stationary Combustion SourcesUS EPA Center for Corporate Climate Leadership: Direct Emissions from Mobile Combustion SourcesOther, please specify (See C5.2a for details)
C5.2a
(C5.2a) Provide details of the standard, protocol, or methodology you have used to collect activity data and calculate emissions.
UK Department for Business, Energy & Industrial Strategy Greenhouse Gas Reporting – Conversion Factors 2019
WRI/WBCSD Greenhouse Gas Protocol Corporate Value Chain (Scope 3) Accounting and Reporting Standard (Scope 3)
IEA CO2 Emissions from Fuel Combustion
C6. Emissions data
C6.1
(C6.1) What were your organization’s gross global Scope 1 emissions in metric tons CO2e?
Reporting year
Gross global Scope 1 emissions (metric tons CO2e)3552415
Start date<Not Applicable>
End date<Not Applicable>
CommentStart date: 1/1/2019 End date: 12/31/2019
C6.2
(C6.2) Describe your organization’s approach to reporting Scope 2 emissions.
Row 1
Scope 2, location-based We are reporting a Scope 2, location-based figure
Scope 2, market-basedWe are reporting a Scope 2, market-based figure
CommentWe are reporting against both methodologies; however we are measuring progress against our goals using the market based methodology. We do not currently haveaccess to electricity supplier emissions factors or residual emissions factors for all markets, however, where they have been available (for example, in Europe) we haveapplied them to our market-based Scope 2 reporting figure. We have also calculated our Scope 2 emissions based on location-based methodology so that we are able tojudge the impact of our reduction efforts against both methodologies.
C6.3
CDP Page of 7525
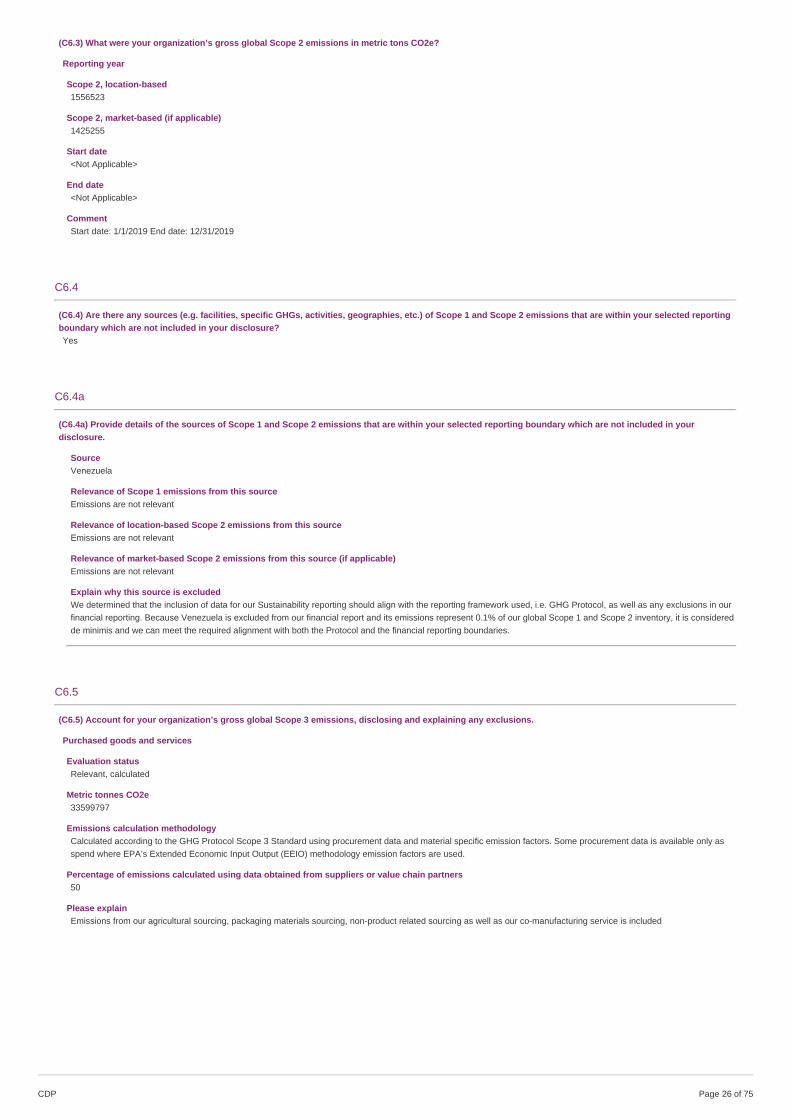
(C6.3) What were your organization’s gross global Scope 2 emissions in metric tons CO2e?
Reporting year
Scope 2, location-based1556523
Scope 2, market-based (if applicable)1425255
Start date<Not Applicable>
End date<Not Applicable>
CommentStart date: 1/1/2019 End date: 12/31/2019
C6.4
(C6.4) Are there any sources (e.g. facilities, specific GHGs, activities, geographies, etc.) of Scope 1 and Scope 2 emissions that are within your selected reportingboundary which are not included in your disclosure?Yes
C6.4a
(C6.4a) Provide details of the sources of Scope 1 and Scope 2 emissions that are within your selected reporting boundary which are not included in yourdisclosure.
SourceVenezuela
Relevance of Scope 1 emissions from this sourceEmissions are not relevant
Relevance of location-based Scope 2 emissions from this sourceEmissions are not relevant
Relevance of market-based Scope 2 emissions from this source (if applicable)Emissions are not relevant
Explain why this source is excludedWe determined that the inclusion of data for our Sustainability reporting should align with the reporting framework used, i.e. GHG Protocol, as well as any exclusions in ourfinancial reporting. Because Venezuela is excluded from our financial report and its emissions represent 0.1% of our global Scope 1 and Scope 2 inventory, it is consideredde minimis and we can meet the required alignment with both the Protocol and the financial reporting boundaries.
C6.5
(C6.5) Account for your organization’s gross global Scope 3 emissions, disclosing and explaining any exclusions.
Purchased goods and services
Evaluation statusRelevant, calculated
Metric tonnes CO2e33599797
Emissions calculation methodologyCalculated according to the GHG Protocol Scope 3 Standard using procurement data and material specific emission factors. Some procurement data is available only asspend where EPA’s Extended Economic Input Output (EEIO) methodology emission factors are used.
Percentage of emissions calculated using data obtained from suppliers or value chain partners50
Please explainEmissions from our agricultural sourcing, packaging materials sourcing, non-product related sourcing as well as our co-manufacturing service is included
CDP Page of 7526
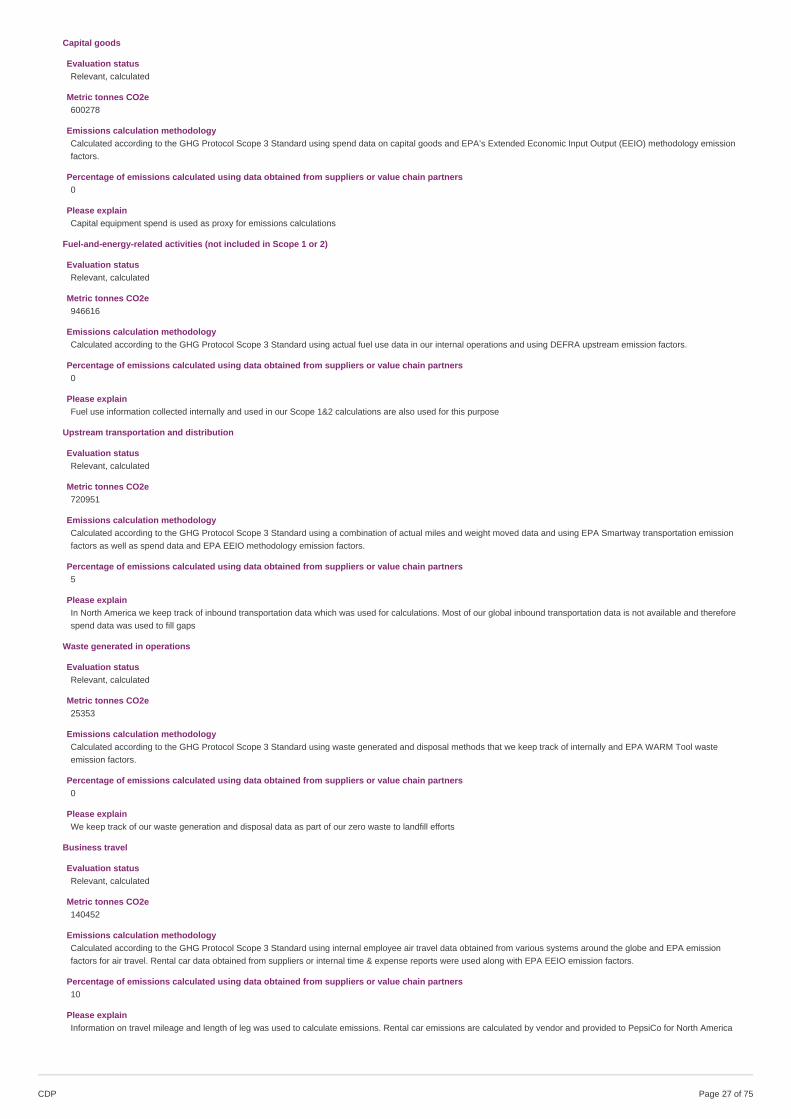
Capital goods
Evaluation statusRelevant, calculated
Metric tonnes CO2e600278
Emissions calculation methodologyCalculated according to the GHG Protocol Scope 3 Standard using spend data on capital goods and EPA’s Extended Economic Input Output (EEIO) methodology emissionfactors.
Percentage of emissions calculated using data obtained from suppliers or value chain partners0
Please explainCapital equipment spend is used as proxy for emissions calculations
Fuel-and-energy-related activities (not included in Scope 1 or 2)
Evaluation statusRelevant, calculated
Metric tonnes CO2e946616
Emissions calculation methodologyCalculated according to the GHG Protocol Scope 3 Standard using actual fuel use data in our internal operations and using DEFRA upstream emission factors.
Percentage of emissions calculated using data obtained from suppliers or value chain partners0
Please explainFuel use information collected internally and used in our Scope 1&2 calculations are also used for this purpose
Upstream transportation and distribution
Evaluation statusRelevant, calculated
Metric tonnes CO2e720951
Emissions calculation methodologyCalculated according to the GHG Protocol Scope 3 Standard using a combination of actual miles and weight moved data and using EPA Smartway transportation emissionfactors as well as spend data and EPA EEIO methodology emission factors.
Percentage of emissions calculated using data obtained from suppliers or value chain partners5
Please explainIn North America we keep track of inbound transportation data which was used for calculations. Most of our global inbound transportation data is not available and thereforespend data was used to fill gaps
Waste generated in operations
Evaluation statusRelevant, calculated
Metric tonnes CO2e25353
Emissions calculation methodologyCalculated according to the GHG Protocol Scope 3 Standard using waste generated and disposal methods that we keep track of internally and EPA WARM Tool wasteemission factors.
Percentage of emissions calculated using data obtained from suppliers or value chain partners0
Please explainWe keep track of our waste generation and disposal data as part of our zero waste to landfill efforts
Business travel
Evaluation statusRelevant, calculated
Metric tonnes CO2e140452
Emissions calculation methodologyCalculated according to the GHG Protocol Scope 3 Standard using internal employee air travel data obtained from various systems around the globe and EPA emissionfactors for air travel. Rental car data obtained from suppliers or internal time & expense reports were used along with EPA EEIO emission factors.
Percentage of emissions calculated using data obtained from suppliers or value chain partners10
Please explainInformation on travel mileage and length of leg was used to calculate emissions. Rental car emissions are calculated by vendor and provided to PepsiCo for North America
CDP Page of 7527
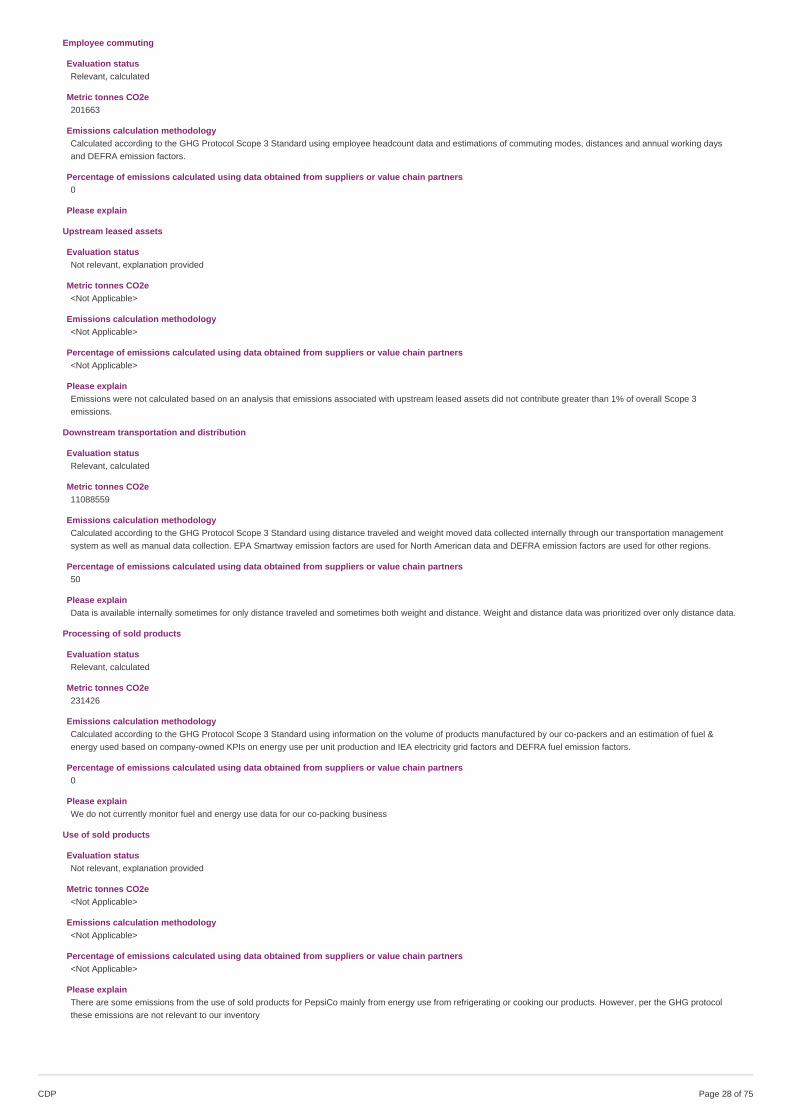
Employee commuting
Evaluation statusRelevant, calculated
Metric tonnes CO2e201663
Emissions calculation methodologyCalculated according to the GHG Protocol Scope 3 Standard using employee headcount data and estimations of commuting modes, distances and annual working daysand DEFRA emission factors.
Percentage of emissions calculated using data obtained from suppliers or value chain partners0
Please explain
Upstream leased assets
Evaluation statusNot relevant, explanation provided
Metric tonnes CO2e<Not Applicable>
Emissions calculation methodology<Not Applicable>
Percentage of emissions calculated using data obtained from suppliers or value chain partners<Not Applicable>
Please explainEmissions were not calculated based on an analysis that emissions associated with upstream leased assets did not contribute greater than 1% of overall Scope 3emissions.
Downstream transportation and distribution
Evaluation statusRelevant, calculated
Metric tonnes CO2e11088559
Emissions calculation methodologyCalculated according to the GHG Protocol Scope 3 Standard using distance traveled and weight moved data collected internally through our transportation managementsystem as well as manual data collection. EPA Smartway emission factors are used for North American data and DEFRA emission factors are used for other regions.
Percentage of emissions calculated using data obtained from suppliers or value chain partners50
Please explainData is available internally sometimes for only distance traveled and sometimes both weight and distance. Weight and distance data was prioritized over only distance data.
Processing of sold products
Evaluation statusRelevant, calculated
Metric tonnes CO2e231426
Emissions calculation methodologyCalculated according to the GHG Protocol Scope 3 Standard using information on the volume of products manufactured by our co-packers and an estimation of fuel &energy used based on company-owned KPIs on energy use per unit production and IEA electricity grid factors and DEFRA fuel emission factors.
Percentage of emissions calculated using data obtained from suppliers or value chain partners0
Please explainWe do not currently monitor fuel and energy use data for our co-packing business
Use of sold products
Evaluation statusNot relevant, explanation provided
Metric tonnes CO2e<Not Applicable>
Emissions calculation methodology<Not Applicable>
Percentage of emissions calculated using data obtained from suppliers or value chain partners<Not Applicable>
Please explainThere are some emissions from the use of sold products for PepsiCo mainly from energy use from refrigerating or cooking our products. However, per the GHG protocolthese emissions are not relevant to our inventory
CDP Page of 7528
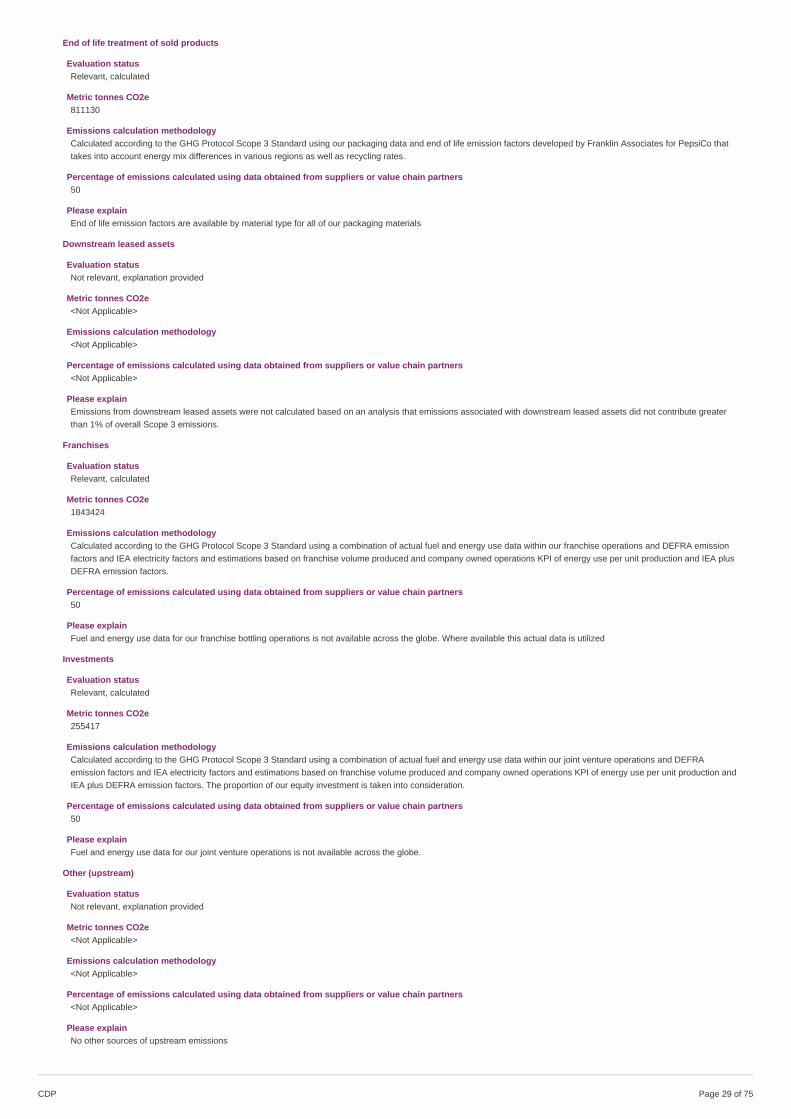
End of life treatment of sold products
Evaluation statusRelevant, calculated
Metric tonnes CO2e811130
Emissions calculation methodologyCalculated according to the GHG Protocol Scope 3 Standard using our packaging data and end of life emission factors developed by Franklin Associates for PepsiCo thattakes into account energy mix differences in various regions as well as recycling rates.
Percentage of emissions calculated using data obtained from suppliers or value chain partners50
Please explainEnd of life emission factors are available by material type for all of our packaging materials
Downstream leased assets
Evaluation statusNot relevant, explanation provided
Metric tonnes CO2e<Not Applicable>
Emissions calculation methodology<Not Applicable>
Percentage of emissions calculated using data obtained from suppliers or value chain partners<Not Applicable>
Please explainEmissions from downstream leased assets were not calculated based on an analysis that emissions associated with downstream leased assets did not contribute greaterthan 1% of overall Scope 3 emissions.
Franchises
Evaluation statusRelevant, calculated
Metric tonnes CO2e1843424
Emissions calculation methodologyCalculated according to the GHG Protocol Scope 3 Standard using a combination of actual fuel and energy use data within our franchise operations and DEFRA emissionfactors and IEA electricity factors and estimations based on franchise volume produced and company owned operations KPI of energy use per unit production and IEA plusDEFRA emission factors.
Percentage of emissions calculated using data obtained from suppliers or value chain partners50
Please explainFuel and energy use data for our franchise bottling operations is not available across the globe. Where available this actual data is utilized
Investments
Evaluation statusRelevant, calculated
Metric tonnes CO2e255417
Emissions calculation methodologyCalculated according to the GHG Protocol Scope 3 Standard using a combination of actual fuel and energy use data within our joint venture operations and DEFRAemission factors and IEA electricity factors and estimations based on franchise volume produced and company owned operations KPI of energy use per unit production andIEA plus DEFRA emission factors. The proportion of our equity investment is taken into consideration.
Percentage of emissions calculated using data obtained from suppliers or value chain partners50
Please explainFuel and energy use data for our joint venture operations is not available across the globe.
Other (upstream)
Evaluation statusNot relevant, explanation provided
Metric tonnes CO2e<Not Applicable>
Emissions calculation methodology<Not Applicable>
Percentage of emissions calculated using data obtained from suppliers or value chain partners<Not Applicable>
Please explainNo other sources of upstream emissions
CDP Page of 7529

Other (downstream)
Evaluation statusNot relevant, explanation provided
Metric tonnes CO2e<Not Applicable>
Emissions calculation methodology<Not Applicable>
Percentage of emissions calculated using data obtained from suppliers or value chain partners<Not Applicable>
Please explainNo other sources of downstream emissions
C-AC6.6/C-FB6.6/C-PF6.6
(C-AC6.6/C-FB6.6/C-PF6.6) Can you break down your Scope 3 emissions by relevant business activity area?Yes
C-AC6.6a/C-FB6.6a/C-PF6.6a
CDP Page of 7530

(C-AC6.6a/C-FB6.6a/C-PF6.6a) Disclose your Scope 3 emissions for each of your relevant business activity areas.
ActivityAgriculture/Forestry
Scope 3 categoryPurchased goods and services
Emissions (metric tons CO2e)18880614
Please explainEmissions from our purchased agricultural commodities are calculated using procurement data on volume purchased and commodity specific emission factors obtainedfrom several credible external sources like the World Food Lifecycle Database as well as supplier specific data for example potatoes in the UK.
ActivityProcessing/Manufacturing
Scope 3 categoryPurchased goods and services
Emissions (metric tons CO2e)1092653
Please explainEmissions from our co-manufacturing services are included in this category and are calculated using total spend data on these services and using the EPA’s EEIO emissionfactors.
ActivityProcessing/Manufacturing
Scope 3 categoryProcessing of sold products
Emissions (metric tons CO2e)231426
Please explainEmissions from our co-packing services are included in this category and are estimated using the total volume of products manufactured through our co-packers andapplying an energy use KPI based on company owned manufacturing processes.
ActivityDistribution
Scope 3 categoryUpstream transportation and distribution
Emissions (metric tons CO2e)720951
Please explainAll emissions from inbound transportation for our company owned operations as well as our franchise operations are included. In North America we track inboundtransportation mileage and weights moved from our carriers and this data is used for emissions calculations. Internationally, we use transportation spend data and EPAEEIO emission factors.
ActivityDistribution
Scope 3 categoryDownstream transportation and distribution
Emissions (metric tons CO2e)11088559
Please explainAll emissions from outbound transportation including distribution related to our vending and cooling equipment and for our franchise business are included. Outboundtransportation emissions are calculated using distance and weight moved data collected from across the globe. For our vending and cooling equipment data on annualequipment purchases, their energy consumption information and refrigerant leakage estimates are used for emissions calculations.
ActivityConsumption
Scope 3 categoryEnd of life treatment of sold products
Emissions (metric tons CO2e)811130
Please explainEmissions related to the end of life treatment of our packaging materials by region is included. Packaging data by material is collected annually by our operating regions andthis data is used along with packaging end of life estimates by region to calculate emissions.
C-AC6.8/C-FB6.8/C-PF6.8
CDP Page of 7531
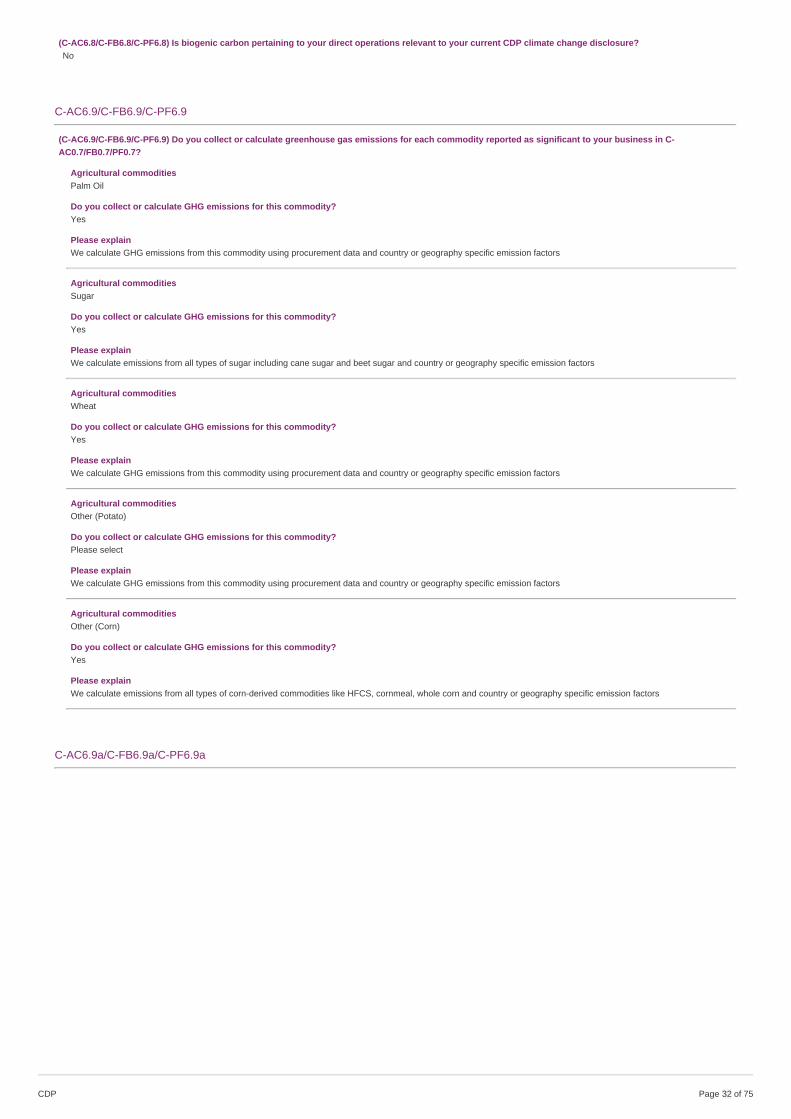
(C-AC6.8/C-FB6.8/C-PF6.8) Is biogenic carbon pertaining to your direct operations relevant to your current CDP climate change disclosure?No
C-AC6.9/C-FB6.9/C-PF6.9
(C-AC6.9/C-FB6.9/C-PF6.9) Do you collect or calculate greenhouse gas emissions for each commodity reported as significant to your business in C-AC0.7/FB0.7/PF0.7?
Agricultural commoditiesPalm Oil
Do you collect or calculate GHG emissions for this commodity?Yes
Please explainWe calculate GHG emissions from this commodity using procurement data and country or geography specific emission factors
Agricultural commoditiesSugar
Do you collect or calculate GHG emissions for this commodity?Yes
Please explainWe calculate emissions from all types of sugar including cane sugar and beet sugar and country or geography specific emission factors
Agricultural commoditiesWheat
Do you collect or calculate GHG emissions for this commodity?Yes
Please explainWe calculate GHG emissions from this commodity using procurement data and country or geography specific emission factors
Agricultural commoditiesOther (Potato)
Do you collect or calculate GHG emissions for this commodity?Please select
Please explainWe calculate GHG emissions from this commodity using procurement data and country or geography specific emission factors
Agricultural commoditiesOther (Corn)
Do you collect or calculate GHG emissions for this commodity?Yes
Please explainWe calculate emissions from all types of corn-derived commodities like HFCS, cornmeal, whole corn and country or geography specific emission factors
C-AC6.9a/C-FB6.9a/C-PF6.9a
CDP Page of 7532
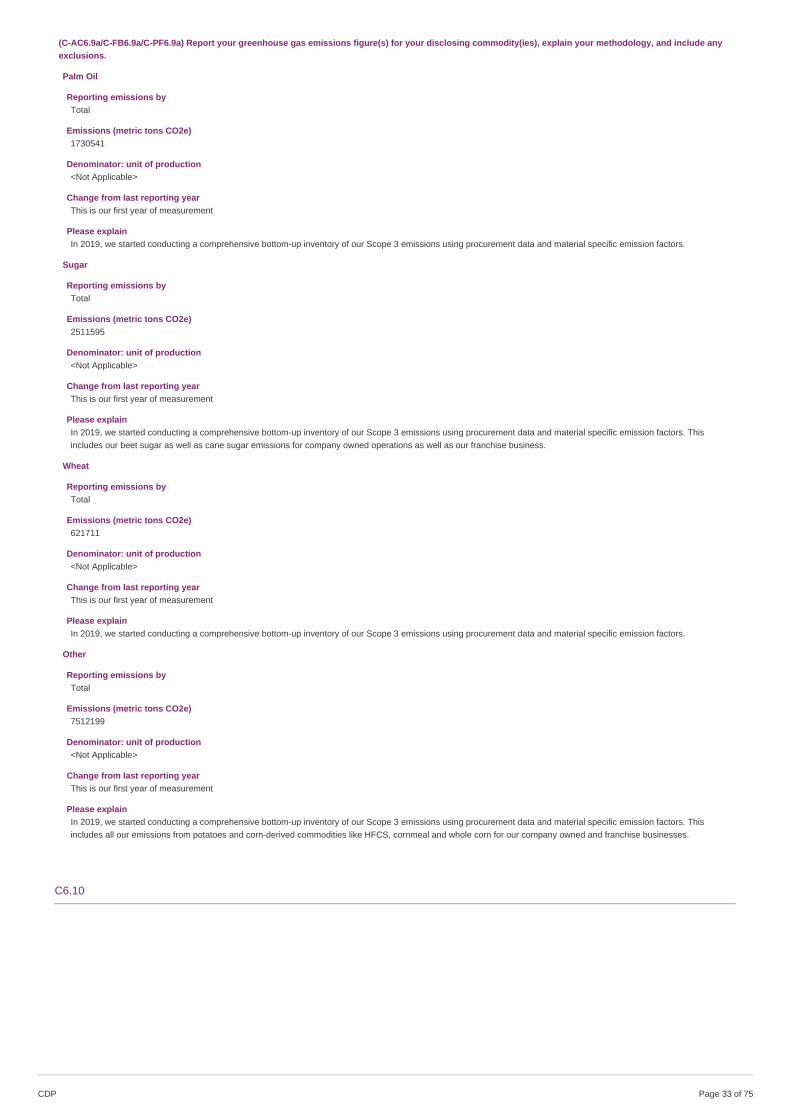
(C-AC6.9a/C-FB6.9a/C-PF6.9a) Report your greenhouse gas emissions figure(s) for your disclosing commodity(ies), explain your methodology, and include anyexclusions.
Palm Oil
Reporting emissions byTotal
Emissions (metric tons CO2e)1730541
Denominator: unit of production<Not Applicable>
Change from last reporting yearThis is our first year of measurement
Please explainIn 2019, we started conducting a comprehensive bottom-up inventory of our Scope 3 emissions using procurement data and material specific emission factors.
Sugar
Reporting emissions byTotal
Emissions (metric tons CO2e)2511595
Denominator: unit of production<Not Applicable>
Change from last reporting yearThis is our first year of measurement
Please explainIn 2019, we started conducting a comprehensive bottom-up inventory of our Scope 3 emissions using procurement data and material specific emission factors. Thisincludes our beet sugar as well as cane sugar emissions for company owned operations as well as our franchise business.
Wheat
Reporting emissions byTotal
Emissions (metric tons CO2e)621711
Denominator: unit of production<Not Applicable>
Change from last reporting yearThis is our first year of measurement
Please explainIn 2019, we started conducting a comprehensive bottom-up inventory of our Scope 3 emissions using procurement data and material specific emission factors.
Other
Reporting emissions byTotal
Emissions (metric tons CO2e)7512199
Denominator: unit of production<Not Applicable>
Change from last reporting yearThis is our first year of measurement
Please explainIn 2019, we started conducting a comprehensive bottom-up inventory of our Scope 3 emissions using procurement data and material specific emission factors. Thisincludes all our emissions from potatoes and corn-derived commodities like HFCS, cornmeal and whole corn for our company owned and franchise businesses.
C6.10
CDP Page of 7533
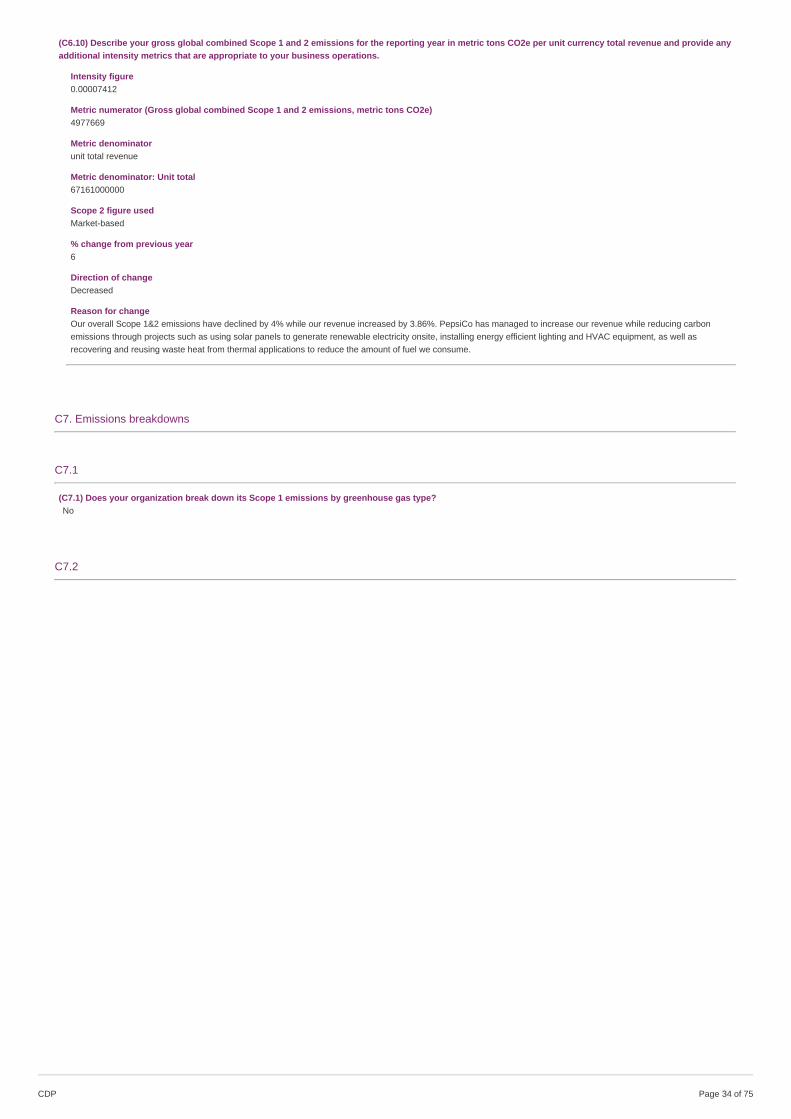
(C6.10) Describe your gross global combined Scope 1 and 2 emissions for the reporting year in metric tons CO2e per unit currency total revenue and provide anyadditional intensity metrics that are appropriate to your business operations.
Intensity figure0.00007412
Metric numerator (Gross global combined Scope 1 and 2 emissions, metric tons CO2e)4977669
Metric denominatorunit total revenue
Metric denominator: Unit total67161000000
Scope 2 figure usedMarket-based
% change from previous year6
Direction of changeDecreased
Reason for changeOur overall Scope 1&2 emissions have declined by 4% while our revenue increased by 3.86%. PepsiCo has managed to increase our revenue while reducing carbonemissions through projects such as using solar panels to generate renewable electricity onsite, installing energy efficient lighting and HVAC equipment, as well asrecovering and reusing waste heat from thermal applications to reduce the amount of fuel we consume.
C7. Emissions breakdowns
C7.1
(C7.1) Does your organization break down its Scope 1 emissions by greenhouse gas type?No
C7.2
CDP Page of 7534

(C7.2) Break down your total gross global Scope 1 emissions by country/region.
Country/Region Scope 1 emissions (metric tons CO2e)
Argentina 12939
Australia 24913
Belgium 32021
Bosnia & Herzegovina 2326
Brazil 102464
Canada 205559
Chile 13710
China 41673
Colombia 28292
Costa Rica 288
Cyprus 1765
Dominican Republic 8454
Ecuador 3904
Egypt 135010
El Salvador 1603
Estonia 103
France 257
Georgia 2618
Germany 3181
Greece 7449
Guatemala 17749
Honduras 3197
India 15885
Ireland 2624
Italy 955
Kyrgyzstan 175
Mexico 372907
Netherlands 17649
New Zealand 6295
Pakistan 27340
Panama 428
Peru 7715
Poland 46081
Portugal 12092
Romania 13349
Russian Federation 257087
Saudi Arabia 33655
Serbia 6904
Singapore 437
South Africa 37997
Spain 35462
Taiwan, Greater China 4954
Thailand 17048
Turkey 38775
Ukraine 20298
United Kingdom of Great Britain and Northern Ireland 69287
United States of America 1852069
Uruguay 1269
Viet Nam 4194
Israel 8
Paraguay 2
C7.3
(C7.3) Indicate which gross global Scope 1 emissions breakdowns you are able to provide.By business division
C7.3a
CDP Page of 7535
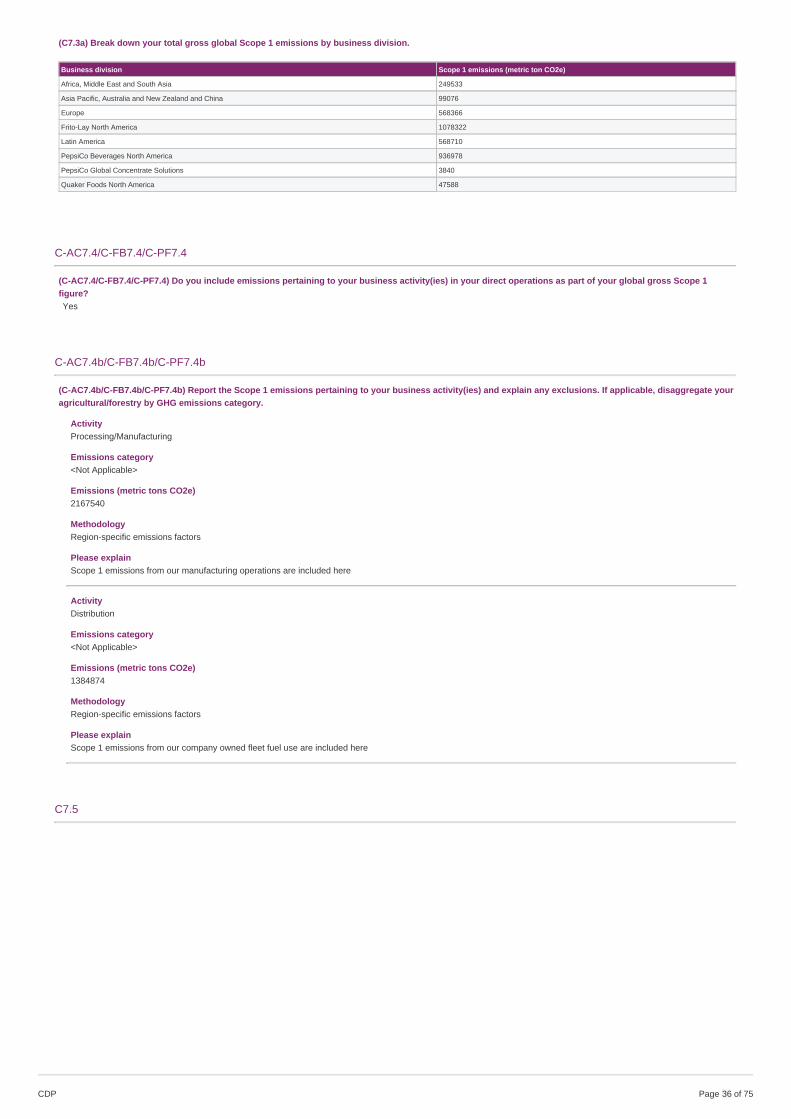
(C7.3a) Break down your total gross global Scope 1 emissions by business division.
Business division Scope 1 emissions (metric ton CO2e)
Africa, Middle East and South Asia 249533
Asia Pacific, Australia and New Zealand and China 99076
Europe 568366
Frito-Lay North America 1078322
Latin America 568710
PepsiCo Beverages North America 936978
PepsiCo Global Concentrate Solutions 3840
Quaker Foods North America 47588
C-AC7.4/C-FB7.4/C-PF7.4
(C-AC7.4/C-FB7.4/C-PF7.4) Do you include emissions pertaining to your business activity(ies) in your direct operations as part of your global gross Scope 1figure?Yes
C-AC7.4b/C-FB7.4b/C-PF7.4b
(C-AC7.4b/C-FB7.4b/C-PF7.4b) Report the Scope 1 emissions pertaining to your business activity(ies) and explain any exclusions. If applicable, disaggregate youragricultural/forestry by GHG emissions category.
ActivityProcessing/Manufacturing
Emissions category<Not Applicable>
Emissions (metric tons CO2e)2167540
MethodologyRegion-specific emissions factors
Please explainScope 1 emissions from our manufacturing operations are included here
ActivityDistribution
Emissions category<Not Applicable>
Emissions (metric tons CO2e)1384874
MethodologyRegion-specific emissions factors
Please explainScope 1 emissions from our company owned fleet fuel use are included here
C7.5
CDP Page of 7536

(C7.5) Break down your total gross global Scope 2 emissions by country/region.
Country/Region Scope 2, location-based(metric tons CO2e)
Scope 2, market-based(metric tons CO2e)
Purchased and consumed electricity,heat, steam or cooling (MWh)
Purchased and consumed low-carbon electricity, heat, steam or coolingaccounted for in Scope 2 market-based approach (MWh)
Argentina 7024 6700 19957 0
Australia 27618 26959 37021 883
Belgium 6750 98 39781 39235
Bosnia & Herzegovina 1509 1509 1851 0
Brazil 12558 12553 106397 0
Canada 22453 22453 147489 0
Chile 8468 8010 19189 1038
China 39575 39575 66860 0
Colombia 3999 3999 29697 0
Costa Rica 1 1 460 0
Cyprus 564 564 877 0
Dominican Republic 5647 5647 10804 0
Ecuador 714 714 3981 0
Egypt 49450 49450 111755 0
El Salvador 132 132 783 0
Georgia 290 290 3078 0
Germany 3614 0 9203 9203
Greece 3025 31 5688 4250
Guatemala 4468 4468 14152 0
Honduras 837 837 2632 0
Hungary 0 0 0 0
India 54072 52627 74718 2000
Ireland 4413 7367 11617 0
Italy 186 65 609 395
Kyrgyzstan 3227 3227 4668 0
Mexico 152667 97586 319445 103043
Netherlands 7715 1341 19843 17314
New Zealand 822 822 7120 0
Pakistan 10981 10981 26243 0
Panama 563 563 3001 0
Peru 2346 2346 10547 0
Poland 31696 3182 52693 48801
Portugal 3354 17 9591 8446
Romania 10937 13510 33674 0
Russian Federation 132741 132741 412318 0
Saudi Arabia 28687 28687 40384 0
Serbia 6716 6716 13312 0
Singapore 2303 2303 5808 0
South Africa 22661 22661 25074 0
Spain 12520 2309 31748 26599
Taiwan, Greater China 4246 4241 7196 0
Thailand 11894 11894 24929 0
Turkey 33336 33336 71818 0
Ukraine 14688 14688 454112 0
United Kingdom of GreatBritain and Northern Ireland
21112 4235 84502 72986
United States of America 781132 781009 1702043 0
Uruguay 150 150 8202 0
Viet Nam 2605 2605 7205 0
Israel 54 54 96 0
C7.6
(C7.6) Indicate which gross global Scope 2 emissions breakdowns you are able to provide.By business division
C7.6a
CDP Page of 7537
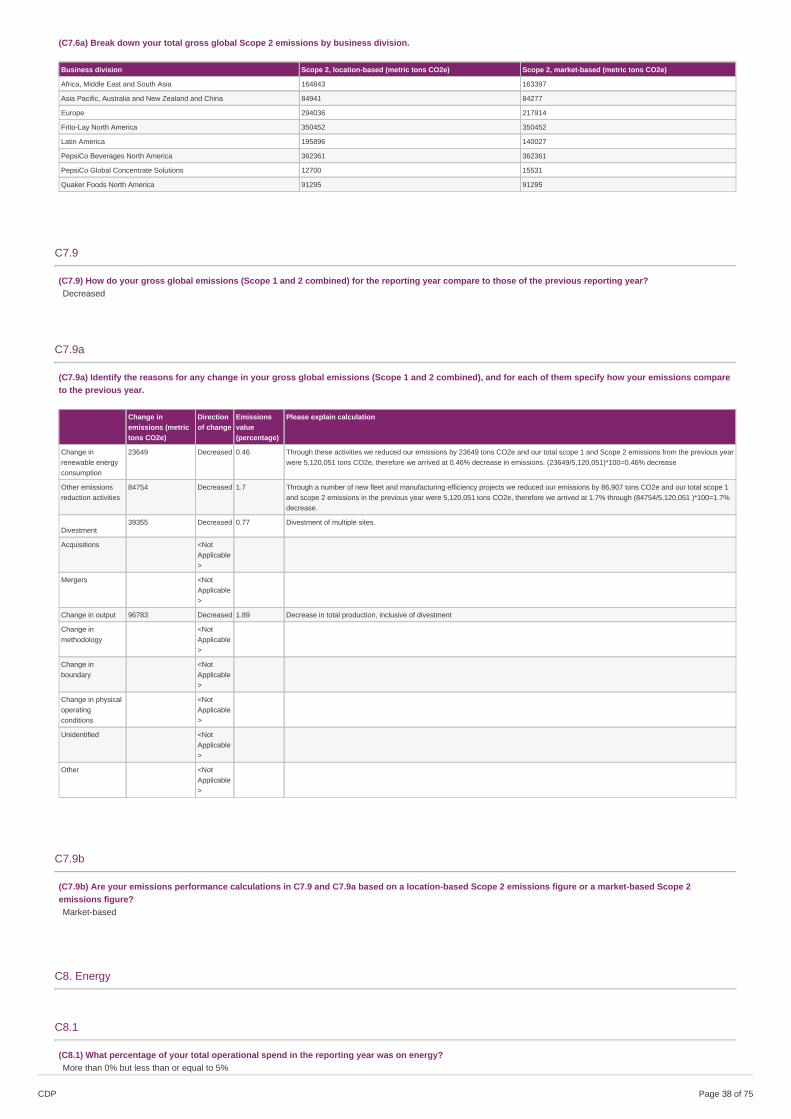
(C7.6a) Break down your total gross global Scope 2 emissions by business division.
Business division Scope 2, location-based (metric tons CO2e) Scope 2, market-based (metric tons CO2e)
Africa, Middle East and South Asia 164843 163397
Asia Pacific, Australia and New Zealand and China 84941 84277
Europe 294036 217914
Frito-Lay North America 350452 350452
Latin America 195896 140027
PepsiCo Beverages North America 362361 362361
PepsiCo Global Concentrate Solutions 12700 15531
Quaker Foods North America 91295 91295
C7.9
(C7.9) How do your gross global emissions (Scope 1 and 2 combined) for the reporting year compare to those of the previous reporting year?Decreased
C7.9a
(C7.9a) Identify the reasons for any change in your gross global emissions (Scope 1 and 2 combined), and for each of them specify how your emissions compareto the previous year.
Change inemissions (metrictons CO2e)
Directionof change
Emissionsvalue(percentage)
Please explain calculation
Change inrenewable energyconsumption
23649 Decreased 0.46 Through these activities we reduced our emissions by 23649 tons CO2e and our total scope 1 and Scope 2 emissions from the previous yearwere 5,120,051 tons CO2e, therefore we arrived at 0.46% decrease in emissions. (23649/5,120,051)*100=0.46% decrease
Other emissionsreduction activities
84754 Decreased 1.7 Through a number of new fleet and manufacturing efficiency projects we reduced our emissions by 86,907 tons CO2e and our total scope 1and scope 2 emissions in the previous year were 5,120,051 tons CO2e, therefore we arrived at 1.7% through (84754/5,120,051 )*100=1.7%decrease.
Divestment39355 Decreased 0.77 Divestment of multiple sites.
Acquisitions <NotApplicable>
Mergers <NotApplicable>
Change in output 96783 Decreased 1.89 Decrease in total production, inclusive of divestment
Change inmethodology
<NotApplicable>
Change inboundary
<NotApplicable>
Change in physicaloperatingconditions
<NotApplicable>
Unidentified <NotApplicable>
Other <NotApplicable>
C7.9b
(C7.9b) Are your emissions performance calculations in C7.9 and C7.9a based on a location-based Scope 2 emissions figure or a market-based Scope 2emissions figure?Market-based
C8. Energy
C8.1
(C8.1) What percentage of your total operational spend in the reporting year was on energy?More than 0% but less than or equal to 5%
CDP Page of 7538
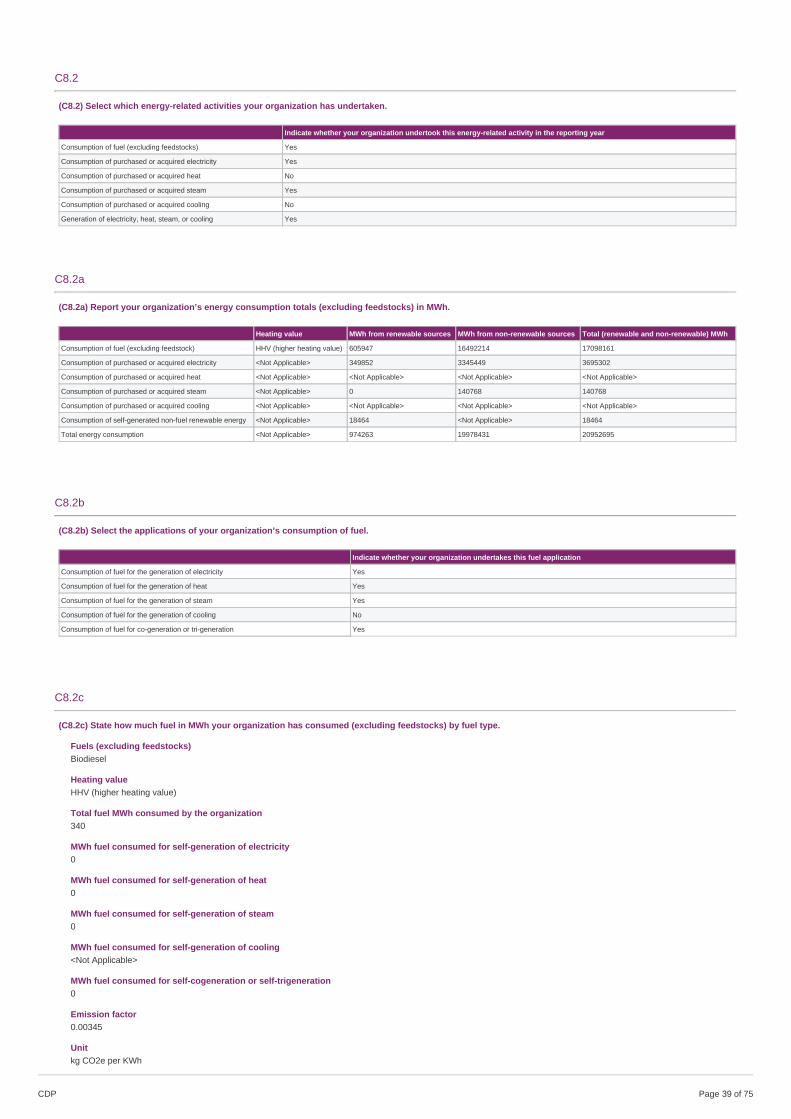
C8.2
(C8.2) Select which energy-related activities your organization has undertaken.
Indicate whether your organization undertook this energy-related activity in the reporting year
Consumption of fuel (excluding feedstocks) Yes
Consumption of purchased or acquired electricity Yes
Consumption of purchased or acquired heat No
Consumption of purchased or acquired steam Yes
Consumption of purchased or acquired cooling No
Generation of electricity, heat, steam, or cooling Yes
C8.2a
(C8.2a) Report your organization’s energy consumption totals (excluding feedstocks) in MWh.
Heating value MWh from renewable sources MWh from non-renewable sources Total (renewable and non-renewable) MWh
Consumption of fuel (excluding feedstock) HHV (higher heating value) 605947 16492214 17098161
Consumption of purchased or acquired electricity <Not Applicable> 349852 3345449 3695302
Consumption of purchased or acquired heat <Not Applicable> <Not Applicable> <Not Applicable> <Not Applicable>
Consumption of purchased or acquired steam <Not Applicable> 0 140768 140768
Consumption of purchased or acquired cooling <Not Applicable> <Not Applicable> <Not Applicable> <Not Applicable>
Consumption of self-generated non-fuel renewable energy <Not Applicable> 18464 <Not Applicable> 18464
Total energy consumption <Not Applicable> 974263 19978431 20952695
C8.2b
(C8.2b) Select the applications of your organization’s consumption of fuel.
Indicate whether your organization undertakes this fuel application
Consumption of fuel for the generation of electricity Yes
Consumption of fuel for the generation of heat Yes
Consumption of fuel for the generation of steam Yes
Consumption of fuel for the generation of cooling No
Consumption of fuel for co-generation or tri-generation Yes
C8.2c
(C8.2c) State how much fuel in MWh your organization has consumed (excluding feedstocks) by fuel type.
Fuels (excluding feedstocks)Biodiesel
Heating valueHHV (higher heating value)
Total fuel MWh consumed by the organization340
MWh fuel consumed for self-generation of electricity0
MWh fuel consumed for self-generation of heat0
MWh fuel consumed for self-generation of steam0
MWh fuel consumed for self-generation of cooling<Not Applicable>
MWh fuel consumed for self-cogeneration or self-trigeneration0
Emission factor0.00345
Unitkg CO2e per KWh
CDP Page of 7539
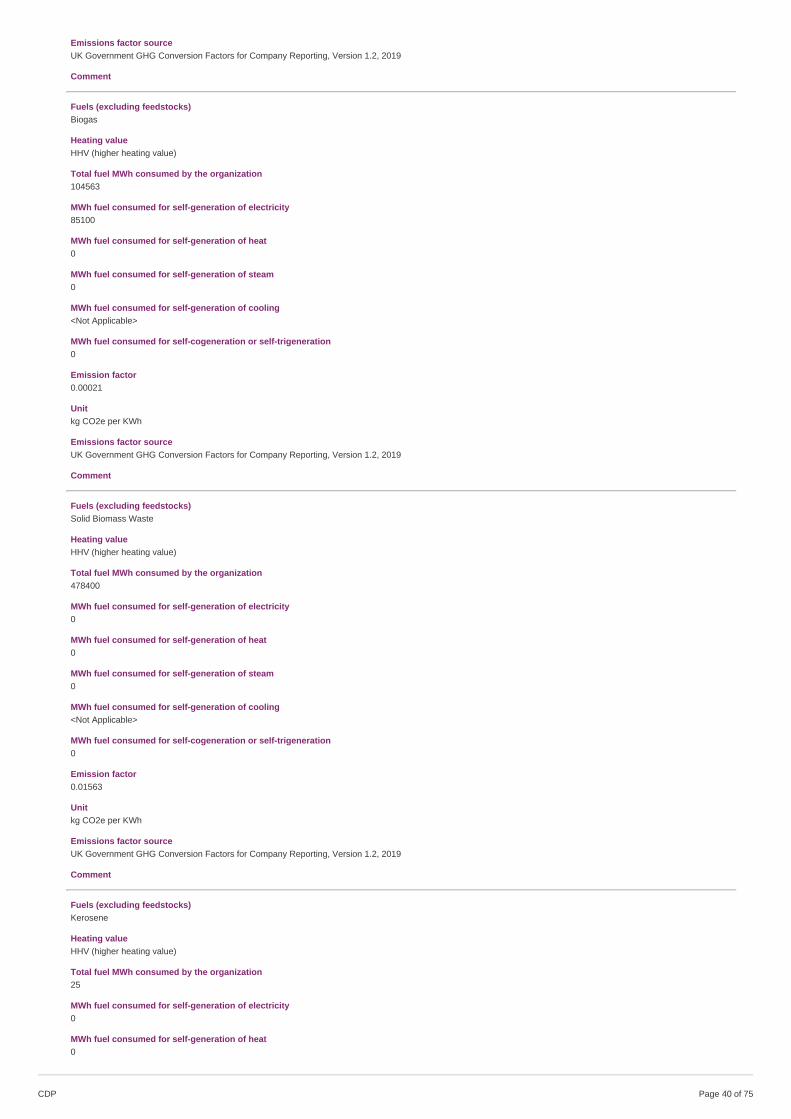
Emissions factor sourceUK Government GHG Conversion Factors for Company Reporting, Version 1.2, 2019
Comment
Fuels (excluding feedstocks)Biogas
Heating valueHHV (higher heating value)
Total fuel MWh consumed by the organization104563
MWh fuel consumed for self-generation of electricity85100
MWh fuel consumed for self-generation of heat0
MWh fuel consumed for self-generation of steam0
MWh fuel consumed for self-generation of cooling<Not Applicable>
MWh fuel consumed for self-cogeneration or self-trigeneration0
Emission factor0.00021
Unitkg CO2e per KWh
Emissions factor sourceUK Government GHG Conversion Factors for Company Reporting, Version 1.2, 2019
Comment
Fuels (excluding feedstocks)Solid Biomass Waste
Heating valueHHV (higher heating value)
Total fuel MWh consumed by the organization478400
MWh fuel consumed for self-generation of electricity0
MWh fuel consumed for self-generation of heat0
MWh fuel consumed for self-generation of steam0
MWh fuel consumed for self-generation of cooling<Not Applicable>
MWh fuel consumed for self-cogeneration or self-trigeneration0
Emission factor0.01563
Unitkg CO2e per KWh
Emissions factor sourceUK Government GHG Conversion Factors for Company Reporting, Version 1.2, 2019
Comment
Fuels (excluding feedstocks)Kerosene
Heating valueHHV (higher heating value)
Total fuel MWh consumed by the organization25
MWh fuel consumed for self-generation of electricity0
MWh fuel consumed for self-generation of heat0
CDP Page of 7540
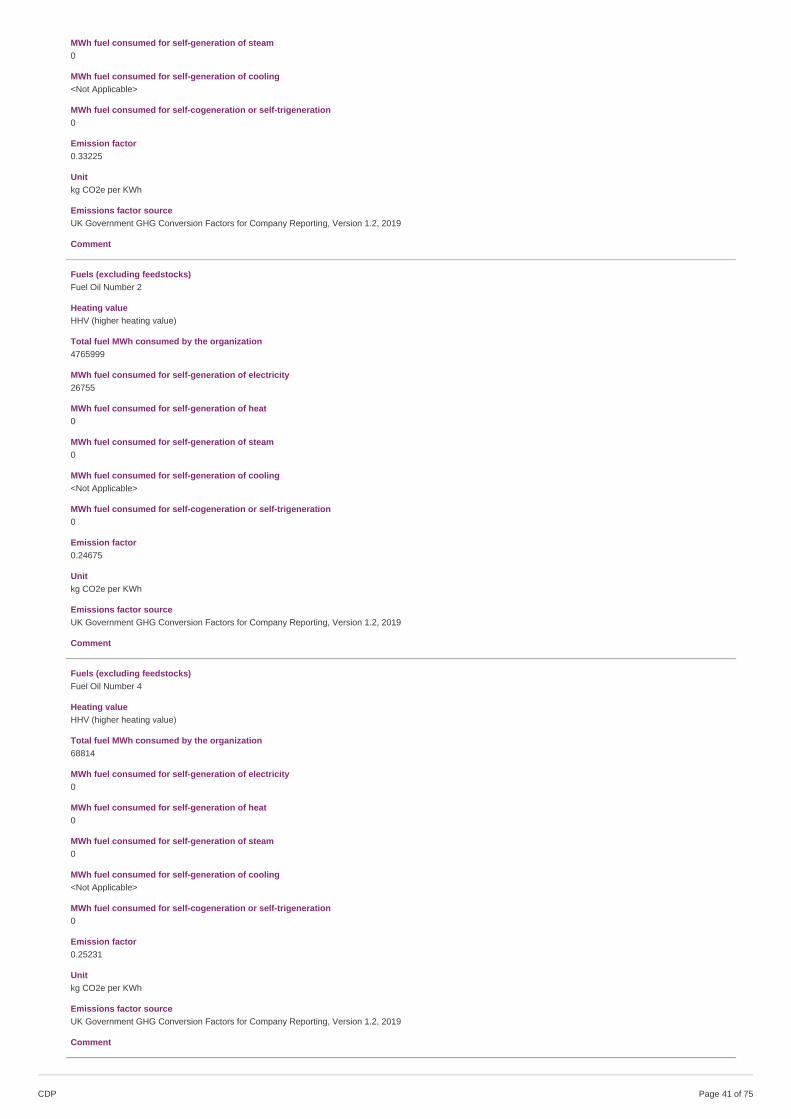
MWh fuel consumed for self-generation of steam0
MWh fuel consumed for self-generation of cooling<Not Applicable>
MWh fuel consumed for self-cogeneration or self-trigeneration0
Emission factor0.33225
Unitkg CO2e per KWh
Emissions factor sourceUK Government GHG Conversion Factors for Company Reporting, Version 1.2, 2019
Comment
Fuels (excluding feedstocks)Fuel Oil Number 2
Heating valueHHV (higher heating value)
Total fuel MWh consumed by the organization4765999
MWh fuel consumed for self-generation of electricity26755
MWh fuel consumed for self-generation of heat0
MWh fuel consumed for self-generation of steam0
MWh fuel consumed for self-generation of cooling<Not Applicable>
MWh fuel consumed for self-cogeneration or self-trigeneration0
Emission factor0.24675
Unitkg CO2e per KWh
Emissions factor sourceUK Government GHG Conversion Factors for Company Reporting, Version 1.2, 2019
Comment
Fuels (excluding feedstocks)Fuel Oil Number 4
Heating valueHHV (higher heating value)
Total fuel MWh consumed by the organization68814
MWh fuel consumed for self-generation of electricity0
MWh fuel consumed for self-generation of heat0
MWh fuel consumed for self-generation of steam0
MWh fuel consumed for self-generation of cooling<Not Applicable>
MWh fuel consumed for self-cogeneration or self-trigeneration0
Emission factor0.25231
Unitkg CO2e per KWh
Emissions factor sourceUK Government GHG Conversion Factors for Company Reporting, Version 1.2, 2019
Comment
CDP Page of 7541
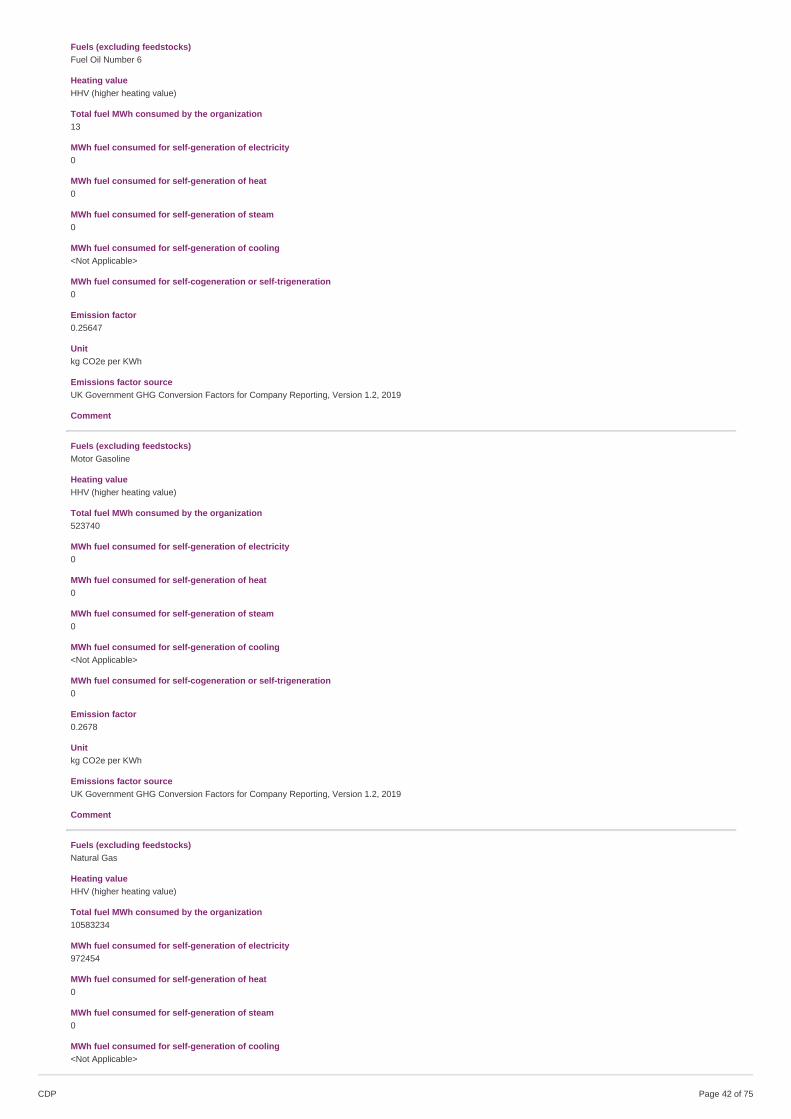
Fuels (excluding feedstocks)Fuel Oil Number 6
Heating valueHHV (higher heating value)
Total fuel MWh consumed by the organization13
MWh fuel consumed for self-generation of electricity0
MWh fuel consumed for self-generation of heat0
MWh fuel consumed for self-generation of steam0
MWh fuel consumed for self-generation of cooling<Not Applicable>
MWh fuel consumed for self-cogeneration or self-trigeneration0
Emission factor0.25647
Unitkg CO2e per KWh
Emissions factor sourceUK Government GHG Conversion Factors for Company Reporting, Version 1.2, 2019
Comment
Fuels (excluding feedstocks)Motor Gasoline
Heating valueHHV (higher heating value)
Total fuel MWh consumed by the organization523740
MWh fuel consumed for self-generation of electricity0
MWh fuel consumed for self-generation of heat0
MWh fuel consumed for self-generation of steam0
MWh fuel consumed for self-generation of cooling<Not Applicable>
MWh fuel consumed for self-cogeneration or self-trigeneration0
Emission factor0.2678
Unitkg CO2e per KWh
Emissions factor sourceUK Government GHG Conversion Factors for Company Reporting, Version 1.2, 2019
Comment
Fuels (excluding feedstocks)Natural Gas
Heating valueHHV (higher heating value)
Total fuel MWh consumed by the organization10583234
MWh fuel consumed for self-generation of electricity972454
MWh fuel consumed for self-generation of heat0
MWh fuel consumed for self-generation of steam0
MWh fuel consumed for self-generation of cooling<Not Applicable>
CDP Page of 7542
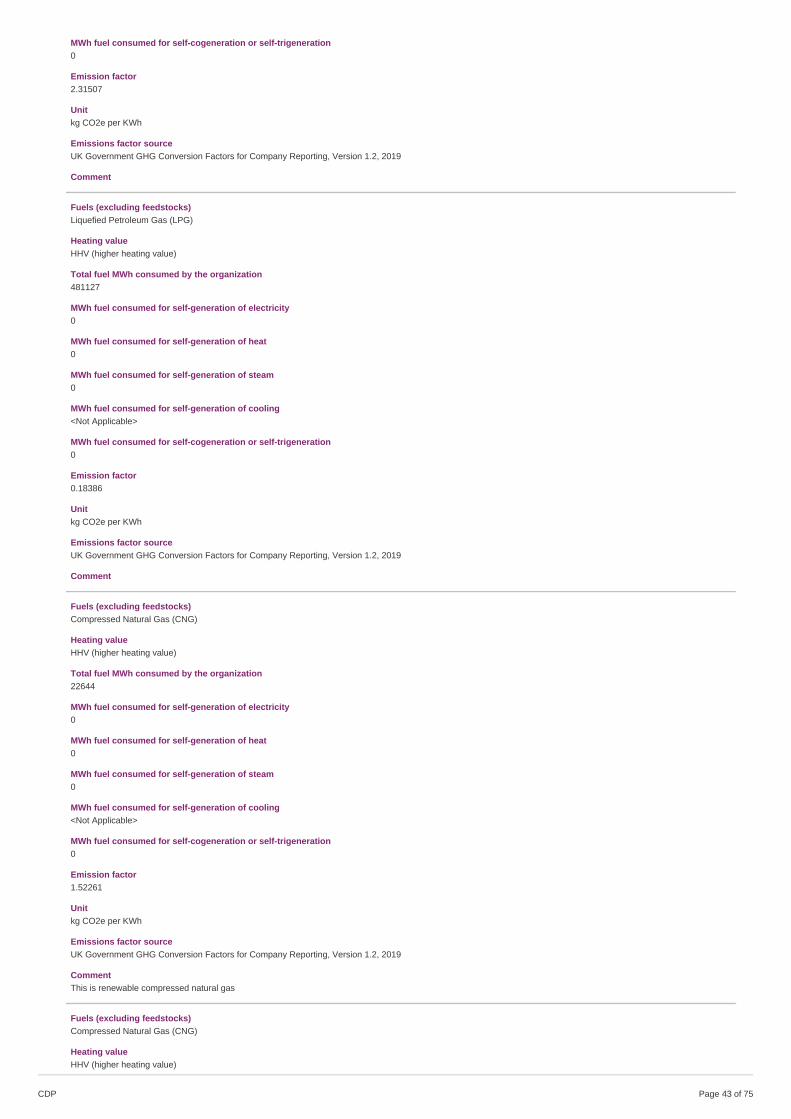
MWh fuel consumed for self-cogeneration or self-trigeneration0
Emission factor2.31507
Unitkg CO2e per KWh
Emissions factor sourceUK Government GHG Conversion Factors for Company Reporting, Version 1.2, 2019
Comment
Fuels (excluding feedstocks)Liquefied Petroleum Gas (LPG)
Heating valueHHV (higher heating value)
Total fuel MWh consumed by the organization481127
MWh fuel consumed for self-generation of electricity0
MWh fuel consumed for self-generation of heat0
MWh fuel consumed for self-generation of steam0
MWh fuel consumed for self-generation of cooling<Not Applicable>
MWh fuel consumed for self-cogeneration or self-trigeneration0
Emission factor0.18386
Unitkg CO2e per KWh
Emissions factor sourceUK Government GHG Conversion Factors for Company Reporting, Version 1.2, 2019
Comment
Fuels (excluding feedstocks)Compressed Natural Gas (CNG)
Heating valueHHV (higher heating value)
Total fuel MWh consumed by the organization22644
MWh fuel consumed for self-generation of electricity0
MWh fuel consumed for self-generation of heat0
MWh fuel consumed for self-generation of steam0
MWh fuel consumed for self-generation of cooling<Not Applicable>
MWh fuel consumed for self-cogeneration or self-trigeneration0
Emission factor1.52261
Unitkg CO2e per KWh
Emissions factor sourceUK Government GHG Conversion Factors for Company Reporting, Version 1.2, 2019
CommentThis is renewable compressed natural gas
Fuels (excluding feedstocks)Compressed Natural Gas (CNG)
Heating valueHHV (higher heating value)
CDP Page of 7543
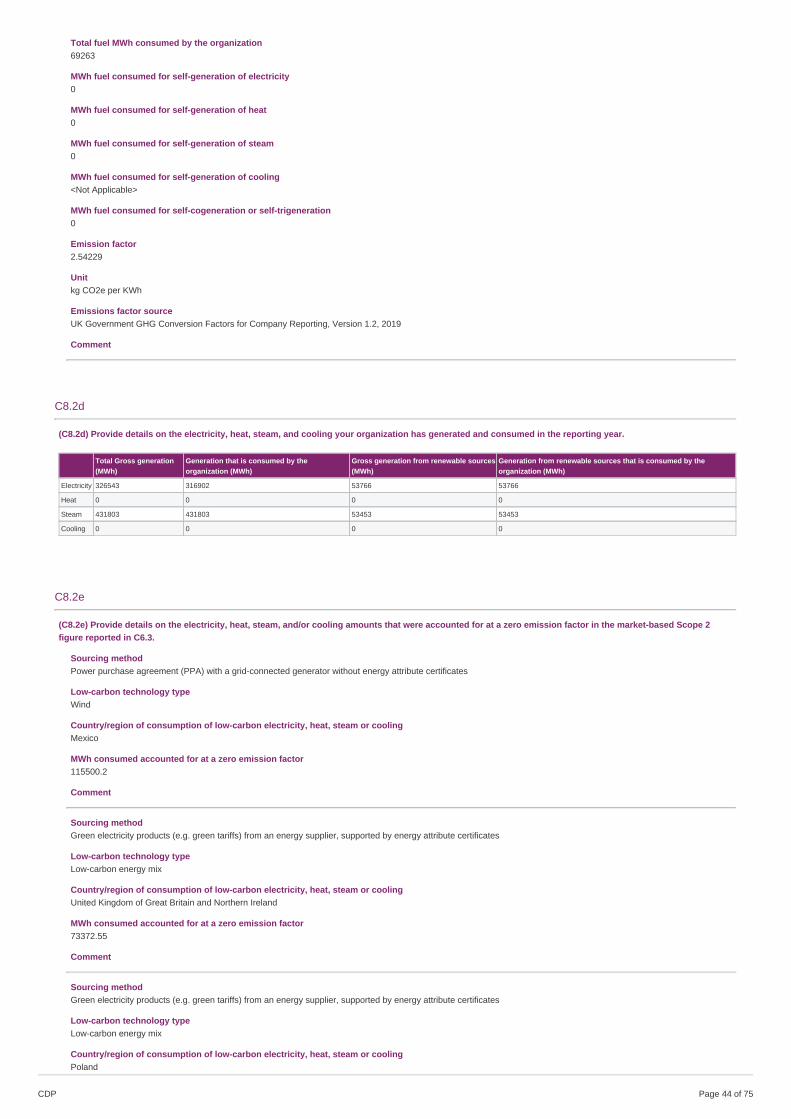
Total fuel MWh consumed by the organization69263
MWh fuel consumed for self-generation of electricity0
MWh fuel consumed for self-generation of heat0
MWh fuel consumed for self-generation of steam0
MWh fuel consumed for self-generation of cooling<Not Applicable>
MWh fuel consumed for self-cogeneration or self-trigeneration0
Emission factor2.54229
Unitkg CO2e per KWh
Emissions factor sourceUK Government GHG Conversion Factors for Company Reporting, Version 1.2, 2019
Comment
C8.2d
(C8.2d) Provide details on the electricity, heat, steam, and cooling your organization has generated and consumed in the reporting year.
Total Gross generation(MWh)
Generation that is consumed by theorganization (MWh)
Gross generation from renewable sources(MWh)
Generation from renewable sources that is consumed by theorganization (MWh)
Electricity 326543 316902 53766 53766
Heat 0 0 0 0
Steam 431803 431803 53453 53453
Cooling 0 0 0 0
C8.2e
(C8.2e) Provide details on the electricity, heat, steam, and/or cooling amounts that were accounted for at a zero emission factor in the market-based Scope 2figure reported in C6.3.
Sourcing methodPower purchase agreement (PPA) with a grid-connected generator without energy attribute certificates
Low-carbon technology typeWind
Country/region of consumption of low-carbon electricity, heat, steam or coolingMexico
MWh consumed accounted for at a zero emission factor115500.2
Comment
Sourcing methodGreen electricity products (e.g. green tariffs) from an energy supplier, supported by energy attribute certificates
Low-carbon technology typeLow-carbon energy mix
Country/region of consumption of low-carbon electricity, heat, steam or coolingUnited Kingdom of Great Britain and Northern Ireland
MWh consumed accounted for at a zero emission factor73372.55
Comment
Sourcing methodGreen electricity products (e.g. green tariffs) from an energy supplier, supported by energy attribute certificates
Low-carbon technology typeLow-carbon energy mix
Country/region of consumption of low-carbon electricity, heat, steam or coolingPoland
CDP Page of 7544
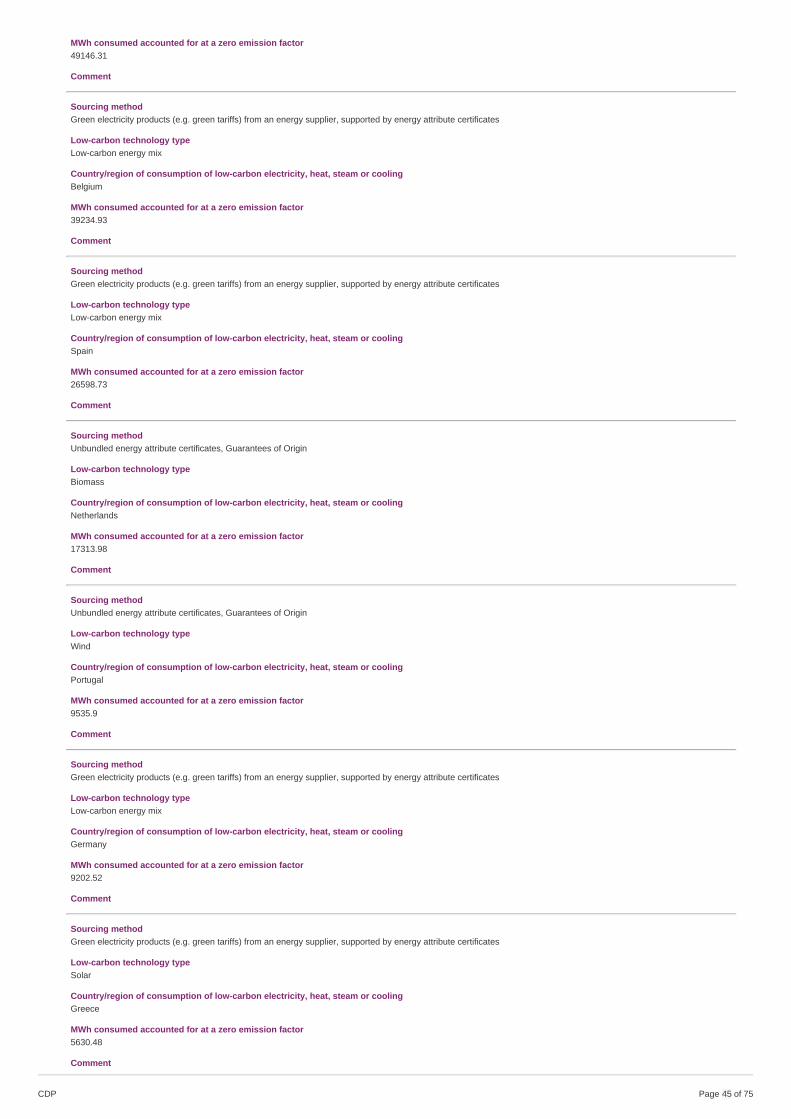
MWh consumed accounted for at a zero emission factor49146.31
Comment
Sourcing methodGreen electricity products (e.g. green tariffs) from an energy supplier, supported by energy attribute certificates
Low-carbon technology typeLow-carbon energy mix
Country/region of consumption of low-carbon electricity, heat, steam or coolingBelgium
MWh consumed accounted for at a zero emission factor39234.93
Comment
Sourcing methodGreen electricity products (e.g. green tariffs) from an energy supplier, supported by energy attribute certificates
Low-carbon technology typeLow-carbon energy mix
Country/region of consumption of low-carbon electricity, heat, steam or coolingSpain
MWh consumed accounted for at a zero emission factor26598.73
Comment
Sourcing methodUnbundled energy attribute certificates, Guarantees of Origin
Low-carbon technology typeBiomass
Country/region of consumption of low-carbon electricity, heat, steam or coolingNetherlands
MWh consumed accounted for at a zero emission factor17313.98
Comment
Sourcing methodUnbundled energy attribute certificates, Guarantees of Origin
Low-carbon technology typeWind
Country/region of consumption of low-carbon electricity, heat, steam or coolingPortugal
MWh consumed accounted for at a zero emission factor9535.9
Comment
Sourcing methodGreen electricity products (e.g. green tariffs) from an energy supplier, supported by energy attribute certificates
Low-carbon technology typeLow-carbon energy mix
Country/region of consumption of low-carbon electricity, heat, steam or coolingGermany
MWh consumed accounted for at a zero emission factor9202.52
Comment
Sourcing methodGreen electricity products (e.g. green tariffs) from an energy supplier, supported by energy attribute certificates
Low-carbon technology typeSolar
Country/region of consumption of low-carbon electricity, heat, steam or coolingGreece
MWh consumed accounted for at a zero emission factor5630.48
Comment
CDP Page of 7545
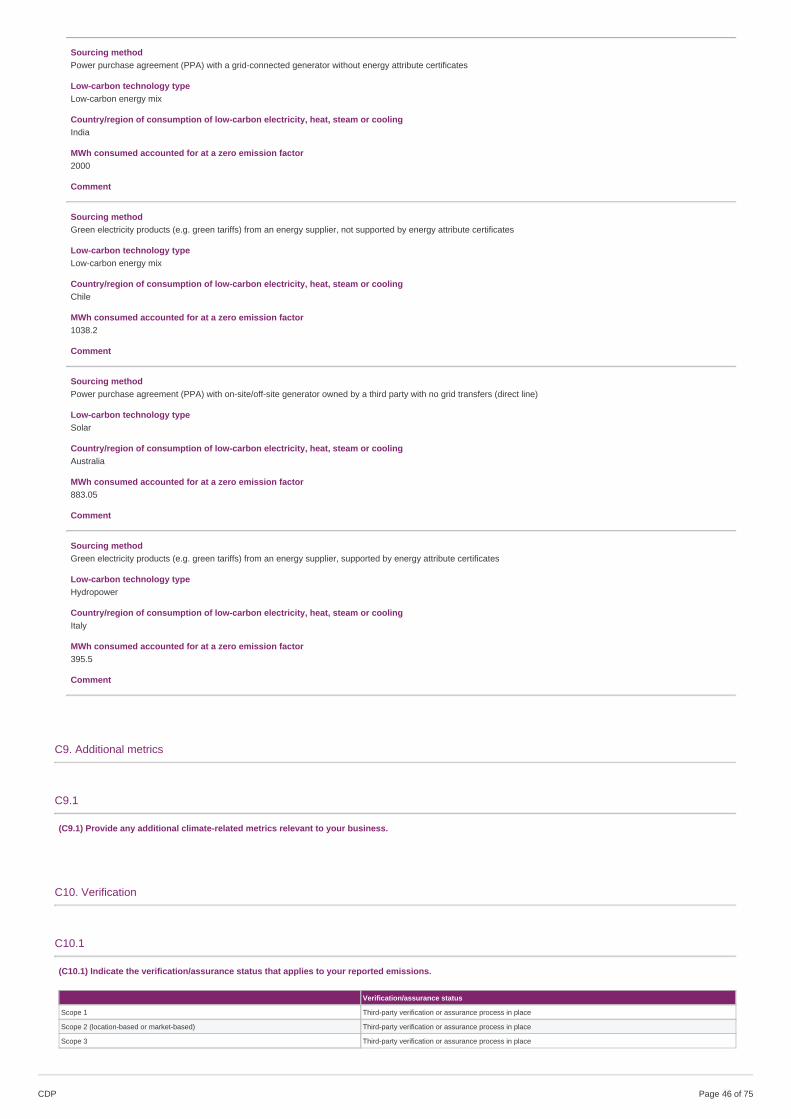
Sourcing methodPower purchase agreement (PPA) with a grid-connected generator without energy attribute certificates
Low-carbon technology typeLow-carbon energy mix
Country/region of consumption of low-carbon electricity, heat, steam or coolingIndia
MWh consumed accounted for at a zero emission factor2000
Comment
Sourcing methodGreen electricity products (e.g. green tariffs) from an energy supplier, not supported by energy attribute certificates
Low-carbon technology typeLow-carbon energy mix
Country/region of consumption of low-carbon electricity, heat, steam or coolingChile
MWh consumed accounted for at a zero emission factor1038.2
Comment
Sourcing methodPower purchase agreement (PPA) with on-site/off-site generator owned by a third party with no grid transfers (direct line)
Low-carbon technology typeSolar
Country/region of consumption of low-carbon electricity, heat, steam or coolingAustralia
MWh consumed accounted for at a zero emission factor883.05
Comment
Sourcing methodGreen electricity products (e.g. green tariffs) from an energy supplier, supported by energy attribute certificates
Low-carbon technology typeHydropower
Country/region of consumption of low-carbon electricity, heat, steam or coolingItaly
MWh consumed accounted for at a zero emission factor395.5
Comment
C9. Additional metrics
C9.1
(C9.1) Provide any additional climate-related metrics relevant to your business.
C10. Verification
C10.1
(C10.1) Indicate the verification/assurance status that applies to your reported emissions.
Verification/assurance status
Scope 1 Third-party verification or assurance process in place
Scope 2 (location-based or market-based) Third-party verification or assurance process in place
Scope 3 Third-party verification or assurance process in place
CDP Page of 7546
C10.1a
(C10.1a) Provide further details of the verification/assurance undertaken for your Scope 1 emissions, and attach the relevant statements.
Verification or assurance cycle in placeAnnual process
Status in the current reporting yearComplete
Type of verification or assuranceLimited assurance
Attach the statementPepsiCo RY2019_CDP Verification Statement Limited Final 06-15-2020.pdf
Page/ section referencePage 1
Relevant standardISO14064-3
Proportion of reported emissions verified (%)100
C10.1b
(C10.1b) Provide further details of the verification/assurance undertaken for your Scope 2 emissions and attach the relevant statements.
Scope 2 approachScope 2 location-based
Verification or assurance cycle in placeAnnual process
Status in the current reporting yearComplete
Type of verification or assuranceLimited assurance
Attach the statementPepsiCo RY2019_CDP Verification Statement Limited Final 06-15-2020.pdf
Page/ section referencePage 1
Relevant standardISO14064-3
Proportion of reported emissions verified (%)100
Scope 2 approachScope 2 market-based
Verification or assurance cycle in placeAnnual process
Status in the current reporting yearComplete
Type of verification or assuranceLimited assurance
Attach the statementPepsiCo RY2019_CDP Verification Statement Limited Final 06-15-2020.pdf
Page/ section referencePage 1
Relevant standardISO14064-3
Proportion of reported emissions verified (%)100
C10.1c
CDP Page of 7547

(C10.1c) Provide further details of the verification/assurance undertaken for your Scope 3 emissions and attach the relevant statements.
Scope 3 categoryScope 3: Downstream transportation and distribution
Verification or assurance cycle in placeAnnual process
Status in the current reporting yearComplete
Type of verification or assuranceLimited assurance
Attach the statementPepsiCo RY2019_CDP Verification Statement Limited Final 06-15-2020.pdf
Page/section referencePage 1
Relevant standardISO14064-3
Proportion of reported emissions verified (%)5
C10.2
(C10.2) Do you verify any climate-related information reported in your CDP disclosure other than the emissions figures reported in C6.1, C6.3, and C6.5?Yes
C10.2a
(C10.2a) Which data points within your CDP disclosure have been verified, and which verification standards were used?
Disclosure module verificationrelates to
Data verified Verificationstandard
Please explain
C8. Energy Other, please specify (Energyconsumption)
ISAE 3000 Energy consumption associated with manufacturing and warehouse operations, fleet operations, offices anddistribution centers.APEX - Assurance Statement ISAE 3000_LIMITED_v1.2_2.13_Final 06-15-2020.pdf
C11. Carbon pricing
C11.1
(C11.1) Are any of your operations or activities regulated by a carbon pricing system (i.e. ETS, Cap & Trade or Carbon Tax)?Yes
C11.1a
(C11.1a) Select the carbon pricing regulation(s) which impacts your operations.California CaT - ETSEU ETS
C11.1b
CDP Page of 7548

(C11.1b) Complete the following table for each of the emissions trading schemes you are regulated by.
California CaT
% of Scope 1 emissions covered by the ETS2.2
% of Scope 2 emissions covered by the ETS0
Period start dateJanuary 1 2019
Period end dateDecember 31 2019
Allowances allocated111304
Allowances purchased0
Verified Scope 1 emissions in metric tons CO2e76790
Verified Scope 2 emissions in metric tons CO2e0
Details of ownershipFacilities we own and operate
CommentZero allowances purchased due to a net excess of allowances allocated across applicable sites. True up of allowances to take place after CDP submission.
EU ETS
% of Scope 1 emissions covered by the ETS3.34
% of Scope 2 emissions covered by the ETS0
Period start dateJanuary 1 2019
Period end dateDecember 31 2019
Allowances allocated50776
Allowances purchased67969
Verified Scope 1 emissions in metric tons CO2e118473
Verified Scope 2 emissions in metric tons CO2e0
Details of ownershipFacilities we own and operate
CommentEurope Sites : Veurne, BOL, Grodzisk, Burgos, Bursom Road, Leycroft Road. At the time of this response, 31,421 allowances have been purchased, and 36,548 allowancesare to be purchased before year end.
C11.1d
(C11.1d) What is your strategy for complying with the systems you are regulated by or anticipate being regulated by?
Our first priority is to leverage our Resource Conservation (ReCon) Program to drive improvements in our energy efficiency to reduce emissions from facilities covered byEmission Trading Schemes (ETS). Examples of how we have applied this program as part of our compliance strategy include behavioral-based initiatives, as well as capitalinvestments to reduce fuel consumption and switching to renewable fuels, such as anaerobic digesters.
In addition to our own reduction efforts, each of our ETS sites also currently receives an allocation of free allowances towards their compliance. Beyond the free allowances,we purchase allowances to meet final verified emissions, as appropriate. We do not currently source project based carbon allowances for ETS compliance. Over the longerterm, we are continuing to investigate and plan to invest in further energy efficiency opportunities, as well as heat recovery and reuse and renewable fuels.For example, atour Grodzisk plant in Poland, we are replacing three heat exchangers with more efficient equipment, as well as centralizing our waste heat recovery capabilities in order toreduce fuel consumption across the facility.
C11.2
CDP Page of 7549
(C11.2) Has your organization originated or purchased any project-based carbon credits within the reporting period?No
C11.3
(C11.3) Does your organization use an internal price on carbon?No, but we anticipate doing so in the next two years
C12. Engagement
C12.1
(C12.1) Do you engage with your value chain on climate-related issues?Yes, our suppliersYes, our customersYes, other partners in the value chain
C12.1a
CDP Page of 7550

(C12.1a) Provide details of your climate-related supplier engagement strategy.
Type of engagementInformation collection (understanding supplier behavior)
Details of engagementCollect climate change and carbon information at least annually from suppliers
% of suppliers by number26
% total procurement spend (direct and indirect)80
% of supplier-related Scope 3 emissions as reported in C6.560
Rationale for the coverage of your engagementWe collect climate change and carbon information from our suppliers through the annual CDP Supply Chain process. Included in this process are suppliers in our keycategories like agriculture, packaging and third party logistics that represent the biggest drivers of our emissions. Our top suppliers by spend are selected in thesecategories and these top suppliers represent ~80% of procurement spend in the category.
Impact of engagement, including measures of successOur measures of success are our supplier participation rate and average supplier score. As an indicator of the impact of our engagement in 2019 our response rate was68%, this is up 10% from the prior year. 54% of our suppliers indicated having a target for emissions reduction. We will continue collecting climate information from oursuppliers through this process and use the results as a way of encouraging and incentivizing our suppliers to further act on managing and mitigating climate-related issues.
CommentThe percent of Scope 3 emissions is calculated based on the category of suppliers requested and the emissions associated with those categories against our total Scope 3emissions. The % of suppliers by number is based on 2017 data on total number of suppliers.
Type of engagementInformation collection (understanding supplier behavior)
Details of engagementCollect climate change and carbon information at least annually from suppliers
% of suppliers by number100
% total procurement spend (direct and indirect)100
% of supplier-related Scope 3 emissions as reported in C6.53
Rationale for the coverage of your engagementOur Sustainable Farming Program (SFP), is a program we use to engage with growers on farms of all sizes and types around the world in order to encourage continualimprovement in sustainable farming practices, expand respect for workers' human rights, enhance growers' capabilities, and address risks. We have initiated SFP withfarmers from which we source directly, given our existing relationships with those farmers and the importance of directly sourced agricultural raw materials to the continuityof our business. By 2025, our goal is to expand the SFP and other programs recognized by PepsiCo’s benchmarking protocol to our indirect crops as well. To date, we havefocused on engaging growers and bringing them into the SFP through Farm Management Groups (FMGs).
Impact of engagement, including measures of successTo date, we have focused on engaging growers and bringing them into the SFP through Farm Management Groups (FMGs)as a key measure of success. As an indicator ofthe impact of our engagement, as of year-end 2019, 100% of the volume of the agricultural raw materials that we directly source has been supplied by FMGs engaged inour SFP. The percentage of FMGs engaged is one metric by which we are measuring progress. The second metric – representing our ultimate objective – is the percentageof directly sourced agricultural raw materials that we have verified as sustainably sourced In 2019, this number was 80%.
CommentThe percent of Scope 3 emissions is calculated based on the total emissions of crops covered by SFP against total Scope 3 emissions. Our SFP program now engages allour direct supply chain, however with grower turnover & growth the % of suppliers by number may not always be 100%.
C12.1b
CDP Page of 7551
(C12.1b) Give details of your climate-related engagement strategy with your customers.
Type of engagementEducation/information sharing
Details of engagementRun an engagement campaign to educate customers about the climate change impacts of (using) your products, goods, and/or services
% of customers by number100
% of customer - related Scope 3 emissions as reported in C6.58
Portfolio coverage (total or outstanding)<Not Applicable>
Please explain the rationale for selecting this group of customers and scope of engagementWe introduced the PepsiCo Recycling initiative in 2010 and have continued to scale it up ever since. PepsiCo Recycling programs bring recycling solutions to colleges anduniversities, K-12 schools, high-traffic retail locations, professional sports facilities, events, and other organizations across the U.S. with the goal of increasing beveragecontainer recycling rates. These customers and venues are chosen as they represent areas where high volumes of our products are consumed. We educate and inspireconsumers through the belief that simple acts can lead to a big impact. We believe that every bottle and can recycled helps make communities and the world a cleaner,more sustainable place. The % of emissions reported is our total PepsiCo Beverages North America sector packaging emissions against our total Scope 3 emissions.
Impact of engagement, including measures of successOur measures of success include the number of containers collected and year over year trends in collection numbers. In 2019, the PepsiCo Recycling Program collected325 million post-consumer containers for recycling in the U.S., an approximately 37 percent increase in container collections as compared to 2018. We engage with all ourcustomers in this category in the US through the PepsiCo Recycling program.
Type of engagementCollaboration & innovation
Details of engagementRun a campaign to encourage innovation to reduce climate change impacts
% of customers by number100
% of customer - related Scope 3 emissions as reported in C6.554
Portfolio coverage (total or outstanding)<Not Applicable>
Please explain the rationale for selecting this group of customers and scope of engagementPepsiCo has strong relationships with our customers like largest retail customer worldwide. This customer was selected based on our volume of business with them andcommon objectives around sustainability. We regularly work with this customer on programs with climate-related benefits, such as the Mid-West Row Crop Collaborative,which is a group of companies and conservation organizations working to expand agricultural solutions that protect air and water quality and enhance soil health across theentire U.S. corn and soy system in the Midwest. PepsiCo also worked with this customer to help create the Closed Loop Fund in 2014 and continues to increasingly supportand invest in the fund to improve recycling both in the U.S., and internationally. The % of emissions reported is our total Scope 3 emissions from agriculture and packagingand is an approximation.
Impact of engagement, including measures of successMeasures of success for The Midwest Row Crop Collaborative are: By 2025: (1) 75% of row crop acres in Illinois, Iowa and Nebraska are engaged in sustainabilitymeasures; (2) Reduce nutrient loading in these states by 20 percent; (3) 50 percent of all irrigation units used in Nebraska will maximize water conservation. By 2035: (1)Illinois, Iowa and Nebraska have met the 45 percent nitrogen loss reduction goal and partnerships established to expand across the Upper Mississippi River Basin. TheClosed Loop Fund has continued to make progress since its launch. In 2019, the fund estimates that it kept 1.3 million tons of material in circulation and avoided 3 milliontons of greenhouse gas emissions.
Type of engagementCollaboration & innovation
Details of engagementRun a campaign to encourage innovation to reduce climate change impacts
% of customers by number100
% of customer - related Scope 3 emissions as reported in C6.54
Portfolio coverage (total or outstanding)<Not Applicable>
Please explain the rationale for selecting this group of customers and scope of engagementPepsiCo has a Partner Outreach Program to drive energy conservation with strategic franchise operations in the U.S., Mexico, Latin America, South America, WesternEurope and Asia. These are our strategic bottlers from a production volume and revenue perspective which is why we prioritized them for engagement. We have madeefforts to expand our Resource Conservation program to our franchise operations by providing trainings and access to tools that help measure and track performance,identify and implement improvement opportunities. This is a natural extension of our work within our owned operations to our franchise operations. The % of emissionsreported is our total Scope 3 emissions from franchise operations and is an approximation.
Impact of engagement, including measures of successWe track GHG emissions reduction within franchise operations as a measure of success. As a result of our engagements, we saw ~13% decline in emissions in 2019 ascompared to the prior year within our LATAM franchise operations through energy efficiency and renewable energy measures.
CDP Page of 7552

C12.1d
(C12.1d) Give details of your climate-related engagement strategy with other partners in the value chain.
We value our engagement with a wide range of stakeholders and actively create and foster collaborations to reduce greenhouse gas emissions. Key stakeholders includecustomers, peer companies, non-profit organizations, and regulators, among others. Our collaborations help us learn more about climate change and other sustainabilitytopics, better inform our efforts, and help us create value for society. We use a variety of mechanisms to solicit feedback from our stakeholders on climate change and othertopics, including bilateral meetings and participation in stakeholder networks, outreach programs and webinars. Some examples of our climate-related engagements areprovided here. PepsiCo is one of the founding members of the Climate Leadership Council in the U.S., which advocates for a consensus climate solution that bridges partisandivides, strengthens the economy, and protects our environment. The Council includes a wide range of businesses, NGOs and individuals. PepsiCo also has an aspirationalcommitment to eliminating deforestation from our supply chains. As a member of the Consumer Goods Forum (CGF), we are signatories of the Forum's resolutions ondeforestation and sustainable refrigeration, which is meant to have a significant positive impact on climate change. We also support climate-friendly sustainable agriculturalpractices through initiatives such as the Sustainable Agriculture Initiative (SAI) Platform and Field to Market Initiative.
C-AC12.2/C-FB12.2/C-PF12.2
(C-AC12.2/C-FB12.2/C-PF12.2) Do you encourage your suppliers to undertake any agricultural or forest management practices with climate change mitigationand/or adaptation benefits?Yes
C-AC12.2a/C-FB12.2a/C-PF12.2a
CDP Page of 7553
(C-AC12.2a/C-FB12.2a/C-PF12.2a) Specify which agricultural or forest management practices with climate change mitigation and/or adaptation benefits youencourage your suppliers to undertake and describe your role in the implementation of each practice.
Management practice reference numberMP1
Management practiceCrop rotation
Description of management practiceThrough our Sustainable Farming Program (SFP), growers are encouraged to implement crop rotation practices to improve soil fertility, as well as manage pests
Your role in the implementationFinancialKnowledge sharingOperationalProcurement
Explanation of how you encourage implementationFor PepsiCo, sustainable agriculture is critical to the continued growth of our business, ensuring food safety and crop resilience for continued and localized supply. As acorporation that has a global reach but operates locally in the communities where we do business, we provide relevant expertise to help advance the ways in which farmingis carried out around the world. This benefits individual farmers and the communities that rely on them, while helping protect our license to operate. Our SFP is a programwe use to engage with growers on farms of all sizes and types around the world in order to encourage continual improvement in sustainable farming practices, expandrespect for workers' human rights, enhance growers' capabilities, and address risks. The SFP is comprised of two components: • The SFP Code, which lists PepsiCo’sfarm-level sustainable agriculture principles and practices. The Code draws from principles of externally recognized agricultural codes, such as those published by theRainforest Alliance, GlobalG.A.P, Bonsucro, and the RSPO. • The SFP Continuous Improvement Process, through which farmers are continually assessed and efforts aretaken to drive improvement in sustainable agriculture. To date, we have focused on engaging growers and bringing them into the SFP through FMGs, which are groups offarmers that show consistency across geography, crop, farm size, and a variety of other factors. PepsiCo considers an FMG engaged when: • An initial assessment againstour SFP Principles and Practices has been completed; • Sustainability opportunities have been identified and improvement programs developed; and • Grower engagementin these improvement programs has been initiated. The percentage of FMGs engaged is one metric by which we are measuring progress. The second metric – representingour ultimate objective – is the percentage of directly-sourced agricultural raw materials that we have verified as sustainably sourced.
Climate change related benefitEmissions reductions (mitigation)Increasing resilience to climate change (adaptation)Increase carbon sink (mitigation)Reduced demand for fossil fuel (adaptation)Reduced demand for fertilizers (adaptation)Reduced demand for pesticides (adaptation)
Comment
Management practice reference numberMP2
Management practiceFertilizer management
Description of management practiceThrough our SFP, growers are encouraged to manage fertilizers by incorporating into the soil, using split application to minimize nitrous oxide emissions. Growers areencouraged to use tools to determine the amount of fertilizer to apply as well as to use organic fertilizer and low carbon fertilizers.
Your role in the implementationFinancialKnowledge sharingOperationalProcurement
Explanation of how you encourage implementationFor PepsiCo, sustainable agriculture is critical to the continued growth of our business, ensuring food safety and crop resilience for continued and localized supply. As acorporation that has a global reach but operates locally in the communities where we do business, we provide relevant expertise to help advance the ways in which farmingis carried out around the world. This benefits individual farmers and the communities that rely on them, while helping protect our license to operate. Our SFP is a programwe use to engage with growers on farms of all sizes and types around the world in order to encourage continual improvement in sustainable farming practices, expandrespect for workers' human rights, enhance growers' capabilities, and address risks. The SFP is comprised of two components: • The SFP Code, which lists PepsiCo’sfarm-level sustainable agriculture principles and practices. The Code draws from principles of externally recognized agricultural codes, such as those published by theRainforest Alliance, GlobalG.A.P, Bonsucro, and the RSPO. • The SFP Continuous Improvement Process, through which farmers are continually assessed and efforts aretaken to drive improvement in sustainable agriculture. To date, we have focused on engaging growers and bringing them into the SFP through FMGs, which are groups offarmers that show consistency across geography, crop, farm size, and a variety of other factors. PepsiCo considers an FMG engaged when: • An initial assessment againstour SFP Principles and Practices has been completed; • Sustainability opportunities have been identified and improvement programs developed; and • Grower engagementin these improvement programs has been initiated. The percentage of FMGs engaged is one metric by which we are measuring progress. The second metric – representingour ultimate objective – is the percentage of directly-sourced agricultural raw materials that we have verified as sustainably sourced.
Climate change related benefitEmissions reductions (mitigation)Increasing resilience to climate change (adaptation)Increase carbon sink (mitigation)Reduced demand for fossil fuel (adaptation)Reduced demand for fertilizers (adaptation)Reduced demand for pesticides (adaptation)
Comment
C-AC12.2b/C-FB12.2b/C-PF12.2b
CDP Page of 7554

(C-AC12.2b/C-FB12.2b/C-PF12.2b) Do you collect information from your suppliers about the outcomes of any implemented agricultural/forest managementpractices you have encouraged?Yes
C12.3
(C12.3) Do you engage in activities that could either directly or indirectly influence public policy on climate-related issues through any of the following?Direct engagement with policy makersTrade associationsFunding research organizations
C12.3a
(C12.3a) On what issues have you been engaging directly with policy makers?
Focus oflegislation
Corporateposition
Details of engagement Proposed legislative solution
Carbon tax Support We are a founding member of the Climate Leadership Council (CLC). CLC is aninternational policy institute founded in collaboration with business andenvironmental leaders to promote a carbon dividend framework as the most cost-effective, equitable and politically-viable climate solution. The Council is activeprimarily in the U.S. In Europe, the European Commission is exploring possibilitiesof a carbon border tax, PepsiCo has fed into the consultation on this topic viadirect submission and through FoodDrinkEurope.
CLC proposes a carbon dividend program to be implemented at the federal level in the United States.The program is based on four interdependent pillars: 1. A gradually rising and revenue-neutral carbonfee; 2. Carbon dividend payments to all Americans, funded by 100% of the revenue; 3. The rollback ofcarbon regulations that are no longer necessary; and 4. Border carbon adjustments to level the playingfield and promote American competitiveness.
Other,pleasespecify(Emissions)
Support PepsiCo is regularly monitoring the developments of the EU Green Deal andassociated EU Climate Law and EU Climate Pact. We have provided inputs to theCommission through public consultations on these policy measures. We regularlyengage with policy makers to provide our input into the process and demonstrateour support for the direction the EU is heading. The vision of the EU Climate Lawis aligned with our recent pledge for Business Ambition for 1.50C and a long termnet zero target.
The Commission’s proposal for the first European Climate Law aims to write into law the goal set out inthe European Green Deal – for Europe’s economy and society to become climate-neutral by 2050. Thismeans achieving net zero greenhouse gas emissions for EU countries as a whole, mainly by cuttingemissions, investing in green technologies and protecting the natural environment. The law aims toensure that all EU policies contribute to this goal and that all sectors of the economy and society playtheir part. The EU Climate Law also proposed intermediate steps to set mid term (2030 and 2040)targets towards the climate neutrality objective.
C12.3b
(C12.3b) Are you on the board of any trade associations or do you provide funding beyond membership?Yes
C12.3c
(C12.3c) Enter the details of those trade associations that are likely to take a position on climate change legislation.
Trade associationAmerican Beverage Association (ABA)
Is your position on climate change consistent with theirs?Consistent
Please explain the trade association’s positionWe understand that ABA may support various types of legislation related to climate change, such as legislation on energy efficiency, consistent with PepsiCo’s views.
How have you influenced, or are you attempting to influence their position?PepsiCo is an active member of ABA with a seat at the board. We regularly share information on our sustainability vision relating to climate change and related issues.
Trade associationConsumer Brands Association (CBA)
Is your position on climate change consistent with theirs?Consistent
Please explain the trade association’s positionWe understand that GMA may support various types of legislation related to climate change, such as legislation on energy efficiency, consistent with PepsiCo’s views.
How have you influenced, or are you attempting to influence their position?PepsiCo is a member of the CBA Board. We regularly share information on our sustainability vision relating to climate change and related issues.
Trade associationUnion of European Soft Drinks Associations (UNESDA)
Is your position on climate change consistent with theirs?Consistent
Please explain the trade association’s positionWe understand that UNESDA welcomes the European Commission’s proposal for establishing a Circular Economy in Europe and the recently concluded review of the
CDP Page of 7555
Waste Framework Directive (WFD) and the Packaging and Packaging Waste Directive (PPWD). UNESDA’s members are conscious of their responsibility for the end-of-lifephase of packaging and advocate for a strong European framework on Extended Producer Responsibility (EPR) for packaging to increase efficiency and transparency ofEPR in Europe. UNESDA supports the objective of increasing resource efficiency, sustainability and progress towards a circular economy through the recycling ofmaterials.
How have you influenced, or are you attempting to influence their position?PepsiCo is an active member of UNESDA with a seat at the Board. PepsiCo participates in UNESDA’s two main committees dealing with scientific affairs and EU policy.
Trade associationFoodDrinkEurope
Is your position on climate change consistent with theirs?Consistent
Please explain the trade association’s positionFoodDrinkEurope responded to the call for inputs to draw the future European Commission’s proposal for a strategy for long-term EU greenhouse gas emissions reductionsin accordance with the Paris Agreement. Food chain partners, as well as other economic sectors, civil society and policymakers should support ambitious efforts to mitigateand adapt to Climate Change in Europe and globally. Challenges to achieve the temperature objective under the Paris Climate Agreement persist, such as the lack ofeconomical and technically viable means (i.e. financial and technological) to reach such target. FoodDrinkEurope has yet to agree on a more proactive approach in supportto climate neutrality but members have agreed to have climate ambitions as the main objective when assessing packaging performance.
How have you influenced, or are you attempting to influence their position?PepsiCo is a member of the FoodDrinkEurope Board and participates in a variety of committees and working groups.
Trade associationEuropean Organization for Packaging and Environment (EUROPEN)
Is your position on climate change consistent with theirs?Consistent
Please explain the trade association’s positionEUROPEN supports the objectives of the EU Circular Economy package. EUROPEN advocates for a packaging waste policy framework that clearly defines the roles andresponsibilities of all actors involved in waste management. The new Circular Economy Package should safeguard the EU internal market and be based on the principle oflife cycle assessment. EUROPEN does not plan on engaging in climate specific files at this stage but supports the climate neutrality objective through its advocacy on thecircular economy.
How have you influenced, or are you attempting to influence their position?PepsiCo is part of the EUROPEN Executive Committee and of the technical Task Force on Circular Economy that is responsible for analyzing policy developments andbuilding an advocacy plan for the association. PepsiCo hold the chairmanship of the Circular Economy and Green Deal taskforce.
Trade associationEuropean Snacks Association (ESA)
Is your position on climate change consistent with theirs?Consistent
Please explain the trade association’s positionWe understand that ESA supports sustainable practices to protect natural resources. ESA supports a circular economy for packaging and actively engages in packagingrelated policy initiatives at EU level.
How have you influenced, or are you attempting to influence their position?PepsiCo is an ESA Board member and holds the Chairmanship of the Communication Committee.
C12.3d
(C12.3d) Do you publicly disclose a list of all research organizations that you fund?No
C12.3f
(C12.3f) What processes do you have in place to ensure that all of your direct and indirect activities that influence policy are consistent with your overall climatechange strategy?
PepsiCo has specific teams and individuals that are assigned responsibilities for developing corporate policy and regulatory positions as well as engaging on regulatory policywith external stakeholders, including public policymakers, trade associations and non-government actors that is aligned with our climate strategy. The Public Policy andGovernment Affairs (PPGA) department has global personnel and well as personnel focused on specific geographies and markets. They manage relationships withgovernment actors and coordinate activities like advocating for similar climate positions that may influence regulatory policy globally. The PPGA department works closelywith the Office of Sustainability and other functions to ensure that our external engagements are aligned with our overall strategy on climate action and advocacy.
C12.4
CDP Page of 7556
(C12.4) Have you published information about your organization’s response to climate change and GHG emissions performance for this reporting year in placesother than in your CDP response? If so, please attach the publication(s).
PublicationIn mainstream reports
StatusComplete
Attach the documentpepsico-inc-2019-annual-report.pdf
Page/Section referencePages 10, 17, 21, 29
Content elementsGovernanceStrategyRisks & opportunities
Comment
PublicationIn voluntary sustainability report
StatusComplete
Attach the documentPepsiCo-CSR-2019.pdf
Page/Section referenceOur report is entirely digital this year. Attached climate section excerpt here. Please visit www.pepsico.com for details.
Content elementsGovernanceStrategyRisks & opportunitiesEmissions figuresEmission targetsOther metrics
Comment
PublicationIn voluntary communications
StatusComplete
Attach the documentESG Topics A-Z.pdf
Page/Section referenceOur ESG topics page is entirely digital. Attached climate excerpts here. Please visit www.pepsico.com for details.
Content elementsGovernanceStrategyRisks & opportunitiesEmissions figuresEmission targetsOther metrics
Comment
C13. Other land management impacts
C-AC13.2/C-FB13.2/C-PF13.2
(C-AC13.2/C-FB13.2/C-PF13.2) Do you know if any of the management practices mentioned in C-AC12.2a/C-FB12.2a/C-PF12.2a that were implemented by yoursuppliers have other impacts besides climate change mitigation/adaptation?Yes
C-AC13.2a/C-FB13.2a/C-PF13.2a
CDP Page of 7557
(C-AC13.2a/C-FB13.2a/C-PF13.2a) Provide details of those management practices implemented by your suppliers that have other impacts besides climate changemitigation/adaptation.
Management practice reference numberMP1
Overall effectPositive
Which of the following has been impacted?BiodiversitySoilWaterYieldOther, please specify (Waste, Ag Chemicals)
Description of impactsOur Sustainable Farming Program (SFP), is a program we use to engage with growers on farms of all sizes and types around the world in order to encourage continualimprovement in sustainable farming practices, expand respect for workers' human rights, enhance growers' capabilities, and address risks. The SFP program is comprisedof two components: (1) The SFP Code, which lists PepsiCo’s farm-level sustainable agriculture principles and practices. The Code draws from principles of externallyrecognized agricultural codes, such as those published by the Rainforest Alliance, GlobalG.A.P., Bonsucro, and the Roundtable on Sustainable Palm Oil (RSPO); and (2)The SFP Continuous Improvement Process, through which farmers are continually assessed and efforts are taken to drive improvement in sustainable agriculture. The SFPCode outlines the specific farm-level principles and practices that embody PepsiCo’s Sustainable Agriculture Policy. These principles span a comprehensive array of topicsacross the three widely recognized pillars of sustainability: Environmental, Social and Economic. Under the Environmental pillar topics included are Ag Chemicals, Air,Biodiversity, Nutrients, Soil, Water and Waste in addition to climate related topics such as GHGs and Energy. Farmers are encouraged to adhere to the fundamentalprinciples and practices within each of these topics. As of year-end 2019, 100% of the volume of the agricultural raw materials that we directly source has been supplied byFMGs engaged in the SFP.
Have any response to these impacts been implemented?Yes
Description of the response(s)The percentage of Farm Management Groups engaged is one metric by which we are measuring progress. The second metric – representing our ultimate objective – is thepercentage of directly sourced agricultural raw materials that we have verified as sustainably sourced. PepsiCo considers an FMG verified sustainable when: (1) Arepresentative sample of self-assessments demonstrate that the farmers have implemented the Fundamental Principles of the SFP; and (2) A certain proportion of randomsamples from the self-assessment results are verified by a third party. The details of this process are being piloted. Once finalized, the requirements will be listed in anappendix in the SFP Scheme Rules. We made significant progress on SFP engagement in 2019, and with that, progress towards our sustainable sourcing goal with targetcompletion date of 2020.
Management practice reference numberMP2
Overall effectPositive
Which of the following has been impacted?BiodiversitySoilWaterYieldOther, please specify (Waste, Ag Chemicals)
Description of impactsOur Sustainable Farming Program (SFP), is a program we use to engage with growers on farms of all sizes and types around the world in order to encourage continualimprovement in sustainable farming practices, expand respect for workers' human rights, enhance growers' capabilities, and address risks. The SFP program is comprisedof two components: (1) The SFP Code, which lists PepsiCo’s farm-level sustainable agriculture principles and practices. The Code draws from principles of externallyrecognized agricultural codes, such as those published by the Rainforest Alliance, GlobalG.A.P., Bonsucro, and the Roundtable on Sustainable Palm Oil (RSPO); and (2)The SFP Continuous Improvement Process, through which farmers are continually assessed and efforts are taken to drive improvement in sustainable agriculture. The SFPCode outlines the specific farm-level principles and practices that embody PepsiCo’s Sustainable Agriculture Policy. These principles span a comprehensive array of topicsacross the three widely recognized pillars of sustainability: Environmental, Social and Economic. Under the Environmental pillar topics included are Ag Chemicals, Air,Biodiversity, Nutrients, Soil, Water and Waste in addition to climate related topics such as GHGs and Energy. Farmers are encouraged to adhere to the fundamentalprinciples and practices within each of these topics. As of year-end 2019, 100% of the volume of the agricultural raw materials that we directly source has been supplied byFMGs engaged in the SFP.
Have any response to these impacts been implemented?Yes
Description of the response(s)The percentage of Farm Management Groups engaged is one metric by which we are measuring progress. The second metric – representing our ultimate objective – is thepercentage of directly sourced agricultural raw materials that we have verified as sustainably sourced. PepsiCo considers an FMG verified sustainable when: (1) Arepresentative sample of self-assessments demonstrate that the farmers have implemented the Fundamental Principles of the SFP; and (2) A certain proportion of randomsamples from the self-assessment results are verified by a third party. The details of this process are being piloted. Once finalized, the requirements will be listed in anappendix in the SFP Scheme Rules. We made significant progress on SFP engagement in 2019, and with that, progress towards our sustainable sourcing goal with targetcompletion date of 2020.
C15. Signoff
C-FI
CDP Page of 7558
(C-FI) Use this field to provide any additional information or context that you feel is relevant to your organization's response. Please note that this field is optionaland is not scored.
C15.1
(C15.1) Provide details for the person that has signed off (approved) your CDP climate change response.
Job title Corresponding job category
Row 1 Chief Sustainability Officer Chief Sustainability Officer (CSO)
SC. Supply chain module
SC0.0
(SC0.0) If you would like to do so, please provide a separate introduction to this module.
PepsiCo products are enjoyed by consumers more than one billion times a day in more than 200 countries and territories around the world. PepsiCo generated more than $67billion in net revenue in 2019, driven by a complementary food and beverage portfolio that includes 23 brands that generate more than $1 billion each in estimated annualretail sales (e.g., Frito-Lay, Gatorade, Pepsi-Cola, Quaker and Tropicana). Guiding PepsiCo is our vision to Be the Global Leader in Convenient Foods and Beverages byWinning with Purpose. “Winning with Purpose” reflects our ambition to win sustainably in the marketplace and embed purpose into all aspects of the business. We also setthree lofty aspirations that will help us achieve these goals: becoming Faster by winning in the marketplace; Stronger by transforming our capabilities, cost, and culture; andBetter by integrating purpose into our business strategy and brands, whilst doing even more for our planet and people. As part of our efforts to become Better, we were proudto sign the Business Roundtable’s 2019 Statement on the Purpose of a Corporation. This standard for corporate responsibility aligns with our existing values and strategy tolead the company for the benefit of all of our stakeholders. We know that being a Better company is about doing the most good for the most people. That’s why we arefocused on using our scale and expertise as one of the world’s leading food and beverage companies to tackle the long-term challenges facing the global food systemincluding climate change.
This CDP Climate Questionnaire contains statements reflecting our views about our future performance that constitute “forward-looking statements” within the meaning of thePrivate Securities Litigation Reform Act of 1995. Forward-looking statements are generally identified through the inclusion of words such as “aim,” “anticipate,” “believe,”“drive,” “estimate,” “expect,” “goal,” “intend,” “may,” “plan,” “project,” “strategy,” “target” and “will” or similar statements or variations of such terms and other similarexpressions. Forward-looking statements inherently involve risks and uncertainties. For information on certain factors that could cause actual events or results to differmaterially from our expectations, please see PepsiCo’s filings with the Securities and Exchange Commission, including its most recent annual report on Form 10-K andsubsequent reports on Forms 10-Q and 8-K. Investors are cautioned not to place undue reliance on any such forward-looking statements, which speak only as of the datethey are made. PepsiCo undertakes no obligation to update any forward-looking statements, whether as a result of new information, future events or otherwise.
SC0.1
(SC0.1) What is your company’s annual revenue for the stated reporting period?
Annual Revenue
Row 1 67161000000
SC0.2
(SC0.2) Do you have an ISIN for your company that you would be willing to share with CDP?No
SC1.1
(SC1.1) Allocate your emissions to your customers listed below according to the goods or services you have sold them in this reporting period.
Requesting memberCaesars Entertainment
Scope of emissionsScope 1
Allocation levelCompany wide
CDP Page of 7559
Allocation level detail<Not Applicable>
Emissions in metric tonnes of CO2e852
Uncertainty (±%)15
Major sources of emissionsThese emissions include those from PepsiCo's total global company-owned operations that have been allocated to Caesars Entertainment. Major sources include fuel usein PepsiCo's wholly-owned or operated manufacturing facilities globally that produce products that may or may not be sold to Caesar’s Entertainment. Also included is fueluse in transportation vehicles that are wholly-owned or operated by PepsiCo.
VerifiedNo
Allocation methodAllocation based on the market value of products purchased
Please explain how you have identified the GHG source, including major limitations to this process and assumptions madeOur method for allocating emissions is to take the percentage of PepsiCo’s net revenue attributable to the customer in the reporting year and apply this percentage to ourglobal Scope 1, Scope 2 or Scope 3 emissions. Thus, our method does not distinguish between emissions from facilities that produce product sold to the customer versusemissions from all PepsiCo's production facilities world-wide.
Requesting memberCaesars Entertainment
Scope of emissionsScope 2
Allocation levelCompany wide
Allocation level detail<Not Applicable>
Emissions in metric tonnes of CO2e342
Uncertainty (±%)15
Major sources of emissionsThese emissions include those from indirect fuel use in the generation of electricity that is consumed by PepsiCo's direct operations - our wholly-owned or operatedmanufacturing facilities globally that produce products that may or may not be sold to Caesar’s Entertainment.
VerifiedNo
Allocation methodAllocation based on the market value of products purchased
Please explain how you have identified the GHG source, including major limitations to this process and assumptions madeOur method for allocating emissions is to take the percentage of PepsiCo’s net revenue attributable to the customer in the reporting year and apply this percentage to ourglobal Scope 1, Scope 2 or Scope 3 emissions. Thus, our method does not distinguish between emissions from facilities that produce product sold to the customer versusemissions from all PepsiCo's production facilities world-wide.
Requesting memberCaesars Entertainment
Scope of emissionsScope 3
Allocation levelCompany wide
Allocation level detail<Not Applicable>
Emissions in metric tonnes of CO2e12098
Uncertainty (±%)15
Major sources of emissionsThese emissions include all other indirect emissions from PepsiCo’s value chain, such as the extraction and production of purchased materials and fuels, transport-relatedactivities in vehicles not owned or controlled by PepsiCo, electricity-related activities (e.g. Transmission & Distribution (T&D) losses) not covered in Scope 2, outsourcedactivities, consumer use, waste disposal, etc. These global emissions have then been allocated to Caesar’s entertainment.
VerifiedNo
Allocation methodAllocation based on the market value of products purchased
Please explain how you have identified the GHG source, including major limitations to this process and assumptions madeOur method for allocating emissions is to take the percentage of PepsiCo’s net revenue attributable to the customer in the reporting year and apply this percentage to our
CDP Page of 7560
global Scope 1, Scope 2 or Scope 3 emissions. Thus, our method does not distinguish between emissions from facilities that produce product sold to the customer versusemissions from all PepsiCo's production facilities world-wide.
Requesting memberCVS Health
Scope of emissionsScope 1
Allocation levelCompany wide
Allocation level detail<Not Applicable>
Emissions in metric tonnes of CO2e10191
Uncertainty (±%)15
Major sources of emissionsThese emissions include those from PepsiCo's company-owned operations that have been allocated to CVS Health. Major sources include fuel use in PepsiCo's wholly-owned or operated manufacturing facilities globally that produce products that may or may not be sold to CVS Health. Also included is fuel use in transportation vehiclesthat are wholly-owned or operated by PepsiCo.
VerifiedNo
Allocation methodAllocation based on the market value of products purchased
Please explain how you have identified the GHG source, including major limitations to this process and assumptions madeOur method for allocating emissions is to take the percentage of PepsiCo’s net revenue attributable to the customer in the reporting year and apply this percentage to ourglobal Scope 1, Scope 2 or Scope 3 emissions. Thus, our method does not distinguish between emissions from facilities that produce product sold to the customer versusemissions from all PepsiCo's production facilities world-wide.
Requesting memberCVS Health
Scope of emissionsScope 2
Allocation levelCompany wide
Allocation level detail<Not Applicable>
Emissions in metric tonnes of CO2e4089
Uncertainty (±%)15
Major sources of emissionsThese emissions include those from indirect fuel use in the generation of electricity that is consumed by PepsiCo's direct operations - our wholly-owned or operatedmanufacturing facilities globally that produce products that may or may not be sold to CVS Health. These global emissions have then been allocated to CVS Health.
VerifiedNo
Allocation methodAllocation based on the market value of products purchased
Please explain how you have identified the GHG source, including major limitations to this process and assumptions madeOur method for allocating emissions is to take the percentage of PepsiCo’s net revenue attributable to the customer in the reporting year and apply this percentage to ourglobal Scope 1, Scope 2 or Scope 3 emissions. Thus, our method does not distinguish between emissions from facilities that produce product sold to the customer versusemissions from all PepsiCo's production facilities world-wide.
Requesting memberCVS Health
Scope of emissionsScope 3
Allocation levelCompany wide
Allocation level detail<Not Applicable>
Emissions in metric tonnes of CO2e144767
Uncertainty (±%)15
Major sources of emissions
CDP Page of 7561
These emissions include all other indirect emissions from PepsiCo’s value chain, such as the extraction and production of purchased materials and fuels, transport-relatedactivities in vehicles not owned or controlled by PepsiCo, electricity-related activities (e.g. Transmission & Distribution (T&D) losses) not covered in Scope 2, outsourcedactivities, consumer use, waste disposal, etc. These global emissions have then been allocated to CVS Health.
VerifiedNo
Allocation methodAllocation based on the market value of products purchased
Please explain how you have identified the GHG source, including major limitations to this process and assumptions madeOur method for allocating emissions is to take the percentage of PepsiCo’s net revenue attributable to the customer in the reporting year and apply this percentage to ourglobal Scope 1, Scope 2 or Scope 3 emissions. Thus, our method does not distinguish between emissions from facilities that produce product sold to the customer versusemissions from all PepsiCo's production facilities world-wide.
Requesting memberJ Sainsbury Plc
Scope of emissionsScope 1
Allocation levelCompany wide
Allocation level detail<Not Applicable>
Emissions in metric tonnes of CO2e11510
Uncertainty (±%)15
Major sources of emissionsThese emissions include those from PepsiCo's company-owned operations that have been allocated to Sainsbury’s. Major sources include fuel use in PepsiCo's wholly-owned or operated manufacturing facilities globally that produce products that may or may not be sold to Sainsbury’s. Also included is fuel use in transportation vehiclesthat are wholly-owned or operated by PepsiCo.
VerifiedNo
Allocation methodAllocation based on the market value of products purchased
Please explain how you have identified the GHG source, including major limitations to this process and assumptions madeOur method for allocating emissions is to take the percentage of PepsiCo’s net revenue attributable to the customer in the reporting year and apply this percentage to ourglobal Scope 1, Scope 2 or Scope 3 emissions. Thus, our method does not distinguish between emissions from facilities that produce product sold to the customer versusemissions from all PepsiCo's production facilities world-wide.
Requesting memberJ Sainsbury Plc
Scope of emissionsScope 2
Allocation levelCompany wide
Allocation level detail<Not Applicable>
Emissions in metric tonnes of CO2e4618
Uncertainty (±%)15
Major sources of emissionsThese emissions include those from indirect fuel use in the generation of electricity that is consumed by PepsiCo's direct operations - our wholly-owned or operatedmanufacturing facilities globally that produce products that may or may not be sold to Sainsbury’s. These global emissions have then been allocated to Sainsbury’s.
VerifiedNo
Allocation methodAllocation based on the market value of products purchased
Please explain how you have identified the GHG source, including major limitations to this process and assumptions madeOur method for allocating emissions is to take the percentage of PepsiCo’s net revenue attributable to the customer in the reporting year and apply this percentage to ourglobal Scope 1, Scope 2 or Scope 3 emissions. Thus, our method does not distinguish between emissions from facilities that produce product sold to the customer versusemissions from all PepsiCo's production facilities world-wide.
Requesting memberJ Sainsbury Plc
Scope of emissionsScope 3
CDP Page of 7562
Allocation levelCompany wide
Allocation level detail<Not Applicable>
Emissions in metric tonnes of CO2e163506
Uncertainty (±%)15
Major sources of emissionsThese emissions include all other indirect emissions from PepsiCo’s value chain, such as the extraction and production of purchased materials and fuels, transport-relatedactivities in vehicles not owned or controlled by PepsiCo, electricity-related activities (e.g. Transmission & Distribution (T&D) losses) not covered in Scope 2, outsourcedactivities, consumer use, waste disposal, etc. These global emissions have then been allocated to Sainsbury’s.
VerifiedNo
Allocation methodAllocation based on the market value of products purchased
Please explain how you have identified the GHG source, including major limitations to this process and assumptions madeOur method for allocating emissions is to take the percentage of PepsiCo’s net revenue attributable to the customer in the reporting year and apply this percentage to ourglobal Scope 1, Scope 2 or Scope 3 emissions. Thus, our method does not distinguish between emissions from facilities that produce product sold to the customer versusemissions from all PepsiCo's production facilities world-wide.
Requesting memberMetro AG
Scope of emissionsScope 1
Allocation levelCompany wide
Allocation level detail<Not Applicable>
Emissions in metric tonnes of CO2e13625
Uncertainty (±%)15
Major sources of emissionsThese emissions include those from PepsiCo's company-owned operations that have been allocated to Metro. Major sources include fuel use in PepsiCo's wholly-owned oroperated manufacturing facilities globally that produce products that may or may not be sold to Metro. Also included is fuel use in transportation vehicles that are wholly-owned or operated by PepsiCo.
VerifiedNo
Allocation methodAllocation based on the market value of products purchased
Please explain how you have identified the GHG source, including major limitations to this process and assumptions madeOur method for allocating emissions is to take the percentage of PepsiCo’s net revenue attributable to the customer in the reporting year and apply this percentage to ourglobal Scope 1, Scope 2 or Scope 3 emissions. Thus, our method does not distinguish between emissions from facilities that produce product sold to the customer versusemissions from all PepsiCo's production facilities world-wide.
Requesting memberMetro AG
Scope of emissionsScope 2
Allocation levelCompany wide
Allocation level detail<Not Applicable>
Emissions in metric tonnes of CO2e5467
Uncertainty (±%)15
Major sources of emissionsThese emissions include those from indirect fuel use in the generation of electricity that is consumed by PepsiCo's direct operations - our wholly-owned or operatedmanufacturing facilities globally that produce products that may or may not be sold to Metro. These global emissions have then been allocated to Metro.
VerifiedNo
Allocation methodAllocation based on the market value of products purchased
CDP Page of 7563
Please explain how you have identified the GHG source, including major limitations to this process and assumptions madeOur method for allocating emissions is to take the percentage of PepsiCo’s net revenue attributable to the customer in the reporting year and apply this percentage to ourglobal Scope 1, Scope 2 or Scope 3 emissions. Thus, our method does not distinguish between emissions from facilities that produce product sold to the customer versusemissions from all PepsiCo's production facilities world-wide.
Requesting memberMetro AG
Scope of emissionsScope 3
Allocation levelCompany wide
Allocation level detail<Not Applicable>
Emissions in metric tonnes of CO2e193562
Uncertainty (±%)15
Major sources of emissionsThese emissions include all other indirect emissions from PepsiCo’s value chain, such as the extraction and production of purchased materials and fuels, transport-relatedactivities in vehicles not owned or controlled by PepsiCo, electricity-related activities (e.g. Transmission & Distribution (T&D) losses) not covered in Scope 2, outsourcedactivities, consumer use, waste disposal, etc. These global emissions have then been allocated to Metro.
VerifiedNo
Allocation methodAllocation based on the market value of products purchased
Please explain how you have identified the GHG source, including major limitations to this process and assumptions madeOur method for allocating emissions is to take the percentage of PepsiCo’s net revenue attributable to the customer in the reporting year and apply this percentage to ourglobal Scope 1, Scope 2 or Scope 3 emissions. Thus, our method does not distinguish between emissions from facilities that produce product sold to the customer versusemissions from all PepsiCo's production facilities world-wide.
Requesting memberRestaurant Brands International
Scope of emissionsScope 1
Allocation levelCompany wide
Allocation level detail<Not Applicable>
Emissions in metric tonnes of CO2e5078
Uncertainty (±%)15
Major sources of emissionsThese emissions include those from PepsiCo's company-owned operations that have been allocated to RBI. Major sources include fuel use in PepsiCo's wholly-owned oroperated manufacturing facilities globally that produce products that may or may not be sold to RBI. Also included is fuel use in transportation vehicles that are wholly-owned or operated by PepsiCo.
VerifiedNo
Allocation methodAllocation based on the market value of products purchased
Please explain how you have identified the GHG source, including major limitations to this process and assumptions madeOur method for allocating emissions is to take the percentage of PepsiCo’s net revenue attributable to the customer in the reporting year and apply this percentage to ourglobal Scope 1, Scope 2 or Scope 3 emissions. Thus, our method does not distinguish between emissions from facilities that produce product sold to the customer versusemissions from all PepsiCo's production facilities world-wide.
Requesting memberRestaurant Brands International
Scope of emissionsScope 2
Allocation levelCompany wide
Allocation level detail<Not Applicable>
Emissions in metric tonnes of CO2e2037
CDP Page of 7564
Uncertainty (±%)15
Major sources of emissionsThese emissions include those from indirect fuel use in the generation of electricity that is consumed by PepsiCo's direct operations - our wholly-owned or operatedmanufacturing facilities globally that produce products that may or may not be sold to RBI. These global emissions have then been allocated to RBI.
VerifiedNo
Allocation methodAllocation based on the market value of products purchased
Please explain how you have identified the GHG source, including major limitations to this process and assumptions madeOur method for allocating emissions is to take the percentage of PepsiCo’s net revenue attributable to the customer in the reporting year and apply this percentage to ourglobal Scope 1, Scope 2 or Scope 3 emissions. Thus, our method does not distinguish between emissions from facilities that produce product sold to the customer versusemissions from all PepsiCo's production facilities world-wide.
Requesting memberRestaurant Brands International
Scope of emissionsScope 3
Allocation levelCompany wide
Allocation level detail<Not Applicable>
Emissions in metric tonnes of CO2e72135
Uncertainty (±%)15
Major sources of emissionsThese emissions include all other indirect emissions from PepsiCo’s value chain, such as the extraction and production of purchased materials and fuels, transport-relatedactivities in vehicles not owned or controlled by PepsiCo, electricity-related activities (e.g. Transmission & Distribution (T&D) losses) not covered in Scope 2, outsourcedactivities, consumer use, waste disposal, etc. These global emissions have then been allocated to RBI.
VerifiedNo
Allocation methodAllocation based on the market value of products purchased
Please explain how you have identified the GHG source, including major limitations to this process and assumptions madeOur method for allocating emissions is to take the percentage of PepsiCo’s net revenue attributable to the customer in the reporting year and apply this percentage to ourglobal Scope 1, Scope 2 or Scope 3 emissions. Thus, our method does not distinguish between emissions from facilities that produce product sold to the customer versusemissions from all PepsiCo's production facilities world-wide.
Requesting memberTarget Corporation
Scope of emissionsScope 1
Allocation levelCompany wide
Allocation level detail<Not Applicable>
Emissions in metric tonnes of CO2e37841
Uncertainty (±%)15
Major sources of emissionsThese emissions include those from PepsiCo's company-owned operations that have been allocated to Target. Major sources include fuel use in PepsiCo's wholly-ownedor operated manufacturing facilities globally that produce products that may or may not be sold to Target. Also included is fuel use in transportation vehicles that are wholly-owned or operated by PepsiCo.
VerifiedNo
Allocation methodAllocation based on the market value of products purchased
Please explain how you have identified the GHG source, including major limitations to this process and assumptions madeOur method for allocating emissions is to take the percentage of PepsiCo’s net revenue attributable to the customer in the reporting year and apply this percentage to ourglobal Scope 1, Scope 2 or Scope 3 emissions. Thus, our method does not distinguish between emissions from facilities that produce product sold to the customer versusemissions from all PepsiCo's production facilities world-wide.
Requesting memberTarget Corporation
CDP Page of 7565
Scope of emissionsScope 2
Allocation levelCompany wide
Allocation level detail<Not Applicable>
Emissions in metric tonnes of CO2e15182
Uncertainty (±%)15
Major sources of emissionsThese emissions include those from indirect fuel use in the generation of electricity that is consumed by PepsiCo's direct operations - our wholly-owned or operatedmanufacturing facilities globally that produce products that may or may not be sold to Target. These global emissions have then been allocated to Target.
VerifiedNo
Allocation methodAllocation based on the market value of products purchased
Please explain how you have identified the GHG source, including major limitations to this process and assumptions madeOur method for allocating emissions is to take the percentage of PepsiCo’s net revenue attributable to the customer in the reporting year and apply this percentage to ourglobal Scope 1, Scope 2 or Scope 3 emissions. Thus, our method does not distinguish between emissions from facilities that produce product sold to the customer versusemissions from all PepsiCo's production facilities world-wide.
Requesting memberTarget Corporation
Scope of emissionsScope 3
Allocation levelCompany wide
Allocation level detail<Not Applicable>
Emissions in metric tonnes of CO2e537558
Uncertainty (±%)15
Major sources of emissionsThese emissions include all other indirect emissions from PepsiCo’s value chain, such as the extraction and production of purchased materials and fuels, transport-relatedactivities in vehicles not owned or controlled by PepsiCo, electricity-related activities (e.g. Transmission & Distribution (T&D) losses) not covered in Scope 2, outsourcedactivities, consumer use, waste disposal, etc. These global emissions have then been allocated to Target.
VerifiedNo
Allocation methodAllocation based on the market value of products purchased
Please explain how you have identified the GHG source, including major limitations to this process and assumptions madeOur method for allocating emissions is to take the percentage of PepsiCo’s net revenue attributable to the customer in the reporting year and apply this percentage to ourglobal Scope 1, Scope 2 or Scope 3 emissions. Thus, our method does not distinguish between emissions from facilities that produce product sold to the customer versusemissions from all PepsiCo's production facilities world-wide.
Requesting memberWal Mart de Mexico
Scope of emissionsScope 1
Allocation levelCompany wide
Allocation level detail<Not Applicable>
Emissions in metric tonnes of CO2e25632
Uncertainty (±%)15
Major sources of emissionsThese emissions include those from PepsiCo's company-owned operations that have been allocated to Walmart Mexico y Centroamerica. Major sources include fuel use inPepsiCo's wholly-owned or operated manufacturing facilities globally that produce products that may or may not be sold to Walmart Mexico y Centroamerica. Also includedis fuel use in transportation vehicles that are wholly-owned or operated by PepsiCo.
VerifiedNo
CDP Page of 7566
Allocation methodAllocation based on the market value of products purchased
Please explain how you have identified the GHG source, including major limitations to this process and assumptions madeOur method for allocating emissions is to take the percentage of PepsiCo’s net revenue attributable to the customer in the reporting year and apply this percentage to ourglobal Scope 1, Scope 2 or Scope 3 emissions. Thus, our method does not distinguish between emissions from facilities that produce product sold to the customer versusemissions from all PepsiCo's production facilities world-wide.
Requesting memberWal Mart de Mexico
Scope of emissionsScope 2
Allocation levelCompany wide
Allocation level detail<Not Applicable>
Emissions in metric tonnes of CO2e10284
Uncertainty (±%)15
Major sources of emissionsThese emissions include those from indirect fuel use in the generation of electricity that is consumed by PepsiCo's direct operations - our wholly-owned or operatedmanufacturing facilities globally that produce products that may or may not be sold to Walmart Mexico y Centroamerica. These global emissions have then been allocatedto Walmart Mexico y Centroamerica.
VerifiedNo
Allocation methodAllocation based on the market value of products purchased
Please explain how you have identified the GHG source, including major limitations to this process and assumptions madeOur method for allocating emissions is to take the percentage of PepsiCo’s net revenue attributable to the customer in the reporting year and apply this percentage to ourglobal Scope 1, Scope 2 or Scope 3 emissions. Thus, our method does not distinguish between emissions from facilities that produce product sold to the customer versusemissions from all PepsiCo's production facilities world-wide.
Requesting memberWal Mart de Mexico
Scope of emissionsScope 3
Allocation levelCompany wide
Allocation level detail<Not Applicable>
Emissions in metric tonnes of CO2e364131
Uncertainty (±%)15
Major sources of emissionsThese emissions include all other indirect emissions from PepsiCo’s value chain, such as the extraction and production of purchased materials and fuels, transport-relatedactivities in vehicles not owned or controlled by PepsiCo, electricity-related activities (e.g. Transmission & Distribution (T&D) losses) not covered in Scope 2, outsourcedactivities, consumer use, waste disposal, etc. These global emissions have then been allocated to Walmart Mexico y Centroamerica.
VerifiedNo
Allocation methodAllocation based on the market value of products purchased
Please explain how you have identified the GHG source, including major limitations to this process and assumptions madeOur method for allocating emissions is to take the percentage of PepsiCo’s net revenue attributable to the customer in the reporting year and apply this percentage to ourglobal Scope 1, Scope 2 or Scope 3 emissions. Thus, our method does not distinguish between emissions from facilities that produce product sold to the customer versusemissions from all PepsiCo's production facilities world-wide.
Requesting memberWalmart, Inc.
Scope of emissionsScope 1
Allocation levelCompany wide
Allocation level detail<Not Applicable>
CDP Page of 7567
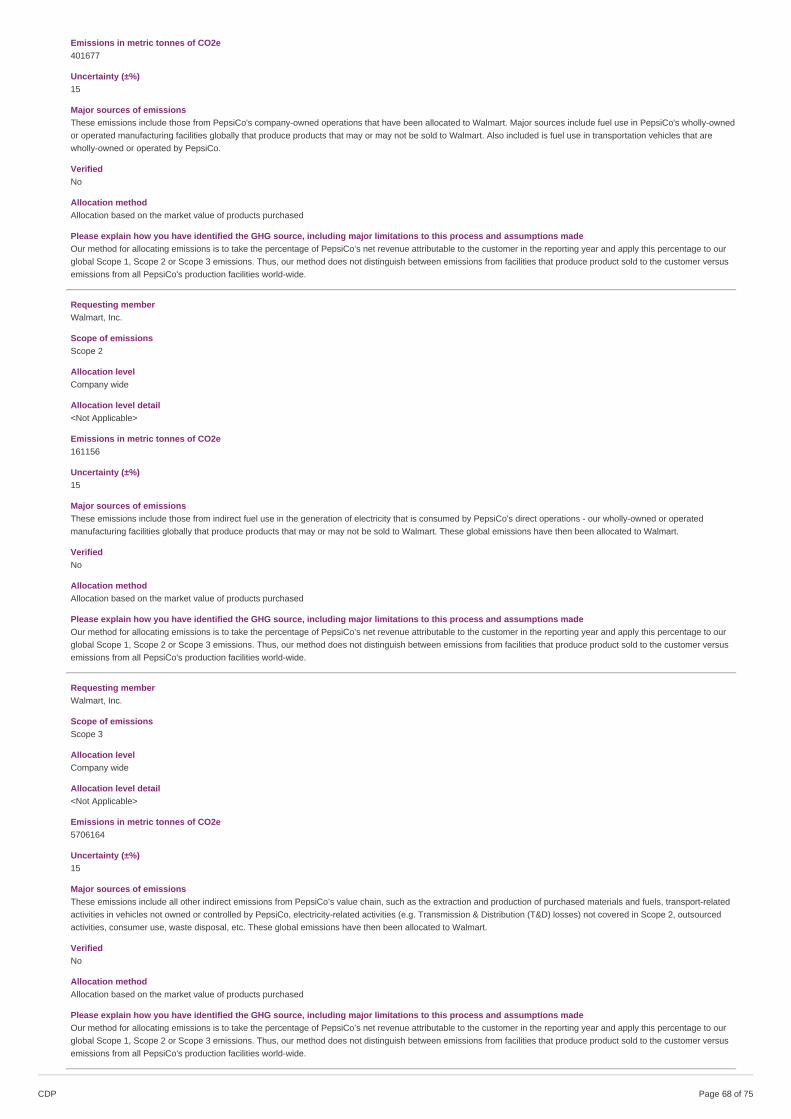
Emissions in metric tonnes of CO2e401677
Uncertainty (±%)15
Major sources of emissionsThese emissions include those from PepsiCo's company-owned operations that have been allocated to Walmart. Major sources include fuel use in PepsiCo's wholly-ownedor operated manufacturing facilities globally that produce products that may or may not be sold to Walmart. Also included is fuel use in transportation vehicles that arewholly-owned or operated by PepsiCo.
VerifiedNo
Allocation methodAllocation based on the market value of products purchased
Please explain how you have identified the GHG source, including major limitations to this process and assumptions madeOur method for allocating emissions is to take the percentage of PepsiCo’s net revenue attributable to the customer in the reporting year and apply this percentage to ourglobal Scope 1, Scope 2 or Scope 3 emissions. Thus, our method does not distinguish between emissions from facilities that produce product sold to the customer versusemissions from all PepsiCo's production facilities world-wide.
Requesting memberWalmart, Inc.
Scope of emissionsScope 2
Allocation levelCompany wide
Allocation level detail<Not Applicable>
Emissions in metric tonnes of CO2e161156
Uncertainty (±%)15
Major sources of emissionsThese emissions include those from indirect fuel use in the generation of electricity that is consumed by PepsiCo's direct operations - our wholly-owned or operatedmanufacturing facilities globally that produce products that may or may not be sold to Walmart. These global emissions have then been allocated to Walmart.
VerifiedNo
Allocation methodAllocation based on the market value of products purchased
Please explain how you have identified the GHG source, including major limitations to this process and assumptions madeOur method for allocating emissions is to take the percentage of PepsiCo’s net revenue attributable to the customer in the reporting year and apply this percentage to ourglobal Scope 1, Scope 2 or Scope 3 emissions. Thus, our method does not distinguish between emissions from facilities that produce product sold to the customer versusemissions from all PepsiCo's production facilities world-wide.
Requesting memberWalmart, Inc.
Scope of emissionsScope 3
Allocation levelCompany wide
Allocation level detail<Not Applicable>
Emissions in metric tonnes of CO2e5706164
Uncertainty (±%)15
Major sources of emissionsThese emissions include all other indirect emissions from PepsiCo’s value chain, such as the extraction and production of purchased materials and fuels, transport-relatedactivities in vehicles not owned or controlled by PepsiCo, electricity-related activities (e.g. Transmission & Distribution (T&D) losses) not covered in Scope 2, outsourcedactivities, consumer use, waste disposal, etc. These global emissions have then been allocated to Walmart.
VerifiedNo
Allocation methodAllocation based on the market value of products purchased
Please explain how you have identified the GHG source, including major limitations to this process and assumptions madeOur method for allocating emissions is to take the percentage of PepsiCo’s net revenue attributable to the customer in the reporting year and apply this percentage to ourglobal Scope 1, Scope 2 or Scope 3 emissions. Thus, our method does not distinguish between emissions from facilities that produce product sold to the customer versusemissions from all PepsiCo's production facilities world-wide.
CDP Page of 7568
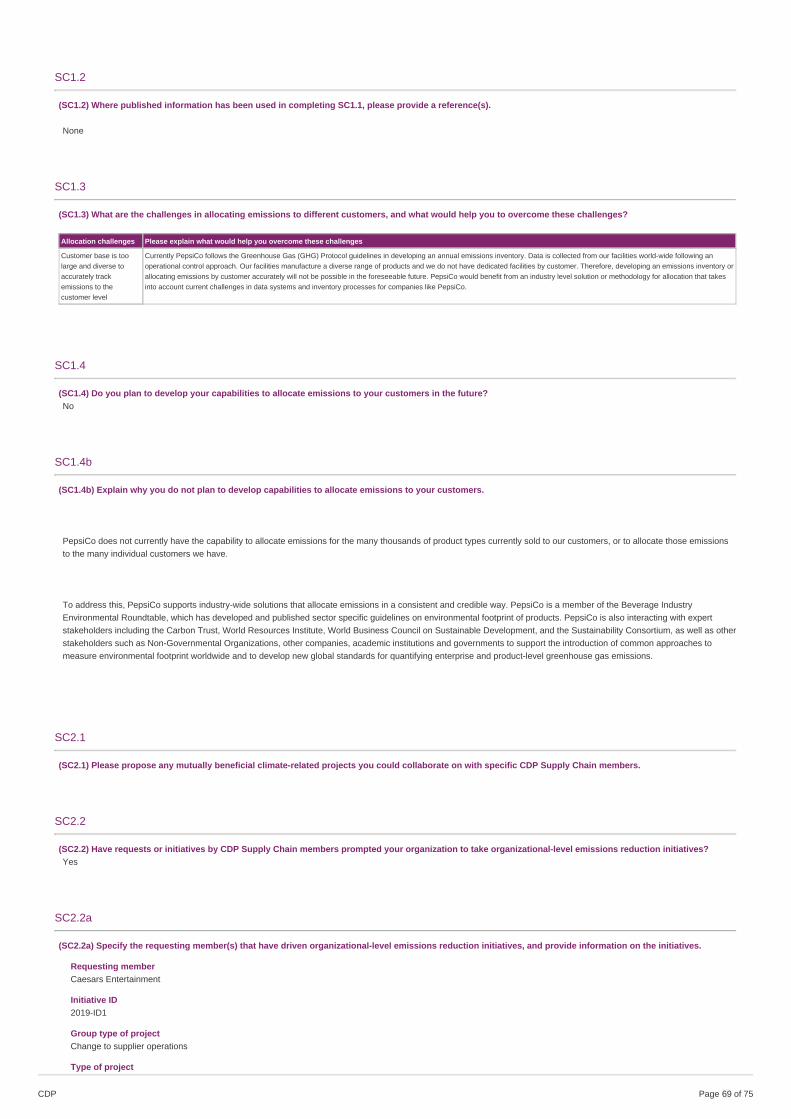
SC1.2
(SC1.2) Where published information has been used in completing SC1.1, please provide a reference(s).
None
SC1.3
(SC1.3) What are the challenges in allocating emissions to different customers, and what would help you to overcome these challenges?
Allocation challenges Please explain what would help you overcome these challenges
Customer base is toolarge and diverse toaccurately trackemissions to thecustomer level
Currently PepsiCo follows the Greenhouse Gas (GHG) Protocol guidelines in developing an annual emissions inventory. Data is collected from our facilities world-wide following anoperational control approach. Our facilities manufacture a diverse range of products and we do not have dedicated facilities by customer. Therefore, developing an emissions inventory orallocating emissions by customer accurately will not be possible in the foreseeable future. PepsiCo would benefit from an industry level solution or methodology for allocation that takesinto account current challenges in data systems and inventory processes for companies like PepsiCo.
SC1.4
(SC1.4) Do you plan to develop your capabilities to allocate emissions to your customers in the future?No
SC1.4b
(SC1.4b) Explain why you do not plan to develop capabilities to allocate emissions to your customers.
PepsiCo does not currently have the capability to allocate emissions for the many thousands of product types currently sold to our customers, or to allocate those emissionsto the many individual customers we have.
To address this, PepsiCo supports industry-wide solutions that allocate emissions in a consistent and credible way. PepsiCo is a member of the Beverage IndustryEnvironmental Roundtable, which has developed and published sector specific guidelines on environmental footprint of products. PepsiCo is also interacting with expertstakeholders including the Carbon Trust, World Resources Institute, World Business Council on Sustainable Development, and the Sustainability Consortium, as well as otherstakeholders such as Non-Governmental Organizations, other companies, academic institutions and governments to support the introduction of common approaches tomeasure environmental footprint worldwide and to develop new global standards for quantifying enterprise and product-level greenhouse gas emissions.
SC2.1
(SC2.1) Please propose any mutually beneficial climate-related projects you could collaborate on with specific CDP Supply Chain members.
SC2.2
(SC2.2) Have requests or initiatives by CDP Supply Chain members prompted your organization to take organizational-level emissions reduction initiatives?Yes
SC2.2a
(SC2.2a) Specify the requesting member(s) that have driven organizational-level emissions reduction initiatives, and provide information on the initiatives.
Requesting memberCaesars Entertainment
Initiative ID2019-ID1
Group type of projectChange to supplier operations
Type of project
CDP Page of 7569

Implementation of energy reduction projects
Description of the reduction initiativeAs part of our Sustainability agenda, PepsiCo has a goal to reduce our entire value chain (Scope 1, 2 and 3) emissions by at least 20% by 2030 against a 2015 baseline.These reductions relate to our operational emissions and are due to a number of measures undertaken within our facilities and fleet. Main programs contributing are ourResource Conservation (ReCon) program and fleet efficiency program.
Emissions reduction for the reporting year in metric tons of CO2e32
Did you identify this opportunity as part of the CDP supply chain Action Exchange?No
Would you be happy for CDP supply chain members to highlight this work in their external communication?Yes
Requesting memberCaesars Entertainment
Initiative ID2019-ID2
Group type of projectRelationship sustainability assessment
Type of projectAssessing products or services life-cycle foot print to identify efficiencies
Description of the reduction initiativeAs part of our Sustainability agenda, PepsiCo has a goal to reduce our entire value chain (Scope 1, 2 and 3) emissions by at least 20% by 2030 against a 2015 baseline.These reductions relate to our Scope 3 emissions and are due to a number of initiatives including packaging sustainability, certified commodities and the deployment of ourHigher Efficiency Coolers and Vending program.
Emissions reduction for the reporting year in metric tons of CO2e279
Did you identify this opportunity as part of the CDP supply chain Action Exchange?No
Would you be happy for CDP supply chain members to highlight this work in their external communication?Yes
Requesting memberCVS Health
Initiative ID2019-ID3
Group type of projectChange to supplier operations
Type of projectImplementation of energy reduction projects
Description of the reduction initiativeAs part of our Sustainability agenda, PepsiCo has a goal to reduce our entire value chain (Scope 1, 2 and 3) emissions by at least 20% by 2030 against a 2015 baseline.These reductions relate to our operational emissions and are due to a number of measures undertaken within our facilities and fleet. Main programs contributing are ourResource Conservation (ReCon) program and fleet efficiency program.
Emissions reduction for the reporting year in metric tons of CO2e383
Did you identify this opportunity as part of the CDP supply chain Action Exchange?No
Would you be happy for CDP supply chain members to highlight this work in their external communication?Yes
Requesting memberCVS Health
Initiative ID2019-ID4
Group type of projectRelationship sustainability assessment
Type of projectAssessing products or services life-cycle foot print to identify efficiencies
Description of the reduction initiativeAs part of our Sustainability agenda, PepsiCo has a goal to reduce our entire value chain (Scope 1, 2 and 3) emissions by at least 20% by 2030 against a 2015 baseline.These reductions relate to our Scope 3 emissions and are due to a number of initiatives including packaging sustainability, certified commodities and the deployment of ourHigher Efficiency Coolers and Vending program.
Emissions reduction for the reporting year in metric tons of CO2e3336
Did you identify this opportunity as part of the CDP supply chain Action Exchange?
CDP Page of 7570
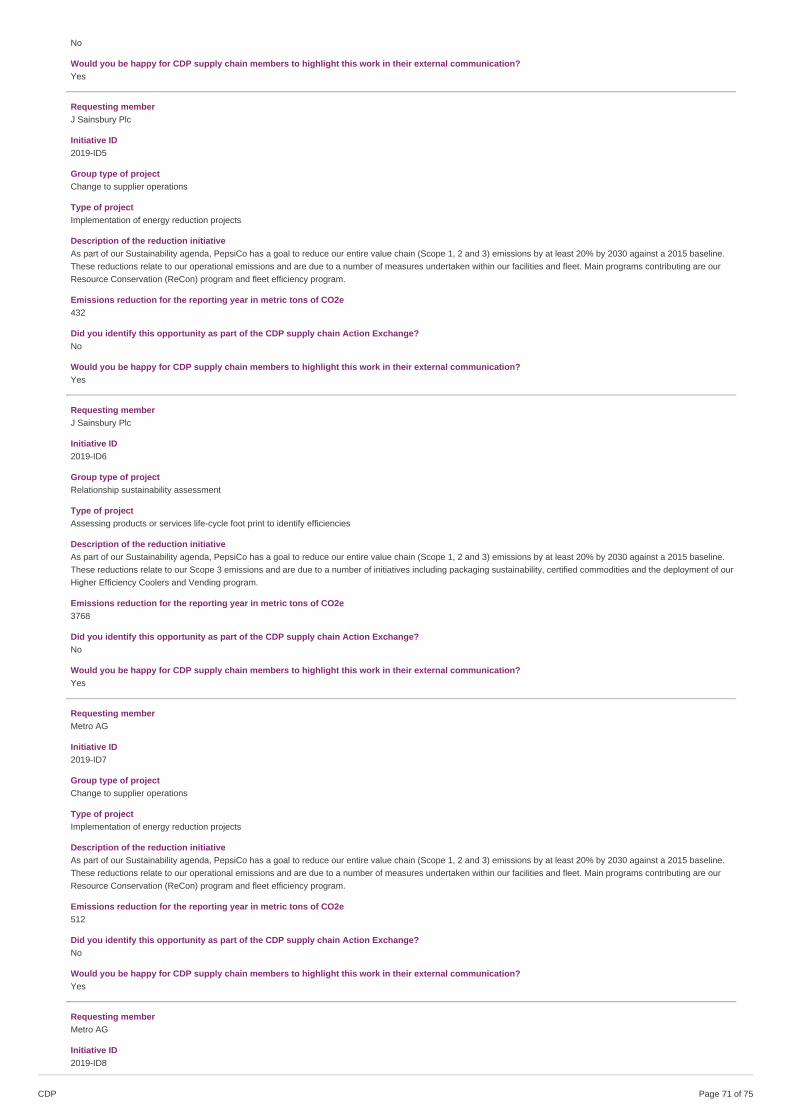
No
Would you be happy for CDP supply chain members to highlight this work in their external communication?Yes
Requesting memberJ Sainsbury Plc
Initiative ID2019-ID5
Group type of projectChange to supplier operations
Type of projectImplementation of energy reduction projects
Description of the reduction initiativeAs part of our Sustainability agenda, PepsiCo has a goal to reduce our entire value chain (Scope 1, 2 and 3) emissions by at least 20% by 2030 against a 2015 baseline.These reductions relate to our operational emissions and are due to a number of measures undertaken within our facilities and fleet. Main programs contributing are ourResource Conservation (ReCon) program and fleet efficiency program.
Emissions reduction for the reporting year in metric tons of CO2e432
Did you identify this opportunity as part of the CDP supply chain Action Exchange?No
Would you be happy for CDP supply chain members to highlight this work in their external communication?Yes
Requesting memberJ Sainsbury Plc
Initiative ID2019-ID6
Group type of projectRelationship sustainability assessment
Type of projectAssessing products or services life-cycle foot print to identify efficiencies
Description of the reduction initiativeAs part of our Sustainability agenda, PepsiCo has a goal to reduce our entire value chain (Scope 1, 2 and 3) emissions by at least 20% by 2030 against a 2015 baseline.These reductions relate to our Scope 3 emissions and are due to a number of initiatives including packaging sustainability, certified commodities and the deployment of ourHigher Efficiency Coolers and Vending program.
Emissions reduction for the reporting year in metric tons of CO2e3768
Did you identify this opportunity as part of the CDP supply chain Action Exchange?No
Would you be happy for CDP supply chain members to highlight this work in their external communication?Yes
Requesting memberMetro AG
Initiative ID2019-ID7
Group type of projectChange to supplier operations
Type of projectImplementation of energy reduction projects
Description of the reduction initiativeAs part of our Sustainability agenda, PepsiCo has a goal to reduce our entire value chain (Scope 1, 2 and 3) emissions by at least 20% by 2030 against a 2015 baseline.These reductions relate to our operational emissions and are due to a number of measures undertaken within our facilities and fleet. Main programs contributing are ourResource Conservation (ReCon) program and fleet efficiency program.
Emissions reduction for the reporting year in metric tons of CO2e512
Did you identify this opportunity as part of the CDP supply chain Action Exchange?No
Would you be happy for CDP supply chain members to highlight this work in their external communication?Yes
Requesting memberMetro AG
Initiative ID2019-ID8
CDP Page of 7571
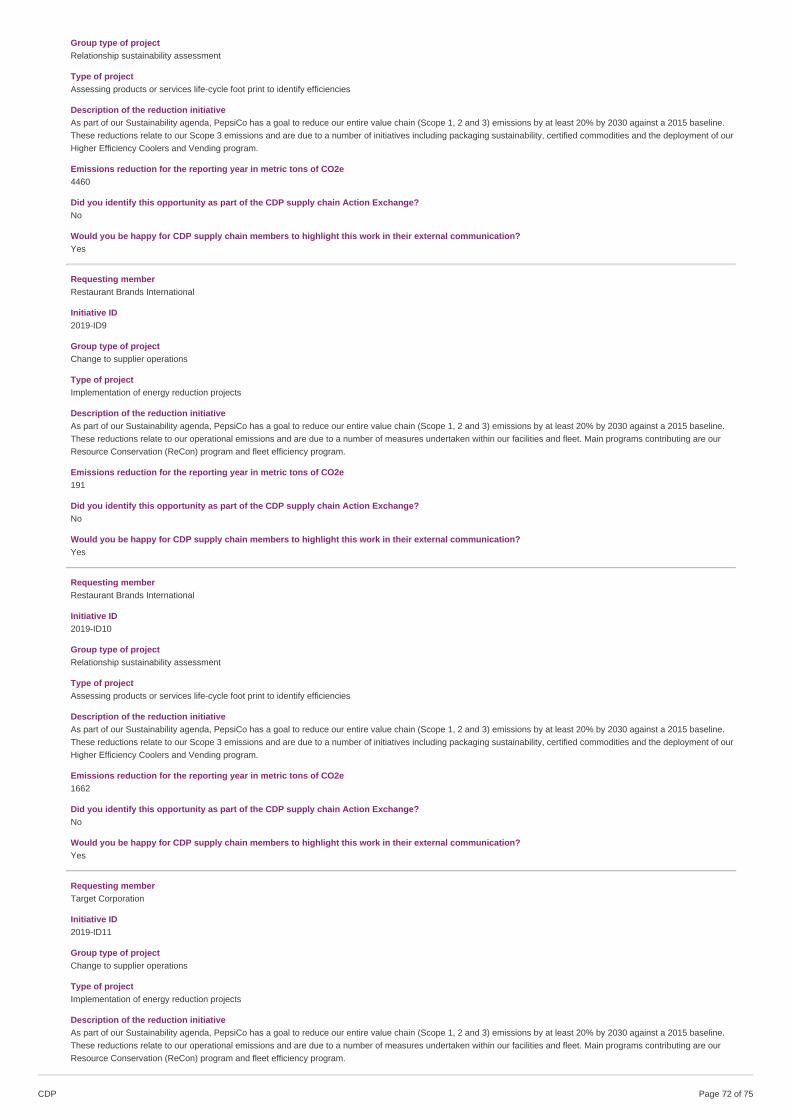
Group type of projectRelationship sustainability assessment
Type of projectAssessing products or services life-cycle foot print to identify efficiencies
Description of the reduction initiativeAs part of our Sustainability agenda, PepsiCo has a goal to reduce our entire value chain (Scope 1, 2 and 3) emissions by at least 20% by 2030 against a 2015 baseline.These reductions relate to our Scope 3 emissions and are due to a number of initiatives including packaging sustainability, certified commodities and the deployment of ourHigher Efficiency Coolers and Vending program.
Emissions reduction for the reporting year in metric tons of CO2e4460
Did you identify this opportunity as part of the CDP supply chain Action Exchange?No
Would you be happy for CDP supply chain members to highlight this work in their external communication?Yes
Requesting memberRestaurant Brands International
Initiative ID2019-ID9
Group type of projectChange to supplier operations
Type of projectImplementation of energy reduction projects
Description of the reduction initiativeAs part of our Sustainability agenda, PepsiCo has a goal to reduce our entire value chain (Scope 1, 2 and 3) emissions by at least 20% by 2030 against a 2015 baseline.These reductions relate to our operational emissions and are due to a number of measures undertaken within our facilities and fleet. Main programs contributing are ourResource Conservation (ReCon) program and fleet efficiency program.
Emissions reduction for the reporting year in metric tons of CO2e191
Did you identify this opportunity as part of the CDP supply chain Action Exchange?No
Would you be happy for CDP supply chain members to highlight this work in their external communication?Yes
Requesting memberRestaurant Brands International
Initiative ID2019-ID10
Group type of projectRelationship sustainability assessment
Type of projectAssessing products or services life-cycle foot print to identify efficiencies
Description of the reduction initiativeAs part of our Sustainability agenda, PepsiCo has a goal to reduce our entire value chain (Scope 1, 2 and 3) emissions by at least 20% by 2030 against a 2015 baseline.These reductions relate to our Scope 3 emissions and are due to a number of initiatives including packaging sustainability, certified commodities and the deployment of ourHigher Efficiency Coolers and Vending program.
Emissions reduction for the reporting year in metric tons of CO2e1662
Did you identify this opportunity as part of the CDP supply chain Action Exchange?No
Would you be happy for CDP supply chain members to highlight this work in their external communication?Yes
Requesting memberTarget Corporation
Initiative ID2019-ID11
Group type of projectChange to supplier operations
Type of projectImplementation of energy reduction projects
Description of the reduction initiativeAs part of our Sustainability agenda, PepsiCo has a goal to reduce our entire value chain (Scope 1, 2 and 3) emissions by at least 20% by 2030 against a 2015 baseline.These reductions relate to our operational emissions and are due to a number of measures undertaken within our facilities and fleet. Main programs contributing are ourResource Conservation (ReCon) program and fleet efficiency program.
CDP Page of 7572
Emissions reduction for the reporting year in metric tons of CO2e1422
Did you identify this opportunity as part of the CDP supply chain Action Exchange?No
Would you be happy for CDP supply chain members to highlight this work in their external communication?Yes
Requesting memberTarget Corporation
Initiative ID2019-ID12
Group type of projectRelationship sustainability assessment
Type of projectAssessing products or services life-cycle foot print to identify efficiencies
Description of the reduction initiativeAs part of our Sustainability agenda, PepsiCo has a goal to reduce our entire value chain (Scope 1, 2 and 3) emissions by at least 20% by 2030 against a 2015 baseline.These reductions relate to our Scope 3 emissions and are due to a number of initiatives including packaging sustainability, certified commodities and the deployment of ourHigher Efficiency Coolers and Vending program.
Emissions reduction for the reporting year in metric tons of CO2e12387
Did you identify this opportunity as part of the CDP supply chain Action Exchange?No
Would you be happy for CDP supply chain members to highlight this work in their external communication?Yes
Requesting memberWal Mart de Mexico
Initiative ID2019-ID13
Group type of projectChange to supplier operations
Type of projectImplementation of energy reduction projects
Description of the reduction initiativeAs part of our Sustainability agenda, PepsiCo has a goal to reduce our entire value chain (Scope 1, 2 and 3) emissions by at least 20% by 2030 against a 2015 baseline.These reductions relate to our operational emissions and are due to a number of measures undertaken within our facilities and fleet. Main programs contributing are ourResource Conservation (ReCon) program and fleet efficiency program.
Emissions reduction for the reporting year in metric tons of CO2e963
Did you identify this opportunity as part of the CDP supply chain Action Exchange?No
Would you be happy for CDP supply chain members to highlight this work in their external communication?Yes
Requesting memberWal Mart de Mexico
Initiative ID2019-ID14
Group type of projectRelationship sustainability assessment
Type of projectAssessing products or services life-cycle foot print to identify efficiencies
Description of the reduction initiativeAs part of our Sustainability agenda, PepsiCo has a goal to reduce our entire value chain (Scope 1, 2 and 3) emissions by at least 20% by 2030 against a 2015 baseline.These reductions relate to our Scope 3 emissions and are due to a number of initiatives including packaging sustainability, certified commodities and the deployment of ourHigher Efficiency Coolers and Vending program.
Emissions reduction for the reporting year in metric tons of CO2e8391
Did you identify this opportunity as part of the CDP supply chain Action Exchange?No
Would you be happy for CDP supply chain members to highlight this work in their external communication?Yes
Requesting member
CDP Page of 7573
Walmart, Inc.
Initiative ID2019-ID15
Group type of projectChange to supplier operations
Type of projectImplementation of energy reduction projects
Description of the reduction initiativeAs part of our Sustainability agenda, PepsiCo has a goal to reduce our entire value chain (Scope 1, 2 and 3) emissions by at least 20% by 2030 against a 2015 baseline.These reductions relate to our operational emissions and are due to a number of measures undertaken within our facilities and fleet. Main programs contributing are ourResource Conservation (ReCon) program and fleet efficiency program.
Emissions reduction for the reporting year in metric tons of CO2e15092
Did you identify this opportunity as part of the CDP supply chain Action Exchange?No
Would you be happy for CDP supply chain members to highlight this work in their external communication?Yes
Requesting memberWalmart, Inc.
Initiative ID2019-ID16
Group type of projectRelationship sustainability assessment
Type of projectAssessing products or services life-cycle foot print to identify efficiencies
Description of the reduction initiativeAs part of our Sustainability agenda, PepsiCo has a goal to reduce our entire value chain (Scope 1, 2 and 3) emissions by at least 20% by 2030 against a 2015 baseline.These reductions relate to our Scope 3 emissions and are due to a number of initiatives including packaging sustainability, certified commodities and the deployment of ourHigher Efficiency Coolers and Vending program.
Emissions reduction for the reporting year in metric tons of CO2e131486
Did you identify this opportunity as part of the CDP supply chain Action Exchange?No
Would you be happy for CDP supply chain members to highlight this work in their external communication?Yes
SC3.1
(SC3.1) Do you want to enroll in the 2020-2021 CDP Action Exchange initiative?No
SC3.2
(SC3.2) Is your company a participating supplier in CDP’s 2019-2020 Action Exchange initiative?No
SC4.1
(SC4.1) Are you providing product level data for your organization’s goods or services?No, I am not providing data
Submit your response
In which language are you submitting your response?English
CDP Page of 7574

Please confirm how your response should be handled by CDP
I am submitting to Public or Non-Public Submission Are you ready to submit the additional Supply Chain Questions?
I am submitting my response InvestorsCustomers
Public Yes, submit Supply Chain Questions now
Please confirm belowI have read and accept the applicable Terms
CDP Page of 7575