Embed Size (px)
Citation preview

PERCEIVED EFFECT OF TOTAL QUALITY
MANAGEMENT ON THE RELATIONSHIP BETWEEN
GENERIC STRATEGIES AND PERFORMANCE OF
KENYAN MANUFACTURING FIRMS
LUCY SIMANI WAMALWA
DOCTOR OF PHILOSOPHY
(Business Administration)
JOMO KENYATTA UNIVERSITY OF
AGRICULTURE AND TECHNOLOGY
2018

i
Perceived Effect of Total Quality Management on the Relationship
between Generic Strategies and performance of Kenyan
manufacturing firms
Lucy Simani Wamalwa
A Thesis Submitted in Partial Fulfilment for the Degree of Doctor
of Philosophy in Business Administration in the Jomo Kenyatta
University of Agriculture and Technology
2018

ii
DECLARATION
This thesis is my original work and has not been presented for a degree in any other
University
Signature………………………………….. Date ……………………………….
Lucy Simani Wamalwa
This thesis has been submitted for examination with our approval as University
Supervisors
Signature………………………………….. Date ……………………………….
Prof. Margaret A. Oloko, PhD
JKUAT, Kenya
Signature………………………………….. Date ……………………………….
Dr. Edward Owino, PhD
KCA, Kenya

iii
DEDICATION
To all my children, always remember nothing is impossible with a willing heart.
May you always be happy?

iv
ACKNOWLEDGMENTS
First and foremost, I would like to thank our almighty God for his love, grace and
protection throughout my studies. May His name be glorified.
The preparation of this thesis would not have been possible without the valuable
contribution and support received from my supervisors; Prof. Margaret A. Oloko and
Dr. Edward Owino for the support they provided during thesis preparation. Thanks
for your inspiration and endless support. I would also like to extend my appreciation
to all my lecturers (JKUAT, COHRED-NCBD) for their contribution towards my
academic development. I would also like to thank all those who played a major role
during my studies individually. My thoughts of thanks must first go to my late
mother Anne who started me off the academic journey and my sister Patricia who
has always been a pillar in my life. To my beloved son Joseph, you are my joy and
you motivated me to work hard.
To all of you, thank you very much.
v
TABLE OF CONTENTS
DECLARATION ...................................................................................................... ii
DEDICATION ......................................................................................................... iii
ACKNOWLEDGMENTS ...................................................................................... iv
TABLE OF CONTENTS ......................................................................................... v
LIST OF TABLES ................................................................................................ xiii
LIST OF FIGURE ................................................................................................ xvi
LIST OF APPENDICES .................................................................................... xviii
ABBREVIATIONS AND ACRONYMS ............................................................. xix
OPERATIONAL DEFINITION OF TERMS .................................................... xxi
ABSTRACT ......................................................................................................... xxiii
CHAPTER ONE ...................................................................................................... 1
INTRODUCTION .................................................................................................... 1
1.1 Background of the study .....................................................................................................1
1.1.1 Generic Strategies ............................................................................................................2
1.1.2 Total Quality Management ..............................................................................................3
1.1.3 Organization Performance ...............................................................................................4
1.1.4 Global Overview of the Manufacturing Industry .............................................................5
1.1.5 Regional Overview of the Manufacturing Industry .........................................................6
1.1.6 Overview of manufacturing industry in Kenya ................................................................7

vi
1.2 Statement of the Problem ....................................................................................................8
1.3 Research objectives .............................................................................................................9
1.3.1 General objective .............................................................................................................9
1.3.2 Specific objectives ...........................................................................................................9
1.3.3 Research Hypothesis ......................................................................................................10
1.4 Significance of the study ...................................................................................................10
1.5 Scope of the study .............................................................................................................11
1.6 The Delimitations of the Study .........................................................................................11
CHAPTER TWO ................................................................................................... 12
LITERATURE REVIEW ...................................................................................... 12
2.1. Introduction ......................................................................................................................12
2.2 Theoretical Framework .....................................................................................................12
2.2.1 Knowledge Based Theory of the Firm ...........................................................................12
2.2.3 The Resource Based View Theory .................................................................................14
2.2.4 Dynamic Capabilities Theory ........................................................................................15
2.2.5 System Theory ...............................................................................................................17
2.3 Conceptual framework ......................................................................................................18
2.3.1 Generic strategies ...........................................................................................................20
2.3.2 Total Quality Management Practices .............................................................................21
2.3.4 Organization Performance .............................................................................................23
vii
2.4 Empirical Review ..............................................................................................................24
2.4.1 Generic strategies ...........................................................................................................24
2.4.2 Cost Leadership Strategy ...............................................................................................26
2.4.3 Differentiation Strategy .................................................................................................27
2.4.4 Market Focus strategy ....................................................................................................28
2.4.1 Total Quality Management, Generic Strategies and Firm’s Performance .....................30
2.4.2 TQM, Cost Leadership Strategy and Firm’s Performance .............................................30
2.4.3 TQM, Market Focus Strategy and Firm’s Performance .................................................32
2.4.4 TQM, Differentiation Strategy and Firm’s Strategy ...............................................34
2.6 Critical Review .................................................................................................................35
2.6.1 Summary of Knowledge gaps ........................................................................................37
2.7 Research Gap ....................................................................................................................39
2.8 Summary ...........................................................................................................................40
CHAPTER THREE ............................................................................................... 42
RESEARCH METHODOLOGY ......................................................................... 42
3.1 Introduction .......................................................................................................................42
3.2 Research Philosophy .........................................................................................................42
3.3 Research Design ................................................................................................................43
3.4 Target population ..............................................................................................................44
3.5 Sampling Frame ................................................................................................................44

viii
3.6 Sample Size and Sampling Technique ..............................................................................44
3.7 Data collection Instruments ..............................................................................................45
3.8 Data Collection Procedure ................................................................................................46
3.9 Pilot test ............................................................................................................................47
3.9.1 Validity of data collection Instruments ..........................................................................47
3.9.2 Reliability of data collection Instruments ......................................................................48
3.10 Factor Analysis ...............................................................................................................48
3.11 Data Processing and Analysis .........................................................................................49
3.12 Model specification .........................................................................................................50
3.13 Diagnostics Tests ............................................................................................................52
CHAPTER FOUR .................................................................................................. 54
RESEARCH FINDINGS AND DISCUSSION .................................................... 54
4.1 Introduction .......................................................................................................................54
4.1.1 Response rate .................................................................................................................54
4.2 Testing the assumptions of the study variables .................................................................55
4.2.1 Test of Normality ...........................................................................................................55
4.2.2 Test for Outliers .............................................................................................................55
4.2.3 Heteroscedasticity ..........................................................................................................56
4.2.4 Multicollinearity ............................................................................................................56
4.2.5 Common Method Bias ...................................................................................................58

ix
4.2.6 Convergent validity and discriminant validity. ..............................................................59
4.2.7 Reliability results ...........................................................................................................60
4.3 Biodata of the Respondents ..............................................................................................61
4.3.1 Gender ............................................................................................................................61
4.3.2 Work experience ............................................................................................................62
4.3.3 Highest level of Educational of the respondents ............................................................62
4.3.4 The number of competitors the organization faced ........................................................63
4.4 Descriptive analysis ..........................................................................................................64
4.4.2 Differentiation Strategy and Organization Performance ................................................65
4.4.3 Focus Strategy and Firm’s Performance ........................................................................67
4.4.4 Competitive Strategies Adopted ....................................................................................68
4.4.5 Total Quality Management ............................................................................................69
4.4.6 Financial Performance ...................................................................................................70
4.4.7 Customer Satisfaction ....................................................................................................71
4.4.8 Internal Process Improvement .......................................................................................73
4.4.7.4 Learning and Growth ..................................................................................................74
4.5 Factor Analysis .................................................................................................................75
4.5.1 Confirmatory Measurement Model ................................................................................76
4.5.2 Exploratory Factor Analysis ..........................................................................................76
34.5.3 Factor Analysis for Independent Variable ...................................................................77

x
4.5.4 Factor Analysis for Cost Leadership Strategy ...............................................................77
4.5.5 Factor Analysis for Differentiation Strategy ..................................................................78
4.5.6 Factor analysis for Focus strategy ..................................................................................80
4.5.7 Factor Analysis for Mediating Variable Total quality management ..............................81
4.5.8 Factor analysis for Dependent Variables .......................................................................82
4.5.9 Factor analysis for Financial Performance .....................................................................82
4.5.10 Factor analysis for Customer Satisfaction....................................................................83
4.5.11 Factor analysis for Internal Process Improvement .......................................................83
4.5.12 Factor Analysis for Learning and growth ....................................................................85
4.5.13 Communalities of Factors ............................................................................................86
4.6 Confirmatory Factor Analysis ...........................................................................................86
4.7 Hypothesis testing .............................................................................................................87
4.7.1 Confirmatory Structural Models and Hypothesis Testing of Study Variables ...............87
4.8 TQM on the relationship between Cost Leadership Strategy and Organization
Performance ............................................................................................................................89
4.8.1 TQM effects on Cost Leadership strategy and Financial performance. .........................90
4.8.2 TQM, Cost Leadership Strategy and Customer Satisfaction performance ....................94
4.8.3 TQM practice on Cost Leadership Strategy and Internal Process Performance. ...........97
4.8.4 TQM, Cost Leadership Strategy and Organization Learning and Growth ..................100
4.8.5 TQM, Cost Leadership Strategy, Overall Organization Performance .........................103
4.9 TQM practice on Differentiation Strategy and Organization Performance. ...................106

xi
4.9.1 TQM practice on Differentiation Strategy and Financial performance. ......................107
4.9.2 TQM practice on Differentiation Strategy and Customer Satisfaction. .......................110
4.9.3 TQM practice on Differentiation Strategy and Internal Process Performance ............114
4.9.4 TQM practice on Differentiation Strategy and Organization Learning and Growth ...117
4.9.5 TQM, Differentiation Strategy and Overall Performance ............................................120
4.10. TQM practice on Focus Strategy and Organization Performance. ..............................124
4.10.1 TQM practice on Focus Strategy and Financial performance....................................125
4.10.2 TQM practice on Focus Strategy and Customer Satisfaction ....................................128
4.10.3 TQM practice on Focus Strategy and Internal Process Performance .........................131
4.10.4 TQM; Focus Strategy and Organization Learning and Growth. ................................134
4.10.5 TQM; Focus Strategy and Overall Performance of the Organization. .......................137
4.11 TQM, Generic Strategies and Organization Performance ............................................141
4.11.1 TQM, Generic Strategies and Financial performance ................................................142
4.11.2 TQM practice on Generic Strategies and Customer Satisfaction. ..............................145
4.11.3 TQM on Generic Strategies and Internal Process Management ................................148
4.11.4 TQM, Generic Strategies and Learning and Growth .................................................152
4.11.5 TQM practice on Generic Strategies and Organization Performance ........................155
CHAPTER FIVE .................................................................................................. 161
SUMMARY, CONCLUSION AND RECOMMENDATION .......................... 161
5.1 Introduction .....................................................................................................................161

xii
5.2 Summary of Findings ......................................................................................................161
5.2.1 TQM practice on the relationship between Cost Leadership Strategy and Organization
Performance ..........................................................................................................................161
5.2.2 To determine the Mediating effect of TQM practice on the Relationship between
Differentiation Strategy and Organization Performance.......................................................162
5.2.3 To examine the Mediating effect of TQM practice on the Relationship between Focus
Strategy and Organization Performance ...............................................................................162
5.2.4 To establish the Mediating Effect of TQM practice on the Relationship between
Generic Strategies and Organization Performance. ..............................................................163
5.3 Conclusions .....................................................................................................................163
5.3.1 TQM, Cost Leadership Strategy and Organization Performance ................................163
5.3.2 TQM, differentiation Strategy and Organization Performance ....................................164
5.3.3 TQM, Focus Strategy and Organization Performance .................................................164
5.3.4 TQM, generic Strategy and Organization Performance ...............................................164
5.4 Recommendations ...........................................................................................................165
5.5 Suggestions for Further Studies ......................................................................................166
REFERENCES ..................................................................................................... 168
APPENDICES ...................................................................................................... 195
xiii
LIST OF TABLES
Table 2.1: Summary of Knowledge Gaps ................................................................. 37
Table 4.1: Response Rate .......................................................................................... 54
Table 4.2: Heteroscedasticity .................................................................................... 56
Table 4.3: Coefficient for tolerance and variance of inflation factor test ................. 57
Table 4.4: Convergent validity and Discriminant validity ........................................ 60
Table 4.5: Cronbach alpha Reliability results ........................................................... 61
Table 4.6: Work Experience...................................................................................... 62
Table 4.7: Highest level of Education of the Respondents ....................................... 63
Table 4.8: The number of competitors the organization faced ................................. 63
Table 4.9: Cost Leadership Strategy ......................................................................... 64
Table 4.10: Differentiation Strategy.......................................................................... 66
Table 4.11: Focus Strategy ........................................................................................ 67
Table 4.12: Total Quality Management .................................................................... 69
Table 4.13: Financial Performance ........................................................................... 70
Table 4.14: Customer Satisfaction ............................................................................ 72
Table 4.15: Internal process improvement ................................................................ 73
Table 4.16: Learning and growth .............................................................................. 74
Table 4.17: KMO and Barlett Test ............................................................................ 77

xiv
Table 4.18: Factor Analysis for Cost Leadership Strategy ....................................... 78
Table 4.19: Factor analysis for differentiation strategy ............................................ 79
Table 4.20: Factor Analysis for Focus strategy ........................................................ 80
Table 4.21: Factor Analysis for Total Quality Management .................................... 81
Table 4.22: Factor analysis for Financial performance ............................................. 82
Table 4.23: Factor Analysis for Customer Satisfaction ............................................ 83
Table 4.24: Factor analysis for Internal Process Performance .................................. 84
Table 4.25: Factor analysis for organization learning and growth ............................ 85
Table 4.26: Model Fit Statistics TQM, Cost leadership and Organization
performance ........................................................................................ 90
Table 4.27: Cost leadership strategy on TQM and financial performance ............... 91
Table 4.28: Cost leadership strategy, TQM and customer satisfaction performance 95
Table 4.29: Cost leadership strategy on TQM and internal process performance .... 98
Table 4.30: Cost leadership, TQM and organization learning and growth
performance ...................................................................................... 101
Table 4.31: Cost leadership strategy on TQM and overall performance ................ 104
Table 4.32: Model Fit Statistics TQM, differentiation and Organization performance
.......................................................................................................... 107
Table 4.33: Differentiation strategy on TQM and financial performance .............. 108
Table 4.34: Differentiation strategy, TQM and customer satisfaction performance
.......................................................................................................... 112

xv
Table 4.35: Differentiation strategy, TQM and internal process performance ....... 115
Table 4.36: Differentiation, TQM and organization learning and growth performance
.......................................................................................................... 118
Table 4.37: Differentiation strategy on TQM and overall performance ................. 121
Table 4.38: Model Fit Statistics TQM, Focus strategy and Organization performance
.......................................................................................................... 125
Table 4.39: Focus strategy, TQM and financial performance ................................. 127
Table 4.40: Focus strategy; TQM and customer satisfaction performance............. 130
Table 4.41: Focus strategy on TQM and internal process performance ................. 132
Table 4.42: Focus strategy; TQM and learning and growth performance .............. 135
Table 4.43: Focus strategy on TQM and overall performance ............................... 138
Table 4.44: Model Fit Statistics TQM, Generic strategies and Organization
performance ...................................................................................... 142
Table 4.45: Generic strategies; TQM and financial performance ........................... 143
Table 4.46: Generic strategies on TQM and customer satisfaction performance ... 146
Table 4.47: Generic Strategies on TQM and Internal Process Performance .......... 149
Table 4.48: Generic Strategies; TQM and Learning and Growth ........................... 153
Table 4.49: Generic strategies on Overall performance .......................................... 157
Table 4.50: Generic strategies on TQM .................................................................. 158
Table 4.51: Generic strategies on TQM and overall performance .......................... 159

xvi
LIST OF FIGURE
Figure 2.1: Conceptual Frame Work......................................................................... 19
Figure 4.1: Common Bias Method ............................................................................ 59
Figure 4.2: Confirmatory Factor Analysis ................................................................ 87
Figure 4.3: Cost Leadership Strategy, TQM, Financial Performance ...................... 92
Figure 4.4: Cost Leadership Strategy, TQM, Customer Satisfaction ....................... 95
Figure 4.5: Cost Leadership Strategy, TQM, Internal Process Performance ............ 98
Figure 4.6: TQM On Cost Leadership Strategy; Organization Learning And Growth
.......................................................................................................... 101
Figure 4.7: Cost Leadership Strategy, TQM, Overall Performance ....................... 104
Figure 4.8: Differentiation Strategy, TQM And Financial Performance ................ 109
Figure 4.9: Differentiation Strategy, TQM And Customer Satisfaction ................. 112
Figure 4.10: Differentiation Strategy, TQM, Internal Process Performance .......... 116
Figure 4.11: Differentiation, TQM and Organization Learning And Growth
Performance. ..................................................................................... 119
Figure 4.12: Differentiation Strategy On TQM And Overall Performance ............ 122
Figure 4.13: Focus Strategy, TQM and Financial Performance ............................. 126
Figure 4.14: Focus Strategy, TQM and Customer Satisfaction Performance ......... 129
Figure 4.15: Focus Strategy on TQM and Internal Process Performance .............. 133
Figure 4.16: Focus Strategy, TQM And Learning and Growth Performance ......... 136

xvii
Figure 4.17: Focus Strategy On TQM and Overall Performance ........................... 139
Figure 4.18: Generic Strategies, TQM and Financial Performance ........................ 144
Figure 4.19: Generic Strategies On TQM and Customer Satisfaction Performance
.......................................................................................................... 147
Figure 4.20: Generic Strategies On TQM and Internal Process Performance ........ 150
Figure 4.21: Generic Strategies, TQM and Learning And Growth ........................ 153
Figure 4.22: Generic Strategies On Overall Performance ...................................... 156
Figure 4.23: Generic Strategies On TQM ............................................................... 157
Figure 4.24: Generic Strategies, TQM and Overall Performance........................... 159

xviii
LIST OF APPENDICES
Appendix I: Questionnaire ...................................................................................... 195
Appendix II: List Of Iso Certified Manufacturing Companies In Kenya............... 203
Appendix III: Correlations ..................................................................................... 205
Appendix IV: Tests Of Normalitya ......................................................................... 206
Appendix V: Mahalanobis Distance ....................................................................... 207
Appendix VI: Factor Analysis ................................................................................ 211
Appendix VII: Communalities Of Factors ............................................................. 215
xix
ABBREVIATIONS AND ACRONYMS
AGFI Adjusted Goodness of Fit Index
AMOS Analysis of Moment Structure
AVE Average Variance Extracted
CEO Chief Executive Officer
CMB Common method bias
CFA Confirmatory Factor Analysis
CFI Comparative Fit Index
DF Degree of Freedom
EAC East Africa Community
EFA Exploratory Factor Analysis
EFQM European Foundation for Quality Management.
GDP Gross domestic product
GFI Goodness of Fit Index
ILO International Labour Organization
ISO International Organization for Standardization
KAM Kenya Association of Manufacturers
KEBS Kenya Bureau of Standards
KNBS Kenya National Bureau of Statistics

xx
KPMG Klynveld Peat Marwick Goerdeler
NSE Nairobi Securities Exchange
OLS Ordinary Least Square
PA Path Analysis
PCA Principal Component Analysis.
RMSEA Root Mean Square of Approximation
RMSR Root Mean Square Residual
RoK Republic of Kenya
SEM Structural Equation Modelling
SPSS Statistical Package for Social Sciences
SSA Sub-Saharan Africa
TQM Total quality management
USA United States of America
VIF Variance Inflation Factor

xxi
OPERATIONAL DEFINITION OF TERMS
Strategy: is a plans by which a company sets out to achieve
its desired ends objectives (McKeown, 2015).
Competitive strategy: All moves and approaches that a firm has and is
taking to attract buyers, withstand competitive
pressure and improve its market position
(Thompson & Strickland, 2010)
Competitive advantage: The organization ability to deliver the same
benefits as competitors but at a lower cost or
deliver benefits that exceed those of competition
products (Wang, Lin & Chu,2011).
Porter’s Generic strategies: How a company pursues competitive advantage
across its chosen market scope; either through
lower cost, differentiation or focus strategy (Porter,
1980).
Cost leadership strategy: an integrated set of action taken to produce goods
or services with features that are acceptable to
customers at the lowest cost, relative to that of
competitors (Ireland, Hokisson & Hitt, 2011)
Differentiation: Is the ability of a firm to achieve competitive
advantage over its rivals because of the perceived
uniqueness of their products and services (Acquaah
& Ardekani, 2008).
Market Focus: Implies pursuing specific market segments through
overall cost leadership and /or differentiation as
opposed to engaging in the whole market, (Porter,
1980).
xxii
Total quality management: An action plan to produce and deliver commodities
or services which are consistent with customer
needs or requirements by better, cheaper, faster,
safer, easier processing than competitors with the
participation of all employees under top
management leadership (Lakhal, Pasin & Liman,
2006).

xxiii
ABSTRACT
The Kenya manufacturing industry contributes to 11% of the country GDP, 26% of
the merchandise exported and 12 % of formal employment. The manufacturing
industry in Kenya is faced with a number of challenges one of which is competition
from local firms as well as well-established multinationals. This necessitates the need
for the sector to implement a viable business strategy in order to improve its
competitiveness. Generic strategies are widely accepted both academically and
practically as sustainable competitive strategies and their influence on performance
have been critically examined in a wide range of business settings in countries
worldwide. TQM on the other hand establishes quality enhancement as a dominant
priority and one that is vital for long-term effectiveness and survival, it focuses on
increasing efficiency and improving processes, provides superior customer value and
meeting customer needs. The purpose of this study was to examine the effect of
TQM practices, on the relationship between generic strategies and organization
performance in the Kenyan manufacturing industry. Specifically, this study focused
on establishing the mediating effects of TQM practice on the relationship between
cost leadership strategies; differentiation strategies; markets focus strategy and
organization performance. The study adopted a descriptive research design. The
target population for the study was 39 ISO certified, manufacturing firms. The target
respondents were the CEO, strategic managers and Quality Assurance managers
from the 39 ISO certified manufacturing firms. A pilot test was conducted to assess
the questionnaire validity and reliability of the data. Structural equation modelling
(SEM) and multiple Regression analysis were used to analyse the relationships
between generic strategies, TQM and organization performance. The finding
indicated that TQM partially mediates the relationship between cost leadership
strategy and organization performance. The study established that the mediation
effects of TQM on the relationship between differentiation strategy and focus
strategy varied depending on the performance measure. TQM partially mediated the
relationship between differentiation strategy and both financial performance and
overall performance, it fully mediated the relationship between differentiation
strategy and the following performance measures customer satisfaction, internal
process performance and organization learning and growth. The study also
established that TQM fully mediates the relationship between focus strategy and the
following performance measures; financial performance; Customer satisfaction and
overall performance of the organization however it partially mediates the relationship
between focus strategy and internal process performance and organization learning
and growth. Lastly the study established that TQM partially mediated the
relationship between generic strategies and financial performance; customer
satisfaction; internal process performance; organization learning and growth and the
overall performance. The study is important to managers it enables them to
understand the role that different TQM practices play on various generic strategies
this enables them in making strategic decision concerning TQM and generic strategy
implementation and choice. The study recommends that manufacturing firms should
be encouraged to integrate generic strategies with TQM practice, as TQM will enable
them to build processes that are responsive to the customer’s need, enable them
transform existing resources in to new capabilities and integrate their processes with

xxiv
those of their customers and suppliers. This will make the firms more competitive
hence enhancing economic development.
1
CHAPTER ONE
INTRODUCTION
This chapter gives an introduction to the study. The chapter comprises of the
following; background of the study; global, regional and country overview of the
manufacturing industry; statement of the problem; research objectives; research
hypothesis; justification of the study; the scope of the study and limitations of the
study.
1.1 Background of the study
One of the main questions in strategic management field is why some firms in the
same industry have systematically performed better than others (Crook, Bratton,
Street & Ketchen, 2006). Competitive strategy is basically concerned with the
patterns of decisions or choices that managers of firms make over which markets to
compete in and how the business can add more value for buyers in order to gain
more advantage than competitors. Generic strategies which are the focus of this
study have been widely accepted as one of the most important contributors to the
study of strategic behaviour in organization. According to Porter (1980) an
organization can generate competitive advantage and ostensibly maximize
performance either through cost-leadership, differentiation or market focus strategy.
Extant literature (Kisaka & Okibo, 2014; Arasa & Gathiji, 2014; Acquaah, 2011;
Acquaah & Agyapong 2015) supports the notion that each of these three generic
strategies influences firm’s performance in diverse contexts and they are therefore
highly implemented by firms that want to out compete their competitors.
The link between organization strategy, structure and performance is a classical
theme in strategic management; strategy follows structure and structure supports
strategy; strategy and structure are married to each other; organization structure
influences the performance of an organization strategy (Kavale, 2012). The
organization structure is affected by the extent to which Total Quality Management
is implemented within an organization (Yunis, Jung & Chen, 2013). TQM
establishes quality enhancement as a dominant priority and one that is vital for

2
long-term effectiveness and survival it focuses on increasing efficiency and
improving processes, provide superior customer value and meeting customer needs
(Munisu, 2013). Its factors significantly affect the firm’s performance with respect
to internal procedures, customers, market share, and the natural and social
environment (Zakuan, Yusof, Laosirihongthong & Shaharoun, 2010). Research has
shown that strategic benefits of TQM are increased market share, return on
investment and improvement in strategic performance (Zehir, Ertosun, Zehir &
Muceldilli, 2012).
1.1.1 Generic Strategies
Strategy is a set of decisions making rules for guidance of organization behaviour
that enables manager to attain competitive advantage over rivals. Porter (1980,
1985) introduced the concept of generic strategies namely differentiation, cost-
leadership and market focus strategies. He argued that the generic strategies of cost
leadership, differentiation and market focus represent different strategic
orientations available to a firm to compete in its industry. Firms that adapt these
orientations would acquire a competitive advantage that would enable them to
outperform industry competitors (Ghasemi, Abdi, Yaghmaei & Nemati, 2015).
Organizations that implement a differentiation strategy develop a competitive
advantage by creating a product or service that is unique or creates the perception in
the minds of customers that the firm or its products and services are superior to
those of its competitors and also possess characteristics that are distinctive from
those of its competitor’s. These perceptions are generated through design quality
and innovativeness (Acquaah, Adjei & Mensa-Bonsu, 2008).
Porter (1980) asserts that the cost leadership approach requires a vigorous pursuit of
cost reductions. Firms that implement cost leadership strategy focus on out
performing competitors through efficiency (Tansey, Spillane & Meng, 2014) by
controlling production costs, materials costs, supply costs and product distribution
costs. The third generic strategy, market focus is about concentrating on a particular
client, segment of the market, or geographical market. Porter (1980) acknowledged
that the focus strategy is built around serving a particular target very well. Within

3
its target market, the firm seeks to meet the needs of the customer better, resulting
in cost leadership through marketing and operating efficiencies or differentiation
from better services.
Porters (1980; 1985) generic strategies are have been widely accepted and adopted
as the dominant paradigm of strategy, research and practice (Newton, Gilinsky &
Jordan 2015; Tansey, Spillane & Meng, 2014). These include industries as diverse
as shipping (Niamié, & Germain, 2014); telecommunication industry (Arasa &
Gathiji, 2014); higher institution of learning (Kisaka & Okibo, 2014); wine industry
(Newton et al., 2015) and hospitality industry (Kaliappen & Hilman,2014) and
countries as diverse as Kenya ( Matunga & Minja, 2014); Ghana (Acquaah, Adjei
& Mensa-Bonsu, 2008); Iran (Faezi, 2014); USA (Zatzick, Moliterno &
Fang,2012); Romania (Bordean, Borza, Nistro & Mitra,2010); Argentina and Peru
(Parnell, 2011). Porter’s typology has also received more research attention than
any other typologies (Sumer & Bayraktar, 2012). It has been widely used by the
researchers studying relationships between firms’ competitive strategy and;
performance measurement (Jusoh & Parnel, 2008); innovation (Kaliappen &
Hilman, 2014); business capabilities (Acar & Zehir, 2010); Social networks
(Acquaah; 2011) and Marketing Capabilities (Acquaah & Agyapong, 2015) among
others.
The paradigm’s theoretical proposition has also attracted intense debate (Ozdemir &
Mecikoglu, 2016). Challengers (Salavou, 2013; Huang, 2011; Shinkle, Kriauciunas
& Hundley, 2013) to this typology argued that conditions which favour cost
leadership strategies were independent conditions that might favour differentiation
strategies. Others (Parnell 2013; Manev-Azorin & Claver-Cortés, 2009) argue that
combining elements of both generic competitive strategies, simultaneously lead to
better performance. However, this typology remains unchanged in strategic
management literature (Kotler & Armstrong, 2010; Pearce & Robinson, 2007).
1.1.2 Total Quality Management
Total quality management (TQM) has been widely accepted as a holistic
management philosophy that strives for continuous improvement in all functions of

4
an organization (Oakland, 2014). Quality refers to the ability of a product or service
to constantly meet or exceed customer expectations (Munisu, 2013). According to
Chaudary, Zafar and Salman (2015) TQM is a set of instruments employed by the
firm’s management that aim to provide better value to customers by recognising
their observable and hidden needs (which are sensitive to the changing markets)
and improve the efficiency of the procedure that generate the product or service.
TQM is a multidimensional construct that consists of several activities these
includes; leadership management, factual approach to decision making, process
management, supplier management, continuous improvement, employee
management, customer focus and system approach to management (Zehir et al.,
2012). Continuous commitment to TQM implementation has a significant positive
effect on superior firm performance (Lee & Lee, 2014; Wali & Boujelbene, 2010).
Previous studies have reported that Organizations that effectively implement TQM
generate many benefits such as higher quality products, more satisfied customers,
reduced costs, improved financial, quality and innovation performance and in
addition to these improved employee job satisfaction (Munisu, 2013).
1.1.3 Organization Performance
An organization is a voluntary association of productive assets, including human,
physical and capital resources for the purpose of achieving a shared purpose
(Elisiva & Sule, 2015). What constitutes an effective strategy depend on how one
measures performance (Cavalier, Ggaiardelli & Ierace, 2007; Pongatich & Johnson,
2008). Scholars (Van der Stede, Chow & Lin, 2006) have further suggested that
different measures are appropriate for different strategies. These measures include
effectiveness, efficiency, financial viability and relevance to stakeholders (Shisia,
Sang, Matoke & Omwario, 2014). According to Richard, Devinney, Yip and
Johnson (2009) organization performance should encompass three specific areas
financial performance, product market performance and shareholder return.
Kaplan and Norton (1992) introduced the balanced scorecard approach to measure
performance. Since then this framework has been adopted and applied by hundreds
of organizations worldwide (Awadallah & Allam, 2015). The balanced scorecard

5
integrates financial and non-financial based performance measures allowing the
manager to measure performance from several perspectives simultaneously. The
balanced scorecard metrics includes financial measures that tell the results of
actions already taken. It also comprises of three sets of operational measures having
to do with customer satisfaction, internal processes and the organization ability to
learn and improve the activities that drives future financial performance.
To measure organization performance, the study adopted the balance scorecard
performance metrics which stipulates financial metrics and non-financial metrics.
Financial metric remained the ultimate measure of a firm’s performance as it helped
to determine whether a firm’s strategy and execution are supporting the overall
mission of the firm (Madsen & Stenheim, 2014). The financial measures adopted
focused on profitability and cost reductions. Non-financial measures include;
Customer satisfaction under this measure the study focused on customer loyalty,
customer retention and customer acquisition. The study also measured the extend
which internal process have been improved. The main focus as recommended by
Bose and Thomas (2007) is on activities that enhance customer satisfaction;
innovation and learning; to improve the skills of employees. Learning and growth
perspective is particularly important for strategic management to identify, improve
and better the performance of intellectual capital and is critical to develop
innovative product design, product, distribution and promotion and to improve the
market value of an organization beyond the value of intangible asset base. Adapting
a balanced scorecard approach provides a holistic performance outlook that ensured
that the researcher focuses on the entire business process and both current business
activities and events contribute to customer values and to the long-term growth of
the organization (Awadallah & Allam, 2015).
1.1.4 Global Overview of the Manufacturing Industry
The impact of manufacturing industry on economic development is tremendous, a
strong and thriving manufacturing sector usually precipitate industrialisation
(KPMG, 2014). However, the world today is in a dynamic state of transition and
transformation moving towards an integration of a single global market, referred to

6
as a global village in which everyone is free to live, sell and buy; this
transformation process is referred to as globalization (Ali, Awidini & Adan, 2012).
Globalization has led to intense competition among manufacturing firms;
economies have been opened to both domestic and international competition
(Acquaah, Adjei & Mensa-Bonsu, 2008). The globalization of the marketplace and
the rapid improvement in high quality products and services has brought about high
levels of market pressure across the world forcing manufacturers to reconsider their
status in terms of quality cost and ability to deliver (Kibe & Wanjau, 2014).
As a result, most countries in emerging economies of Africa, Asia and Latin
American have embarked on transforming their economic and business
environment by implementing liberalization policies. The contents of the economic
liberalization policies in most African economies include privatization of state-
owned enterprises, removal of barriers to foreign trade in the form of import
controls and foreign exchange restrictions, removal of price controls and domestic
product subsidies, and monetary and banking reforms (Acquaah et al., 2008). This
has had a negative effect on the manufacturing firms in this country as it has
intensified competition in these countries.
1.1.5 Regional Overview of the Manufacturing Industry
African manufacturing industry is still in its infancy and is curtailed by a number of
shortcomings among this is competition. The manufacturing sector is widely
considered to be the ideal industry to drive African development; this is due to the
labour-intensive export-focused nature of the industry (KPMG, 2014). However,
the manufacturing sector in Sub-Saharan Africa (SSA) still plays a relatively small
role compared to other regions. According to Dinh, Palmade, Chandra and Cossar
(2012) report, manufacturing firms in Africa accounts for 13% of the GDP in SSA;
the sector accounts for only 25% of the exports in SSA lower than any other region.
In comparison to east and south Asian countries where manufacturing exports
account for roughly 75% of exports. This quantitative and qualitative difference
between developed world manufacturing sectors and most African manufacturing

7
sector illustrates that the sector need to progress before becoming globally
competitive (KPMG, 2014).
1.1.6 Overview of manufacturing industry in Kenya
The Kenya manufacturing industry contributes about 10.7 % of the country GDP
(KNBS, 2016). The sector accounted 26% of the merchandise exported; 12 % of
the total formal employment which is about 280, 0000 people (KNBS, 2015).
However regardless of this contribution vision 2030 stipulates that the sector should
account for 20% percent of the GDP (KNBS, 2015) achieving this goal requires
addressing underlying constrains that hinder faster growth. These include high
input cost, decline in investment portfolio for some activities, high credit costs and
stiff competition from imports. In an effort to spur growth in the sector, the
government continues to invest in both infrastructure developments projects and
cheap energy supply mainly in geothermal and wind energy aimed at improving
competitiveness of manufactured products in domestic and global markets (RoK,
2015).
Despite this the sector faces high competition; the survival rate of export
manufacturing firms is low. Particularly the first few years of entering export
markets, 65% of firms exit the export market by the second year of operation
(World Bank, 2014). Real growth rate in the sector was averaged 4.1% in 2006-
2013, lower than the average annual growth in the overall real GDP of 4.6% as a
result the manufacturing sector’s share in output has declined in recent years
hindering the country’s ability to became fully industrialized (KPMG, 2014). The
Kenyan manufacturing industry is dominated by food and consumer goods
processing; meat and fruit canning, wheat flour and maize milling, and sugar
refining are notable subsectors (KPMG, 2014). The country manufactures a range
of other goods including the following; chemicals, textiles, ceramics, shoes, beer
and soft drinks, cigarettes, soaps, metal products, batteries, plastics, cement,
aluminium, steel, glass, rubber, wood, cork, furniture and leather goods.

8
1.2 Statement of the Problem
The Kenyan manufacturing sector is faced with a number of challenges one of
which is competition (Chege, Ngui & Kimuyu, 2014). The manufacturing industry
must compete locally with imports from well-established multinational firms while
at the same time trying to have a competitive edge in the world (World Bank,
2016). The competitiveness of Kenya manufacturing exports has been slowly
declining; traditionally Kenya was the largest exporter of various manufactured
goods to the EAC currently its market share has declined from 9% in 2009 to 7% in
2013; Globally its market share has also been on the decline from 0.18% in 1980
down to 0.06% in 1994 and 0.02% in 2013 (World Bank, 2014).
Acar and Zehir (2010) emphasized on the need for an organization to implement a
viable business strategy in order to improve its competitiveness. Porter’s (1980)
Generic strategy model positive linkage to organization performance has been
widely documented over the past three decades (Parnell, 2011; Luoma, 2015;
Salavou, 2015). The model stipulates that an organization can attain superior
performance over others by either establishing cost leadership position or
differentiating its offering from those of its rivals, either of these approaches may
be accompanied by focusing efforts on a given market niche. Faezi (2014)
envisaged that generic strategies need to be complemented with TQM
implementation in order to provide sustenance and achieve high performance.
TQM has become an irrepressible, globally pervasive strategic force in today’s
business environment (Asif, Bruijin, Douglas & Fisscher, 2009). Organizations that
have implemented TQM practices consistently outperform organizations that have
not implemented TQM practices (Vanichchnchai & Igel, 2011; Akgün, Ince,
Imamoglu, Kekskin & Kocoglu, 2014). Studies have shown that TQM is positively
associated with performance outcome such as; Financial performance and
profitability (Chaudary, Zafar & Salman, 2015; Talib, Rahman, & Quresh, 2013);
customer satisfaction (Mehra & Ranganathan, 2008) and knowledge management
(Ooi, Cheah, Lin & Teh, 2012; Aboyassi, Alnsour & Alkloub, 2011).

9
The impact of TQM on strategic management research practices still remains
unclear and under examined (Nouri, 2013). Scholars (Nouri, 2013; Asif et al.,
2009) posit that TQM literature is pretty much divorced from the field of strategic
management. A number of researchers (Yunis,Jung & Chen,2013; Escrig-Tena,
Bou-Liusar, Beltr`an-Mart`in &Roga-Puig, 2011) have studied the impact of TQM
on business strategies performance as a driver to strategic choices; Jung, Wang and
Wu(2009) examined the relationship between TQM and business strategies in
international projects in USA; Zatzick, Moliterno and Fang (2012) explored how fit
organization strategic orientation relates to TQM implementation in USA; Prajogo
and Sohal (2006) studied the relationship between organization strategy, TQM and
organization performance in Australian firms; Revuelto-Taboada, Canet-Giner and
Balbastre-Benavent (2011) investigated the relationship between Quality tools and
techniques, EFQM experience and strategy formulation in Spanish service firms.
The primary focus of these studies has been on advanced economies. In Kenya,
related studies have been carried out by Awino, Muchara, Ogutu and Oeba (2012)
to find out the effect of Total Quality implementation on Horticulture Industry
Competitive advantage. Other studies (Karani & Okibo, 2012; Kibe & Wanjau,
2014) have focused on the effect of TQM on organization performance. The study
examined the mediating effect of TQM on the relationship between generic
strategies and organization performance in Kenyan manufacturing sector.
1.3 Research objectives
1.3.1 General objective
To examine the Mediating effect of TQM on relationship between generic
strategies and organization performance in Kenyan manufacturing sector.
1.3.2 Specific objectives
i) To establish the mediating effect of TQM practice on the relationship
between cost leadership strategy and organization performance.
ii) To determine the mediating effect of TQM practice on the relationship
between differentiation strategy and organization performance.
10
iii) To examine the mediating effect of TQM practice on the relationship between
focus strategy and organization performance.
iv) To examine the mediating effect of TQM practice on the combined effects of
generic strategies on organization performance.
1.3.3 Research Hypothesis
H01: TQM practice has no significant Mediating effect on the relationship
between cost leadership strategy and organization performance.
H02: TQM practice has no significant Mediating effect on the relationship
between differentiation strategy and organization performance.
H03: TQM practice has no significant Mediating effect on the relationship
between market focus strategy and organization performance.
H04: TQM practice has no significant Mediating effect on the combined effects
of generic strategies on organization performance.
1.4 Significance of the study
The study is significant to manufacturing firms. The business world today is
undergoing rapid transformation and is operating in a highly turbulent and dynamic
environment that calls for business to plan and anticipate any uncertain future by
crafting appropriate and sustainable response strategies. The management of
Kenyan manufacturing firms will gain a better understanding of competitive
strategies that are adopted by firms and the significance of implementing TQM
within their organization. The manufacturing firms can then implement TQM and
Generic strategies from a more informed position. The study is therefore
significance to the management of Kenyan manufacturing firms as they formulate
the most effective competitive strategies in order to cope with the ever changing
and fast-paced trends and demands of the business environment.

11
The study is significant to the government. The Growth targets for manufacturing
sector stated by the government in vision 2030 are ambitious and require rapidly
increasing investment levels, eventually reaching levels above 20% of the GDP
(RoK, 2015). Against the backdrop of these ambitious plans of the government the
manufacturing products face intense competition from imports from multinational
firms. The study will therefore facilitate policy formulation and implementation for
all working toward improving the competitiveness of the Kenyan manufactured
products.
The study is significant to academicians. The relationship between competitive
strategies organization performance has been studied by many researchers however
the Mediating effect of TQM on this relationship has remained unexplored among
the Kenyan manufacturing firms. This Research will as a result increase the body of
Knowledge. The findings can be used as a source of reference to other researchers.
In addition, it may stimulate further research in this area and as such form a basis of
good background for further researchers.
1.5 Scope of the study
The study examined the effect of TQM on the relationship between generic
strategies; cost leadership, differentiation, focus strategies and manufacturing firm’s
performance using a balance scorecard approach. The study it focused on
manufacturing firms that are ISO certified in Kenya. The period for conducting the
study was between November 2016 to October 2017.
1.6 The Delimitations of the Study
The study mainly focussed on the manufacturing firms and ignores firms in the
primary industry dealing with extraction of natural resources and service providers.
Despite the fact that this study focuses on manufacturing firms in Kenya. The study
is only limited to firms that are ISO certified, manufacturing firms that are not ISO
certified have been excluded in this study based on the researcher’s assumptions
that they may not be acquainted with TQM practice.

12
CHAPTER TWO
LITERATURE REVIEW
2.1. Introduction
This chapter reviews relevant literature on the effect of TQM on the relationship
between generic strategies and organization’s performance. The chapter develops
theoretical reviews, conceptual framework and empirical review that was used in the
study in regard to each variable in the study. The review further identifies research
gaps and areas recommended for further research
2.2 Theoretical Framework
Theoretical framework is a collection of interrelated concepts determining what
variables a researcher will measure and what statistical relationship the researcher
will be looking for. It provides a researcher with lens to view the world (Ngugi,
2013). This study was based on knowledge based theory; dynamic capability
theory; resource based view theory and systems theory.
2.2.1 Knowledge Based Theory of the Firm
This theory considers knowledge as the most strategically significant resource of
the firm, a firm’s competitive advantage depends upon what it knows and how it
uses what it knows and how fast it can create something new (Duran, Centinder &
Sahan, 2014). The capability to learn, or the ability to create and apply new
knowledge is considered a source of sustainable competitive advantage and
superior corporate performance (Islam, Low, Kim & Hasan, 2011). The aim of
knowledge management is to create a “learning organization” which evaluates,
stores, uses and commercializes expertise and authentic knowledge of the
employees in the organizations so as to create an organization more powerful and
valuable and more competitive than its competitors (Duran et al., 2014). TQM and
knowledge management constitute and interact in area of continuous improvement
and workforce empowerment. Enterprises that have implemented TQM practices

13
are better in the fields of obtaining knowledge from customers and employees
participation in dissemination of knowledge.
According to Hung, Lien, Fang and McLean (2010) one of TQM greatest benefits
is its emphasis on continuous improvement of business processes so that it can
improve organizations competitiveness, effectiveness and flexibility. To achieve
continuous improvement firms must promote organization learning to create
knowledge that can be utilized in future to improve business processes (Islam, et al,
2011). Hung et al. (2010) posited that Knowledge Management initiatives have an
indirect effect on innovation performance through TQM practice; by focusing on
meeting customers’ needs and encouraging organizations to continually identify
new customer’s needs and expectations. Thereby inducing organizations to
innovate, continually develop and introduce products that meet markets changing
needs.
TQM focus on top management support and employee involvement is also seen as
critical to successful knowledge management and sequentially organization
innovation. Organizations must be able to learn from past experiences, effectively
use knowledge, correct errors and apply this knowledge within organizations if they
are to change and adapt to continuously changing markets (Akgun, Ince, Imamoglu,
Kekskin & Kocoglu, 2014). When systems empower employees during quality
improvement initiatives, their knowledge and skills are applied more easily,
consequently these systems create opportunities for employees to disseminate their
knowledge throughout an organization. Organizations where all employees have
been equipped with the necessary and right type of information have a competition
advantages over its competitors (Han & Anantatmula, 2007).
Knowledge management has many benefits. Hooshyar (2010) considers Knowledge
management as a fundamental source of competitive that leads to costs reductions.
TQM practices such as customer focus, continuous process improvement, employee
empowerment and leadership; create mutual trust and knowledge sharing culture
among organization and leverage the impact of knowledge on organization
performance (Rasula, Vuksic & Stemberger, 2012). Jung, Wang and Wu (2009)

14
hypothesises that knowledge management leads to creativity and innovation hence
it further enhances product differentiation. Considering the relationship between
TQM and Knowledge management. This theory instigates the researcher’s second
and third hypothesis which states that; TQM practice has no significant Mediating
effect on the relationship between differentiation strategy and organization
performance; TQM practice has no significant Mediating on the relationship
between market focus strategy and organization performance.
2.2.3 The Resource Based View Theory
The resource-based theory developed by Penrose (1959) later expanded by
(Wernerfelt,1984; Barney, 1991; Conner, 1991) stipulates that in strategic
management the fundamental sources and drivers to the firms’ competitive
advantage and superior performance are mainly associated with the attributes of
their resources and capabilities which are valuable and costly to copy.
Organizational resources and systems have been conceptualized to be able to
significantly predict the level of competitive advantage (Ismail, Rose, Uli &
Abdullah, 2011). The resource-based theory builds its assumptions on the basis that
strategic resources are heterogeneously distributed across firms and immobile. A
firm is said to have a competitive advantage when it is implementing a value
creating strategy not simultaneously being implemented by any current or potential
competitors and when these competitors are unable to duplicate the benefits of this
strategy (Barney, 1991). Barney (1991), Collis and Montgomery (1995) offers a
series of five tests for valuable resources; inimitability (hard for competitors to
copy the resource); durability (how quickly does the resource depreciate);
Appropriability (who capture the value that the resource creates, company,
customers, supplies employees); substitutability (can a unique resource be trumped
by different resources) and competitive superiority (is the resource really better
relative to competitors).
Itami and Roehl (1987); Prahalad and Bettis (1986) and Prahalad and Hamel (1990)
are the most significant contributors to this theory. Itami and Roehl (1987) theory
of invisible assets suggests that invisible assets, for example information based
15
resources such as technology, customer trust, brand image, control of distribution,
Corporate culture, management skills are necessary for competitive advantage
because they are hard and time consuming to accumulate. Visible assets on the
other hand, must be present for business operations to take place, but it is invisible
assets that lead to competitive advantage.
According to Addae-Korankye (2013) TQM provides resources that are invisible
intangible and extremely difficult for a competitor to copy for example; a company
unique culture, transformational leaders, superior customer service hence it has a
long lasting competitive advantage. Silva, Gomes, Lages, and Pereira (2014),
conceptualized TQM as a set of integrated organizational resources that contribute
to achieving and sustaining competitive advantage. Based on the fact that TQM is a
unique strategic value creating resource that is inimitable and gives the firm a
sustainable competitive advantage. This theory Instigate the following research
hypothesis; TQM practice has a significant Mediating effect on the relationship
between differentiation strategy and organization performance.
2.2.4 Dynamic Capabilities Theory
Yusr, Othmanand and Mokhtar (2012) defined dynamic capabilities theory as the
total competences/capabilities enabling a firm to come up with novel products and
processes and to respond to the dynamic market situation. Wang and Ahmed (2007)
defined dynamic capabilities as a firm’s behavioural orientation to constantly
integrate, reconfigure, renew and recreate its resources and most important upgrade
and reconstruct its core capabilities in response to the changing environment to
attain and sustain competitive advantage. Dynamic capabilities theory posits that
the most significant and enduring source of competitive advantage, rather than
being located in the simple possession of idiosyncratic resource is constituted by
the capability of firm to acquire, integrate and deploy resources in ways that match
each firm’s environment (Eisenhardt & Jeffrey, 2000). According to Kuei and Lu
(2013) business enterprises of all sizes are expected to build capabilities and
capacities to offer better and cheaper products, shorter response times and higher
service levels to meet customers demand.

16
Dynamic capabilities stresses on management capability and the unique
combination of resources throughout the functions such as research and
development, product and process development, manufacturing, human resource
and organization learning. Applying TQM in the organization provides a good
environment and conditions that lead to generate distinctive capabilities in different
aspects of the organization (Santos-vijande & Lez, 2007). Successful TQM
Implementation requires several practices leadership commitment, customer focus,
people management, process management, supplier management, and quality data
reporting. Implementing these practices lead to generate several capabilities within
the organization (Yusr, Othman & Mokhtar, 2012). For example leadership
commitment to achieve quality performance provides an environment that
encourages the trust and cooperation among employees which in turn, lead to
knowledge flow across the organization as a result the organization develops
innovation capabilities (Ju, Lin, Lin & Kuo, 2006); Customer focus orientation
support the organization with the necessary feedback regarding the customers’
attitudes, preferences and complaints, these information help the organization to
improve marketing capabilities (Ooi, Teh, Arumugam & Chong, 2008); and the
ability to consistently improve current processes and learn new ones is termed
continuous improvement capability ( Anand, Ward, Mohan & Schilling, 2009).
Continuous process improvement Capabilities are valuable because they give firm a
lower cost structure or basis of differentiation, (Porter, 1980).
TQM practices enable the organization to build marketing capabilities (Yusr et al.,
2012), innovation capabilities (Yusr, Mokhtar & Othman, 2014) and process
improvement capabilities (Silva, Gomes, Lages & Pereira, 2014). These capabilities
enhance the performance of generic strategies. This theory instigates the following
research hypothesis; TQM practice has no significant Mediating effect on the
relationship between differentiation strategy and organization performance; TQM
practice has no significant Mediating effect on the relationship between market
focus strategy and organization performance and lastly TQM practice has no
significant Mediating effect on the relationship between a generic strategies and
firm’s performance

17
2.2.5 System Theory
System thinking was developed in 1950 as an alternative to traditional management
thinking (Mingers & White, 2010). The system school views organizations as
complex interrelationship amongst input, throughput (process), output and
feedback. According to this theory an organization is an open and complex system
with varying degrees of process flexibility and many feedback loops which are used
adaptively by an organization for its survival. An organization as a complex system
is made up of activities or interrelated elements such as firms activities, policies,
structural elements and resources are seen to form of configurations. Some
activities in this system are core activities elements; they are tightly connected or
interact with other elements in the system. In this way, the system as a whole is
characterized by the connections or interactions of its core elements.
Siggelkow (2002) introduces the idea of elaborating elements or elements that are
added to the system to reinforce existing core elements. Each core element of an
organization may be supported overtime by a series of elaborating elements. A firm
with many organizational elements that reinforce each other is said to have a high
degree of internal fit (Siggelkow, 2001). When elaborate elements are
complementary with core elements or system as a whole these new elements
thicken connections in the system and drive tighter connections between them
enabling the organization to gain internal fit (Porter & Siggelkow, 2008). When
elements in the system achieve internal fit, high performance and sustainable
competitive advantage can accrue to the organization.
Zatzick et al. (2012) hypothesized TQM as an elaborating element when added to
an organization system; TQM reinforces the core elements over time enabling the
organization to achieve cost efficiency. When TQM is implemented the
organization engage only in a thickening process of its core elements this
eventually can lead to configurations with increasingly tighter interactions and high
internal fit (Siggelkow, 2002). When elements in the system achieve internal fit
high performance and sustainable competitive advantage can accrue to an
organization. The fit among the elements of an organization may be evidenced by

18
the degree to which strategy, structure and systems complement one another
leading to efficiency and higher performance. Visualizing strategy as core elements
within the organization and TQM as elaborate elements that enhances cost
efficiency (Zatzick et al., 2012) this theory prompts the development of the
following research hypothesis which states that; H01 :TQM practice has no
significant Mediating effect on the relationship between cost leadership strategy
and organization performance.
2.3 Conceptual framework
Mugenda (2008) defines conceptual framework as a concise description of the
phenomenon under study accompanied by graphical or visual depiction of the
major variable of the study. According to Young (2009), a conceptual framework is
a diagrammatical representation that shows the relationship between dependent and
independent variables. In this study the conceptual framework will look at the
Mediating effects of TQM and the relationship Between Generic strategies and
organization performance as proposed in the figure 2.1;

19
H01
H02
H03
Independent
variables
Mediating variable
Dependent
variable
Figure 2.1: Conceptual frame work
TQM Practice
Customer focus
Continuous process improvement
Supplier management
Leadership and human resource
management
Organization
performance
Customer
satisfaction
Financial
performance
Process
improvement
Organization
learning
&growth
Differentiation
strategy
Customer service
Marketing
activities
Products
development
Cost-leadership
strategy
Efficiency
Economies of scale
Supplier relations
Focus strategy
Customized
customer service
Market
segmentation
activities

20
2.3.1 Generic strategies
Porter (1980) generic competitive strategy posits that an organization can generate
competitive advantage and ostensibly maximize performance either through cost-
leadership, differentiation or a market focus strategy. These three generic strategies
were defined along two dimensions’ strategic scope and strategic strength. Strategic
scope is a demand-sided dimension and looked at the size and composition of the
target market while strategic strength is a supply-sided dimension and looks at the
strength of core competency of the firm.
The focus of firms implementing a cost leadership strategy is on stringent cost
control and efficiency in all areas of operations. A cost leadership strategy
emphasizes on creating competitive advantage through generating and maintaining
low-cost positions relative to competitors (Porter, 1980). This maintaining good
relationships with suppliers, organizing and managing its value adding activities so
as to produce a product (good or service) at lower cost than competitors; providing
a standard, no frills, and high volume product at the cheapest prices to customers;
favourable access to raw materials; accurate demand forecasting combined with
high capacity utilization; economies of scale; technological advantages; outsourcing
and learning /experience. As a result, the firm can keep prices low and attract a
market segment of the market interested in inexpensive products.
Differentiation strategy involves creating market positions that is perceived as
being unique industry wide and that is sustainable overlong run (Porter, 1980).In a
differentiation strategies emphasis is on creating value through uniqueness achieved
through services innovations, superior services, creative advertising, better
customer relationships, better product performance, design, brand image and
control of distribution channels leading to better services or in an almost unlimited
number of ways. Firms following a differentiation strategy appeals to a
sophisticated or knowledgeable consumer interested in a unique or quality product.
The uniqueness of differentiation strategy permits the organization to charge
premium prices for its products and/or services.

21
The firm can choose to focus on a selected customer group, product range
geographical or service line. Firms pursuing focus strategies have to be able to
identify their target market segment assess and meet the needs and desires of buyers
in the segment better than any other competitors (Porter, 1980). It is hoped that by
focusing its marketing efforts on one or two narrow market segments and tailoring
its marketing mix to these specialized markets the firm can meet the needs of the
target market better and become less vulnerable to competition from rivals or
substitute.
Salavou (2013) Huang (2011) Shinkle, Kriauciunas and Hundley (2013) argued that
conditions which favour cost leadership strategies were independent conditions that
might favour differentiation strategies. Others (Parnell, 2013; Manev-Azorin &
Claver-Cortés, 2009) argue that combining elements of both generic competitive
strategies, simultaneously lead to better performance. The study therefore
conceptualized that combining all three competitive strategies have an effect on
firm’s performance.
2.3.2 Total Quality Management Practices
TQM is an action plan to produce and deliver commodities or services which are
consistent with customer needs or requirements by better, cheaper, faster, safer,
easier processing than competitors with the participation of all employees under top
management leadership. TQM extends beyond the reconstruction of quality standard
techniques, it can be seen as system approach which is an integral part of
organization strategy aimed at people focused management featuring participation of
all firm members and a culture of cooperation to create value for all stakeholders.
TQM is employed by the firm’s management with aim of providing better value to
customers by recognising their observable and hidden needs and improving
efficiency of the procedures that generate the product or service. Before an
organization can benefit from TQM implementation some the following human
resources principles would have to be enshrined into the organization culture; this
including the following; Top management commitment; Organizational Leadership;
Employee empowerment, Education and training.

22
Another principle that will affects its performance is customer management
construct examines how the organization; builds relationships with customers;
determines customers’ requirements and expectations; measures their satisfaction
and uses the feedback of customers in improving quality services. Customer
relationship management programmes can be used for creating, maintaining and
developing effective relationships with customers. Customer involvement in
organization planning monitoring and evaluation is a necessity.
TQM extend the concept of quality to a company’s suppliers. The philosophy of
TQM extends the concept of quality to suppliers and ensures that they engage in the
same quality practices. Suppliers can make a substantial contribution to quality
achievement through supplying high-quality and defect-free materials.
Collaboration with suppliers is a key TQM practice.
Quality product comes from a quality process. This means that quality should be
built into the process. Quality at the source is the belief that it is far better to uncover
the source of quality problems and correct it than to discard defective item after
production. If the source is not corrected the problem will continue. Hence TQM
focuses on studying, understanding and improving processes. Process management
concerns the value adding system and involves the policies, procedures and practices
that are required to control the process. The process management construct examines
how key processes are designed, implemented managed and improved to support the
organizations strategy and actions plan. TQM emphasizes on Continuous process
improvement, this involves ongoing activities aimed at process simplification and
reduction or elimination of process waste it systematically seeks to achieve small,
incremental changes in processes in order to improve efficiency and quality. This
study conceptualizes that both TQM and generic strategies have an influence on
firm’s performance using all four dimensions of the balance scorecard that is
financial performance; customer satisfaction; process improvement and organization
learning and growth. However, TQM mediates the relationship between generic
strategies and firm’s performance.
23
2.3.4 Organization Performance
Kaplan and Norton (1992) introduced the balanced scorecard approach to measure
performance. This framework has been adopted and applied by hundreds of
organizations worldwide. The balanced scorecard integrates financial and non-
financial based performance measures allowing the manager to measure
performance from several perspectives simultaneously. The balanced scorecard
metrics includes financial measures that tell the results of actions already taken. It
also comprises of three sets of operational measures having to do with customer
satisfaction, internal processes and the organization ability to learn and improve the
activities that drives future financial performance.
To measure organization performance, the study adopted a balance scorecard
performance metrics. According to Madsen and Stenheim (2014) Financial metric
is the ultimate measure of a firm’s performance as it helps to determine whether a
firm’s strategy and execution are supporting the overall mission of the firm. The
financial measures focused on profitability and market share. Customer satisfaction
is directly related to profitability of the organization, under this measure the study
focused on customer loyalty, customer retention and customer acquisition. The
study also measured the extend which internal process have improved, the main
focus as recommended by Bose and Thomas (2007) was on activities that enhances
customer satisfaction, innovation and learning; to improve the skills of employees
and to achieve superior internal business process. Learning and growth perspective
is particularly important for strategic management to identify, improve and better
the performance of intellectual capital and is critical to develop innovative product
design, product, distribution and promotion and to improve the market value of an
organization beyond the value of intangible asset base. Adapting a balanced
scorecard approach provides a holistic performance outlook that ensured that the
researcher focuses on the entire business process and both current business
activities and events contributes to customer values and to the long-term
organization strategy are measured.
24
2.4 Empirical Review
The following review of literature focus on empirical findings from past studies in
the fields of Generic strategies and TQM. Literature reviews and empirical studies
using qualitative and quantitative methods from journal publications books and
reports are included
2.4.1 Generic strategies
Competitive strategy is basically concerned with the patterns of decisions or
choices that managers of firms make over which market to compete in and how the
business can add more value for buyers in order to gain more advantage than
competitors (Acquaah & Agyapong, 2015). Porter (1980) generic competitive
strategy posits that an organization can generate competitive advantage and
ostensibly maximize performance either through cost-leadership, differentiation or
a market focus strategy. These three generic strategies were defined along two
dimensions’ strategic scope and strategic strength. Strategic scope is a demand-
sided dimension and looked at the size and composition of the target market while
strategic strength is a supply-sided dimension and looks at the strength of core
competency of the firm. Porter (1980) in particular identified two competencies that
he felt were most important product differentiation and product cost (Tanwa, 2013).
Porter (1980) further explains that if sometimes a firm can successfully pursue
more than one approach as its primary target, it is rarely possible. This is because
effective implementation of any of these strategies usually requires total
commitment and supporting arrangements that are diluted if there is more than one
primary target (Furrer, Sudharshan, Thomas & Alexandre, 2008).
Following Porter’s early work numerous studies have found a positive relationship
between generic strategies and firm’s performance (Tansey, Spillane & Meng,
2014). More recent studies also show a link between strategy type and organization
performance. Banker, Mashruwala and Tripathy (2014), utilized the profit impact
of marketing strategies database to analyse Porter’s (1980) theory and found
evidence of higher performance in terms of market share and profits, for firms
following both differentiating and cost leadership strategies. Banker et al. (2014)

25
further investigated the relationship between strategic positioning of firms and the
sustainability of firm performance. The study found out that pursuing a
differentiation strategy leads to more sustainable financial performance Compared
to following cost leadership strategy. The findings indicated that both cost
leadership and differentiation strategies have a positive contemporaneous
performance. However, the differentiation strategy allows a firm to sustain its
current performance in the future to a greater extent than a cost leadership strategy.
However, differentiation strategy was associated with greater systematic risk and
more unstable performance. Nandakumar, Ghobadian and O’Regan (2010),
examined the relations between Porter’s (1980) generics strategies in explaining the
difference in performance in manufacturing organizations in UK the findings
indicated that firms adopting cost leadership and differentiation performed better
than stuck in the middle firms which do not have a dominant strategic orientation.
This study provided support that for Porter’s view that combination strategies are
unlikely to be effective in organizations, however cost leadership and
differentiation strategies were not strongly correlated with financial performance
measures indicating limitation in Porter’s generic strategies in explaining
performance heterogeneity in organizations.
In Kenya a Study by Kisaka and Okibo (2014) on the effects of generic strategies
on the expansion of academics programmes for competitive advantage found out
that market focus and differentiation strategies had a positive correlation with the
expansion of academic programmes moreover combining them had an effect on
increasing competitive advantage of the university. Arasa and Gathiji (2014)
examined the relationship between competitive strategies and organization
performance among firms in Kenya mobile telecommunication industry the study
revealed that product differentiation and low cost leadership are the most
commonly used strategies the study concluded that these strategies had an effect on
sales, market share, customer retention, profit and product innovation. Matunga and
Minja (2014) established that the use of generic strategies by food and beverage
firms in Kenya led to sustainable competitive advantage found that companies
adopted generic strategies to ensure survival and diversify risk especially in
competitive environment like that of the Kenya food and beverage industry.

26
2.4.2 Cost Leadership Strategy
The focus of firms implementing a cost leadership strategy is on stringent cost
control and efficiency in all areas of operations. A cost leadership strategy
emphasizes on creating competitive advantage through generating and maintaining
low-cost positions relative to competitors (Porter, 1980). Cost leadership strategy is
an integrated set of actions taken to produce goods or services with features that are
acceptable to customers at the lowest cost relative to that of competitors. A cost
leadership strategy is characterized by tight control of costs and overheads;
minimization of operational costs and a reduction of labour and input costs
(Acquaah & Agyapong, 2015; Porter, 1985). This includes organizing and
managing its value adding activities so as to produce a product (good or service) at
lower cost than competitors; providing a standard, no frills, and high volume
product at the cheapest prices to customers; favourable access to raw materials;
accurate demand forecasting combined with high capacity utilization; economies of
scale; technological advantages; outsourcing and learning /experience. As a result,
the firm can keep prices low and attract a market segment of the market interested
in inexpensive products.
This strategy enables a firm to effectively defend itself in price wars, attack
competitors on price, gain market share if already dominant in the industry and
benefits from supernormal profits. Barney and Hesterley (2006) affirms that few
layers in reporting structure; simple reporting relationships, small corporate staff,
and focus on narrow range of business are elements of organization structure that
allows firms to realize the full potential of cost leadership strategies. Empirical
studies show that the implementation of cost leadership strategy enhances the
performance in both small and large businesses (Agyapong & Boamah, 2013;
Tanwa, 2013). Birjandi, Jahromi, Darabi and Birjandi (2014) study on the effect of
cost leadership strategy on Rate of Return on Assets (ROA) and future performance
of companies in Tehran stock exchange results indicated that firm that adapted cost
leadership strategy experienced positive relationship between the ratios of sales to
capital expenditure with percentage growth in sales. Chang, Fernando and Tripathy
(2015) empirical study of strategic positioning and production efficiency revealed

27
that Firms which pursued cost leadership strategy were associated with high
production efficiency. Kaliappen and Hilman (2014) examined the effect of cost
leadership strategy on organization performance in context of hotel industry in
Malaysia. Adapting Kaplan and Norton (1992) balance score card to measure
organization performance findings revealed that cost leadership strategy has a
positive significant effect on organization performance.
Nyauncho and Nyagara (2015) investigated the effect of cost leadership strategy on
performance of liquefied petroleum gas companies in Kenya using financial
measure. The study established cost leadership enables the company to reduce price
leading to high volume of sales visa-visa profit margin, increased service delivery,
less return inwards, reduced operational costs and reduced wastages. Atikiya,
Mukulu, Kihoro and Waganjo, (2015) examined the effect of cost leadership on
performance of manufacturing firm in Kenya, the findings of their study revealed
that manufacturing firms in Kenya were positively significantly influenced by cost
leadership strategy. The study further revealed that manufacturing firms adopt a
cost leadership strategy to increase their competitiveness and performance. Studies
by Atikiya et al. (2015), Matunga and Minja (2014) considered competitive pricing
and efficiency as important constituents of cost leadership strategies in Kenyan
manufacturing industry.
2.4.3 Differentiation Strategy
Differentiation strategy involves creating market positions that is perceived as
being unique industry wide and that is sustainable overlong run (Porter, 1980).In a
differentiation strategies emphasis is on creating value through uniqueness achieved
through services innovations, superior services, creative advertising, better supplier
relationships, better product performance, design, brand image and control of
distribution channels leading to better services or in an almost unlimited number of
ways. Firms following a differentiation strategy appeals to a sophisticated or
knowledgeable consumer interested in a unique or quality product. The uniqueness
of differentiation strategy permits the organization to charge premium prices for its
products and/or services.

28
Empirical evidence shows that adapting a differentiation strategy positively
influences performance (Agyapaong & Boamah 2013; Li et al., 2006; Tanwa,
2013). Davcik and Sharma (2015) examined the impact of product differentiation,
marketing investment and brand equity on pricing strategies; using a cluster
analysis revealed that brand equity, marketing investment and product
differentiation are closely associated with price and that the premium price is
significantly associated with product differentiation based on innovation and
company type. Shafiwu and Mohammed (2013) examined the effect of product
differentiations on profitability in the petroleum industry in Ghana. Measuring
profitability in terms of earning per share and profit margin the study found that
there was a positive relationship between product differentiation and profitability in
Total Ghana limited. Al-alak and Tarabieh (2011) paper examined the relationship
between customer orientation, innovation differentiation, and market differentiation
and organization performance in the banking industry in Jordan. Organization
performance was measured using market performance. The study showed that
customer orientation contributes positively to organization performance through
innovation differentiation and market differentiation. The study further revealed
that; the impact of innovation differentiation on organization performance is greater
than the impact market differentiation on performance and both innovation
differentiation and market differentiation simultaneously achieve greater
competitive advantage. A study by Atikiya et al. (2015) considered brand loyalty
and product/process innovation as important components of differentiation strategy
in the Kenyan manufacturing industry.
2.4.4 Market Focus strategy
This strategy is also known as segmentation strategy or niche strategy. In the focus
strategy a firm targets a specific segment of the market (Arasa & Gathinji, 2014).
The firm can choose to focus on a selected customer group, product range
geographical or service line. Firms pursuing focus strategies have to be able to
identify their target market segment assess and meet the needs and desires of buyers
in the segment better than any other competitors (Porter, 1980). It is hoped that by
focusing its marketing efforts on one or two narrow market segments and tailoring

29
its marketing mix to these specialized markets the firm can meet the needs of the
target market better and become less vulnerable to competition from rivals or
substitute. Focus strategies can be based on differentiation or lowest cost (Porter,
1980). The choice of offering low prices or differentiated products or services
should depend on the needs of segments and the resources and capabilities of the
firm. The firm typically looks to gain competitive advantage through product
innovation and or brand marketing rather than efficiency. Focusing is based on
adopting a narrow competitive scope within an industry aimed at growing market
share through operating in a niche market or in market either not attractive to or
overlooked by large competitors (Allen & Helms, 2006). Researchers have found
support for Porters (1980) market focus strategy. Onaolapo, Salami and Oyedokun
(2011) study examined the impact of market segmentation practices on
performance of selected Nigerian commercial banks and the findings showed that
marketing segmentation benefited some sections of the industry more than others,
thus enabling dominance of the market share and customer patronage.
Mbithi, Muturi and Rambo (2015) investigated the performance implications of
using two marketing strategy approaches; developing new market segments and
extending geographically in the Kenyan sugar industry. The findings showed that
developing new segments influenced sales volumes which positively affected
firm’s profitability. Asiedu (2016) assessed the use and impact of market
segmentation practices on banks performance in Colombia. The study revealed that
banks that have adapted this strategy dominated the markets, retained their
customer and their profits were higher than those who had not adopted market
focus (market segmentation) strategy. Kimani and Wagoki (2015) assessed
strategies for gaining competitive advantage in insurance firms in Kenya with
specific focus on generic strategies. The study found out that market focus
strategies have a positive effect on the performance of insurance firms in Kenya.
Atikya et al. (2015) considered, speciality of product as a vital component of
market focus strategy in the Kenyan manufacturing industry.

30
2.4.1 Total Quality Management, Generic Strategies and Firm’s Performance
The link between organization strategy, structure and performance is a classical
theme in strategic management; organization strategy determines organization
structure which in turn influences organization performance. The success of generic
strategies is affected by extend of which TQM implementation influence the
effectiveness of the organization structure. Porter (1980) emphasized that each
strategy requires different resources and organization arrangements to be successful
in achieving the primary goal of strategy. Prajogo and Sohal (2006) identified that
TQM is positively related to innovation performance because it establishes a
system and culture that will provide a fertile environment for organizations to
innovate as a result it enhances the performance of a differentiation strategy.
According to Faezi (2014) TQM content could be divided into two categories
customer orientation and process orientation. With customer orientation, an
organization focuses on gaining market advantage where they can outperform their
competitor in terms of attracting more customers with distinguished products and
charge premium prices. This view suggests that under customer orientation TQM is
associated with differentiation strategy (Prajogo & Sohal, 2006) and market focus
strategy. On the other hand, under process orientation, companies will pursue
process efficiency improvement to eliminate defects and wastes (Zatzick et al.,
2012). The concept of continuous improvement elevates the importance of cost
reduction through defect preventions, a fundamental premise of TQM is that the
cost of poor quality (such as inspection, rework, lost customer and so on) are
greater than the cost of developing processes that produce high quality products and
services (Chaudary et al., 2015). TQM implementation eventually leads to cost
leadership strategy. By focusing process orientation TQM is closely linked to
porters cost leadership strategy.
2.4.2 TQM, Cost Leadership Strategy and Firm’s Performance
Cost leadership strategy is implemented when company’s product or services are
produced more efficiently than competitors. The low cost advantages could come
from new process, innovation, better learning curve, new service design, less

31
time/cost, and fully reengineering activities based on economies of scale (Acquaah
& Agyapong, 2015) and if this is not the case companies follow this strategy can
reduce any activity that does not create a cost advantage and delegate such
responsibility to companies they outsource the activity from (Porter, 1980).
Through the concept of continuous improvement, TQM focuses on studying,
understanding improving the processes. Process management construct examines
how key processes are designed, implemented managed and improved to support
the organizations strategy and action plans (Oakland, 2014). A fundamental
principle of TQM is that the cost of poor Quality (such as inspection, rework, lost
customers and so on) are far greater than the cost of developing process that
produce high quality products and services (Koc, 2011). By focusing on process
innovation TQM can be linked to porters cost leadership strategy.
Another strong association between TQM and cost leadership is through supplier
management. It involves developing partnership with key suppliers to reduce costs,
and create value to both parties based on mutual commitment on long-term
collaborations and shared success (Lambert & Schwieterman, 2012). Chaudary et
al. (2015) advocates TQM implementation to improve quality, shrink’s costs and
thus yields a positive outcome for financial performance. The fundamental
theoretical foundation for the link between effective TQM and financial
performance relies on reducing costs through product design efficiency. Prajogo
and Sohal (2006) have posited that TQM could be used in a different strategic
context including enhancing the performance of cost leadership strategy.
Empirical studies show positive relationship between TQM and cost reduction;
Ayandele and Akpan (2015) study on the practice, challenges and benefits of TQM
in Nigeria manufacturing firm revealed significant reduction in operating expenses
and manufacturing costs were recorded by firms that implemented TQM. Madar
(2015) investigated the implementation of TQM in British Airways. The study
revealed that TQM has an important role in British Airways and its implementation
continuously improve British Airways performance, it enabled British Airways to
meet its internal and external client’s needs in terms of service and product quality
32
and also enable it to develop an efficient and profitable business through cost
reduction.
2.4.3 TQM, Market Focus Strategy and Firm’s Performance
According to porter (1980) a focus market starts by choosing a market niche where
buyers have distinctive preference or requirement. The basis for competitive
advantage is either lower cost than competitors in serving the market niche or on
the ability to offer niche members something different from other competitors.
Focus–cost leadership factor emphasizes on reducing costs while at the same time
meeting the needs of undeveloped niche while the Focus-Product differentiation
factor emphasizes a uniqueness of a product or service and an attempt to make the
product or service special in the mind of the custom but to a smaller, possibly
undefined or overlooked speciality Niche (Allen & Helms, 2006).
TQM is a platform for the full realization of marketing potentials by revitalising the
marketing concept and fostering its implementation. TQM and marketing are
complementary and synergistic in facilitating efficient management of the process
of value creation and delivery. According to Oakland (2014) the main focus for
TQM is to establish a management system and corporate culture to ensure that
customer satisfaction is enhanced which involves a systematic method of
continuous improvement of organization processes, resulting in high quality
products and service. Su, Tsai and Hsu (2010), posits that Customer–oriented
culture is essential for quality and extension of customer-knowledge creation and
dissemination, and increasing responsiveness to customer needs. Possessing
customer knowledge will assist an organization to access new customer segments
achieving customer loyalty among its clients and provide customised products or
services that mirror customer needs. Organization that implement TQM in their
strategy and corporate culture are by nature, market oriented organizations. Wang,
Chen, and Chen (2012) posits that total quality management (TQM) and market
orientation both focus on customer needs and satisfaction. Market-oriented firms
have been shown to be successful at maintaining strong competitive positions over
time and TQM-adopting firms obtain a competitive advantage over firms that do
33
not adopt TQM (Vanichchnchai & Igel, 2011; Akgün, Ince, Imamoglu, Kekskin &
Kocoglu, 2014).
Scholars (Gilanina & Talab, 2013) have investigated the relationship between TQM
and marketing orientation but none have explored the relationship between TQM
and market focus. However, the two concepts market orientation and market focus
are closely related. According to Webster and Curry (2016) Market orientation is
described as an organization culture in which everyone in the organization is
committed to the customer and adapts in a timely manner to meeting the changing
needs of the customers, it blends a company culture dedicated to providing superior
value with successful achieving a customer focus, acquiring competitor intelligence
and maintaining inter-functional coordination. which is also consistent with Porters
(1980) perspective on the generic market focus strategy the market oriented
businesses achieve differentiation from better meeting the needs of particular target
or lower costs in serving the target or both similar to market focus.
Samat, Ramayah and Saad (2006) explored the relationship between TQM practices
and service quality as well as the relationship between TQM practices and market
orientation. The results showed that employee empowerment, information and
communication, customer focus and continuous improvement had a significant
effect on service quality and employee empowerment and customer focus had a
significant effect on market orientation. Teleghani, Gilanina and Talab (2013)
investigated the relationship between TQM and market orientation and performance
they concluded that organizations that successfully implemented TQM have better
and effective performance, market orientation has strongly and positively
relationship with performance and finally Total quality management and market
oriented both lead to superior quality.
Hang and Cheng (2011); Demirbag et al. (2006) and Pour et al. (2010) as cited by
Teleghani et al. (2013) studied the relationship between TQM market orientation
and firm performance the outcome shows that TQM had a positive impact on
performance and market orientation has a positive effect on performance. Mehra
and Ranganathan (2008) examined the role of total quality management (TQM)

34
towards enhancing customer satisfaction. It is found that TQM substantially
increases customer satisfaction across diverse industrial and cultural settings. TQM
principles mediate the relationship between market focus strategy and firm growth
of market share and financial performance, by developing unique products and
fostering an environment for innovation (Prajogo & Sohal, 2006) and by improving
efficiencies hence reducing costs.
2.4.4 TQM, Differentiation Strategy and Firm’s Strategy
Differentiation strategy aims to produce better products or services to satisfy the
customer needs. This strategy includes creating differentiated products or services
provided by a firm that are different from products and services of competitors; the
product and services must be accepted as unique and different from any product or
service which serve the same purpose in the market (Porter, 1980). Firms that
adopting differentiation strategy place strong emphasis on research and
development and venturing into new markets. Munisu (2013) emphasizes on
significant relationship between differentiation strategy and product quality, he
argued that quality is an aspect of differentiation along with design, style or
technological innovation. Therefore, Organizations can charge premium prices and
increase its profits margin on sales and return on investment, if they can be able to
offer the high-quality products consistently.
Companies that implement TQM have to explore and find ways to serve customers
expectations at their best. This creates the impetus for companies to be innovative
in developing and launching new products or services to match customers’ needs.
Several studies have identified positive relationship between TQM and innovation
(Hung, Lien, Fang & McLean, 2010; Lee, Ooi, Tan & Chong, 2010). Arguments
proposing a positive relationship between TQM and innovation posited that
companies implementing TQM in their business systems and corporate culture are
fertile environments because TQM promotes principles coincident with innovation
(Prajogo & Sohal, 2006). Total quality management culture requires changes in
manager’s employees believe attitude and behaviours to focus on continuous
improvement. This require commitment to a culture emphasising trust,

35
empowerment, entrepreneurship, teamwork cooperation, risk taking and continuous
improvement (Kaluarachi, 2010) hence innovation success.
Mielgo, Poen-Monters and Ordas-Vazquez (2009) study demonstrated the
relationship between TQM elements and innovation. TQM elements leadership and
Customer-orientation encourages employees to suggest innovative; leadership
encourages generation of ideas from employees for solving problems or developing
new products while Customer-orientation encourages organizations to search
consistently for new customer needs and expectations, so companies can survive in
this globally competitive environment. Martinez-Costa and Martinez-Lorente
(2007) emphasizes that TQM principle Continuous improvement is also critical to
the success of innovation through encourages changes and creative in organizing
works. Sadikoglu and Zehir (2010) study found that all elements of TQM are
significantly and positively associated with innovative performance. Empirical
Literature commonly agrees that there is a positive association between innovation
particularly product innovation and differentiation strategy (Prajogo & Sohal,
2006).
2.6 Critical Review
Prajogo and Sohal (2006) examined the fit of TQM on the relationship between
organization strategy and organization performance in Australian firms. By
examining TQM in relation to organization strategy, the findings indicate that TQM
is positively and significantly related to differentiation strategy and it only partially
mediates the relationship between differentiation strategy and three performance
measures product quality, product innovation, and process innovation. However,
this study was carried out in Australia a developed country the findings may not be
the same in Kenya a developing economy in sub-Saharan Africa. The study mainly
focused on innovation as a measure of performance ignoring other performance
measures.
Zatzick et al. (2012) explored the fit with the organization orientation relates to
performance following TQM implementation in USA. Conceptualizing an
organization as a system of interrelated activities; they proposed that TQM acting

36
as an elaborate element that achieves internal fit; when the core activities are
oriented towards cost rather than differentiation strategic position. When internal fit
occurs TQM drives tighter interactions among core elements in activity systems
resulting to greater performance. Their findings show that TQM is positively
related to performance for cost leaders and negatively related to performance of
differentiators. Their findings support contingency perspective where internal fit
serves as an overarching contextual factor influencing TQM performance. This
study covered only two generic strategies cost leadership and differentiation study
the third generic strategy market focus as a strategy was not investigated.
Faezi (2014) investigate the relationship between criterions of differentiation
strategy and cost leadership with TQM in pharmaceutical companies in Iran. The
study found that TQM has a significant relationship with differentiation strategy.
On the other side result did not show any positive relationship between TQM and
cost control. This study was carried out in an environment that is quite different
from the Kenya environment its finding may not be the same. The study was
carried out in a single unique field pharmaceutical its finding may not be
universally applied in all fields of manufacturing. Herzallah, Gutierrez-Gutierrez
and Munoz (2014), examined the relationship between TQM practices, competitive
strategies cost leadership and differentiation and firms performance in the
Palestinian economy. The findings indicated that TQM practices were directly
related to financial performance. The study only focused on financial performance
and ignored non-financial measures.

37
2.6.1 Summary of Knowledge gaps
Table 2.1: Summary of Knowledge Gaps
Researcher Focus Findings Knowledge
gaps
Addressing
knowledge Gaps
in the current
study
Faezi
(2014)
Investigated
the relationship
between
standards of
differentiation
strategy and
cost leadership
with
comprehensive
quality
management in
medic firms
TQM has a
significant
relationship
with
differentiation
strategy, on
the other side
results did not
show any
positive
relationship
between TQM
and cost
leadership
strategy
The study is
narrowed to
pharmaceutical
firms only.
This study
covers all
manufacturing
firms.
Herzallah,
Gutierrez-
Gutierrez
and Munoz,
(2014).
Examined the
relationship
between TQM
practices,
competitive
strategies and
financial
performance.
The results
showed that
TQM practice
have an
indirect,
positive and
significance
relationship
with
competitive
strategies and
financial
performance
The study does
not measure
performance
using non-
financial
measures
This study uses
both financial
and non-financial
measures.
Munisu,
(2013)
Tested the
effect of TQM
practices on
organization
competitive
advantage and
The findings
showed that
TQM has a
positive and
significant
effect on both
The study is
narrowed to
the fishing
industry in
Indonesia. The
findings may
This study was
carried out in the
Kenyan
manufacturing
industry.

38
subsequently
performance of
an
organization.
organization
performance
and
competitive
advantage
not be
applicable in
the Kenyan
industry
Prajogo and
Sohal
(2006)
Examined the
relationship
between
organization
strategy, total
quality
management
and
organization
performance
TQM
positively and
significantly
relate to
differentiation
strategy and it
partially
affects the
relationship
between
differentiation
strategy and
product
quality,
product
innovation,
and process
innovation.
Performance
in the study is
measured
using product
quality,
product
innovation,
and process
innovation.
Customer
satisfaction
and financial
performance
of
organizations
was not
considered.
This study offers
a holistic
approach to
performance
measure. Using
both financial
and non-financial
measures. Using
customer
satisfaction,
organization
learning and
growth, process
efficiency and
financial
performance
Zatzick,
Molterno
and Fang,
(2012).
The study
explored how
best
organization
orientation
relates to
performance
following
TQM
implementation
TQM is
positively
related to
performance
for cost
leadership
strategy but
negatively
related to the
performance
of
differentiation
strategy.
The study does
not cover the
effect of TQM
on market
focus strategy.
The study covers
all the three
generic
strategies, cost
leadership
strategy, market
focus strategy
and
differentiation
strategy.
39
2.7 Research Gap
Past findings from studies carried out on TQM effect on performance of
organization strategies have been divisive. While some researchers (Faezi, 2014;
Prajogo & Sohal, 2006) have suggested that TQM could align with differentiation
orientation given the intense customer focus and has no effect on cost
minimization; others (Zatzick, Moliterno & Fang, 2012) argue that TQM is mostly
associated with internal process improvement and cost reduction particularly in
manufacturing context. They further argue that customer focus could trap
organizations into captive markets where they will focus on meeting the needs of
existing customers and therefore view their business only through customer’s eyes
as a result ignoring the unserved potential in their markets (Zatzick et al., 2012).
To further their argument whiles the link between TQM and innovation is the basis
for differentiation strategy. Scholars are not in agreement about the effect of TQM
on innovation. Hung et al. (2010) and Lee et al. (2010) argue that there is a positive
link between TQM practice and innovation performance. The argument is on the
basis that TQM is a good way to improve quality while facilitating the innovation
process. Learning associated with continuous improvement helped employees to
increase their knowledge of customers, competitors and markets and resulted in
generating new ideas for innovative products. Other scholars (Hoang et al., 2010)
emphasize the negative link between them. According to Hoang et al. (2010) the
negative relationship between TQM and innovation performance is because the
customer focus is concern with product conformance (product quality), but not with
product newness. Finding from a study by Cole and Matsumiya (2008) also
supports the motion, the study examining the impediments to radical innovation
created by pursuit of quality improvement in the dynamic hi-tech sector, findings
showed that risk averse quality culture adopted in Japanese hi-tech firms possibly
inhibited potential radical innovation. According to Martinez- Costa and Martinez-
Lorente (2007) TQM can lead organizations to be narrow-minded and hinder
creativity due to the enforcement standardization.

40
Similarly studies on the effect of TQM on cost leadership strategy and firm’s
performance have been divisive. Scholars (Prajogo & Sohal, 2006; Faezi, 2014)
studies on the effect of TQM on the relationship between cost leadership and firm’s
performance did not find significance relationship between TQM and cost
reduction. While Zatzick et al. (2012) found a positive significance relationship on
the effect of TQM on the relationship between cost leadership strategy on firms’
performance. There is need to resolve the inconsistencies which have appeared in
the literature concerning the relationship among generic strategies. Similar Studies
carried out (Prajogo & Sohal, 2006; Faezi, 2014; Zatzick et al., 2012) have
examined the relationship between TQM and two generic strategies. Cost
leadership strategy and differentiation strategy. There is need to examine the effect
of TQM on market focus strategy’s performance necessitating the need for this
study. Furthermore, the focus of these studies has been in developed countries;
Prajogo and Sohal (2006) study was carried out in Australia while Zatzick et al.
(2012) study was carried out in USA hence their findings may not be applicable in
Kenya today.
This study therefore intends to fill these pertinent gaps in literature by studying
TQM Mediating effect on the performance of the three generic strategies (cost
leadership, market focus strategy and differentiation strategy) on the performance
of manufacturing firms in Kenya. This study adds value to existing literature by
providing empirical evidence on the Mediating effect of TQM on the relationship
between generic strategies and firm’s performance in the Kenyan manufacturing
sector and fills the existing contextual and conceptual gaps.
2.8 Summary
A review of literature on the relationship between generic strategies and
organization performance reveal that there is a significant positive relationship
between generic strategies cost leadership strategy, market focus strategy, and
differentiation strategy and firms performance. Studies have also proven that TQM
have a direct positive relationship with firm’s performance in form of financial
performance, innovation and growth of markets share. On the mediating effect of

41
TQM on the performance of generic strategies studies revealed that continuous
process improvement was closely related to cost leadership strategy since it
enhances cost reduction by improving efficiency in processes and eliminate waste.
Studies also identified supplier management and outsourcing as means of reducing
costs and resulting to cost leadership strategy.
Customer focus another principle of TQM was identified in studies as closely
related to market focus strategy and differentiation strategy. Customer focus
coupled with TQM culture of employee empowerment and top leadership
commitment; were identified as principles that create a fertile culture for innovation
leading to product and service differentiation. Studies also closely linked Customer
focus with market focus strategy. Customer focus resulted to Customer–oriented
culture essential for quality and extension of customer-knowledge creation and
dissemination, and increasing responsiveness to customer needs. Possessing
customer knowledge was revealed as means to assist an organization to access new
customer segments achieving customer loyalty among its clients and provide
customised products or services that mirror customer needs hence enhancing the
performance of market focus strategy.

42
CHAPTER THREE
RESEARCH METHODOLOGY
3.1 Introduction
This chapter discuss the research design and methodology used in this research.
More specifically it outlines the research philosophy, research design, target
population, sampling methodology, data collection procedures and instruments,
pilot test, data processing and analysis. This chapter also explain and rationalize the
statistical techniques that were used for data analysis. Muhammad and Supinit
(2016) defined research methodology as a systematic theoretical analysis of the
methods applied to a field of study, it consists the theoretical analysis of the body
of methods and principles associated with a branch of knowledge; methodology is
essential in gathering relevant information thereby giving effective and reliable
representation. The study adopted both qualitative and quantitative approaches to
research.
3.2 Research Philosophy
A research philosophy reflects the researcher’s perspective in interpreting of
phenomena and it depends on how he/she thinks about the development of
knowledge. Related literature classifies research according to perception of the
world into different philosophies (such as critical realism, positivism, pragmatic,
postmodernism and pragmatism) (Saunders, Lewis & Thornhill, 2009). The two
major paradigms adopted in research are Positivism and Phenomenological
approaches (Masadeh, 2012). The study adopted a positivist research philosophy.
Positivism is developed from existing theory with a logical manner through highly
structured empirical testing of hypothesis. This approach to research is based on
knowledge gained from positive verification of observable experience rather than
intuition. According to Hesse-Biber and Leavy (2011). Positivist holds that there is
a knowledge reality that exists independent of research process; the social world
like the natural world is governed by rules which results to patterns accordingly
causal relationship exists between variables and can be identified, proven and

43
explained. Thus, patterned social reality is predictable and can potentially be
controlled.
3.3 Research Design
A research design constitutes the blue print for collection, measurement and
analysis of data. It is the process that the investigator followed from the inception to
completion of the study (Mugenda & Mugenda, 2011; Mugenda, 2011). Cooper
and Schindler (2011) defined research design as the plan and structure of instigating
conceived so as to obtain answers to questions. According to Kothari (2011)
research design is a master plan that specifies methods and procedures for
collection and analysing the needed information. Research design therefore is a
road map of how one goes about answering the research questions.
This study adopted a descriptive research design. This research design is used when
data is collected to describe people, organizations, settings or phenomena
(Creswell, 2014). It is ideal for gathering original data for the purpose of describing
certain perceptions, opinions, attitudes, relationships and orientations that are held
by a population too large to observe directly. The descriptive research design
enables the researcher to obtain in-depth information, which can be used to
facilitate the generalization of one’s findings to the larger population (Pietersen &
Maree, 2007). According to Kothari (2011) descriptive research design also has
enough provision for protection against biasness and maximizes the reliability of
the data collected. The descriptive survey strategy is therefore chosen as the most
appropriate method that would provide a broad overview of a sample representing
Kenyan manufacturers.
Descriptive research survey using both qualitative and quantitative approaches is
recommended for this study. A quantitative research refers to the systematic
investigation of scientific or mathematical properties and their relationship while
qualitative approach refers to the in-depth investigation that is more descriptive
than numerical (Saunders et al., 2009). Qualitative and quantitative techniques
provide a trade-off between depth and breadth and between generalizability and
targeting specific populations. Each technique has its advantages and disadvantages
44
(Kumar, 2011). A combination of qualitative and quantitative approaches provides
a more complete understanding of a research problem than using either approach
alone (Creswell, 2014).
3.4 Target population
This is the total collection of elements about which the researcher wishes to make
some inferences (Cooper & Schindler, 2011; Kothari, 2011). Sekaran and Bougie
(2011) defines population as a total collection of elements about which references
are made and refer to all possible cases which are of interest to the study. This
includes people or items with the characteristics one wishes to understand. The
study focuses on all ISO certified manufacturing firms in Kenya. Data from Kenya
Bureau of Standards shows there are 39 manufacturing firms in Kenya that are ISO
certified. The target population for the study is 117 three middle level managers in
39 ISO Certified manufacturing firms in Kenya (Appendix II). The CEO’s / human
resource managers, strategic/Marketing managers and Quality assurance managers
3.5 Sampling Frame
Sampling frame is a (physical) representation of all the elements in the population
from which a sample is drawn (Sekaran & Bougie, 2011). Saunders et al. (2009)
defines a sampling frame as a list of all the items where a representative sample is
drawn for a purpose of carrying out a study. Upagade and Shende (2012) also refer
to a sampling frame as a source list containing all names of the universe. Specifying
the sample frame is crucial as it itemize all elements in the population from which a
sample is obtained for analysis so as to test the research hypotheses. The
elementary units or the group or cluster of such units may form the basis for
sampling process in which case they are called sampling units. The sampling frame
in this study was all 39 ISO certified manufacturing firms (Appendix II).
3.6 Sample Size and Sampling Technique
Sample size is the actual number of elements to be physically reached by the
researcher to extract data using an appropriate data instrument. The study applied

45
census, each ISO certified manufacturing firms was being represented. According
to Kothari (2011), a census approach is a complete enumeration of all items in the
population. It is presumed that in such an inquiry when all items are covered no
element of chance is left and the highest accuracy is obtained. A census has no
sampling error as all members of the population are enumerated; therefore, it
provides more accurate and exact information as compared to the sample which
involves drawing a representative and adequate fraction of the population (Statistics
Canada, 2010). A census approach therefore affords more extensive and detailed
study. This method is suitable when the study population is small or manageable
and therefore there is no need for a sampling survey. Since there are only 39 ISO
certified manufacturing firms the census approach was seen as suitable for this
study. Considering the nature of data (information) to be collected three managers
(CEO/human resource manager, Strategic managers/ marketing manager, and
Quality assurance managers) in each firm were used as a unit of observation to give
information on behalf of the organization. This result to a total of 117 respondents.
3.7 Data collection Instruments
The primary research data was collected from the management using
questionnaires. A questionnaire was perceived as the most accurate tool for
measuring self-sufficiency existing relationship, objects or events as well as self-
reported beliefs and behaviour. The use of questionnaire also makes it possible for
descriptive, correlation and inferential statistical analysis (Saunders et al., 2009).
The questionnaire allows data to be collected quickly in an efficient manner. The
questionnaire used in this study merged the questionnaire used from previous
studies of Dess and Devis (1984) and Powell (1995) with minor adjustments.
Creswell (2014) recommend the use of previous questionnaire to assists in testing
the reliability and validity of the current instrument as well as saving much time
spent in developing new questionnaire. Powell (1995) questionnaire was used to
measure TQM performance in the organization while Dess and Devis (1984)
questionnaire was used to measure the performance of generic strategies. Dess and
Devis (1984) questionnaire is a widely recommended by researchers (Luoma, 2015;
Lisboa, Augusto & Yasin, 2012) likewise Powell (1995) questionnaire is popular

46
among researchers (Ngambi & Nkemkaifu, 2015; Hoang et al., 2010). Variables
used to measure organization performance were adapted from the balance score
card designed by Norton and Kaplan (1992).
Based on the nature of strategic information required for this study three types of
questionnaire were administered middle level and top-level managers to different
managers (that is quality assurance managers; strategic manager’s/marketing
managers and CEOs’/human resource managers (Appendix I). A Likert scale was
employed to evaluate how each particular item was rated by the respondents in
relation to a given variable investigated. A Likert scale is an ordinal scale
comprising of a set of quantitative variation of a particular attribute ordered
sequentially form least to most. A five-point Likert scale was used for most
questions in the survey except for sections dealing with background information
and a few open-ended questions. These choices represent the degree of agreement
to the given question. The choices range from Strongly Disagree (SD), Disagree
(D), Neutral (N), Agree (A) and Strongly Agree (SA). Likert scale is preferred as it
is considered more reliable because respondents are able to easily answer all or
most questions contained in the questionnaire (Kothari, 2011). Kothari (2011)
further argue that the Likert scales ratings constitute interval scales attributes hence
it can be evaluated easily using standard techniques. Perceived financial measure
was used to measure financial performance, the degree to which a manager is
satisfied with the firm’s profitability and market share. This measure is preferred by
respondents since objective measures such as profit or revenue are seen as
confidential (Gruber, Heinemann & Bretel, 2010).
3.8 Data Collection Procedure
Creswell (2014) defines data collection as a means by which information is
obtained from the selected subjects of an investigation. Secondary data used in the
study was from journals and books relevant to this study. Primary data was
collected from the respondents using self-administered questionnaires. The study
targeted three senior managers (CEO/human resource management, Strategic
manager’s/marketing managers and Quality Assurance Managers) in each

47
organization. Those targeted were of great concern to the study because information
required in this study need employees with adequate knowledge and data about the
organization strategies, quality programmes and performance. Prior arrangements
were made on how to get the managers out of their busy schedule to fill the
questionnaires. Four trained research assistants were engaged to assist in data
collection. The study utilized 117 questionnaires to collect data from 39 ISO
certified manufacturing firms.
3.9 Pilot test
A pilot test was conducted to detect weaknesses in research instrumentation and to
provide proxy data for selection of a probability sample. A pilot test is an activity
that assist the researcher to determining if there are flaws, limitations or other
weaknesses within the interview design and allows him or her to make necessary
revisions prior to the implementation of the study. The rule of thumb is that 1% of
the sample should constitute the pilot test (Cooper & Schilder, 2011). According to
Mugenda and Mugenda (2011) one tenth of the sample size is sufficient for pilot
testing. Therefore, 12 sample questionnaires were tested on 12 employees from 4
ISO certified manufacturing firms. This Pilot test was used to test the validity
(Mugenda & Mugenda, 2011) and testing the reliability of data collection
instruments. Few corrections were made on the data collection instrument after the
pilot test.
3.9.1 Validity of data collection Instruments
Validity is the degree to which results obtained for analysis of the data actually
represent the phenomena understudy. It indicates how accurate the data obtained in
the study represent the variable of the study (Mugenda & Mugenda, 2011). Validity
is used to check whether a questionnaire is measuring what it purports to measure.
There are several forms of validity test. This study focused on two; face validity
test and internal validity test. According to Drost (2011) Face validity is a
subjective judgement on the operationalization of a construct. Face validity
measures the extent to which a research instrument is subjectively viewed as
covering the concept it purports to measure. The questionnaire was given to

48
expert’s researchers and supervisors who assessed it and they approved that the
questionnaires measures what it intends to. Internal validity test measures how well
the study was run (in form of research design, operationalization of variables used,
how the variable were measured and what was/wasn’t measured,) and how well one
can conclude that the change in the dependent variable was produced solely by the
independent variable and not erroneous ones. Trochim, Donnelly and Arora (2014)
defines internal validity test as the approximate truth about inferences regarding
cause-effect or causal relationships. The response from the pilot test was used to
improve on the final research instruments.
3.9.2 Reliability of data collection Instruments
Reliability is the extent to which results are consistent over time. This is done by
determining the association in between scores obtained from different
administration of the scale. If the association is high, the scale yields consistent
results, thus it is reliable. Data reliability was measured using Cronbach’s alpha
method. The coefficient alpha is an appropriate measure of variance attributed to
subjects and variance attributed to the interactions between subjects and items.
Cronbach’s alpha is a general form of Kunder-Richardson (K-R) 20 formula. Field
(2009) observes that a Cronbach’s α ≥ 0.7 implies the instrument provides a
relatively good measurement tool hence reliable. The research questionnaire
instrument to be used in this study was subjected to crouchback alpha test.
3.10 Factor Analysis
Factor analysis was used to reduce the number of variables by combining two or
more variables into a single factor and to identify groups of inter-related variables to
see how they were related to each other (Zikmund , Babin, Carr & Griffin, 2010).
Both exploratory factor analysis (EFA) and confirmatory factor analysis (CFA) were
employed to understand shared variance of measured variables that were believed to
be attributable to a factor or latent construct. EFA was used at the early stages of
research in order to identify the variables that cluster together.

49
Principal Component Analysis (PCA) was used in factor extraction. The goal of PCA
was to extract maximum variance from the data set with each component
(Tabachnick & Fidell, 2013). Principal Component Analysis orthogonal rotation,
Varimax methods were used to extract quality constructs for each of the variables.
Varimax solution yielded results which made it easy to identify each variable with a
single factor (Field, 2009). Confirmatory factor analysis (CFA) was used to test the
hypothesis that the items used in measuring each objective were associated with
specific factors (Hair et al., 2010). Hypothesized models were tested against actual
data and the analysis used to demonstrate loadings of observed variables on the latent
variables (factors) as well as the correlation between the latent variables (Zikmund et
al., 2010).
3.11 Data Processing and Analysis
The data that were obtained from the questionnaires were both qualitative and
quantitative. Before processing the responses, every filled questionnaire was tallied
for every response per question. The responses were first edited, coded and cleaned
for analysis. Qualitative data was analysed using descriptive statistics. Statistic
including the mean, mode and median, variance and standard deviation were used
(Mugenda, 2011). These tools were used to describe and determine the respondent‘s
degree of agreement or disagreement with various statements under each variable
(Mugenda, 2011). SPSS was used to conduct descriptive data analysis of each
variable and the same was presented in form of percentages and tables. Quantitative
approach involved collecting numerical data through counting of attributes or
quantities. The counts were used to report the findings as numbers.
After descriptive statistics for all variables were run, data analysis was further
conducted using SEM where two phase process consisting of confirmatory
measurement model and structural model were used (Hair et al., 2010). The first
phase involved estimation of the measurement model which assesses the relationship
between the observable variables and the theoretical constructs they represent.
However, prior to CFA, exploratory factor analysis (EFA) that involved computation
of factor loading matrix, communality and principle component analysis (PCA) was

50
conducted. To assess the factorability of items, two indicators were examined (Kaiser
Meyer-Olkin measure of sampling adequacy and Barletts Test of Sphericity (Pallant,
2010). These tests were generated by SPSS and helped to assess the factorability of
data or suitability of data for structure detection (Pallant, 2010). Kaiser-Meyer-Olkin
(KMO) test was used to assess sampling adequacy. Bartlett test of sphericity was
performed to assess the appropriateness of using factor analysis (Hair et al., 2010).
There were four criteria that were used to validate the model fit. These were
convergent validity, discriminant validity, construct reliability and construct validity.
Different fit statistical tests were used to determine whether the model provided
adequate fit for the data. The fit was used to assess whether overall models were
acceptable and if acceptable researcher establish whether specific paths were
significant. In order to ascertain that the model provided adequate fit for the data, the
study also considered absolute fit indices and incremental fit indices (Hair et al.,
2010).
The second phase was the specification of the structural model and evaluation of the
relationships proposed and testing of hypothesis. Structural equation modelling
(SEM) was used to test the hypothesized relationship and to fit the structural model.
SEM assumes linear relationships or unidirectional causal relationships between the
research indicators and latent variables, as well as between latent variables. Path
diagrams (models) were used to specify patterns of directional and non-directional
relationships among observed variables. This was conducted by use of Analysis of
Moment Structures (AMOS) software. The software was also used to assess the
model ‘s fit, computes results and develops a visual/graphical output (Bhattacharyya,
2007).
3.12 Model specification
The research adopted Baron and Kenny (1986) three steps approach to test the
mediation effect several regression analyses were conducted and significance of the
coefficients examined at each step. The Baron and Kenny (1986) approach have
been widely used by scholars (Mackinnon, 2011; Pardo and Román, 2013) and was
deemed suitable for this study

51
The first model (step) was to conduct a regression analysis with X (generic
strategies) predicting Y (organization performance)
Model 1
The second step was to conduct a regression analysis with X (generic
strategies) predicting M (TQM performance within the organization)
Model 2
The third step was to conduct a regression analysis with M (TQM) predicting Y
(organization performance)
Model 3
Where
Y= organization performance
β0 = constant
βi = regression coefficient for Xi (i =1,2,3.....10)
X = Generic strategies (cost leadership strategy, differentiation and focus
strategy)
M= total quality management (mediator)
= error term.
If the independent variable (generic strategies) should no longer relate to the
dependent variable (organization performance) after the mediator variable TQM is
controlled, such that it regression coefficient beta in the third step is not significant.
This condition shows that the relationship between generic strategies and
organization performance examined under the first condition disappears when the

52
mediated effect transmitted through TQM is taken into account Satisfying all the four
conditions provides evidence for complete mediation, where as satisfying three
conditions indicate partial mediation.
3.13 Diagnostics Tests
The model was subjected to preliminary tests to establish its validity and to enable
one to draw conclusion. Prior to data analysis, a number of assumptions were tested.
Those included; outlier, normality, linearity, homoscedasticity, multicollinearity,
independence of residuals, common method bias and correlation among study
variables. When these assumptions are violated, the study results are likely to give
biased estimates of the parameters (Saunders, Lewis & Thornhill, 2009).
An outlier is any observation that is long away from the general pattern of
distribution of variables (Creswell, 2014). In a specific regression case of regression
model, outliers are observations that are long away from the fitted line. The presence
of outliers was detected by use of Mahalanobis d-square test. Linearity means that
the amount of change or rate of change between scores on two sets of variables is
constant for the entire range of scores for the variables. It is therefore the consistent
slope of change that represents the relationship between an independent variable and
a dependent variable. Problem of linearity are fixed by removing outliers (Creswell,
2014). The study assumed linearity of the variables because outliers had been
dropped. Similarly, Breusch-Pagan and Koenker test statistics was used to test for
heteroscedasticity.
The test for normality of dependent variable was conducted Kolmogorov-Sminov
and Shapiro-Wilk test for normality were used to detect all departures from
normality (Shapiro & Wilk, 1965). The test rejects the hypothesis of normality when
the p-value is less than or equal to 0.05 (Shapiro & Wilk, 1965). Multicollinearity is
a statistical phenomenon in which two or more predictor variables in a multiple
regression model are highly correlated. It arises when there is a linear relationship
among two or more independent variables in a single equation model; increasing the
standard errors of the coefficients (Gujarat & Porter, 2009). Multicollinearity makes
the coefficient estimates to change erratically in response to small changes in the

53
model or the data. It makes some variables statistically insignificant while they
should be statistically significant. Detection Tolerance and Variance Inflation Factor
(VIF) method was used to test for multicollinearity. Multicollinearity is reflected by
lower tolerance values and higher VIF values (Hair et al., 2010). According to Field
(2009) a value of VIF > 10 indicates the presence of high collinearity implying the
variable is a linear function of another variable in the same model. Related to the VIF
is the tolerance statistics which is a reciprocal of VIF(1/VIF) values below 0.1
indicate serious problems of multicollinearity.
Common method bias is a bias in a dataset due to something external to the measures
that may have influenced the response given (Podsakoff, MacKenzie & Podsakoff,
2012). Collecting data using a single (common) method may introduce systematic
response bias that will either inflate or deflate responses as majority of the variance
can be explained by a single factor (Podsakoff et al., 2012). To test the significance
of this indirect effect (mediation effects) bootstrapping procedures as recommended
by Hayes (2013) were used. The indirect effects were computed for each 5000
bootstrapped samples.

54
CHAPTER FOUR
RESEARCH FINDINGS AND DISCUSSION
4.1 Introduction
This chapter presents the research findings and the result of the study. The purpose of
this study was to determine the mediating effect of TQM on the relationship between
generic strategies and Kenya manufacturing firm’s performance. The study used
generic strategies as independent variables (cost leadership, differentiation strategy
and focus strategy). TQM as mediating variable and financial performance, customer
satisfaction, internal process improvement and organization learning and growth as
measures of organization performance. Data analysis was conducted for each of the
objective by use of descriptive statistics, structure equation modelling (SEM) and
regression analysis
4.1.1 Response rate
The study administered 117 questionnaires to (CEO/Human resource managers,
strategic managers/Marketing managers and quality assurance managers in 39 ISO
certified manufacturing firms. 102 questionnaires were properly filled and returned
as shown in Table 4.1. The overall response rate was 87%. According to Kothari
(2011) a response rate of 50% is considered average 60-70% is considered adequate
while anything above 70% is considered a good representation to provide
information for analysis. This response was therefore considered good representative
to provide information for analysis and derive conclusions.
Table 4.1: Response Rate
Respondent Frequency percentage
Human resource/CEO 34 87%
Marketing/Strategic managers 34 87%
Quality assurance managers 34 87%
Total 102 87%
55
4.2 Testing the assumptions of the study variables
The assumptions of linear regression models were validated to ensure that the
ordinary least squares (OLS) provide reliable estimates of the parameters, if these
assumptions are violated, the study results are likely to be biased estimate of
parameters (Saunders et al., 2009). The following assumptions of the study variables
were tested outlier, normality, homoscedasticity, multicollinearity, independence of
residuals and common method bias.
4.2.1 Test of Normality
A normality test determines if the data set is well-modelled by a normal distribution.
Kolmogorov-Smirnova and Shapiro-Wilk test were conducted. This was fundamental
in order to determine appropriate test to be conducted and make sure the assumptions
of a normal distribution were not violated. The test rejects the hypothesis of
normality when the p-value is less than or equal to 0.05 (Hair et al., 2010). The P-
value for the factors were greater than 0.05 for both Kolmogorov-Smirnova and
Shapiro-Wilk test. Hence the study assumed that the data was normally distributed.
The results are presented in the appendix (IV).
4.2.2 Test for Outliers
An outlier is any observation that is long away from the general pattern of
distribution variables and a long way from the fitted line (Creswell, 2014). The
presence of outliers was tested by the use of Mahalanobis D-square test. Kline
(2005) recommend that Mahalanobosis distance is appropriate for evaluating the
multivariate outliers. Mahalanobis D2 is a multidimensional version of a Z-score. It
measures the distance of a case from centroid (multidimensional mean) of a
distribution, given the covariance (multidimensional variance) of the distribution. A
case is multivariate outlier if the probability associated with D2 is 0.01 or less. D2
follows a chi-square distribution with degree of freedom equal to the number of
variables included in the calculation (Tabchnick & Fidell, 2013). The results of
mahalanobis D-square test show that the distribution ranges from 8.554 to 39.092
with P2 values being greater than 0.01 hence suggesting incidents of multivariate

56
outliners are not existent. The results for mahalanobis D-square test results are
presents in appendix (V.)
4.2.3 Heteroscedasticity
Heteroscedasticity is a situation where the error term is unequal across the range of
values of a second variable that predicts it. OLS makes the assumption that the
variance of the error term is constant (Homoscedastic). Violation of this assumptions
leads to bias test statistics and confidence intervals (Hair et al., 2010). In this study
heteroscedasticity was tested by performing the Breuch-pagan/Cookweisberg test.
Breusch/Cook-weisberg test the null hypothesis that the error variances are equal
verse the alternative hypothesis that the error covariance are multiplicative function
of one or more variables. Heteroscedasticity will be evident when the value of
Prob>Chi-Square is greater than 0.05 Park, 2008). The result in Table 4.2 shows
Prob> Chi-square = 0.0179. Since the Prob> Chi-square value is less than 0.05 the
study therefore accepts the null hypothesis the variance in the error term is constant.
Hence heteroscedasticity does not exist and that the variance of the error term is
constant (Homoscedastic).
Table 4.2: Heteroscedasticity
HO Chi2(10) Prob> Chi2
Constant variance 5.61 0.0179
4.2.4 Multicollinearity
Multicollinearity exist when there are more than one variable measuring the same
value (Hair et al., 2010). Multicollinearity is concerned with high correlations
between independent variables that are supposed to predict a certain dependent
variable. Existence of multicollinearity may lead to significance impact on the
regression and statistics results. Multicollinearity can be detected using the value of
correlations. A value of 0.8 or 0.9 shows that there is a relation of multi-collinearity

57
between two variables. The study examined the correlations as appears in the
Pearsons correlation there is no sign of multicollinearity. The highest correlation
coefficient between the variable was 0.690 which does not exceed 0.8 as suggested
by Hair et al. (2010). These results are presented in appendix (III).
Multicollinearity existence was further examined using the variance of inflation
(VIF) for independent variables The VIF indicates whether a predictor has a stronger
linear relationship with the other predictors. According to Field (2009) a value of
VIF > 10 indicates the presence of high collinearity implying the variable is a linear
function of another variable in the same model. The VIF values in this case ranges
from 2.070 to 3.293 which suggest that problems of multicollinearity are unlikely to
occur. Related to the VIF is the tolerance statistics which is a reciprocal of VIF
(1/VIF) values below 0.1 indicate serious problems of multicollinearity in this study
the value ranges from 0. 304 to 0.482 indicating multicollinearity does not exist. The
results are presented in Table 4.3
Table 4.3: Coefficient for tolerance and variance of inflation factor test
Tolerance VIF
CL1 .483 2.070
CL2 .304 3.293
CL3 .404 2.473
DS1 .437 2.288
DS2 .448 2.234
DS3 .378 2.644
CF1 .475 2.106
CF2 .461 2.168

58
4.2.5 Common Method Bias
Collecting data using a single (common) method may introduce systematic response
bias that will either inflate or deflate responses. Common method bias (CMB) is used
to measure bias in a dataset due to something external to the measure that may have
influenced the response given (Podsakoff, MacKenzie, Lee & Podsakoff, 2003). A
study that has significant common method bias is one which a majority of the
variance can be explained by a single factor. To test for a common variance among
all observed variables in the model a latent factor was added to Amos CFA model
and was then connected to all observed items in the model. The standardized
regression weights from the model was used as a measure of CMB. The results are
presented in Figure 4.1. The CMB should be less than 20% (0.200) (Podsakoff et al.,
2003) in this study common bias is 0.262 = 0.0676. This implies that CMB was
6.67% which was much lower than the conventional CMB of 20% (0.2). This
indicates that the recommended threshold was met, thus absence of systematic
response bias.

59
Figure 4.1: Common Bias Method
4.2.6 Convergent validity and discriminant validity.
Convergent validity is used to ensure the measurement items for relevant constructs
actually measure that particular construct (Hair et al., 2010). Discriminant validity
measures the uniqueness of the constructs to each other in the model (Hensley et al.,
2009). Convergent validity ensures that constructs that are expected to be related are
in fact related while discriminant validity test that constructs that should have no

60
relationship do in fact not have any relationship. Convergent validity of the
measurement model can be assessed by the Average Variance Extracted (AVE).
AVE measures the level of variance captured by a construct versus the level due to
measurement error, values above 0.7 are considered very good, whereas, the level of
0.5 is acceptable (Hair et al.,2010). Discriminant validity can be assessed by
comparing the amount of the variance capture by the construct (AVE) and the shared
variance with other constructs thus the AVE for each construct should be greater than
the squared correlation involving the constructs. The Table 4.4 shows the AVE
values are all above 0.5 as recommended by Hair et al. (2010) and the squared
correlations among are less than AVE values this indicates that the measuring scale
exhibited adequate convergent and discriminant validity. The AVE values are (0.622;
0.874; 0.743; 0.793; 0.597;0.598 and 604) and the squared correlations values are
(0.392, 0.418,0.499,0.351,0.473,0.445,0.216 0.285, 0.2130, 0.377, 0.141, 0.171,
0.127,0.293,0.342,0.278,0.319,0.171,0.354,0.334,0.264)
Table 4.4: Convergent validity and Discriminant validity
PROCESS LEARN CUSTOMER FINANCIAL FOCUS DIFF COST
PROCESS 0.622
LEARN 0.392 0.874
CUSTOMER 0.418 0.499 0.743
FINANCIAL 0.351 0.473 0.445 0.793
FOCUS 0.216 0.285 0.213 0.377 0.597
DIFF 0.141 0.171 0.127 0.293 0.342 0.598
COST 0.278 0.319 0.171 0.354 0.334 0.264 0.604
4.2.7 Reliability results
Reliability test was conducted as a test of whether data collecting instrument yield
the same results on repeated trials. The measurement of the reliability of a data
instrument helps the researcher to gauge the goodness of the variable of the

61
measurement (Sekaran & Bougie, 2010). The widely used Cronbach coefficient
alpha was employed to assess internal consistency. Bryman and Cramer (1997)
stated that reliability of 0.70 Cronbach alpha is normally accepted in basic research.
Zikmund et al. (2010) also posit that Cronbach alpha of 0.60 as a minimum is
accepted. All the alpha coefficient ranged from above 0.731 to 0. 895 as shown in the
Table 4.5. based on the coefficient values the items tested were deemed reliable for
this study.
Table 4.5: Cronbach alpha Reliability results
Variable Number
of items
Reliability
Cronbach’s
alpha
Comment
Total quality management 9 0.786 Accepted
Cost leadership strategy 10 0.800 Accepted
Differentiation strategy 8 0.791 Accepted
Market focus strategy 7 0.790 Accepted
Financial performance 14 0.778 Accepted
Customer satisfaction 6 0.731 Accepted
Internal process performance 9 0.807 Accepted
Learning and growth 9 0.895 Accepted
4.3 Biodata of the Respondents
4.3.1 Gender
The study sought to establish the gender of the respondents involved in management
of Kenyan manufacturing firms. 64.7 % of the respondents were male and 35.3% of
the respondents were female. From the findings Majority of the respondents in the
study were male indicating there are more male in management than women are in
management in the manufacturing firms in Kenya. This result can also be attributed
to the strong male domineering culture in Kenya (Karanja, 2011). These findings are
also in line with ILO report (2015) which states that in Kenya women holds only 44
or 9.5% of the 462 board seats of the 55% of the companies listed at the Nairobi
securities exchange (NSE).

62
4.3.2 Work experience
The respondents were asked to indicate the number of years they have been in
management positions. It was observed that 55.9% of the respondents have been in
management for 4 – 6 years, 41.2% of the respondents have been in management for
more than 6 years and only 2.9 % of the respondents have been in management for
less than 2 years. This indicates the respondents had a clear understanding of the
organization operation and they had relevant information needed for the study
Table 4.6: Work Experience
Frequency Percentage Cumulative Percent
0- 2 Years 3 2.9 2.9
4-6 Years 57 55.9 58.8
6 Years above 42 41.2 100
Total 102 100
4.3.3 Highest level of Educational of the respondents
The educational profiles of the respondents are as presented in Table 4.7 which
shows that 9.8% of the respondents were diploma holders, 62.7% of the respondents
had bachelor’s degrees and 27.4 % of the respondents had master’s degree. This
shows that majority of the respondents were highly educated and trained. This
concurs the findings by Heshmati and Rashidghalam (2016) which showed that
training and education were highly associated with higher labour productivity in the
Kenyan manufacturing and services industry.

63
Table 4.7: Highest level of Education of the Respondents
Frequency Percentage
Diploma 10 9.8
Bachelor degree 64 62.7
Master’s degree 28 27.4
Total 102 100
4.3.4 The number of competitors the organization faced
The respondents were asked to indicate the number of competitors the organization
faced. Table 4.8 show that 14.7% of the manufacturing companied had less than 5
competitors, 35.3% of the respondents had between 5 – 20 competitors; 35.3% of the
respondents had between 20 - 40 competitors; 8.8 % of the respondents had 40-60
competitors and 5.9% of the respondents had more than 60 competitors. This shows
that competition in the manufacturing industry is high hence the need to adopt both
generic strategies and TQM in the organization. These findings are consistent to the
findings by African development bank group (2014) which shows that the
manufacturing sector in Kenya is facing high competition both locally and
internationally.
Table 4.8: The number of competitors the organization faced
Number of
competitors
Frequency Percentage Cumulative
Percentage
0 -5 15 14.7 14.7
5 -20 36 35.3 50.0
20 -40 36 35.3 85.3
40 -60 9 8.8 94.1
Above 60 6 5.9 100
Total 102 100

64
4.4 Descriptive analysis
The purpose of the study was to investigate the mediating effect of TQM on the
relationship between generic strategies and organization performance. Descriptive
statistics for the following variables cost leadership strategy, differentiation strategy,
focus strategy, total quality management and organization performance were
analysed.
The study seeks to find out the extent to which the firms had implemented cost
leadership strategy. The respondents were asked to rank the following statement
using Likert scale. The responses were as shown in the Table 4.9.
Table 4.9: Cost Leadership Strategy
Cost leadership strategy N Min Max Mean
Std.
Deviation
Most of our products are standardized 102 4.00 5.00 4.5000 0.50752
We produced in large quantities 102 2.00 5.00 4.0881 0.79268
We buy raw materials at fairly good prices 102 2.00 5.00 3.9647 0.87644
We maintain good Supplier relationships 102 2.00 5.00 3.8725 0.78651
We charge prices lower than their
competitors 102 3.00 5.00 3.8599 0.65747
we emphasized on cost cutting measures 102 3.00 5.00 3.8224 0.66881
We have reduced labour input through
automation 102 2.00 5.00 3.6766 0.72699
We have Integrated our supply chain with
suppliers
102 2.00 5.00 3.5778 0.98610
We continuously train our employees to
improve efficiency
102 2.00 5.00 3.4765 0.94595
We outsource functions to control costs. 102 2.00 5.00 3.1176 0.86936

65
The respondents agreed on the following statements; Most of their products are
standardized (mean of 4.5000); they produced in large quantities (mean of 4.0881);
they buy raw materials at fairly good prices (3.9647); they have good relationship
with their suppliers (3.8725) that they charged prices lower than their competitors
with (mean of 3.8599); they emphasized on cost cutting measures (mean of 3.8224);
and they have reduced labour input through automation (mean of 3.6766) and lastly
they agreed that they had integrated their supply chain with suppliers (3.5778). The
respondents were neutral when they were asked whether they continuously train their
employees to improve efficiency (mean of 3.4765) they were also neutral on whether
they outsource functions to control costs (mean of 3.1176).
From the findings, it is further noted that response to the statement used to measure
cost leadership strategy ranged from 4.50 to 3.11. This shows that majority of the
respondents were in agreement with the statement used to measure cost leadership
strategy in the organization. Similarly, the standard deviation for all the items was
below 1.0. It can be deduced that the response for the item were not deviating much
from the expected response. This shows that most of the manufacturing firms in
Kenya have implemented, cost leadership strategy. This finding are similar to the
findings of a study carried out by Mutunga and Minja (2014) which shows that 81.2
% of Kenyan food and beverage firms have implemented cost leadership strategy
either exclusively or as a dual strategy with differentiation strategy.
4.4.2 Differentiation Strategy and Organization Performance
The respondents were asked to rank the following statement concerning the extent to
which manufacturing firms had implemented differentiation strategy. Their
responses were as presented in Table 4.10

66
Table 4.10: Differentiation Strategy
Differentiation strategy N Min Max Mean
Std.
Deviation
Our product and service have a strong
brand identity
102 3.00 5.00 4.2059 .64099
We have improved quality of customer
services
102 3.00 5.00 4.0932 .43421
we meet our customer needs more than
our competitor
102 2.00 5.00 3.9863 .73223
We have increased our marketing
communication to differentiate ourselves
102 3.00 5.00 3.9422 .70221
We continuously develop unique
products 102 3.00 5.00 3.8549 .70205
we have improved the quality of our
products to distinguish ourselves
102 2.00 5.00 3.7943 .53820
We trained our employees on how to
handle customers 102 2.00 5.00 3.7053 .61835
We invest in research and development 102 2.00 4.00 3.4453 .56723
The respondents agreed with the following statement concerning differentiation
strategy; they had built strong brand identity (4.2059); had improved quality of
customer service (4.0932); they were able to meet their customer needs more than
their competitors (3.9863). They had increased marketing communication activities
to distinguish themselves (3.9422); they continuously develop unique products
(3.8549); they produced higher quality products to differentiate themselves (3.7943)
and lastly, they trained employees on how to handle customers (3.7053). However,
the respondents were neutral about the expenses spend on research and development
(3.4453), this is consistent with world bank (2016) report which shows that Kenyan
firms did not spend enough on research and development; On average only 0.5% of
the total company expenses is spend on research and development.

67
From the findings of the study it is further noted that response to the statement used
to measure differentiation strategy ranged from (3.4453 to 4.2059). This shows that
majority of the respondents were in agreement with the statement used to measure
differentiation strategy in the organization. Similarly, the standard deviation of all the
items are below 1.0. It can be deduced that the response for the item were not
deviating much from the expected response. This shows that most of the
manufacturing firms in Kenya have implemented, differentiation strategy. The
findings are consistent with the findings by Waweru (2011) which showed that 89%
of firms in Kenya implemented differentiation strategy either exclusive or as a dual
strategy with cost leadership. Similarly, Minja and Mutungu (2014) study in the food
and beverage manufacturing industry shows similar results. That is 75% of the
manufacturing firms have implemented differentiation strategy.
4.4.3 Focus Strategy and Firm’s Performance
The respondents were also asked to rate the following statement concerning focus
strategy. Their responses were as presented in Table 4.11.
Table 4.11: Focus Strategy
Focus strategy
N Min Max Mean Std.
Deviation
Our prices are set based the products
quality
102 2.00 5.00 3.8834 .80772
We quickly respond to changes in
demand of our customers
102 2.00 5.00 3.8475 .95254
We meet our customer needs more
than our competitors
102 2.00 5.00 3.7453 .93124
We offer tailored market
communication messages to specific
market segments
102 2.00 5.00 3.6472 .91725
We produce speciality products 102 2.00 5.00 3.6276 .85333
We offer customized customer
services
102 2.00 5.00 3.5688 .85957
Our customers are involved in
developing new products
102 2.00 5.00 3.4716 .96091

68
The respondents agreed that their prices are set based on products quality (3.8834).
They respond to changes in demand of our customers (3.8475); they were able to
meet customer needs more than their competitors (3.7453); their market
communication messages were tailored to specific customer segments (3.6472); they
produce speciality products (3.6276) and lastly they agreed that they offered
customized customer services (3.5688); However, they were neutral on whether they
involved their customers in developing new products (3.4716).
From the findings of the study it is further noted that response to the statement used
to measure focus strategy ranged between (3.4716 - 3.8834). This shows that
majority of the respondents were in agreement with the statement used to measure
focus strategy in the organization. Similarly, the standard deviation of majority of the
items is below 1.0. It can be deduced that the response for the item were not
deviating much from the expected response. This shows that most of the
manufacturing firms in Kenya have implemented, focus strategy. The findings are
consistent with the findings by Atikiya et al. (2015) which showed that 23% of firms
in Kenya implemented focus strategy.
4.4.4 Competitive Strategies Adopted
From the above findings, it can be noted that most manufacturing firms had adopted
all the three generic strategies combined. This is in line with the work of Atikiya et
al. (2015) which revealed that the manufacturing firms in Kenya preferred
differentiation strategy as a method of obtaining competitive advantage and cost
leadership enabled the manufacturing firms to expand their market share while focus
strategy enabled firms to reach market segments that are not well served. This
finding are also similar to Waweru (2011) which revealed that manufacturing firms
in Kenya embraced a combination of cost leadership, differentiation and focus
strategy simultaneously. Closely related to this are the findings by Salavou (2013)
which showed that firms in Greece preferred hybrid strategies to pure strategies.

69
4.4.5 Total Quality Management
The study sought to find out the extent to which firms had implemented TQM. The
respondents were asked to rate the following statements key to TQM
implementation. Table 4.12 shows their ratings of the statements.
Table 4.12: Total Quality Management
Total quality management
N Min Max Mean
Std.
Deviation
We have quality Leaders who are our
mentors
102 2.00 5.00 3.8935 .75761
We have implemented continuous
improvement philosophy
102 2.00 5.00 3.8235 .79661
We all work together as a Team
102
2.00 5.00 3.7945 .76986
We empower our Employee through
training
102 2.00 5.00 3.7853 .75111
We bench mark with the best in the
industry
102
2.00 5.00 3.7677 .78079
Our top managers are commitment to
TQM implementation
102 1.00 5.00 3.7637 .88963
We have reduced wastage 102 2.00 5.00 3.6376 .69695
We partner with our Suppliers 102 1.00 5.00 3.5882 .85697
We are committed to our Customer 102 1.00 5.00 3.5588 .82356
The respondents agreed the organization had quality leaders who drives its vision
and mentor others (3.8935); they had implemented continuous improvement
philosophy (3.8235); they empowered Employees through training (with mean of
3.7853); they benchmark with the best in the industry to enabled them to improve
operation processes (mean of 3.7677); the top-level management were commitment
to TQM implementation (3.7637); they were committed to zero defect philosophy
(3.6376 and lastly they agreed that they were committed to their Customer (3.5588).
From the findings of the study it is further noted that response to the statement used
to measure the level of TQM adaptation ranged from (3.5588 to 3.8935). This shows
that majority of the respondents had implemented TQM in the organization.

70
Similarly, the standard deviation for all the items was below 1.0. It can be deduced
that the response for the item were not deviating much from the expected response.
4.4.6 Financial Performance
The study sought to find out the financial performance of the organization, the
respondents were asked to rate the following statement indicating the organization
financial performance. The responses were as indicated in Table 4.13.
Table 4.13: Financial Performance
Financial indicator
N Min Max Mean Std.
Deviation
We have Improved asset
utilization
102 3.00 5.00 3.9218 .71213
We have reduced amount of
wastage in the organization
102 2.00 5.00 3.9118 .83003
We have reduced the fixed capital
needed to support a given level of
business
102 2.00 5.00 3.8765 .87803
We have reduced indirect cost
common resources are shared with
other business unit
102 2.00 5.00 3.7981 .72944
Our Sales growth rate has
improved
102 2.00 5.00 3.7941 .76986
Our organization has introduced
new revenue sources by entering
introducing new products
102 2.00 5.00 3.7841 .68664
We have disposed parts of current
and fixed asset base not in use
102 3.00 5.00 3.7607 .69887
Our organization has improved the
existing customers profitability
102 2.00 5.00 3.7471 .81212
We have been more careful in
asset acquisition
102 2.00 5.00 3.7352 .89732
Our market share has increased 102 2.00 5.00 3.7153 .89811
Our organization has introduced
new revenue sources by entering
into new markets
102 2.00 5.00 3.7147 .78079
We have Lowered the direct cost
of products and services
102 2.00 5.00 3.6765 .76755
Our Profit growth rate has increase 102 2.00 5.00 3.6271 .88360
We have reduced the working
capital needed to support a given
level of business
102 2.00 5.00 3.6176 .81704

71
The respondents agreed that the their organization had improved their financial
performance, in the following areas (the mean score for various variables has been
written against the them); their Sales growth rate has improved (3.7941); their
market share has increased(3.7153); their Profit growth rate has increased (3.6271);
their organization has introduced new revenue sources by entering into new markets
(3.7147); their organization has introduced new revenue sources by introducing new
products (3.7841) and lastly their organization has improved the existing customers
profitability (3.7471).
On cost reduction the respondents agree they had reduced wastage in the
organization (3.9118); they had Lowed the direct cost of products and service
(3.6765); they had reduced indirect cost common resources are shared with other
business unit (3.7981) they had Improved asset utilization (3.9218); they had
reduced the working capital needed to support a given level of business (3.6176) they
had reduced the fixed capital needed to support a given level of business (3.8765);
they had been more careful in asset acquisition (3.7352) and lastly they disposed
parts of current and fixed asset base not in use (3.7607). Studies (Mehralian, Nazari,
Nooriparto and Rasekh, 2017) show that a combination of TQM philosophy and
tools positively influence both cost reduction and business performance. Fotopoulos
and Psomas (2010) studies further revealed in their studies that TQM has a
substantial positive effect on both operational and organization performance. The
findings show TQM and generic strategies have positive effect on organization
financial performance. There is evidence that TQM has an indirect effect on
organization financial performance. Chaudary et al., (2015) study showed there is an
indirect relationship between TQM and financial performance.
4.4.7 Customer Satisfaction
The respondents were asked to rate the following statement concerning customer
satisfaction. Their ratings are as shown in Table 4.14.

72
Table 4.14: Customer Satisfaction
Customer satisfaction indicator N Min Max Mean Std.
Deviation
Our customer is loyal to us 102 3.00 5.00 4.0598 .69375
We have managed to retain our
customers over the years
102 3.00 5.00 4.0009 .84909
Our customers have provided us with
quality knowledge which has enabled
us to develop and/improve our
products and business processes.
102 3.00 5.00 4.0000 .55048
Our customers have always
recommended our products to others
102 2.00 5.00 3.9412 .81431
The number of customer complaints
have reduced over the years
102 3.00 5.00 3.8824 .68599
We have continuously acquired new
customers
102 2.00 5.00 3.8529 .74396
The respondents agreed on the following statement; their customer was loyal to them
(mean score of 4.0598); they had retained their customers over the years (mean score
of 4.0009); the customers provided them with quality knowledge which has enabled
them to develop and/improve our products and business processes (Mean of 4.0000);
their customer has always recommended their products to others (3.9412); the
number of customer complaints have reduced over the years (mean score of 3.8824)
and lastly, they have continuously acquired new customers (3.8529). These findings
are consistent with Ngigi and Njeru (2014) study shows there is a positive
relationship between generic strategies (differentiation and cost focus) and customer
satisfaction. Similarly, studies (Kim, 2016; Kumar et al., 2009; Mehra & Rangathan,
2008) concluded that there is a strong significant relationship between TQM and
customer satisfaction.

73
4.4.8 Internal Process Improvement
The respondents were asked to rate the following statement used measure internal
process performance. Their responses are as shown in the Table 4.15 below.
Table 4.15: Internal process improvement
Indicator N Min Max Mean Std.
Deviation
We have integrated seamlessly with our
customer’s value chains to deliver solutions
102 3.00 5.00 4.0578 .60006
We have Built a strong customer
management process
102 3.00 5.00 4.0290 .57658
We have a Leading-edge innovation
process that have enabled us create new
products
102 2.00 5.00 3.8929 .74396
We have Speed and efficiency in
distribution process
102 3.00 5.00 3.8129 .65747
We have excellence supplier relationships 102 1.00 5.00 3.7653 1.02422
We have improved the quality of our
products
102 2.00 5.00 3.7647 .78079
We have reduced our operation costs 102 2.00 5.00 3.6971 .84861
We have speed and efficiency in supply
process
102 2.00 5.00 3.6577 .88360
We have reduced the cycle time of
operating process
102 2.00 5.00 3.5000 .82572
The respondents agreed that internal business processes had generally improved.
They agreed that the different aspects of business processes (with mean score written
against each variable) had improved; On customer management process the
respondents agreed they had integrated seamlessly with customer’s value chains to
deliver solutions (4.0578) and that they have built a strong customer management
process (4.0290). The respondents also agreed (3.8929) they have built a leading-
edge innovation process that have enabled them create new products and they had
increased Speed and efficiency in distribution process (3.8129). They also agreed
that they had excellence supplier relationships (3.7653); the quality of their products
had improved (3.7647), their operation costs had reduced (3.6971); they had

74
increased speed and efficiency in supply process (3.6577) and lastly, they agreed that
the cycle time of operating process had reduced (3.5000). Rapid technological
changes in the world demands that organizations continuously improve internal
processes. The results show that implementation of TQM coupled with generic
strategies encourages to improve internal processes. This is in line with the findings
of previous studies (Baird et al., 2011; Kumar et al., 2009) which results suggest that
TQM implementation can improve internal processes or modify the existing
organizational operations
4.4.7.4 Learning and Growth
The respondents were asked to rate the following statement used measure on
organization learning and growth. Their findings are shown in Table 4.16.
Table 4.16: Learning and growth
Indicator N Min Max Mean Std.
Deviation
We understand our customer’s needs 102 3.00 5.00 4.0294 .62694
We ensure that everyone knows the
customer
102 2.00 5.00 4.0000 .81650
We make our company knowledge
available to our customers
102 2.00 5.00 3.9706 .75820
We emphasize on team work 102 2.00 5.00 3.8412 .99060
We continuously train our employees to
improve their skills
102 3.00 5.00 3.7588 .60006
We capture knowledge from our
customer
102 3.00 5.00 3.7353 .61835
We reuse what other parts of the
company have already learnt
102 2.00 5.00 3.6770 .91725
We ensure that ideas flow from
customer service to research and
development
102 2.00 5.00 3.6471 .84861
We capture knowledge from our
suppliers
102 2.00 5.00 3.5294 .74814

75
The respondents agreed that they understand their customer’s needs (4.0294); they
ensure that everyone knows the customer (4.0000), they made company knowledge
available to their customers (3.9706); they emphasize on team work (3.8412); they
continuously train their employees to improve their skills (3.7588), they captured
knowledge from their customer (3.7353); they reused what other parts of the
company have already learnt (3.6770);they ensure that ideas flow from customer
service to research and development (3.6471) and lastly they capture knowledge
from their suppliers (3.5294).
These findings are in agreement with findings of Aboyassin et al. (2011) which
showed there exist a link between KM processes and the principles of TQM. There is
significant correlation between knowledge management processes (diagnosis,
acquisition, generation, sharing, storing and application) and TQM principles
(adaptation of quality and commitment of senior staff; focus on customers;
continuous improvement, training and education, and employee participation. The
study further revealed that acquiring and applying knowledge are the most important
process to achieve overall quality. Akgun et al. (2014) study also revealed the same
TQM principles enables a firm to acquire, interpret, translate and deploy the
knowledge, skills and attitude of people throughout the organization to establish
learning capability.
4.5 Factor Analysis
The study conducted a structural equation modelling using the analysis of moment
structures (SPSS AMOS) to construct a conceptual modelling linking the variables
understudy. The study employed confirmatory factor analysis to construct the linkage
between the dimension of generic strategies, TQM and dependent variables. The
study also followed two step approaches for SEM. The confirmatory measurement
model and confirmatory structure model as outlined by Anderson and Gerbing
(1988).

76
4.5.1 Confirmatory Measurement Model
The first phase involved Confirmatory Factor Analysis (CFA) that involved
evaluation of measurement model on multiple criteria. Prior to CFA, exploratory
factor analysis (EFA) that involve computation of factor loading matric,
communality and principle component analysis (PCA) was conducted.
4.5.2 Exploratory Factor Analysis
To test whether the items were associated with specific factors, Exploratory Factor
Analysis (EFA) was used. EFA was used to identify factors based on data and to
maximize the amount of variance explained. To assess the factorability of items, two
indicators were examined that is Kaise Meyer-Olkin measure of sampling adequacy
and Barlett test of sphericity (Pallant, 2010). KMO & Bartlett’s Test of Sphericity
was used to measure of sampling adequacy that is recommended. The Bartlett’s Test
of Sphericity relates to the significance of the study and thereby shows the validity
and suitability of the responses collected to the problem being addressed through the
study. For Factor Analysis to be recommended suitable, the Bartlett’s Test of
Sphericity must be less than 0.05 in this study the Bartlett test of sphericity is less
than 0.01 for all the variables used in the study this shows the data was suitable for
factor analysis .
Kaiser-Meyer-Olkin (KMO) Test was used to measure the suitability of data is for
Factor Analysis. The KMO ranges from 0 to 1. According to Kaiser KMO values of
0.00 to 0.49 are unacceptable; 0.50 to 0.59 are miserable; Values of 0.60 to 0.69 are
mediocre; Values of 0.70 to 0.79 are middling; 0.80 to 0.89 meritorious and 0.90 to
1.00 marvellous. The KMO value as indicated in Table 4.17 was 0.875 showing the
data was adequate for factor analysis.

77
Table 4.17: KMO and Barlett Test
34.5.3 Factor Analysis for Independent Variable
EFA was used to reduce the number of variables from large to small, establish
underlying dimensions between measured variables and constructs and provide
construct validity evidence (Field, 2009). The KMO values for independent and
dependent variables in the study ranges from 0.764 to 0.891 with most values
above 0.80. This shows that the data was suitable for factor analysis. Stevens (2002)
recommends that for a sample size of 50 a loading of 0.722 can be considered
significant, for 100 factor loading of 0.512 is considered significant. The population
size in the study is 102 the factor loading for the variables are significant as they
range from 0.609 to 0.964. Reliability of 0.70 Cronbach alpha is normally accepted
in basic research. Zikmund et al. (2010) also posit that a Cronbach alpha of 0.60 as a
minimum is accepted. All the alpha coefficient ranged from 0.739 to 0.922 based on
the coefficient values the items tested were deemed reliable for this study.
4.5.4 Factor Analysis for Cost Leadership Strategy
The KMO value for cost leadership was 0.875 and Bartlett's Test of Sphericity was <
0.00001. This shows that the data was suitable for factor analysis. Factor analysis
was conducted using principal component method. The extraction of the factors
followed the Kaiser Criterion where an Eigen value of 1 or more indicates a unique
factor (Field, 2009). Total variance analysis indicated that the ten statements of cost
leadership could be factored into three factors as shown in appendix VII. The three
KMO and Bartlett's Test
Kaiser-Meyer-Olkin Measure of Sampling Adequacy. .875
Bartlett's Test of Sphericity
Approx.
Chi-Square 1450.694
df 190
Sig. .000

78
factors are Supplier relationship; Economies of scale and Improved efficiency as
shown in Table 4.18. Supplier relationship (CL1) the items under supplier relations
included Integration of supply chain with suppliers; Supplier relationships and
accessing raw materials at fairly good prices. Under Economies of scale (CL2) the
items included Production in large quantities; Standardized products and Selling at
lower prices, under improved efficiency (CL3) the items included out sourcing,
Internal cost cutting measures and automation of processes.
Table 4.18: Factor Analysis for Cost Leadership Strategy
Factor Item Items Factor
loading
Cronbach
alpha
Supplier
relationship (CL1)
Integration of supply chain
with suppliers
0.872 0.893
Supplier relationships 0.956
We buy raw materials at fairly
good prices
0.941
Economies of
scale (CL2)
Production in large quantities 0.925 0.776
Standardized products 0.894
Selling at lower prices 0.762
Improved
efficiency (CL3)
Out sourcing 0. 786 0.852
Internal cost cutting measures 0.922
Automation of processes 0.788
4.5.5 Factor Analysis for Differentiation Strategy
The KMO value was 0.807 and Bartlett's Test of Sphericity was < 0.00001. This
show the data was suitable for factor analysis. Factor analysis was conducted using
principal component method. The extraction of the factors followed the Kaiser
Criterion where an Eigen value of 1 or more indicates a unique factor (Field, 2009).
Total variance analysis indicated that the eight statements of differentiation could be

79
factored into three factors as shown in appendix VII. The three factors as shown in
Table 4.19 are high level of customer service (DS1), developing unique products
(DS2) and increased marketing activities (DS3). Under customer service the key
component included training employees on customer care, quality services and the
organization responsive to customer needs. Under marketing services, the variable
included marketing communication activities and building brand identity. Lastly
under product development the subcomponent included improved product quality,
continuous development of new product and lastly diversifying unique product
range.
Table 4.19: Factor analysis for differentiation strategy
Factor Sub-component Factor
loading
Cronbach
alpha
Customer service
(DS1)
Well trained employees on
customer care
0.796 0.922
Offer quality customer services 0.793
Responsive to customers’ needs 0.809
Marketing services
(DS2)
Build brand identity
0.838 0.739
Increased marketing
communication activities
0.647
Product development
(DS3)
Improve product quality 0.847 0.828
continuously development of
new products
0.730
Diversified unique product
range
0.696

80
4.5.6 Factor analysis for Focus strategy
The KMO value was 0.866 and Bartlett's Test of Sphericity was < 0.00001. The data
was suitable for factor analysis. EFA was conducted using principal component
method. The extraction of the factors followed the Kaiser Criterion where an Eigen
value of 1 or more indicates a unique factor. Total variance analysis indicated that
the eight statements of focus strategy could be factored into two factors as shown in
appendix VII. The two factors are customized customer service (CF1) and
customized marketing mixes (CF2) as shown in Table 4.20. Under specialized
customer service components, the subcomponent included quick responses to the
changing customer demands, employees trained on how to handle customers,
meeting the customer needs better than competitors and personalized customer
services. while under customized marketing mixes the subcomponent included
products tailored to meet customer demand and customers involved in developing
new products, tailored market communication messages, competitive pricing based
on quality of products.
Table 4.20: Factor Analysis for Focus strategy
Component Sub-components Factor
loading
Cronbach
alpha
Customized
customer
service (CF
1)
quick responses to the changing customer
demands 0.714
0.905
Competitive services 0.609
Training 0.861
Personalized customer services 0.919
Serving
specific
market
segment (CF
2)
Products tailored to meet specific customers’
needs 0.855
0.876
Tailored market communication messages 0.661
pricing is based on product quality 0.877
Customers are involved in developing new
products
0.892
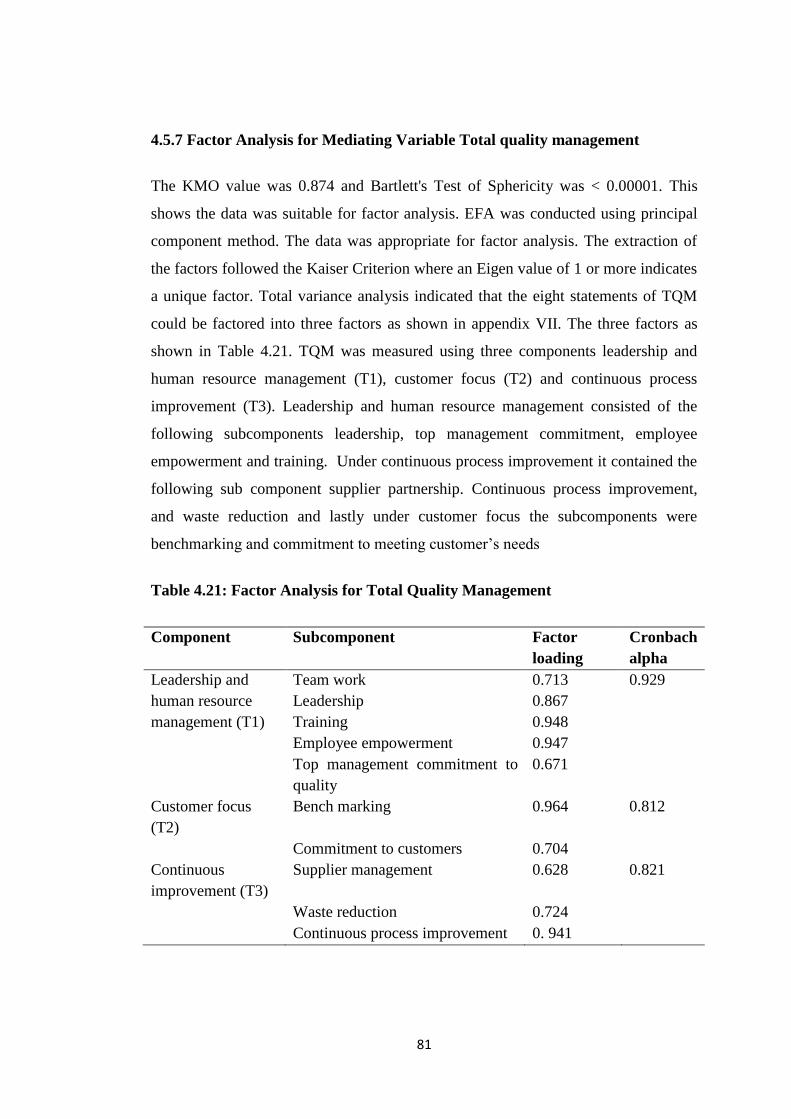
81
4.5.7 Factor Analysis for Mediating Variable Total quality management
The KMO value was 0.874 and Bartlett's Test of Sphericity was < 0.00001. This
shows the data was suitable for factor analysis. EFA was conducted using principal
component method. The data was appropriate for factor analysis. The extraction of
the factors followed the Kaiser Criterion where an Eigen value of 1 or more indicates
a unique factor. Total variance analysis indicated that the eight statements of TQM
could be factored into three factors as shown in appendix VII. The three factors as
shown in Table 4.21. TQM was measured using three components leadership and
human resource management (T1), customer focus (T2) and continuous process
improvement (T3). Leadership and human resource management consisted of the
following subcomponents leadership, top management commitment, employee
empowerment and training. Under continuous process improvement it contained the
following sub component supplier partnership. Continuous process improvement,
and waste reduction and lastly under customer focus the subcomponents were
benchmarking and commitment to meeting customer’s needs
Table 4.21: Factor Analysis for Total Quality Management
Component Subcomponent Factor
loading
Cronbach
alpha
Leadership and
human resource
management (T1)
Team work 0.713 0.929
Leadership 0.867
Training 0.948
Employee empowerment 0.947
Top management commitment to
quality
0.671
Customer focus
(T2)
Bench marking 0.964 0.812
Commitment to customers 0.704
Continuous
improvement (T3)
Supplier management
0.628 0.821
Waste reduction 0.724
Continuous process improvement 0. 941

82
4.5.8 Factor analysis for Dependent Variables
Organization performance was measured using balance scorecard approach, this
included financial, customer satisfaction, internal process improvement and learning
and growth
4.5.9 Factor analysis for Financial Performance
The KMO value was 0.764 and Bartlett's Test of Sphericity was < 0.00001. The data
was suitable for factor analysis. EFA was conducted using principal component
method. The extraction of the factors followed the Kaiser Criterion where an Eigen
value of 1 or more indicates a unique factor. Total variance analysis indicated that
the fourteen statements of focus strategy could be factored into two factors as shown
in appendix VII. The factors are profitability (F1) and cost reduction (F2) as shown
in Table 4.22. Under profitability the subcomponents include Sales growth rate
increase, growth in markets share, profit increase and introduction of new sources of
revenue. Under cost reduction the subcomponents included waste reduction, reduced
direct cost of products and service, reduced indirect cost and Improved asset
utilization
Table 4.22: Factor analysis for Financial performance
Components Subcomponents Factor loading Cronbach
alpha
Profitability
(F1)
Sales growth rate 0.710 0.847
growth in markets share 0.822
Profit increase 0.875
New sources of revenue 0.746
Cost
reduction
(F2)
Waste reduction 0.782 0.884
Reduced direct cost 0.813
Reduced indirect cost 0.694
Asset utilization 0.878

83
4.5.10 Factor analysis for Customer Satisfaction
The KMO value was 0.891 and Bartlett's Test of Sphericity was < 0.00001. This
shows data was suitable for factor analysis. Factor analysis was conducted using
principal component method. The extraction of the factors followed the Kaiser
Criterion where an Eigen value of 1 or more indicates a unique factor. Total variance
analysis indicated that the six statements of focus strategy could be factored into two
factors as shown in appendix VII. The two factors are customer management (CS1)
and acquisition of new customers (CS2) as shown in Table 4.23. Customer loyalty
was measured using customer loyalty, retention rate and complains handling.
Customer acquisition was measured using new customer acquisition and referrals
Table 4.23: Factor Analysis for Customer Satisfaction
Components Subcomponents Factor
loading
Cronbach
alpha
Customer
Management (CS1)
Customer loyalty 0.884
0.890
Customer retention 0.883
Customer complaints have
reduced
0.923
Customer
acquisition (CS2)
Acquiring new customers 0.917
0.846
Referrals of new customers 0.706
4.5.11 Factor analysis for Internal Process Improvement
The KMO value was 0.829 and Bartlett's Test of Sphericity was < 0.00001. This
shows data was suitable for factor analysis. Factor analysis was conducted using
principal component method. The extraction of the factors followed the Kaiser
Criterion where an Eigen value of 1 or more indicates a unique factor. Total variance
analysis indicated that the nine statements of internal process improvement could be
factored into three factors as shown in appendix VII, the three factors are efficiency
in supply chain management (PM1), customer value chain management (PM2) and

84
operation efficiency (PM3) as indicated in Table 4.24. Under Efficiency in supply
chain management the items included excellence supplier relationships and speed
and efficiency in supply process, Under Customer value chain management the
subcomponents included Speed and efficiency in distribution process, strong
customer management process, integrating seamlessly with our customer’s value
chains to deliver solutions and lastly Leading-edge innovation process that have
enabled organization create new products for our customers. Lastly under Operation
efficiency the items included reduced operation costs and reduced the cycle time of
operating process
Table 4.24: Factor analysis for Internal Process Performance
Components Subcomponents Factor
loading
Cronbach
alpha
Efficiency in supply
chain
management(PM1)
Excellence supplier
relationships 0.921
0.941
Speed and efficiency in
supply process 0.908
Customer value chain
management (PM2)
We have speed and
efficiency in distribution
process
0.876
0.893
We have built a strong
customer management
process
0.912
We have integrated
seamlessly with our
customer’s value chains to
deliver solutions
0.915
We have a leading-edge
innovation process that have
enabled us create new
products for our customers
0.749
Operation efficiency
(PM3 )
We have reduced our
operation costs 0.873
0.787
We have reduced the cycle
time of operating process 0.719
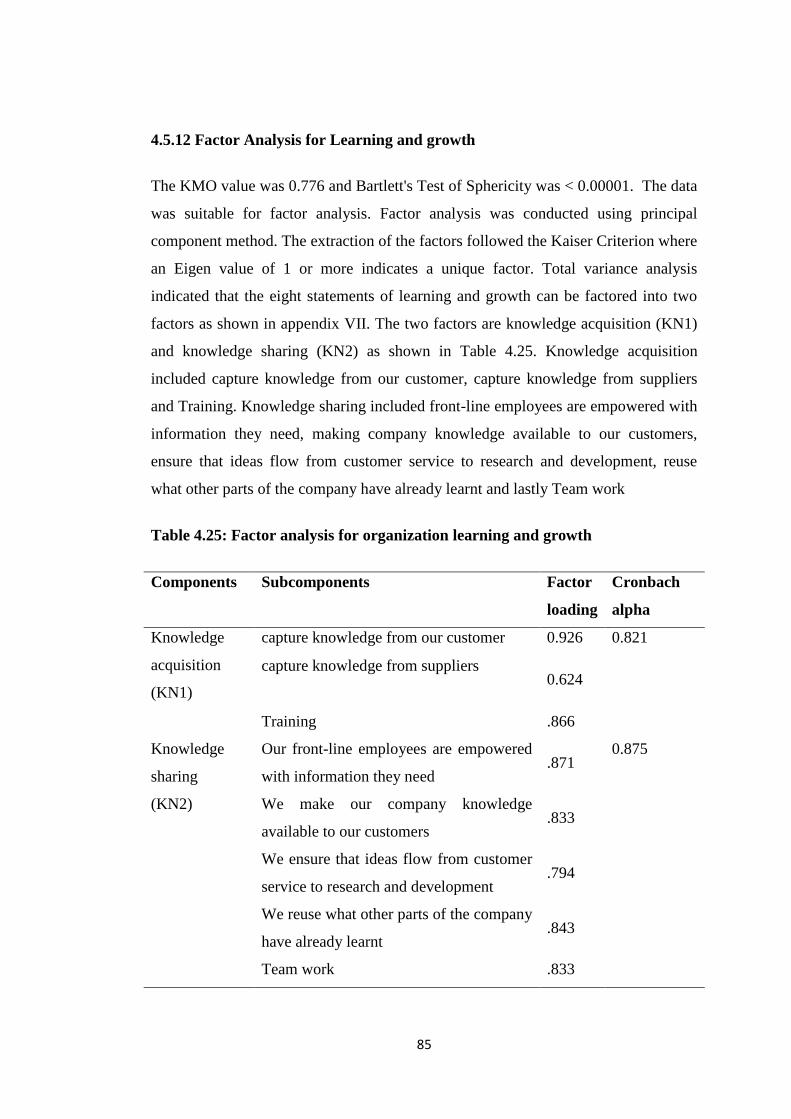
85
4.5.12 Factor Analysis for Learning and growth
The KMO value was 0.776 and Bartlett's Test of Sphericity was < 0.00001. The data
was suitable for factor analysis. Factor analysis was conducted using principal
component method. The extraction of the factors followed the Kaiser Criterion where
an Eigen value of 1 or more indicates a unique factor. Total variance analysis
indicated that the eight statements of learning and growth can be factored into two
factors as shown in appendix VII. The two factors are knowledge acquisition (KN1)
and knowledge sharing (KN2) as shown in Table 4.25. Knowledge acquisition
included capture knowledge from our customer, capture knowledge from suppliers
and Training. Knowledge sharing included front-line employees are empowered with
information they need, making company knowledge available to our customers,
ensure that ideas flow from customer service to research and development, reuse
what other parts of the company have already learnt and lastly Team work
Table 4.25: Factor analysis for organization learning and growth
Components Subcomponents Factor
loading
Cronbach
alpha
Knowledge
acquisition
(KN1)
capture knowledge from our customer 0.926 0.821
capture knowledge from suppliers 0.624
Training .866
Knowledge
sharing
Our front-line employees are empowered
with information they need .871
0.875
(KN2) We make our company knowledge
available to our customers .833
We ensure that ideas flow from customer
service to research and development .794
We reuse what other parts of the company
have already learnt .843
Team work .833

86
4.5.13 Communalities of Factors
Communality values used to measure the values of each observed variable that could
be explained by extracted factors (Field, 2009). Communality value less than 0.3
indicates that the variable does not fit well with other variables in its component and
is undesirable (Pallant, 2010). Small values indicate that variables do not fit well the
factor solution and could possibly be dropped from the analysis. Extracted
communalities are estimates of variance in variables accounted for by factors in each
factor solution. Extracted communalities values for this study ranged between 0.596
to 827 (appendix VII)
4.6 Confirmatory Factor Analysis
The confirmatory factor analysis was conducted in order to assess the extent to which
the observed data fitted the pre-specified theoretically driven model (Hair et al.,
2010). CFA was conducted on each construct to shows the extent to which the
observed variable (indicators) represent the underlying latent construct by assess
whether proposed variable indicators had significant factor loadings. Hence it
ensures the appropriate model was selected for analysis (Hooper et al.2008). The
results of CFA are presented in Figure 4.2
According to Hair et al. (2010) a significant standardized residual covariance is one
with absolute value greater than 0.5. The Figure shows that all the factor loading for
all hypothesized indicators measuring independence, mediating and dependent
variables are above 0. 65 hence they are acceptable.

87
Figure 4.2: Confirmatory Factor Analysis
4.7 Hypothesis testing
4.7.1 Confirmatory Structural Models and Hypothesis Testing of Study
Variables
The study used Structural Equation Modelling (SEM) to test the hypothesized
relationship and to fit the structural to SEM as recommended by Hooper et al.
(2008). Exploratory factor analysis was conducted to ensure the factor loading for
the indicator to be used were more than 0.4 and that variable indicators converged on
one common construct (Fielder, 2009). In order to assess whether the model

88
provided adequate fit for the data, the study considered both absolute fit indices and
incremental fit indices (Hair et al., 2010). Regression weights were used to test the
contribution of each indicator to their relevant construct (convergent validity).
Regression weights were also used to explain the nature of the relationship since all
the variables were in the same measurement scale.
Path diagrams (Models) were used to specify patterns of directional and non-
directional relationships among observed variables (Babin & Svensson, 2012). Path
coefficient estimates were used to determine the direction and strength of the factor.
This was conducted by the use of Analysis of Moment structures (SPSS AMOS)
software. SPSS AMOS software was used to assess the model fit, compute results
and develop a visual/graphic output.
In order to ascertain that the model provided adequate fit for the data the study also
considered the two types of fit statistics commonly used that is absolute fit indices
and incremental fit indices (Hair et al., 2010) for absolute fit indices the study used
root mean square error of approximation (RMSEA), RMSEA is related to the
residuals in the model, it analyse the discrepancy between the hypothesized model,
with optimally chosen parameter estimates, and the population covariance matrix.
The RMSEA values ranges from 0 to 1, with smaller values indicating better model
fit. A value of 0.08 or less is indicative of acceptable model fit (Hair el al, 2010).
Other absolute fit indices used were Goodness of Fit Index (GFI) and adjusted
goodness of fit index (AGFI). The goodness of fit index (GFI) is a measure of fit
between the hypothesized model and the observed covariance matrix. The adjusted
goodness of fit index (AGFI) corrects the GFI, which is affected by the number of
indicators of each latent variable. The GFI and AGFI range between 0 and 1, with a
value of over 0.8 generally indicating acceptable model fit (McDonald & Ho, 2002).
For incremental fit indices, comparative fit index (CFI) was used. The comparative
fit index (CFI) analyses the model fit by examining the discrepancy between the data
and the hypothesized model, while adjusting for the issues of sample size inherent in
the chi-squared test of model fit and the normed fit index. CFI values range from 0 to
1, with larger values indicating better fit.

89
4.8 TQM on the relationship between Cost Leadership Strategy and
Organization Performance
The first objective of the study was to establish the mediation effect of TQM on the
relationship between cost leadership strategy and organization performance and to
tested the null hypothesis;
H01: TQM practice has no significant Mediating effect on the relationship between
costs Leadership strategy and organization performance.
The study measured Organization performance using four dimensions (financial
performance, customer satisfaction, internal business process performance and
organization learning and growth) to provide a holistic view of the organization
performance as recommended by Kaplan and Norton (1992) in the balance score
card. To test the hypothesis and measure the mediation effect of TQM the study first
assessed its effects on different performance dimensions starting with financial
performance, customer satisfaction performance, internal process performance,
organization learning and growth and lastly its effect on the overall performance.
To ascertain that the models provided adequate fit for the data the study considered
both absolute fit indices and incremental fit indices. The fit indices used to verify that
the five models use test the hypothesis were adequate. Table 4.26 shows the five
model fit statistics were as follows, RMSEA values of 0.078, 0.094, 0.031, 0.059 and
0.078 all within the acceptance range; GFI of 0.943, 0.920, 0.973,0.966 and 0.927:
AGFI 0.901, 0.830, 0.930, 0.910 and 0.862 of and lastly CFI index of 0.951, 0.927,
0.997, 0.987 and 0.954 this also falls within the acceptance range. RMSEA Values
range from 0 to 1 with a smaller RMSEA value indicating better model fit (Marsh et
al., 2011). RMSEA value of less than 0.05 is considered excellent, 0.05 to 0.08 is
good while 0.1 is acceptable. (HU & Bentler 1999). According to Hair et al. (2010)
GFI, AGFI and CFI values > 0.90 are acceptable. This shows the model were fit to
test the hypothesis.

90
Table 4.26: Model Fit Statistics TQM, Cost leadership and Organization
performance
Model 1 Model 2 Model 3 Model 4 Model 5
RMSEA 0.078 0.094 0.031 0.059 0.078
GFI 0.943 0.920 0.973 0.966 0.927
AGFI 0.901 0.830 0.930 0.910 0.862
CFI 0.951 0.927
0.997 0.987
0.954
Model 1; TQM, Cost leadership and financial performance
Model 2; TQM, Cost leadership and customer satisfaction
Model 3; TQM, Cost leadership and internal process performance
Model 4; TQM, Cost leadership and organization learning and growth
Model 5; TQM, Cost leadership and overall performance
4.8.1 TQM effects on Cost Leadership strategy and financial performance.
The study adopted Baron and Kenny (1986) procedures for measuring mediation
effect as discussed in chapter three. The first step involves establishing that the
independent variable (cost leadership) is relate to the dependent variable (financial
performance) such that Beta in equation one is significant. The study findings as
presented in Table 4.27 showed there was a positive significant relationship between
Cost leadership strategy and financial performance; (β =0. 501 and P-value <0.01) a
unit increase in cost leadership strategy index led to an increase in manufacturing
firm financial performance index by 0.501. Since the p-value was less than 0.05 this
fulfils the first condition for testing mediation effects.
The second condition involves testing if the independent variable (cost leadership)
relate to the mediator variable (TQM) such that (β) in equation is significant. This
condition establishes the first stage of measuring the mediation effect. The findings
as presented in the Table 4.27 showed that there was a positive significant
relationship between cost leadership strategy and TQM (β =0.233 and P-value is
0.046). Since the p-value was less than 0.05 this shows that at 95% confidence level

91
cost leadership strategy affects TQM performance. This fulfils the second condition
for measuring mediation effects.
Lastly to test for mediation according to Baron and Kenny (1986) mediation test,
there should be a significant relationship between TQM and financial performance.
The findings as presented in the Table 4.27 shows the regression coefficients for
TQM is (β = 0. 596 and the P-value <0.01). since the p-value was less than 0.05 this
shows that TQM predicts the financial performance of the organization, and for cost
leadership strategy the regression coefficient is (β =0.352 and the P-value is 0.01)
similarly the p-value was less than 0.05 which shows that at 95% confident level
both TQM and cost leadership strategy predicts the financial performance of the
organization.
Table 4.27: Cost leadership strategy on TQM and financial performance
Relationship Regression
Weights
Standardized
Regression
Weights
S.E. P
Before TQM
mediation effects
FP < CL 0.310 0.501 0.078 0.010
TQM < CL 0.136 0.233 0.099 0.046
After TQM
mediation effects TQM < CL .143 0.246 0.067 0.039
FP < TQM .599 0.596 0.131 0.010
FP < CL .205 0.352 0.062 0.010
CL (Cost leadership strategy); FP (financial performance)
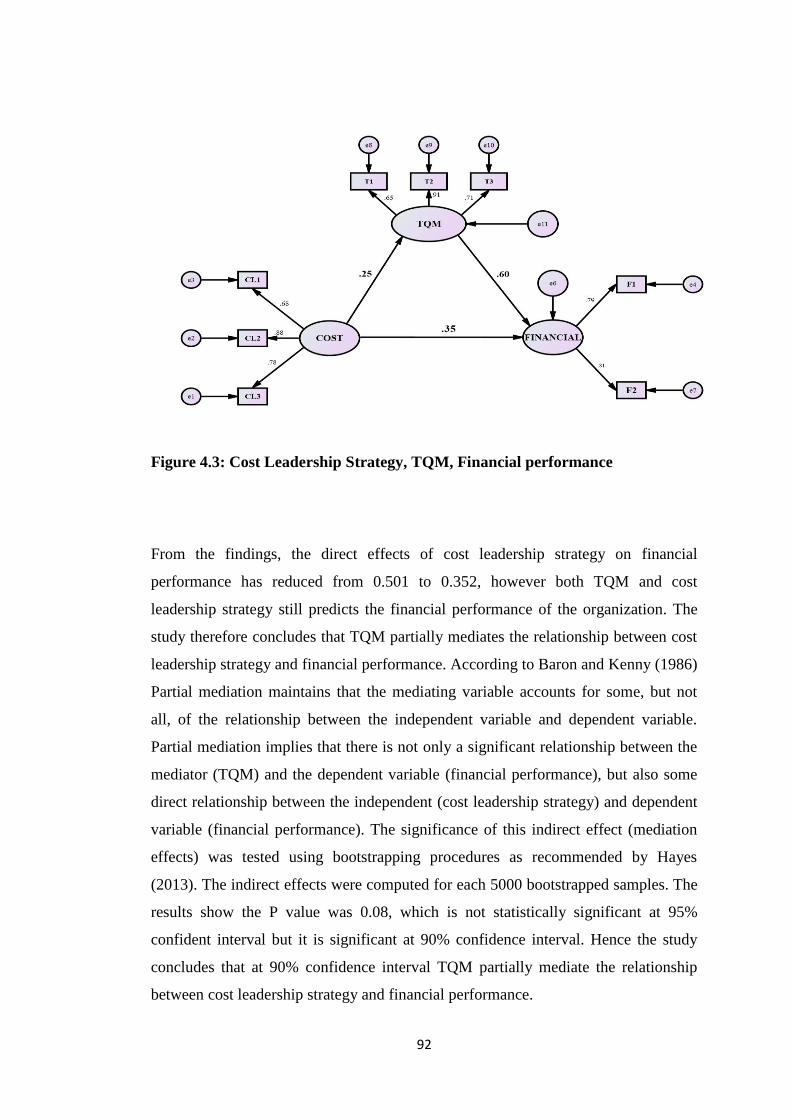
92
Figure 4.3: Cost Leadership Strategy, TQM, Financial performance
From the findings, the direct effects of cost leadership strategy on financial
performance has reduced from 0.501 to 0.352, however both TQM and cost
leadership strategy still predicts the financial performance of the organization. The
study therefore concludes that TQM partially mediates the relationship between cost
leadership strategy and financial performance. According to Baron and Kenny (1986)
Partial mediation maintains that the mediating variable accounts for some, but not
all, of the relationship between the independent variable and dependent variable.
Partial mediation implies that there is not only a significant relationship between the
mediator (TQM) and the dependent variable (financial performance), but also some
direct relationship between the independent (cost leadership strategy) and dependent
variable (financial performance). The significance of this indirect effect (mediation
effects) was tested using bootstrapping procedures as recommended by Hayes
(2013). The indirect effects were computed for each 5000 bootstrapped samples. The
results show the P value was 0.08, which is not statistically significant at 95%
confident interval but it is significant at 90% confidence interval. Hence the study
concludes that at 90% confidence interval TQM partially mediate the relationship
between cost leadership strategy and financial performance.

93
The following conclusions can be drawn from the study, there exist strong positive
relationship between cost leadership strategy and financial performance. This is
consistent with past Studies by Mutunga and Minja (2014) and Waweru (2011)
which showed there is strong relationship between cost leadership strategy and
financial performance. The study also shows that there exists strong positive
relationship between TQM and financial performance; Several studies (Fotopouos
Psomas & Vouzas ,2010; Salaheldin, 2009; Kumar et al., 2009) have also proven
there is significant relationship between TQM and organization financial
performance.
The study concluded that TQM partially mediates the relationship between cost
leadership strategy and financial performance. The indirect (mediation) effects can
be explained by the fact that TQM principles are closely related to cost leadership
strategy. According to Porter (1980) Attaining cost leadership requires aggressive
construction of efficiency scales and vigorous pursuit of cost reduction through
experience, tight cost and overhead control. Similarly, TQM is an organization
culture that emphasizes on elimination of wastes and reduction of different types of
costs hence enabling the organization attain cost reduction and improve its
profitability. However, the study shows that, TQM only partially mediated the
relationships between cost leadership strategy and financial performance this shows
that a significant portion of variance in performance is directly explained by cost
leadership strategies without being mediated by TQM. This finding is important in
the sense that when pursuing TQM under the context of cost leadership strategy,
organization also needs to furnish certain resources that are not accommodated by
TQM such as economies of scales and adaptation of technology.
This finding relates to the findings by Zatzick et al. (2012) study which revealed that
TQM mediated the relationship between cost leadership strategy and financial
performance in US manufacturing firms. Similarly, study by Yunis et al. (2013)
study also showed that there exists a positive relationship between TQM and cost
leadership strategy because TQM is an organization culture influencing strategy
choice and hence operational performance. The study therefore rejects the null

94
hypothesis and accepts the alternative hypothesis TQM mediates the relationship
between cost leadership strategy and financial performance.
4.8.2 TQM, Cost Leadership Strategy and Customer Satisfaction performance
The study adopted Baron and Kenny (1986) procedures to test for mediation effect.
The first step involves establishing that the independent variable (Cost leadership)
relates to the dependent variable (customer satisfaction) such that Beta in equation
one is significant. The study findings as presented in the Table 4.28 showed that
there was a positive significant relationship between cost leadership strategy and
customer satisfaction. (β =0.470 and P-value is 0.003) therefore a unit increase in
cost leadership strategy index led to an increase in manufacturing firm customer
satisfaction performance index by 0.470. Since the p-value was less than 0.05. This
fulfils the first condition for measuring mediation effects.
The second condition involves testing if the independent variable (cost leadership)
should related to the mediator variable (TQM) such that (β) in equation is significant.
This condition establishes the first stage of the mediation effect. The findings as
shown in the Table 4.28 showed that there was a positive significant relationship
between cost leadership strategy and TQM (β =.233 and P-value <0.0). Since the p-
value was less than 0.05. This fulfils the second mediation condition
Lastly to test for mediation according to Baron and Kenny (1986) mediation test,
there should be a significant relationship between TQM and customer satisfaction.
The findings as presented in the Table 4.28 shows the regression coefficients for
TQM is (β = 0.479 and the P-value is 0.01). which shows that TQM predicts the
customer satisfaction indices of manufacturing firms in Kenya and for cost
leadership strategy the regression coefficient is (β = 0.351 and the P-value is 0.002)
which is statistically significant. Both TQM and cost leadership strategy have a
significant effect on customer satisfaction. However, the direct effect of cost
leadership strategy on customer satisfaction performance has reduced from 0.470 to
0.351. The study concludes that TQM partially mediates the relationship between
cost leadership strategy and customer satisfaction.

95
Table 4.28: Cost leadership strategy, TQM and customer satisfaction
performance
Relationship Regression
Weights
Standardized
Regression
Weights
S.E. P
Before mediation effects
of TQM
TQM < CL .136 .233 .099 0.046
CS < CL .240 .470. .081 0.003
After TQM mediation
effects
TQM < CL .143 .239 .070 0.040
CS < CL .215 .351 .063 0.002
CS< TQM .476 .479 .133 0.010
CL (Cost leadership strategy); CS (customer satisfaction performance)
Figure 4.4: Cost leadership strategy, TQM, Customer satisfaction
96
The relationship between cost leadership strategy and customer satisfaction
performance was partially mediated by TQM. According to Baron and Kenny (1986)
Partial mediation maintains that the mediating variable accounts for some, but not
all, of the relationship between the independent variable and dependent variable.
Partial mediation implies that there is not only a significant relationship between the
mediator (TQM) and the dependent variable (customer satisfaction), but also some
direct relationship between the independent (cost leadership strategy) and dependent
variable (customer satisfaction). The significance of this indirect (mediation) effect
was tested using bootstrapping procedures. The indirect effects were computed for
each 5000 bootstrapped samples. The results show the P value was 0.049. Therefore,
the study concluded that the indirect (mediation) effect of TQM on the relationship
between cost leadership strategy and customer satisfaction performance is
significantly different from zero at 95% confidence level based on a bootstrap
approximation obtained by constructing two-sided percentile-based confidence
intervals.
The studies result show there is strong significant relationship between cost
leadership’s strategy and customer satisfaction and that TQM only partially mediate
this relationship. This can be explained by the fact that customers look for high value
or low cost and are less concern with uniqueness and high level of individualized
service (Miles, 2013). Though seeking low costs means customer’s service is
standardized, reducing the personal elements in service delivery, reducing network
costs and sealing off part of service to enhance efficiency. However, customer
Service quality expectation differs depending on the complexity of the service task
(Malhotra & Malhotra, 2013). When a firm competes as a cost leader, customers may
recognize that the cost leadership comes at a price and therefore be willing to trade
service quality for lower price and they will still be satisfied (Miles, 2013).
Furthermore the results show that TQM partially mediate the relationship between
cost leadership strategy and customer satisfaction this can be explained by analysing
the close link between TQM principle customer focus strategy and customer
satisfaction. TQM does not fully mediate the relationship between cost leadership
strategy and customer satisfaction performance this imply that a percentage of
variance is caused by resources not coupled in TQM such as product promotion,

97
marketing research and distribution of the products. Hence when implementing TQM
in the context of cost leadership organization should also implement it together with
this resource. Closely related to this finding are previous studies (Kristianto et al.,
2012; Kumar et al, 2009) findings which hypothesized and found evidence of a
positive significant impact of TQM on customer performance. The study therefore
rejects the null hypothesis and accepts the alternative hypothesis and concludes that
TQM partially mediates the relationship cost leadership strategy and customer
satisfaction performance.
4.8.3 TQM practice on Cost Leadership Strategy and Internal Process
Performance.
To test for mediation, the study used Baron and Kenny (1986) test as discussed in
chapter three. First the study established that the independent variable (Cost
leadership) relate to the dependent variable (internal process improvement) such that
Beta in equation one is significant. The study findings as shown in Table 4.29 show
that there was a positive significant relationship between cost leadership strategy and
internal process performance (β =0.517 and P-value <0.01) therefore a unit increase
in cost leadership strategy index led to an increase in manufacturing firm
performance index by 0.517 since the p-value was less than 0.05. This fulfils the
first condition for measuring mediation effects.
The second condition involves testing if the independent variable (cost leadership)
relate to the mediator variable (TQM) such that (β) in equation is significant. This
condition establishes the first stage of the mediation effect. The findings as shown in
Table 4.29 showed that there was a positive significant relationship between cost
leadership strategy and TQM (β =.233 and P-value <0.05). Since the p-value was less
than 0.05. This fulfils the second condition for measuring mediation effects.
To establishes the second stage of the mediation effect. The mediator variable TQM
should relate to the dependent variable (internal process performance) such that β is
significant. The findings as presented in Table 4.29 show the standardized regression
coefficients for TQM is (β = 0.280 and the P-value is 0.012). which shows that TQM
predicts internal process performance of manufacturing firms in Kenya and for cost

98
leadership strategy the regression coefficient is (β = 0.447 and the P-value is 0.002)
which is statistically significant.
Figure 4.5: Cost leadership strategy, TQM, Internal process performance
Table 4.29: Cost leadership strategy on TQM and internal process performance
Relationship Regression
Weights
Standardized
Regression
Weights
S.E. P
Before TQM
Mediation effects
IP < CL 0.513 0.517 0.123 0.010
TQM < CL 0.136
0.233
0.099 0.046
After TQM
mediation effects
TQM < CL 0.135 0.238 0.068 0.047
IP < CL 0.431 0.447 0.070 0.002
IP < TQM 0.475 0.280 0.195 0.012
IP (internal process performance) CL (Cost leadership strategy)
Both TQM and cost leadership strategy have a significant effect on internal process
performance. However, the direct effects of cost leadership strategy on internal

99
process performance have reduced from 0.517 to 0.447. The study concludes that
TQM partially mediates the relationship between cost leadership strategy and
internal process performance. According to Baron and Kenny (1986) Partial
mediation maintains that the mediating variable accounts for some, but not all, of the
relationship between the independent variable and dependent variable. Partial
mediation implies that there is not only a significant relationship between the
mediator (TQM) and the dependent variable (internal process performance), but also
some direct relationship between the independent (cost leadership strategy) and
dependent variable (internal process performance). The significance of this indirect
effect was tested using bootstrapping procedures. The indirect effects were computed
for each 5000 bootstrapped samples. The results show the P value for the indirect
(mediating effect) was 0.042 which was significant at 95% confidence level. The
study concludes that TQM partially mediates the relationship between Cost
leadership strategy and internal process performance.
The study shows there is positive significant relationship between cost leadership
strategy and internal process performance and that TQM only partially mediate this
relationship. The mediation effects can be explained by the fact that TQM is an
organization culture that emphasizes on continuous process improvement and
efficiency. When TQM is implemented together with cost leadership strategy it is
likely to enhance the performance of processes. The direct effect of cost leadership
strategy even after TQM implementation can explained by the fact that Organizations
that pursue cost leadership strategy employs several activities that are not
incorporated in TQM philosophy like accurate demand forecasting, economies of
scales, technological advancement and outsourcing. Even though not integrated in
TQM they still enhance the process performance. This thus requires that when
organizations are implementing TQM under the dimension of cost leadership in order
to improve processes it should be implemented together with this other strategy not
incorporated in TQM philosophy. Process improvement allows organization to be
more efficient reduces the cost of production and delivery as well as allowing the
organization to achieve economies of scale, reducing the cost and gaining market
share. These results accentuate the earlier findings of Hilman and Kaliappen (2014)
which shows there is a significant relationship between cost leadership strategy and

100
process improvement. Mehralian et al. (2017) also hypothesised and proved that
strong significant relationship between TQM practise and process improvement. The
study therefore accepts the alternative hypothesis that TQM mediates the relationship
between cost leadership strategy and internal process performance.
4.8.4 TQM, Cost Leadership Strategy and Organization Learning and Growth
To test for mediation, the study used Baron and Kenny (1986) test as discussed in
chapter three. First the study established that the independent variable (Cost
leadership strategy) should relate to the dependent variable (organization learning
and growth) such that Beta in equation one is significant. The study findings as
shown in Table 4.30 showed that there was a positive significant relationship
between cost leadership strategy and organization learning and growth performance
(β = 0.414 and P-value <0.01) therefore a unit increase in cost leadership strategy
index led to an increase in manufacturing firm learning and growth index by 0.414
since the p-value was less than 0.05.
The second condition involves testing if the independent variable (cost leadership)
relate to the mediator variable (TQM) such that (β) in equation is significant. This
condition establishes the first stage of the mediation effect. The findings as shown in
the Table 4.30 showed that there was a positive significant relationship between cost
leadership strategy and TQM (β =.233 and P-value <0.046). Since the p-value was
less than 0.046. This fulfils the second condition for measuring mediation effects.
To establishes the second stage of the mediation effect. The mediator variable TQM
should relate to the dependent variable (organization learning and growth) such that
β is significant. The results as indicated in Table 4.30 shows the regression
coefficients for TQM is (β = 0.600 and the P-value is 0.01). which shows that at 99%
confidence interval TQM predicts organization learning and growth in Kenyan
manufacturing firms and the regression coefficient for cost leadership strategy is (β =
0.254 and the P-value is 0.008) which is statistically significant at 99% confident
level.
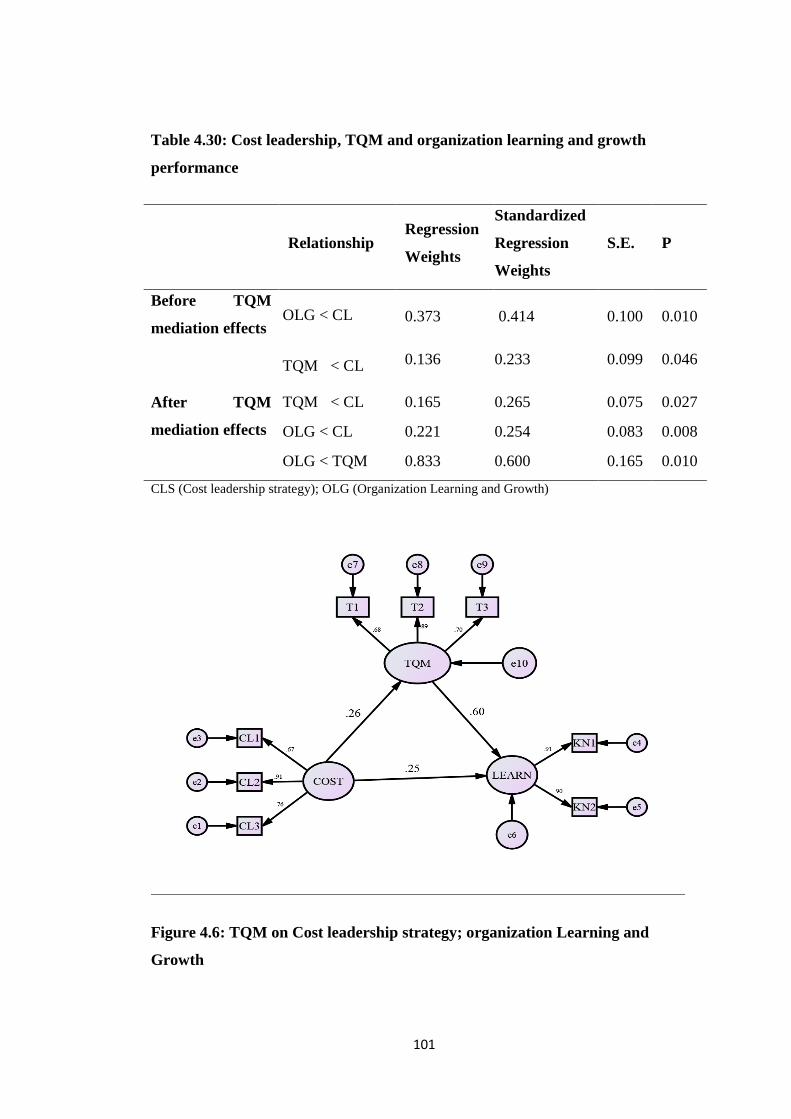
101
Table 4.30: Cost leadership, TQM and organization learning and growth
performance
Relationship Regression
Weights
Standardized
Regression
Weights
S.E. P
Before TQM
mediation effects OLG < CL 0.373 0.414 0.100 0.010
TQM < CL 0.136 0.233 0.099 0.046
After TQM
mediation effects
TQM < CL 0.165 0.265 0.075 0.027
OLG < CL 0.221 0.254 0.083 0.008
OLG < TQM 0.833 0.600 0.165 0.010
CLS (Cost leadership strategy); OLG (Organization Learning and Growth)
Figure 4.6: TQM on Cost leadership strategy; organization Learning and
Growth

102
Both TQM and cost leadership strategy have a significant effect on organization
learning and growth. However, the direct effects of cost leadership on organization
learning and growth have reduced from 0.414 to 0.254. Hence the study concludes
that TQM partially mediates the relationship between cost leadership strategy and
organization learning and growth. According to Baron and Kenny (1986) Partial
mediation maintains that the mediating variable accounts for some, but not all, of the
relationship between the independent variable and dependent variable. Partial
mediation implies that there is not only a significant relationship between the
mediator (TQM) and the dependent variable (organization learning and growth), but
also some direct relationship between the independent (cost leadership strategy) and
dependent variable (organization learning and growth). To find out significance of
the indirect effects of TQM on the relationship between cost leadership strategy and
internal process performance the study used bootstrapping procedures. The indirect
(mediation) effect of TQM on relationship between cost leadership strategy and
organization is not significantly different from zero at the 95% confidence level (P =
0.060 two-tailed) based on a bootstrap approximation obtained by constructing two-
sided percentile- based confidence intervals. However, the indirect effects are
significant at 90% confidence interval.
TQM partially mediate the relationship between cost leadership and organization
learning and growth. There is significant relationship between cost leadership
strategy and organization learning and growth and TQM only partially mediates this
relation. The direct effects of cost leadership strategy on organization learning and
growth can be explained by the fact that cost leadership as a strategy emphasizes on a
learning atmosphere where by higher learning will be associated with less defects
rate lower maintenance cost and increased efficiency within the organization.
However, the partial mediation effects of TQM can be explained by examining the
strong significant relationship between TQM and organization learning and growth.
According to Ooi et al. (2010) TQM and knowledge management are related
theoretically and practically, TQM practice training, teamwork and customer focus
are positively associated with knowledge sharing) in addition their practices are used
for improving the organization performance. The findings accentuate Zwain, Lim
and Othman (2017) which provided evidence that TQM core elements have a

103
positive significant impact on knowledge management. Hung et al., (2010) study
also shows that the higher extent of the TQM core elements implementation would
lead to the better Knowledge management processes.
4.8.5 TQM, Cost Leadership Strategy, Overall Organization Performance
To test for mediation, the study used Baron and Kenny (1986) test as discussed in
chapter three. First the independent variable (Cost leadership) should relate to the
dependent variable (organization performance) such that Beta in equation one is
significant. The study findings as indicated in the Table 4.31 showed that there was a
positive significant relationship between cost leadership strategy and overall
organization performance (β =0.572 and P-value <0.01) therefore a unit increase in
cost leadership strategy index led to an increase in manufacturing firm performance
index by 0.572 since the p-value was less than 0.05. This fulfils the first condition
for measuring mediation effects.
The second condition involves testing if the independent variable (cost leadership)
relate to the mediator variable (TQM) such that (β) in equation is significant. This
condition establishes the first stage of the mediation effect. The findings as indicated
in the Table 4.31. Showed that there was a positive significant relationship between
cost leadership strategy and TQM (β =.233 and P-value <0.046). Since the p-value
was less than 0.046. This fulfils the second condition for measuring mediation
effects.
Lastly the mediator variable TQM should relate to the dependent variable such that β
is significant. This condition establishes the second stage of the mediation effect. The
findings as shown in the Table 4.31 shows the regression coefficients for TQM is (β
= 0.624 and the P-value is 0.01). Which shows that TQM predicts the overall
performance of the organization, and for cost leadership strategy the regression
coefficient is (β =0.383 and the P-value is 0.01) this shows that both TQM and cost
leadership strategy at 99% confidence interval predicts the overall performance of
the organization.

104
Table 4.31: Cost leadership strategy on TQM and overall performance
Relationship Regression
Weights
Standardized
Regression
Weights
S.E. P
Before TQM
Mediation effect
TQM < CLS .136 .233 .099 0.046
OP < CLS .390 .572 .082 0.010
After TQM
Mediation effect
TQM < CLS .156 .258 .073 0.032
OP < CLS .186 .383 .050 0.010
OP < TQM .502 .624 .108 0.010
CLS (Cost leadership strategy); OP (overall performance)
Figure 4.7: Cost leadership strategy, TQM, Overall performance

105
This shows that both TQM and cost leadership strategy at 99% confidence interval
predicts the overall performance of the organization. The relationship between cost
leadership strategy and overall performance is significant. Hence the study concludes
that TQM partially mediates the relationship between cost leadership strategy and
overall organization performance. According to Baron and Kenny (1986) Partial
mediation maintains that the mediating variable accounts for some, but not all, of the
relationship between the independent variable and dependent variable. Partial
mediation implies that there is not only a significant relationship between the
mediator (TQM) and the dependent variable (overall performance), but also some
direct relationship between the independent (cost leadership strategy) and dependent
variable (overall performance). The relationship between cost leadership strategy and
overall organization performance was partially mediated by TQM. The significance
of this indirect effect was tested using bootstrapping procedures. The indirect effects
were computed for each 5000 bootstrapped samples. The results show the P value
was 0.01, which is statistically significant at 99% confident interval. Hence the
study concludes that at 99% confidence interval TQM partially mediate the
relationship between cost leadership strategy and organization performance.
The study concludes that TQM partially mediate the relationship between cost
leadership strategy and overall organization performance. Therefore, the study
rejects the null hypothesis (H0: TQM practice has no significant Mediating effect on
the relationship between cost leadership strategy and organization performance)
and accept the alternative hypothesis. The study results show there is a strong
significant relationship between cost leadership strategy and overall organization
performance; this is similar to previous studies (Arasa & Gathinji, 2014; Birjandi et
al., 2014) findings. The study also shows there is strong significant relationship
between TQM and organization performance this have been proven by several
studies (Hilman & Kaliappen 2014; Kumar et al., 2009). The mediating effects of
TQM on this relationship are explained by the similarities between the two
philosophies. According to Porter (1980) Attaining cost leadership requires
aggressive construction of efficiency scales and vigorous pursuit of cost reduction
through experience, tight cost and overhead control. Similarly, TQM principles
continuous process improvement, elimination of wastes, supplier partnership, and

106
team work enhances the performance of cost leadership strategy. However, the
study shows that TQM partially mediates this relationship; this is because a
significant portion of variance in performance is directly explained by strategies
without being mediated by TQM. This finding is important in the sense that when
pursuing TQM under the context of cost leadership strategies, organization also
needs to furnish certain resources that are not accommodated by TQM such as
economies of scale and technology adaptation. This finding are related to previous
studies findings by Yunis et al., (2013) and Zatzick et al., (2012) which shows that
TQM mediated the relationship between cost leadership strategy and organization
performance. The study rejects the null hypothesis; TQM practice has no significant
mediating effect on the relationship between cost leadership strategy and
organization performance and accepts the alternative hypothesis.
4.9 TQM practice on Differentiation Strategy and Organization Performance.
The second objective of the study was to determine the Mediating effect of TQM
practice on the relationship between differentiation strategy and organization
performance and to test the following hypothesis
H02: TQM practice has no significant Mediating effect on the relationship between
differentiation strategy and organization performance.
To measure the mediating effect of TQM on the relationship between differentiation
strategy and organization performance; the study first assessed it effects on different
performance measures dimensions starting with financial performance, customer
satisfaction performance, internal process performance, learning and growth and
lastly its effect on the overall performance. The study measured Organization
performance using four dimensions (financial, customer satisfaction, internal
business process and learning and growth) to provide a holistic view of the
organization performance as recommended by Kaplan and Norton (1992) in the
balance score card. Before testing for mediation effect the study established that the
five models used to measure mediation effects were fit. To ascertain that the model
provided adequate fit for the data the study considered both absolute fit indices and
incremental fit indices. The fit indices were used to verify that the five models used
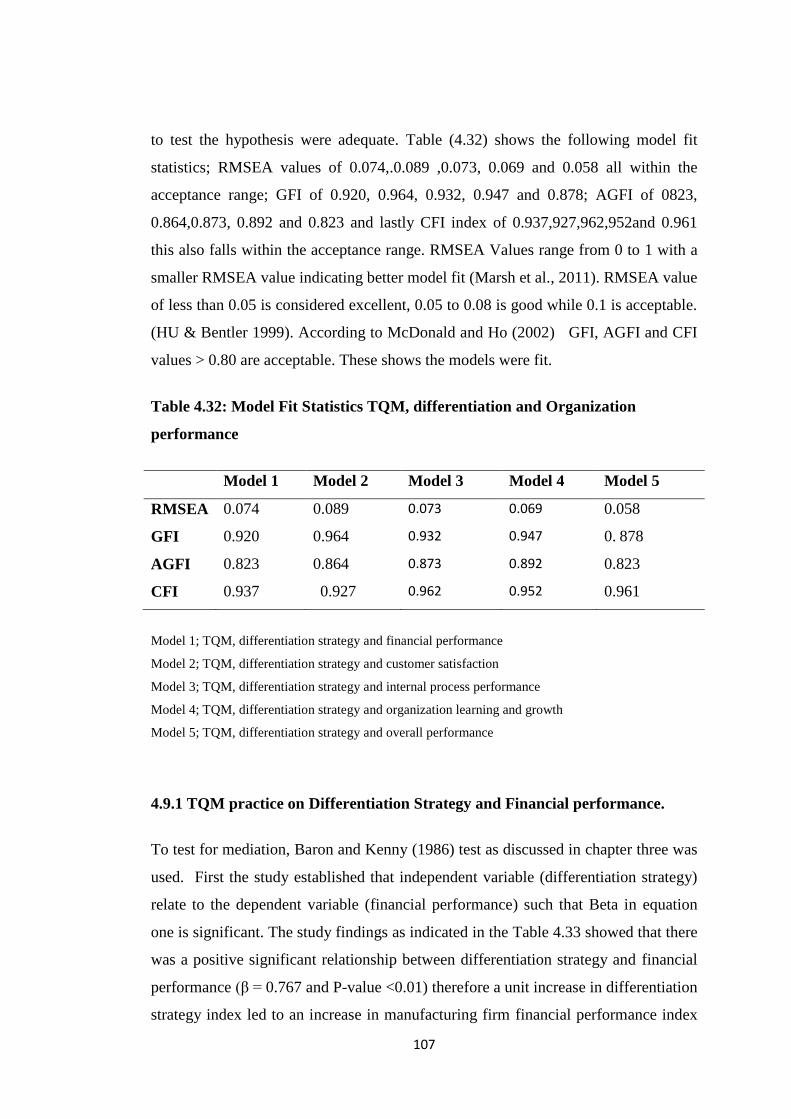
107
to test the hypothesis were adequate. Table (4.32) shows the following model fit
statistics; RMSEA values of 0.074,.0.089 ,0.073, 0.069 and 0.058 all within the
acceptance range; GFI of 0.920, 0.964, 0.932, 0.947 and 0.878; AGFI of 0823,
0.864,0.873, 0.892 and 0.823 and lastly CFI index of 0.937,927,962,952and 0.961
this also falls within the acceptance range. RMSEA Values range from 0 to 1 with a
smaller RMSEA value indicating better model fit (Marsh et al., 2011). RMSEA value
of less than 0.05 is considered excellent, 0.05 to 0.08 is good while 0.1 is acceptable.
(HU & Bentler 1999). According to McDonald and Ho (2002) GFI, AGFI and CFI
values > 0.80 are acceptable. These shows the models were fit.
Table 4.32: Model Fit Statistics TQM, differentiation and Organization
performance
Model 1 Model 2 Model 3 Model 4 Model 5
RMSEA 0.074 0.089 0.073 0.069 0.058
GFI 0.920 0.964 0.932 0.947 0. 878
AGFI 0.823 0.864 0.873 0.892 0.823
CFI 0.937 0.927
0.962 0.952 0.961
Model 1; TQM, differentiation strategy and financial performance
Model 2; TQM, differentiation strategy and customer satisfaction
Model 3; TQM, differentiation strategy and internal process performance
Model 4; TQM, differentiation strategy and organization learning and growth
Model 5; TQM, differentiation strategy and overall performance
4.9.1 TQM practice on Differentiation Strategy and Financial performance.
To test for mediation, Baron and Kenny (1986) test as discussed in chapter three was
used. First the study established that independent variable (differentiation strategy)
relate to the dependent variable (financial performance) such that Beta in equation
one is significant. The study findings as indicated in the Table 4.33 showed that there
was a positive significant relationship between differentiation strategy and financial
performance (β = 0.767 and P-value <0.01) therefore a unit increase in differentiation
strategy index led to an increase in manufacturing firm financial performance index

108
by 0.767 since the p-value was less than 0.05. This fulfils the first condition for
measuring mediation effects.
The second condition involves testing if the independent variable (differentiation
strategy) relate to the mediator variable (TQM) such that (β) in equation is
significant. This condition establishes the first stage of the mediation effect. The
findings as indicated in the Table 4.33 showed that there was a positive significant
between differentiation strategy and TQM (β =0.643 and P-value <0.01). Since the p-
value was less than 0.05. This fulfils the second condition for measuring mediation
effects.
Lastly the mediator variable TQM should relate to the dependent variable such that
its β is significant. This condition establishes the second stage of the mediation effect
the findings as shown in Table 4.33 shows the regression coefficients for TQM is (β
= 0.309 and the P-value is 0.028). This shows that TQM predicts the financial of the
organization hence fulfilling the last condition for measuring mediation effects. For
differentiation strategy, the regression coefficient is (β =0.571 and the P-value is
0.01). The p values for regression coefficient for TQM and differentiation strategy
are significant at 95% level of confidence.
Table 4.33: Differentiation strategy on TQM and financial performance
Relationship Regression
Weights
Standardized
Regression
Weights
S.E. P
Before TQM
mediation effects
TQM < DS 0.790 0.643 0.199 0.010
FP < DS 0.788 0.767 0.171 0.010
After TQM
mediation effects
TQM < DS .758 649 .179 0.010
FP < DS .614 .571 .177 0.010
FP < TQM .285 .309 .130 .028
DS (Differentiation strategy); FP (financial performance)

109
Figure 4.8: Differentiation strategy, TQM and Financial performance
Both differentiation strategy and TQM predicts the financial performance of
manufacturing firms. However, the direct effect of differentiation strategy on
financial performance has reduced from 0.767 to 0.571. Hence, the study concludes
that TQM partially mediate the relationship between differentiation strategy and
financial performance. Partial mediation implies that there is not only a significant
relationship between TQM and financial performance, but also some direct
relationship between differentiation strategy and financial performance.
The significance of this indirect effect was tested using bootstrapping procedures.
The indirect effects were computed for each 5000 bootstrapped samples. The results
based on a bootstrap approximation obtained by constructing two-sided percentile-
based confidence intervals show the P value was 0.01 which is statistically
significant at 99% confident interval. Hence the study concludes that at 99%
confidence interval TQM partially mediates the relationship between differentiation
strategy and financial performance

110
The findings show TQM partially mediates the relationship between differentiation
strategy and financial performance. This mediation effect can be explained by the
fact that TQM is a strategic organization resource that emphasizes on continuous
process improvement enhancing efficiency and effectiveness resulting to
development of quality products, services and processes that increases the
competitiveness of the organization resulting to increased financial performance in
the long run. The direct effects of Differentiation strategy on financial after TQM
implementation shows that a significant portion of variance in performance is
directly explained by differentiation strategies without being mediated by TQM. This
finding is important in the sense that when pursuing TQM under the context of
differentiation strategies, organization also needs to furnish certain resources that are
not accommodated by TQM such as market communication, market research, market
development, and adopted of technology. Similar to the study’s findings are Yunis et
al., (2013) findings which indicated that TQM plays the role of a strategic driver; it
can be viewed as a company-wide culture that instils a culture of innovation,
effective communication, knowledge sharing and employee involvement and thus
had a potential effect on differentiation strategy. This finding are also consistent
with Ndung’u, Otieno and Rotich (2016) Study carried out in Equity bank showed
that differentiation strategy had a positive effect on financial performance of equity
bank, to a great extent, with product/service quality control procedures through TQM
having the greatest effect. This finding are closely related to Banker et al., (2014)
findings which showed that there was significant relationship between differentiation
strategy and financial performance and Mehralian (2017) study demonstrates that
them was significant relationship between TQM and financial performance.
4.9.2 TQM practice on Differentiation Strategy and Customer Satisfaction.
To test the mediating effect of TQM on relationship between differentiation strategy
and customer satisfaction index performance. First the independent variable
(differentiation strategy) should relate to the dependent variable (customer
satisfaction) such that Beta in equation one is significant. The study findings as
indicated in the Table 4.34 showed that there was a positive significant relationship
between differentiation strategy and customer satisfaction. (β = 0.491 and P-value

111
<0.01) therefore a unit increase in differentiation strategy index led to an increase in
manufacturing firm customer satisfaction performance index by 0.491. Since the p-
value was less than 0.05. This fulfils the first condition for measuring mediation
effects.
The second condition involves testing if the independent variable (differentiation
strategy) relate to the mediator variable (TQM) such that (β) in equation is
significant. This condition establishes the first stage of the mediation effect. The
findings as indicated in the Table 4.34 showed that there was a positive significant
relationship between differentiation strategy and TQM (β =0.643 and P-value <0.01).
Since the p-value was less than 0.05. This fulfils the second condition for measuring
mediation effects.
Lastly the mediator variable TQM should relate to the dependent variable such that
its β is significant. This condition establishes the second stage of the mediation
effect. The findings as indicated in Table 4.34 shows the regression coefficients for
TQM is (β = 0.407 and the P-value is 0.007). Which shows that TQM predicts the
Customer satisfaction indices in the organization, and the regression coefficient for
differentiation strategy is (β =0.207 and the P-value is 0.165). The p value for
regression differentiation strategy is insignificant at 95% level of confidence.
However, the P-value for TQM is significant at 95% level of confidence; hence this
satisfies the last condition TQM predicts the customer satisfaction performance.
However, the direct effects of differentiation strategy on customer satisfaction are
insignificant.

112
Table 4.34: Differentiation strategy, TQM and customer satisfaction
performance
Relationship Regression
Weights
Standardized
Regression
Weights
S.E. P
Before TQM
mediation effect
TQM < DS 0.790 0.643 0.199 0.010
CS < DS 0.596 0.491 0.158 0.010
After TQM
mediation effect
TQM < DS 0.787 0.647 0.215 0.010
CS < DS 0.269 0.207 0.072 0.165
CS < TQM 0.435 0.407 0.175 0.007
DS (Differentiation strategy); CS (Customer Satisfaction)
Figure 4.9: Differentiation strategy, TQM and customer satisfaction

113
The direct effect of differentiation strategy on customer satisfaction is insignificant.
Hence, the study concludes that TQM completely mediate the relationship between
differentiation strategy and customer satisfaction performance. According to Baron
and Kenny (1986) complete mediation in mediational hypothesis means that the
independent variable does not at all affect the dependent variable after the mediator
variable has controlled it. The study shows the relationship between differentiation
strategy and customer satisfaction performance is completely mediated by TQM. The
significance of this indirect effect was tested using bootstrapping procedures. The
results based on bootstrap approximation obtained by constructing two-sided
percentile-based confidence intervals show the indirect (mediation) effect of TQM
on relationship between differentiation strategy and customer satisfaction is
significantly different from zero at 0.01 confident level (p=.010 two-tailed).
The study shows there is a significant relationship between differentiation strategy
and customer satisfaction and that TQM full mediated this relationship. This can be
explained by the close link between differentiation strategies and TQM. Firms that
focus on differentiation often rely on product customization which in turn involves
depending on close relationship developed with customers. This relationship
overtime builds a reputation of the firm, a good reputation translates into better
performance and creates a valuable resource that is difficult to imitate thus providing
the firm with durable advantage. Banker et al. (2014) study shows Firms focusing on
differentiation strategy emphasizes on high customer service level since the basic
level of service and support may be easy to imitate. Increasing these service levels
beyond the basic level of service level involves substantial training and changes in
the attitudes of employees towards customers which becomes entrenched in the
organization culture and can be hard to duplicate enabling them to achieve financial
performance in the long run. TQM is a culture when embedded in the organization
enables the organization to continuously improve its processes, products and services
and also improves professionalism among employees through training, good
leadership and its emphasizes on employee’s empowerment. This enhances good
relationship between the organization and customers. TQM principle of customer
focus emphasizes on the organization building strong long-term relationship with its
customers similarly to differentiation strategy.

114
Closely related to this finding are Arasa and Gathinji (2014) study shows there is a
positive relationship between generic strategies (differentiation and cost focus) on
customer satisfaction. Similarly, studies (Kim, 2016; Kumar et al., 2009; Mehra &
Rangathan, 2008) concluded that there is a strong significant relationship between
TQM and customer satisfaction. Considering the similarity between TQM and
differentiation strategy and the strong relationship between TQM and customer
satisfaction it is clear that TQM affects the relationship between differentiation
strategy and customer satisfaction. Hence the study rejects the null hypothesis and
accepts that alternative hypothesis TQM mediate the relationship between
differentiation strategy and customer satisfaction performance.
4.9.3 TQM practice on Differentiation Strategy and Internal Process
Performance
To test the mediating effect of TQM on relationship between differentiation strategy
and internal process performance. First the independent variable (differentiation
strategy) should relate to the dependent variable (Internal Process Management) such
that Beta in equation one is significant. The study findings as shown in the Table
4.35 show that there was a positive significant relationship between differentiation
strategy and process management performance. (β = 0.400 and P-value <0.003)
therefore a unit increase in differentiation strategy index led to an increase in
manufacturing firm process management performance index by 0.400 since the p-
value was less than 0.05. This fulfils the first condition for measuring mediation
effects.
The second condition involves testing if the independent variable (differentiation
strategy) should relate to the mediator variable (TQM) such that (β) in equation is
significant. This condition establishes the first stage of the mediation effect. The
findings as shown in the Table 4.35 showed that there was a positive significant
between differentiation strategy and TQM (β =0.643 and P-value <0.00001). Since
the p-value was less than 0.05. This fulfils the second condition for measuring
mediation effects.

115
Lastly the mediator variable TQM should relate to the dependent variable such that
its β is significant. This condition establishes the second stage of the mediation
effect. The findings as shown in Table 4.35 shows the regression coefficients for
TQM is (β = 0.419 and the P-value is 0.010). The p value for regression coefficient
for TQM on internal process performance is significant at 95% confidence interval.
Meeting the second mediation condition. The direct effects of differentiation strategy
on internal process improvement is (β= 0.192 and the p-value is 0.194). This is
insignificant at 95% and 90% confidence interval. Hence the study concludes that
TQM completely mediates the relationship between differentiation strategy and
internal process performance.
Table 4.35: Differentiation strategy, TQM and internal process performance
Relationship Regression
Weights
Standardized
Regression
Weights
S.E. P
Before TQM
mediation effects
IP < DS 0.761 0.400 0.255 0.003
TQM < DS 0.790 0.643 0.199 0.010
After TQM
mediation effects
TQM < DS 0.800 0.633 0.198 0.010
IP < DS 0.409 0.192 0.315 0.194
IP < TQM 0.407 0.419 0.253 0.010
IP (internal process performance) DS (Differentiation strategy)
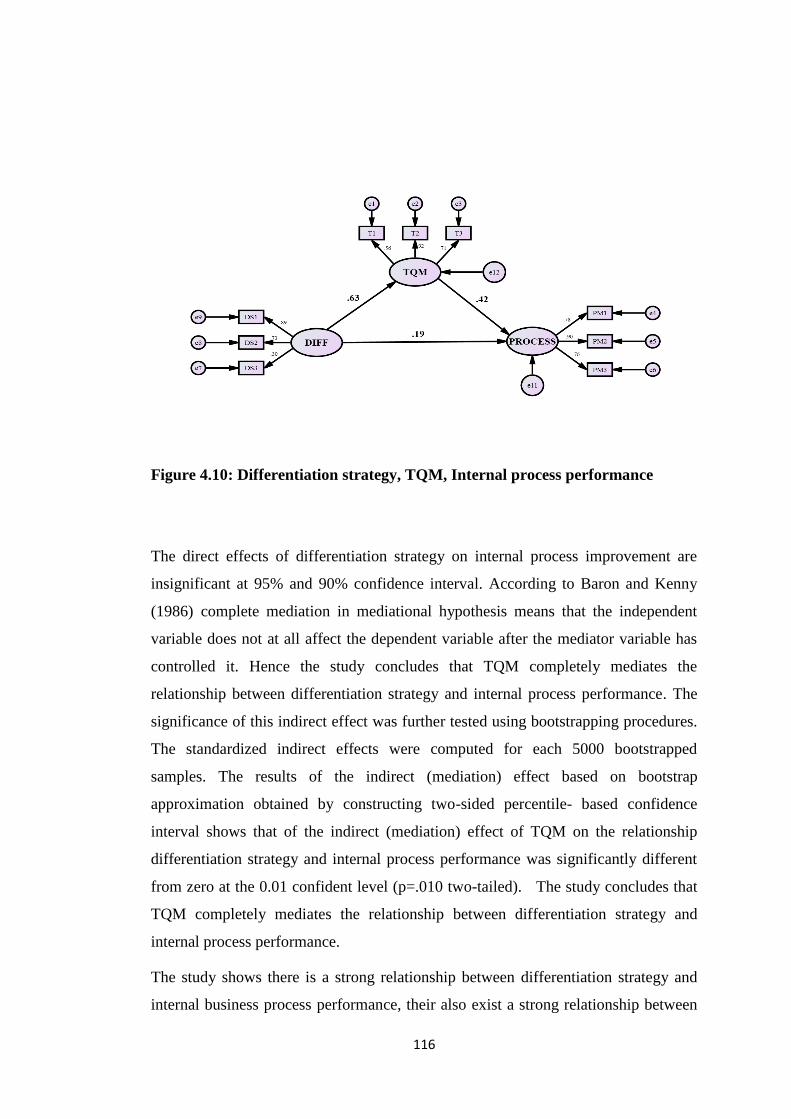
116
Figure 4.10: Differentiation strategy, TQM, Internal process performance
The direct effects of differentiation strategy on internal process improvement are
insignificant at 95% and 90% confidence interval. According to Baron and Kenny
(1986) complete mediation in mediational hypothesis means that the independent
variable does not at all affect the dependent variable after the mediator variable has
controlled it. Hence the study concludes that TQM completely mediates the
relationship between differentiation strategy and internal process performance. The
significance of this indirect effect was further tested using bootstrapping procedures.
The standardized indirect effects were computed for each 5000 bootstrapped
samples. The results of the indirect (mediation) effect based on bootstrap
approximation obtained by constructing two-sided percentile- based confidence
interval shows that of the indirect (mediation) effect of TQM on the relationship
differentiation strategy and internal process performance was significantly different
from zero at the 0.01 confident level (p=.010 two-tailed). The study concludes that
TQM completely mediates the relationship between differentiation strategy and
internal process performance.
The study shows there is a strong relationship between differentiation strategy and
internal business process performance, their also exist a strong relationship between

117
TQM and differentiation strategy. It also shows that TQM fully mediate the
relationship between differentiation strategy and internal process performance.
Consistent with this study are findings are Prajogo and Sohal (2006) and Faezi
(2014) shows that TQM have significant effect on the relationship between
differentiation strategy and organization performance. As explained by ZatZick et al.
(2012) firm that adopt differentiation strategic orientation focus on enhancing values
of a products or service through innovations and responsiveness to customer
preferences. It is therefore expected that the processes for this firms are not
efficiency. TQM is generally associated with internal process improvement and cost
reduction, customer focus, team work and continuous process improvement. Hence
TQM implementation enhances their efficiency of these processes and fully mediated
the performance of such process. This study rejects the null hypothesis and accepts
alternative hypothesis TQM mediates the relationship between Generic strategies and
internal process performance.
4.9.4 TQM practice on Differentiation Strategy and Organization Learning and
Growth
To test the mediating effect of TQM on relationship between differentiation strategy
and organization learning and growth performance index. First the independent
variable (differentiation strategy) should relate to the dependent variable
(organization learning and growth) such that Beta in equation one is significant. The
study findings as shown in the Table 4.36. Showed that there was a positive
significant relationship between differentiation strategy and organization learning
and growth. (β = 0.564 and P-value <0.01) therefore a unit increase in differentiation
strategy index led to an increase in manufacturing firm learning and growth
performance index by 0.564. Since the p-value was less than 0.05. This fulfils the
first condition for measuring mediation effects.
The second condition involves testing if the independent variable (differentiation
strategy) should relate to the mediator variable (TQM) such that (β) in equation is
significant. This condition establishes the first stage of the mediated effect. The
findings as shown in Table 4.36 showed that there was a positive significant
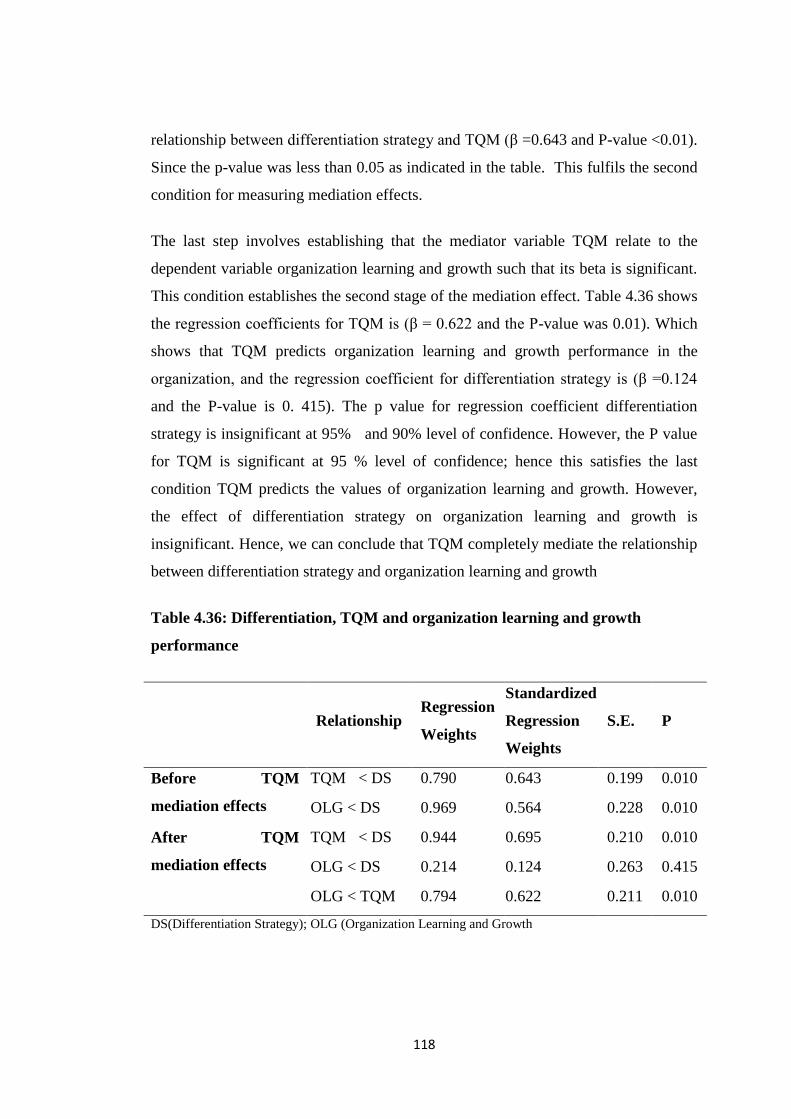
118
relationship between differentiation strategy and TQM (β =0.643 and P-value <0.01).
Since the p-value was less than 0.05 as indicated in the table. This fulfils the second
condition for measuring mediation effects.
The last step involves establishing that the mediator variable TQM relate to the
dependent variable organization learning and growth such that its beta is significant.
This condition establishes the second stage of the mediation effect. Table 4.36 shows
the regression coefficients for TQM is (β = 0.622 and the P-value was 0.01). Which
shows that TQM predicts organization learning and growth performance in the
organization, and the regression coefficient for differentiation strategy is (β =0.124
and the P-value is 0. 415). The p value for regression coefficient differentiation
strategy is insignificant at 95% and 90% level of confidence. However, the P value
for TQM is significant at 95 % level of confidence; hence this satisfies the last
condition TQM predicts the values of organization learning and growth. However,
the effect of differentiation strategy on organization learning and growth is
insignificant. Hence, we can conclude that TQM completely mediate the relationship
between differentiation strategy and organization learning and growth
Table 4.36: Differentiation, TQM and organization learning and growth
performance
Relationship Regression
Weights
Standardized
Regression
Weights
S.E. P
Before TQM
mediation effects
TQM < DS 0.790 0.643 0.199 0.010
OLG < DS 0.969 0.564 0.228 0.010
After TQM
mediation effects
TQM < DS 0.944 0.695 0.210 0.010
OLG < DS 0.214 0.124 0.263 0.415
OLG < TQM 0.794 0.622 0.211 0.010
DS(Differentiation Strategy); OLG (Organization Learning and Growth

119
Figure 4.11: Differentiation, TQM and organization learning and growth
performance.
However, the direct effect of differentiation strategy on organization learning and
growth is insignificant. Hence, the study can conclude that TQM completely mediate
the relationship between differentiation strategy and organization learning and
growth. To test the significance of this indirect effects. Standardized indirect effects
were computed for each 5000 bootstrapped samples. The results based on bootstrap
approximation obtained by constructing two-sided percentile-based confidence
intervals show that the indirect (mediation) effect of TQM on the relationship
between differentiation strategy and Organization learning and growth is
significantly different from zero at the 0.01 confident level (p=.010 two-tailed).
The study shows that TQM mediates the relationship between differentiation strategy
and organization learning and growth. The findings are closely related to Hung et al.
(2010) and Zwain et al. (2017) which indicates a positive relationship between TQM
and Knowledge management. TQM as a tool motivate the culture of learning in the
organization, employees in the organization are encouraged to continuously learn
from within and outside the organization in order to improve internal processes and

120
meet customers demand. Firms that focus on differentiation strategy rely on product
customization and developing unique products. This mainly depend on innovations
based on organizations ability to learn acquire and share knowledge.
Aboyassin et al. (2011) study revealed there exist a link between KM processes and
the principles of TQM. There is significant correlation between knowledge
management processes (diagnosis, acquisition, generation, sharing, storing and
application) and TQM principles (adaptation of quality and commitment of senior
staff; focus on customers; continuous improvement, training and education, and
employee participation this explains the mediation. The study further revealed that
acquiring and applying knowledge are the most important process to achieve overall
quality. Akgun et al. (2014) study also revealed the same TQM principles enables a
firm to acquire, interpret, translate and deploy the knowledge, skills and attitude of
people throughout the organization to establish learning capability.
4.9.5 TQM, Differentiation Strategy and Overall Performance
To test the mediating effect of TQM on relationship between differentiation strategy
and the overall performance of the organization. First the independent variable
(differentiation strategy) should relate to the dependent variable (firm’s performance)
such that Beta in equation one is significant. The study findings as indicated Table
4.37. Showed that there was a positive significant relationship between
differentiation strategy and organization performance. (β = 0. 688 and P-value <0.01)
therefore a unit increase in differentiation strategy index led to an increase in
manufacturing firm performance index by 0. 688. Since the p-value was less than
0.01 this fulfils the first condition for measuring mediation effects.
The second condition involves testing if the independent variable (differentiation
strategy) relate to the mediator variable (TQM) such that (β) in equation is
significant. This condition establishes the first stage of the mediation effect. The
findings showed as indicated Table 4.37 showed that there was a positive significant
between differentiation strategy and TQM (β =0.643 and P-value <0.00001). Since
the p-value was less than 0.05. This fulfils the second condition for measuring
mediation effects.

121
Lastly the mediator variable TQM should relate to the dependent variable such that
its beta is significant. This condition establishes the second stage of the mediation
effect. The results as indicated in the Table 4.37 show. The regression coefficients
for TQM is (β = 0.549 and the P-value is 0.01). Which shows that TQM predicts the
overall performance of the organization, and the regression coefficient for
differentiation strategy is (β = 0.310 and the P-value is 0.039). The p value for
regression coefficient for TQM and differentiation strategy is significant at 95% level
of confidence. Both TQM and differentiation strategy predicts the overall
organization performance.
Table 4.37: Differentiation strategy on TQM and overall performance
Relationship Regression
Weights
Standardized
Regression
Weights
S.E. P
Before TQM effects OP < DS 0.660
0.688 0.152 0.010
TQM < DS 0.790 0.643
0.199 0.010
After TQM effects TQM < DS 0.881 0.682 0.198 0.010
OP < DS 0.305 0.310 0.148 0.039
OP < TQM 0.418 0.549 .0123 0.010
DS (Differentiation strategy); OP (overall performance)

122
Figure 4.12: Differentiation Strategy on TQM and overall performance
Both TQM and differentiation strategy predicts the overall organization
performance. However, the direct effect of differentiation strategy on overall
performance has reduced from 0.688 to 0.310. Hence, we can conclude that TQM
partially mediates the relationship between differentiation strategy and firm’s
overall performance. According to Baron and Kenny (1986) Partial mediation
maintains that the mediating variable accounts for some, but not all, of the
relationship between the independent variable and dependent variable. Partial
mediation implies that there is not only a significant relationship between the
mediator (TQM) and the dependent variable (organization overall performance),
but also some direct relationship between the independent (differentiation strategy)
and dependent variable (overall organization performance).
The significance of this indirect (mediation) effects were tested using bootstrapping
procedures. The indirect (mediation) effect of TQM on the relationship between
differentiation strategy and organization performance is significantly different from
zero at the 0.01 confident level (p=.010 two-tailed). Based on bootstrap
approximation obtained by constructing two-sided percentile- based confidence

123
intervals. This study therefore rejects the null hypothesis (H02: TQM practice has
no significant Mediating effect on the relationship between differentiation strategy
and organization performance) and accepts the alternative hypothesis TQM has
significant mediation effects on the relationship between differentiation strategy
and organization performance.
The study shows that TQM partially mediates the relationship between
differentiation strategy and overall organization performance. This finding are
consistent findings of a study by Yunis et al. (2013); Faezi (2014) which revealed
that TQM mediated the relationship between differentiation strategy and firm’s
overall performance. Under customer orientation TQM is closely related with
differentiation strategy hence its mediating effects on the relationship. As further
explained by Porter (1980) differentiation strategy aims to create products that
customers see as unique. Firms that adopt this strategy select one or more attributes
or characteristics that customers perceive as important and uniquely position itself to
excel in those attributes leading to premium prices. Among these attributes includes
quality. Quality is one of the attributes that characterizes differentiation strategy.
This is because quality creates a competitive advantage through customer loyalty as
well as minimizes customer’s sensitivity to price. Companies that implement TQM
have to explore and find ways to serve customers expectations at their best. This
creates the impetus for companies to be innovative in developing and launching new
products or services to match customers’ needs this enables the organization focuses
on gaining a market share advantage where they can outperform their competitors in
terms of attracting more customers with distinguished products and customer
satisfaction (Prajogo & Sohal, 2006). However, the direct effects of differentiation
strategy on overall performance even after TQM implementation can be explained by
resources incorporate in differentiation strategy but not incorporated under TQM
philosophy such as marketing communication, market research and market
development. Related to this finding are several studies that have identified positive
relationship between TQM and innovation (Hung, Lien, Fang & McLean, 2010; Lee,
Ooi, Tan & Chong, 2010). Arguments proposing a positive relationship between
TQM and innovation posited that companies implementing TQM in their business
systems and corporate culture are fertile environments because TQM promotes
124
principles coincident with innovation (Prajogo & Sohal, 2006) and product
development.
4.10. TQM practice on Focus Strategy and Organization Performance.
The third objective was to examine the Mediating effect of TQM practice on the
relationship between focus strategy and organization performance and to test the
following hypothesis
H03: TQM practice has no significant Mediating effect on the relationship between
Focus strategy and organization performance.
The study measured Organization performance using four dimensions (financial,
customer satisfaction, internal business process and learning and growth) to provide
a holistic view of the organization performance as recommended by Kaplan and
Norton (1992) in the balance score card. To measure the mediating effect of TQM
the study first assessed it effects of different all dimensions starting with financial
performance, customer satisfaction performance, internal process performance,
learning and growth and lastly its effect on the overall performance
Before testing for mediation effect the study established that the models used to
measure mediation effects were fit. To ascertain that the model provided adequate fit
for the data the study considered both absolute fit indices and incremental fit indices.
The fit indices were used to verify that the three models use test the hypothesis were
adequate. The Table (4.38) shows RMSEA values of 0.097,0.080, 0.000, 0.090 and
0.050 all within the acceptance range; GFI of 0.932, 0.952, 0.987, 0.926 and 0.895;
AGFI of 0.828, 0.877,0. 950, 0.810 and 0.843 and lastly CFI index of 0.954, 0.974,
1.00, 0.956 and 0.976 this also falls within the acceptance range. RMSEA Values
range from 0 to 1 with a smaller RMSEA value indicating better model fit (Marsh et
al., 2011). RMSEA value of less than 0.05 is considered excellent, 0.05 to 0.08 is
good while 0.1 is acceptable. (HU & Bentler,1999). According to McDonald and Ho
(2002) GFI, AGFI and CFI values > 0.80 are acceptable. These shows the models
were fit.

125
Table 4.38: Model Fit Statistics TQM, Focus strategy and Organization
performance
Model 1 Model 2 Model 3 Model 4 Model 5
RMSEA 0.097 0.080 0.000 0.090 0.050
GFI 0.932 0.952 0.987 . 0.926
0.895
AGFI 0.828 0.877 0. 950 0.810 0.843
CFI 0.954 0.974
1.00 0.956 0.976
Model 1; TQM, Focus strategy and financial performance
Model 2; TQM, Focus strategy and customer satisfaction
Model 3; TQM, Focus strategy and internal process performance
Model 4; TQM, focus strategy and organization learning and growth
Model 5; TQM, Focus strategy and overall performance
4.10.1 TQM practice on Focus Strategy and Financial performance.
To test the mediating effect of TQM on relationship between focus strategy and
financial performance of the organization. First the independent variable (Focus
strategy) should relate to the dependent variable (financial performance) such that
Beta in equation one is significant. The study findings as indicated in the Table 4.39
showed that there was a positive significant relationship between focus strategy and
organization performance (β = 0.544 and P-value <0.01) therefore a unit increase in
focus strategy index led to an increase in manufacturing firm performance index by
0.544 since the p-value was less than 0.05. This fulfils the first condition for
measuring mediation effects. The second condition involves testing if the
independent variable (focus strategy) should relate to the mediator variable (TQM)
such that (β) in equation is significant. This condition establishes the first stage of the
mediation effect. The findings as indicated in Table 4.39 showed that there was a
positive significant relationship between Focus strategy and TQM (β =0.775 and P-
value <0.01). Since the p-value was less than 0.05. This fulfils the second mediation
condition

126
Lastly the mediator variable TQM should relate to the dependent variable such that
its beta is significant. This condition establishes the second stage of the mediation
effect. The findings as shown in Table 4.39 shows the regression coefficients for
TQM is (β = 0.801 and the P-value is 0. 01). Which shows that TQM predicts the
financial performance of the organization, and the regression coefficient for Focus
strategy is (β = - 0.026 and the P-value is 0.910). The p value for regression
coefficient for TQM is significant at 99% level of confidence. Hence the study
concludes that at 99% level of confidence TQM predict the financial performance of
manufacturing firms in Kenya. Since the P-value for focus strategy is 0.910 it is not
significant at 90% confident interval the study concludes that TQM completely
mediate the relationship between focus strategy and organization performance.
Figure 4.13: Focus strategy, TQM and Financial performance

127
Table 4.39: Focus strategy, TQM and financial performance
Relationship Regression
Weights
Standardized
Regression
Weights
S.E. P
Before TQM
mediation
effects
FP < FS 0.491 0.544 0.135 0.010
TQM< FS 0.655 0.775
0.130 0.010
After TQM
mediation
effects
TQM < FS 0.741 0.801 0.134 0.010
FP < FS -0.022 -0.026 0.196 0.910
FP < TQM 0.659 0.721 0.230 0.004
The direct effects of focus strategy on financial performance are insignificant at 95%
and 90% confidence interval. Hence, the study concludes that TQM completely
mediate the relationship between focus strategy and financial performance.
According to Baron and Kenny (1986) complete mediation in mediational hypothesis
means that the independent variable does not at all affect the dependent variable after
the mediator variable has controlled it. Hence the study concludes that TQM
completely mediates the relationship between focus strategy and internal process
performance. The relationship between Focus strategy and financial performance
was fully mediated by TQM. The significance of this indirect effect was tested using
bootstrapping procedures. The indirect (mediation) effect of TQM on the relationship
between focus strategy and financial performance is significantly different from zero
at the 0.01 confident level (p=.010 two-tailed) based on bootstrap approximation
obtained by constructing two-sided percentile based confidence intervals.
The study shows that TQM completely mediates the relationship between focus
strategy and organization financial performance. The full meditation effects can be
explained by the similarities between focus strategy and Customer focus principle in
TQM. Firms that implement TQM focus on providing superior value for their
customers and improving efficiency of their processes. Continuous improvement of
processes and service quality leads to increased revenue through product reliability

128
and cost reduction through process efficiency (Miguel et al., 2016). Customer
satisfaction enabled firms have a market advantage resulting to growth of the market
share in return it results to improved financial performance. Hence TQM mediates
the relationship. These findings are closely related to the findings of Wang et al.
(2011) and Lam et al. (2012) studies which point out that TQM model was positively
related to the development of market oriented culture in the organization which
enhances the implementation of focus strategy. The study therefore rejects the null
hypothesis and accept the alternative hypothesis, TQM mediates the relationship
between focus strategy and financial performance.
4.10.2 TQM practice on Focus Strategy and Customer Satisfaction
To test the mediating effect of TQM on relationship between focus strategy and
customer satisfaction index. First the independent variable (focus strategy) should
relate to the dependent variable (Customer satisfaction) such that Beta in equation
one is significant. The study findings as indicated in the Table 4.40 showed that there
was a positive significant relationship between focus strategy and customer
satisfaction (β = 0.431 and P-value <0.01) therefore a unit increase in focus strategy
index led to an increase in manufacturing firm performance index by 0.431 since the
p-value was less than 0.05. This fulfils the first condition for measuring mediation
effects.
The second condition involves testing if the independent variable (focus strategy)
should relate to the mediator variable (TQM) such that (β) in equation is significant.
This condition establishes the first stage of the mediation effect. The findings as
indicated in the Table 4.40 showed that there was a positive significant relationship
between focus strategy and TQM (β =0.775 and P-value <0.01). Since the p-value
was less than 0.05 this fulfils the second mediation condition
Lastly the mediator variable TQM should relate to the dependent variable such that
its beta is significant. This condition establishes the second stage of the mediation
effect. The findings as shown in Table 4.40 shows the regression coefficient for
TQM is (β = 0.781 and the P-value is 0.01 and for Focus strategy the regression
coefficient is (β = 0.006 and the P-value is 0.976). The p value for regression

129
coefficient for TQM is significant at 99% level of confidence. However, the P value
for Focus strategy 0.976 which is insignificant at 95% and 90% level of confidence.
Hence the study concludes that at 95% level of confidence TQM predict customer
satisfaction index of manufacturing firms but focus strategy does not predict the
customer satisfaction levels.
Figure 4.14: Focus strategy, TQM and customer satisfaction performance

130
Table 4.40: Focus strategy; TQM and customer satisfaction performance
Relationship Regression
Weights
Standardized
Regression
Weights
S.E. P
Before TQM
Mediation
effects
TQM < FS 0.655 0.775 0.130 0.010
CS < FS 0.399 0.431 0.117 0.010
After TQM
mediation
effects
TQM < FS 0.677 0.781 0.130 0.010
CS< FS 0.006 0.006 0.196 0.976
CS < TQM 0.572 0.529 0.230 0.012
FS (Focus strategy); CS (customer satisfaction performance)
From the findings, the direct effects of focus strategy were insignificant at 95% and
90% level of confidence. The study concludes that TQM fully mediate the
relationship between focus strategy and customer satisfaction. According to Baron
and Kenny (1986) complete mediation in mediational hypothesis means that the
independent variable does not at all affect the dependent variable after the mediator
variable has controlled it. The significance of this indirect effect was tested using
bootstrapping procedures. The indirect effects were computed for each 5000
bootstrapped samples. The indirect (mediation) effect of TQM on the relationship
between focus strategy and TQM is significantly different from zero at the 0.01
confident level (p=.010 two-tailed). Based on a bootstrap approximation obtained by
constructing two-sided percentile- based confidence intervals.
The study therefore concludes that TQM fully mediated the relationship between
focus strategy and customer satisfaction. TQM represents a platform from which full
advantage can be taken of marketing thus favouring the development of focus
strategy. Both TQM and Focus strategy emphasizes on meeting customers’ needs

131
and customer participation and the aim is to accomplish the same ultimate goal
customer satisfaction. TQM and market orientation require organization structure
designed around the flow of value adding captivities and should also empower
employees to manage organization change. This findings are consistent Miguel,
Heras-Saizarbitoria and Tari (2016) which showed that TQM through these
dimensions; leadership, continuous process improvement and employee
empowerment enable the design and management of processes geared to determine
users’ needs and expectations, their satisfaction and determine the level of customer
satisfaction hence make a positive contribution to (market orientation)focus strategy.
Hence TQM fully mediates this relationship. The study rejects the null hypothesis
and accepts the alternative hypothesis. TQM mediates the relationship between focus
strategy and customer satisfaction performance.
4.10.3 TQM practice on Focus Strategy and Internal Process Performance
To test the mediating effect of TQM on relationship between focus strategy and
process management index. First the independent variable (focus strategy) should
relate to the dependent variable (internal process management) such that Beta in
equation one is significant. The study findings as indicated in the Table 4.41 showed
that there was a positive significant relationship between focus strategy and internal
process performance (β = 0.454 and P-value <0.01) therefore a unit increase in focus
strategy index led to an increase in manufacturing firm performance index by 0.454.
Since the P-value was less than 0.05. This fulfils the first condition for measuring
mediation effects.
The second condition involves testing if the independent variable (focus strategy)
should relate to the mediator variable (TQM) such that (β) in equation is significant.
This condition establishes the first stage of the mediation effect. The findings as
indicated in the Table 4.41 showed that there was a positive significant relationship
between Focus strategy and TQM (β =0.775 and P-value <0.01). Since the p-value
was less than 0.05 this fulfils the second mediation condition
Lastly the mediator variable TQM should relate to the dependent variable such that
beta in equation is significant. This condition establishes the second stage of the
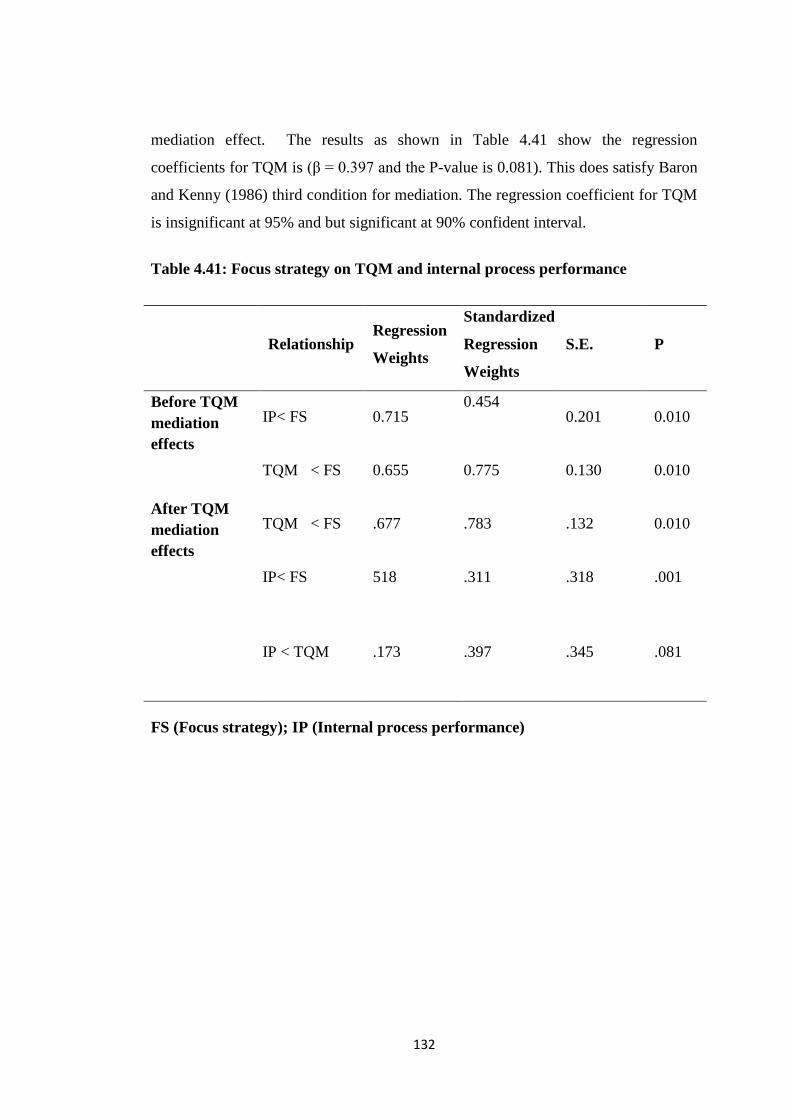
132
mediation effect. The results as shown in Table 4.41 show the regression
coefficients for TQM is (β = 0.397 and the P-value is 0.081). This does satisfy Baron
and Kenny (1986) third condition for mediation. The regression coefficient for TQM
is insignificant at 95% and but significant at 90% confident interval.
Table 4.41: Focus strategy on TQM and internal process performance
Relationship Regression
Weights
Standardized
Regression
Weights
S.E. P
Before TQM
mediation
effects
IP< FS 0.715 0.454
0.201 0.010
TQM < FS 0.655 0.775 0.130 0.010
After TQM
mediation
effects
TQM < FS .677 .783 .132 0.010
IP< FS 518 .311 .318 .001
IP < TQM .173 .397 .345 .081
FS (Focus strategy); IP (Internal process performance)

133
Figure 4.15: Focus strategy on TQM and internal process performance
At 90% confidence interval both TQM and Focus strategy does predict the internal
process performance in manufacturing firms. However, the direct effect of focus
strategy has reduced from 0.454 to 0.311. The study concludes that TQM partially
mediates the relationship between focus strategy and internal process performance.
According to Baron and Kenny (1986) Partial mediation maintains that the mediating
variable accounts for some, but not all, of the relationship between the independent
variable and dependent variable. Partial mediation implies that there is not only a
significant relationship between the mediator (TQM) and the dependent variable
(internal process performance), but also some direct relationship between the
independent (focus strategy) and dependent variable (internal process performance).
The significance of this indirect effect was further tested using bootstrapping
procedures. The findings show that the indirect (mediation) effect of TQM on the
relationship between focus strategy and internal process management is
insignificantly different from zero at 95% confident level but significant at 90%

134
confident level (p= 0.056 two-tailed). The study concluded that TQM partially
mediate the relationship between focus strategy and internal process performance.
Closely related with this study are findings are Zatzick et al. (2012) which shows that
TQM is generally associated with internal process improvement and cost reduction.
A Focus strategy enhances the value of a product or service through innovation and
responsiveness to customer preferences, processes are designed focused on
developing new products and services. Thus, it is expected that the firms will
experience process misfit, however TQM focuses on improving process and
efficiency within the processes by eliminating wastage. Organizations that
implement TQM practices develop process improvement capabilities (Silva, Gomes,
Lages & Pereira, 2014). These capabilities enhance the performance of focus
strategy. Hung et al. (2010) posited that Knowledge Management initiatives have an
indirect effect on innovation performance through TQM practice; by focusing on
meeting customers’ needs and encouraging organizations to continually identify new
customer’s needs and expectations, thereby inducing organizations to innovate,
continually develop and introduce processes and products that meet markets
changing needs. Hence TQM mediate the relationship between focus strategy and
internal process improvement.
4.10.4 TQM; Focus Strategy and Organization Learning and Growth.
To test the mediating effect of TQM on relationship between Focus strategy and
organization learning and growth. First the independent variable (focus strategy)
should relate to the dependent variable (learning and growth) such that Beta in
equation one is significant. The study findings as indicated in the Table 4.42 showed
that there was a positive significant relationship between focus strategy and
organization learning and growth. (β = 0.608 and P-value <0.01) therefore a unit
increase in focus strategy index led to an increase in manufacturing firm leaning and
growth performance index by 0.608 since the p-value was less than 0.05. This fulfils
the first condition for measuring mediation effects.
The second condition involves testing if the independent variable (focus strategy)
should relate to the mediator variable (TQM) such that (β) in equation is significant.

135
This condition establishes the first stage of the mediation effect. The findings as
indicated in Table 4.42 showed that there was a positive significant relationship
between focus strategy and TQM (β =0.775 and P-value is 0.01). The p-value was
less than 0.05. This fulfils the second condition for measuring mediation effects.
Lastly the mediator variable TQM should relate to the dependent variable such that
beta in equation is significant. This condition establishes the second stage of the
mediation effect. The findings as indicated on Table 4.42 show the regression
coefficients for TQM is (β = 0.496 and the P-value is 0. 019). Which shows that
TQM predicts organization learning and growth in the organization, and the
regression coefficient for Focus strategy is (β = 0.221 and the P-value is 0.291). The
p value for regression coefficient for TQM is significant at 99% level of confidence.
Since the P-value for focus strategy is 0.291 it is not significant at 90% confident
interval the study concludes that TQM Fully mediate this relationship.
Table 4.42: Focus strategy; TQM and learning and growth performance
Relationship Regression
Weights
Standardized
Regression
Weights
S.E. P
Before TQM
mediation effects
OLS < FS 0.876 0.608 0.162 0.010
TQM < FS 0.655 0.775 0.130 0.010
After TQM
mediation effects
TQM < FS 0.754 0.805 0.134 0.010
OLG < FS 0.284 0.221 0.270 0.291
OLG < TQM 0.682 0.496 0.291 0.019
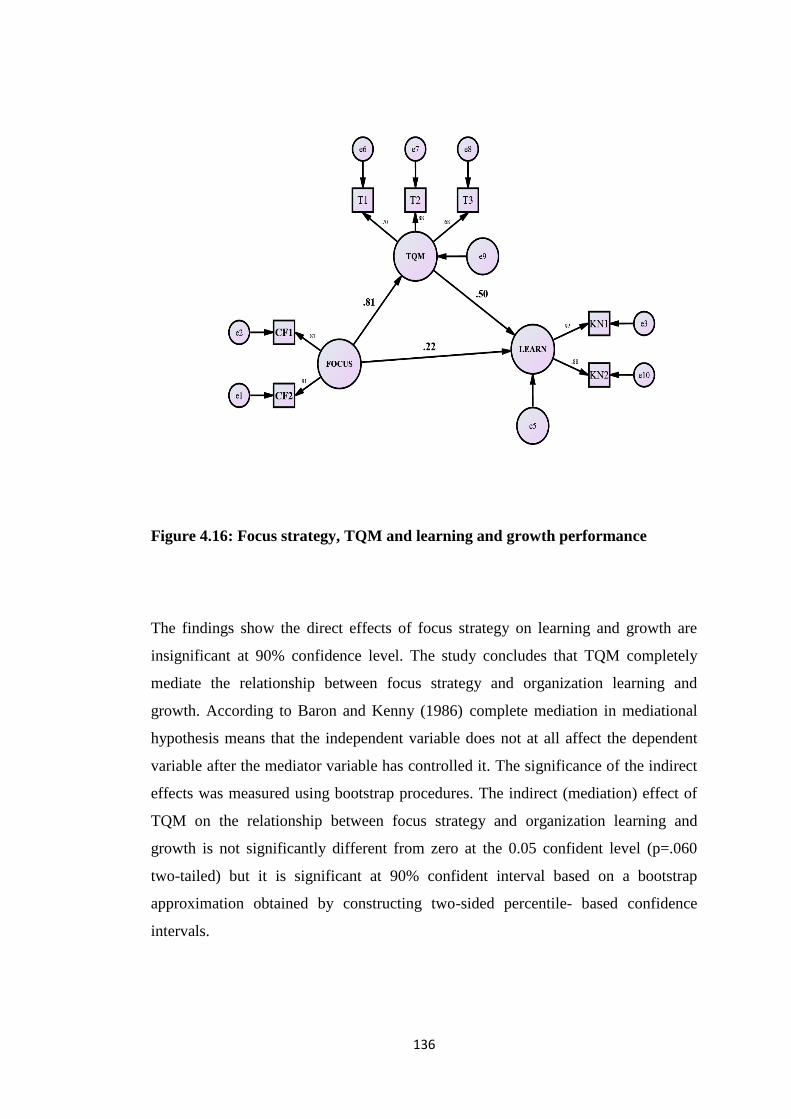
136
Figure 4.16: Focus strategy, TQM and learning and growth performance
The findings show the direct effects of focus strategy on learning and growth are
insignificant at 90% confidence level. The study concludes that TQM completely
mediate the relationship between focus strategy and organization learning and
growth. According to Baron and Kenny (1986) complete mediation in mediational
hypothesis means that the independent variable does not at all affect the dependent
variable after the mediator variable has controlled it. The significance of the indirect
effects was measured using bootstrap procedures. The indirect (mediation) effect of
TQM on the relationship between focus strategy and organization learning and
growth is not significantly different from zero at the 0.05 confident level (p=.060
two-tailed) but it is significant at 90% confident interval based on a bootstrap
approximation obtained by constructing two-sided percentile- based confidence
intervals.

137
The findings show that TQM mediate the relationship between focus strategy and
organization performance. Focus strategy requires an organization to develop
products and services unique to a certain market segment. TQM through customer
focus practice supplies the organization with the customer needs information that
results in generating new products to fulfil their customer demands. Closely related
to these findings are the findings of Mehralian et al. (2017) and Ooi (2009) which
showed there exist significant relationship between TQM and Knowledge
management. Honarpour et al. (2012) study hypothesized and revealed that them was
significant relationship between TQM, innovation and knowledge management.
Hence TQM mediates the relationship between focus strategy and organization
learning. The study rejects the null hypothesis and accept alternative hypothesis.
4.10.5 TQM; Focus Strategy and Overall Performance of the Organization.
To test the mediating effect of TQM on relationship between focus strategy and
overall performance of the organization. First the independent variable (focus
strategy) should relate to the dependent variable (overall performance) such that Beta
in equation one is significant. The study findings as indicated in the Table 4.43
showed that there was a positive significant relationship between focus strategy and
organization performance (β = 0.649 and P-value <0.01) therefore a unit increase in
Focus strategy index led to an increase in manufacturing firm performance index by
0.649 since the p-value was less than 0.05. This fulfils the first condition for
measuring mediation effects.
The second condition involves testing if the independent variable (focus strategy)
should relate to the mediator variable (TQM) such that (β) in equation is significant.
This condition establishes the first stage of the mediation effect. The findings as
indicated in Table 4.43 showed that there was a positive significant relationship
between focus strategy and TQM (β =0.775 and P-value <0.01). The p-value was less
than 0.05. This fulfils the second condition for measuring mediation effects.
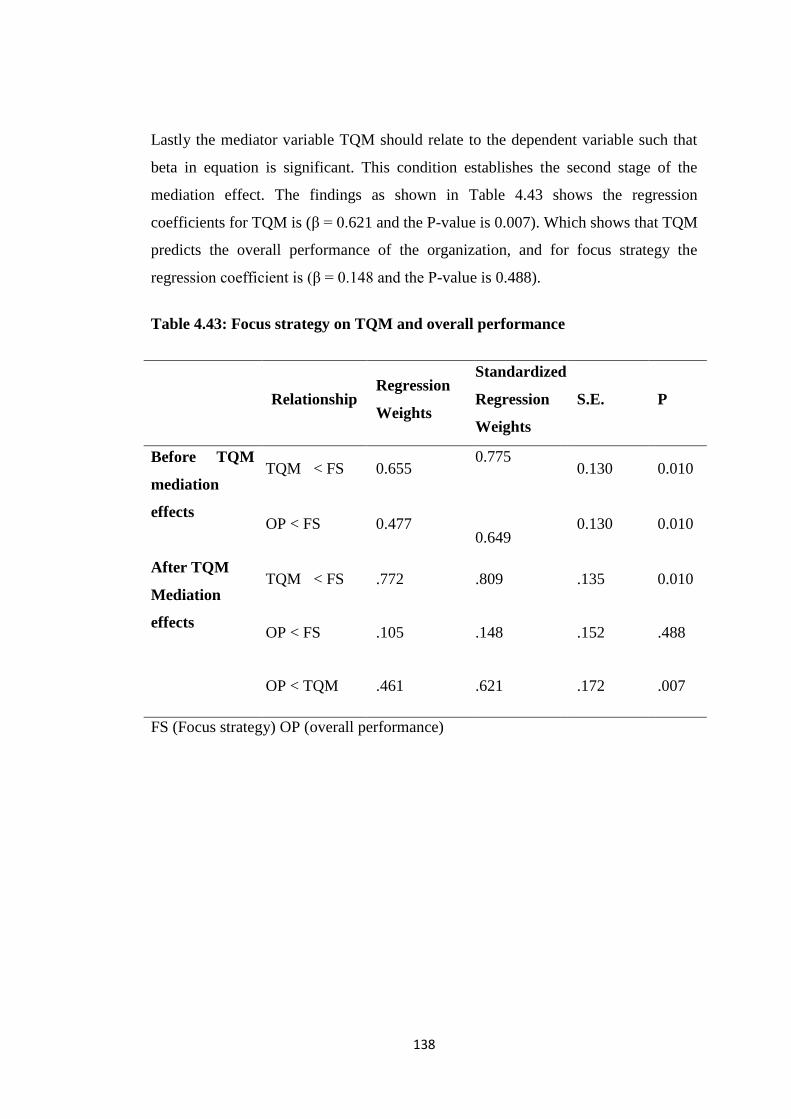
138
Lastly the mediator variable TQM should relate to the dependent variable such that
beta in equation is significant. This condition establishes the second stage of the
mediation effect. The findings as shown in Table 4.43 shows the regression
coefficients for TQM is (β = 0.621 and the P-value is 0.007). Which shows that TQM
predicts the overall performance of the organization, and for focus strategy the
regression coefficient is (β = 0.148 and the P-value is 0.488).
Table 4.43: Focus strategy on TQM and overall performance
Relationship Regression
Weights
Standardized
Regression
Weights
S.E. P
Before TQM
mediation
effects
TQM < FS 0.655 0.775
0.130 0.010
OP < FS 0.477
0.649 0.130 0.010
After TQM
Mediation
effects
TQM < FS .772 .809 .135 0.010
OP < FS .105 .148 .152 .488
OP < TQM .461 .621 .172 .007
FS (Focus strategy) OP (overall performance)

139
Figure 4.17: Focus strategy on TQM and overall performance
The p value for regression coefficient for TQM is significant at 95% level of
confidence and the P-value for Focus strategy is insignificant at 95% and 90% level
of confidence. Hence the study concludes that at 95% level of confidence TQM
predict the overall performance index of manufacturing firms. The study also
concluded that TQM completely mediate the relationship between Focus strategy and
organization performance. According to Baron and Kenny (1986) complete
mediation in mediational hypothesis means that the independent variable does not at
all affect the dependent variable after the mediator variable has controlled it. The
significance of this indirect effect was further tested using bootstrapping procedures.
The indirect effects were computed for each 5000 bootstrapped samples and the
indirect (mediation) effect of TQM on overall performance was found not
significantly different from zero at 95% confidence level (p=.076 two-tailed) but
significant at 90% confident interval. The study concludes that at 90% confidence
140
level TQM completely mediate the relationship between focus strategy and
organization overall performance
The study rejects the null hypothesis and accepts the alternative hypothesis, TQM
fully mediates the relationship between focus strategy and overall organization
performance. This is because the similarity between TQM philosophy and Focus
strategy is enormous. Quality is no longer defined in terms of products with zero
defects rather is increasingly understood in terms of the value generated by a system
that is characterized by continuous improvement in every aspect with the aim of
satisfying the explicit and implicit expectations of the customers and all relevant
stakeholders. Quality is the element that focuses the attention and commitment of
the whole firm on customer satisfaction to create and diffusion of value and for the
customer. Focus strategy aim at identifying a niche in the market and developing
products that satisfy this segment. TQM represents a crucial input in the
development of Focus strategy, they both advocate and implement a company
strategy of customer orientation. Hence TQM fully mediates the relationship between
focus strategy and overall performance. Closely related to this are the findings of
Mele et al. (2007) which concludes that TQM represents a platform for full
realization of marketing potential capabilities and that TQM and marketing are
complementary and synergistic in enabling and effective management of the process
of value creation and delivery to the customers. Quality Guru’s Ishikawa (1972),
Crosby (1979), Deming (1982) and Juran (1988) conversed that main focus for TQM
is to establish a management system and corporate culture to ensure that customer
satisfaction is enhanced which involves a systematic method of continuous
improvement of organization processes, resulting in high quality products and
service. Su et al. (2010) posits that Customer–oriented culture is essential for quality
and extension of customer-knowledge creation and dissemination, and increasing
responsiveness to customer needs. Possessing customer knowledge will assist an
organization to access new customer segments achieving customer loyalty among its
clients and provide customised products or services that mirror customer needs.
Organization that implement TQM in their strategy and corporate culture are by
nature, market oriented organizations (Samat et al., 2006). Wang, Chen, and Chen,
(2012) posits that total quality management (TQM) and market orientation both

141
focus on customer needs and satisfaction. Market-oriented firms have been shown to
be successful at maintaining strong competitive positions over time (Boyd, Walker,
Mullin & Larreche, 2013) and TQM-adopting firms obtain a competitive advantage
over firms that do not adopt TQM.
4.11 TQM, Generic Strategies and Organization Performance
The fourth objective was to examine the Mediating effect of TQM practice on the
relationship between generic strategies and organization performance and to test the
following hypothesis
H04: TQM practice has no significant Mediating effect on the relationship between
generic strategies and organization performance.
The study measured Organization performance using four dimensions (financial,
customer satisfaction, internal business process and learning and growth) to provide
a holistic view of the organization performance as recommended by Kaplan and
Norton (1992) in the balance score card. To measure the mediating effect of TQM
the study first assessed its effects of different performance measures. Starting with
financial performance, customer satisfaction performance, internal process
performance, learning and growth and lastly its effect on the overall performance.
Before testing for mediation effect the study established that the five models used to
measure mediation effects were fit. To ascertain that the model provided adequate fit
for the data the study considered both absolute fit indices and incremental fit indices.
The fit indices were used to verify that the five models used to test the hypothesis
were adequate. The Table 4.44 shows RMSEA values of 0.089, 0.085, 0.066, 0.072
and 0.062 all within the acceptance range; GFI of 0.904, 0.911, 0.875, 0.879 and
0.827; AGFI of 0.863, 0.837, 0.815, 0.813 and 0.807 and lastly CFI index of 0.919,
0.944, 0.937, 0.919 and 0.932 this also falls within the acceptance range. RMSEA
Values range from 0 to 1 with a smaller RMSEA value indicating better model fit
(Marsh et al., 2011). RMSEA value of less than 0.05 is considered excellent, 0.05 to
0.08 is good while 0.1 is acceptable. (HU & Bentley 1999). According to McDonald

142
and how (2002) GFI, AGFI and CFI values > 0.80 are acceptable. These shows the
models were fit.
Table 4.44: Model Fit Statistics TQM, Generic strategies and Organization
performance
Model 1 Model 2 Model 3 Model 4 Model 5
RMSEA 0.089 0.085 0.066 0.072 0.062
GFI 0.904 0.911 0.875 0.879 0.827
AGFI 0.863 0.837 0.815 0.813 0.807
CFI 0.919 0.944 0.937 0.919 0.932
Model 1; TQM, and financial performance
Model 2; TQM, Focus strategy and customer satisfaction
Model 3; TQM, Focus strategy and internal process performance
Model 4; TQM, focus strategy and organization learning and growth
Model 5; TQM, Focus strategy and overall performance
4.11.1 TQM, Generic Strategies and Financial performance
To test the mediating effect of TQM on relationship between generic strategies
strategy and financial performance of the organization. First the independent
variables generic strategies (cost leadership strategy, differentiation strategy and
Focus strategy) should relate to the dependent variable (financial performance) such
that Beta in equation one is significant. The study findings as indicated in the Table
4.45 showed that there was a positive significant relationship between generic
strategies and financial performance. The regression coefficient for generic strategy
(β = 0.851 and P-value = 0.01) therefore a unit increase in generic strategy index led
to an increase in manufacturing firm financial performance index by 0.851 since the
p-value was less than 0.05. Fulfilling the mediation first condition. The second
condition involves testing if the independent variables generic strategies (focus
strategy, cost leadership and differentiation) should relate to the mediator variable
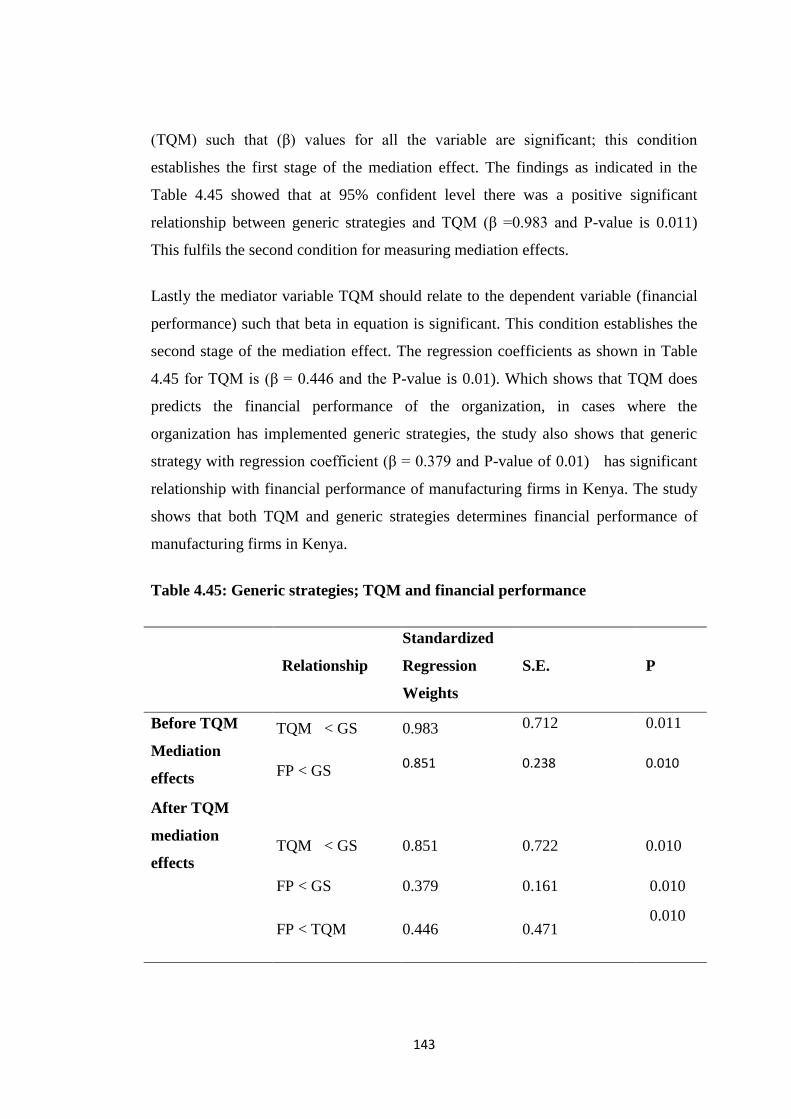
143
(TQM) such that (β) values for all the variable are significant; this condition
establishes the first stage of the mediation effect. The findings as indicated in the
Table 4.45 showed that at 95% confident level there was a positive significant
relationship between generic strategies and TQM (β =0.983 and P-value is 0.011)
This fulfils the second condition for measuring mediation effects.
Lastly the mediator variable TQM should relate to the dependent variable (financial
performance) such that beta in equation is significant. This condition establishes the
second stage of the mediation effect. The regression coefficients as shown in Table
4.45 for TQM is (β = 0.446 and the P-value is 0.01). Which shows that TQM does
predicts the financial performance of the organization, in cases where the
organization has implemented generic strategies, the study also shows that generic
strategy with regression coefficient (β = 0.379 and P-value of 0.01) has significant
relationship with financial performance of manufacturing firms in Kenya. The study
shows that both TQM and generic strategies determines financial performance of
manufacturing firms in Kenya.
Table 4.45: Generic strategies; TQM and financial performance
Relationship
Standardized
Regression
Weights
S.E. P
Before TQM
Mediation
effects
TQM < GS 0.983 0.712 0.011
FP < GS 0.851 0.238 0.010
After TQM
mediation
effects
TQM < GS
0.851
0.722
0.010
FP < GS 0.379 0.161 0.010
FP < TQM 0.446 0.471 0.010

144
Figure 4.18: Generic strategies, TQM and Financial performance
The findings show that both TQM and generic strategies determine the financial
performance of organizations. However, the direct effects of generic strategies on
financial performance of manufacturing firms have reduced from 0.851 to 0.379.
The study therefore concludes that TQM partially mediates the relationship between
generic strategies and financial performance. According to Baron and Kenny (1986)
Partial mediation maintains that the mediating variable accounts for some, but not
all, of the relationship between the independent variable and dependent variable.
Partial mediation implies that there is not only a significant relationship between the
mediator (TQM) and the dependent variable (financial performance), but also some
direct relationship between the independent (generic strategies) and dependent
variable (financial performance). The significance of this indirect effect (mediation
effects) was tested using bootstrapping procedures as recommended by Hayes
(2013). The indirect (mediation) effect of TQM on the relationship between generic
strategies and financial performance is significantly different from zero at the 0.05
confident level (p=.012 two-tailed). Based on bootstrap approximation obtained by
constructing two-sided bias-corrected confidence intervals. The study therefore

145
concluded that TQM partially mediate the relationship between generic strategies
and financial performance of the organization.
This result shows that TQM partially mediates the relationship between generic
strategies and financial performance. Consistent with this study are findings are
Zatzick et al. (2012) which shows that TQM have significant mediating effect on the
relationship between cost leadership strategy and organization performance. The
study is similar to Prajogo and Sohal (2006) study shows TQM has significant
mediating effect on differentiation strategy. This is because improved quality should
shrink costs and thus yield positive outcome for financial performance; superior
quality products also enhance the retention rate of existing customers and attract new
ones thus strengthening market share and revenues. Improved product quality or
services should increase consumer loyalty and reduce customer complains. Hence
TQM mediates the relationship between generic strategies and financial
performance. This study shows that TQM only partially mediated the relationships a
significant portion of variance in performance is directly explained by strategies
without being mediated by TQM. This finding is important in the sense that when
pursuing TQM under the context of generic strategies, organization also needs to
furnish certain resources that are not accommodated by TQM such as economies of
scales, market communication, market research, market development, and adopted of
technology.
4.11.2 TQM practice on Generic Strategies and Customer Satisfaction.
To test the mediating effect of TQM on relationship between generic strategies
strategy and customer satisfaction of the organization. First the independent variables
generic strategies (differentiation strategy, cost leadership strategy and Focus
strategy) should relate to the dependent variable (customer satisfaction) such that
Beta in equation one is significant. The study findings as indicated in Table 4.46
showed that there was a positive significant relationship between; generic strategies
and customer satisfaction. The regression coefficient for generic strategies (β =
0.624 and P-value = 0.01) therefore a unit increase in generic strategy index led to an

146
increase in manufacturing firm customer satisfaction index by 0.624 since the p-
value was less than 0.05.
The second condition involves testing if the independent variables generic strategies
(Focus strategy, cost leadership and differentiation) should relate to the mediator
variable (TQM) such that (β) values for all the variable are significant; this condition
establishes the first stage of the mediation effect. The findings as shown in Table
4.46 showed that at 95% confident level there was a positive significant relationship
between generic strategies and TQM (β =0.983 and P-value <0.011) This fulfils the
second condition for measuring mediation effects.
Finally, the mediator variable TQM should relate to the dependent variable
(customer satisfaction) such that beta in equation is significant. This condition
establishes the second stage of the mediation effect. The Table 4.46 shows the
regression coefficients for TQM is (β = 0.358 and the P-value is 0.01). This shows
that TQM predicts customer satisfaction indices in manufacturing firms in Kenya,
study also shows that generic strategies (β = 0.302 and a P-value of 0.01); has
significant relationship with customer satisfaction performance at confident level of
99 %.
Table 4.46: Generic strategies on TQM and customer satisfaction performance
Relationship Standardized
regression
P value S.E
Before TQM
mediating effects
TQM < GS 0.983 0.011 0.712
CS < GS 0.624 0.010 0.260
After TQM
mediating effects
TQM < GS 0 .844 0.010 0.109
CS < TQM 0.358 0.010 0.065
CS < GS 0.302 0.010 0.49

147
Figure 4.19: Generic strategies on TQM and Customer satisfaction performance
Both generic strategies and TQM predicts customer satisfaction levels in the
manufacturing firms in Kenya. However, the direct effects of generic strategies on
customer satisfaction have reduced from (0.624 to 0.302). Hence the study concludes
that TQM partially mediate the relationship between generic strategies and customer
satisfaction levels in the Kenyan manufacturing firms. According to Baron and
Kenny (1986) Partial mediation maintains that the mediating variable accounts for
some, but not all, of the relationship between the independent variable and dependent
variable. Partial mediation implies that there is not only a significant relationship
between the mediator (TQM) and the dependent variable (customer satisfaction
performance), but also some direct relationship between the independent (generic
strategies strategy) and dependent variable (customer satisfaction). The significance
of this indirect effect (mediation effects) was tested using bootstrapping procedures
as recommended by Hayes (2013). The results show that the indirect (mediation)
effect of TQM on the relationship between generic strategies and customer
satisfaction is significantly different from zero at the 0.01 confident level (P = 0.010

148
two-tailed) based on bootstrap approximation obtained by constructing two-sided
percentile- based confidence intervals
The study shows that TQM partially mediates the relationship between generic
strategies and customer satisfaction. TQM provides resources that are invisible
intangible and extremely difficult for a competitor to copy for example; a company
unique culture, transformational leaders, superior customer service. Companies that
implement TQM have to explore and find ways to serve customers expectations at
their best. Consistent to this finding are Faezi (2014) and Prajogo and Sohal (2006).
Studies which showed TQM practice customer orientation helped organization to
gaining market advantage and outperform their competitor in terms of attracting
more customers with distinguished products and charge premium prices. Similarly,
studies (Kim, 2016 and Kumar et al., 2009) hypothesized and found evidence that
there was strong significant relationship between TQM and customer satisfaction. It
is imperative to note that TQM does not fully mediated the relationships; a
significant portion of variance in performance is directly explained by strategies
without being mediated by TQM. This finding is important in the sense that when
pursuing TQM under the context of generic strategies, organization also needs to
furnish certain resources that are not accommodated by TQM such as market
research, market development, electronic marketing and marketing communication.
The study rejects the Null hypothesis and accepts the alternative hypothesis that
TQM mediates the relationship between generic strategies and customer satisfaction
performance.
4.11.3 TQM on Generic Strategies and Internal Process Management
To test the mediating effect of TQM on relationship between generic strategies
strategy and internal process performance. First the independent variables generic
strategies (differentiation strategy, cost leadership strategy and Focus strategy)
should relate to the dependent variable (internal process management performance)
such that Beta in equation one is significant. The study findings as indicated in the
Table 4.47 showed that there was a significant relationship between generic
strategies (β = 0.688 and P-value = 0.01) and organization internal process

149
performance. Therefore, a unit increase in generic strategies led to an increase in
manufacturing firm process performance index by 0.688 since the p-value was less
than 0.05. This fulfils the first condition for measuring mediation effects.
The second condition involves testing if the independent variables generic strategies
(Focus strategy, cost leadership and differentiation) should relate to the mediator
variable (TQM) such that (β) values for all the variable are significant; this condition
establishes the first stage of the mediation effect. The findings as indicated in Table
4.47 showed that at 95% confident level there was a positive significant relationship
between generic strategies and TQM (β =0.983 and P-value <0.011) This fulfils the
second condition for measuring mediation effects.
Lastly the mediator variable TQM should relate to the dependent variable such that
beta in equation is significant. This condition establishes the second stage of the
mediation effect. The findings as indicated in Table 4.47 shows the regression
coefficients for TQM is (β = 0.334 and the P-value is 0.0421). which shows that
TQM does predicts performance of process management of the organization, in cases
where the organization has implemented generic strategies, the study also shows that
generic strategies (β = 0.290 and P-value of 0.0432) have a significant effect on the
performance of internal processes.
Table 4.47: Generic Strategies on TQM and Internal Process Performance
Relationship Standardized regression P-value
Before TQM
mediation effects
TQM < GS 0.983 0.0110
IP < GS 0.688 0.0100
After TQM
mediation effects
TQM < GS 0.868 0.0254
IP < TQM 0.334 0.0421
IP < GS 0.290 0.0432

150
Figure 4.20: Generic Strategies on TQM and Internal Process Performance
The study findings show that both TQM and generic strategies predicts the internal
process performance of the organization. However, the direct effects of generic
strategies on internal process performance have reduced from 0.688 to 0.290. Hence
the study concludes that TQM partially mediate the relationship between generic
strategies and internal process performance in the Kenyan manufacturing firms.
According to Baron and Kenny (1986) Partial mediation maintains that the mediating
variable accounts for some, but not all, of the relationship between the independent
variable and dependent variable. Partial mediation implies that there is not only a
significant relationship between the mediator (TQM) and the dependent variable
(customer satisfaction performance), but also some direct relationship between the
independent (generic strategies strategy) and dependent variable (internal process
performance).
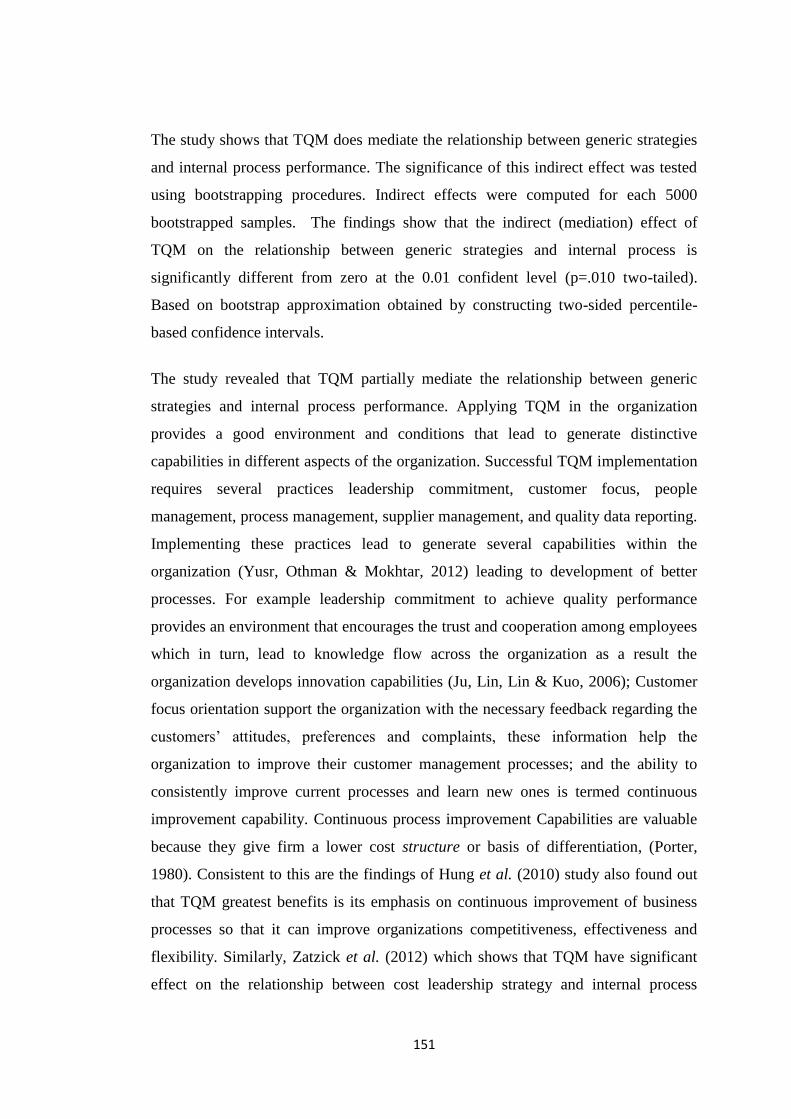
151
The study shows that TQM does mediate the relationship between generic strategies
and internal process performance. The significance of this indirect effect was tested
using bootstrapping procedures. Indirect effects were computed for each 5000
bootstrapped samples. The findings show that the indirect (mediation) effect of
TQM on the relationship between generic strategies and internal process is
significantly different from zero at the 0.01 confident level (p=.010 two-tailed).
Based on bootstrap approximation obtained by constructing two-sided percentile-
based confidence intervals.
The study revealed that TQM partially mediate the relationship between generic
strategies and internal process performance. Applying TQM in the organization
provides a good environment and conditions that lead to generate distinctive
capabilities in different aspects of the organization. Successful TQM implementation
requires several practices leadership commitment, customer focus, people
management, process management, supplier management, and quality data reporting.
Implementing these practices lead to generate several capabilities within the
organization (Yusr, Othman & Mokhtar, 2012) leading to development of better
processes. For example leadership commitment to achieve quality performance
provides an environment that encourages the trust and cooperation among employees
which in turn, lead to knowledge flow across the organization as a result the
organization develops innovation capabilities (Ju, Lin, Lin & Kuo, 2006); Customer
focus orientation support the organization with the necessary feedback regarding the
customers’ attitudes, preferences and complaints, these information help the
organization to improve their customer management processes; and the ability to
consistently improve current processes and learn new ones is termed continuous
improvement capability. Continuous process improvement Capabilities are valuable
because they give firm a lower cost structure or basis of differentiation, (Porter,
1980). Consistent to this are the findings of Hung et al. (2010) study also found out
that TQM greatest benefits is its emphasis on continuous improvement of business
processes so that it can improve organizations competitiveness, effectiveness and
flexibility. Similarly, Zatzick et al. (2012) which shows that TQM have significant
effect on the relationship between cost leadership strategy and internal process

152
performance. Lastly Prajogo and Sohal (2006) study which showed that TQM did
mediate the relationship between differentiation strategy and process innovation.
TQM only partially mediated the relationships a significant portion of variance in
performance is directly explained by strategies without being mediated by TQM.
This finding is important in the sense that when pursuing TQM under the context of
generic strategies, organization also needs to furnish certain resources that are not
accommodated by TQM such as economies of scales, market communication, market
research, market development, and adopted of technology.
4.11.4 TQM, Generic Strategies and Learning and Growth
To test the mediating effect of TQM on relationship between generic strategies
strategy and knowledge management. First the independent variables generic
strategies (differentiation strategy, cost leadership strategy and Focus strategy)
should relate to the dependent variable (knowledge management performance) such
that beta in equation one is significant. The study findings as indicated in Table 4.48
showed that there was a significant relationship between generic strategies and
knowledge management (β = 0.812 and P-value = 0.01) therefore a unit increase in
generic strategies index led to an increase in manufacturing firm knowledge
management by 0.812 since the p-value was less than 0.05. This fulfils the first
condition for measuring mediation effects.
The second condition involves testing if the independent variables generic strategies
(Focus strategy, cost leadership and differentiation) should relate to the mediator
variable (TQM) such that (β) values for all the variable are significant; this condition
establishes the first stage of the mediation effect. The findings as indicated in Table
4.48 showed that at 95% confident level there was a positive significant relationship
between generic strategies and TQM (β =0.983 and P-value <0.011) This fulfils the
second condition for measuring mediation effects.
Lastly the mediator variable TQM should relate to the dependent variable such that
beta in equation is significant. This condition establishes the second stage of the
mediation effect. The findings as indicated in Table 4.48 shows the regression

153
coefficients for TQM is (β = 0.418 and the P-value is 0.01) fulfilling the last step in
the test for mediation effect. The study also shows that generic strategies with
regression coefficient (β = 0.364 and the P-value of 0.01) has significant
relationship on organization learning and growth.
Table 4.48: Generic Strategies; TQM and Learning and Growth
Relationship Regression
weight
p
Before TQM
mediation effects
OLG < GS 0.812 0.010
TQM< GS 0.983 0.011
After TQM mediation
effects
TQM < GS 0.872 0.010
OLG < GS 0.364 0.010
OLG < TQM 0.418 0.010
GS(Generic strategies); OLG(Orgarnization learning and growth)
Figure 4.21: Generic Strategies, TQM and Learning and Growth

154
The study shows that both TQM and generic strategies determines organization
learning and growth. However, the direct effects of generic strategies on organization
learning and growth have reduced from 0.812 to 0.364. According to Baron and
Kenny (1986) Partial mediation maintains that the mediating variable accounts for
some, but not all, of the relationship between the independent variable and dependent
variable. Partial mediation implies that there is not only a significant relationship
between the mediator (TQM) and the dependent variable (organization learning and
growth), but also some direct relationship between the independent (generic strategy)
and dependent variable (organization learning and growth).
The study concludes that TQM partially mediates the relationship between generic
strategies and organization learning and growth. The significance of this indirect
effect was tested using bootstrapping procedures. The indirect (mediation) effect of
TQM on the relationship between generic strategies and organization learning and
growth is significantly different from zero at the 0.01 confident level (p=.010 two-
tailed). This is based bootstrap approximation obtained by constructing two-sided
percentile- based confidence intervals. However, the direct effects of generic
strategies on organization learning and growth have reduced from (0.812 to 0.364).
The indirect (mediation) effect of TQM on the relationship between generic
strategies and organization learning and growth is significantly different from zero at
the 0.01 confident level (p=.010 two-tailed). This is based bootstrap approximation
obtained by constructing two-sided percentile- based confidence intervals.
The study shows that TQM mediates the relationship between generic strategies and
organization learning and growth. The mediation effect can be explained by the fact
that TQM enables create “learning organization” which evaluates, stores, uses and
commercializes expertise and authentic knowledge of the employees in the
organizations creating organization more powerful and valuable and more
competitive than its competitors. TQM practices; Customer focus practice supplies
the organization with customer needs information that results in generating new ideas
to fulfil their customers’ demands; continuous improvement practice improves know-
how within the organization by providing the changes in process and adapting new
methods to do work. Suppliers generally possess superior expertise and knowledge

155
which may be crucial for new product development (Honarpour et al., 2012) and
people management develops autonomy and ideas exchange among employees that
result in innovation. Leading to new product development.
Closely related to this finding are the findings of Duran et al. (2014) which showed
that Enterprises that have implemented TQM practices are better in the fields of
obtaining knowledge from customers and participation of employees in
dissemination of knowledge. Hung et al. (2010) study also found out that TQM
greatest benefit is its emphasis on continuous improvement of business processes so
that it can improve organizations competitiveness, effectiveness and flexibility. To
achieve continuous improvement firms must promote organization learning to
enhance knowledge that can be utilized in future (Islam et al, 2011). Hung et al.
(2010) posited that Knowledge Management initiatives have an indirect effect on
innovation performance through TQM practice. Hence TQM partially mediates the
relationship between generic strategies and organization learning and growth. TQM
only partially mediated the relationships a significant portion of variance in
performance is directly explained by strategies without being mediated by TQM.
This finding is important in the sense that when pursuing TQM under the context of
generic strategies, organization also need to furnish certain resources that are not
accommodated market communication, networking, market research, market
development, and in order to increase its ability to learn and grow.
4.11.5 TQM practice on Generic Strategies and Organization Performance
To test the mediating effect of TQM on relationship between generic strategies
strategy and overall performance. Generic strategies (differentiation strategy, cost
leadership strategy and Focus strategy) should relate to the dependent variable
(overall organization performance) such that Beta in equation one is significant. The
study findings as shown in Table 1.49 showed that there was a significant
relationship between the generic strategies and organization performance. The
regression coefficient for generic strategies (β = 0.951 and P-value = 0. 01) therefore
a unit increase in generic strategies strategy index led to an increase in manufacturing
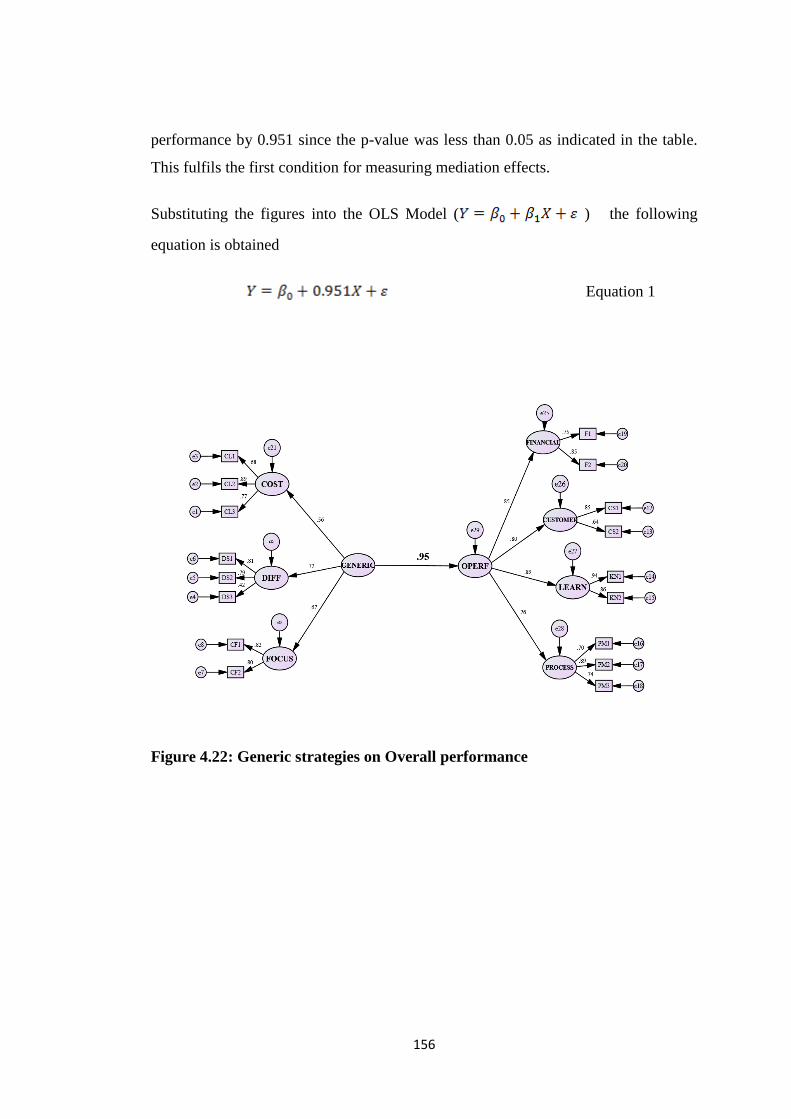
156
performance by 0.951 since the p-value was less than 0.05 as indicated in the table.
This fulfils the first condition for measuring mediation effects.
Substituting the figures into the OLS Model ( ) the following
equation is obtained
Equation 1
Figure 4.22: Generic strategies on Overall performance

157
Table 4.49: Generic strategies on Overall performance
Regression
Weights
Standardized
Regression Weights S.E. P
Generic strategies 1.770 0.951
0.621 0.010
Dependent variable: overall performance
The second condition involves testing if the independent variables generic strategies
(focus strategy, cost leadership and differentiation) should relate to the mediator
variable (TQM) such that (β) values for all the variable are significant; this condition
establishes the first stage of the mediation effect. The findings showed that at 95%
confident level there was a positive significant relationship between generic
strategies and TQM (β =0.983 and P-value <0.011) Substituting this into the OLS
model the following equation is obtained
Equation 2
Figure 4.23: Generic strategies on TQM

158
Table 4.50: Generic strategies on TQM
Regression
Weights
Standardized Regression
Weights S.E. P
Generic
strategy 1.860
0.983 0.712 0.011
Dependent variable: Total Quality Management
Lastly the regression coefficients for TQM is (β = 0.451 and the P-value is 0.01).
This shows that TQM does predict the overall performance of the firm. Similarly, the
direct effects of generic strategies on organization performance is (β =0.388 and the
p value is 0.087). This shows that both TQM and generic strategies does predict the
and overall performance of the firm of the firm at 90% confidence level. However,
the direct effects of Generic strategies on TQM have reduced from (0.951 to 0.388).
This indicates that TQM partially mediates the relationship between TQM and
overall performance. Substituting the figures into the OLS Model
the following equation is obtained.
Equation 3
Y= organization performance
β0 = constant
X = Generic strategies (cost leadership strategy, differentiation and focus
strategy)
M= total quality management (mediator)
= error term.
The significance of indirect effects was further tested using bootstrapping
procedures. The indirect effects were computed for each 5000 bootstrapped samples.

159
The findings showed that the indirect (mediation) effect of TQM on the relationship
between generic strategies and overall performance is significantly different from
zero at the 0.10 confident level (p=.10 two-tailed) based on a bootstrap
approximation obtained by constructing two-sided percentile- based confidence
intervals.
Table 4.51: Generic strategies on TQM and overall performance
Relationship Standardized Regression
Weights P
TQM < Generic strategies 0.861 0.010
Overall Performance < Generic strategies 0.388 0.087
Overall performance < TQM 0.451 0.051
Figure 4.24: Generic strategies, TQM and overall performance

160
The study findings show that a combination of three generic strategies had a positive
effect on financial, customer satisfaction, internal process performance and
organization learning and growth performance. Porter (1980) explains that if
sometimes a firm can successfully pursue more than one approach as its primary
target, it is rarely possible. This is because effective implementation of any of these
strategies usually requires total commitment and supporting arrangements that are
diluted if there is more than one primary target (Furrer, Sudharshan, Thomas &
Alexandre, 2008). However the study results are inconsistent to this and are in
agreement with Salavou (2013), Huang(2011) and Shinkle, Kriauciunas and
Hundley (2013) findings who argued that conditions which favour cost leadership
strategies were independent conditions that might favour differentiation strategies
and also consistent with scholars (Parnell 2013; Manev-Azorin & Claver-Cortés,
2009) who argue that combining elements of both generic competitive strategies,
simultaneously lead to better performance. These findings are the same as findings
from (Waweru, 2011) whose findings show that manufacturing firms in Kenya
effectively implement all the generic strategies concurrently.
TQM mediates the relationship between generic strategies and organization
performance consistent to this finding is the findings of Yuns et al. (2013). TQM is a
culture that is embedded in the organization. This culture instils a culture of
innovation, effective communication, and knowledge sharing and employee
involvement and thus had a potential effect on generic strategy and enhances the
performance of manufacturing firms. Also conceptualizing TQM as a strategic
resource that is unique to every organization and is difficult to imitate TQM then
shapes the strategy formulation process in an organization and thus leading to a
competitive advantage. TQM only partially mediated the relationships a significant
portion of variance in performance is directly explained by strategies without being
mediated by TQM. This finding is important in the sense that when pursuing TQM
under the context of generic strategies, organizations also need to furnish certain
resources that are not accommodated by TQM such as economies of scales, market
communication, market research, market development, and adopted of technology.

161
CHAPTER FIVE
SUMMARY, CONCLUSION AND RECOMMENDATION
5.1 Introduction
This chapter presents the summary conclusions and recommendations of the study on
the mediating effect of TQM on the relationship between generic strategies and
Kenya manufacturing firm’s performance.
5.2 Summary of Findings
This section presents the summary of the study on the mediating effects of TQM on
relationship between generic strategies and organization performance based on
specific objectives.
5.2.1 TQM practice on the relationship between Cost Leadership Strategy and
Organization Performance
The study concluded that most of the manufacturing firms in Kenya have
implemented, cost leadership strategy either exclusively or as a dual strategy with
differentiation strategy. The study also confirmed that the ISO certified
manufacturing firms had implemented TQM practices. The study established that
TQM practice such as continuous process improvement enabled manufacturing firm
to improve their Operation efficiencies and reduce wastage, defects rates and other
related costs. It also discovered that TQM practice supplier partnerships had enable
their organization to reduce order–processing cycles and access raw materials and
supplies at affordable prices. This enabled the organizations to reduce costs.
The study further discovered that there was a positive significant relationship
between Cost leadership strategy and financial performance; customer satisfaction;
internal process improvement; organization learning and growth and the overall
performance of the organization. It also revealed there was strong significant
relationship between cost leadership strategy and total quality management. On the
indirect (mediation) effects of TQM on the relationship between cost leadership and

162
organization performance. The study determined that TQM partially mediates the
relationship between cost leadership strategy and financial performance; customer
satisfaction; internal process performance; organization learning and growth and
overall organization performance.
5.2.2 To determine the Mediating effect of TQM practice on the Relationship
between Differentiation Strategy and Organization Performance.
The study findings revealed that there was a positive significant relationship between
differentiation strategy and financial performance; customer satisfaction; internal
process performance; organization learning and growth and the overall performance
of the organization. It also discovered that there was a positive significant
relationship between differentiation strategy and TQM. On the mediation effects of
TQM on relationship between differentiation strategy and organization performance,
the study findings varied based on the performance measure used. On the indirect
effects of TQM on the relationship between differentiation strategy and financial
performance and overall performance the study established that TQM partially
mediated these relationships. However, it also established that TQM completely
mediated the relationship between differentiation strategy and the following
performance measures customer satisfaction, internal process performance and
organization learning and growth.
5.2.3 To examine the Mediating effect of TQM practice on the Relationship
between Focus Strategy and Organization Performance
The study determined that there exists strong significant relationship between focus
strategy and financial; customer satisfaction; internal process performance;
organization learning and growth and the overall performance of the organization.
The study also discovered that there exists strong significant relationship between
focus strategy and TQM. Regarding the indirect effects of TQM on the relationship
between Focus strategy and organization performance, the findings varied for each
performance measures. The study revealed that TQM completely mediates the
relationship between focus strategy and the following performance measures;
financial performance; Customer satisfaction and overall performance of the

163
organization. It also established that TQM partially mediates the relationship
between focus strategy and the following performance measures internal process
performance and organization learning and growth.
5.2.4 To establish the Mediating Effect of TQM practice on the Relationship
between Generic Strategies and Organization Performance.
The study established that most manufacturing firms had adopted all the three
generic strategies combined. The manufacturing firms in Kenya preferred
differentiation strategy as method of obtaining competitive advantage and cost
leadership strategy enabled the manufacturing firms to expand their market share
while focus strategy enabled firms to reach market segments that are not well served.
The study discovered that there exists strong positive significant relationship
between TQM and generic strategies. The study findings further indicated that there
was a positive significant relationship between generic strategies and financial
performance; customer satisfaction; internal process performance; organization
learning and growth and the overall performance of the organization. The study
concluded that TQM partially mediate the relationship between generic strategies
and financial performance; customer’s satisfaction; internal process performance;
organization learning and growth and overall performance of manufacturing firms in
Kenya.
5.3 Conclusions
5.3.1 TQM, Cost Leadership Strategy and Organization Performance
The study concludes that both TQM and Cost leadership have a direct effect on the
organization performance using all four dimensions of the balance scorecard.
However, TQM partially mediates the relationship between cost leadership strategies
and organization performance. This shows that significant portion of variance in
performance is directly explained by strategies without being mediated by TQM.
This finding is important in the sense that when pursuing TQM under the context of
generic strategies, organizations also need to furnish certain resources that are not

164
accommodated by TQM such as economies of scales, market communication, market
research, market development, and adopted of technology.
5.3.2 TQM, differentiation Strategy and Organization Performance
The study concludes both TQM and differentiation strategies significantly and
positively relate to the four organization performance measures (Financial, customer
satisfaction, organization learning and growth, and internal process performance).
Depending on the performance measure the indirect effects of TQM vary between
partial mediation and complete mediation. TQM partially mediated the relationships
between differentiation strategy and financial performance and overall performance.
It has also been established that TQM completely mediated the relationship between
differentiation strategy and the following performance measures customer
satisfaction, internal process performance and organization learning and growth.
5.3.3 TQM, Focus Strategy and Organization Performance
The concludes that both TQM and focus strategy have a positive effect on firms
financial; customer satisfaction; internal process performance; organization learning
and growth and the overall performance of the organization. The study also
discovered that there exists strong significant relationship between focus strategy and
TQM. Regarding the indirect effects of TQM on the relationship between Focus
strategy and organization performance, the findings varied for each performance
measures. TQM completely mediates the relationship between focus strategy and the
following performance measures; financial performance; Customer satisfaction and
overall performance of the organization. It also established that TQM partially
mediates the relationship between focus strategy and the following performance
measures internal process performance and organization learning and growth.
5.3.4 TQM, generic Strategy and Organization Performance
TQM positively and significantly influenced organization performance using the four
dimensions of performance as indicated in the balance score card (financial
perspective, customer perspective, internal process perspective and organization
165
learning and growth perspective). Similarly, all the three generic strategies combined
had a positive and significant effect on the balance scorecard measures. The study
also concludes that TQM partially mediate the relationship between generic strategy
and organization performance. Indicating that TQM can be employed as an effective
means of implementing generic strategies within the organization and achieve
satisfactory organization performance in all the four dimensions recommended in the
balance scorecard however it should be embedded in an organization together with
generic strategies not captures in TQM such as economies of scale for a firm to be
effective.
5.4 Recommendations
The impact of manufacturing industry on economic development is tremendous, a
strong and thriving manufacturing sector usually precipitate industrialisation. The
manufacturing sector is widely considered to be the ideal industry to drive African
development; this is due to the labour-intensive export-focused nature of the
industry. Kenya manufacturing industry like many African countries is still in its
infancy and is curtailed by a number of shortcomings among this is competition. The
sector faces high competition; the survival rate of export manufacturing firms is low.
Particularly the first few years of entering export markets, 65% of firms exit the
export market by the second year of operation (World Bank, 2014). The industry
plays a relatively small role on economic development. However regardless of this
contribution vision 2030 stipulates that the sector should account for 20% percent of
the GDP achieving this goal requires addressing underlying constrains that hinder
faster growth. These include stiff competition from imports. To improve the
competitiveness of manufacturing firms in Kenya based on the findings firms need to
implementation TQM coupled with generic strategies.
The importance of TQM on organizations competitiveness is enormous however
only 39 manufacturing firms are ISO certified it is imperative that the government
through the ministry of industrialization and using organizations such as Kenya
Bureau of standards should create awareness of the value of TQM in manufacturing
firm. The study also recommends that organizations such as Kenya Bureau of
166
standards (KEBS) that manage quality inspection programs for manufacturing firms
should restructure their programs to include quality management practices.
Manufacturing firms should be encouraged to integrate generic strategies with TQM
practice, as TQM will enable them to build processes that are responsive to the
customer’s need, enable them transform existing resources in to new capabilities and
integrate their processes with those of their customers and suppliers. This will make
the firms more competitive hence enhancing economic development.
The management of manufacturing firms in Kenya must know the importance of
quality management, they must create a culture that is conducive and supportive of
quality implementation. They must align quality implementation with their strategic
goals and competitive environment. TQM practice should be integrated within the
organization systems, processes and core values which inform the firm’s strategic
plan. TQM designers and practitioners should understand the link between TQM and
the various strategies and core processes could be critical for designing TQM
programmes that are well aligned to the culture of the organization as well as its
strategic management processes. It is prudent for managers to understand the role
that different TQM practices play in affecting the various generic strategies and their
selection process. This important if the management deploying TQM aims gaining
competitive advantage from this powerful strategic resource tool.
5.5 Suggestions for Further Studies
For researchers integrating the roles that TQM plays in organization in a holistic
form that takes into consideration all the possible relationship between variables is
enriching to this research stream. Future research may opt to confirm the findings of
this study by undertaking the research through a longitudinal research approach to
detect the dynamic changes of the relationships between variables through the
processes.
The focus of this study was only in one industry, future studies can leverage the
approach used in the present study in order to examine the impact of TQM on other
industries and examine the impact on various dimensions of performance using. The
167
study recommends that a replica of the same study should be carried out in the
service industry.
While this study provided insight into generic TQM and organization performance.
Research on TQM in relation to functional studies remains unexamined, future
research should focus on TQM effect on performance of functional strategies,
marketing strategies, innovation, product diversification and management areas such
as leadership, human resource management.
168
REFERENCES
Aboyassi N. A., Alnsour, M. & Alkloub, M. (2011). Achieving total quality
management using knowledge management practices. International
Journal of Commerce and Management, 21(4), 394-409.
Acar, A. Z. & Zehir, C. (2010). The harmonized effects of generic strategies and
business capabilities on business performance. Journal of Business
Economics and Management, 11(4), 689-711.
Acquaah, M. (2011). Business strategy and competitive advantage in family business
in Ghana: The role of social networking relationships. ,. Journal of
Development Entrepreneurship, 16(1), 103-126.
Acquaah, M. & Agyapong, A. (2015). The Relationship between Competitive
strategy and firms performance in Micro and Small businesses in Ghana:
The Moderating Role of Managerial and Marketing Capabilities. Africa
Journal of Management, 11(4), 689-711.
Acquaah, M. & Ardekani, M. Y. (2008). Does the Implementation of a combination
Strategy Yield Incremental performance benefits? A perspective from a
transition economy in Sub- Saharan Africa. Journal of Business
Research, 61(4), 346-354.
Acquaah, M., Adjei, C. M. & Mensa-Bonsu, F. I. (2008). Competitive strategy,
environmental characteristics and performance in African emerging
economies. Journal of African Business, 9(1), 93-120.
doi:10.1080/15228910802053732
Addae-Korankye, A. (2013). Total Quality Management (TQM): A Source of
Competitive Advantage. A Comparative Study of Manufacturing and
Service Firms in Ghana”, International Journal of Asian Social Science.
Asian Economic and Social Society, 3(6), 1293-1305.

169
Agyapong, A. & Boamah, R. B. (2013). Business Strategies and competitive
Advantage of family Hotel Business in Ghana: The role of Strategic
Leadership. Journal of Applied Business Research, 29(2), 531.
Akgün, A. E., Incea, H., Imamoglua, S. Z., Keskin, H. & Kocoglua, İ. (2014). The
mediator role of learning capability and business innovativeness between
total quality management and financial performance. International
Journal of Production Research, 52(3), 888-901.
doi:10.1080/00207543.2013.843796
AL-Aali, A. & Teece, D. J. (2014). International entrepreneurship and the theory of
the (Long-Lived) International firms: A capabilities perspectives.
Entrepreneurship Theory and Practice, 38(1), 95-116.
Al-alak, B. A. & Tarabieh, S. A. (2012). Gaining competitive advantage and
organization performance customer orientation, innovation
differentiation, and market differentiation. International Journal of
Economics and management sciences, 1(5).
Alexander, J. A., Weiner, B. J. & Griffith, J. (2006). Quality improvement and
Hospital finance performance. Journal of Organization Behaviour, 27(7),
1003-29.
Ali, S. A., Awdini, N. A. & Adan, H. D. (2012). The Effect of Globalization on
Local Industries: A Case of Mogadishu Manufacturers. International
Journal of Business and Management Tomorrow, 2(11), 1-9.
Allen, R. S. & Helms, M. M. (2006). Linking strategic practices and organizational
performance to porter’s generic strategies. Business Process
Management Journal,, 1F2, 433-454.
Alolayyana, N. F., Idris, F., Ibreh, A. & Ali, K. M. (2011). Advance mathematical
model to study and analyse the effects of total quality management
(TQM) and Operational flexibility on hospital performance. Total
Quality Management, 22(12).

170
Anand, G., Ward, P. T., Mohan, T. V. & Schilling, D. A. (2009). Dynamic
capabilities through continuous improvement infrastructure. Journal of
Operations Management, 27(6), 444–461. doi:10.1016/j.jom.
2009.02.002
Anand, J., Brenes, E. R., Karnani, A. & Rodriquez, A. (2006). Strategic responses to
economic liberalization in emerging economies: Lessons from
experience. Journal of Business Research, 59(3), 365-371.
Arasa, R. & Gathinji, L. (2014). The Relationship between competitive strategies and
firms performance. International Journal of Economic, Commerce and
Management, II(9), 2348-0386.
Asif , M., Bruijin , J. E., Douglas, A. & Fisscher, A. (2009). Why quality
management fail. International Journal of Quality and reliability
management, 26(8), 778-794.
Atikiya, R., Mukulu, E., Kihoro, J. M. & Waganjo, E. (2015). Effect of
differentiation Strategy on the Performance of Manufacturing Firms in
Kenya. Asian Journal of Humanities and Social Studies, 2321-2799.
Awadallah, E. A. & Allam, A. (2015). A Critique of the Balanced Scorecard as a
Performance Measurement Tool. International Journal of Business and
Social Science, 6(7), 91-99. Retrieved from www.ijbssnet.com
Awino, Z. B., Muchara, M., Ogutu, M. & Oeba, L. K. (2012). Total Quality and
Competitive advantage in Horticulture industry in Kenya. Prime Journal
of Business Administration and Management, 2(4) (2251-1261), 521-532.
Ayandele, I. A. & Akpan, A. P. (2015). The Practice, Challenges and Benefits of
Total Quality Management (TQM) In Manufacturing Firms in Nigeria.
International Journal of Economic and Business Management, 3(5), 62-
74. doi:10.14662/IJEBM2015.024

171
Babin, B. J. & Svensson, G. (2012). Structural equation modeling in social science
research: Issues of validity and reliability in the research process.
European Business Review, 24(4), 320-330. doi:org/10.1108/
09555341211242132
Banker, R. D., Mashruwala, R. & Tripathy, A. A. (2014). Does a differentiation
strategy lead to more sustainable financial performance than a cost
leadership strategy? Management Decision, 52(5), 872-896.
Barney, J. B. (1991). Firms resources and sustainable competitive advantage. Journal
of management Executive, 9(4), 49-61.
Barney, J. B. (2001). Is the resource “View” a useful perspective for strategic
management research . Academy of management review, 11(3), 656-665.
Barney, J. & Hesterly, W. (2006). Organizational Economics: Understanding the
Relationship between Organizations and Economic Analysis. The Sage
handbook of organization studies.
Baron, R. M. & Kenny , D. A. (1986). The Moderator-Mediator Variable Distinction
in Social Psychological Research: Conceptual, Strategic, and Statistical
Considerations. Journal of Pesonality and Social Psychology, 51(6),
1173-1182.
Bhattacharyya, D. K. (2007). Human Resource Research Methods. Oxford: Oxford
University Press.
Birjandi, H., Jahrom , I. N., Darabi, S. A. & Birjandi, M. (2014). The Effect of Cost
Leadership Strategy on ROA and Future Performance of Accepted
Companies in Tehran Stock Exchange. Research Journal of Finance and
Accounting, 5(7).
Bordean, O. N., Borza, A. I., Nistro, L. R. & Mitra, C. S. (2010, August). The Use of
Micheal Porter’s Generic Strategies in the Romanian Hotel Industry.
International Journal of Trade ,Economics and Finance, 1(2).
172
Bose, S. & Thomas, K. (2007). Applying the balanced scorecard for better
performance of intellectual capital. Journal of intellectual capital, 8(4),
653-665.
Boyd, J. H., Walker, C. O., Mullins, J. & Larreche, J.-C. (2013). Marketing
Management: A Strategic, Decision-Making Approach. Irwin : McGraw-
Hill.
Brannen, J. (1992). Combining Qualitative and Quantitative approaches: an
Overview. Aldershot: Avebury.
Calva-Mora, A., Leal , A. & Roldan, J. (2006). Using enablers of EFQM model to
manage institution of higher education. Quality Assurance in Education,
14(2), 99-122.
Cavalier, S., Ggaiardelli, P. & Lerace, S. (2007). Aligning Strategic profiles with
operational metrics in after sales service. Review of International Journal
of Productivity and performance management, 56, 436-455.
Chang, H., Fernando, G. D. & Tripathy, A. (2015). An empirical study of strategic
positioning and production efficiency. Hindawi Publishing Corporation
Advances in Operation Research, 2015(347045), 11.
Chaudary, S., Zafar, S. & Salman, M. (2015). Does Total Quality Management still
shine? Re examining the total quality management effect on financial
performance. Total Quality Management and Business Excellence, 26(7-
8), 811-824.
Chege, J., Ngui, D. & Kimuyu, P. (2014). Learning to compete,. Working paper
series no. 25, Africa Growth initiative at Brooking bank, African
Development; Nation, united; world institute for development economic
research.
Cole, R. E. & Matsumiya, T. (2008). When the pursuit of quality risks innovation.
The TQM Journal, 20(2), 130 - 142. doi:10.1108/17542730810857363
173
Collis, D. J. & Montgomery, C. A. (1995). Competing on resources. Harvard
Business Review., 73, 118-128.
Conner, K. R. (1991). A Historical Comparison of Resource-Based Theory and Five
Schools of Thought Within Industrial Organization Economics: Do We
Have a New Theory of the Firm. Journal of Management, 121-154.
Cooper, D. R. & Schinder, P. S. (2011). Business research methods. (11TH, Ed.)
New York: McGraw Hill.
Creswell, J. W. (2014). Research design: Qualitative, Quantitative and mixed
methods (2ND ed.). London.: Sage publications.
Crook , T. R., Bratton, V. K., Street , V. L. & Ketchen, D. J. (2006). Has strategic
Management Shed the Normal Science Straightjacket? ; Revisiting Bettis
(1991) Critiques. Journal of Managerial Issues, 18(3), 409-423.
Davcik, N. S. & Sharma, P. (2015). Impact of product differentiation, market
investment and brand equity on pricing strategies: a brand level
investigation. European Journal of Marketing, 49, 760-781.
Dess , G. & Davis, P. (1984). Porter’s (1980) generic strategies as determinants of
strategic group membership and organization performance. Academy of
Management Journal, 27(3), 467-488.
Dinh, H. T., Palmade, V., Chandra, V. & Cossar, F. (2012). Light Manufacturing.
The World Bank. Retrieved from
http://siteresources.worldbank.org/DEC/Resources/LightManufacturingI
nAfrica-FullReport.pdf
Drost, E. A. (2011). Validity and Reliability in Social Science Research.Eductaion
Research and Perspectives . 38(1). Retrieved from http://www.
erpjournal.net

174
Duran, C., C’entinder, A. & Sahan, O. (2014). An analysis on the Relationship
between Total Quality Management practices and knowledge
management : The case of Eskisehir. Procedia-Social and Behaviour
Science, 109 , 65-77.
Eisenhardt, K. M. & Jeffrey, M. A. (2000). Dynamic capabilities: what are they?
Strategic Management Journal, 21(10-11), 1105–1121.
doi:10.1002/1097-0266(200010/11)21:10/11<1105::AID-
SMJ133>3.0.CO;2-E
Elisiva, A. R. & Sule, E. T. (2015). Influence of competitive strategy analysis on
improvement of organizational performance. International Journal of
Economics, Commerce and Management, 3(5), 1406-1420. Retrieved
from http://ijecm.co.uk/wp-content/uploads/2015/05/3592.pdf
Escrig-Tena, A. B., Bou-Liusar, J. C., Beltr`an-Mart, Beltr`an-Mart`in, ,. I. & Roga-
Puig, V. (2011). Modelling the implication of Quality Management on
Strategic Flexibility. . Hindawi Publishing Corporation Advances in
Decision Sciences., 2011, 1-27.
Faezi, M. (2014). Study of the relationship between standards of differentiation
strategy and cost leadership with comprehensive quality management in
medic firms. Indian Journal of Fundamental and Applied Life Sciences, 4
(2231-6345), 957-964. Retrieved from www.cibtech.org/sp.ed/
jls/2014/04/jls.htm
Field, A. (2009). Discovering Statistics Using SPSS. London, England: SAGE
Publications.
Foley, K. J. (2005). Meta-management: a stakeholder/quality management approach
to whole of enterprise management. Sydney: SAI Global, .
Fotopoulos, C. V., Psomas, E. L. & Vouzas, F. K. (2010). Investigating total quality
management practice's inter-relationships in ISO 9001: 2000 certified
organisations. Total Quality Managemen, 21(5), 503-515.
175
Freeman, R. & Reed, D. (1983). Stockholders and stakeholders: A new perspective
on corporate governance. California Management Review, 25, 88-106.
Furrer, O., Sudharshan, D., Thomas, H. & Alexandre, M. T. (2008). Resource
configurations, generic strategies and firms performance. Journal of
strategy and management, 1(1), 15-40.
Garvare, R. & Johansson, p. (2010). Management for sustainability-a stakeholder
theory. Total quality Management, 21(7), 737-747.
Gelso, C. j. (2006). Applying theories to research: The interplay of theory and
research in science. In Leong, F.T., &Austin J.T. (Eds) The psychology
Resaerch Handbook. Thousand Oaks: C .A: Sage.
Ghasemi, I., Abdi, E., Yaghmaei, O. & Nemati, R. (2015). Effects of Competitive
Advantage on Company superiority in Global Market. International
letters of Social and Humanistic Sciences, 57 , 65-73.
Goetsch , D. L. & Davis, S. B. (2010). Quality Management for Organizational
Excellence, Pearson, New Jersey, NJ, USA, 6th edition, 2010. (6th ed.)
New Jersey: Pearson.
Graham, N. K., Arthur, Y. D. & Mensah, D. P. (2014). Managerial role in ensuring
successful Total Quality Management programme in Ghanaian printing
firms. The TQM Journal, 26(5), 398-410.
Gray, C. & Macblain, S. (2012). Learning Theories in childhood. London.: Sage
publications Ltd.
Gruber, M., Heinemann, F. & Bretel, M. (2010). Configurations of resources and
capabilities and their performance implications an exploratory study on
technology ventures. Strategic Management Journal, 31, 1337-1356,.
Gujarati, D. N. & Porter, D. C. (2009). Basic Econometrics. Irwin: McGraw-Hill.

176
Hair, J. F., Black, B., Rabin, B., Anderson, R. E. & Tatham, R. L. (2010).
Multivariate Data. Upper Saddle River: Prentice-Hall.
Han, B. & Anantatmula, V. (2007). Knowledge sharing in large IT organizations.
Vine, 37(4), 421-439.
Harlow, E. (2009). Contribution theoretical Encyclopedia of case study research.
Retrieved from Http://www.sageereference.com.proxyl.ncu.edu/
casestudy/ Article_n89.html.
Hayes, A. F. (2013). Introduction to Mediation, Moderation, and Conditional Process
Analysis: A Regression-Based Approach. Journal of Educational
Measurement, 51, 335-337. doi:10.1111/jedm.12050
Herzallah, A. M., Gutierrez-Gutierrez, L. J. & Munoz, R. .. (2014). Total Quality
management practices, competitive strategies and financial performance:
the case of Palestinian industries SMEs. Total Quality Management and
Business Excellence, 25(5/6), 635-649.
Hesse-Biber , S. N. & Leavy, P. (2011). The practice of qualitative research (2ND
ed.). SAGE Publications.
Hoang, D. T., Igel, B. & Laosirihongthong, T. (2010). Total Quality management
(TQM) Strategy and organization characteristics: Evidence from a recent
WTO member. Total Quality Management and Business Excellence,
21(9), 931-951. doi:10.1080/14
Hoope, D., Coughla, J. & Mullen, M. (2008). Structural Equation Modelling:
Guidelines for Determining Model Fit. Electronic Journal of Business
Research Method, 6(1), 53-60.
Hooshyar, B. (2010). Strategic Knowledge Management and its effects on Cost. 2nd
International Conference on Manufacturing Engineering, Quality and
Production Systems. Retrieved from http://www.wseas.us/e-
library/conferences/2010/Constantza/MEQAPS/MEQAPS-31.pdf

177
Huang, J. S. (2011). An examination of business strategies in the second life virtual
market. Journal of Media Business, 8(2), 1-17.
doi:10.1080/16522354.2011.11073520
Hung, R. Y., Lien, B. Y., Fang, S. & McLean, G. N. (2010). Knowledge as a
facilitator for enhancing innovation performance through total quality
management. Total Quality Management &Business Excellence, 21(4),
425-438. doi:10.1080/147833610036
Ireland, R., Hokisson, R. & Hitt, M. (2011). The Management of Strategy -
International Edition (9th ed.). South-Western: Cengage Learning.
Islam, Z., Low, C., Kim, P. & Hasan, I. (2011). Knowledge Management Practices
And Organizational Effectiveness: Empirical Evidence From Banks Of
An Underdeveloped Country. Global Education Journal.
Ismail, A. I., Rose, R. C., Uli, J. & Abdullah, H. (2011). The Relationship between
Organizational Resources and Systems:An Empirical Research. Asian
Social Science, 7(5), 72-81. doi:10.5539/ass.v7n5p72
Itami, H. & Roehl, T. W. (1991). Mobilizing invisible assets. Cambridge: Harvard
university press.
Itami, H. & Roehl, T. W. (1987). Mobilizing invisible assets. Harvard: Harvard
University Press.
Ju, T. L., Lin, B., Lin, C. & Kuo, H. J. (2006). TQM critical factors and KM value.
Total Quality Manage. Bus. Excell., 17(3), 373-393.
Jung, J. Y., Wang, Y. J. & Wu, S. (2009). Competitive strategy, TQM practice, and
continuous improvement of international project management: A
contingency study. International Journal of quality & reliability
management, 26(2), 164-183.
178
Jusoh, R. & Parnel, J. A. (2008). Competitive strategy and performance measurement
in the Malaysian context: An exploratory study. Management decision,
46(1), 5-31.
Kalaurachi, K. A. (2010). Organization culture and Total Quality Management
practices: a Sri Lankan case.,. The TQM Journal, 22(1), 41-55.
Kaliappen, N. & Hilman, H. (2013). Enhancing Organizational Performance
Through Strategic Alignment of Cost Leadership Strategy and
Competitor Orientation. Middle-East Journal of Scientific Research,
18(10), 1411-1416. doi:10.5829/idosi.mejsr.2013.18.10.12410
Kaliappen, N. & Hilman, H. (2014). Do Cost Leadership Strategy and Process
Innovation Influence the Performance of Malaysia Hotel Industry? .
Asian Social Science, 10(10), 134.
Kaplan, R. S. & Norton, D. (1996). Linking the Balanced Scorecard to Strategy.
California Management Review, 39(1), 53-79.
Kaplan, R. S. & Norton, D. P. (1992). The balanced scorecard: measures that drive
performance. . Harvard: Harvard Business Review.
Karani, S. R. & Okibo, W. B. (2012). Effect of total quality management
implementation on business performance in service institutions.
International journal of Research studies in Management, 1(1), 59-76.
Karuppusami, G. & Gandhinathan, R. (2006). Pareto analysis of critical success
factors of Total Quality Management: A literature review and Analysis.
The TQM magazine, 18(4), 372-385.
Kavale, S. (2012). The connection between Strategy and structure. nternational
Journal of Business and Commerce, 1(6), (2225-2436), 60-70.

179
Kaynak, K. & Hartley, L. J. (2008). A Replication and Extension of Quality
Management into Supply Chain. Journal of Operations Management, 26,
468-489.
Kenya association of Manufacturers(KAM). (2008). First things faster, Kenya
competitiveness benchmark report 2008. Retrieved from
www.kam.co.ke.
Kenya National Bureau of Statistics (KNBS). (2015). Economic Survey 2015.
Retrieved from http://www.knbs.or.ke.
Kenya National Bureau of Statistics (KNBS). (2016). Economic Survey 2016.
Retrieved from http://www.knbs.or.ke
Kibe, E. N. & Wanjau, K. (2014). The effect of Quality management systems on
performance of food processing firms in Kenya. Journal of Business
Management, 16(5).
Kim, D. Y., Kumar, V. & Kumar, U. (2012). Relationship between quality
management practices and innovation. Journal of Operations
management, 30(4), 295-315.
Kimani, M. W. & Wagoki, J. (2015). Assessment Of Strategies For Gaining
Competitive Advantage in Insurance Firms in Thika town, Kenya.
International Journal of Economics, Commerce and Management.
Kisaka, S. N. & Okibo, W. B. (2014). Effect of Porters Generic Strategies on
Expansion of Academic programmes for competitive advantage in
Kenya. International Journal in Management and Business studies(2348-
893X).
Kline, R. B. (2005). Principles and practice of structural equation modeling (2nd
ed.). New York: Guilford.

180
Koc, T. (2011). The relationship between TQM and performance in small
manufacturing enterprises: The moderating effect of failure.
International Journal of Industrial Engineering,, 18(4), 203-218.
Kothari, C. R. (2011). Research Methodology: Methods and Techniques. New Delhi:
New Age International Limited Publishers.
Kotler, P. T. & Armstrong, G. (2010). Principles of Marketing. California: Prentice
Hall.
KPMG Africa. (2014). Manufacturing in Africa sector report. Retrieved from
Http//:www.kpmg.com/Africa
Kristianto, Y., Ajmal , M. & Sandhu , M. (2012). Adopting TQM approach to
achieve customer satisfaction: a flour milling company case study. TQM
Journal, 24(1), 29–46.
Kuei, C. H. & Lu, M. H. (2013). Integrating quality management principles into
sustainability management. Total Quality Management & Business
Excellence, 24(1-2), 62-78.
Kumar, R. (2011). Research methodology; A step-by-step guide for beginners.
London: SAGE Publications Ltd.
Kumar, U., Kumar, V., Grosbois, D. & Choisne, F. (2009). Continuo’s improvement
of performance measurement by TQM adopters. Total Quality
Management and Business Excellence, 20(6), 603-616.
doi:10.1080/14783360902924242.
Lakhal, l., Pasin, F. & Liman, M. (2006). Quality management practices and their
impact on performance. International Journal of Quality and Reliability
management, 23(6), 625-646.
Lam, S. Y., Lee, V. H., Ooi, K. B. & Phusavat, K. (2012). A structural equation
model of TQM, market orientation and service quality. Evidence from a
181
developing nation. Managing Service Quality. An International Journal,
22(3), 281–309.
Lambert, D. M. & Schwieterman, M. A. (2012). Supplier relationship management
as a macro business process. Supply chain management an International
Journal., 17(3), 352-377.
Lee, H. & Lee, C. (2014). The effect of total quality management and organization
learning on Business performance: evidence from Taiwanese insurance
industries. Total Quality Management and Business Excellence, 25(9-
10), 1072-1087. doi:10.1080/197615597.2010.96686683
Lee, V., Ooi, K., Tan, B. & Chong, A. Y. (2010). A structural analysis of the
relationship between TQM practices and product innovation. Asian
Journal of Technology Innovation, 18(1), 73-96.
doi:10.1080/197615597.2010.96686683
Li, S., Nathan, B. R., Nathan, T. S. & Rao, S. S. (2006). The impact of supply chain
management practices on competitive advantage and organization
performance,. The international journal of management science, 36(1),
107-124.
Lisboa, J. V., Augusto, M. G. & Yasin, M. M. (2012). Revisiting the Applicability
of Porters Model to the Portuguese Manufacturing: A Departure from
Traditional Strategies. European Journal of Management Studies, 17(1),
83-89.
Luoma, M. A. (2015). Revisiting the strategy-performance linkage. Management
Decision, 53(5), 1083-1106.
MacKinnon, D. P. (2011). Integrating Mediators and Moderators in Research Design.
Res Soc Work Pract., 21(6), 675–681. doi: 10.1177/1049731511414148
Madar, A. (2015). Implementation of total quality management Case study: British
Airways. Economic Sciences , 8 (57), 125-133.

182
Madsen, D. O. & Stenheim, T. (2014). Perceived benefits of balanced scorecard
implementation: some preliminary evidence. Problems and Perspectives
in management, 12(13), 81-90.
Malhotra, A. & Malhotra, C. (2013). Exploring switching behavior of US mobile
service. Journal of Services Marketing, 27(1), 13-24.
Manev, I. M., Manolova, T. S., Harkins, J. A. & Gyoshev, B. S. (2014). Are pure or
hybrid strategies right for new ventures in transition economies?
International Small Business Journal, 33(8), 951-973.
doi:10.1177/0266242614550322
Marsh, H. W., Nagengast, B., Morin, A. J., Parada, R. H., Craven, R. G. & Hamilton,
L. R. (2011). Construct validity of the multidimensional structure of
bullying and victimization: An application of exploratory structural
equation modeling. Journal of Educational Psychology, 3(103), 701-732.
Marshall, A. (1890). Principles of Economics. London: Macmillan.
Martinez- Costa, M. & Martinez-Lorente, A. R. (2007). A triple analysis of ISO
9000 effects on Company Performance. International Journal of
Productivity and Performance Management, 56( 5/6), 484-499.
Masadeh, M. A. (2012). Linking Philosophy, Methodology and Methods: Towards
Mixed Model Design in Hospitality Industry. European Journal of Social
Sciences, 28(1450-2267).
Mbithi, B., Muturi, W. & Rambo, C. (2015). Effect of Market Development Strategy
on Performance in Sugar Industry in Kenya. International Journal of
Academic Research in Business and Social Sciences, 5(12), 311-325.
doi:10.6007/IJARBSS/v5-i12/1960
McDonald , P. R. & Ho, M.-H. R. (2002). Principles and Practice in Reporting
Structural Equation Analyses. The American Psychological Association,
7(1), 64–82. doi:10.1037//1082-989X.7.1.64

183
McKeown, M. (2015). The strategy. (2nd ed.). London: FT Publishing International.
Mehra, S. & Ranganathan, S. (2008). Implementing total quality management with a
focus on enhancing customer satisfaction. International Journal of
Quality & Reliability Management, 25(9), 913-927.
Mehralian , G., Jamal , A. N., Nooriparto, G. & Hamid, R. R. (2017). TQM and
organizational performance using the balanced scorecard approach.
International Journal of Productivity and Performance Management,
66(1), 111 - 125.
Mielgo, N. P., Poen-Monters, J. M. & Ordas-Vazquez, C. J. (2009). Are Quality and
Innovation Management conflicting activities. Technovation, 29(8), 537-
545.
Miguel, E. S., Heras-Saizarbitoria, I. & Tari, J. J. (2016). TQM and market
orientation in care home services. International Journal of Quality &
Reliability Management, 33(8), 1076 - 1098.
Miles, C. P. (2013). Competitive strategy: the link between service characteristics
and customer satisfaction. International Journal of Quality and Service
Sciences, 5 (4), 395 - 414.
Miller, W. J., Summer, A. T. & Deane, R. H. (2009). Assessment of quality
management practices within healthcare industry. American Journal of
Economics and Business Adminstration, 1(2), 105-113.
Mingers, J. & White, L. (2010). A review of the recent contribution of systems
thinking to operational research and management science q. European
Journal of Operational Research, 207 (2010), 1147–1161.
doi::10.1016/j.ejor.2009.12.019
Mosadeghrad, A. M. (2014). Essentials of total quality management: a meta-analysis.
International Journal of Heath Care Quality Assurance, 27(6), 544-558.

184
Mosadeghrad, A. M. (2015). Developing and validating a total quality management
model. The TQM Journal, 27(5), 544 - 564. Retrieved from
http://dx.doi.org/10.1108/TQM-04-2013-0051
Mugenda, A. G. (2011). Social Science Research. Nairobi: Acts Press.
Mugenda, A. & Mugenda, O. (2011). Research methods: quantitative and qualitative
approaches. Nairobi : ACTS.
Muhammad , E. & Supinit, V. (2016). Service Quality and Customer Satisfaction
Relationship: A Research in the Ambassador Bangkok. International
Journal of Social Science and Humanities Research, 4(1), 459-472.
Retrieved from www.researchpublish.com
Munisu, M. (2013). The Impact of Total Quality Management Practices towards
Competitive advantage and Organization Performance. Pakistan Journal
of Commerce and Social Sciences, 7(1), 184-197.
Mutunga, L. S. & Minja, D. (2014). Generic strategies employed by food and
beverage firms in Kenya and their effects on sustainable competitive
advantage. International Journal of Business and Management review,
2(6).
Nair, A. (2006). Meta-analysis of the relationship between quality management
practices and firms performance-implications for quality management
theory development. Journal o Operations Management, 24(6), 948-975.
Nandakumar, M. K., Ghobadian, A. & O’Regan, N. (2010). Generic Strategies and
Performance- evidence from manufacturing firms. International Journal
of Productivity and Performance Management, 60(3), 222-251.
Ndung’u, C. M., Otieno , W. & Rotich, G. (2016). Competitive business strategies on
financial performance of commercial banks in kenya: case study of
equity bank limited. International Academic Journal of Economics and
Finance,, 2(1), 41-58.
185
Newton, S. K., Gilinsky , A. J. & Douglas, J. (2015). Differentiation strategies and
winery financial performance. sciencedirect, 2015(4), 88–97. Retrieved
from www.sciencedirect.com
Ngambi, M. T. & Nkemkiafu , A. G. (2015). The Impact of Total Quality
Management on Firm’s Organizational Performance. American Journal
of Management, 15(4), 69-85. Retrieved from http://www.na-
businesspress.com/AJM/NgambiMT_Web15_4_.pdf
Ngugi, J. K. (2013). Influence of intellectual capital on the Growth of Small and
medium enterprises in Kenya. International Journal of Art and
Entrepreneurship, 2307-6305.
Niamié, O. & Germain, O. (2014). Strategies in Shipping Industry. Papers in
Academic Journals, 1-35. Retrieved from
http://dev.sefacil.com/sites/sefacil.com/files/Review%20Strategies%20S
hipping.pdf
Nouri, M. (2013). A Comprehensive Total Quality Management Strategy and
Organization. International Journal of Engineering Research and
Development, 7(2278-800), 94-99. Retrieved from www.ijerd.com
Nyauncho, M. J. & Nyagara, I. N. (2015). Assessment of the effect of Cost
Leadership Strategy on the Performance of Liquefied Petroleum Gas
Companies in Eldoret town. International Journal of Business and
management Invention, (2319-8028).
Oakland, J. S. (2014). Total Quality Management and Operational Excellence. Third
Avenue, New York: Routledge.
Onaolapo, A. A., Salami , A. O. & Oyedokun , A. J. (2011). Marketing segmentation
practices and performance of Nigerian commercial banks. European
Journal of Economics, Finance and administrative Sciences, (1450-
2275).
186
Ooi , K.-B., Cheah, W.-C., Lin, B. & Teh, P.-L. (2012). TQM practices and
knowledge sharing: An empirical study of Malaysia’s manufacturing
organizations. Asia Pacific Journal of Management, 29(1), 59-78.
Ooi, K.-B., Arumugam, V., Teh, P.-L. & Chong, A. Y.-L. (2008). TQM practices
and its association with production workers. Industrial Management &
Data Systems, 108(7), 909-927.
Ozdemir, E. D. & Mecikoglu, S. (2016). A Case Study on Performance Implications
of Hybrid Strategy in Automotive Supplier Industry. International
Business Research, 9(6), 31-43. doi::10.5539/ibr.v9n6p31
Pallant, J. (2010). SPSS survival manual: A step by step guide to data analysis using
SPSS . Maidenhead. Maidenhead: Open University Press/McGraw-Hill.
Pardo, A. & Román, M. (2013). Reflections on the Baron and Kenny model of
statistical mediation. Anales de Psicología, 614-623.
Parnell, J. A. (2011). Strategic capabilities, competitive strategy and performance
among retailers in Argentina, Peru and the United states. Management
Decision, 49(1), 139-155.
Parnell, J. A. (2013). Uncertainty, generic strategy, strategic clarity, and performance
of retail SMEs in Peru, Argentina,and the United States. Journal of Small
Business Management, 51(2), 215–234. doi:10.1111/jsbm.12010
Pearce, J. A. & Robinson, R. B. (2007). Formulation, Implementation and Control of
Competitive strategy (9TH ed.). Boston: McGraw-Hill. Irwin.
Penrose, E. T. (1959). The Theory of the Growth of the Firm. New York: John Wiley.
Pietersen, J. & Maree, K. (2007). The quantitative research process. First steps in
research. Pretoria: Van Schaik, 144-153.
Podsakoff, P. M., MacKenzie , S. B. & Podsakoff, N. P. (2012). Sources of Method
Bias in Social Science Research and Recommendations on How to
187
Control. The Annual Review of Psychology. Retrieved from
http://isites.harvard.edu/fs/docs/icb.topic1392661.files/PodsakoffARP20
12.pdf
Pongatich, P. & Johnson, R. (2008). Exploring strategy –misalignment performance
measurement. International Journal of Productivity and Performance
Management, 57(3), 207-222.
Porter, M. E. (1980). Competitive strategy. NewYork: Free Press.
Porter, M. E. (1985). Competitive advantage creating and sustaining superior
performance. New York: Free Press.
Porter, M. E. & Siggelkow, N. (2008). Contextuality within activity systems and
sustainability of competitive advantage. Academy of Management
perspective, 22, 34-56.
Powell, T. C. (1995). Total Quality Management as competitive advantage: a review
and empirical study. Strategic Management Journal, 16(1), 15-37.
Prahalad, C. K. & Bettis, R. A. (1986). The Dominant Logic: a New Linkage
Between Diversity and Performance. Strategic Management Journal,
7(6), 485-501.
Prahalad, C. K. & Gary, H. (1990). The Core Competence of the Corporation.
Harvard Business Review, 68(3), 79-91.
Prajogo, D. I. & Sohal, A. S. (2006). The relationship between organization strategy,
total quality management and organization performance. European
Journal of Operational Research, 168(2006), )35-50.
Psychogios, A. G. & Priporas, C. V. (2007). Understanding Total Quality
Management in context: Qualitative Research on Managers’ Awareness
of TQM Aspects in Greek service Industry. Retrieved from
http://nsuworks.nova.edu/tqm/vol12/
188
Raja, M. P., Deshmukh, S. G. & Wadhwa, S. (2007). Quality Award dimension: a
strategic instrument for measuring health service quality. Int. J. Health
Care Quality Assurance, 28, 35-40.
Rasula, J., Vuksic, V. B. & Stemberger, M. I. (2012). The impact of Knowledge
Management on Orgarnization Performance. Economic and Business
Review, 14, 147-168.
Republic of Kenya (ROK). (2015). The national energy and petroleum policy.
Retrieved from http://www.energy.go.ke.
Revuelto-Taboada, L., Canet-Giner, T. & Balbastre-Benavent, F. (2011). Quality
tools and techniques, EFQM experience and strategy formation. Is there
any relationship? The particular case of Spanish service firms. Revista
Innovar Journal Revista de Ciencias Administrativas y Sociales, 21(42),
25-40. Retrieved from http://www.revistas.unal.edu.co/index.php/
innovar/article/ view/35410/35785
Richard, H. Y.-Y., Lien, B. Y.-H., Fang, S.-C. & McLean, G. N. (2010). Knowledge
as a facilitator for enhancing innovation performance through total
quality management. Total Quality Management & Business Excellence,
425-438.
Richard, J. P., Devinney, M. T., Yip, G. S. & Johnson, G. (2009). Measuring
Organization Performance: Towards Mythological Best. Journal of
Management, 35(3), 718-804.
Sadikoglu, E. & Zehir, C. (2010). Investigating the Effects of Innovation and
Employee Performane on the relationship between TQM and firms
performance: An Empirical study of Turkish firms. International Journal
of Production Economics, 127, 13-26.
Salaheldin, I. & Mukhalalati, B. (2009). The Implementation of TQM in the Qatari
Health Sector. Journal of Accounting_Business and Management,, 16(2),
1-14.

189
Salavou, H. (2015). Competitive strategies and their shift to the future. European
Business Review, 27(1), 80-99.
Salavou, H. E. (2013). Hybrid strategies in Greece: A pleasant surprise. European
Business Review, 25(3), 301–314. doi:10.1108/09555341311314834
Samat, N., Ramayah, T. & Saad, N. M. (2006). TQM practices, service quality, and
market orientation: Some empirical evidence from a developing country.
Management Research News, 29(11), 713-728.
Santos-Vijande, M. L., Lez, L. I. & Ivarez, G. (2007). Innovativeness and
organizational innovation in total quality oriented firms: The moderating
role of market turbulence. ,. Technovation, 27(9), 514-532.
Saunders, M., Lewis, p. & Thornhill, A. (2009). Research Methods for Business
Students (5TH ed.). London: Prentice Hall.
Sekaran, U. & Bougie, R. (2011). Research Methods for Business: A skill building
Approach (5TH ed.). Delhi: Aggarwal printing press.
Shafiwu, A. B. & Mohammed, A. (2013). The effect of product differentiations on
profitability in the petroleum industry in Ghana. European Journal of
Business and Innovation Research, 1(4), 49-65.
Shapiro, S. S. & Wilk, M. B. (1965). An Analysis of Variance Test for Normality
(Complete Samples). Biometrika, 52(3/4), 591-611.
Shinkle , G. A., Kriauciunas, A. P. & Hundley, G. (2013). Why pure strategies may
be wrong for transition economy firms. Strategic Management Journal,
34(10), 1244-1254. Retrieved from http://dx.doi.org/10.1002/smj.2060
Shisia, A., Sang, W., Matoke, J. & Omwario, B. N. (2014). Strategic Innovation and
Performance of public universities in Kenya. European Journal of
Business and Management., 6(23).

190
Siggelkow, N. (2001). Change in the presence of fit: the rise, the fall and the
renaissance of Liz Claireborne. Academy of Management Journal, 44,
838-857.
Siggelkow, N. (2002). Evolution toward fit. Administrative science Quarterly, 47,
15-159.
Silva, G. M., Gomes, P. J., Lages, L. F. & Pereira, Z. (2014). The role of TQM in
strategic product innovation: an empirical assessment. International
Journal of Operations and Production Management, 34(10), 1307-1337.
Statistics Canada. (2010). Survey Methods and practices. Ottawa: National Library
of Canada. Retrieved from http://www.statcan.gc.ca/pub/12-587-x/12-
587-x2003001-eng.pdf
Studenmund, A. H. (2011). Using Econometrics: A Practical Guide (6TH ed.).
Boston: Addison-Wesley. Retrieved from http://works.bepress.
com/woody_studenmund/1/
Su, C., Tsai , A. & Hsu , C. (2010). The TQM extension: Total customer relationship
management. Total Quality Management and Business Excellence, 21(1),
79-92. doi:10.1080/147833609034922678
Sumer, K. & Bayraktar, C. A. (2012). Business Strategies and Gaps in Porter’S
Typology :A Literature Review. Journal of Management Research, 4(3),
100-119. doi:10.5296/jmr.v4i3.1721
Tabachnick, B. G. & Fidell, L. S. (2013). Using Multivariate Statistics (6th ed.).
Boston: Pearson.
Talib, F., Rahman, Z. & Quresh, M. N. (2013). An empirical investigation of
relationship between total quality management practices and quality
performance in Indian service companies. International Journal of
Quality and Reliability Management, 30(3), 280-318.

191
Tansey, P., Spillane, P. J. & Meng, X. (2014). Linking response strategies adopted
by construction firms during the 2007 economic recessions to Porter’s
generic strategies, 32(7-8), 705-724. doi:10.1080/01446193.
2014.933856
Tanwa, R. (2013). Porter’s Generic Competitive strategies. Journal of Business and
Management, 15(1).
Teleghani, M., Gilanina, S. & Talab, S. M. (2013). Market Orientation and Business
performance. Singaporean Journal of Business Economics and
management Studies., 1(11), 13-17.
Thompson, A. & Strickland, A. J. (2010). Strategic Management: Concepts and
Cases. New York: Irwin.
Trochim, W. M., Donnelly, P. J. & Arora, K. (2014). Research Methods, the
Essential knowledge base. Atomic Dog: .Mason.oh.
Upagade, V. & Shende, A. (2012). Research methodology. (2nd ed.). New Delhi.:
S.Chad and company ltd. Ram Nagar.
Van der Stede, W. A., Chow, C. W. & Lin, T. W. (2006). Strategy, Choice of
Performance Measurement. Behaviour Research in Accounting, 18, 185-
205.
Vanichchnchai, A. & Igel , B. (2011). The impact of total quality management on
supply chain management and firms supply performance . International
Journal of Production Research, 49(11), 3405-3424.
Wali, S. & Boujelbene, Y. (2010). The effect of TQM implementation on firm’s
performance in the Tunisian Context. International Journal of
productivity and Quality Management , 5(1), 60-74. Retrieved from
http://dx.doi.org/10.1504/IJPQM.2010.029510.

192
Walker, J. O., Larreche, J. W., Mullinsh, W. J. & Boyd, J. C. (2006). Marketing
Strategy: a decision focused approach. (5TH ed.). NewYork: McGraw-
Hill Irwin.
Wang, C. H., Chen, K. Y. & Chen, S. C. (2012). Total Quality Management, Market
Orientation and Hotel Performance: The Moderating effects of external
environmental factors. International Journal of Hospitality Management,
1(31), 119-129.
Wang, C. L. & Ahmed, P. K. (2007). Dynamic capabilities: a review and research
agenda. International Journal of Management Reviews, 9(1), 31-51.
Wang, W., Lin, C. & Chu, Y. (2011). Types of competitive advantage and analysis.
International Journal of Business and management, 6(5), 100-104.
Waweru, M. A. (2011). Comparative analysis of competitive strategy
implementation. Journal of management and strategy, 3(2), 49.
Webster, R. L. & Curry, J. A. (2016). Marketing Department Chairpersons, Market
Orientation, and Organizational Performance: A Pilot Study of AACSB
International Private Business Schools. International Journal of Business
and Social Science, 7(1), 1-9. Retrieved from
http://ijbssnet.com/journals/Vol_7_No_1_January_2016/1.pdf
Weckenmann, A., Akkasoglu, G. & Werner, T. (2015). Quality management history
and trends. Tehe TQM Journal, 27(3), 281-293.
Wernerfelt, B. (1984). A Resource-based View of the Firm. Strategic Management
Journal, 171-180 .
World Bank. (2014). Doing Business 2015: Going beyond Efficiency; Washington,
DC. doi:10.1596/978-1-4648-351-2.

193
World Bank. (2015). Kenya Economic update, Anchoring High Growth, Can
Manufacturing Contribute More? Retrieved from Retrieved from http
//www. worldbank.org/curated/en/2014/12/24193201
Worldbank. (2016). Kenya Economic Memorandum; From Economic Growth to
Jobs and Shared Prosperity. worldbank group. Retrieved from
http://documents.worldbank.org/curated/en/763771468197384854/pdf/10
3822-WP-Kenya-Country-Economic-Memorandum-PUBLIC.pdf
Young, N. (2009). Understanding the Research Process and Methods. An
Introduction to Research Methods. Las Vegas: Acts Press.
Yunis , M., Joo , J. & Chen, S. (2013). TQM, strategy, and performance:a firm-level
analysis. International Journal of Quality & Reliability Management,
30(6), 690 - 714.
Yusr, M. M., Mokhtar., S. S. & Othman, A. R. (2014). The effect of TQM practice
on Technological innovation capabilities: applying on Malaysian
Manufacturing sector. International Journal for quality Research, 8(2),
197-216.
Yusr, M. M., Othman, A. R. & Mokhtar, S. S. (2012). Assessing the moderating role
of marketing capabilities in the relationship between TQM practices and
Innovation performance capabilities approach. International Journal of
Business and Social science, 3(23), 165-176.
Zakuan, N. M., Yusof, S. M. & Laosirihongthong, T. (2010). Proposed relationship
of TQM and Organization performance using structured equation
modelling. Total Quality Management., 21(2), 185-203.
Zatzick, C., Molterno, T. P. & Fang, T. (2012). Strategic (Mis) Fit: The
implementation of TQM in Manufacturing organizations. Strategic
Management Journal, 33, 1321-1330.

194
Zehir, C., Ertosun, Ö. G., Zehir, S. & Müceldilli, B. (2012). Total quality
management practices’ effects on quality performance and innovative
performance. Procedia-Social and Behavioral Sciences, 273-280.
Zikmund, G. W., Babin, B. J., Carr, C. J. & Griffin, M. (2010). Business research
methods (8 TH ed.). South-Western: Cengage Learning.
Zwain, A. A., Lim, K. T. & Othman, S. N. (2017). TQM and academic performance
in Iraqi HEIs: associations and mediating effect of KM. TQM Journal,
29(2), 357 - 368.

195
APPENDICES
Appendix I: Questionnaire
The aim of this questionnaire is to collect data for purely academic purpose. The
study seeks to examine the Mediating effect of TQM on the relationship between
Generic strategies and organizations performance in the Kenyan manufacturing
firms. Do not put any name or identification on this questionnaire. Answer all
questions as indicated by either filling in the blanks or ticking the option that
applies
Please indicate
I DEMOGRAPHIC INFORMATION
General information
a) Gender
i) Male
ii) Female
b) How long have you worked for this organization?
i) Less than 2 yrs.
ii) 2-4 yrs.
iii) 4-6 yrs.
iv) Above 6 yrs.
c) What is your current position? _____________________________
d) Kindly indicate your highest Academic qualification
i) PhD level
ii) Master’s degree
iii) Bachelor degree
iv) Diploma holder
v) KCSE level
vi) Other please specify________________________________

196
II THE EFFECT OF GENERIC STRATEGIES ON ORGANIZATION
PERFORMANCE
a) Indicate the number of your organization major competitors
i) 0-5
ii) 5-20
iii) 20-40
iv) 40-60
v) Above 60
a) Cost leadership and organization performance
Using agree-disagree scale indicate how cost leadership strategy has impacted the
performance of your organization by answering each question. SD= Strongly
Disagree, D=Disagree, N=Neutral, A=Agree and SA= Strongly Agree.
Cost leadership strategy SD D N A SA
We charge prices lower than their
competitors
We have reduced labour input through
automation
We produced in large quantities
we emphasized on cost cutting measures
We continuously train our employees to
improve efficiency
Most of our products are standardized
We outsource functions to control costs.
Integration of supply chain with suppliers
We maintain good Supplier relationships
We buy raw materials at fairly good prices
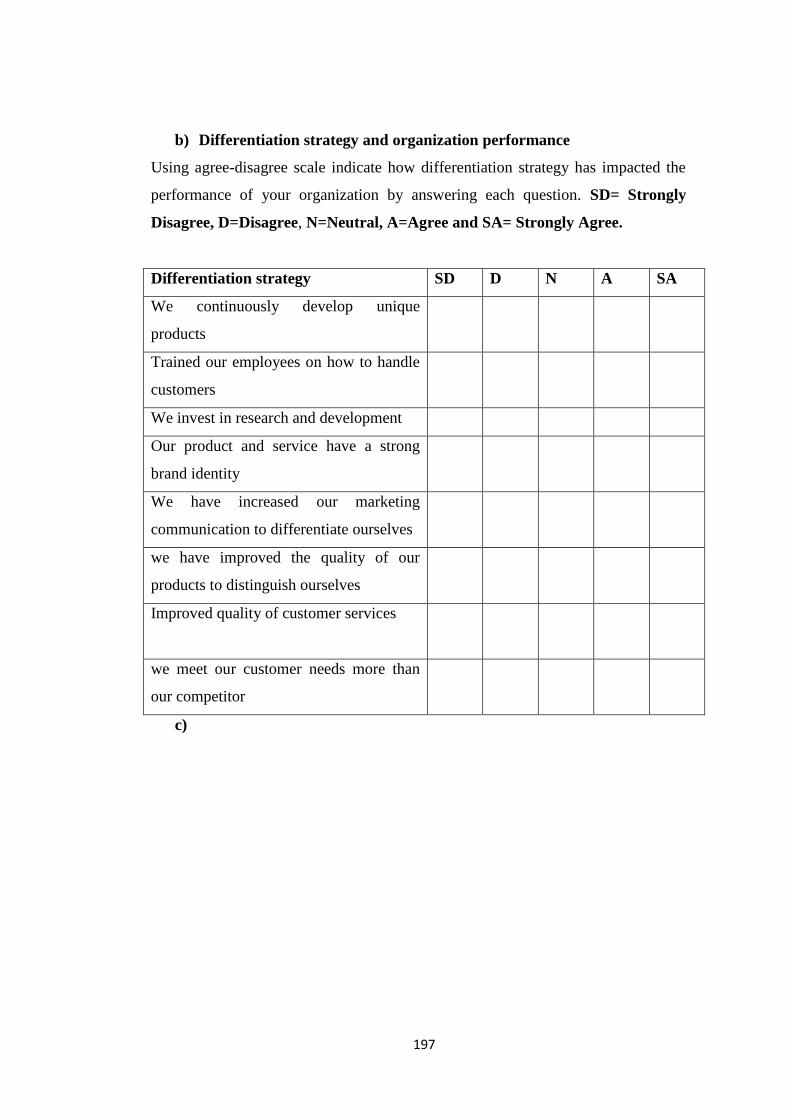
197
b) Differentiation strategy and organization performance
Using agree-disagree scale indicate how differentiation strategy has impacted the
performance of your organization by answering each question. SD= Strongly
Disagree, D=Disagree, N=Neutral, A=Agree and SA= Strongly Agree.
Differentiation strategy SD D N A SA
We continuously develop unique
products
Trained our employees on how to handle
customers
We invest in research and development
Our product and service have a strong
brand identity
We have increased our marketing
communication to differentiate ourselves
we have improved the quality of our
products to distinguish ourselves
Improved quality of customer services
we meet our customer needs more than
our competitor
c)

198
d) Focus strategy and organization performance
Using agree-disagree scale indicate how Focus strategy has impacted the
performance of your organization by answering each question. SD= Strongly
Disagree, D=Disagree, N=Neutral, A=Agree and SA= Strongly Agree.
Focus strategy SD D N A SA
We offer customized customer
services
We produce speciality products
We meet our customer needs more
than our competitors
We offer tailored market
communication messages to specific
market segments
Our customers are involved in
developing new products
We quickly respond to changes in
demand of our customers
Our prices are set based the products
quality

199
III THE EFFECT OF TQM ON ORGANIZATION PERFORMANCE
Using agree-disagree scale indicate how TQM programme has impacted
performance by answering each question. SD= Strongly Disagree, D=Disagree,
N=Neutral, A=Agree and SA= Strongly Agree.
Total quality management SD D N A SA
Our top managers are commitment to
TQM implementation
We have implemented continuous
improvement philosophy
We are committed to our Customer
We partner with our Suppliers
We all work together as a Team
We empower our Employee through
training
We have quality Leaders who are our
mentors
We have reduced wastage in our
organization
We bench mark with the best in the
industry

200
IV FIRM PERFORMANCE
Financial performance
To what extend do you agree with the following statements related to the financial
performance of your organization; using the scale SD= Strongly Disagree,
D=Disagree, N=Neutral, A=Agree and SA= Strongly Agree
SD D N A SA
Our Sales growth rate has improved
Our market share has increased
Profit growth rate has increase
Our organization has introduced new revenue
sources by entering into new markets
Our organization has introduced new revenue
sources by entering introducing new products
Our organization has improved the existing
customers profitability
We have reduced amount wastage in the
organization
We have Lowed the direct cost of products and
service
We have reduced indirect cost common resources
are shared with other business unit
We have Improved asset utilization
We have reduced the working capital needed to
support a given level of business
We have reduced the fixed capital needed to support
a given level of business
We have been more careful in asset acquisition
We have disposed parts of current and fixed asset
base not in use
Our Sales growth rate has improved
Our market share has increased

201
Customer satisfaction
To what extend do you agree with the following statements related to the customer
satisfaction index in your organization; using the scale SD= Strongly Disagree,
D=Disagree, N=Neutral, A=Agree and SA= Strongly Agree
SD D N A SA
Our customer are loyal to us
We have managed to retain our customers over the
years
Our customers have always recommend our
products to others
We have continuously acquired new customers
The number of customer complaints have reduced
over the years
Our customers have provided us with quality
knowledge which has enabled us to develop
and/improve our products and business processes.
Internal process performance
To what extend do you agree with the following statements related to internal
process performance in your organization; using the scale SD= Strongly
Disagree, D=Disagree, N=Neutral, A=Agree and SA= Strongly Agree
SD D N A SA
We have reduced our operation costs
We have improved the quality of our products
We have reduced the cycle time of operating
process
We have excellence supplier relationships
We have speed and efficiency in supply process
We have Speed and efficiency in distribution
process
We have Built a strong customer management
process
We have integrated seamlessly with our

202
customer’s value chains to deliver solutions
We have a Leading edge innovation process that
have enabled us create new products
Organization Learning and growth
To what extend do you agree with the following statements related to organization
Learning and growth performance in your organization; using the scale SD=
Strongly Disagree, D=Disagree, N=Neutral, A=Agree and SA= Strongly Agree
SD D N A SA
We capture knowledge from our customer
We understand our customer’s needs
We continuously train our employees to
improve their skills
We ensure that everyone knows the
customer
We make our company knowledge
available to our customers
We capture knowledge from our suppliers
We emphasize on team work
We ensure that ideas flow from customer
service to research and development
We reuse what other parts of the company
have already learnt
We capture knowledge from our customer
We understand our customer’s needs
We continuously train our employees to
improve their skills
Thank You

203
Appendix II: List of ISO certified manufacturing companies in Kenya
1) ASP Company Ltd
2) Bidco Oil Refineries lianto Division
3) Bidco Oil Refineries Ltd
4) Botanical Extracts (EPZ) Ltd
5) Capwell Industries Ltd
6) Changoi and Lelsa Tea Estate (Williamson Tea Kenya Ltd)
7) Central Glass Industries Ltd
8) Coca-Cola Juices Kenya Ltd
9) Continental Products Ltd
10) Del Monte Kenya Limited
11) Dalcom Kenya Limited
12) East African Breweries Ltd
13) East African Portland Cement Company Limited
14) Egerton Uni- Guildford Dairy Institute
15) Equator Bottlers Ltd
16) East African Maltings Ltd
17) Equatorial Nut Processors Ltd
18) General Motors East Africa Ltd
19) GlaxoSmithKline
20) Kaimosi Tea Estates Ltd.
21) Kapchorua Tea Company.
22) KEMRI Production Department
23) Kenya Tea Packers Ltd (KETEPA)
24) Kenya Seed Company Ltd
25) Kipkebe Tea Factory
26) Lake Basin Development Company
27) Lemoc Ltd
28) Mt. Kenya Bottlers Ltd.
29) Muhoroni Sugar Comapny
30) Nairobi Bottlers Ltd

204
31) Nairobi Java House Ltd
32) New Kenya Cooperative Creameries Ltd
33) Nzoia Sugar Co.
34) Sous chef limited
35) South Nyanza Sugar Company (SONY SUGAR)
36) Ten Senses Africa Limited
37) Tinderet Tea Estate (1989) Ltd,
38) Tropikal Brands (Africa) Ltd
39) Vermont Flowers (EPZ) Ltd

205
Appendix III: Correlations
Correlations
CL1 CL2 CL3 DS1 DS2 DS3 CF1 CF2
CL1
Pearson Correlation 1 .613** .493** .619** .487** .636** .229* .240*
Sig. (2-tailed) .000 .000 .000 .000 .000 .020 .015
N 102 102 102 102 102 102 102 102
CL2
Pearson Correlation .613** 1 .690** .633** .648** .655** .451** .374**
Sig. (2-tailed) .000 .000 .000 .000 .000 .000 .000
N 102 102 102 102 102 102 102 102
CL3
Pearson Correlation .493** .690** 1 .535** .518** .600** .335** .499**
Sig. (2-tailed) .000 .000 .000 .000 .000 .001 .000
N 102 102 102 102 102 102 102 102
DS1
Pearson Correlation .619** .633** .535** 1 .601** .643** .347** .298**
Sig. (2-tailed) .000 .000 .000 .000 .000 .000 .002
N 102 102 102 102 102 102 102 102
DS2
Pearson Correlation .487** .648** .518** .601** 1 .662** .233* .297**
Sig. (2-tailed) .000 .000 .000 .000 .000 .018 .002
N 102 102 102 102 102 102 102 102
DS3
Pearson Correlation .636** .655** .600** .643** .662** 1 .273** .312**
Sig. (2-tailed) .000 .000 .000 .000 .000 .005 .001
N 102 102 102 102 102 102 102 102
CF1
Pearson Correlation .229* .451** .335** .347** .233* .273** 1 .650**
Sig. (2-tailed) .020 .000 .001 .000 .018 .005 .000
N 102 102 102 102 102 102 102 102
CF2
Pearson Correlation .240* .374** .499** .298** .297** .312** .650** 1
Sig. (2-tailed) .015 .000 .000 .002 .002 .001 .000
N 102 102 102 102 102 102 102 102
**. Correlation is significant at the 0.01 level (2-tailed).
*. Correlation is significant at the 0.05 level (2-tailed).

206
Appendix IV: Tests of Normalitya
Kolmogorov-Smirnovb Shapiro-Wilk
Statistic df Sig. Statistic df Sig.
F2 .309 102 .052 .802 102 .063
F2 .193 102 .200* .967 102 .878
CS1 .259 102 .171 .851 102 .125
CS2 .259 102 .169 .909 102 .389
PM1 .288 102 .083 .870 102 .184
PM2 .284 102 .091 .825 102 .072
PM3 .264 102 .149 .887 102 .262
KN1 .184 102 118. .999 102 .927
KN2 .214 102 .200* .852 102 .127
T1 .211 102 .200* .896 102 .198
T2 .223 102 .171 .867 102 .091
T3 .208 102 .200* .955 102 .740
CL1 .293 102 112. .860 102 .262
CL2 .228 102 .200* .887 102 .221
CL3 .295 102 .069 .909 102 .345
DS1 .184 102 .200* .880 102 .226
DS2 .304 102 .149 .817 102 .111
DS3 .291 102 .122 .891 102 .322
CF1 .259 102 .170 .817 102 .060
CF2 .313 102 .122 .849 102 .192

207
Appendix V: Mahalanobis distance
Observations farthest from the centroid (Mahalanobis distance) (Group number 1)
Observation number Mahalanobis d-squared p1 p2
4 39.092 .006 .486
19 36.100 .015 .452
50 34.986 .020 .339
7 34.825 .021 .169
42 34.612 .022 .078
100 34.476 .023 .031
48 34.216 .025 .014
43 33.941 .027 .006
49 32.515 .038 .016
24 32.334 .040 .008
71 32.292 .040 .003
101 30.202 .067 .039
6 29.952 .071 .028
51 29.349 .081 .036
102 29.179 .084 .024
63 28.930 .089 .019
11 28.921 .089 .009
27 28.720 .093 .006
8 28.310 .102 .007
99 27.990 .110 .007
66 27.311 .127 .016
38 27.031 .134 .016
41 26.712 .144 .017
16 26.306 .156 .023
98 25.518 .182 .069
23 25.128 .197 .090

208
17 25.072 .199 .065
72 25.001 .201 .047
13 24.420 .225 .094
15 24.283 .230 .081
75 24.147 .236 .070
97 23.901 .247 .076
47 22.577 .310 .420
65 21.686 .358 .730
52 21.591 .363 .697
64 21.451 .371 .682
81 21.330 .378 .660
80 21.175 .387 .652
76 20.159 .448 .925
2 19.933 .462 .936
37 19.886 .465 .916
12 19.654 .480 .930
9 19.488 .490 .932
91 19.270 .504 .942
5 19.101 .515 .945
18 19.018 .521 .934
55 18.799 .535 .945
77 18.786 .536 .922
68 18.749 .538 .898
10 18.665 .544 .882
31 18.556 .551 .871
74 18.530 .553 .833
69 18.352 .564 .843
40 18.192 .575 .848
83 18.027 .586 .853
62 17.815 .600 .873

209
54 17.408 .626 .934
61 17.008 .652 .969
46 16.898 .660 .965
59 16.763 .668 .964
45 16.590 .679 .967
44 16.386 .692 .973
58 16.271 .700 .970
85 15.977 .718 .982
34 15.963 .719 .972
22 15.914 .722 .962
29 15.364 .755 .991
78 15.342 .757 .985
67 15.151 .768 .987
53 15.137 .768 .979
87 14.903 .782 .984
73 14.795 .788 .981
14 14.688 .794 .978
30 14.635 .797 .969
96 14.602 .799 .954
3 14.576 .800 .931
90 14.380 .811 .937
35 14.234 .818 .934
57 14.219 .819 .901
32 13.867 .837 .939
21 13.817 .840 .914
1 13.593 .851 .924
36 13.527 .854 .897
95 13.382 .860 .886
82 13.333 .863 .843
33 13.243 .867 .805

210
70 13.017 .877 .813
86 12.557 .896 .890
79 12.413 .901 .870
89 12.246 .907 .851
93 12.117 .912 .814
25 11.792 .923 .839
26 11.290 .938 .902
28 11.177 .942 .857
56 11.014 .946 .812
88 10.801 .951 .770
84 10.666 .954 .679
92 10.304 .962 .660
94 10.187 .965 .512
39 8.554 .988 .864

211
Appendix VI: Factor Analysis
GENERIC STRATEGIES
Cost leadership strategy
Total Variance Explained
Component Initial Eigenvalues Extraction Sums of Squared Loadings
Total % of Variance Cumulative % Total % of Variance Cumulative
%
1 4.308 43.079 43.079 4.308 43.079 43.079
2 1.848 18.478 61.558 1.848 18.478 61.558
3 1.318 13.176 74.734 1.318 13.176 74.734
4 .677 6.769 81.503
5 .600 6.002 87.505
6 .482 4.820 92.325
7 .311 3.114 95.440
8 .236 2.362 97.801
9 .150 1.497 99.298
10 .070 .702 100.000
Extraction Method: Principal Component Analysis.
Differentiation Strategy
Total Variance Explained
Component Initial Eigenvalues Extraction Sums of Squared Loadings
Total % of Variance Cumulative % Total % of Variance Cumulative %
1 3.979 44.210 44.210 3.979 44.210 44.210
2 1.480 16.446 60.656 1.480 16.446 60.656
3 1.317 14.633 75.290 1.317 14.633 75.290
4 .672 7.463 82.752
5 .600 6.669 89.421
6 .409 4.547 93.968
7 .285 3.172 97.140
8 .181 2.015 99.156
9 .076 .844 100.000
Extraction Method: Principal Component Analysis.

212
Focus Strategy
Total Variance Explained
Component Initial Eigenvalues Extraction Sums of Squared Loadings
Total % of Variance Cumulative % Total % of Variance Cumulative %
1 3.458 49.405 49.405 3.458 49.405 49.405
2 1.670 23.860 73.265 1.670 23.860 73.265
3 .768 10.971 84.236
4 .462 6.599 90.835
5 .320 4.572 95.407
6 .209 2.990 98.397
7 .112 1.603 100.000
Extraction Method: Principal Component Analysis.
Total Quality Management
Total Variance Explained
Component Initial Eigenvalues Extraction Sums of Squared Loadings
Total % of Variance Cumulative % Total % of Variance Cumulative %
1 4.006 44.511 44.511 4.006 44.511 44.511
2 1.538 17.084 61.595 1.538 17.084 61.595
3 1.215 13.499 75.094 1.215 13.499 75.094
4 .777 8.630 83.724
5 .551 6.118 89.842
6 .346 3.847 93.689
7 .230 2.560 96.249
8 .197 2.193 98.441
9 .140 1.559 100.000
Extraction Method: Principal Component Analysis.

213
ORGANIZATION PERFORMANCE
Financial Performance
Total Variance Explained
Component Initial Eigenvalues Extraction Sums of Squared Loadings
Total % of Variance Cumulative % Total % of Variance Cumulative %
1 8.321 59.433 59.433 8.321 59.433 59.433
2 1.804 12.889 72.322 1.804 12.889 72.322
3 .783 5.593 77.915
4 .737 5.262 83.177
5 .658 4.699 87.876
6 .452 3.227 91.103
7 .342 2.443 93.546
8 .244 1.740 95.286
9 .216 1.539 96.826
10 .156 1.115 97.940
11 .134 .956 98.896
12 .067 .482 99.378
13 .051 .362 99.740
14 .036 .260 100.000
Extraction Method: Principal Component Analysis.
Learning and Growth
Total Variance Explained
Component Initial Eigenvalues Extraction Sums of Squared Loadings
Total % of
Variance
Cumulative
%
Total % of
Variance
Cumulative
%
1 5.870 65.218 65.218 5.870 65.218 65.218
2 1.129 12.540 77.758 1.129 12.540 77.758
3 .664 7.374 85.132
4 .450 5.001 90.133
5 .238 2.639 92.772
6 .226 2.516 95.288
7 .171 1.895 97.183
8 .165 1.833 99.016
9 .089 .984 100.000
Extraction Method: Principal Component Analysis.
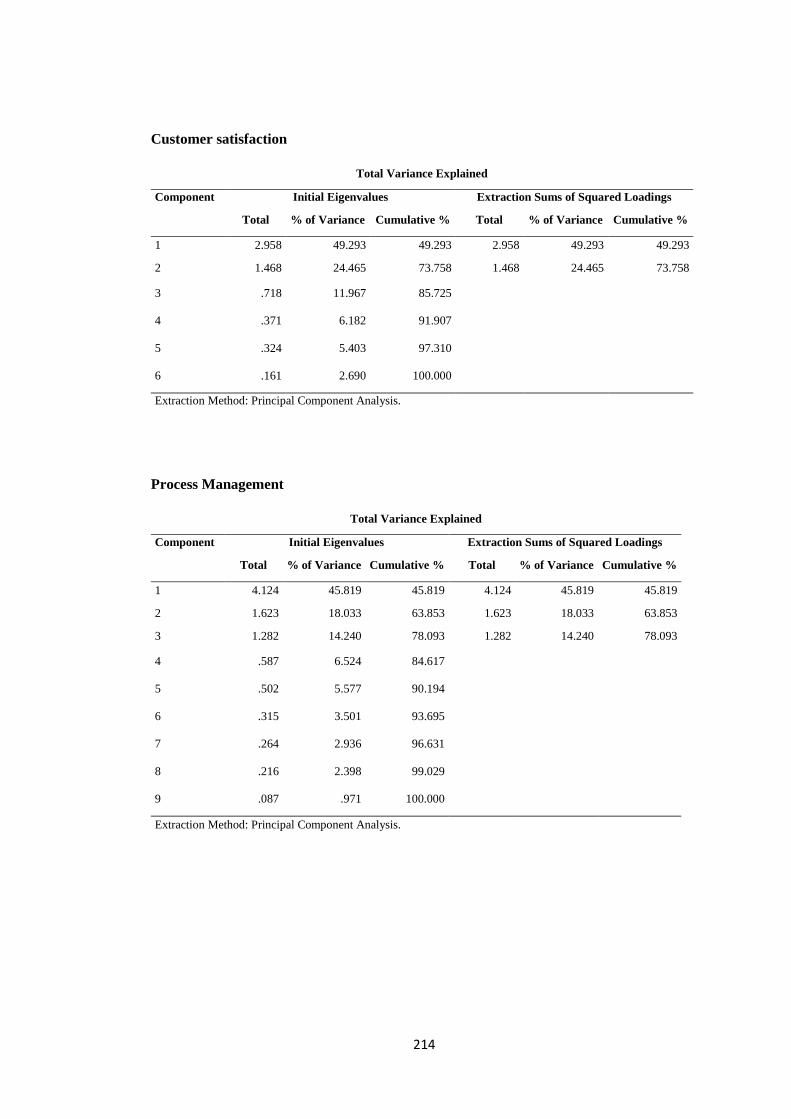
214
Customer satisfaction
Total Variance Explained
Component Initial Eigenvalues Extraction Sums of Squared Loadings
Total % of Variance Cumulative % Total % of Variance Cumulative %
1 2.958 49.293 49.293 2.958 49.293 49.293
2 1.468 24.465 73.758 1.468 24.465 73.758
3 .718 11.967 85.725
4 .371 6.182 91.907
5 .324 5.403 97.310
6 .161 2.690 100.000
Extraction Method: Principal Component Analysis.
Process Management
Total Variance Explained
Component Initial Eigenvalues Extraction Sums of Squared Loadings
Total % of Variance Cumulative % Total % of Variance Cumulative %
1 4.124 45.819 45.819 4.124 45.819 45.819
2 1.623 18.033 63.853 1.623 18.033 63.853
3 1.282 14.240 78.093 1.282 14.240 78.093
4 .587 6.524 84.617
5 .502 5.577 90.194
6 .315 3.501 93.695
7 .264 2.936 96.631
8 .216 2.398 99.029
9 .087 .971 100.000
Extraction Method: Principal Component Analysis.

215
Appendix VII: Communalities of factors
Communalities of factors
Indicator Initial Extraction
CL1 1.000 .631
CL2 1.000 .765
CL3 1.000 .742
DS1 1.000 .711
DS2 1.000 .675
DS3 1.000 .756
CF1 1.000 .749
CF2 1.000 .767
T1 1.000 .596
T2 1.000 .812
T3 1.000 .691
F1 1.000 .717
F2 1.000 .700
CS1 1.000 .704
CS2 1.000 .711
PM1 1.000 .684
PM2 1.000 .689
PM3 1.000 .615
KN1 1.000 .777
KN2 1.000 .827
Extraction Method: Principal Component Analysis.