Embed Size (px)
Citation preview
Percentage Share of IPC and SLL Crimes
during 2006
IPC
36.8%SLL
63.2%
FIGURE 1.1

19961997
19981999
20002001
20022003
20042005
2006
-1.9-0.1
-2.5
-3.7
-6.1
-7.6
-12.4
-8.0
-9.9-8.5
0.6
4.1 3.2
3.63.5 4.1
0.4
7.2
6.6
9.9
-15.0
-10.0
-5.0
0.0
5.0
10.0
Pe
rce
nta
ge
Year
Incidence & Rate of IPC Crime
Percentage Change from 1996
Incidence Rate
FIGURE 1.2


Percentage Distribution of IPC Crimes
during 2006
Other IPC Crimes
49.1%
Hurt
14.1%
Theft
14.6%
Burglary
4.9%
Causing Death By
Negligence
4.2%Riots
3.0%
Cheating
3.1%Molestation
1.9%
Murder
1.7%
Cruelty By Husband And
Relatives
3.4%
FIGURE 1.4

Percentage Distribution of SLL Crimes
during 2006
Other SLL Crimes
76.2%
SC/ST(Prevention Of
Atrocities) Act
0.3%
Copyrights Act
0.2%
Arms Act
2.4%
Gambling Act
5.4%
Prohibition Act
9.8%
N.D.P.S.Act
1.0%
Excise Act
4.6%
Immoral Traffic (P) Act
0.1%
FIGURE 1.5

Incidence & Rate of IPC Crimes (mega cities)
Percentage Change From 2001
2.7
-0.4
7.0
0.5
8.6
12.6
9.2
5.3
3.7
-2.5-4.0
-2.0
0.0
2.0
4.0
6.0
8.0
10.0
12.0
14.0
2001 2002 2003 2004 2005 2006
Year
Per
cen
t
% Variation (Incidence) % Variation (Rate)
FIGURE 2.1

IPC Crime (mega cities)
Percentage distribution during 2006
9.0
10.5
10.1
8.8
16.3
15.8
17.8
7.6
22.2
21.0
21.2
31.1
43.4
25.0
8.5
23.6
26.8
27.4
3.4
11.5
8.4
8.6
17.8
15.2
11.2
16.2
17.4
91.0
89.5
89.9
91.2
83.7
84.2
82.2
92.4
77.8
79.0
78.8
68.9
56.6
75.0
91.5
76.4
73.2
72.6
96.6
88.5
91.6
91.4
82.2
84.8
97.0
88.8
83.8
82.6
3.0
0.0 10.0 20.0 30.0 40.0 50.0 60.0 70.0 80.0 90.0 100.0
MurderAttempt To Commit MurderC.H. Not Amounting Murder
RapeKidnapping & Abduction
Kidnapping & Abduction OfKidnapping & Abduction Of Others
DacoityPreparation & Assembly For
RobberyBurglary
TheftAuto Theft
Other TheftRiots
Criminal Breach Of TrustCheating
CounterfeitingArson
HurtDowry Death
MolestationSexual Harassment
Cruelty By Husband And RelativesImportation Of Girls
Causing Death By NegligenceOther IPC Crimes
Total Cogni. Crimes Under IPC
Cri
me
Hea
d
Percentage
Mega Cities Rest of Country
All India Cities
Population (in lakhs) 11197.75 1078.8
Incidence 1878293 326363
Rate 167.7 302.5
FIGURE 2.2

Ag
raA
hm
ed
ab
ad
Alla
ha
ba
dA
mrits
ar
Asa
nso
lB
an
ga
lore
Bh
op
al
Ch
en
na
iC
oim
ba
tore
De
lhi
Dh
an
ba
dF
ari
da
ba
d
Hyd
era
ba
d
Ind
ore
Ja
ba
lpu
r
Ja
ipu
r
Ja
msh
ed
pu
r
Ka
np
ur
Koch
i
Kolk
ata
Lu
ckn
ow
Lu
dh
ian
a
Ma
du
rai
Me
eru
t
Mu
mb
ai
Na
gp
ur
Na
sik
Patn
a
Pu
ne
Ra
jko
t
Su
rat
Va
do
da
ra
Va
ran
asi
Vija
ya
wa
da
Vis
ha
kh
ap
atn
am
0
100
200
300
400
500
600
700
800C
rim
eR
ate
Cities/Domain States
IPC Crime Rate During 2006
(Mega Cities Vs Domain States) Figure 2.3

State-wise IPC Crime Rate
during 200651
.5 68.6 77
.9
79
90.8 11
0.2
112.
1
114.
7
119.
4
121
123
124 13
4.7
142.
1
149.
8
160 17
0.7
174
177.
3
183.
4
195.
4
196.
5
203.
1
208.
9
215.
4
216.
2
218.
1
219.
6
226.
1
227.
6
289.
7
306.
2
312.
5
357.
2
447.
7
0
50
100
150
200
250
300
350
400
450
500
NA
GA
LAN
D
UT
TA
RP
RA
DE
SH
ME
GH
ALA
YA
WE
ST
BE
NG
AL
UT
TA
RA
NC
HA
L
BIH
AR
MA
NIP
UR
TR
IPU
RA
LAK
SH
AD
WE
EP
SIK
KIM
PU
NJA
B
JHA
RK
HA
ND
OR
ISS
A
GO
A
AS
SA
M
DA
MA
N&
DIU
A&
NIS
LAN
DS
D&
NH
AV
ELI
JAM
MU
&K
AS
HM
IR
MA
HA
RA
SH
TR
A
AR
UN
AC
HA
LP
RA
DE
SH
CH
HA
TT
ISG
AR
H
HIM
AC
HA
LP
RA
DE
SH
KA
RN
AT
AK
A
AN
DH
RA
PR
AD
ES
H
MIZ
OR
AM
HA
RY
AN
A
GU
JAR
AT
RA
JAS
TH
AN
TA
MIL
NA
DU
MA
DH
YA
PR
AD
ES
H
CH
AN
DIG
AR
H
KE
RA
LA
DE
LHI
PO
ND
ICH
ER
RY
States & UTs
Cri
me
Rat
eA
ll-In
dia
Ave
rage
(167
.7)
FIGURE 3.1

State-wise Violent Crime Rate
during 200611.1
11.3
11.5
12.1 13 13.4
14.1 15.1
15.3 16.3
16.5 17.8
18.2
18.2
18.9
19.1 20.3 21.5
21.7
21.8
22 22.4
23.2
23.7 2
5.5 26.6
26.9 28.2
28.7
29.2
29.4
29.4 30.4
33 33.7
0
5
10
15
20
25
30
35
40
A&
NIS
LAN
DS
TA
MIL
NA
DU
GU
JAR
AT
WE
ST
BE
NG
AL
PU
NJA
B
UT
TA
RP
RA
DE
SH
GO
A
RA
JAS
TH
AN
SIK
KIM
AN
DH
RA
PR
AD
ES
H
NA
GA
LAN
D
MIZ
OR
AM
HIM
AC
HA
LP
RA
DE
SH
UT
TA
RA
NC
HA
L
MA
HA
RA
SH
TR
A
OR
ISS
A
ME
GH
ALA
YA
MA
DH
YA
PR
AD
ES
H
CH
AN
DIG
AR
H
HA
RY
AN
A
CH
HA
TT
ISG
AR
H
KA
RN
AT
AK
A
D&
NH
AV
ELI
TR
IPU
RA
DE
LHI
BIH
AR
LAK
SH
AD
WE
EP
KE
RA
LA
AR
UN
AC
HA
LP
RA
DE
SH
JHA
RK
HA
ND
DA
MA
N&
DIU
PO
ND
ICH
ER
RY
AS
SA
M
MA
NIP
UR
JAM
MU
&K
AS
HM
IR
States & UTs
Cri
me
Rat
eA
ll-In
dia
Ave
rage
(18.
4)
FIGURE 3.2

IPC Cases For Investigation
Disposal by Police
2075718
2237379 2246845
894354
1649487
1770511 1792730
2447063
2365658
2303354
1138588
1692060
2169268
696155
1809632179654717600221697664
586279
1335994
0
500000
1000000
1500000
2000000
2500000
3000000
1961 1971 1981 1991 2001 2002 2003 2004 2005 2006
Year
Cas
es
For Investigation Investigation Completed
FIGURE 4.1

IPC Cases For Trial
Disposal By Courts
943394
667340931892 981393
71924516991508
676871365777786464748
2111791
3964610
6221034
800784505412
10441201013240957311301869 959567242592
0
1000000
2000000
3000000
4000000
5000000
6000000
7000000
8000000
1961 1971 1981 1991 2001 2002 2003 2004 2005 2006
Year
Cas
es
For Trial Trial Completed
FIGURE 4.2

Percentage Disposal of IPC Cases by Police
Crime-wise 2006
Disposal
74.0%
Pendency
26.0%
FIGURE 4.3
Crime Head disposal pendency
MURDER 57.5 42.5
ATTEMPT TO COMMIT MURDER 65.4 34.6
C.H. NOT AMOUNTING MURDER 66.6 33.4
RAPE 67.3 32.7
KIDNAPPING & ABDUCTION 57.1 42.9
DACOITY 41.2 58.8
PREPARATION & ASSEMBLY FOR DACOITY 58.8 41.2
ROBBERY 59.3 40.7
BURGLARY 70.0 30.0
THEFT 68.2 31.8
RIOTS 66.3 33.7
CRIMINAL BREACH OF TRUST 51.3 48.7
CHEATING 54.8 45.2
COUNTERFEITING 50.4 49.6
ARSON 68.0 32.0
HURT 81.7 18.3
DOWRY DEATHS 62.8 37.2
MOLESTATION 83.2 16.8
SEXUAL HARASSMENT 87.1 12.9
CRUELTY BY HUSBAND AND RELATIVES 73.0 27.0
IMPORTATION OF GIRLS 33.8 66.2
DEATH DUE TO NEGLIGENCE 77.8 22.2
OTHER IPC CRIMES 80.1 19.9
TOTAL COGNIZABLE CRIMES UNDER IPC 74.0 26.0

Percentage Disposal of SLL Cases by Police
Crime-wise 2006
Pending
6.2%
Disposal
93.8%
FIGURE 4.4
Crime Head disposal pendency
ARMS ACT 85.3 14.7
NARCOTIC DRUGS & PSYCHOTROPIC SUBSTANCES ACT 72.1 27.9
GAMBLING ACT 94.6 5.4
EXCISE ACT 88.7 11.3
PROHIBITION ACT 76.5 23.5
EXPLOSIVE & EXPLOSIVE SUBSTANCES ACT 57.8 42.2
IMMORAL TRAFFIC (P) ACT 76.2 23.8
INDIAN RAILWAYS ACT 58.9 41.1
REGISTRATION OF FOREIGNERS ACT 85.7 14.3
PROTECTION OF CIVIL RIGHTS ACT 78.7 21.3
INDIAN PASSPORT ACT 43.7 56.3
ESSENTIAL COMMODITIES ACT 70.8 29.2
TERRORIST & DISRUPTIVE ACTIVITIES ACT 56.8 43.2
ANTIQUITY & ART TREASURE ACT 42.4 57.6
DOWRY PROHIBITION ACT 56.4 43.6
CHILD MARRIAGE RESTRAINT ACT 72.2 27.8
INDECENT REPRESENTATION OF WOMEN (P) ACT 94.3 5.7
COPYRIGHTS ACT 75.4 24.6
SATI PREVENTION ACT 100.0 0.0
SC/ST (PREVENTION OF ATROCITIES) ACT 65.8 34.2
FOREST ACT 90.9 9.1
OTHER SLL CRIMES 98.3 1.7
TOTAL COGNIZABLE CRIMES UNDER SLL 93.8 6.2

Percentage Disposal of IPC Cases by Courts
Crime-wise 2006
Disposal
16.6%Pendency
83.4%
FIGURE 4.5
Crime Head disposal pendency
MURDER 15.9 84.1
ATTEMPT TO COMMIT MURDER 17.5 82.5
C.H. NOT AMOUNTING MURDER 18.2 81.8
RAPE 19.0 81.0
KIDNAPPING & ABDUCTION 15.2 84.8
DACOITY 13.2 86.8
PREPARATION & ASSEMBLY FOR DACOITY 17.2 82.8
ROBBERY 11.2 88.8
BURGLARY 12.2 87.8
THEFT 12.3 87.7
RIOTS 12.1 87.9
CRIMINAL BREACH OF TRUST 9.0 91.0
CHEATING 10.4 89.6
COUNTERFEITING 15.0 85.0
ARSON 16.0 84.0
HURT 18.3 81.7
DOWRY DEATHS 18.6 81.4
MOLESTATION 16.8 83.2
SEXUAL HARASSMENT 25.0 75.0
CRUELTY BY HUSBAND AND RELATIVES 15.2 84.8
IMPORTATION OF GIRLS 12.3 87.7
DEATH DUE TO NEGLIGENCE 16.0 84.0
OTHER IPC CRIMES 18.7 81.3
TOTAL COGNIZABLE CRIMES UNDER IPC 16.6 83.4

Percentage Disposal of SLL Cases by Courts
Crime-wise 2006
Disposal
36.8%Pendency
63.2%
FIGURE 4.6
Crime Head disposal pendency
ARMS ACT 15.8 84.2
NARCOTIC DRUGS & PSYCHOTROPIC SUBSTANCES ACT 18.8 81.2
GAMBLING ACT 34.5 65.5
EXCISE ACT 23.1 76.9
PROHIBITION ACT 16.3 83.7
EXPLOSIVE & EXPLOSIVE SUBSTANCES ACT 13.8 86.2
IMMORAL TRAFFIC (P) ACT 29.3 70.7
INDIAN RAILWAYS ACT 12.8 87.2
REGISTRATION OF FOREIGNERS ACT 33.5 66.5
PROTECTION OF CIVIL RIGHTS ACT 19.8 80.2
INDIAN PASSPORT ACT 17.8 82.2
ESSENTIAL COMMODITIES ACT 8.9 91.1
TERRORIST & DISRUPTIVE ACTIVITIES ACT 3.9 96.1
ANTIQUITY & ART TREASURE ACT 29.1 70.9
DOWRY PROHIBITION ACT 18.8 81.2
CHILD MARRIAGE RESTRAINT ACT 9.6 90.4
INDECENT REPRESENTATION OF WOMEN (P) ACT 63.4 36.6
COPYRIGHTS ACT 14.4 85.6
SATI PREVENTION ACT 0 100
SC/ST (PREVENTION OF ATROCITIES) ACT 16.9 83.1
FOREST ACT 22.8 77.2
OTHER SLL CRIMES 55.3 44.7
TOTAL COGNIZABLE CRIMES UNDER SLL 36.8 63.2

Crime Against Women -
- Percent Distribution during 2006
Cruelty by Husband and
Relatives
38.3%Others
1.0%
Dowry Death
4.6%
Immoral Traffic (P) Act
2.8%
Dowry Prohibition Act
2.7%
Rape
11.7%Sexual Harassment
6.0%
Kidnapping & Abduction
10.6%
Molestation
22.2%
FIGURE 5.1

Incidence & Rate of Crime Against Women
- Percentage Change from 1996
4.8
33.4
2.2
9.010.8
13.6 12.8
9.6
14.5
42.4
21.523.624.3
22.2
17.3
13.6
34.4
18.5
6.0
13.6
0.0
5.0
10.0
15.0
20.0
25.0
30.0
35.0
40.0
45.0
1996 1997 1998 1999 2000 2001 2002 2003 2004 2005 2006
Year
Per
cen
tag
e
Incidence Rate
FIGURE 5.2

Maharashtra
15.0%/15.4%
[9.3%]
Madhya Pradesh
20.8%/24.8%
[6.0%]
Chhattisgarh
6.5%/6.7%
[2.1%]
Gujarat
5.2%/5.6%
[4.9%]
Kerala
2.9%/2.6%
[3.0%]
Rajasthan
5.0%/3.9%
[5.6%]
Delhi
11.4%/6.9%
[1.5%]
Uttar Pradesh
9.3%/12.0%
[16.5%]
Andhra Pradesh
7.3%/6.3%
[7.2%]
Other States/UTs
11.9%/11.7%
[34.1%]
Haryana
2.4%/2.5%
[2.1%]
West Bengal
2.3%/1.6%
[7.7%]
Crime Against Children – State-wise
distribution during 2006 / 2005
Percentage of Crime w.r.t. to All India for 2005
Percntage of Crime w.r.t to All India for 2006
Percentage of Population w.r.t. to All India for2006
FIGURE 6.1

Crime Against Children -
Crime head-wise Percentage Distribution during 2006
Other Crimes
36.4%
Exposure And
Abandonment
4.8%Murder (Other then
Infanticide)
7.0%
Kidnapping &
Abduction
26.9%
Rape
24.9%
FIGURE 6.2

Crime Head Wise Incidence of Crime against Children During 2002-2006
0
2000
4000
6000
8000
10000
12000
14000
16000
18000
20000
2002 2003 2004 2005 2006
Years
Incid
en
ce
Murder Infanticide Rape Kidnapping & Abduction
Foeticide Abetment of Suicide Exposure & Abandonment Procuration of Minor Girls
Buying of Girls for Prostitution Selling of Girls for Prostitution Child Marriage Restraint Act Other Crimes
Figure 6.3

Human Trafficking Incidence of various crime
during 2002 - 2006
9 24 21 28 35124 171 205 145 23176 46 89 149 675 36 19 50 123
6598
55105748
5908
4541
0
1000
2000
3000
4000
5000
6000
7000
2002 2003 2004 2005 2006
Buying of Girls for Prostitution (Sec 373 IPC) Procuration of Minor girls(Sec. 366-A) Importation of Girls (Sec. 366-B IPC)
Selling of Girls for Prostitution (Sec 372 IPC) Immoral Trafficking (Prevention) Act 1956
FIGURE 6.1*

Human Trafficking
Percent distribution during 2006
Importation of Girls
1.34% Selling of Girls for Prostitution
2.46%
Procuration of Minor girls
4.62%
Buying of Girls for Prostitution
0.70%
Immoral Trafficking(Prevention
Act 1956
90.87%
Buying of Girls for Prostitution (Sec 373 IPC) Procuration of Minor girls(Sec. 366-A) Importation of Girls (Sec. 366-B IPC)
Selling of Girls for Prostitution (Sec 372 IPC) Immoral Trafficking (Prevention) Act 1956
FIGURE 6.2*

FIGURE 7.1Crime Against Scheduled Castes & Scheduled Traibes
- State-wise during 2006/2005
Orissa
4.3%/5.5%
[3.5%]
Maharashtra
3.9%/3.3%
[9.3%]
Gujarat
3.7%/5.0%
[4.9%]
Tamil Nadu
3.7%/4.6%
[5.8%]
Chhattisgarh
1.6%/1.7%
[2.1%]
Karnataka
6.4%/6.8%
[5.0%]
Others
6.2%/6.2%
[25.8%] Uttar Pradesh
18.3%/16.8%
[16.5%]
Madhya Pradesh
15.6%/16.7%
[6.0%]
Andhra Pradesh
14.4%/11.9%
[7.2%]
Rajasthan
14.4%/14.5%
[5.6%]
Bihar
7.5%/7.0%
[8.2%]
Rajasthan
16.7%/15.1%
[5.6%]
Andhra Pradesh
13.7%/9.0%
[7.2%]
Chhattisgarh
10.1%/8.7%
[2.1%]Kerala
1.3%/1.4%
[3.0%]
Other States
3.4%/3.9%
[47.9%]
Madhya Pradesh
25.9%/28.3%
[6.0%]
Orissa
6.0%/10.5%
[3.5%]Jharkhand
5.7%/8.5%
[2.6%]
Maharashtra
4.6%/3.9%
[9.3%]
Assam
4.2%/3.8%
[2.6%]
Karnataka
3.7%/2.8%
[5.0%]
Nagaland
1.9%/0.0%
[0.2%]
Gujarat
2.8%/4.1%
[4.9%]
Percentage of Crime w.r.t. to All India for 2005
Percntage of Crime w.r.t to All India for 2006
Percentage of Population w.r.t. to All India for 2006

State wise Value of Property Stolen
during 20063.8
70.8
93.1
193
278.7
285
463.5
469.9
511.1
554.6
612.7
699.6
704.9
1289.6
1327.5
1410.7
1700.9
1787.7
2831.5
3499.1
4102.6
4885.9
5173.8
5602.2
5867.5
7939.4
8051.1
9760.6
9960.2
10873.3
11125.5
14415.1
25486.2
25888.2
72474.9
0
10000
20000
30000
40000
50000
60000
70000
80000
LAK
SH
AD
WE
EP
A&
NIS
LAN
DS
SIK
KIM
DA
MA
N&
DIU
TR
IPU
RA
PO
ND
ICH
ER
RY
ME
GH
ALA
YA
AR
UN
AC
HA
LP
RA
DE
SH
MIZ
OR
AM
MA
NIP
UR
CH
AN
DIG
AR
H
UT
TA
RA
NC
HA
L
D&
NH
AV
ELI
GO
A
JAM
MU
&K
AS
HM
IR
HIM
AC
HA
LP
RA
DE
SH
JHA
RK
HA
ND
NA
GA
LAN
D
BIH
AR
CH
HA
TT
ISG
AR
H
OR
ISS
A
TA
MIL
NA
DU
AS
SA
M
PU
NJA
B
WE
ST
BE
NG
AL
HA
RY
AN
A
RA
JAS
TH
AN
KA
RN
AT
AK
A
AN
DH
RA
PR
AD
ES
H
UT
TA
RP
RA
DE
SH
MA
DH
YA
PR
AD
ES
H
KE
RA
LA
DE
LHI
GU
JAR
AT
MA
HA
RA
SH
TR
A
States/UTs
(Val
ue
(Rs.
inL
akh
s)
FIGURE 8.1
2403
94.6

State-wise Percentage Recovery in Property Offences
during 20062.5 5
.3 5.9 8
.5 12.1
14.0
14.0
14.1
14.3
15.7
16.0
16.3 2
0.7
21.2
22.8
22.9
23.7 2
8.4
29.1
29.4
29.6
30.1
31.3
33.4
33.6
35.2
43.8
44.0 47.6
49.4 5
5.5
56.5
73.2 7
8.1
92.0
0
10
20
30
40
50
60
70
80
90
100
MA
NIP
UR
DE
LHI
NA
GA
LAN
D
KE
RA
LA
GU
JAR
AT
GO
A
ME
GH
ALA
YA
D&
NH
AV
ELI
MA
HA
RA
SH
TR
A
DA
MA
N&
DIU
BIH
AR
JHA
RK
HA
ND
WE
ST
BE
NG
AL
MIZ
OR
AM
CH
HA
TT
ISG
AR
H
TR
IPU
RA
AR
UN
AC
HA
LP
RA
DE
SH
HIM
AC
HA
LP
RA
DE
SH
MA
DH
YA
PR
AD
ES
H
UT
TA
RA
KH
AN
D
LAK
SH
AD
WE
EP
SIK
KIM
A&
NIS
LAN
DS
OR
ISS
A
KA
RN
AT
AK
A
AS
SA
M
AN
DH
RA
PR
AD
ES
H
JAM
MU
&K
AS
HM
IR
CH
AN
DIG
AR
H
PU
NJA
B
HA
RY
AN
A
RA
JAS
TH
AN
TA
MIL
NA
DU
PO
ND
ICH
ER
RY
UT
TA
RP
RA
DE
SH
States/UTs
%R
eco
very
(All
Indi
aA
vera
ge25
.3)
FIGURE 8.2
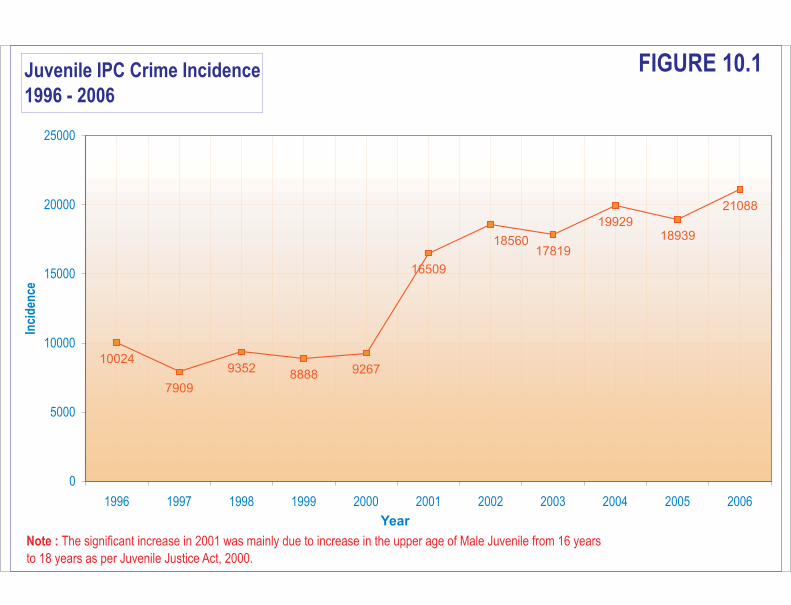
Juvenile IPC Crime Incidence
1996 - 2006
10024
7909
93528888 9267
16509
17819
1992918939
21088
18560
0
5000
10000
15000
20000
25000
1996 1997 1998 1999 2000 2001 2002 2003 2004 2005 2006
Year
Inci
den
ce
Note : The significant increase in 2001 was mainly due to increase in the upper age of Male Juvenile from 16 years
to 18 years as per Juvenile Justice Act, 2000.
FIGURE 10.1

Juveniles Apprehended Under IPC & SLL Crimes
1996 - 200614068
14282
13974
13088
13854
31295
33551
30985
28878
30606
30375
5030
3514
4949
5372
4128
2333
2228
2335
2065
2075
1770
0
5000
10000
15000
20000
25000
30000
35000
40000
1996 1997 1998 1999 2000 2001 2002 2003 2004 2005 2006
Year
Inci
den
ce
Boys Girls
Boys & Girls upto the age of 18 years have been taken as Juvenils as per new definition of Juvenile Justice Act w.e.f. year 2001.
FIGURE 10.2

Disposal of Juveniles Arrested During 2006
Pending Disposal
42%
Sent to Home after
Advice/Admonition
13%
Released on Probation
under the care of
Parents/Guardians
18%
Released on Probation
under the care of Fit
Institutions
5%Sent to Special Home
14%Dealt with Fine
3%
Acquitted or otherwise
disposed of
5%
Figure 10.3

Persons Arrested Under IPC Crimes
State-wise Percentage Distribution during 2006
Rajasthan
7.0%
Uttar Pradesh
8.2%
Gujarat
6.0%
Other States and Uts
19.2%
Andhra Pradesh
8.6%
Bihar
6.8%Tamil Nadu
6.7%
West Bengal
4.2%
Maharashtra
10.9%
Karnataka
5.4%
Madhya Pradesh
11.7%
Kerala
5.4%
FIGURE 12.1

Persons Arrested Under SLL Crimes
State-wise Percentage Distribution during 2006
Tamil Nadu
14.7%Rajasthan
1.3%Other States & UTs
5.8%
Maharashtra
4.9%
Andhra Pradesh
17.0%
Kerala
1.9%
Madhya Pradesh
6.5%
Uttar Pradesh
34.9%
Gujarat
5.8%
Uttarakhand
3.4%
Chhattisgarh
3.7%
FIGURE 12.2

0
20
40
60
80
100
120
140
No
.o
fD
eath
s
2002 2003 2004 2005 2006
Years
Number of Deaths in Police Custody/Lockup During 2002-2006
Death of Person Remanded to Police Custody by Court Death of Person Not Remanded to Police Custody by Court
Figure 13.1

No. of Complaints Received against Police Personnel & No. of Complaints per 100 Police
Personnel During 2006
0
5000
10000
15000
20000
25000
And
hra
Pra
desh
Aru
nach
alPra
desh
Ass
amBihar
Chh
attis
garh
Goa
Gujar
at
Har
yana
Him
acha
l Pra
desh
Jam
mu
&Kas
hmir
Jhar
khan
d
Kar
nata
ka
Ker
ala
Mad
hya
Pra
desh
Mah
aras
htra
Man
ipur
Meg
halaya
Mizor
am
Nag
alan
d
Oris
sa
Pun
jab
Rajas
than
Sikkim
TamilNad
u
Tripur
a
Utta
r Pra
desh
Utta
ranc
hal
Wes
t Ben
gal
A&
NIsland
s
Cha
ndigar
h
D&
NHav
eli
Dam
an&
Diu
Delhi
Laks
hadw
eep
Pon
dich
erry
State/UT
Nu
mb
er
of
co
mp
lain
ts
0
5
10
15
20
25
30
35
Nu
mb
er
of
co
mp
lain
ts(p
er
10
0p
oli
ce
pe
rso
nn
el)
No. of Complaints Received against police personnel No. of Complaints Against Per 100 Police personnel
Note : Negligible Values of Complaints per 100 personnel have been shown as zero
Figure 16.2

93.2
134
95.5
134
97.1
135
98.7
134
100.2
129
102.7
127
105.1
125
106.8
123
108.6
123
110.3
122
111.9
126
0.0
20.0
40.0
60.0
80.0
100.0
120.0
140.0
1996 1997 1998 1999 2000 2001 2002 2003 2004 2005 2006
Year
Population and Police Population Ratio
During 1996 to 2006
Population (in 10 million) Ratio Ratio : No. of Policemen per lakh of population
FIGURE 17.1
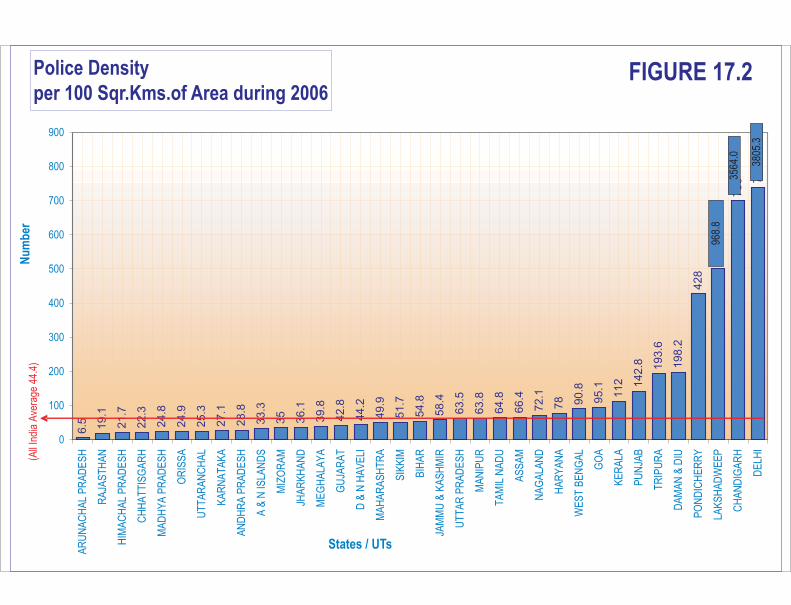
Police Density
per 100 Sqr.Kms.of Area during 20066.5 19.1
21.7
22.3
24.8
24.9
25.3
27.1
28.8
33.3
35
36.1
39.8
42.8
44.2
49.9
51.7
54.8
58.4
63.5
63.8
64.8
66.4
72.1
78 90.8
95.1
112 142.8 193.6
198.2
428
500
700 7
40
0
100
200
300
400
500
600
700
800
900
AR
UN
AC
HA
LP
RA
DE
SH
RA
JAS
TH
AN
HIM
AC
HA
LP
RA
DE
SH
CH
HA
TT
ISG
AR
H
MA
DH
YA
PR
AD
ES
H
OR
ISS
A
UT
TA
RA
NC
HA
L
KA
RN
AT
AK
A
AN
DH
RA
PR
AD
ES
H
A&
NIS
LAN
DS
MIZ
OR
AM
JHA
RK
HA
ND
ME
GH
ALA
YA
GU
JAR
AT
D&
NH
AV
ELI
MA
HA
RA
SH
TR
A
SIK
KIM
BIH
AR
JAM
MU
&K
AS
HM
IR
UT
TA
RP
RA
DE
SH
MA
NIP
UR
TA
MIL
NA
DU
AS
SA
M
NA
GA
LAN
D
HA
RY
AN
A
WE
ST
BE
NG
AL
GO
A
KE
RA
LA
PU
NJA
B
TR
IPU
RA
DA
MA
N&
DIU
PO
ND
ICH
ER
RY
LAK
SH
AD
WE
EP
CH
AN
DIG
AR
H
DE
LHI
States / UTs
Nu
mb
er(A
llIn
dia
Ave
rage
44.4
)
968.
8
3564
.0
FIGURE 17.2
3805
.3

Cyber Crimes under IT Act During 2003-20068
21
20
6
32
26
34
0
6
10
74
88
1
5
10
59
69
0
30
10
20
30
40
50
60
70
80
90
100
Ta
mp
erin
g
Ha
ckin
g
Ob
sce
ne
pu
blic
atio
n/t
ran
sm
issio
n
Fa
ilure
Bre
ach
of
co
nfid
en
tia
lity
No
.of
Ca
se
s
2003 2004 2005 2006
6
18
17
12
00
32
21
0
710
41
12
5
0
13
8
63
81
0 2
0
20
40
60
80
100
120
140
Ta
mp
erin
g
Ha
ckin
g
Ob
sce
ne
pu
blic
atio
n/t
ran
sm
issio
n
Fa
ilure
Bre
ach
of
co
nfid
en
tia
lity
No
.of
Ca
se
s
2003 2004 2005 2006
Figure 18.1
Cases Registered Persons Arrested

Cyber Crimes under IPC during 2003-20060 0 0
89
26
9
53
0 0 0
77
173
29
0 0 0
48
18
6
68
0 0 0
16
0
90
61
0
50
100
150
200
250
300
Public
Serv
ant
Offences
by/A
gain
st
Fals
eele
ctr
onic
evid
ence
Destr
uction
of
ele
ctr
onic
evid
ence
Forg
ery
Crim
inalB
reach
of
Tru
st/F
raud
Counte
rfeitin
g
No
.of
Ca
se
s
2003 2004 2005 2006
0 0 0
10
2
25
5
11
8
0 0 0
81
18
1
67
0 0 0
71
21
5
91
0 0 0
19
4
12
1
96
0
50
100
150
200
250
300
Public
Serv
ant
Offences
by/A
gain
st
Fals
eele
ctr
onic
evid
ence
Destr
uction
of
ele
ctr
onic
evid
ence
Forg
ery
Crim
inalB
reach
of
Tru
st/F
raud
Counte
rfeitin
g
No
.of
Ca
se
s
2003 2004 2005 2006
Figure 18.2
Cases Registered Persons Arrested

0
500
1000
1500
2000
2500
3000
3500
4000
Incid
en
ce
AS
SA
M
BIH
AR
CH
HA
TT
ISG
AR
H
GU
JA
RA
T
HA
RY
AN
A
HIM
AC
HA
LP
RA
DE
SH
JA
MM
U&
KA
SH
MIR
JH
AR
KH
AN
D
KA
RN
AT
AK
A
KE
RA
LA
MA
DH
YA
PR
AD
ES
H
MA
HA
RA
SH
TR
A
OR
ISS
A
PU
NJA
B
RA
JA
ST
HA
N
TA
MIL
NA
DU
UT
TA
RP
RA
DE
SH
WE
ST
BE
NG
AL
DE
LH
IU
T
States/UT
Incidence of total IPC Crimes Reported by GRP During 2004-2006
2004 2005 2006
Figure 19.1