Embed Size (px)
Citation preview
Imprint
Published by
Ministry of Health and Population Ramshahpath, Kathmandu, Nepal Tel +977-1-4262590 +977-1-4223580 +977-1-262862 Fax +977-1-4262896 www.mohp.gov.np [email protected]
and
Nepal Health Sector Support Programme Ministry of Health and Population Ramshahpath, Kathmandu, Nepal Tel - +977-1-4264250, 4262110 www.nhssp.org.np [email protected]
Authors
Suresh Tiwari Susheel Chandra Lekhak Prabha Baral Rajan Adhikari Lila Raj Poudel Mohan Bahadur Thapa Tomas Lievens
Kathmandu, January 2012
Disclaimer
All reasonable precautions have been taken by the Ministry of Health and Population (MoHP) and Nepal Health Sector Support Programme (NHSSP) to verify the information contained in this publication. However, the published material is being distributed without warranty of any kind, either expressed or implied. The responsibility for the interpretation and use of the material lies with the reader. In no event shall the Ministry of Health and Population and Nepal Health Sector Programme (NHSSP) be liable for damages arising from its use.

i
ACKNOWLEDGEMENTS
We are grateful to all the officials and experts for giving their time to discuss financial allocation and
expenditure issues. We value the inputs from the various MoHP/DoHS divisions and centres. Finally,
we appreciate the input from Nancy Gerein and Greg Whiteside from NHSSP.
The study team would like to acknowledge Dr.Bal Krishna Suvedi, Chief PPICD, Dr. Baburam
Marasini, Chief Health Sector Reform Unit, and Mr. Shiva Simkhada, Chief, Finance Section, of the
Ministry of Health and Population.
ii
LIST OF ABBREVIATIONS
ADB Asian Development Bank
ARI Acute Respiratory Infection
AWPB Annual Work Planning and Budgeting
BPKIHS BP Koirala Institute of Health Sciences
BPKLCOS B. P. Koirala Lions Centre of Ophthalmic Studies
CEC Centre for International Study and Cooperation
D(P)HO District (Public) Health Office(r)
DDA Department of Drug Administration
DFID Department for International Development
DHO District Health Office(r)
DoA Department of Ayurveda
DoHS Department of Health Services
e-AWPB Electronic Annual Planning and Budgeting
EDP External Development Partner
EHCS Essential Health Care Services
FCGO Financial Comptroller’s General Office
FHD Family Health Division
FMIS Financial Management Information System
FMR Financial Monitoring Report
FY Fiscal Year
GAVI Global Alliance for Vaccines and Immunisation
GESI Gender Equality and Social Inclusion
GIZ Gesellschaftfür Internationale Zusammenarbei
GoN Government of Nepal
GTZ German Agency For Technical Cooperation
HC Health Centre
HDI Human Development Index
HIV/AIDS Human Immuno Deficiency Virus / Acquired Immuno Deficiency Virus
HMIS Health Management Information System
HP Health Post
HRI Health Right International
IDA International Development Association
iii
ITI International Trachoma Initiative
JICA Japan International Cooperation Agency
KfW Kreditanstalt für Wiederaufbau
MCH Maternal and Child Health
MDG Millennium Development Goal
MoCS Ministry of Commerce and Supply
MoD Ministry of Defence
MoF Ministry of Finance
MoGA Ministry of General Administration
MoHA Ministry of Home Affairs
MoHP Ministry of Health and Population
MoLD Ministry of Local Development
NCASC National Centre for AIDS and STD Control
NHEICC National Health Education Information Communication Centre
NHSP Nepal Health Sector Programme
NHSSP Nepal Health Sector Support Programme
NHTC National Health Training Centre
NPC National Planning Commission
NPHL National Public Health Laboratory
NSL Netherland Support for Leprosy
NTC National Tuberculosis Centre
PHCC Primary Health Care Centre
PHS Primary Health Service
PPICD Policy, Planning and International Cooperation Division
RHD Regional Health Directorate
SBA Skilled Birth Attendance
SDC Swiss Development Cooperation
SHPs Sub Health Post(s)
STD Sexually Transmitted Disease
TA Technical Assistance
TU Teaching Hospital
TUTH Tribhuvan University Teaching Hospital
TWG Technical Working Group
UNDP United Nation Development Programme
iv
UNFPA United Nation Population Fund
UNICEF United Nation Children's Fund
USA United States of America
USAID United States Agency for International Development
WFP World Food Programme
WHO World Health Organisation
v
EXECUTIVE SUMMARY
The 2007 interim constitution of Nepal recognises health as a fundamental right. This and some
other major policy reforms such as the Nepal Health Sector Programme (NHSP-2) and the Gender
Equality and Social Inclusion Strategy, widely known as GESI, required financial and budgeting
reforms and an accordingly adapted budget allocation structure. The Nepal Health Sector
Programme (NHSP-2) 2010/15 projects that the share of total government budget for health will rise
from around 7% in FY 2010/11 to 9.6% in FY 2014/15. In FY 2010/11 GoN has allocated 7.1% of the
total national budget to the health sector.
This analysis aims to provide law makers, policy formulators and programme managers with
pertinent information on this year’s budget with a view to assisting with the preparation of future
budgets, and to provide information on budget allocation patterns. The overall purpose of this
assignment is to analyse and provide disaggregated data of the 2011-12 health budget, including an
analysis of how resources are allocated between providers and services, and a limited value for
money analysis.
MAIN FINDINGS
ALLOCATION
The health sector allocation of NRs 27.27 billion constitutes 7.1% of the total national
budget. The MoHP allocation is NRs 24.93 billion or 6.5% of the total national budget and
91.4% of the total budget for the health sector.
The development allocation decreased slightly (by 1%) in comparison with the last fiscal year
and currently constitutes 76% of the total MoHP allocation.
The budget allocation for salaries and allowances is 18% of the total budget in 2011/12.
The budget for HIV/AIDS, Population and Laboratory programmes doubled compared to last
year. There has also been a sharp increase (71%) for the Tuberculosis programme. In
contrast, the budget for Drugs and Equipment, BP Koirala Memorial Cancer Hospital, Suresh
Wagle Memorial Cancer Centre and District Ayurveda Services decreased by more than 50%
compared to the last fiscal year.
The budget for the Department of Drug Administration (DDA) and hospitals was slightly
reduced in FY 2011/12, by 2.3% and 1.9% respectively compared to FY 2010/11.
Allocations to districts (both direct and further allocations: ‘direct allocation’ represents the
allocation directly made to districts by MoHP and ‘further allocation' represents DoHS
allocating or providing drugs, equipment and logistics to districts for specific health
programmes after receiving budget from MoHP) increased by 59.5% compared to last fiscal
year. The proportion of budget directly allocated for districts is 32.9% of total MoHP budget
vi
and the proportion of budget which will be further allocated from the centre to districts is
26.6%.
Almost half of the districts received more than NRs 90 million direct allocations in this fiscal
year. The total allocation is higher in the Tarai districts while per-capita allocation is higher in
the mountain and hill districts, namely Humla, Mugu, Dolpa, Mustang, Manang, Rasuwa, and
Sankhuwasabha.
The proportion of budget allocation from government has increased remarkably over the
last three years, by 61% in FY 2011-12 and 50.2% in FY 2008/09.
Global Fund (15.2%), UNICEF (6.0%), USAID (4.6%), GAVI (3.6%), WHO (2.8%), and ITI USA
(1.5%) are the major non-pool partners this year.
The MDG related budget allocations make up 32% of the total health budget, and are 3%
higher compared with last year.
About three quarters of the total MoHP budget is targeted at women, 11.9% in direct
contributions and 62.4% in indirect contributions.
SPENDING
Recurrent spending on pay was higher while non-pay related recurrent expenditure was
lower compared to the previous fiscal year.
Per-capita public health spending was NRs. 650 in nominal terms, which is twice as much as
in 2006/07, while the increment in real terms is only NRs. 22.4 in FY 2010/11 compared to
2007/08.
Per-capita public spending on health is highest in the mountain districts of the mid-western
and western regions, namely Jumla, Dolpa, Mustang, and Manang, and Dhankuta from
eastern region.
The absorption rate of the MoHP was 76% in 2010/11, a decrease of 13% compared to the
previous fiscal year.
The contingency line items in both the recurrent and development budgets were not spent.
Spending distribution is very uneven over the year with almost two thirds (64%) of the
annual budget spent during the third trimester in 2010/11.
RECOMMENDATIONS
To achieve a budget for the health sector in line with the NHSP-2 projections, the MoHP should
improve its absorptive capacity and resource allocation processes, as well as its coordination and
dialogue with the MoF and NPC.
vii
The MoHP should increase value for money through developing a better understanding of the
efficiency of the different MoHP programmes, and increase the allocation of resources towards
the most cost-effective areas.
MoHP should develop a standard budget allocation policy to be followed by central units in the
allocation of resources to districts.
The Government and the MoHP should simplify the budgetary processes, rules and regulations
to improve timely budget execution and increase the budget absorption rate.
viii
TABLE OF CONTENTS
ACKNOWLEDGEMENTS .......................................................................................................................................................... i LIST OF ABBREVIATIONS ...................................................................................................................................................... ii EXECUTIVE SUMMARY .......................................................................................................................................................... v
CHAPTER I
INTRODUCTION 1.1 BACKGROUND 1 1.2 OBJECTIVES OF THE STUDY 1 1.3 METHODOLOGY 2 1.4 MAJOR HIGHLIGHTS OF HEALTH BUDGET 2011/12 2
CHAPTER II
HEALTH BUDGET ALLOCATIONS 2.1 HEALTH BUDGET AS A SHARE OF NATIONAL BUDGET 3 2.2 BUDGET ALLOCATION IN NOMINAL AND REAL TERMS 6 2.3 BUDGET ALLOCATIONS BY ADMINISTRATIVE AND DEVELOPMENT PROGRAMMES 7 2.4 BUDGET ALLOCATIONS BY LINE ITEM (ECONOMIC CODE) 7 2.5 BUDGET ALLOCATION BY PROGRAMME 8 2.6 BUDGET ALLOCATION BY BUDGET AUTHORITY 10 2.7 BUDGET ALLOCATION FOR DISTRICTS 11 2.8 BUDGET ALLOCATIONS BY GOVERNMENT AND DONORS 14 2.9 BUDGET ALLOCATION BY MDG 16 2.10 BUDGET ALLOCATION FOR GENDER AND POOR TARGETED PROGRAMMES 17
CHAPTER III
HEALTH SPENDING 3.1 TRENDS IN HEALTH SPENDING 18 3.2 PER-CAPITA PUBLIC SPENDING ON HEALTH BY DISTRICT 20 3.3 ABSORPTION CAPACITY 21 3.4 TRIMESTER-WISE BUDGET SPENDING 23
CHAPTER IV
SUMMARY, DISCUSSION AND RECOMMENDATIONS 4.1 OBJECTIVE 24 4.2 DISCUSSION 24 4.3 RECOMMENDATIONS 25 ANNEXURES ANNEX 1 – BUDGET BY PROGRAMME (NRS. IN THOUSAND) 28 ANNEX 2 – BUDGET AND EXPENDITURE BY PROGRAMME (NRS. IN THOUSAND) 30 ANNEX 3 – BUDGET AND EXPENDITURE BY NHSP-IP OUTPUT FY 2010/11 (NRS. IN THOUSAND) 32 ANNEX 4 – BUDGET AND EXPENDITURE BY LINE ITEM (NRS. IN THOUSAND) 33 ANNEX 5 – EDP CONTRIBUTION BY BILATERAL, MULTILATERAL AND INGO, FY 2011/12 (NRS. IN
THOUSAND) 35 ANNEX 6 – BUDGET BY SELECTED PROGRAMME AND EDP, FY 2011/12 (NRS. IN THOUSAND) 36 ANNEX 7 – SPENDING BY TRIMESTER (NRS. IN THOUSAND) 37 ANNEX 8 – ALLOCATION AND SPENDING BY DISTRICTS (NRS. IN THOUSAND) 39 ANNEX 9 – BUDGET ALLOCATION BY TYPE GOODS, SERVICES AND CONSTRUCTION (NRS. IN THOUSAND) 42 ANNEX 10 – DISSAGGREGATION OF BUDGET BY PRIORITY PROGRAMMES AND GROUPS (NRS. IN THOUSAND) 43 ANNEX 11 – BUDGET BY AUTHORITY (NRS. IN THOUSAND) 44 ANNEX 12 – BUDGET AND EXPENDITURE BY DONOR (NRS. IN THOUSAND) 45 ANNEX 13 – MACROECONOMIC INDICATORS 46
ix
ANNEX 14 – PROCESS AND CRITERIA DEVELOPED BY NATIONAL PLANNING COMMISSION TO DETERMINE
GENDER ACCOUNTABLE BUDGET AND ACTIVITY 47
List of tables Table 1 - Budget allocations in the health sector (NRs. in billions) ............................................................... 4
Table 2 – Budget allocations by administrative and development programmes .......................................... 7
Table 3 – Budget allocation by line item ....................................................................................................... 7
Table 4 – Development programmes with increased and reduced budgets ................................................. 8
Table 5 – General administration (regular) budget increases and decreases ............................................... 9
Table 6 – Top ten donors in health (NRs. millions) ...................................................................................... 15
Table 7 – Budget allocated for targeted groups (women and poor), NRs. in millions ................................ 17
Table 8– Absorption capacity for general administration budget.............................................................. 21
List of figures Figure 1 – Health budget allocation pattern (FY 2009/10 - 2011/12) ............................................................ 3
Figure 2 – Percentage change vis-a-vis previous year: national, health sector and MoHP budget ................ 5
Figure 3 - Per-capita and total health allocation (FY 2007/08 to 2011/12, constant 2007/08 prices) .......... 6
Figure 4 – Health budget allocation by administrative authorities (FY 2009/10 - 2011/12) ........................ 10
Figure 5 – Health budget allocations – centre versus district (FY 2007/08 - 2011/12)................................. 11
Figure 6 – District-wise budget allocations .................................................................................................. 12
Figure 7 – Per-capita budget allocations by district ..................................................................................... 13
Figure 8 - Government and donor's contributions in MoHP's budget.......................................................... 14
Figure 9 - Government and donor's contribution in MoHP's budget ........................................................... 16
Figure 10– Per-capita spending 2006/07 – 2010/11 (NRs.)........................................................................... 18
Figure 11 - Per-capita and actual spending by MoHP FY 2007/09 - 2010/11 (constant 2007/08 prices) ...... 19
Figure 12– Per-capita spending by district (in NRs) ....................................................................................... 20
Figure 13– Budget absorption capacity ......................................................................................................... 21
Figure 14 - Trimester-wise budget spending ................................................................................................. 23
Page | 1
CHAPTER I INTRODUCTION
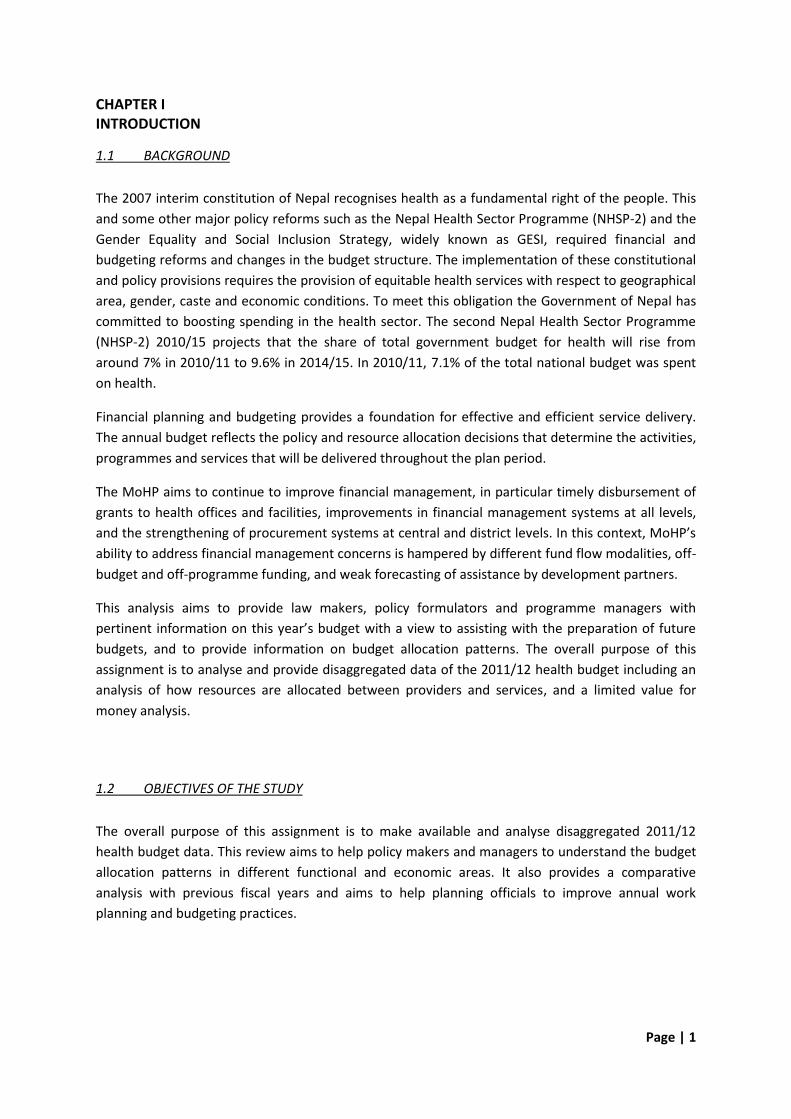
1.1 BACKGROUND
The 2007 interim constitution of Nepal recognises health as a fundamental right of the people. This
and some other major policy reforms such as the Nepal Health Sector Programme (NHSP-2) and the
Gender Equality and Social Inclusion Strategy, widely known as GESI, required financial and
budgeting reforms and changes in the budget structure. The implementation of these constitutional
and policy provisions requires the provision of equitable health services with respect to geographical
area, gender, caste and economic conditions. To meet this obligation the Government of Nepal has
committed to boosting spending in the health sector. The second Nepal Health Sector Programme
(NHSP-2) 2010/15 projects that the share of total government budget for health will rise from
around 7% in 2010/11 to 9.6% in 2014/15. In 2010/11, 7.1% of the total national budget was spent
on health.
Financial planning and budgeting provides a foundation for effective and efficient service delivery.
The annual budget reflects the policy and resource allocation decisions that determine the activities,
programmes and services that will be delivered throughout the plan period.
The MoHP aims to continue to improve financial management, in particular timely disbursement of
grants to health offices and facilities, improvements in financial management systems at all levels,
and the strengthening of procurement systems at central and district levels. In this context, MoHP’s
ability to address financial management concerns is hampered by different fund flow modalities, off-
budget and off-programme funding, and weak forecasting of assistance by development partners.
This analysis aims to provide law makers, policy formulators and programme managers with
pertinent information on this year’s budget with a view to assisting with the preparation of future
budgets, and to provide information on budget allocation patterns. The overall purpose of this
assignment is to analyse and provide disaggregated data of the 2011/12 health budget including an
analysis of how resources are allocated between providers and services, and a limited value for
money analysis.
1.2 OBJECTIVES OF THE STUDY
The overall purpose of this assignment is to make available and analyse disaggregated 2011/12
health budget data. This review aims to help policy makers and managers to understand the budget
allocation patterns in different functional and economic areas. It also provides a comparative
analysis with previous fiscal years and aims to help planning officials to improve annual work
planning and budgeting practices.
Page | 2
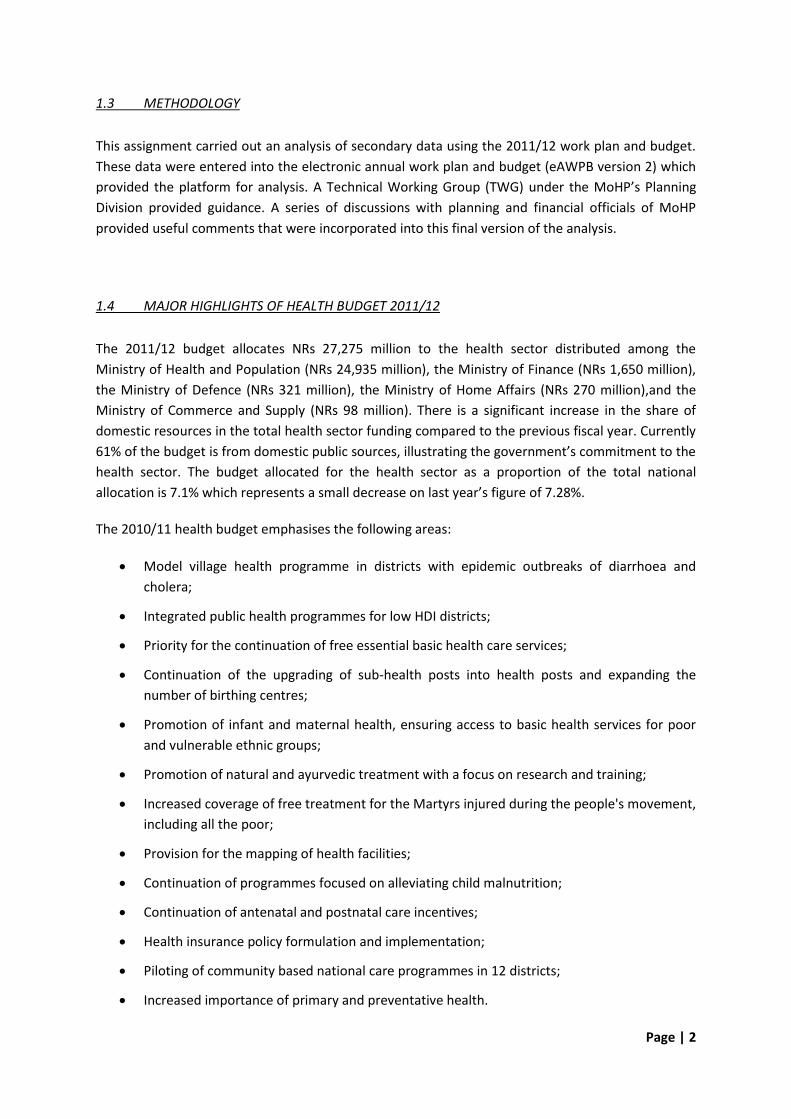
1.3 METHODOLOGY
This assignment carried out an analysis of secondary data using the 2011/12 work plan and budget.
These data were entered into the electronic annual work plan and budget (eAWPB version 2) which
provided the platform for analysis. A Technical Working Group (TWG) under the MoHP’s Planning
Division provided guidance. A series of discussions with planning and financial officials of MoHP
provided useful comments that were incorporated into this final version of the analysis.
1.4 MAJOR HIGHLIGHTS OF HEALTH BUDGET 2011/12
The 2011/12 budget allocates NRs 27,275 million to the health sector distributed among the
Ministry of Health and Population (NRs 24,935 million), the Ministry of Finance (NRs 1,650 million),
the Ministry of Defence (NRs 321 million), the Ministry of Home Affairs (NRs 270 million),and the
Ministry of Commerce and Supply (NRs 98 million). There is a significant increase in the share of
domestic resources in the total health sector funding compared to the previous fiscal year. Currently
61% of the budget is from domestic public sources, illustrating the government’s commitment to the
health sector. The budget allocated for the health sector as a proportion of the total national
allocation is 7.1% which represents a small decrease on last year’s figure of 7.28%.
The 2010/11 health budget emphasises the following areas:
Model village health programme in districts with epidemic outbreaks of diarrhoea and
cholera;
Integrated public health programmes for low HDI districts;
Priority for the continuation of free essential basic health care services;
Continuation of the upgrading of sub-health posts into health posts and expanding the
number of birthing centres;
Promotion of infant and maternal health, ensuring access to basic health services for poor
and vulnerable ethnic groups;
Promotion of natural and ayurvedic treatment with a focus on research and training;
Increased coverage of free treatment for the Martyrs injured during the people's movement,
including all the poor;
Provision for the mapping of health facilities;
Continuation of programmes focused on alleviating child malnutrition;
Continuation of antenatal and postnatal care incentives;
Health insurance policy formulation and implementation;
Piloting of community based national care programmes in 12 districts;
Increased importance of primary and preventative health.
Page | 3
CHAPTER II HEALTH BUDGET ALLOCATIONS
In this section we examine the 2011/12 budget allocations and compare these with budget
allocations in previous years. Except where stated, figures in this section refer to planned
budgets/allocations.
2.1 HEALTH BUDGET AS A SHARE OF NATIONAL BUDGET
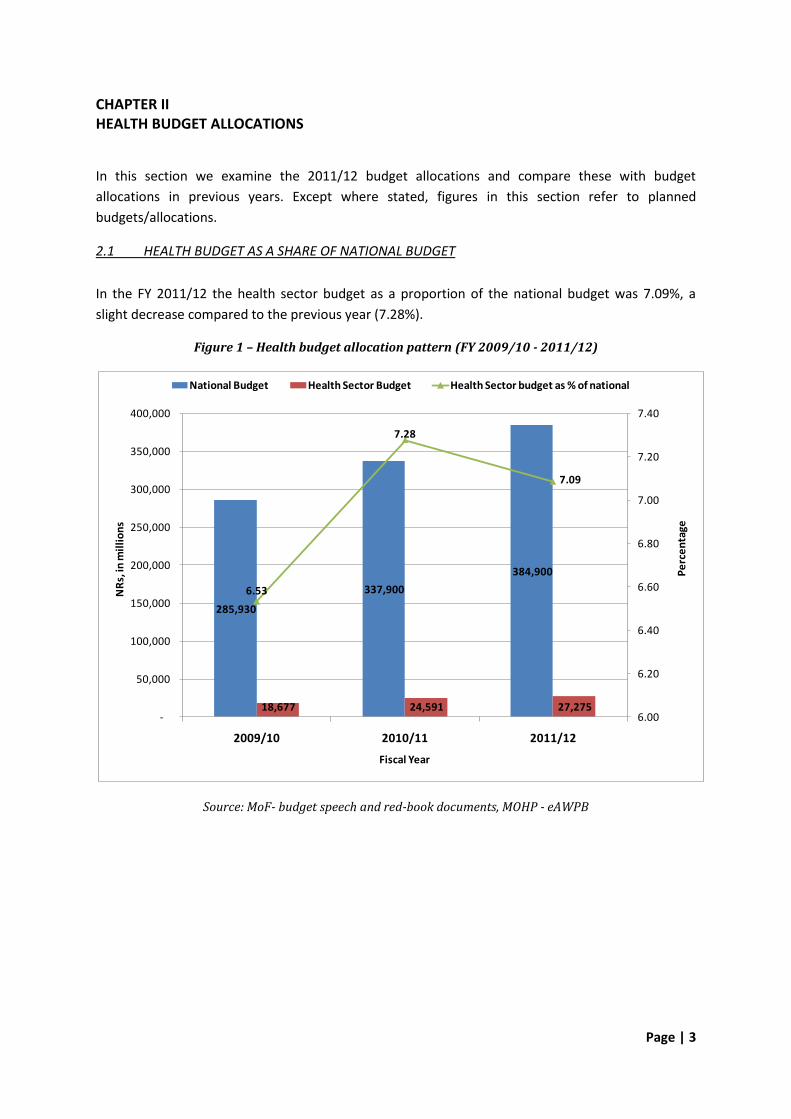
In the FY 2011/12 the health sector budget as a proportion of the national budget was 7.09%, a
slight decrease compared to the previous year (7.28%).
Figure 1 – Health budget allocation pattern (FY 2009/10 - 2011/12)
Source: MoF- budget speech and red-book documents, MOHP - eAWPB
285,930
337,900
384,900
18,677 24,591 27,275
6.53
7.28
7.09
6.00
6.20
6.40
6.60
6.80
7.00
7.20
7.40
-
50,000
100,000
150,000
200,000
250,000
300,000
350,000
400,000
2009/10 2010/11 2011/12
Pe
rce
nta
ge
NR
s, in
mil
lio
ns
Fiscal Year
National Budget Health Sector Budget Health Sector budget as % of national
Page | 4
A total of NRs. 27.27 billion has been allocated to the health sector in 2011/12 out of which 91.4%
(NRs 24.93 billion) is allocated to the Ministry of Health and Population. The budget allocated to the
MoF (NRs. 1.65 billion) is a reserve fund for employee and retirement benefits. The growth in
budgets for the three major recipients (MoHP, MoHA and MoD) has been far smaller from 2010/11
to 2011/12 (4.7%, 9.2% and 4.5%, respectively), compared to the growth in budget from 2009/10 to
2010/11 (33.7%, 28.8% and 16.4% respectively) (see Table 1).
Table 1 - Budget allocations in the health sector (NRs. in billions) Ministry 2009/10 2010/11 2011/12
NRs. % Share NRs. % Share NRs. % Share
MoHP 17.82 95.4 23.81 96.8 24.93 91.4
MoHA 0.19 1.0 0.25 1.0 0.27 1.0
MoD 0.26 1.4 0.31 1.3 0.32 1.2
MoCS 0.09 0.5 0.09 0.4 0.10 0.4
MoGA 0.12 0.7 0.13 0.5 0.00 0.0
MoLD 0.19 1.0 0.00 0.0 0.00 0.0
MoF 0.00 0.0 0.00 0.0 1.65 6.0
Health Sector 18.68 100 24.59 100 27.27 100
Source: MoF budget speech and red-book documents 2009/10 – 2011/12
Page | 5
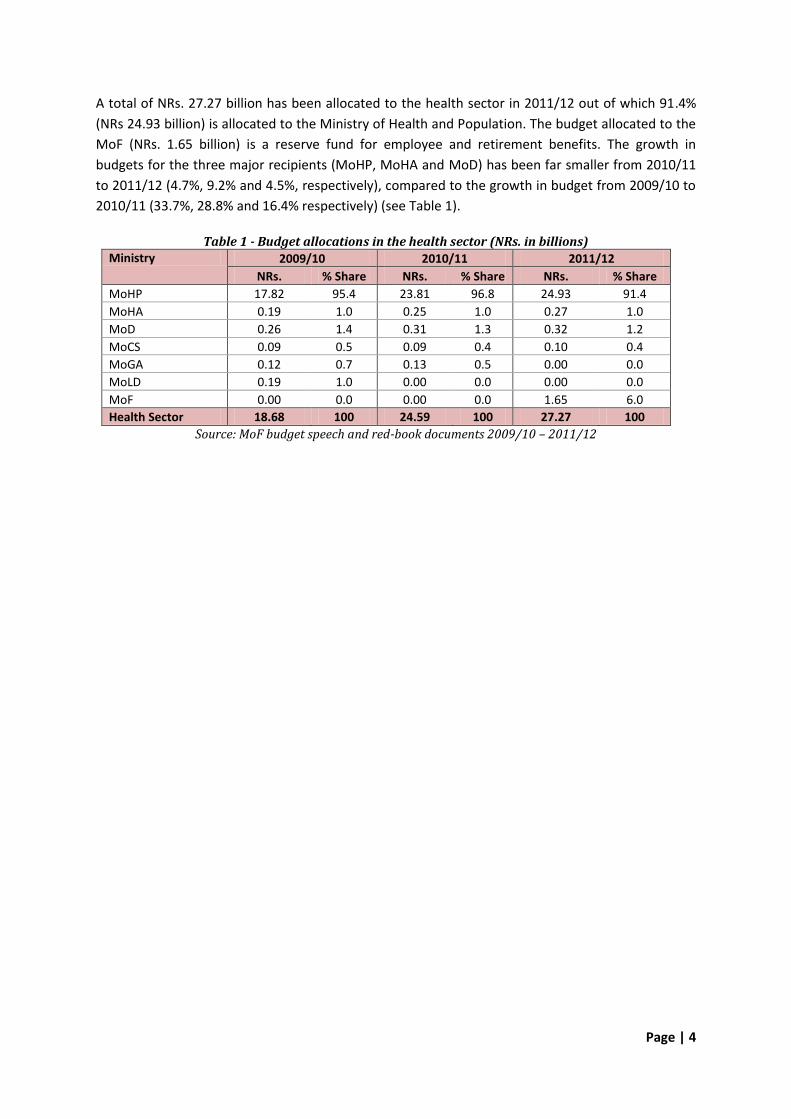
In 2009/10 and 2011/12 the percentage wise growth in the MoHP budget was smaller than that of
the national budget while in 2010/12 this was the other way round. The total national budget
increased by 13.91% compared with 2010/11, whereas the health sector budget increased by
10.91%. The allocation to the MoHP only increased by 4.7% compared to the previous fiscal year.
Figure 2 – Percentage change vis-a-vis previous year: national, health sector and MoHP budget (FY 2009/10 to 2011/12)
Source: MoF- budget speech and red-book documents, MOHP - eAWPB
21.15
18.18
13.91
19.89
31.66
10.91
19.37
33.48
4.71
0.00
5.00
10.00
15.00
20.00
25.00
30.00
35.00
40.00
2009/10 2010/11 2011/12
Pe
rce
nta
ge (%
)
Fiscal Year
National budget change (%)
Health sector budget change (%)
MoHP budget change (%)
Page | 6
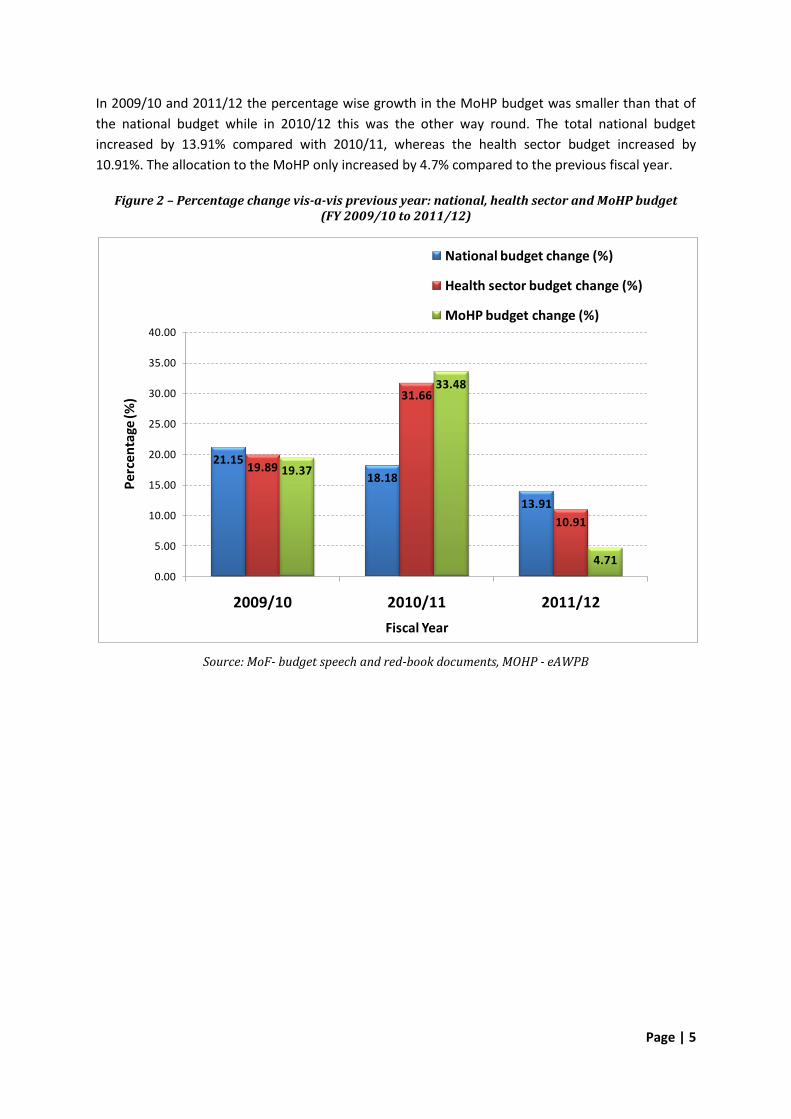
2.2 BUDGET ALLOCATION IN NOMINAL AND REAL TERMS
The MoHP budget allocation more than doubled (106% increase) over the last 5 fiscal years in
nominal terms while the increase is 37.9% in real terms. The increment in FY 2011/12 is only 0.3%
while it was 18.4% in FY 2010/11 compared to the previous fiscal year. Almost the same (38.8%)
increase is observed for the per-capita allocation in real terms during the period.
Figure 3 - Per-capita and total health allocation (FY 2007/08 to 2011/12, constant 2007/08 prices)
454491
514
599631
12179
1345114144
16750 16792
0
100
200
300
400
500
600
700
0
2000
4000
6000
8000
10000
12000
14000
16000
18000
2007/08 2008/09 2009/10 2010/11 2011/12
NR
s.
NR
s. in
mill
ion
Fiscal Year
Per-capita allocation (constant, 2007/08 prices)
Actual allocation (constant, 2007/08 prices)
Page | 7
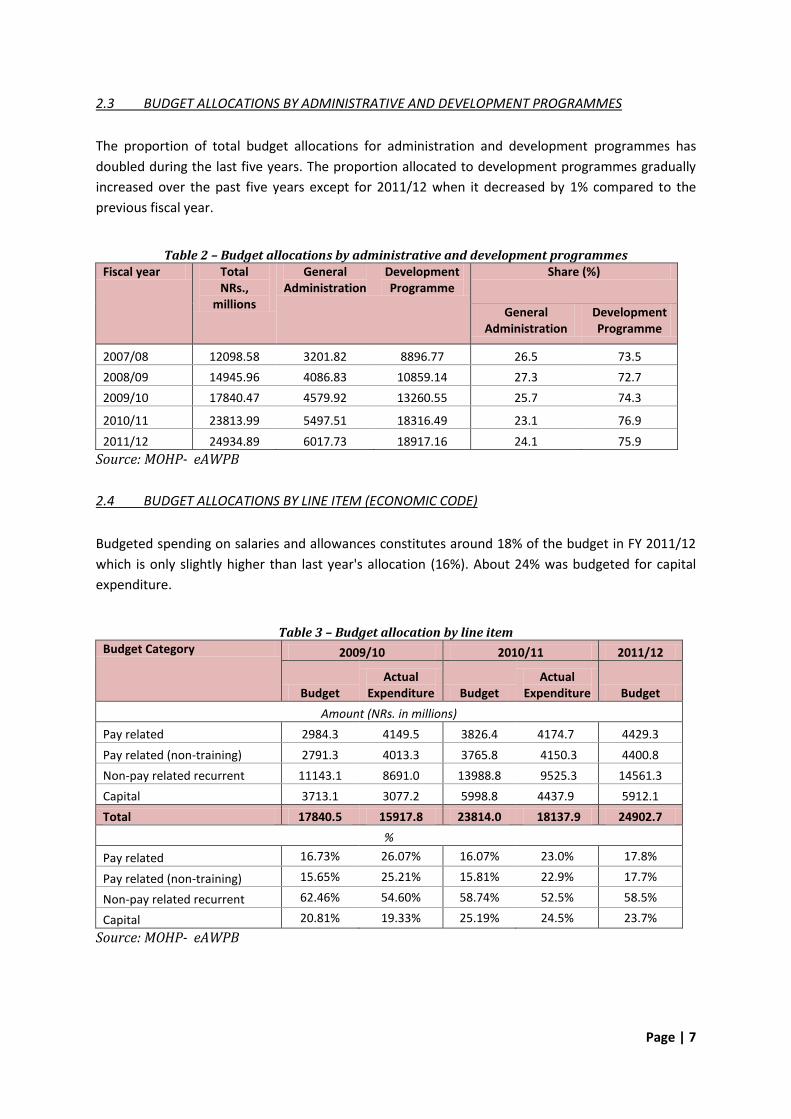
2.3 BUDGET ALLOCATIONS BY ADMINISTRATIVE AND DEVELOPMENT PROGRAMMES
The proportion of total budget allocations for administration and development programmes has
doubled during the last five years. The proportion allocated to development programmes gradually
increased over the past five years except for 2011/12 when it decreased by 1% compared to the
previous fiscal year.
Table 2 – Budget allocations by administrative and development programmes Fiscal year Total
NRs., millions
General Administration
Development Programme
Share (%)
General Administration
Development Programme
2007/08 12098.58 3201.82 8896.77 26.5 73.5
2008/09 14945.96 4086.83 10859.14 27.3 72.7
2009/10 17840.47 4579.92 13260.55 25.7 74.3
2010/11 23813.99 5497.51 18316.49 23.1 76.9
2011/12 24934.89 6017.73 18917.16 24.1 75.9
Source: MOHP- eAWPB
2.4 BUDGET ALLOCATIONS BY LINE ITEM (ECONOMIC CODE)
Budgeted spending on salaries and allowances constitutes around 18% of the budget in FY 2011/12
which is only slightly higher than last year's allocation (16%). About 24% was budgeted for capital
expenditure.
Table 3 – Budget allocation by line item Budget Category 2009/10 2010/11 2011/12
Budget Actual
Expenditure Budget Actual
Expenditure Budget
Amount (NRs. in millions)
Pay related 2984.3 4149.5 3826.4 4174.7 4429.3
Pay related (non-training) 2791.3 4013.3 3765.8 4150.3 4400.8
Non-pay related recurrent 11143.1 8691.0 13988.8 9525.3 14561.3
Capital 3713.1 3077.2 5998.8 4437.9 5912.1
Total 17840.5 15917.8 23814.0 18137.9 24902.7
%
Pay related 16.73% 26.07% 16.07% 23.0% 17.8%
Pay related (non-training) 15.65% 25.21% 15.81% 22.9% 17.7%
Non-pay related recurrent 62.46% 54.60% 58.74% 52.5% 58.5%
Capital 20.81% 19.33% 25.19% 24.5% 23.7%
Source: MOHP- eAWPB
Page | 8
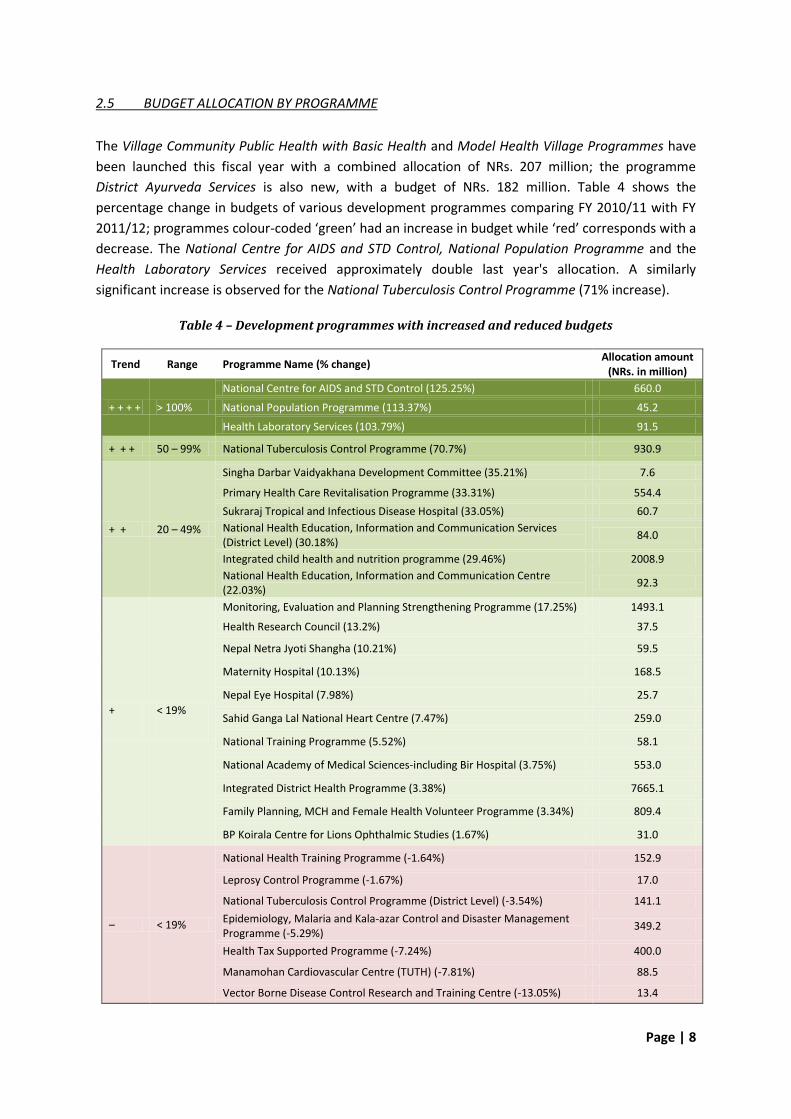
2.5 BUDGET ALLOCATION BY PROGRAMME
The Village Community Public Health with Basic Health and Model Health Village Programmes have
been launched this fiscal year with a combined allocation of NRs. 207 million; the programme
District Ayurveda Services is also new, with a budget of NRs. 182 million. Table 4 shows the
percentage change in budgets of various development programmes comparing FY 2010/11 with FY
2011/12; programmes colour-coded ‘green’ had an increase in budget while ‘red’ corresponds with a
decrease. The National Centre for AIDS and STD Control, National Population Programme and the
Health Laboratory Services received approximately double last year's allocation. A similarly
significant increase is observed for the National Tuberculosis Control Programme (71% increase).
Table 4 – Development programmes with increased and reduced budgets
Trend Range Programme Name (% change) Allocation amount
(NRs. in million)
+ + + + > 100%
National Centre for AIDS and STD Control (125.25%) 660.0
National Population Programme (113.37%) 45.2
Health Laboratory Services (103.79%) 91.5
+ + + 50 – 99% National Tuberculosis Control Programme (70.7%) 930.9
+ + 20 – 49%
Singha Darbar Vaidyakhana Development Committee (35.21%) 7.6
Primary Health Care Revitalisation Programme (33.31%) 554.4
Sukraraj Tropical and Infectious Disease Hospital (33.05%) 60.7
National Health Education, Information and Communication Services (District Level) (30.18%)
84.0
Integrated child health and nutrition programme (29.46%) 2008.9
National Health Education, Information and Communication Centre (22.03%)
92.3
+ < 19%
Monitoring, Evaluation and Planning Strengthening Programme (17.25%) 1493.1
Health Research Council (13.2%) 37.5
Nepal Netra Jyoti Shangha (10.21%) 59.5
Maternity Hospital (10.13%) 168.5
Nepal Eye Hospital (7.98%) 25.7
Sahid Ganga Lal National Heart Centre (7.47%) 259.0
National Training Programme (5.52%) 58.1
National Academy of Medical Sciences-including Bir Hospital (3.75%) 553.0
Integrated District Health Programme (3.38%) 7665.1
Family Planning, MCH and Female Health Volunteer Programme (3.34%) 809.4
BP Koirala Centre for Lions Ophthalmic Studies (1.67%) 31.0
– < 19%
National Health Training Programme (-1.64%) 152.9
Leprosy Control Programme (-1.67%) 17.0
National Tuberculosis Control Programme (District Level) (-3.54%) 141.1
Epidemiology, Malaria and Kala-azar Control and Disaster Management Programme (-5.29%)
349.2
Health Tax Supported Programme (-7.24%) 400.0
Manamohan Cardiovascular Centre (TUTH) (-7.81%) 88.5
Vector Borne Disease Control Research and Training Centre (-13.05%) 13.4
Page | 9
Trend Range Programme Name (% change) Allocation amount
(NRs. in million) Hospital Construction, Maintenance and Management Information System (-16.31%)
164.1
– – 20 – 49% Kanti Children Hospital (-23.73%) 146.6
– – – 50 – 99%
Drugs and Equipment Supply Programme (-51.15%) 946.1
BP Koirala Memorial Cancer Hospital (-51.89%) 51.0
Miscellaneous Programme - Department of Ayurveda (-76.76%) 46.1
Suresh Wagle Memorial Cancer Centre (T.U. Teaching Hospital) (-79.22%) 10.5
District Aurbeda Services Programme (-97.55%) 181.8
– – – – 100% Avian Flu Prevention and Control Programme (-100%) 0.0
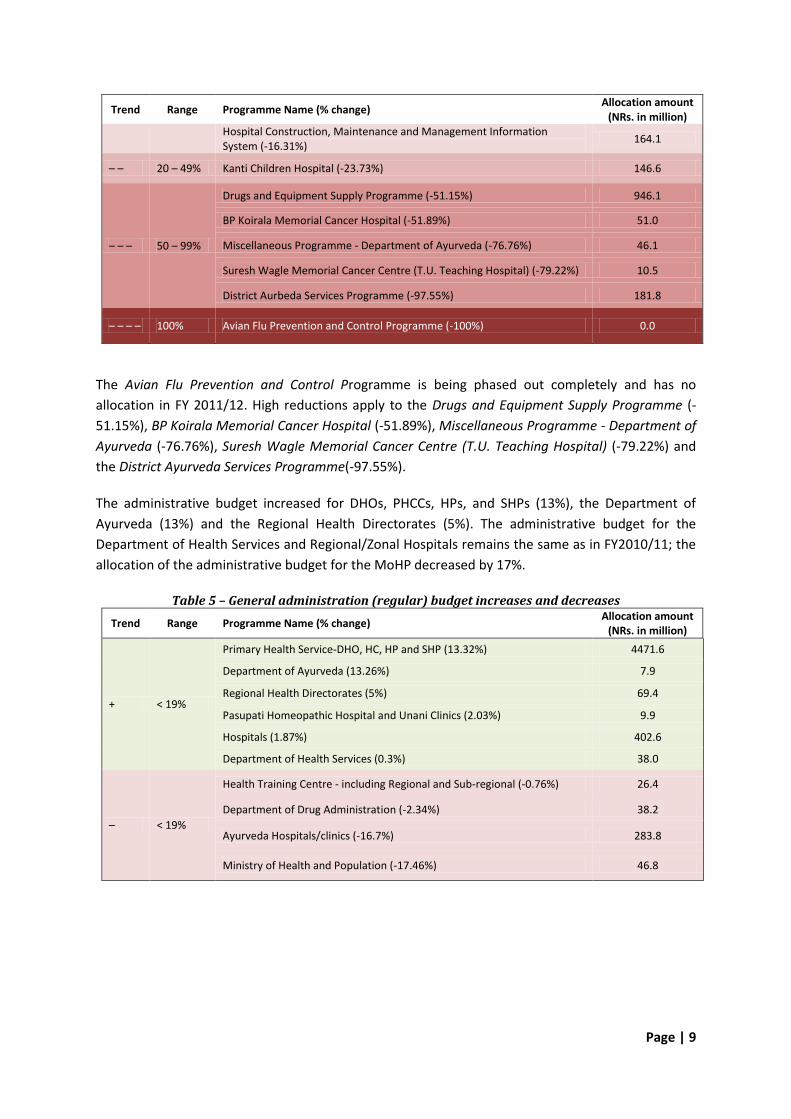
The Avian Flu Prevention and Control Programme is being phased out completely and has no
allocation in FY 2011/12. High reductions apply to the Drugs and Equipment Supply Programme (-
51.15%), BP Koirala Memorial Cancer Hospital (-51.89%), Miscellaneous Programme - Department of
Ayurveda (-76.76%), Suresh Wagle Memorial Cancer Centre (T.U. Teaching Hospital) (-79.22%) and
the District Ayurveda Services Programme(-97.55%).
The administrative budget increased for DHOs, PHCCs, HPs, and SHPs (13%), the Department of
Ayurveda (13%) and the Regional Health Directorates (5%). The administrative budget for the
Department of Health Services and Regional/Zonal Hospitals remains the same as in FY2010/11; the
allocation of the administrative budget for the MoHP decreased by 17%.
Table 5 – General administration (regular) budget increases and decreases
Trend Range Programme Name (% change) Allocation amount
(NRs. in million)
+ < 19%
Primary Health Service-DHO, HC, HP and SHP (13.32%) 4471.6
Department of Ayurveda (13.26%) 7.9
Regional Health Directorates (5%) 69.4
Pasupati Homeopathic Hospital and Unani Clinics (2.03%) 9.9
Hospitals (1.87%) 402.6
Department of Health Services (0.3%) 38.0
– < 19%
Health Training Centre - including Regional and Sub-regional (-0.76%) 26.4
Department of Drug Administration (-2.34%) 38.2
Ayurveda Hospitals/clinics (-16.7%) 283.8
Ministry of Health and Population (-17.46%) 46.8
Page | 10
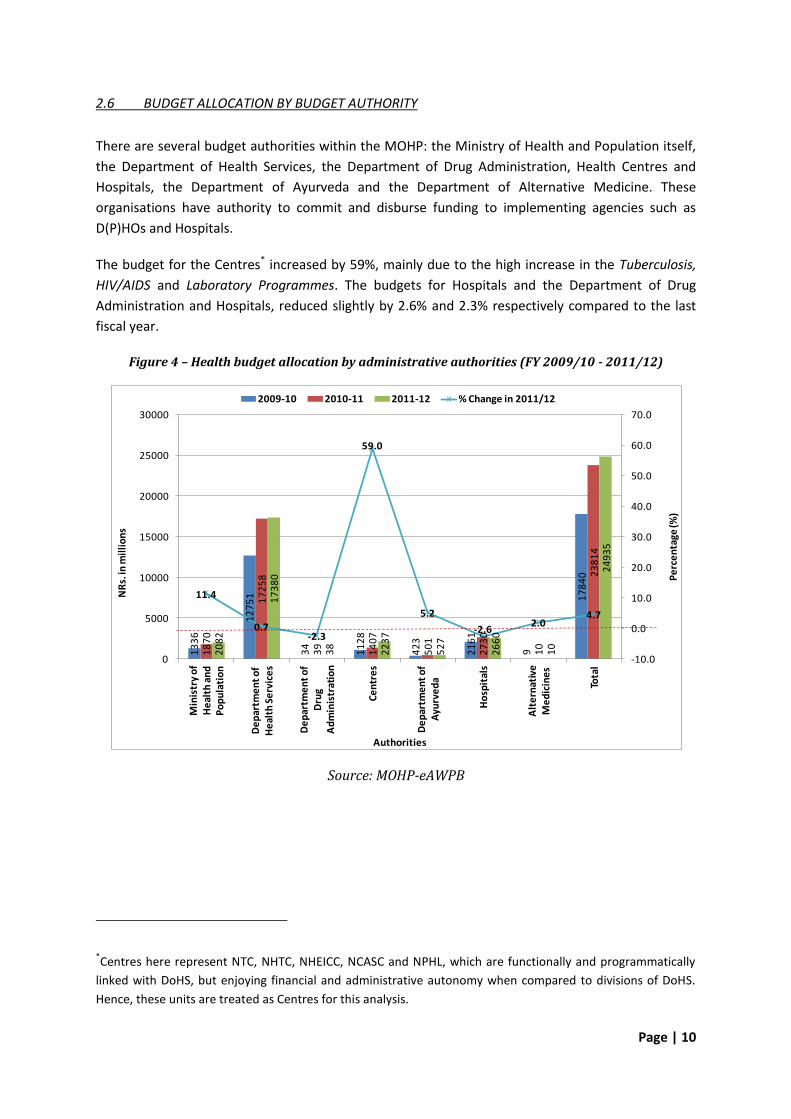
2.6 BUDGET ALLOCATION BY BUDGET AUTHORITY
There are several budget authorities within the MOHP: the Ministry of Health and Population itself,
the Department of Health Services, the Department of Drug Administration, Health Centres and
Hospitals, the Department of Ayurveda and the Department of Alternative Medicine. These
organisations have authority to commit and disburse funding to implementing agencies such as
D(P)HOs and Hospitals.
The budget for the Centres* increased by 59%, mainly due to the high increase in the Tuberculosis,
HIV/AIDS and Laboratory Programmes. The budgets for Hospitals and the Department of Drug
Administration and Hospitals, reduced slightly by 2.6% and 2.3% respectively compared to the last
fiscal year.
Figure 4 – Health budget allocation by administrative authorities (FY 2009/10 - 2011/12)
Source: MOHP-eAWPB
*Centres here represent NTC, NHTC, NHEICC, NCASC and NPHL, which are functionally and programmatically
linked with DoHS, but enjoying financial and administrative autonomy when compared to divisions of DoHS.
Hence, these units are treated as Centres for this analysis.
13
36
12
75
1
34
11
28
42
3
21
61
9
17
84
0
18
70
17
25
8
39
14
07
50
1
27
30
10
23
81
4
20
82
17
38
0
38
22
37
52
7
26
60
10
24
93
511.4
0.7-2.3
59.0
5.2
-2.62.0
4.7
-10.0
0.0
10.0
20.0
30.0
40.0
50.0
60.0
70.0
0
5000
10000
15000
20000
25000
30000
Min
istr
y o
f H
eal
th a
nd
P
op
ula
tio
n
De
par
tme
nt
of
He
alth
Se
rvic
es
De
par
tme
nt
of
Dru
g A
dm
inis
trat
ion
Ce
ntr
es
De
par
tme
nt
of
Ayu
rve
da
Ho
spit
als
Alt
ern
ativ
e M
ed
icin
es
Tota
l
Pe
rce
nta
ge (%
)
NR
s. in
mil
lio
ns
Authorities
2009-10 2010-11 2011-12 % Change in 2011/12
Page | 11
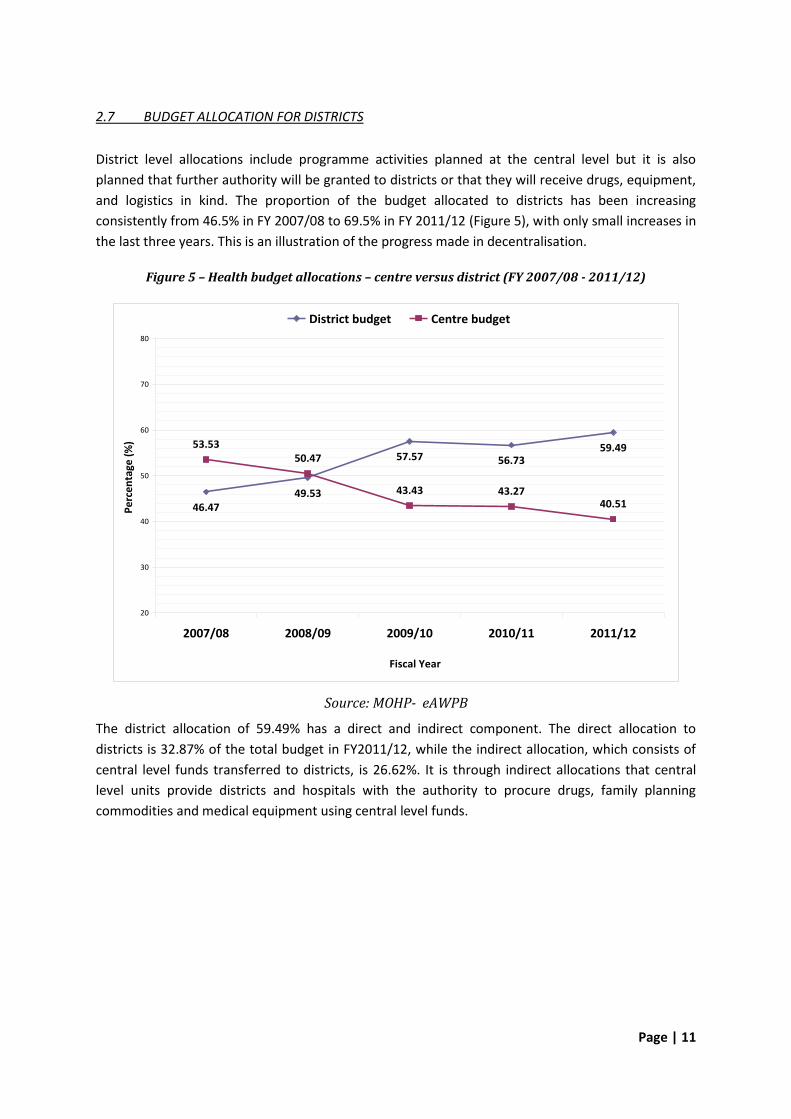
2.7 BUDGET ALLOCATION FOR DISTRICTS
District level allocations include programme activities planned at the central level but it is also
planned that further authority will be granted to districts or that they will receive drugs, equipment,
and logistics in kind. The proportion of the budget allocated to districts has been increasing
consistently from 46.5% in FY 2007/08 to 69.5% in FY 2011/12 (Figure 5), with only small increases in
the last three years. This is an illustration of the progress made in decentralisation.
Figure 5 – Health budget allocations – centre versus district (FY 2007/08 - 2011/12)
Source: MOHP- eAWPB
The district allocation of 59.49% has a direct and indirect component. The direct allocation to
districts is 32.87% of the total budget in FY2011/12, while the indirect allocation, which consists of
central level funds transferred to districts, is 26.62%. It is through indirect allocations that central
level units provide districts and hospitals with the authority to procure drugs, family planning
commodities and medical equipment using central level funds.
46.4749.53
57.57 56.7359.4953.53
50.47
43.43 43.2740.51
20
30
40
50
60
70
80
2007/08 2008/09 2009/10 2010/11 2011/12
Fiscal Year
Per
cen
tage
(%
)
District budget Centre budget
Page | 12
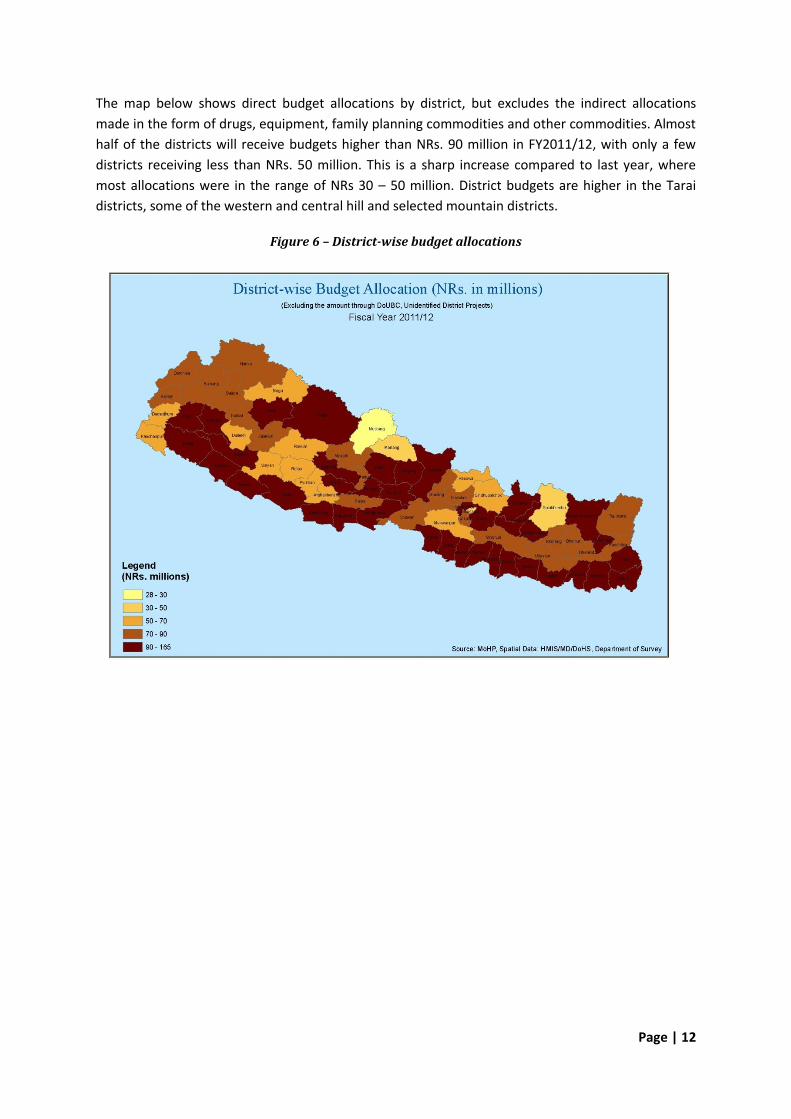
The map below shows direct budget allocations by district, but excludes the indirect allocations
made in the form of drugs, equipment, family planning commodities and other commodities. Almost
half of the districts will receive budgets higher than NRs. 90 million in FY2011/12, with only a few
districts receiving less than NRs. 50 million. This is a sharp increase compared to last year, where
most allocations were in the range of NRs 30 – 50 million. District budgets are higher in the Tarai
districts, some of the western and central hill and selected mountain districts.
Figure 6 – District-wise budget allocations
Page | 13
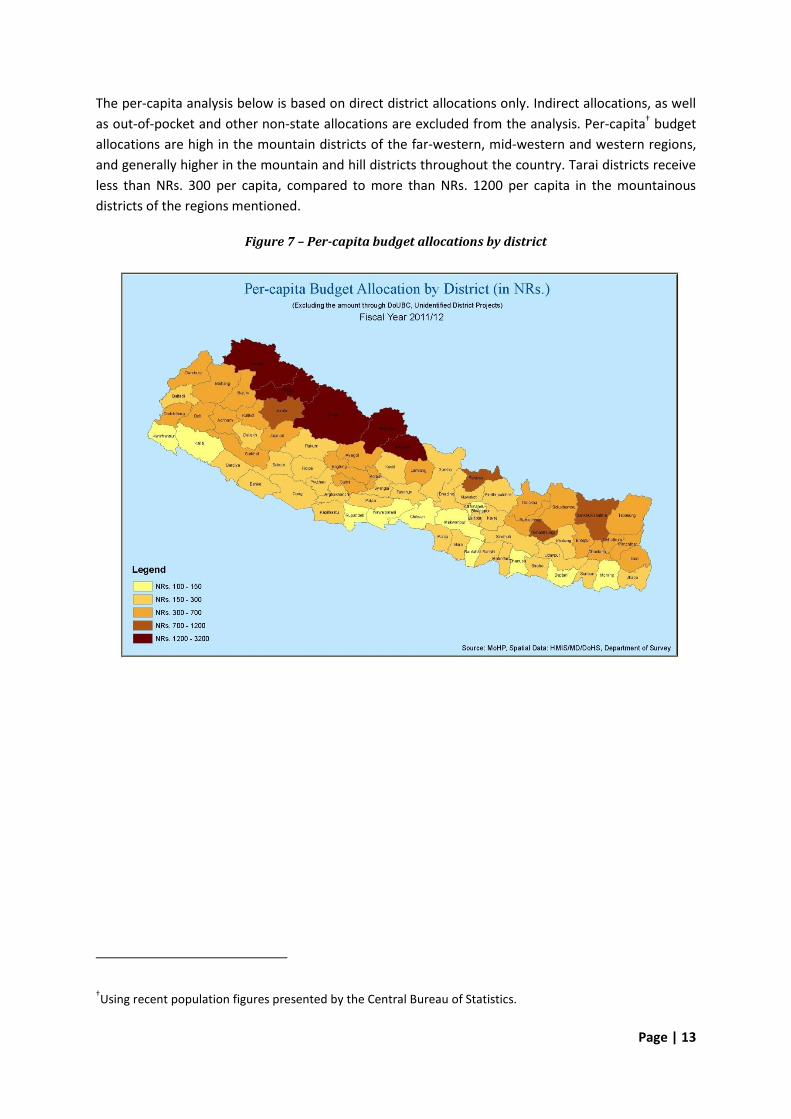
The per-capita analysis below is based on direct district allocations only. Indirect allocations, as well
as out-of-pocket and other non-state allocations are excluded from the analysis. Per-capita† budget
allocations are high in the mountain districts of the far-western, mid-western and western regions,
and generally higher in the mountain and hill districts throughout the country. Tarai districts receive
less than NRs. 300 per capita, compared to more than NRs. 1200 per capita in the mountainous
districts of the regions mentioned.
Figure 7 – Per-capita budget allocations by district
†Using recent population figures presented by the Central Bureau of Statistics.
Page | 14
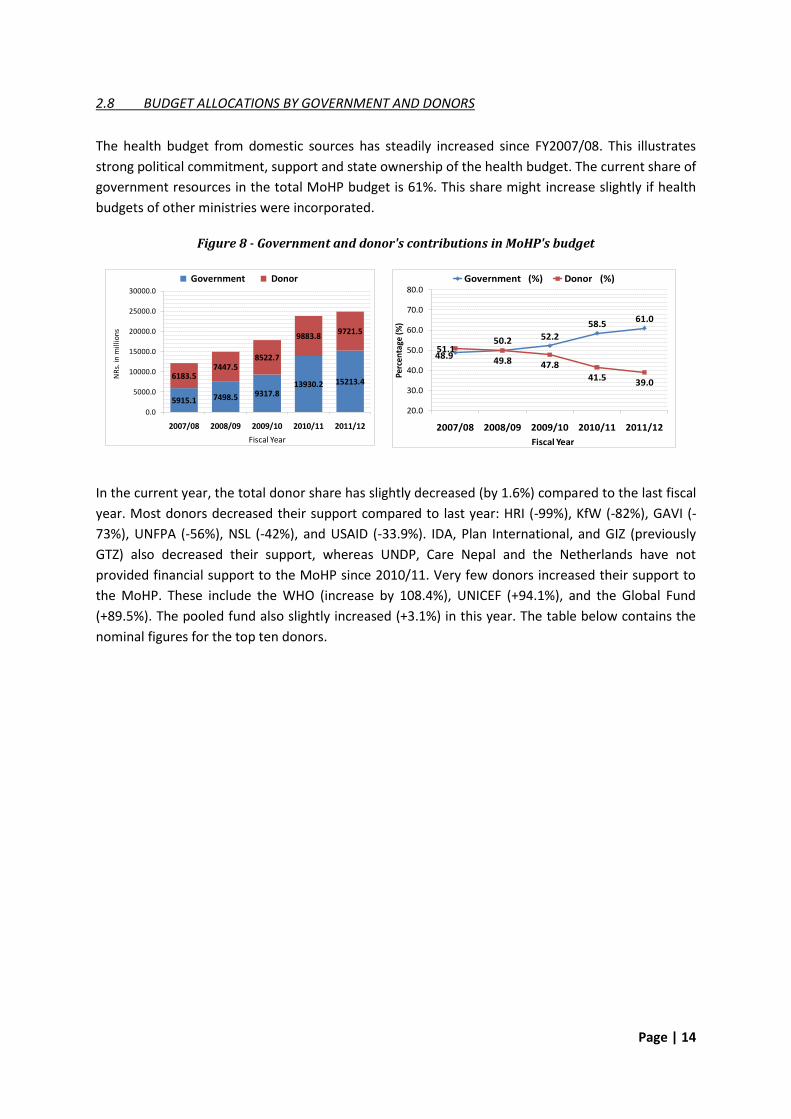
2.8 BUDGET ALLOCATIONS BY GOVERNMENT AND DONORS
The health budget from domestic sources has steadily increased since FY2007/08. This illustrates
strong political commitment, support and state ownership of the health budget. The current share of
government resources in the total MoHP budget is 61%. This share might increase slightly if health
budgets of other ministries were incorporated.
Figure 8 - Government and donor's contributions in MoHP's budget
In the current year, the total donor share has slightly decreased (by 1.6%) compared to the last fiscal
year. Most donors decreased their support compared to last year: HRI (-99%), KfW (-82%), GAVI (-
73%), UNFPA (-56%), NSL (-42%), and USAID (-33.9%). IDA, Plan International, and GIZ (previously
GTZ) also decreased their support, whereas UNDP, Care Nepal and the Netherlands have not
provided financial support to the MoHP since 2010/11. Very few donors increased their support to
the MoHP. These include the WHO (increase by 108.4%), UNICEF (+94.1%), and the Global Fund
(+89.5%). The pooled fund also slightly increased (+3.1%) in this year. The table below contains the
nominal figures for the top ten donors.
5915.1 7498.5 9317.813930.2 15213.4
6183.57447.5
8522.7
9883.89721.5
0.0
5000.0
10000.0
15000.0
20000.0
25000.0
30000.0
2007/08 2008/09 2009/10 2010/11 2011/12
NR
s. in
mill
ion
s
Fiscal Year
Government Donor
48.9
50.2 52.2
58.561.0
51.149.8 47.8
41.539.0
20.0
30.0
40.0
50.0
60.0
70.0
80.0
2007/08 2008/09 2009/10 2010/11 2011/12
Perc
enta
ge (
%)
Fiscal Year
Government (%) Donor (%)
Page | 15
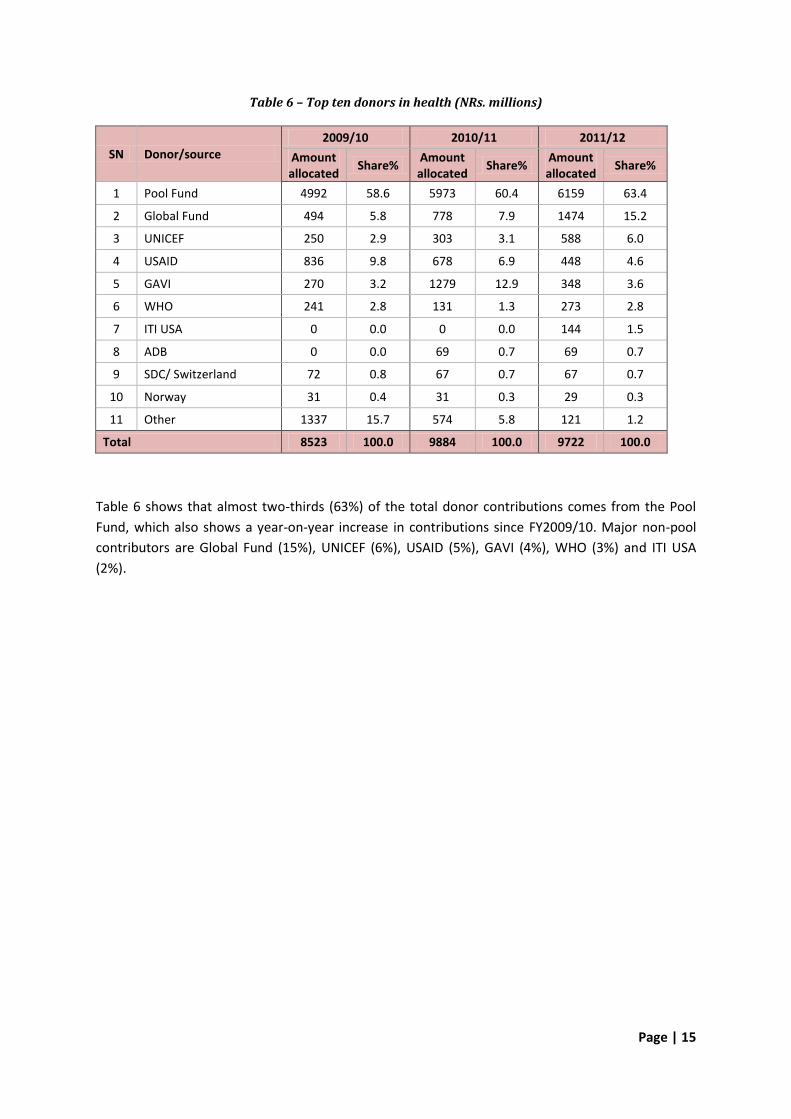
Table 6 – Top ten donors in health (NRs. millions)
SN Donor/source
2009/10 2010/11 2011/12
Amount allocated
Share% Amount allocated
Share% Amount allocated
Share%
1 Pool Fund 4992 58.6 5973 60.4 6159 63.4
2 Global Fund 494 5.8 778 7.9 1474 15.2
3 UNICEF 250 2.9 303 3.1 588 6.0
4 USAID 836 9.8 678 6.9 448 4.6
5 GAVI 270 3.2 1279 12.9 348 3.6
6 WHO 241 2.8 131 1.3 273 2.8
7 ITI USA 0 0.0 0 0.0 144 1.5
8 ADB 0 0.0 69 0.7 69 0.7
9 SDC/ Switzerland 72 0.8 67 0.7 67 0.7
10 Norway 31 0.4 31 0.3 29 0.3
11 Other 1337 15.7 574 5.8 121 1.2
Total 8523 100.0 9884 100.0 9722 100.0
Table 6 shows that almost two-thirds (63%) of the total donor contributions comes from the Pool
Fund, which also shows a year-on-year increase in contributions since FY2009/10. Major non-pool
contributors are Global Fund (15%), UNICEF (6%), USAID (5%), GAVI (4%), WHO (3%) and ITI USA
(2%).
Page | 16
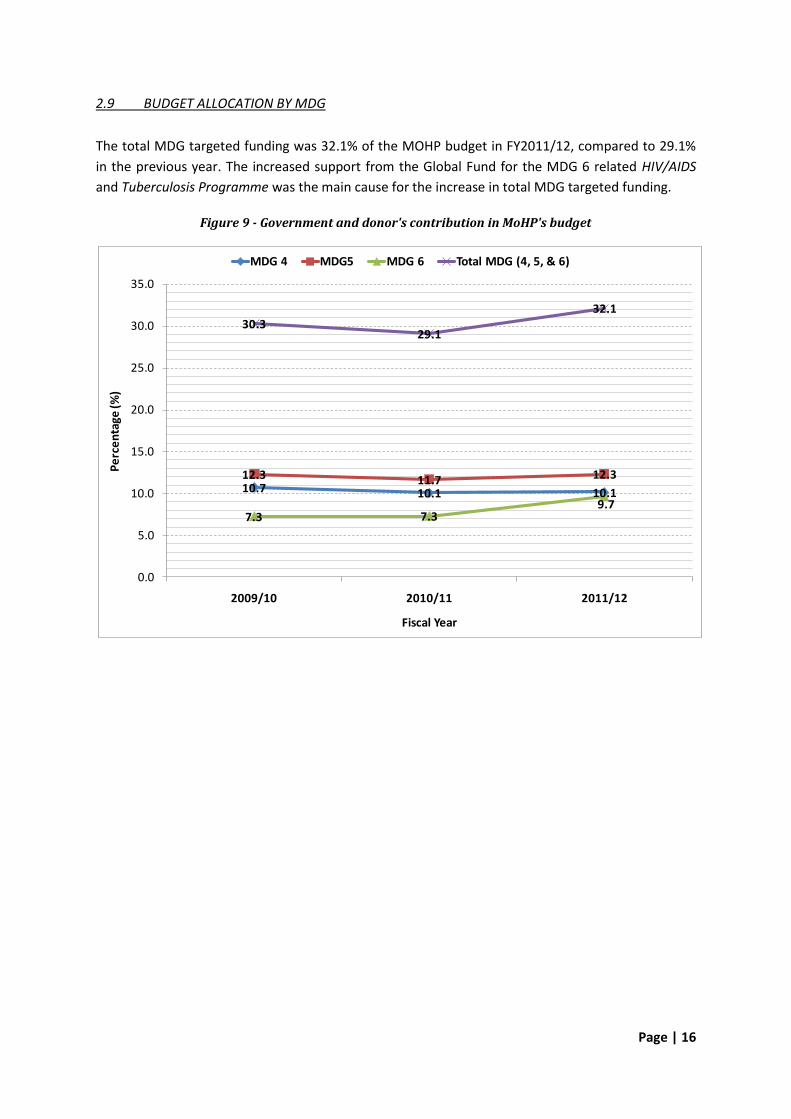
2.9 BUDGET ALLOCATION BY MDG
The total MDG targeted funding was 32.1% of the MOHP budget in FY2011/12, compared to 29.1%
in the previous year. The increased support from the Global Fund for the MDG 6 related HIV/AIDS
and Tuberculosis Programme was the main cause for the increase in total MDG targeted funding.
Figure 9 - Government and donor's contribution in MoHP's budget
10.7 10.1 10.1
12.3 11.7 12.3
7.3 7.39.7
30.329.1
32.1
0.0
5.0
10.0
15.0
20.0
25.0
30.0
35.0
2009/10 2010/11 2011/12
Pe
rce
nta
ge (%
)
Fiscal Year
MDG 4 MDG5 MDG 6 Total MDG (4, 5, & 6)
Page | 17
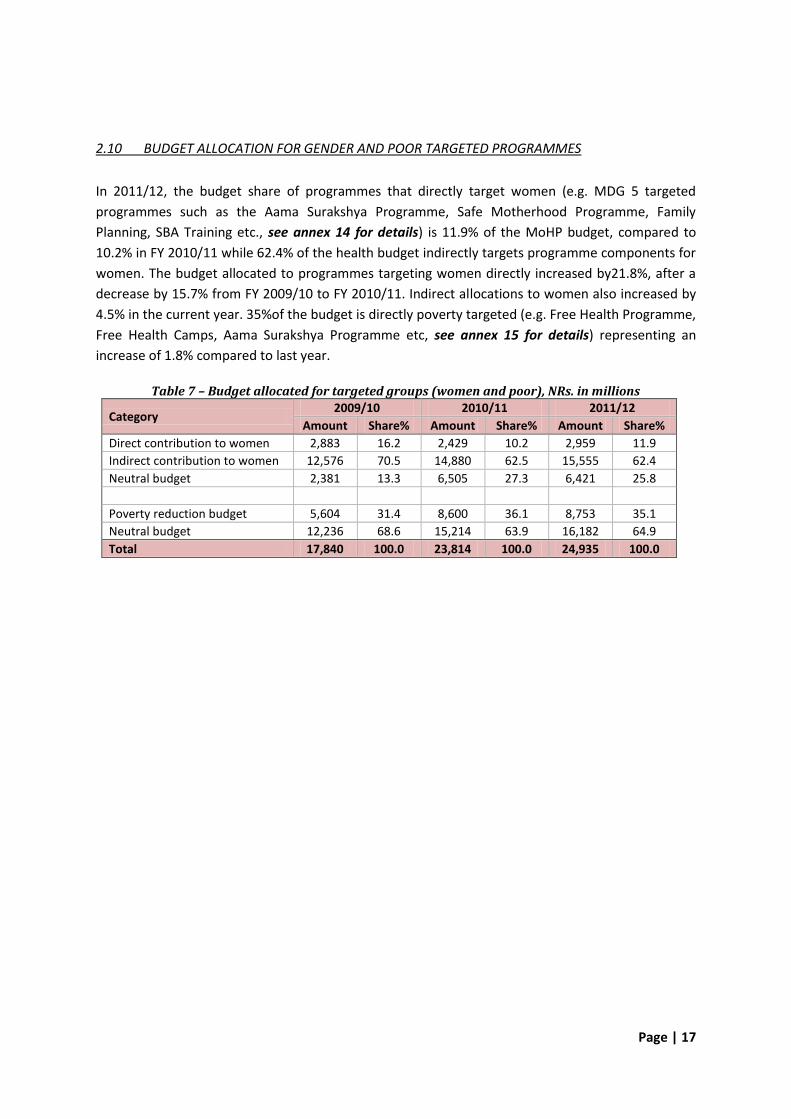
2.10 BUDGET ALLOCATION FOR GENDER AND POOR TARGETED PROGRAMMES
In 2011/12, the budget share of programmes that directly target women (e.g. MDG 5 targeted
programmes such as the Aama Surakshya Programme, Safe Motherhood Programme, Family
Planning, SBA Training etc., see annex 14 for details) is 11.9% of the MoHP budget, compared to
10.2% in FY 2010/11 while 62.4% of the health budget indirectly targets programme components for
women. The budget allocated to programmes targeting women directly increased by21.8%, after a
decrease by 15.7% from FY 2009/10 to FY 2010/11. Indirect allocations to women also increased by
4.5% in the current year. 35%of the budget is directly poverty targeted (e.g. Free Health Programme,
Free Health Camps, Aama Surakshya Programme etc, see annex 15 for details) representing an
increase of 1.8% compared to last year.
Table 7 – Budget allocated for targeted groups (women and poor), NRs. in millions
Category 2009/10 2010/11 2011/12
Amount Share% Amount Share% Amount Share%
Direct contribution to women 2,883 16.2 2,429 10.2 2,959 11.9
Indirect contribution to women 12,576 70.5 14,880 62.5 15,555 62.4
Neutral budget 2,381 13.3 6,505 27.3 6,421 25.8
Poverty reduction budget 5,604 31.4 8,600 36.1 8,753 35.1
Neutral budget 12,236 68.6 15,214 63.9 16,182 64.9
Total 17,840 100.0 23,814 100.0 24,935 100.0
Page | 18
CHAPTER III HEALTH SPENDING
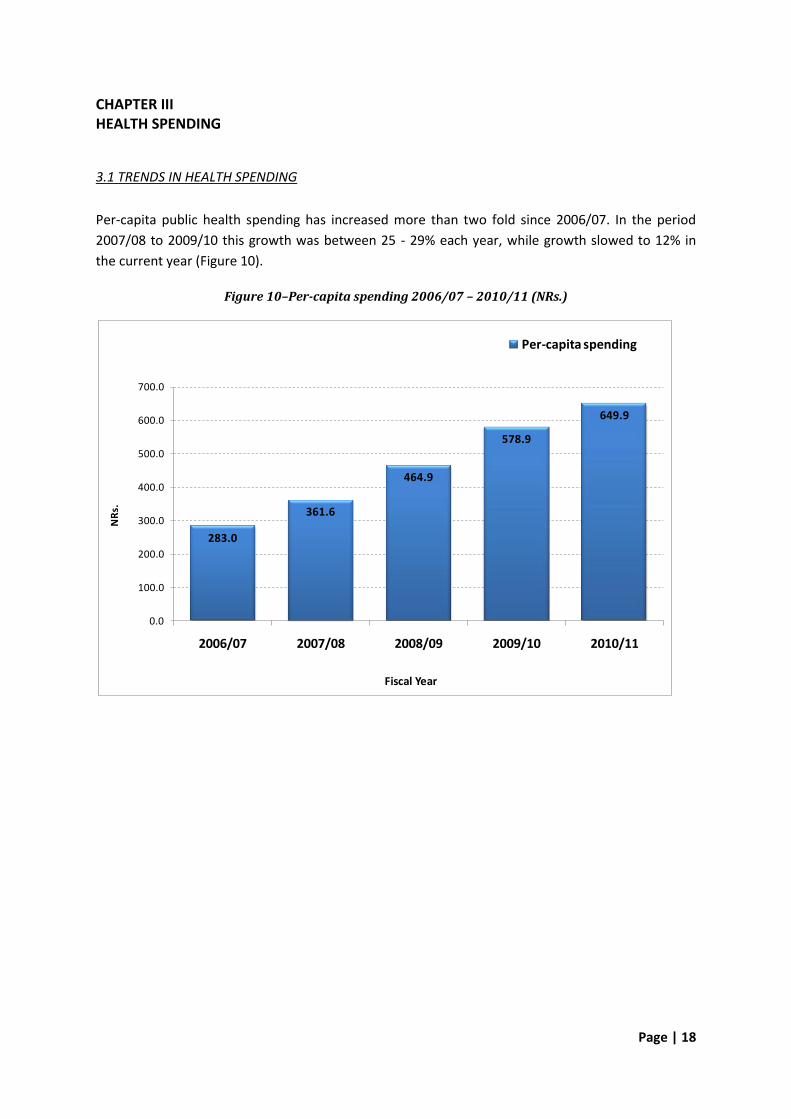
3.1 TRENDS IN HEALTH SPENDING
Per-capita public health spending has increased more than two fold since 2006/07. In the period
2007/08 to 2009/10 this growth was between 25 - 29% each year, while growth slowed to 12% in
the current year (Figure 10).
Figure 10–Per-capita spending 2006/07 – 2010/11 (NRs.)
283.0
361.6
464.9
578.9
649.9
0.0
100.0
200.0
300.0
400.0
500.0
600.0
700.0
2006/07 2007/08 2008/09 2009/10 2010/11
NR
s.
Fiscal Year
Per-capita spending
Page | 19
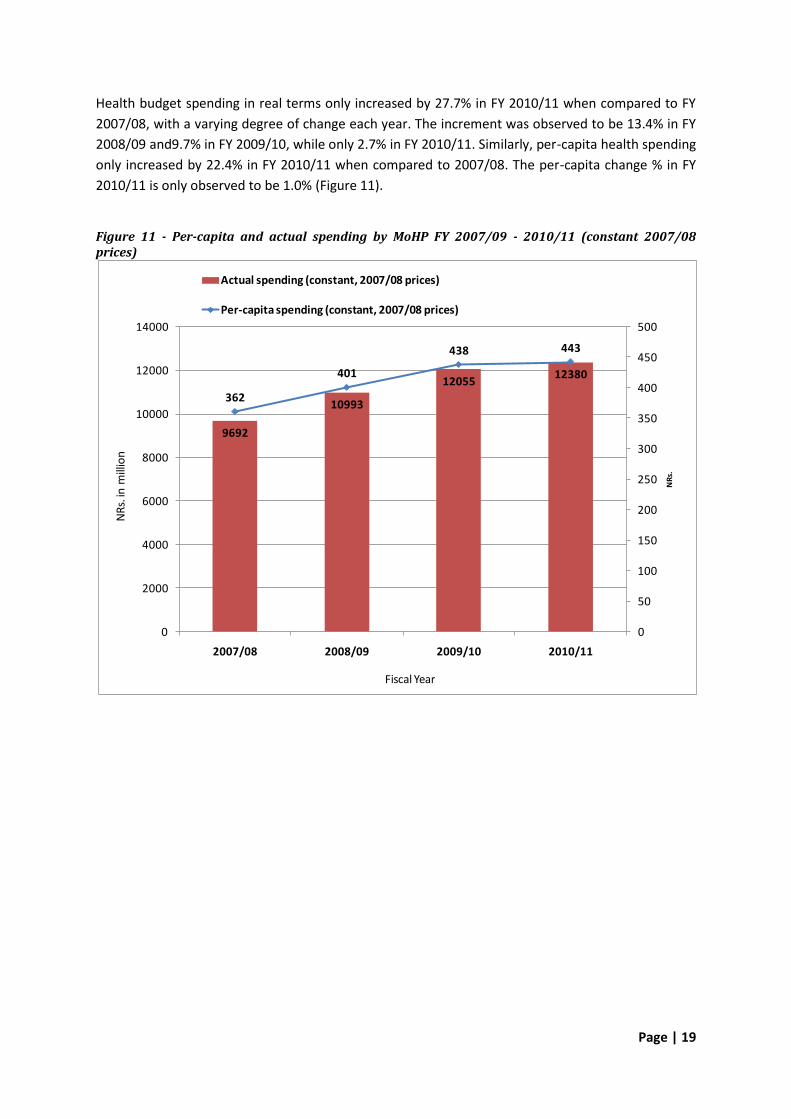
Health budget spending in real terms only increased by 27.7% in FY 2010/11 when compared to FY
2007/08, with a varying degree of change each year. The increment was observed to be 13.4% in FY
2008/09 and9.7% in FY 2009/10, while only 2.7% in FY 2010/11. Similarly, per-capita health spending
only increased by 22.4% in FY 2010/11 when compared to 2007/08. The per-capita change % in FY
2010/11 is only observed to be 1.0% (Figure 11).
Figure 11 - Per-capita and actual spending by MoHP FY 2007/09 - 2010/11 (constant 2007/08 prices)
9692
10993
1205512380
362
401
438 443
0
50
100
150
200
250
300
350
400
450
500
0
2000
4000
6000
8000
10000
12000
14000
2007/08 2008/09 2009/10 2010/11N
Rs.
NR
s. in
mill
ion
Fiscal Year
Actual spending (constant, 2007/08 prices)
Per-capita spending (constant, 2007/08 prices)
Page | 20
3.2 PER-CAPITA PUBLIC SPENDING ON HEALTH BY DISTRICT
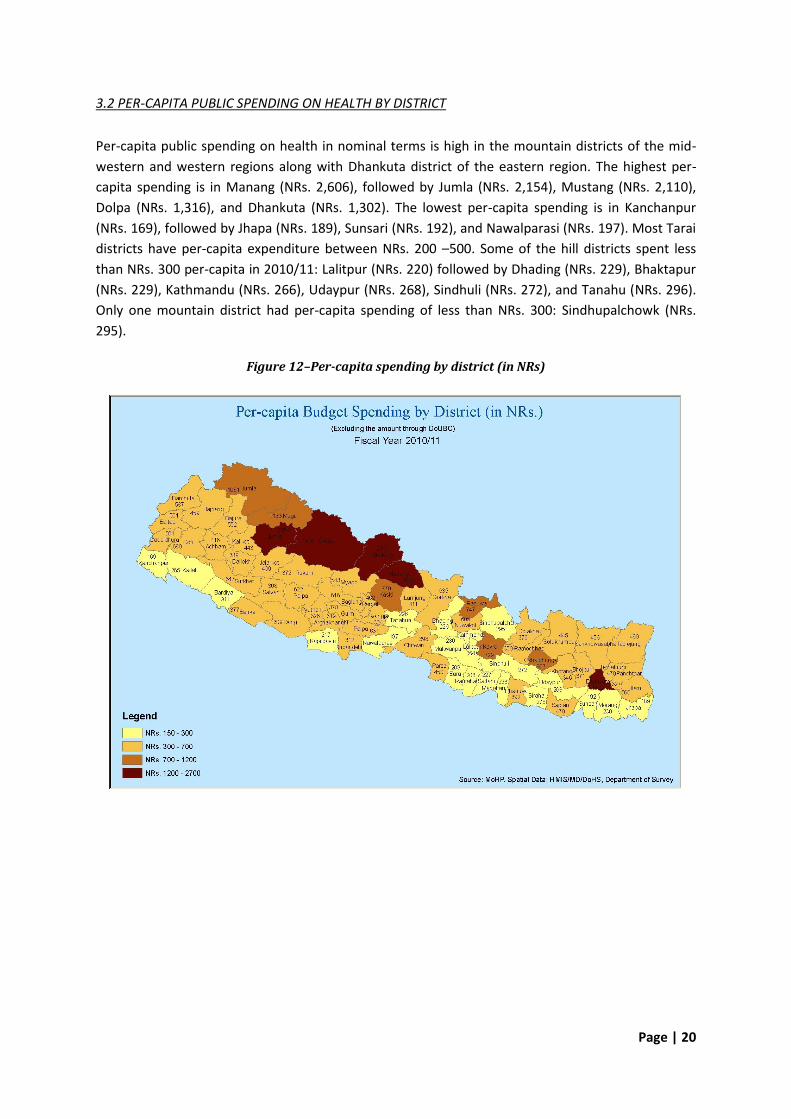
Per-capita public spending on health in nominal terms is high in the mountain districts of the mid-
western and western regions along with Dhankuta district of the eastern region. The highest per-
capita spending is in Manang (NRs. 2,606), followed by Jumla (NRs. 2,154), Mustang (NRs. 2,110),
Dolpa (NRs. 1,316), and Dhankuta (NRs. 1,302). The lowest per-capita spending is in Kanchanpur
(NRs. 169), followed by Jhapa (NRs. 189), Sunsari (NRs. 192), and Nawalparasi (NRs. 197). Most Tarai
districts have per-capita expenditure between NRs. 200 –500. Some of the hill districts spent less
than NRs. 300 per-capita in 2010/11: Lalitpur (NRs. 220) followed by Dhading (NRs. 229), Bhaktapur
(NRs. 229), Kathmandu (NRs. 266), Udaypur (NRs. 268), Sindhuli (NRs. 272), and Tanahu (NRs. 296).
Only one mountain district had per-capita spending of less than NRs. 300: Sindhupalchowk (NRs.
295).
Figure 12–Per-capita spending by district (in NRs)
Page | 21
3.3 ABSORPTION CAPACITY
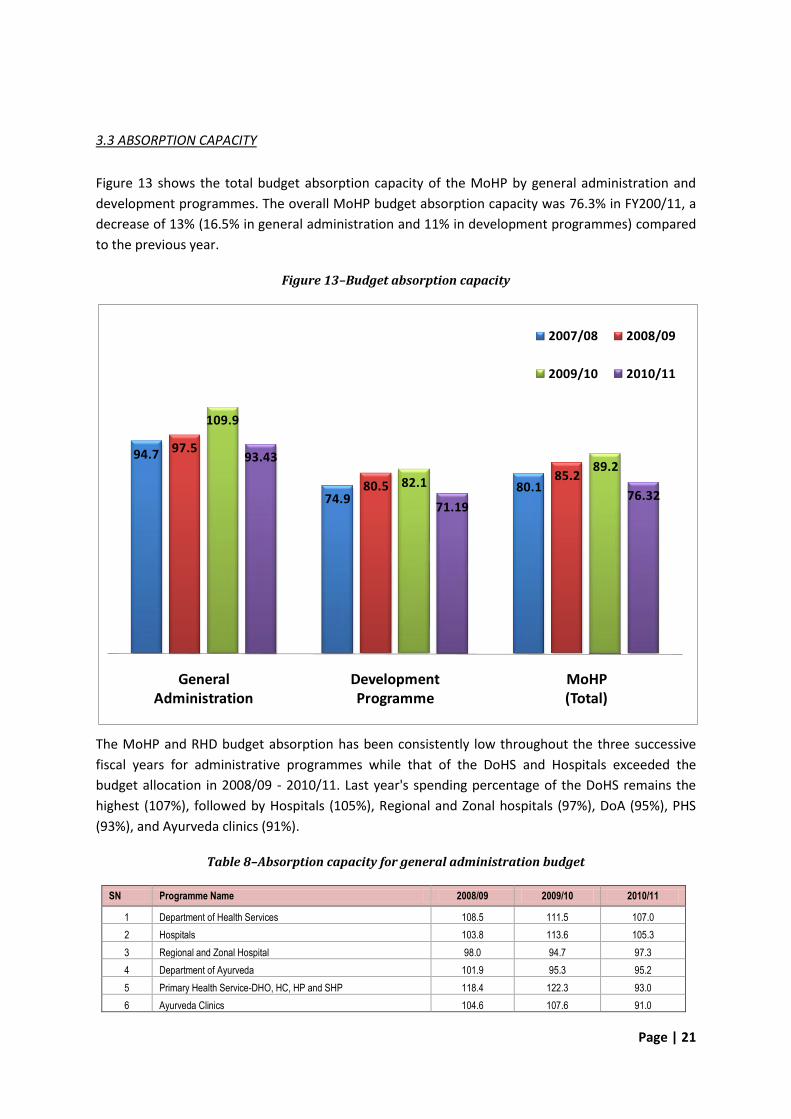
Figure 13 shows the total budget absorption capacity of the MoHP by general administration and
development programmes. The overall MoHP budget absorption capacity was 76.3% in FY200/11, a
decrease of 13% (16.5% in general administration and 11% in development programmes) compared
to the previous year.
Figure 13–Budget absorption capacity
The MoHP and RHD budget absorption has been consistently low throughout the three successive
fiscal years for administrative programmes while that of the DoHS and Hospitals exceeded the
budget allocation in 2008/09 - 2010/11. Last year's spending percentage of the DoHS remains the
highest (107%), followed by Hospitals (105%), Regional and Zonal hospitals (97%), DoA (95%), PHS
(93%), and Ayurveda clinics (91%).
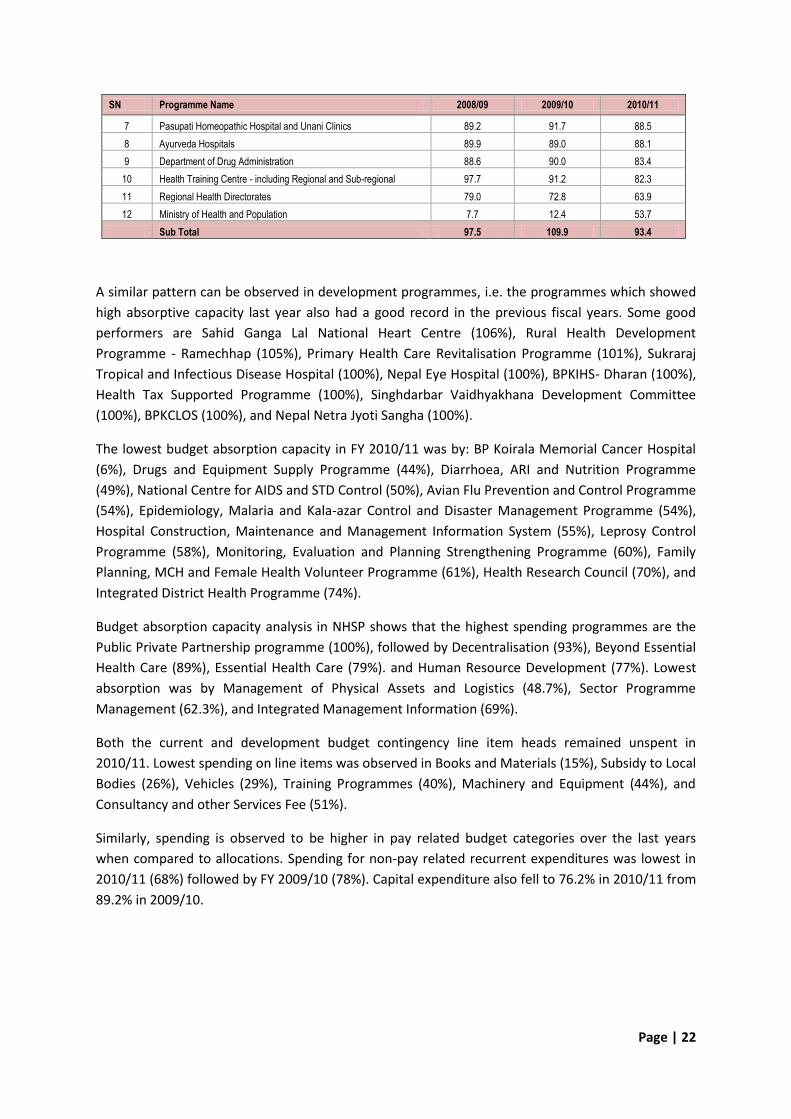
Table 8–Absorption capacity for general administration budget
SN Programme Name 2008/09 2009/10 2010/11
1 Department of Health Services 108.5 111.5 107.0
2 Hospitals 103.8 113.6 105.3
3 Regional and Zonal Hospital 98.0 94.7 97.3
4 Department of Ayurveda 101.9 95.3 95.2
5 Primary Health Service-DHO, HC, HP and SHP 118.4 122.3 93.0
6 Ayurveda Clinics 104.6 107.6 91.0
94.7
74.980.1
97.5
80.585.2
109.9
82.189.2
93.43
71.1976.32
General Administration
Development Programme
MoHP (Total)
2007/08 2008/09
2009/10 2010/11
Page | 22
SN Programme Name 2008/09 2009/10 2010/11
7 Pasupati Homeopathic Hospital and Unani Clinics 89.2 91.7 88.5
8 Ayurveda Hospitals 89.9 89.0 88.1
9 Department of Drug Administration 88.6 90.0 83.4
10 Health Training Centre - including Regional and Sub-regional 97.7 91.2 82.3
11 Regional Health Directorates 79.0 72.8 63.9
12 Ministry of Health and Population 7.7 12.4 53.7
Sub Total 97.5 109.9 93.4
A similar pattern can be observed in development programmes, i.e. the programmes which showed
high absorptive capacity last year also had a good record in the previous fiscal years. Some good
performers are Sahid Ganga Lal National Heart Centre (106%), Rural Health Development
Programme - Ramechhap (105%), Primary Health Care Revitalisation Programme (101%), Sukraraj
Tropical and Infectious Disease Hospital (100%), Nepal Eye Hospital (100%), BPKIHS- Dharan (100%),
Health Tax Supported Programme (100%), Singhdarbar Vaidhyakhana Development Committee
(100%), BPKCLOS (100%), and Nepal Netra Jyoti Sangha (100%).
The lowest budget absorption capacity in FY 2010/11 was by: BP Koirala Memorial Cancer Hospital
(6%), Drugs and Equipment Supply Programme (44%), Diarrhoea, ARI and Nutrition Programme
(49%), National Centre for AIDS and STD Control (50%), Avian Flu Prevention and Control Programme
(54%), Epidemiology, Malaria and Kala-azar Control and Disaster Management Programme (54%),
Hospital Construction, Maintenance and Management Information System (55%), Leprosy Control
Programme (58%), Monitoring, Evaluation and Planning Strengthening Programme (60%), Family
Planning, MCH and Female Health Volunteer Programme (61%), Health Research Council (70%), and
Integrated District Health Programme (74%).
Budget absorption capacity analysis in NHSP shows that the highest spending programmes are the
Public Private Partnership programme (100%), followed by Decentralisation (93%), Beyond Essential
Health Care (89%), Essential Health Care (79%). and Human Resource Development (77%). Lowest
absorption was by Management of Physical Assets and Logistics (48.7%), Sector Programme
Management (62.3%), and Integrated Management Information (69%).
Both the current and development budget contingency line item heads remained unspent in
2010/11. Lowest spending on line items was observed in Books and Materials (15%), Subsidy to Local
Bodies (26%), Vehicles (29%), Training Programmes (40%), Machinery and Equipment (44%), and
Consultancy and other Services Fee (51%).
Similarly, spending is observed to be higher in pay related budget categories over the last years
when compared to allocations. Spending for non-pay related recurrent expenditures was lowest in
2010/11 (68%) followed by FY 2009/10 (78%). Capital expenditure also fell to 76.2% in 2010/11 from
89.2% in 2009/10.
Page | 23
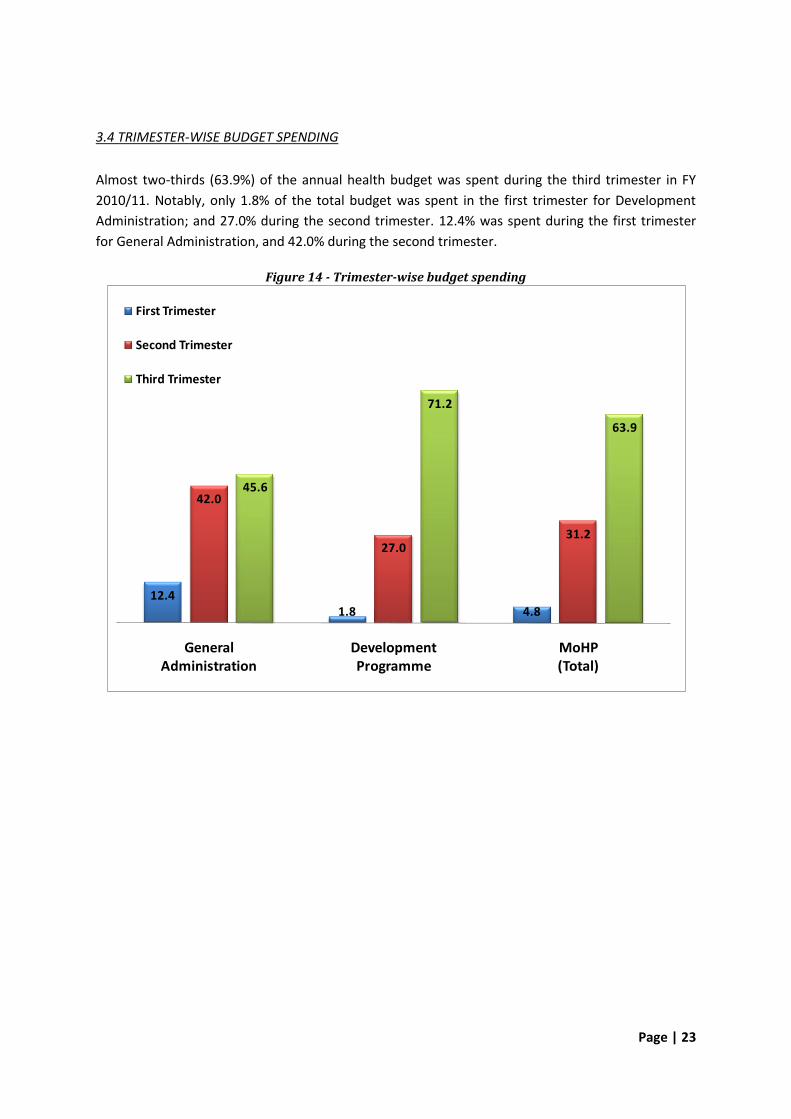
3.4 TRIMESTER-WISE BUDGET SPENDING
Almost two-thirds (63.9%) of the annual health budget was spent during the third trimester in FY
2010/11. Notably, only 1.8% of the total budget was spent in the first trimester for Development
Administration; and 27.0% during the second trimester. 12.4% was spent during the first trimester
for General Administration, and 42.0% during the second trimester.
Figure 14 - Trimester-wise budget spending
12.41.8 4.8
42.0
27.031.2
45.6
71.2
63.9
General Administration
Development Programme
MoHP (Total)
First Trimester
Second Trimester
Third Trimester

Page | 24
CHAPTER IV SUMMARY, DISCUSSION AND RECOMMENDATIONS
4.1 OBJECTIVE
This analysis set out to examine the allocation of resources between different providers and
services. It aims to provide law makers, policy formulators and programme managers with relevant
information on this year’s budget, with a view to supporting the preparation of future budgets and
to provide and analyse disaggregated 2011/12 health budget data.
4.2 DISCUSSION
The health budget as a share of total government budgeted expenditure is 7.1% in FY 2011/12.
However, this picture is biased by an allocation of NRs. 1.65 billion by the MoF for health sector staff
retirement benefits, which wasn’t made in previous fiscal years. Without the MoF allocation, the
health sector’s share of total government resources is only 6.66%. In FY 2010/11 it was 7.28%.
The budget absorption capacity of MoHP was only 76.3% in FY2010/11, down from 89.2% in the
previous year. This poor performance may, in part, explain the current year’s decrease in health
budget allocation out of the total government budget .In some instances the MoHP has decreased
budgets of low spenders. The Drugs and Equipment Supply programme, for example, spent 44% of
its budget in FY 2010/11, and its FY 2011/12 budget was cut by 51.15%. However, some programmes
such as the National Centre for AIDS and STD Control have received a 124% budget increase while
they only spent 50% of last year’s budget. In general there seems not to be an evident arithmetic
relationship between programme absorption capacity and percentage change in budget allocation
over fiscal years (correlation coefficient of 0.08 over 16 observations).
The budget allocation for the Department of Drug Administration and Hospitals decreased slightly in
the current year. This decrease seems at odds with the growing demand for drugs and advanced
specialised health services.
The allocation to districts, as opposed to central level, has increased significantly in the last three
years and currently stands at 59.5%. However, only 32.9% of the national budget is directly allocated
to districts; the remaining26.6% is indirectly allocated in cash and kind out of central level budgets.
There is some level of unpredictability regarding how the indirect budget will be allocated over
districts, which may hinder rational sector planning.
The share of government funding of the total health budget has gradually increased over the years,
thereby decreasing donor dependency. At the same time, the MoHP absorption capacity was only
76% in FY 2010/11. This may imply that government rules and procedures stand in the way of
efficient budget management, a topic that warrants further investigation.
Although women and poverty have been given adequate attention in budgeting, other gender and
social inclusion related issues put forward in GESI and NHSP-2 have been largely neglected.
Page | 25
4.3 RECOMMENDATIONS
To achieve a budget for the health sector in line with the NHSP-2 projections, the MoHP should
improve its absorptive capacity and resource allocation processes, as well as improve its
coordination and dialogue with the MoF and NPC.
The MoHP should increase value for money by developing a better understanding of the
efficiency of different MoHP programmes, and increasing resource allocations towards the most
cost-effective areas.
MoHP should develop a standard budget allocation policy to be followed by central units in the
allocation of resources to districts.
The Government and the MoHP should simplify budgetary processes, rules and regulations to
improve timely budget execution and increase the budget absorption rate.

Annexures
Page | 28
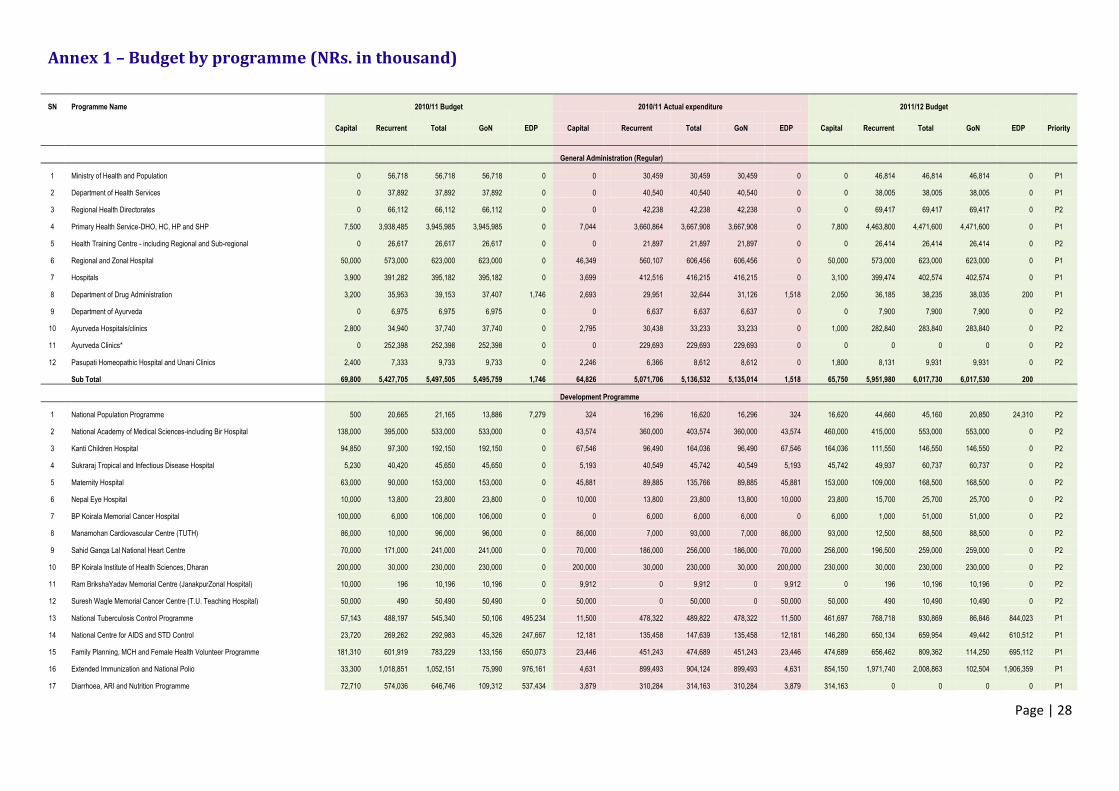
Annex 1 – Budget by programme (NRs. in thousand)
SN Programme Name 2010/11 Budget 2010/11 Actual expenditure 2011/12 Budget
Capital Recurrent Total GoN EDP Capital Recurrent Total GoN EDP Capital Recurrent Total GoN EDP Priority
General Administration (Regular)
1 Ministry of Health and Population 0 56,718 56,718 56,718 0 0 30,459 30,459 30,459 0 0 46,814 46,814 46,814 0 P1
2 Department of Health Services 0 37,892 37,892 37,892 0 0 40,540 40,540 40,540 0 0 38,005 38,005 38,005 0 P1
3 Regional Health Directorates 0 66,112 66,112 66,112 0 0 42,238 42,238 42,238 0 0 69,417 69,417 69,417 0 P2
4 Primary Health Service-DHO, HC, HP and SHP 7,500 3,938,485 3,945,985 3,945,985 0 7,044 3,660,864 3,667,908 3,667,908 0 7,800 4,463,800 4,471,600 4,471,600 0 P1
5 Health Training Centre - including Regional and Sub-regional 0 26,617 26,617 26,617 0 0 21,897 21,897 21,897 0 0 26,414 26,414 26,414 0 P2
6 Regional and Zonal Hospital 50,000 573,000 623,000 623,000 0 46,349 560,107 606,456 606,456 0 50,000 573,000 623,000 623,000 0 P1
7 Hospitals 3,900 391,282 395,182 395,182 0 3,699 412,516 416,215 416,215 0 3,100 399,474 402,574 402,574 0 P1
8 Department of Drug Administration 3,200 35,953 39,153 37,407 1,746 2,693 29,951 32,644 31,126 1,518 2,050 36,185 38,235 38,035 200 P1
9 Department of Ayurveda 0 6,975 6,975 6,975 0 0 6,637 6,637 6,637 0 0 7,900 7,900 7,900 0 P2
10 Ayurveda Hospitals/clinics 2,800 34,940 37,740 37,740 0 2,795 30,438 33,233 33,233 0 1,000 282,840 283,840 283,840 0 P2
11 Ayurveda Clinics* 0 252,398 252,398 252,398 0 0 229,693 229,693 229,693 0 0 0 0 0 0 P2
12 Pasupati Homeopathic Hospital and Unani Clinics 2,400 7,333 9,733 9,733 0 2,246 6,366 8,612 8,612 0 1,800 8,131 9,931 9,931 0 P2
Sub Total 69,800 5,427,705 5,497,505 5,495,759 1,746 64,826 5,071,706 5,136,532 5,135,014 1,518 65,750 5,951,980 6,017,730 6,017,530 200
Development Programme
1 National Population Programme 500 20,665 21,165 13,886 7,279 324 16,296 16,620 16,296 324 16,620 44,660 45,160 20,850 24,310 P2
2 National Academy of Medical Sciences-including Bir Hospital 138,000 395,000 533,000 533,000 0 43,574 360,000 403,574 360,000 43,574 460,000 415,000 553,000 553,000 0 P2
3 Kanti Children Hospital 94,850 97,300 192,150 192,150 0 67,546 96,490 164,036 96,490 67,546 164,036 111,550 146,550 146,550 0 P2
4 Sukraraj Tropical and Infectious Disease Hospital 5,230 40,420 45,650 45,650 0 5,193 40,549 45,742 40,549 5,193 45,742 49,937 60,737 60,737 0 P2
5 Maternity Hospital 63,000 90,000 153,000 153,000 0 45,881 89,885 135,766 89,885 45,881 153,000 109,000 168,500 168,500 0 P2
6 Nepal Eye Hospital 10,000 13,800 23,800 23,800 0 10,000 13,800 23,800 13,800 10,000 23,800 15,700 25,700 25,700 0 P2
7 BP Koirala Memorial Cancer Hospital 100,000 6,000 106,000 106,000 0 0 6,000 6,000 6,000 0 6,000 1,000 51,000 51,000 0 P2
8 Manamohan Cardiovascular Centre (TUTH) 86,000 10,000 96,000 96,000 0 86,000 7,000 93,000 7,000 86,000 93,000 12,500 88,500 88,500 0 P2
9 Sahid Ganga Lal National Heart Centre 70,000 171,000 241,000 241,000 0 70,000 186,000 256,000 186,000 70,000 256,000 196,500 259,000 259,000 0 P2
10 BP Koirala Institute of Health Sciences, Dharan 200,000 30,000 230,000 230,000 0 200,000 30,000 230,000 30,000 200,000 230,000 30,000 230,000 230,000 0 P2
11 Ram BrikshaYadav Memorial Centre (JanakpurZonal Hospital) 10,000 196 10,196 10,196 0 9,912 0 9,912 0 9,912 0 196 10,196 10,196 0 P2
12 Suresh Wagle Memorial Cancer Centre (T.U. Teaching Hospital) 50,000 490 50,490 50,490 0 50,000 0 50,000 0 50,000 50,000 490 10,490 10,490 0 P2
13 National Tuberculosis Control Programme 57,143 488,197 545,340 50,106 495,234 11,500 478,322 489,822 478,322 11,500 461,697 768,718 930,869 86,846 844,023 P1
14 National Centre for AIDS and STD Control 23,720 269,262 292,983 45,326 247,667 12,181 135,458 147,639 135,458 12,181 146,280 650,134 659,954 49,442 610,512 P1
15 Family Planning, MCH and Female Health Volunteer Programme 181,310 601,919 783,229 133,156 650,073 23,446 451,243 474,689 451,243 23,446 474,689 656,462 809,362 114,250 695,112 P1
16 Extended Immunization and National Polio 33,300 1,018,851 1,052,151 75,990 976,161 4,631 899,493 904,124 899,493 4,631 854,150 1,971,740 2,008,863 102,504 1,906,359 P1
17 Diarrhoea, ARI and Nutrition Programme 72,710 574,036 646,746 109,312 537,434 3,879 310,284 314,163 310,284 3,879 314,163 0 0 0 0 P1
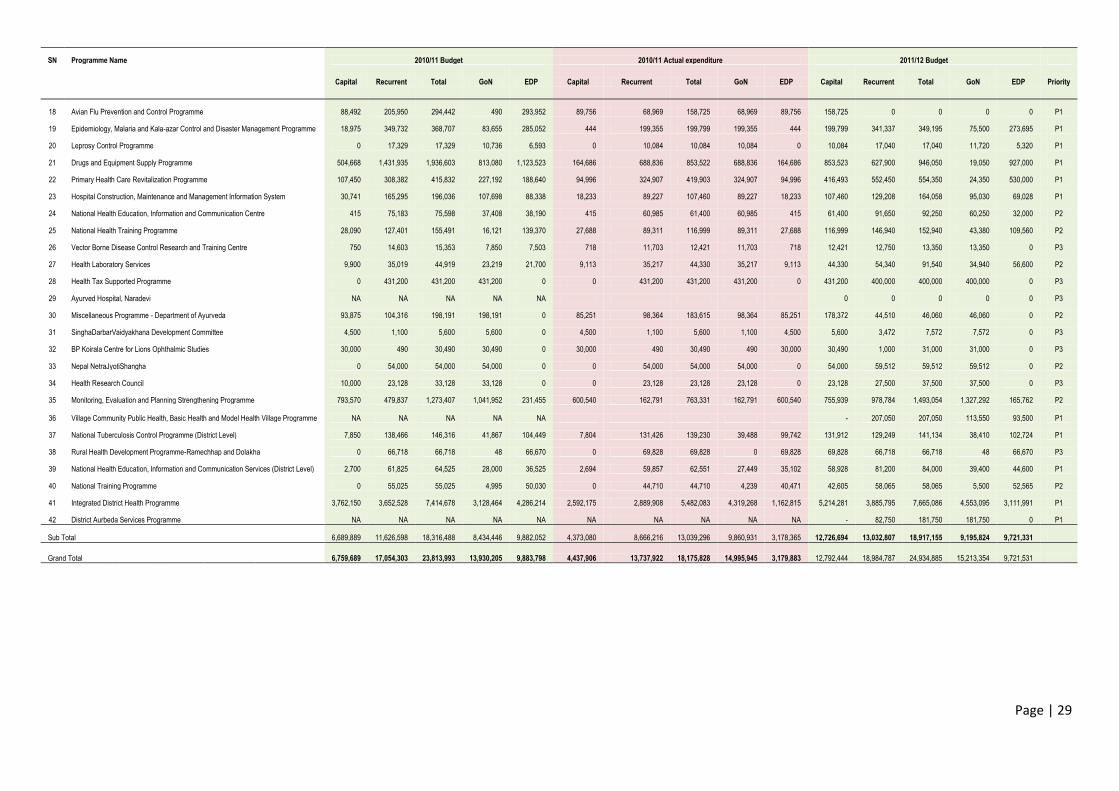
Page | 29
SN Programme Name 2010/11 Budget 2010/11 Actual expenditure 2011/12 Budget
Capital Recurrent Total GoN EDP Capital Recurrent Total GoN EDP Capital Recurrent Total GoN EDP Priority
18 Avian Flu Prevention and Control Programme 88,492 205,950 294,442 490 293,952 89,756 68,969 158,725 68,969 89,756 158,725 0 0 0 0 P1
19 Epidemiology, Malaria and Kala-azar Control and Disaster Management Programme 18,975 349,732 368,707 83,655 285,052 444 199,355 199,799 199,355 444 199,799 341,337 349,195 75,500 273,695 P1
20 Leprosy Control Programme 0 17,329 17,329 10,736 6,593 0 10,084 10,084 10,084 0 10,084 17,040 17,040 11,720 5,320 P1
21 Drugs and Equipment Supply Programme 504,668 1,431,935 1,936,603 813,080 1,123,523 164,686 688,836 853,522 688,836 164,686 853,523 627,900 946,050 19,050 927,000 P1
22 Primary Health Care Revitalization Programme 107,450 308,382 415,832 227,192 188,640 94,996 324,907 419,903 324,907 94,996 416,493 552,450 554,350 24,350 530,000 P1
23 Hospital Construction, Maintenance and Management Information System 30,741 165,295 196,036 107,698 88,338 18,233 89,227 107,460 89,227 18,233 107,460 129,208 164,058 95,030 69,028 P1
24 National Health Education, Information and Communication Centre 415 75,183 75,598 37,408 38,190 415 60,985 61,400 60,985 415 61,400 91,650 92,250 60,250 32,000 P2
25 National Health Training Programme 28,090 127,401 155,491 16,121 139,370 27,688 89,311 116,999 89,311 27,688 116,999 146,940 152,940 43,380 109,560 P2
26 Vector Borne Disease Control Research and Training Centre 750 14,603 15,353 7,850 7,503 718 11,703 12,421 11,703 718 12,421 12,750 13,350 13,350 0 P3
27 Health Laboratory Services 9,900 35,019 44,919 23,219 21,700 9,113 35,217 44,330 35,217 9,113 44,330 54,340 91,540 34,940 56,600 P2
28 Health Tax Supported Programme 0 431,200 431,200 431,200 0 0 431,200 431,200 431,200 0 431,200 400,000 400,000 400,000 0 P3
29 Ayurved Hospital, Naradevi NA NA NA NA NA 0 0 0 0 0 P3
30 Miscellaneous Programme - Department of Ayurveda 93,875 104,316 198,191 198,191 0 85,251 98,364 183,615 98,364 85,251 178,372 44,510 46,060 46,060 0 P2
31 SinghaDarbarVaidyakhana Development Committee 4,500 1,100 5,600 5,600 0 4,500 1,100 5,600 1,100 4,500 5,600 3,472 7,572 7,572 0 P3
32 BP Koirala Centre for Lions Ophthalmic Studies 30,000 490 30,490 30,490 0 30,000 490 30,490 490 30,000 30,490 1,000 31,000 31,000 0 P3
33 Nepal NetraJyotiShangha 0 54,000 54,000 54,000 0 0 54,000 54,000 54,000 0 54,000 59,512 59,512 59,512 0 P2
34 Health Research Council 10,000 23,128 33,128 33,128 0 0 23,128 23,128 23,128 0 23,128 27,500 37,500 37,500 0 P3
35 Monitoring, Evaluation and Planning Strengthening Programme 793,570 479,837 1,273,407 1,041,952 231,455 600,540 162,791 763,331 162,791 600,540 755,939 978,784 1,493,054 1,327,292 165,762 P2
36 Village Community Public Health, Basic Health and Model Health Village Programme NA NA NA NA NA - 207,050 207,050 113,550 93,500 P1
37 National Tuberculosis Control Programme (District Level) 7,850 138,466 146,316 41,867 104,449 7,804 131,426 139,230 39,488 99,742 131,912 129,249 141,134 38,410 102,724 P1
38 Rural Health Development Programme-Ramechhap and Dolakha 0 66,718 66,718 48 66,670 0 69,828 69,828 0 69,828 69,828 66,718 66,718 48 66,670 P3
39 National Health Education, Information and Communication Services (District Level) 2,700 61,825 64,525 28,000 36,525 2,694 59,857 62,551 27,449 35,102 58,928 81,200 84,000 39,400 44,600 P1
40 National Training Programme 0 55,025 55,025 4,995 50,030 0 44,710 44,710 4,239 40,471 42,605 58,065 58,065 5,500 52,565 P2
41 Integrated District Health Programme 3,762,150 3,652,528 7,414,678 3,128,464 4,286,214 2,592,175 2,889,908 5,482,083 4,319,268 1,162,815 5,214,281 3,885,795 7,665,086 4,553,095 3,111,991 P1
42 District Aurbeda Services Programme NA NA NA NA NA NA NA NA NA NA - 82,750 181,750 181,750 0 P1
Sub Total 6,689,889 11,626,598 18,316,488 8,434,446 9,882,052 4,373,080 8,666,216 13,039,296 9,860,931 3,178,365 12,726,694 13,032,807 18,917,155 9,195,824 9,721,331
Grand Total 6,759,689 17,054,303 23,813,993 13,930,205 9,883,798 4,437,906 13,737,922 18,175,828 14,995,945 3,179,883 12,792,444 18,984,787 24,934,885 15,213,354 9,721,531
Page | 30
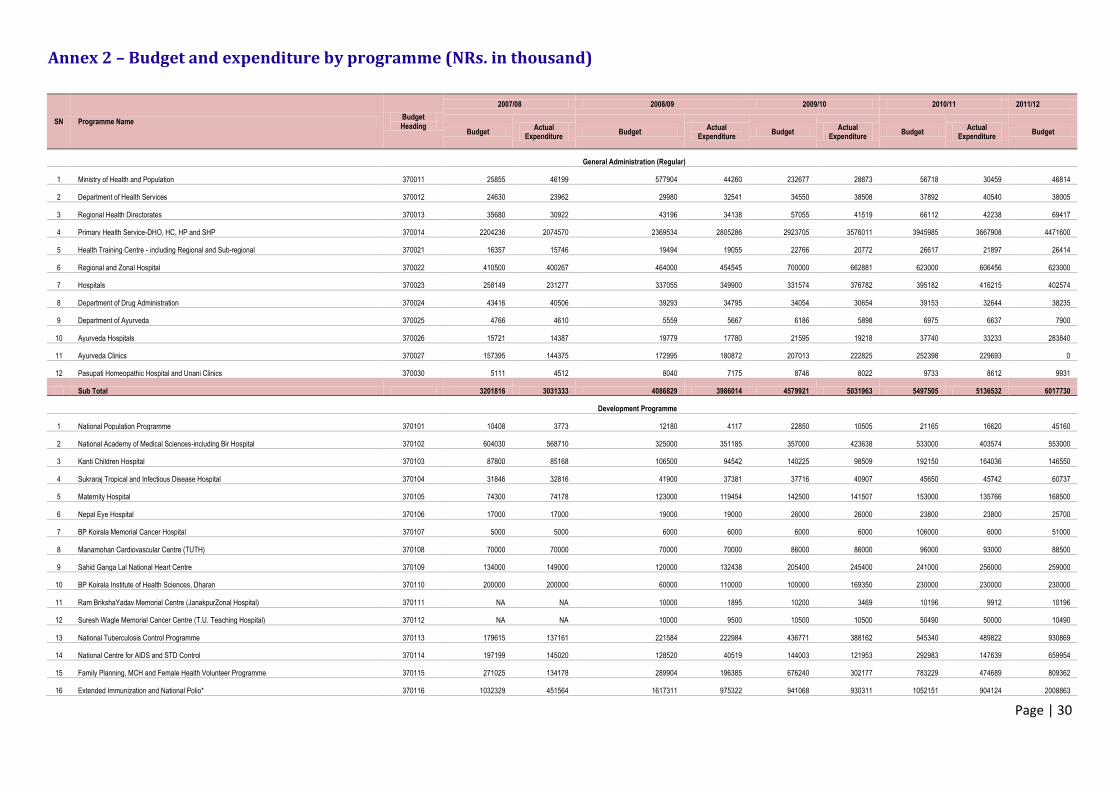
Annex 2 – Budget and expenditure by programme (NRs. in thousand)
SN Programme Name Budget Heading
2007/08 2008/09 2009/10 2010/11 2011/12
Budget Actual
Expenditure Budget
Actual Expenditure
Budget Actual
Expenditure Budget
Actual Expenditure
Budget
General Administration (Regular)
1 Ministry of Health and Population 370011 25855 46199 577904 44260 232677 28873 56718 30459 46814
2 Department of Health Services 370012 24630 23962 29980 32541 34550 38508 37892 40540 38005
3 Regional Health Directorates 370013 35680 30922 43196 34138 57055 41519 66112 42238 69417
4 Primary Health Service-DHO, HC, HP and SHP 370014 2204236 2074570 2369534 2805286 2923705 3576011 3945985 3667908 4471600
5 Health Training Centre - including Regional and Sub-regional 370021 16357 15746 19494 19055 22766 20772 26617 21897 26414
6 Regional and Zonal Hospital 370022 410500 400267 464000 454545 700000 662881 623000 606456 623000
7 Hospitals 370023 258149 231277 337055 349900 331574 376782 395182 416215 402574
8 Department of Drug Administration 370024 43416 40506 39293 34795 34054 30654 39153 32644 38235
9 Department of Ayurveda 370025 4766 4610 5559 5667 6186 5898 6975 6637 7900
10 Ayurveda Hospitals 370026 15721 14387 19779 17780 21595 19218 37740 33233 283840
11 Ayurveda Clinics 370027 157395 144375 172995 180872 207013 222825 252398 229693 0
12 Pasupati Homeopathic Hospital and Unani Clinics 370030 5111 4512 8040 7175 8746 8022 9733 8612 9931
Sub Total 3201816 3031333 4086829 3986014 4579921 5031963 5497505 5136532 6017730
Development Programme
1 National Population Programme 370101 10408 3773 12180 4117 22850 10505 21165 16620 45160
2 National Academy of Medical Sciences-including Bir Hospital 370102 604030 568710 325000 351185 357000 423638 533000 403574 553000
3 Kanti Children Hospital 370103 87800 85168 106500 94542 140225 98509 192150 164036 146550
4 Sukraraj Tropical and Infectious Disease Hospital 370104 31846 32816 41900 37381 37716 40907 45650 45742 60737
5 Maternity Hospital 370105 74300 74178 123000 119454 142500 141507 153000 135766 168500
6 Nepal Eye Hospital 370106 17000 17000 19000 19000 26000 26000 23800 23800 25700
7 BP Koirala Memorial Cancer Hospital 370107 5000 5000 6000 6000 6000 6000 106000 6000 51000
8 Manamohan Cardiovascular Centre (TUTH) 370108 70000 70000 70000 70000 86000 86000 96000 93000 88500
9 Sahid Ganga Lal National Heart Centre 370109 134000 149000 120000 132438 205400 245400 241000 256000 259000
10 BP Koirala Institute of Health Sciences, Dharan 370110 200000 200000 60000 110000 100000 169350 230000 230000 230000
11 Ram BrikshaYadav Memorial Centre (JanakpurZonal Hospital) 370111 NA NA 10000 1895 10200 3469 10196 9912 10196
12 Suresh Wagle Memorial Cancer Centre (T.U. Teaching Hospital) 370112 NA NA 10000 9500 10500 10500 50490 50000 10490
13 National Tuberculosis Control Programme 370113 179615 137161 221584 222984 436771 388162 545340 489822 930869
14 National Centre for AIDS and STD Control 370114 197199 145020 128520 40519 144003 121953 292983 147639 659954
15 Family Planning, MCH and Female Health Volunteer Programme 370115 271025 134178 289904 196385 676240 302177 783229 474689 809362
16 Extended Immunization and National Polio* 370116 1032329 451564 1617311 975322 941068 930311 1052151 904124 2008863
Page | 31
SN Programme Name Budget Heading
2007/08 2008/09 2009/10 2010/11 2011/12
Budget Actual
Expenditure Budget
Actual Expenditure
Budget Actual
Expenditure Budget
Actual Expenditure
Budget
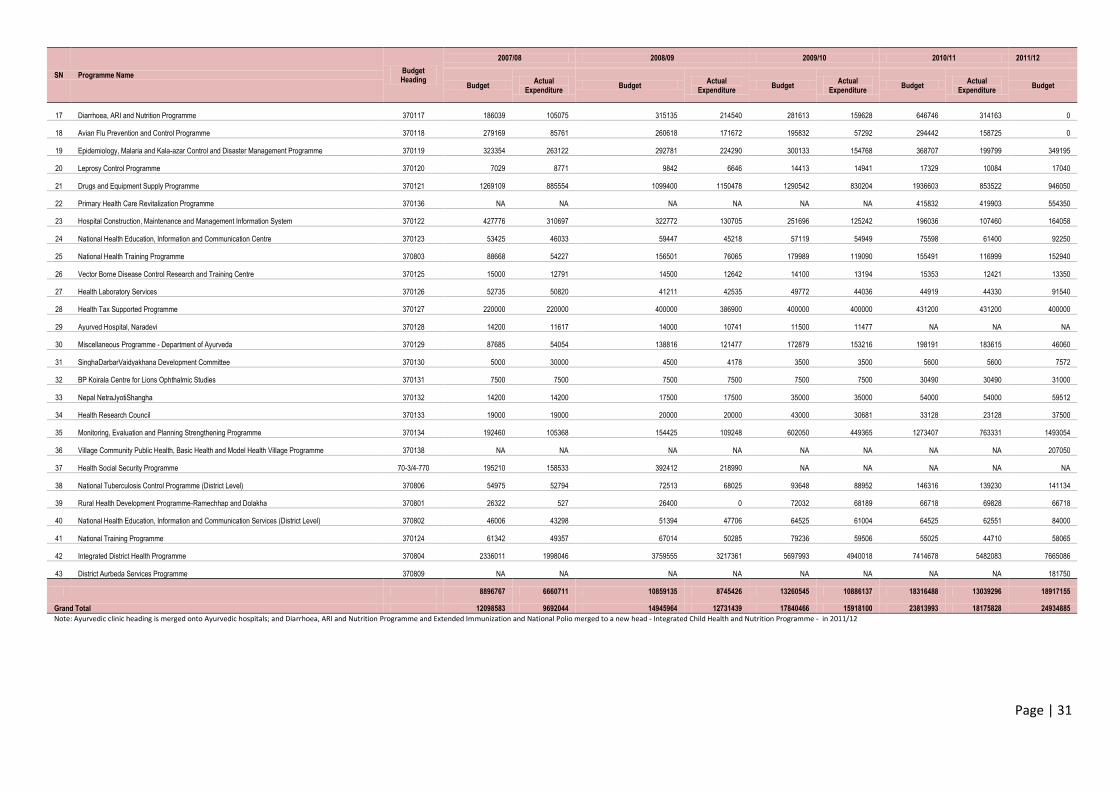
17 Diarrhoea, ARI and Nutrition Programme 370117 186039 105075 315135 214540 281613 159628 646746 314163 0
18 Avian Flu Prevention and Control Programme 370118 279169 85761 260618 171672 195832 57292 294442 158725 0
19 Epidemiology, Malaria and Kala-azar Control and Disaster Management Programme 370119 323354 263122 292781 224290 300133 154768 368707 199799 349195
20 Leprosy Control Programme 370120 7029 8771 9842 6646 14413 14941 17329 10084 17040
21 Drugs and Equipment Supply Programme 370121 1269109 885554 1099400 1150478 1290542 830204 1936603 853522 946050
22 Primary Health Care Revitalization Programme 370136 NA NA NA NA NA NA 415832 419903 554350
23 Hospital Construction, Maintenance and Management Information System 370122 427776 310697 322772 130705 251696 125242 196036 107460 164058
24 National Health Education, Information and Communication Centre 370123 53425 46033 59447 45218 57119 54949 75598 61400 92250
25 National Health Training Programme 370803 88668 54227 156501 76065 179989 119090 155491 116999 152940
26 Vector Borne Disease Control Research and Training Centre 370125 15000 12791 14500 12642 14100 13194 15353 12421 13350
27 Health Laboratory Services 370126 52735 50820 41211 42535 49772 44036 44919 44330 91540
28 Health Tax Supported Programme 370127 220000 220000 400000 386900 400000 400000 431200 431200 400000
29 Ayurved Hospital, Naradevi 370128 14200 11617 14000 10741 11500 11477 NA NA NA
30 Miscellaneous Programme - Department of Ayurveda 370129 87685 54054 138816 121477 172879 153216 198191 183615 46060
31 SinghaDarbarVaidyakhana Development Committee 370130 5000 30000 4500 4178 3500 3500 5600 5600 7572
32 BP Koirala Centre for Lions Ophthalmic Studies 370131 7500 7500 7500 7500 7500 7500 30490 30490 31000
33 Nepal NetraJyotiShangha 370132 14200 14200 17500 17500 35000 35000 54000 54000 59512
34 Health Research Council 370133 19000 19000 20000 20000 43000 30681 33128 23128 37500
35 Monitoring, Evaluation and Planning Strengthening Programme 370134 192460 105368 154425 109248 602050 449365 1273407 763331 1493054
36 Village Community Public Health, Basic Health and Model Health Village Programme 370138 NA NA NA NA NA NA NA NA 207050
37 Health Social Security Programme 70-3/4-770 195210 158533 392412 218990 NA NA NA NA NA
38 National Tuberculosis Control Programme (District Level) 370806 54975 52794 72513 68025 93648 88952 146316 139230 141134
39 Rural Health Development Programme-Ramechhap and Dolakha 370801 26322 527 26400 0 72032 68189 66718 69828 66718
40 National Health Education, Information and Communication Services (District Level) 370802 46006 43298 51394 47706 64525 61004 64525 62551 84000
41 National Training Programme 370124 61342 49357 67014 50285 79236 59506 55025 44710 58065
42 Integrated District Health Programme 370804 2336011 1998046 3759555 3217361 5697993 4940018 7414678 5482083 7665086
43 District Aurbeda Services Programme 370809 NA NA NA NA NA NA NA NA 181750
8896767 6660711 10859135 8745426 13260545 10886137 18316488 13039296 18917155
Grand Total 12098583 9692044 14945964 12731439 17840466 15918100 23813993 18175828 24934885
Note: Ayurvedic clinic heading is merged onto Ayurvedic hospitals; and Diarrhoea, ARI and Nutrition Programme and Extended Immunization and National Polio merged to a new head - Integrated Child Health and Nutrition Programme - in 2011/12
Page | 32
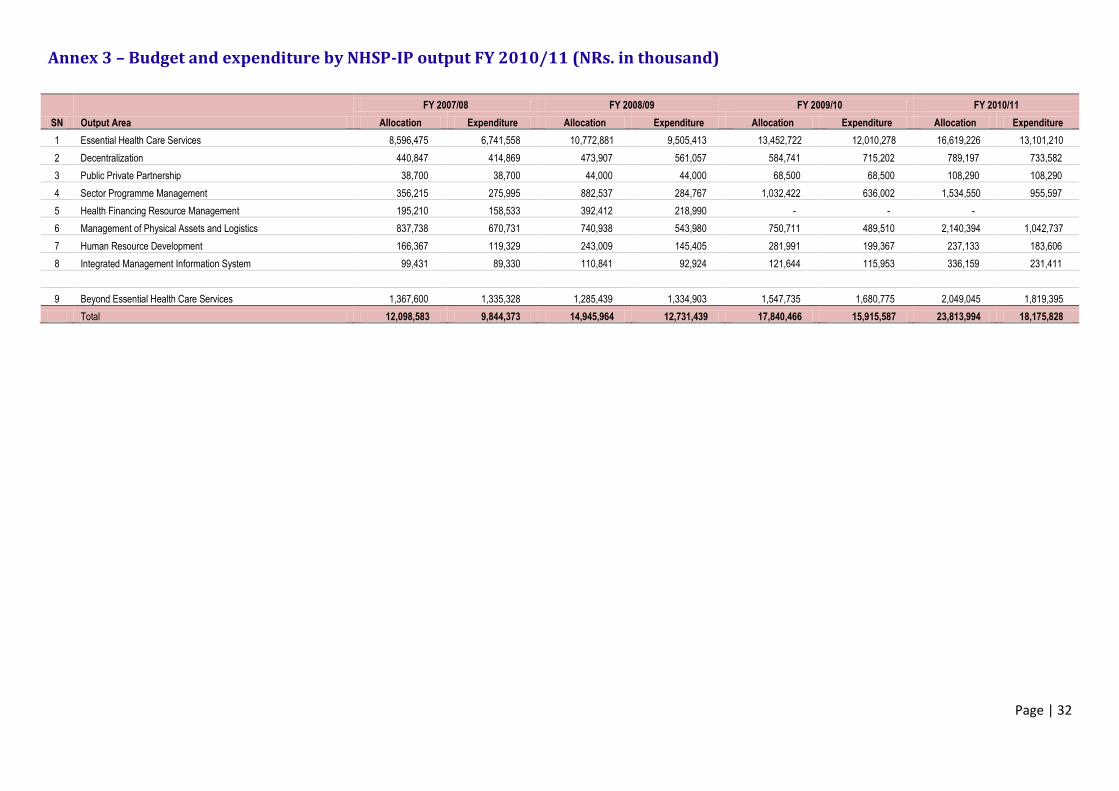
Annex 3 – Budget and expenditure by NHSP-IP output FY 2010/11 (NRs. in thousand)
SN Output Area
FY 2007/08 FY 2008/09 FY 2009/10 FY 2010/11
Allocation Expenditure Allocation Expenditure Allocation Expenditure Allocation Expenditure
1 Essential Health Care Services 8,596,475 6,741,558 10,772,881 9,505,413 13,452,722 12,010,278 16,619,226 13,101,210
2 Decentralization 440,847 414,869 473,907 561,057 584,741 715,202 789,197 733,582
3 Public Private Partnership 38,700 38,700 44,000 44,000 68,500 68,500 108,290 108,290
4 Sector Programme Management 356,215 275,995 882,537 284,767 1,032,422 636,002 1,534,550 955,597
5 Health Financing Resource Management 195,210 158,533 392,412 218,990 - - -
6 Management of Physical Assets and Logistics 837,738 670,731 740,938 543,980 750,711 489,510 2,140,394 1,042,737
7 Human Resource Development 166,367 119,329 243,009 145,405 281,991 199,367 237,133 183,606
8 Integrated Management Information System 99,431 89,330 110,841 92,924 121,644 115,953 336,159 231,411
9 Beyond Essential Health Care Services 1,367,600 1,335,328 1,285,439 1,334,903 1,547,735 1,680,775 2,049,045 1,819,395
Total 12,098,583 9,844,373 14,945,964 12,731,439 17,840,466 15,915,587 23,813,994 18,175,828
Page | 33
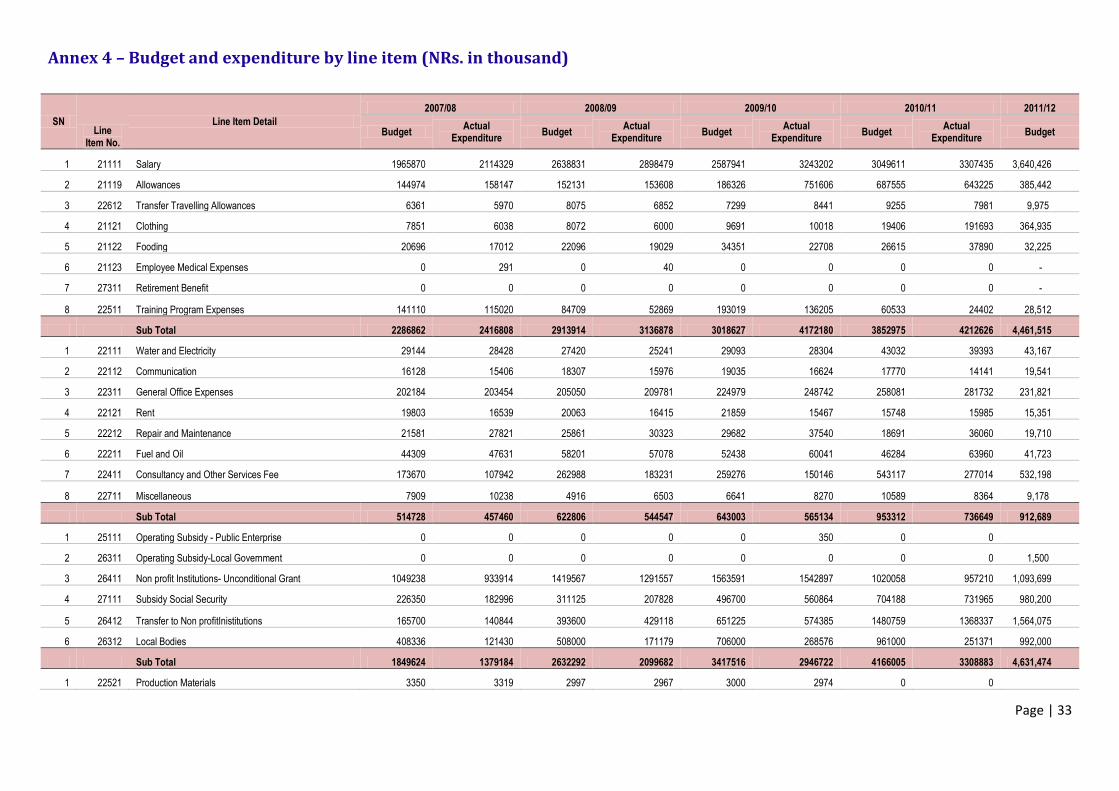
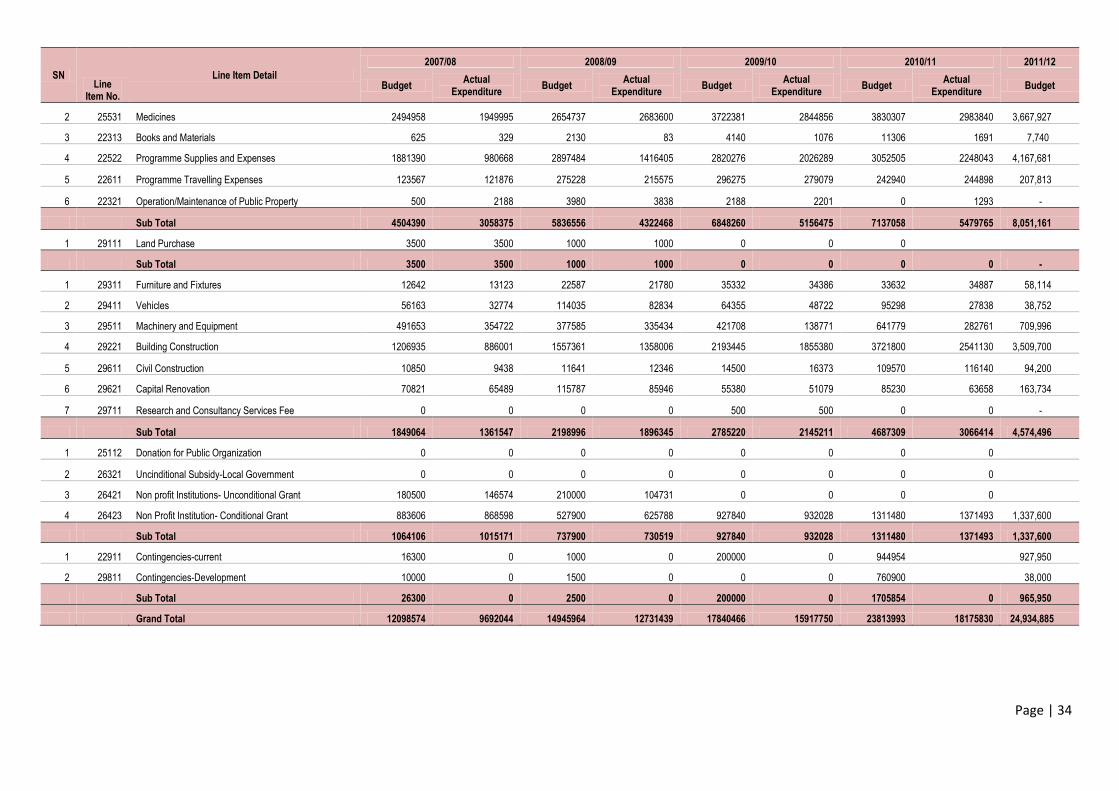
Annex 4 – Budget and expenditure by line item (NRs. in thousand)
SN Line
Item No.
Line Item Detail
2007/08 2008/09 2009/10 2010/11 2011/12
Budget Actual
Expenditure Budget
Actual Expenditure
Budget Actual
Expenditure Budget
Actual Expenditure
Budget
1 21111 Salary 1965870 2114329 2638831 2898479 2587941 3243202 3049611 3307435 3,640,426
2 21119 Allowances 144974 158147 152131 153608 186326 751606 687555 643225 385,442
3 22612 Transfer Travelling Allowances 6361 5970 8075 6852 7299 8441 9255 7981 9,975
4 21121 Clothing 7851 6038 8072 6000 9691 10018 19406 191693 364,935
5 21122 Fooding 20696 17012 22096 19029 34351 22708 26615 37890 32,225
6 21123 Employee Medical Expenses 0 291 0 40 0 0 0 0 -
7 27311 Retirement Benefit 0 0 0 0 0 0 0 0 -
8 22511 Training Program Expenses 141110 115020 84709 52869 193019 136205 60533 24402 28,512
Sub Total 2286862 2416808 2913914 3136878 3018627 4172180 3852975 4212626 4,461,515
1 22111 Water and Electricity 29144 28428 27420 25241 29093 28304 43032 39393 43,167
2 22112 Communication 16128 15406 18307 15976 19035 16624 17770 14141 19,541
3 22311 General Office Expenses 202184 203454 205050 209781 224979 248742 258081 281732 231,821
4 22121 Rent 19803 16539 20063 16415 21859 15467 15748 15985 15,351
5 22212 Repair and Maintenance 21581 27821 25861 30323 29682 37540 18691 36060 19,710
6 22211 Fuel and Oil 44309 47631 58201 57078 52438 60041 46284 63960 41,723
7 22411 Consultancy and Other Services Fee 173670 107942 262988 183231 259276 150146 543117 277014 532,198
8 22711 Miscellaneous 7909 10238 4916 6503 6641 8270 10589 8364 9,178
Sub Total 514728 457460 622806 544547 643003 565134 953312 736649 912,689
1 25111 Operating Subsidy - Public Enterprise 0 0 0 0 0 350 0 0
2 26311 Operating Subsidy-Local Government 0 0 0 0 0 0 0 0 1,500
3 26411 Non profit Institutions- Unconditional Grant 1049238 933914 1419567 1291557 1563591 1542897 1020058 957210 1,093,699
4 27111 Subsidy Social Security 226350 182996 311125 207828 496700 560864 704188 731965 980,200
5 26412 Transfer to Non profitInistitutions 165700 140844 393600 429118 651225 574385 1480759 1368337 1,564,075
6 26312 Local Bodies 408336 121430 508000 171179 706000 268576 961000 251371 992,000
Sub Total 1849624 1379184 2632292 2099682 3417516 2946722 4166005 3308883 4,631,474
1 22521 Production Materials 3350 3319 2997 2967 3000 2974 0 0
Page | 34
SN Line
Item No.
Line Item Detail
2007/08 2008/09 2009/10 2010/11 2011/12
Budget Actual
Expenditure Budget
Actual Expenditure
Budget Actual
Expenditure Budget
Actual Expenditure
Budget
2 25531 Medicines 2494958 1949995 2654737 2683600 3722381 2844856 3830307 2983840 3,667,927
3 22313 Books and Materials 625 329 2130 83 4140 1076 11306 1691 7,740
4 22522 Programme Supplies and Expenses 1881390 980668 2897484 1416405 2820276 2026289 3052505 2248043 4,167,681
5 22611 Programme Travelling Expenses 123567 121876 275228 215575 296275 279079 242940 244898 207,813
6 22321 Operation/Maintenance of Public Property 500 2188 3980 3838 2188 2201 0 1293 -
Sub Total 4504390 3058375 5836556 4322468 6848260 5156475 7137058 5479765 8,051,161
1 29111 Land Purchase 3500 3500 1000 1000 0 0 0
Sub Total 3500 3500 1000 1000 0 0 0 0 -
1 29311 Furniture and Fixtures 12642 13123 22587 21780 35332 34386 33632 34887 58,114
2 29411 Vehicles 56163 32774 114035 82834 64355 48722 95298 27838 38,752
3 29511 Machinery and Equipment 491653 354722 377585 335434 421708 138771 641779 282761 709,996
4 29221 Building Construction 1206935 886001 1557361 1358006 2193445 1855380 3721800 2541130 3,509,700
5 29611 Civil Construction 10850 9438 11641 12346 14500 16373 109570 116140 94,200
6 29621 Capital Renovation 70821 65489 115787 85946 55380 51079 85230 63658 163,734
7 29711 Research and Consultancy Services Fee 0 0 0 0 500 500 0 0 -
Sub Total 1849064 1361547 2198996 1896345 2785220 2145211 4687309 3066414 4,574,496
1 25112 Donation for Public Organization 0 0 0 0 0 0 0 0
2 26321 Uncinditional Subsidy-Local Government 0 0 0 0 0 0 0 0
3 26421 Non profit Institutions- Unconditional Grant 180500 146574 210000 104731 0 0 0 0
4 26423 Non Profit Institution- Conditional Grant 883606 868598 527900 625788 927840 932028 1311480 1371493 1,337,600
Sub Total 1064106 1015171 737900 730519 927840 932028 1311480 1371493 1,337,600
1 22911 Contingencies-current 16300 0 1000 0 200000 0 944954 927,950
2 29811 Contingencies-Development 10000 0 1500 0 0 0 760900 38,000
Sub Total 26300 0 2500 0 200000 0 1705854 0 965,950
Grand Total 12098574 9692044 14945964 12731439 17840466 15917750 23813993 18175830 24,934,885
Page | 35
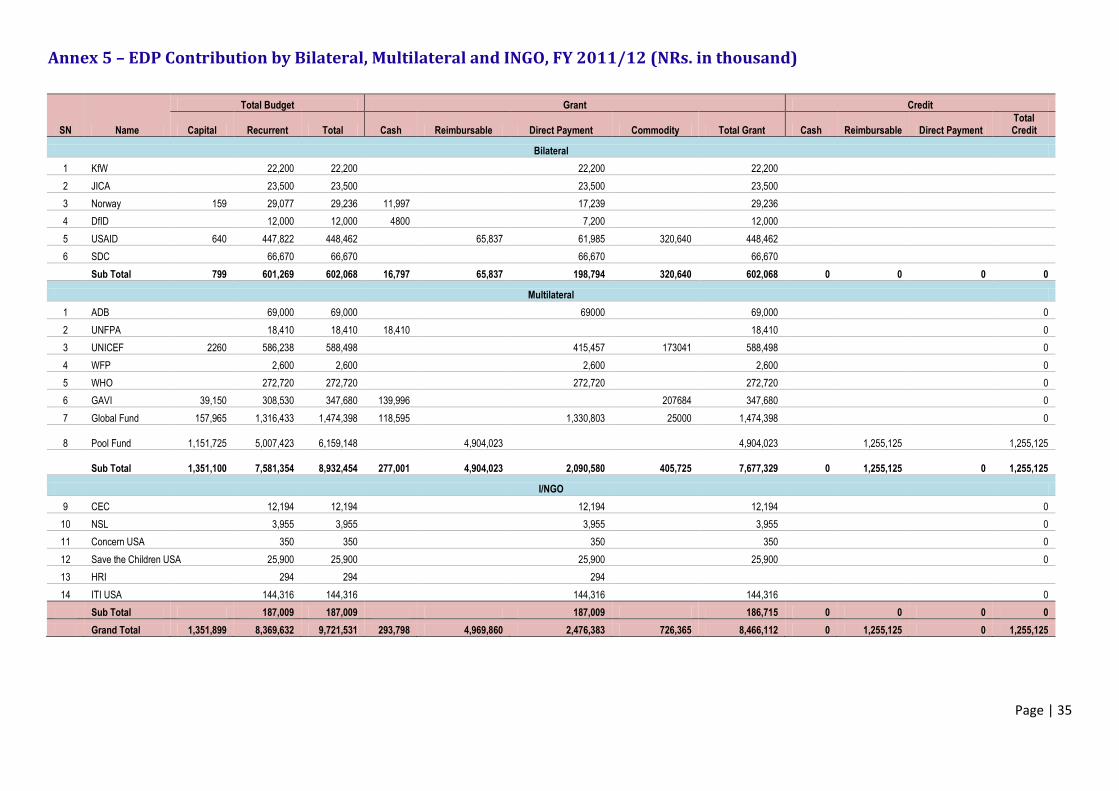
Annex 5 – EDP Contribution by Bilateral, Multilateral and INGO, FY 2011/12 (NRs. in thousand)
SN Name
Total Budget Grant Credit
Capital Recurrent Total Cash Reimbursable Direct Payment Commodity Total Grant Cash Reimbursable Direct Payment Total Credit
Bilateral
1 KfW 22,200 22,200 22,200 22,200
2 JICA 23,500 23,500 23,500 23,500
3 Norway 159 29,077 29,236 11,997 17,239 29,236
4 DfID 12,000 12,000 4800 7,200 12,000
5 USAID 640 447,822 448,462 65,837 61,985 320,640 448,462
6 SDC 66,670 66,670 66,670 66,670
Sub Total 799 601,269 602,068 16,797 65,837 198,794 320,640 602,068 0 0 0 0
Multilateral
1 ADB 69,000 69,000 69000 69,000 0
2 UNFPA 18,410 18,410 18,410 18,410 0
3 UNICEF 2260 586,238 588,498 415,457 173041 588,498 0
4 WFP 2,600 2,600 2,600 2,600 0
5 WHO 272,720 272,720 272,720 272,720 0
6 GAVI 39,150 308,530 347,680 139,996 207684 347,680 0
7 Global Fund 157,965 1,316,433 1,474,398 118,595 1,330,803 25000 1,474,398 0
8 Pool Fund 1,151,725 5,007,423 6,159,148 4,904,023 4,904,023 1,255,125
1,255,125
Sub Total 1,351,100 7,581,354 8,932,454 277,001 4,904,023 2,090,580 405,725 7,677,329 0 1,255,125 0
1,255,125
I/NGO
9 CEC 12,194 12,194 12,194 12,194 0
10 NSL 3,955 3,955 3,955 3,955 0
11 Concern USA 350 350 350 350 0
12 Save the Children USA 25,900 25,900 25,900 25,900 0
13 HRI 294 294 294
14 ITI USA 144,316 144,316 144,316 144,316 0
Sub Total 187,009 187,009 187,009 186,715 0 0 0 0
Grand Total 1,351,899 8,369,632 9,721,531 293,798 4,969,860 2,476,383 726,365 8,466,112 0 1,255,125 0 1,255,125
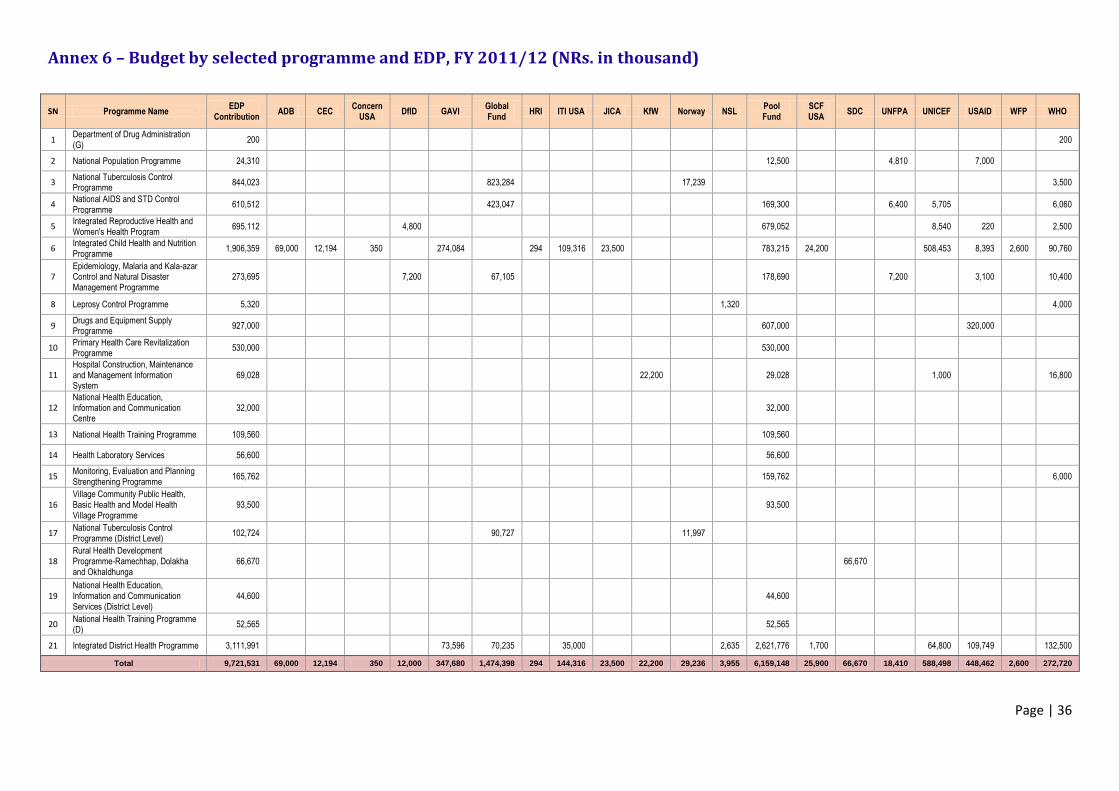
Page | 36
Annex 6 – Budget by selected programme and EDP, FY 2011/12 (NRs. in thousand)
SN Programme Name EDP
Contribution ADB CEC
Concern USA
DfID GAVI Global Fund
HRI ITI USA JICA KfW Norway NSL Pool Fund
SCF USA
SDC UNFPA UNICEF USAID WFP WHO
1 Department of Drug Administration (G)
200 200
2 National Population Programme 24,310 12,500 4,810 7,000
3 National Tuberculosis Control Programme
844,023 823,284 17,239 3,500
4 National AIDS and STD Control Programme
610,512 423,047 169,300 6,400 5,705 6,060
5 Integrated Reproductive Health and Women's Health Program
695,112 4,800 679,052 8,540 220 2,500
6 Integrated Child Health and Nutrition Programme
1,906,359 69,000 12,194 350 274,084 294 109,316 23,500 783,215 24,200 508,453 8,393 2,600 90,760
7 Epidemiology, Malaria and Kala-azar Control and Natural Disaster Management Programme
273,695 7,200 67,105 178,690 7,200 3,100 10,400
8 Leprosy Control Programme 5,320 1,320 4,000
9 Drugs and Equipment Supply Programme
927,000 607,000 320,000
10 Primary Health Care Revitalization Programme
530,000 530,000
11 Hospital Construction, Maintenance and Management Information System
69,028 22,200 29,028 1,000 16,800
12 National Health Education, Information and Communication Centre
32,000 32,000
13 National Health Training Programme 109,560 109,560
14 Health Laboratory Services 56,600 56,600
15 Monitoring, Evaluation and Planning Strengthening Programme
165,762 159,762 6,000
16 Village Community Public Health, Basic Health and Model Health Village Programme
93,500 93,500
17 National Tuberculosis Control Programme (District Level)
102,724 90,727 11,997
18 Rural Health Development Programme-Ramechhap, Dolakha and Okhaldhunga
66,670 66,670
19 National Health Education, Information and Communication Services (District Level)
44,600 44,600
20 National Health Training Programme (D)
52,565 52,565
21 Integrated District Health Programme 3,111,991 73,596 70,235 35,000 2,635 2,621,776 1,700 64,800 109,749 132,500
Total 9,721,531 69,000 12,194 350 12,000 347,680 1,474,398 294 144,316 23,500 22,200 29,236 3,955 6,159,148 25,900 66,670 18,410 588,498 448,462 2,600 272,720
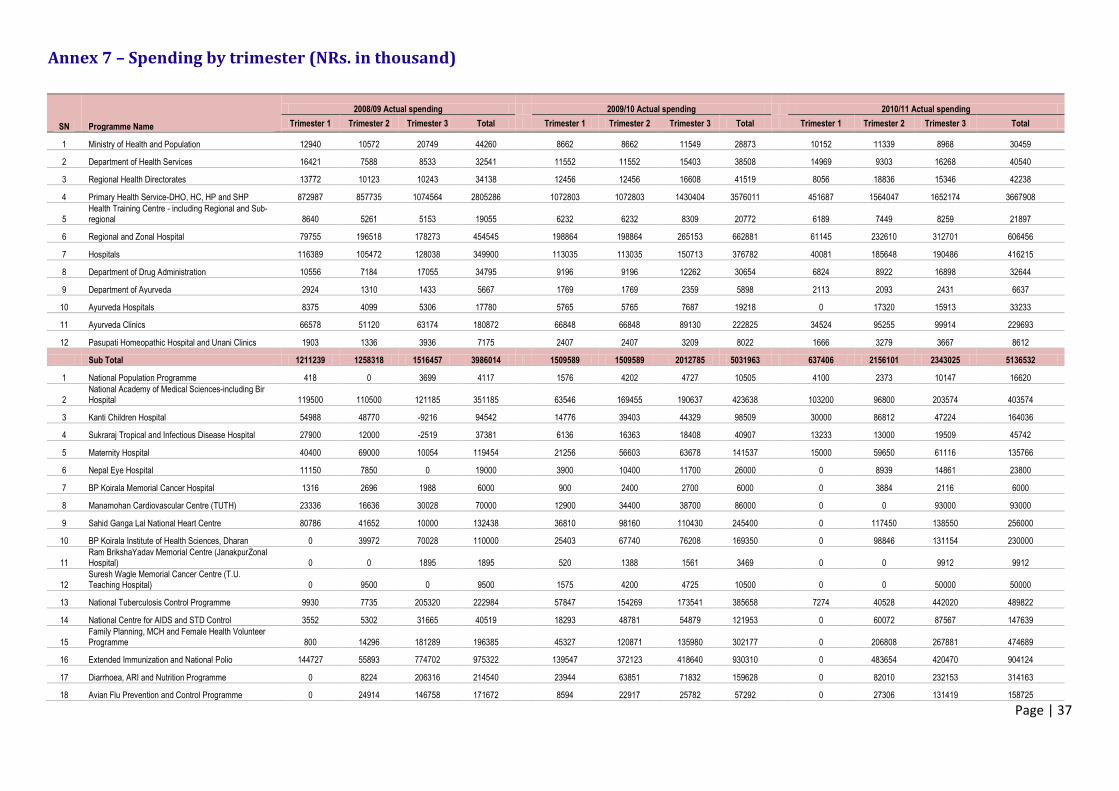
Page | 37
Annex 7 – Spending by trimester (NRs. in thousand)
SN Programme Name
2008/09 Actual spending 2009/10 Actual spending 2010/11 Actual spending
Trimester 1 Trimester 2 Trimester 3 Total Trimester 1 Trimester 2 Trimester 3 Total Trimester 1 Trimester 2 Trimester 3 Total
1 Ministry of Health and Population 12940 10572 20749 44260 8662 8662 11549 28873 10152 11339 8968 30459
2 Department of Health Services 16421 7588 8533 32541 11552 11552 15403 38508 14969 9303 16268 40540
3 Regional Health Directorates 13772 10123 10243 34138 12456 12456 16608 41519 8056 18836 15346 42238
4 Primary Health Service-DHO, HC, HP and SHP 872987 857735 1074564 2805286 1072803 1072803 1430404 3576011 451687 1564047 1652174 3667908
5 Health Training Centre - including Regional and Sub-regional 8640 5261 5153 19055 6232 6232 8309 20772 6189 7449 8259 21897
6 Regional and Zonal Hospital 79755 196518 178273 454545 198864 198864 265153 662881 61145 232610 312701 606456
7 Hospitals 116389 105472 128038 349900 113035 113035 150713 376782 40081 185648 190486 416215
8 Department of Drug Administration 10556 7184 17055 34795 9196 9196 12262 30654 6824 8922 16898 32644
9 Department of Ayurveda 2924 1310 1433 5667 1769 1769 2359 5898 2113 2093 2431 6637
10 Ayurveda Hospitals 8375 4099 5306 17780 5765 5765 7687 19218 0 17320 15913 33233
11 Ayurveda Clinics 66578 51120 63174 180872 66848 66848 89130 222825 34524 95255 99914 229693
12 Pasupati Homeopathic Hospital and Unani Clinics 1903 1336 3936 7175 2407 2407 3209 8022 1666 3279 3667 8612
Sub Total 1211239 1258318 1516457 3986014 1509589 1509589 2012785 5031963 637406 2156101 2343025 5136532
1 National Population Programme 418 0 3699 4117 1576 4202 4727 10505 4100 2373 10147 16620
2 National Academy of Medical Sciences-including Bir Hospital 119500 110500 121185 351185 63546 169455 190637 423638 103200 96800 203574 403574
3 Kanti Children Hospital 54988 48770 -9216 94542 14776 39403 44329 98509 30000 86812 47224 164036
4 Sukraraj Tropical and Infectious Disease Hospital 27900 12000 -2519 37381 6136 16363 18408 40907 13233 13000 19509 45742
5 Maternity Hospital 40400 69000 10054 119454 21256 56603 63678 141537 15000 59650 61116 135766
6 Nepal Eye Hospital 11150 7850 0 19000 3900 10400 11700 26000 0 8939 14861 23800
7 BP Koirala Memorial Cancer Hospital 1316 2696 1988 6000 900 2400 2700 6000 0 3884 2116 6000
8 Manamohan Cardiovascular Centre (TUTH) 23336 16636 30028 70000 12900 34400 38700 86000 0 0 93000 93000
9 Sahid Ganga Lal National Heart Centre 80786 41652 10000 132438 36810 98160 110430 245400 0 117450 138550 256000
10 BP Koirala Institute of Health Sciences, Dharan 0 39972 70028 110000 25403 67740 76208 169350 0 98846 131154 230000
11 Ram BrikshaYadav Memorial Centre (JanakpurZonal Hospital) 0 0 1895 1895 520 1388 1561 3469 0 0 9912 9912
12 Suresh Wagle Memorial Cancer Centre (T.U. Teaching Hospital) 0 9500 0 9500 1575 4200 4725 10500 0 0 50000 50000
13 National Tuberculosis Control Programme 9930 7735 205320 222984 57847 154269 173541 385658 7274 40528 442020 489822
14 National Centre for AIDS and STD Control 3552 5302 31665 40519 18293 48781 54879 121953 0 60072 87567 147639
15 Family Planning, MCH and Female Health Volunteer Programme 800 14296 181289 196385 45327 120871 135980 302177 0 206808 267881 474689
16 Extended Immunization and National Polio 144727 55893 774702 975322 139547 372123 418640 930310 0 483654 420470 904124
17 Diarrhoea, ARI and Nutrition Programme 0 8224 206316 214540 23944 63851 71832 159628 0 82010 232153 314163
18 Avian Flu Prevention and Control Programme 0 24914 146758 171672 8594 22917 25782 57292 0 27306 131419 158725
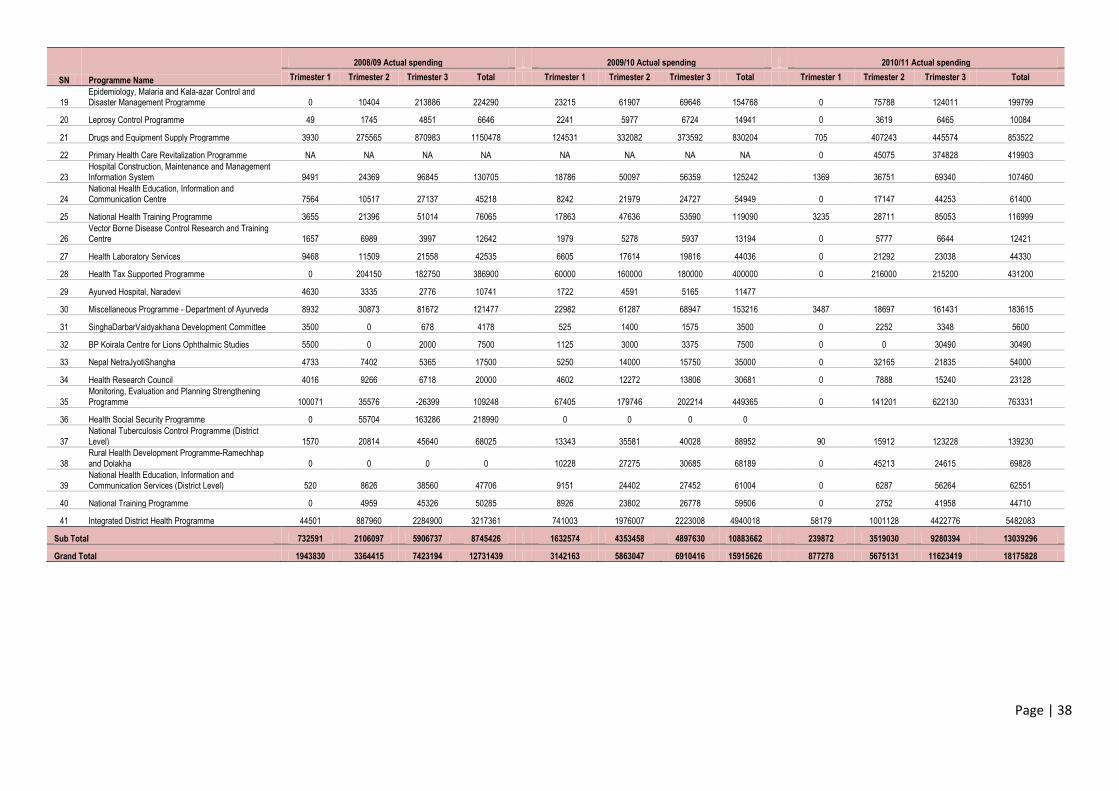
Page | 38
SN Programme Name
2008/09 Actual spending 2009/10 Actual spending 2010/11 Actual spending
Trimester 1 Trimester 2 Trimester 3 Total Trimester 1 Trimester 2 Trimester 3 Total Trimester 1 Trimester 2 Trimester 3 Total
19 Epidemiology, Malaria and Kala-azar Control and Disaster Management Programme 0 10404 213886 224290 23215 61907 69646 154768 0 75788 124011 199799
20 Leprosy Control Programme 49 1745 4851 6646 2241 5977 6724 14941 0 3619 6465 10084
21 Drugs and Equipment Supply Programme 3930 275565 870983 1150478 124531 332082 373592 830204 705 407243 445574 853522
22 Primary Health Care Revitalization Programme NA NA NA NA NA NA NA NA 0 45075 374828 419903
23 Hospital Construction, Maintenance and Management Information System 9491 24369 96845 130705 18786 50097 56359 125242 1369 36751 69340 107460
24 National Health Education, Information and Communication Centre 7564 10517 27137 45218 8242 21979 24727 54949 0 17147 44253 61400
25 National Health Training Programme 3655 21396 51014 76065 17863 47636 53590 119090 3235 28711 85053 116999
26 Vector Borne Disease Control Research and Training Centre 1657 6989 3997 12642 1979 5278 5937 13194 0 5777 6644 12421
27 Health Laboratory Services 9468 11509 21558 42535 6605 17614 19816 44036 0 21292 23038 44330
28 Health Tax Supported Programme 0 204150 182750 386900 60000 160000 180000 400000 0 216000 215200 431200
29 Ayurved Hospital, Naradevi 4630 3335 2776 10741 1722 4591 5165 11477
30 Miscellaneous Programme - Department of Ayurveda 8932 30873 81672 121477 22982 61287 68947 153216 3487 18697 161431 183615
31 SinghaDarbarVaidyakhana Development Committee 3500 0 678 4178 525 1400 1575 3500 0 2252 3348 5600
32 BP Koirala Centre for Lions Ophthalmic Studies 5500 0 2000 7500 1125 3000 3375 7500 0 0 30490 30490
33 Nepal NetraJyotiShangha 4733 7402 5365 17500 5250 14000 15750 35000 0 32165 21835 54000
34 Health Research Council 4016 9266 6718 20000 4602 12272 13806 30681 0 7888 15240 23128
35 Monitoring, Evaluation and Planning Strengthening Programme 100071 35576 -26399 109248 67405 179746 202214 449365 0 141201 622130 763331
36 Health Social Security Programme 0 55704 163286 218990 0 0 0 0
37 National Tuberculosis Control Programme (District Level) 1570 20814 45640 68025 13343 35581 40028 88952 90 15912 123228 139230
38 Rural Health Development Programme-Ramechhap and Dolakha 0 0 0 0 10228 27275 30685 68189 0 45213 24615 69828
39 National Health Education, Information and Communication Services (District Level) 520 8626 38560 47706 9151 24402 27452 61004 0 6287 56264 62551
40 National Training Programme 0 4959 45326 50285 8926 23802 26778 59506 0 2752 41958 44710
41 Integrated District Health Programme 44501 887960 2284900 3217361 741003 1976007 2223008 4940018 58179 1001128 4422776 5482083
Sub Total 732591 2106097 5906737 8745426 1632574 4353458 4897630 10883662 239872 3519030 9280394 13039296
Grand Total 1943830 3364415 7423194 12731439 3142163 5863047 6910416 15915626 877278 5675131 11623419 18175828
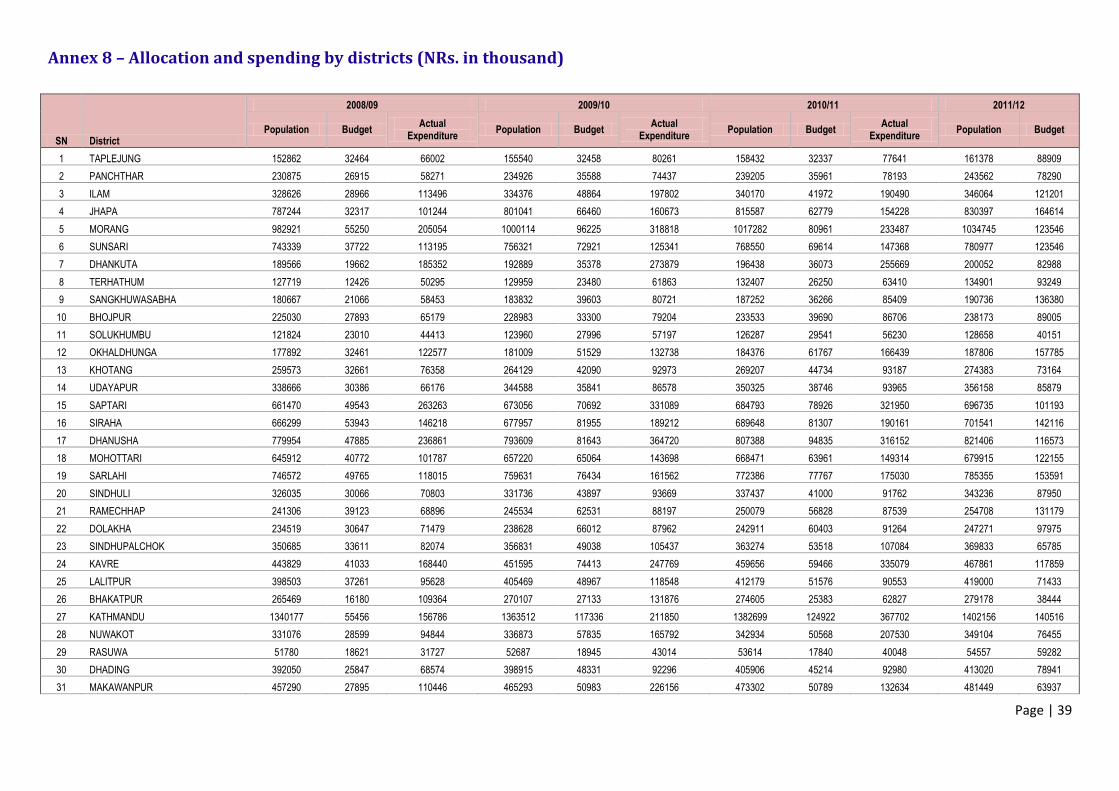
Page | 39
Annex 8 – Allocation and spending by districts (NRs. in thousand)
SN District
2008/09 2009/10 2010/11 2011/12
Population Budget Actual
Expenditure Population Budget
Actual Expenditure
Population Budget Actual
Expenditure Population Budget
1 TAPLEJUNG 152862 32464 66002 155540 32458 80261 158432 32337 77641 161378 88909
2 PANCHTHAR 230875 26915 58271 234926 35588 74437 239205 35961 78193 243562 78290
3 ILAM 328626 28966 113496 334376 48864 197802 340170 41972 190490 346064 121201
4 JHAPA 787244 32317 101244 801041 66460 160673 815587 62779 154228 830397 164614
5 MORANG 982921 55250 205054 1000114 96225 318818 1017282 80961 233487 1034745 123546
6 SUNSARI 743339 37722 113195 756321 72921 125341 768550 69614 147368 780977 123546
7 DHANKUTA 189566 19662 185352 192889 35378 273879 196438 36073 255669 200052 82988
8 TERHATHUM 127719 12426 50295 129959 23480 61863 132407 26250 63410 134901 93249
9 SANGKHUWASABHA 180667 21066 58453 183832 39603 80721 187252 36266 85409 190736 136380
10 BHOJPUR 225030 27893 65179 228983 33300 79204 233533 39690 86706 238173 89005
11 SOLUKHUMBU 121824 23010 44413 123960 27996 57197 126287 29541 56230 128658 40151
12 OKHALDHUNGA 177892 32461 122577 181009 51529 132738 184376 61767 166439 187806 157785
13 KHOTANG 259573 32661 76358 264129 42090 92973 269207 44734 93187 274383 73164
14 UDAYAPUR 338666 30386 66176 344588 35841 86578 350325 38746 93965 356158 85879
15 SAPTARI 661470 49543 263263 673056 70692 331089 684793 78926 321950 696735 101193
16 SIRAHA 666299 53943 146218 677957 81955 189212 689648 81307 190161 701541 142116
17 DHANUSHA 779954 47885 236861 793609 81643 364720 807388 94835 316152 821406 116573
18 MOHOTTARI 645912 40772 101787 657220 65064 143698 668471 63961 149314 679915 122155
19 SARLAHI 746572 49765 118015 759631 76434 161562 772386 77767 175030 785355 153591
20 SINDHULI 326035 30066 70803 331736 43897 93669 337437 41000 91762 343236 87950
21 RAMECHHAP 241306 39123 68896 245534 62531 88197 250079 56828 87539 254708 131179
22 DOLAKHA 234519 30647 71479 238628 66012 87962 242911 60403 91264 247271 97975
23 SINDHUPALCHOK 350685 33611 82074 356831 49038 105437 363274 53518 107084 369833 65785
24 KAVRE 443829 41033 168440 451595 74413 247769 459656 59466 335079 467861 117859
25 LALITPUR 398503 37261 95628 405469 48967 118548 412179 51576 90553 419000 71433
26 BHAKATPUR 265469 16180 109364 270107 27133 131876 274605 25383 62827 279178 38444
27 KATHMANDU 1340177 55456 156786 1363512 117336 211850 1382699 124922 367702 1402156 140516
28 NUWAKOT 331076 28599 94844 336873 57835 165792 342934 50568 207530 349104 76455
29 RASUWA 51780 18621 31727 52687 18945 43014 53614 17840 40048 54557 59282
30 DHADING 392050 25847 68574 398915 48331 92296 405906 45214 92980 413020 78941
31 MAKAWANPUR 457290 27895 110446 465293 50983 226156 473302 50789 132634 481449 63937
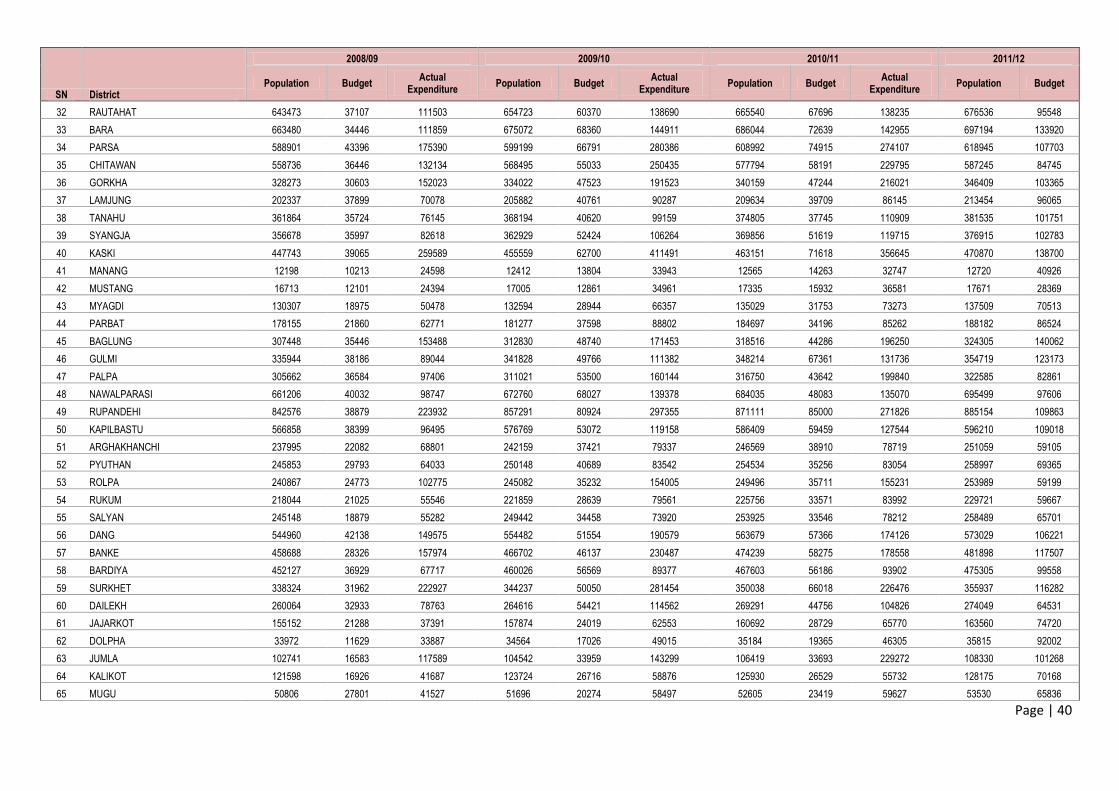
Page | 40
SN District
2008/09 2009/10 2010/11 2011/12
Population Budget Actual
Expenditure Population Budget
Actual Expenditure
Population Budget Actual
Expenditure Population Budget
32 RAUTAHAT 643473 37107 111503 654723 60370 138690 665540 67696 138235 676536 95548
33 BARA 663480 34446 111859 675072 68360 144911 686044 72639 142955 697194 133920
34 PARSA 588901 43396 175390 599199 66791 280386 608992 74915 274107 618945 107703
35 CHITAWAN 558736 36446 132134 568495 55033 250435 577794 58191 229795 587245 84745
36 GORKHA 328273 30603 152023 334022 47523 191523 340159 47244 216021 346409 103365
37 LAMJUNG 202337 37899 70078 205882 40761 90287 209634 39709 86145 213454 96065
38 TANAHU 361864 35724 76145 368194 40620 99159 374805 37745 110909 381535 101751
39 SYANGJA 356678 35997 82618 362929 52424 106264 369856 51619 119715 376915 102783
40 KASKI 447743 39065 259589 455559 62700 411491 463151 71618 356645 470870 138700
41 MANANG 12198 10213 24598 12412 13804 33943 12565 14263 32747 12720 40926
42 MUSTANG 16713 12101 24394 17005 12861 34961 17335 15932 36581 17671 28369
43 MYAGDI 130307 18975 50478 132594 28944 66357 135029 31753 73273 137509 70513
44 PARBAT 178155 21860 62771 181277 37598 88802 184697 34196 85262 188182 86524
45 BAGLUNG 307448 35446 153488 312830 48740 171453 318516 44286 196250 324305 140062
46 GULMI 335944 38186 89044 341828 49766 111382 348214 67361 131736 354719 123173
47 PALPA 305662 36584 97406 311021 53500 160144 316750 43642 199840 322585 82861
48 NAWALPARASI 661206 40032 98747 672760 68027 139378 684035 48083 135070 695499 97606
49 RUPANDEHI 842576 38879 223932 857291 80924 297355 871111 85000 271826 885154 109863
50 KAPILBASTU 566858 38399 96495 576769 53072 119158 586409 59459 127544 596210 109018
51 ARGHAKHANCHI 237995 22082 68801 242159 37421 79337 246569 38910 78719 251059 59105
52 PYUTHAN 245853 29793 64033 250148 40689 83542 254534 35256 83054 258997 69365
53 ROLPA 240867 24773 102775 245082 35232 154005 249496 35711 155231 253989 59199
54 RUKUM 218044 21025 55546 221859 28639 79561 225756 33571 83992 229721 59667
55 SALYAN 245148 18879 55282 249442 34458 73920 253925 33546 78212 258489 65701
56 DANG 544960 42138 149575 554482 51554 190579 563679 57366 174126 573029 106221
57 BANKE 458688 28326 157974 466702 46137 230487 474239 58275 178558 481898 117507
58 BARDIYA 452127 36929 67717 460026 56569 89377 467603 56186 93902 475305 99558
59 SURKHET 338324 31962 222927 344237 50050 281454 350038 66018 226476 355937 116282
60 DAILEKH 260064 32933 78763 264616 54421 114562 269291 44756 104826 274049 64531
61 JAJARKOT 155152 21288 37391 157874 24019 62553 160692 28729 65770 163560 74720
62 DOLPHA 33972 11629 33887 34564 17026 49015 35184 19365 46305 35815 92002
63 JUMLA 102741 16583 117589 104542 33959 143299 106419 33693 229272 108330 101268
64 KALIKOT 121598 16926 41687 123724 26716 58876 125930 26529 55732 128175 70168
65 MUGU 50806 27801 41527 51696 20274 58497 52605 23419 59627 53530 65836
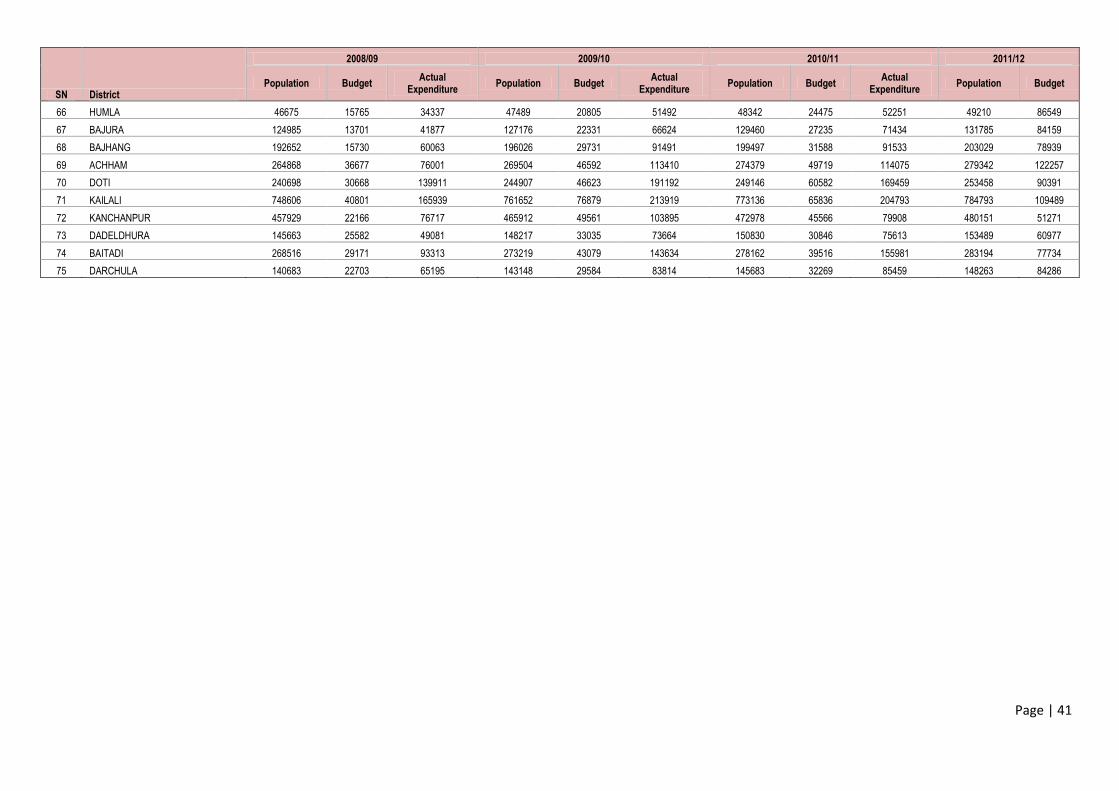
Page | 41
SN District
2008/09 2009/10 2010/11 2011/12
Population Budget Actual
Expenditure Population Budget
Actual Expenditure
Population Budget Actual
Expenditure Population Budget
66 HUMLA 46675 15765 34337 47489 20805 51492 48342 24475 52251 49210 86549
67 BAJURA 124985 13701 41877 127176 22331 66624 129460 27235 71434 131785 84159
68 BAJHANG 192652 15730 60063 196026 29731 91491 199497 31588 91533 203029 78939
69 ACHHAM 264868 36677 76001 269504 46592 113410 274379 49719 114075 279342 122257
70 DOTI 240698 30668 139911 244907 46623 191192 249146 60582 169459 253458 90391
71 KAILALI 748606 40801 165939 761652 76879 213919 773136 65836 204793 784793 109489
72 KANCHANPUR 457929 22166 76717 465912 49561 103895 472978 45566 79908 480151 51271
73 DADELDHURA 145663 25582 49081 148217 33035 73664 150830 30846 75613 153489 60977
74 BAITADI 268516 29171 93313 273219 43079 143634 278162 39516 155981 283194 77734
75 DARCHULA 140683 22703 65195 143148 29584 83814 145683 32269 85459 148263 84286
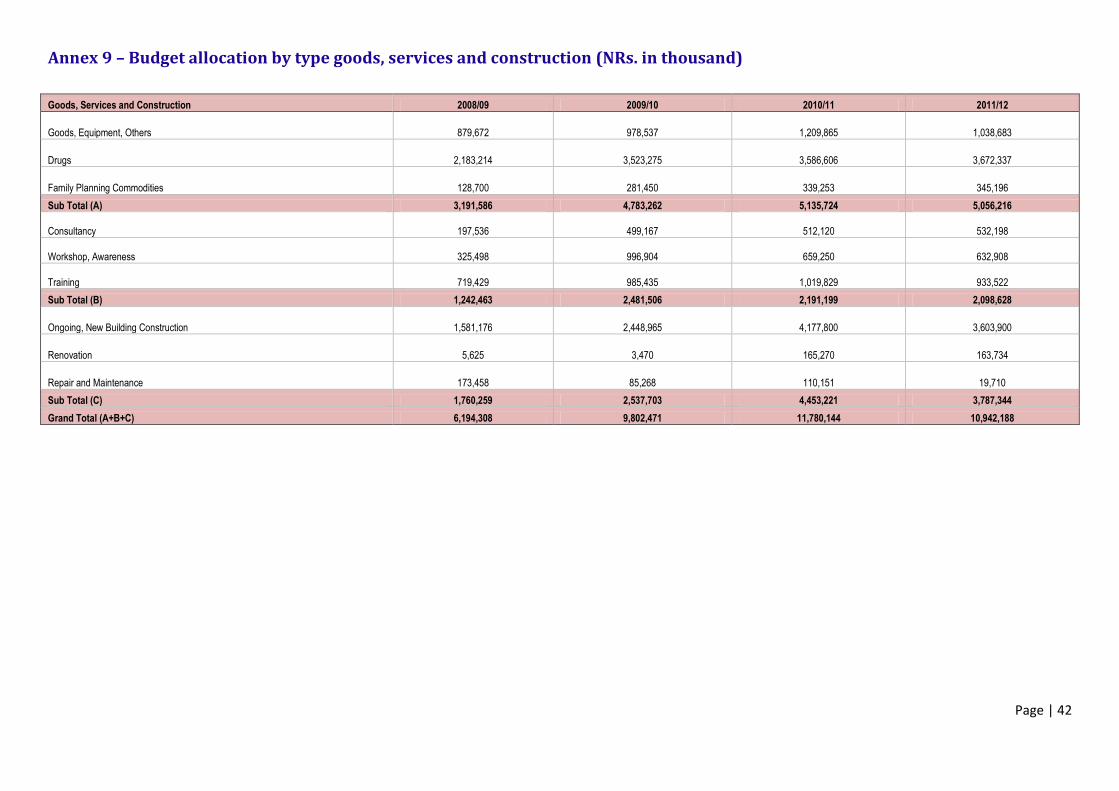
Page | 42
Annex 9 – Budget allocation by type goods, services and construction (NRs. in thousand)
Goods, Services and Construction 2008/09 2009/10 2010/11 2011/12
Goods, Equipment, Others 879,672 978,537 1,209,865 1,038,683
Drugs 2,183,214 3,523,275 3,586,606 3,672,337
Family Planning Commodities 128,700 281,450 339,253 345,196
Sub Total (A) 3,191,586 4,783,262 5,135,724 5,056,216
Consultancy 197,536 499,167 512,120 532,198
Workshop, Awareness 325,498 996,904 659,250 632,908
Training 719,429 985,435 1,019,829 933,522
Sub Total (B) 1,242,463 2,481,506 2,191,199 2,098,628
Ongoing, New Building Construction 1,581,176 2,448,965 4,177,800 3,603,900
Renovation 5,625 3,470 165,270 163,734
Repair and Maintenance 173,458 85,268 110,151 19,710
Sub Total (C) 1,760,259 2,537,703 4,453,221 3,787,344
Grand Total (A+B+C) 6,194,308 9,802,471 11,780,144 10,942,188
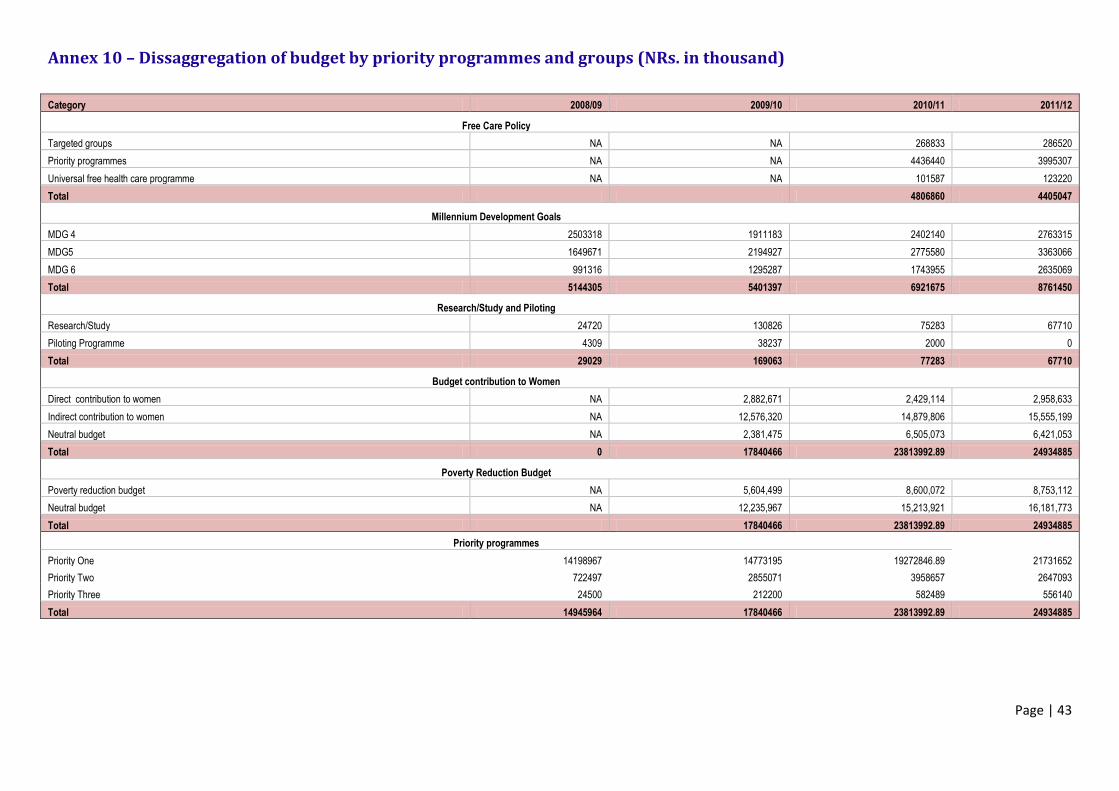
Page | 43
Annex 10 – Dissaggregation of budget by priority programmes and groups (NRs. in thousand)
Category 2008/09 2009/10 2010/11 2011/12
Free Care Policy
Targeted groups NA NA 268833 286520
Priority programmes NA NA 4436440 3995307
Universal free health care programme NA NA 101587 123220
Total 4806860 4405047
Millennium Development Goals
MDG 4 2503318 1911183 2402140 2763315
MDG5 1649671 2194927 2775580 3363066
MDG 6 991316 1295287 1743955 2635069
Total 5144305 5401397 6921675 8761450
Research/Study and Piloting
Research/Study 24720 130826 75283 67710
Piloting Programme 4309 38237 2000 0
Total 29029 169063 77283 67710
Budget contribution to Women
Direct contribution to women NA 2,882,671 2,429,114 2,958,633
Indirect contribution to women NA 12,576,320 14,879,806 15,555,199
Neutral budget NA 2,381,475 6,505,073 6,421,053
Total 0 17840466 23813992.89 24934885
Poverty Reduction Budget
Poverty reduction budget NA 5,604,499 8,600,072 8,753,112
Neutral budget NA 12,235,967 15,213,921 16,181,773
Total 17840466 23813992.89 24934885
Priority programmes
Priority One 14198967 14773195 19272846.89 21731652
Priority Two 722497 2855071 3958657 2647093
Priority Three 24500 212200 582489 556140
Total 14945964 17840466 23813992.89 24934885
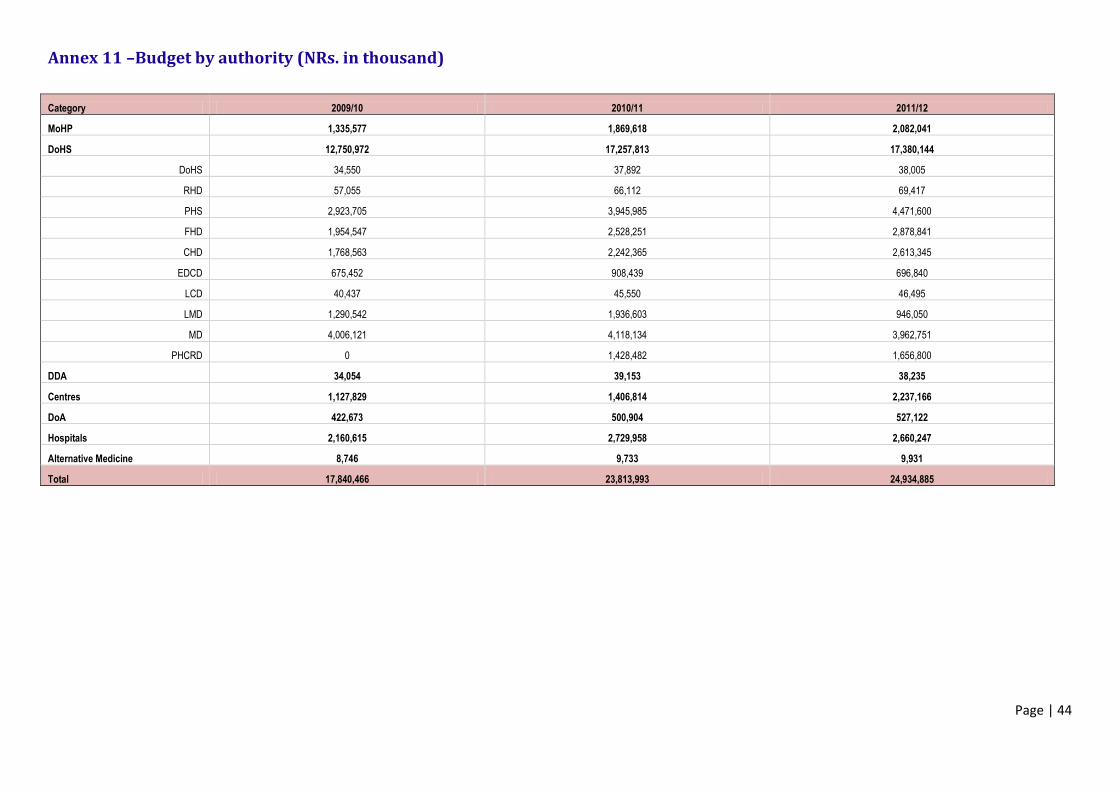
Page | 44
Annex 11 –Budget by authority (NRs. in thousand)
Category 2009/10 2010/11 2011/12
MoHP 1,335,577 1,869,618 2,082,041
DoHS 12,750,972 17,257,813 17,380,144
DoHS 34,550 37,892 38,005
RHD 57,055 66,112 69,417
PHS 2,923,705 3,945,985 4,471,600
FHD 1,954,547 2,528,251 2,878,841
CHD 1,768,563 2,242,365 2,613,345
EDCD 675,452 908,439 696,840
LCD 40,437 45,550 46,495
LMD 1,290,542 1,936,603 946,050
MD 4,006,121 4,118,134 3,962,751
PHCRD 0 1,428,482 1,656,800
DDA 34,054 39,153 38,235
Centres 1,127,829 1,406,814 2,237,166
DoA 422,673 500,904 527,122
Hospitals 2,160,615 2,729,958 2,660,247
Alternative Medicine 8,746 9,733 9,931
Total 17,840,466 23,813,993 24,934,885
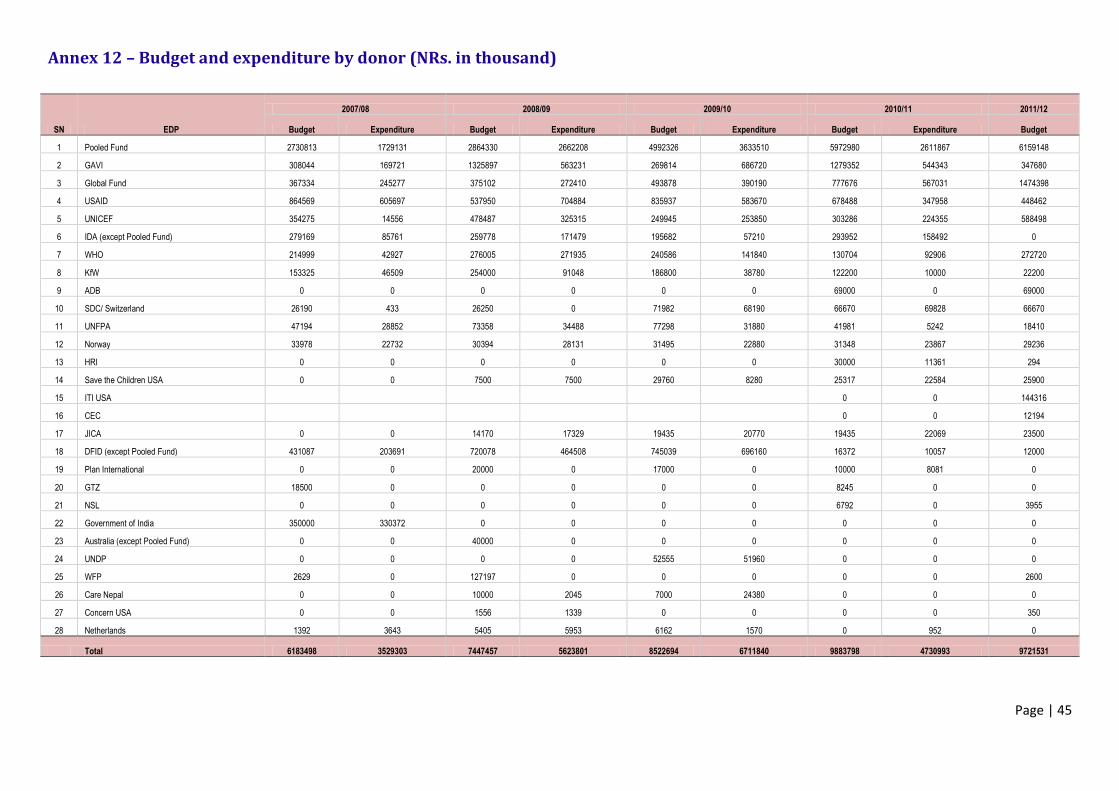
Page | 45
Annex 12 – Budget and expenditure by donor (NRs. in thousand)
SN EDP
2007/08 2008/09 2009/10 2010/11 2011/12
Budget Expenditure Budget Expenditure Budget Expenditure Budget Expenditure Budget
1 Pooled Fund 2730813 1729131 2864330 2662208 4992326 3633510 5972980 2611867 6159148
2 GAVI 308044 169721 1325897 563231 269814 686720 1279352 544343 347680
3 Global Fund 367334 245277 375102 272410 493878 390190 777676 567031 1474398
4 USAID 864569 605697 537950 704884 835937 583670 678488 347958 448462
5 UNICEF 354275 14556 478487 325315 249945 253850 303286 224355 588498
6 IDA (except Pooled Fund) 279169 85761 259778 171479 195682 57210 293952 158492 0
7 WHO 214999 42927 276005 271935 240586 141840 130704 92906 272720
8 KfW 153325 46509 254000 91048 186800 38780 122200 10000 22200
9 ADB 0 0 0 0 0 0 69000 0 69000
10 SDC/ Switzerland 26190 433 26250 0 71982 68190 66670 69828 66670
11 UNFPA 47194 28852 73358 34488 77298 31880 41981 5242 18410
12 Norway 33978 22732 30394 28131 31495 22880 31348 23867 29236
13 HRI 0 0 0 0 0 0 30000 11361 294
14 Save the Children USA 0 0 7500 7500 29760 8280 25317 22584 25900
15 ITI USA
0 0 144316
16 CEC
0 0 12194
17 JICA 0 0 14170 17329 19435 20770 19435 22069 23500
18 DFID (except Pooled Fund) 431087 203691 720078 464508 745039 696160 16372 10057 12000
19 Plan International 0 0 20000 0 17000 0 10000 8081 0
20 GTZ 18500 0 0 0 0 0 8245 0 0
21 NSL 0 0 0 0 0 0 6792 0 3955
22 Government of India 350000 330372 0 0 0 0 0 0 0
23 Australia (except Pooled Fund) 0 0 40000 0 0 0 0 0 0
24 UNDP 0 0 0 0 52555 51960 0 0 0
25 WFP 2629 0 127197 0 0 0 0 0 2600
26 Care Nepal 0 0 10000 2045 7000 24380 0 0 0
27 Concern USA 0 0 1556 1339 0 0 0 0 350
28 Netherlands 1392 3643 5405 5953 6162 1570 0 952 0
Total 6183498 3529303 7447457 5623801 8522694 6711840 9883798 4730993 9721531
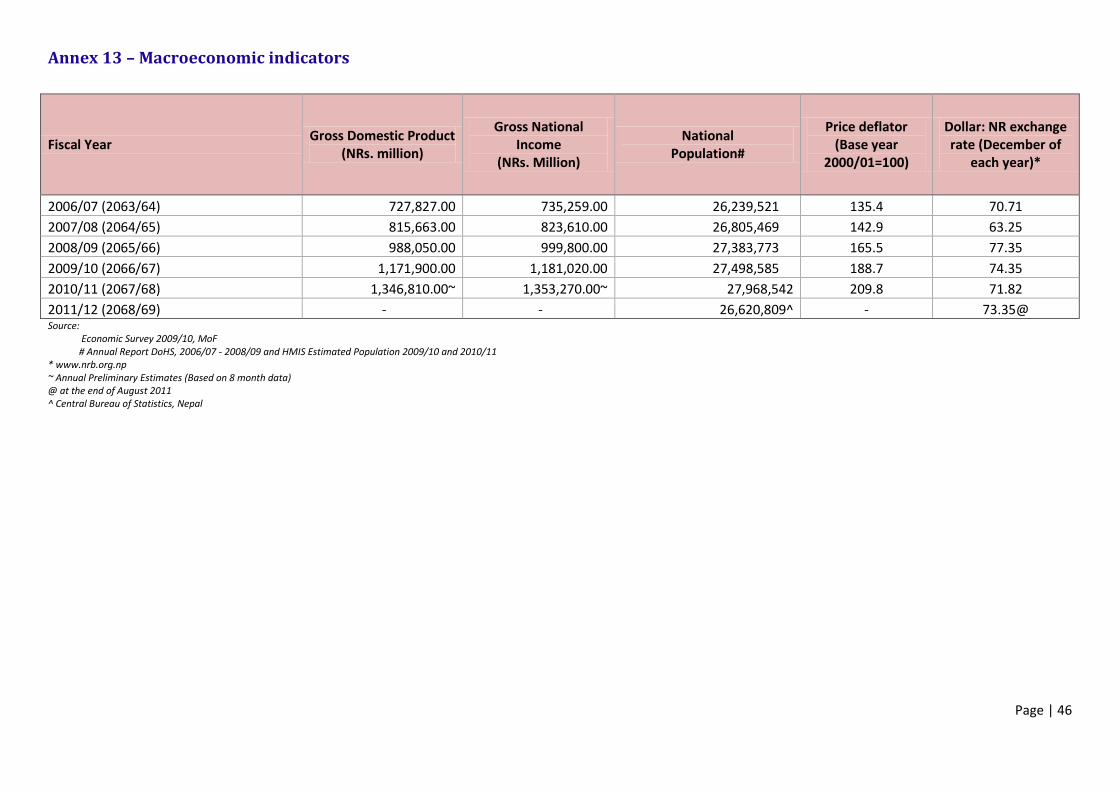
Page | 46
Annex 13 – Macroeconomic indicators
Fiscal Year Gross Domestic Product
(NRs. million)
Gross National Income
(NRs. Million)
National Population#
Price deflator (Base year
2000/01=100)
Dollar: NR exchange rate (December of
each year)*
2006/07 (2063/64) 727,827.00 735,259.00 26,239,521 135.4 70.71
2007/08 (2064/65) 815,663.00 823,610.00 26,805,469 142.9 63.25
2008/09 (2065/66) 988,050.00 999,800.00 27,383,773 165.5 77.35
2009/10 (2066/67) 1,171,900.00 1,181,020.00 27,498,585 188.7 74.35
2010/11 (2067/68) 1,346,810.00~ 1,353,270.00~ 27,968,542 209.8 71.82
2011/12 (2068/69) - - 26,620,809^ - 73.35@ Source: Economic Survey 2009/10, MoF # Annual Report DoHS, 2006/07 - 2008/09 and HMIS Estimated Population 2009/10 and 2010/11 * www.nrb.org.np ~ Annual Preliminary Estimates (Based on 8 month data) @ at the end of August 2011 ^ Central Bureau of Statistics, Nepal
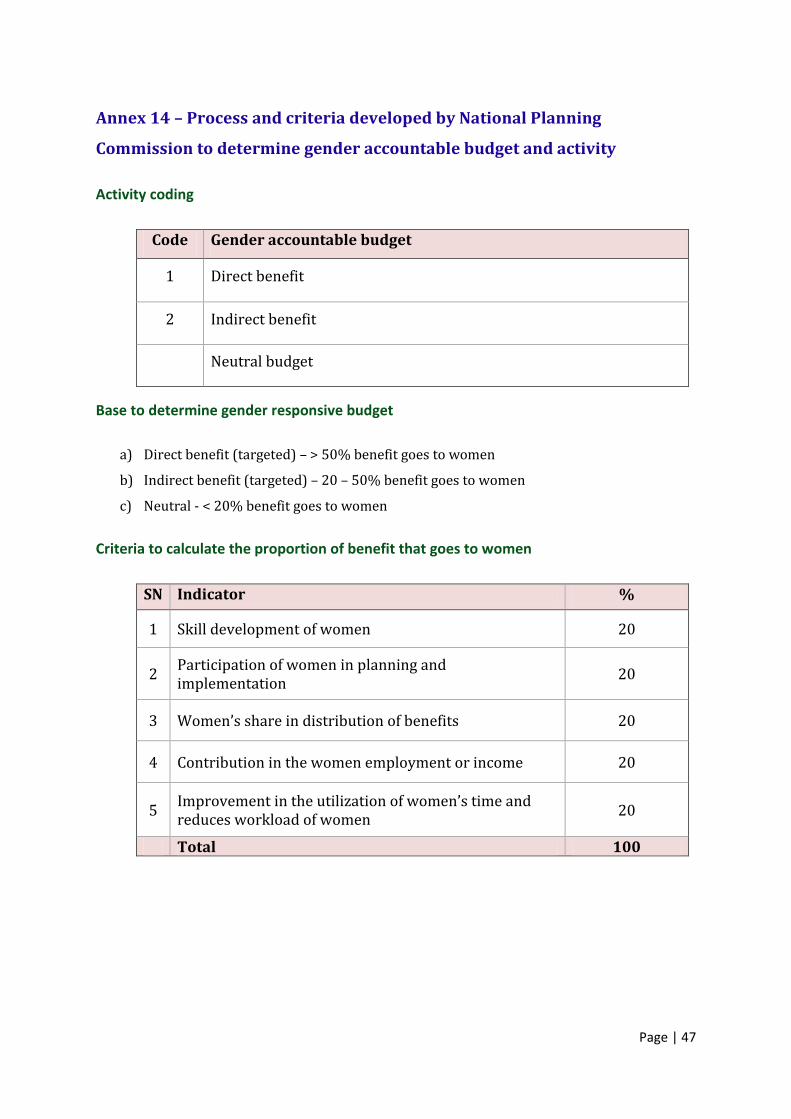
Page | 47
Annex 14 – Process and criteria developed by National Planning
Commission to determine gender accountable budget and activity
Activity coding
Code Gender accountable budget
1 Direct benefit
2 Indirect benefit
Neutral budget
Base to determine gender responsive budget
a) Direct benefit (targeted) – > 50% benefit goes to women
b) Indirect benefit (targeted) – 20 – 50% benefit goes to women
c) Neutral - < 20% benefit goes to women
Criteria to calculate the proportion of benefit that goes to women
SN Indicator %
1 Skill development of women 20
2 Participation of women in planning and implementation
20
3 Women’s share in distribution of benefits 20
4 Contribution in the women employment or income 20
5 Improvement in the utilization of women’s time and reduces workload of women
20
Total 100
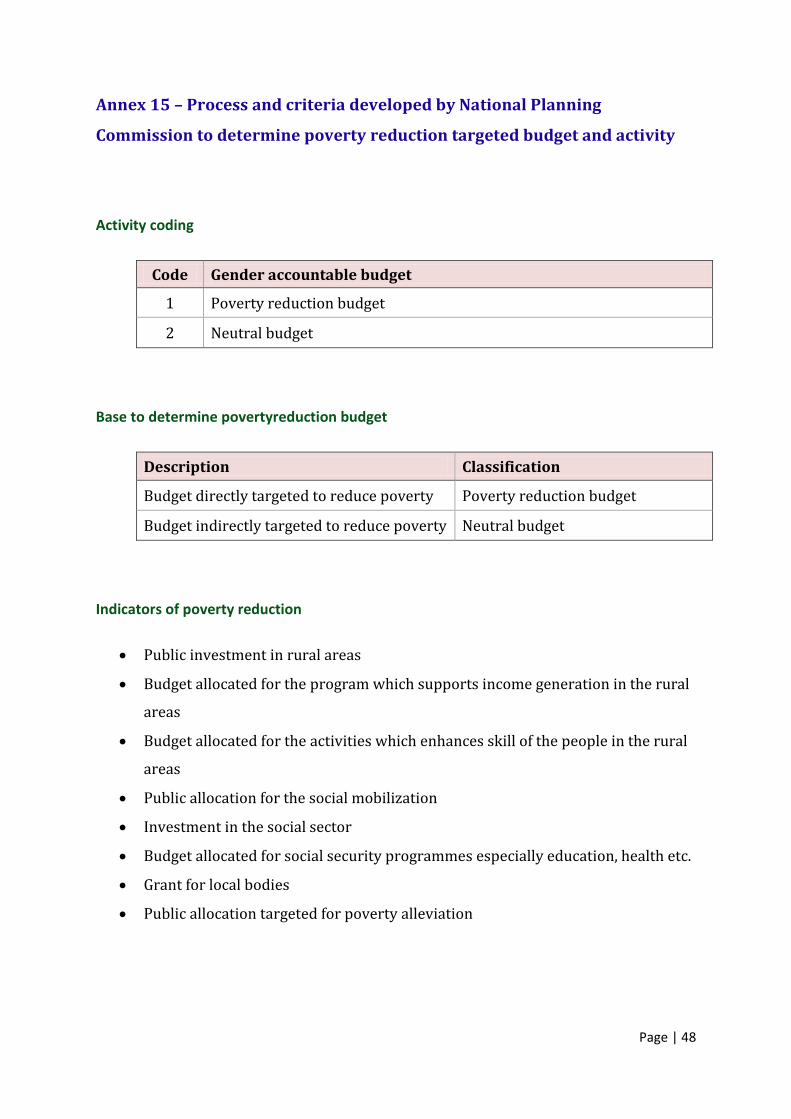
Page | 48
Annex 15 – Process and criteria developed by National Planning
Commission to determine poverty reduction targeted budget and activity
Activity coding
Code Gender accountable budget
1 Poverty reduction budget
2 Neutral budget
Base to determine povertyreduction budget
Description Classification
Budget directly targeted to reduce poverty Poverty reduction budget
Budget indirectly targeted to reduce poverty Neutral budget
Indicators of poverty reduction
Public investment in rural areas
Budget allocated for the program which supports income generation in the rural
areas
Budget allocated for the activities which enhances skill of the people in the rural
areas
Public allocation for the social mobilization
Investment in the social sector
Budget allocated for social security programmes especially education, health etc.
Grant for local bodies
Public allocation targeted for poverty alleviation

Ministry of Health and Population Ramshahpath, Kathmandu, Nepal
Tel - +977-1-4262590, 262862, 4223580 Fax - +977-1-4262896
www.mohp.gov.np [email protected]
Nepal Health Sector Support Programme
Ministry of Health and Population Ramshahpath, Kathmandu, Nepal
Tel - +977-1-4264250, 4262110 www.nhssp.org.np [email protected]