Embed Size (px)
Citation preview

Perception of a Haptic Jamming Display:Just Noticeable Differences in Stiffness and Geometry
Adam M. [email protected]
Andrew A. [email protected]
Allison M. [email protected]
Department of Mechanical Engineering, Stanford University
ABSTRACT
This work characterizes aspects of human perception of a HapticJamming device, a tactile display capable of simultaneously and in-dependently controlling its stiffness and geometry via particle jam-ming and pneumatic actuation. A single Haptic Jamming cell isfilled with coarse coffee grounds, connected to vacuum, and placedover a pressure-regulated air chamber. Increased vacuum level inthe cell increases cell stiffness, and increased pressure in the cham-ber beneath the cell balloons the cell upward. Single-cell deviceswere manufactured and tested to determine the relationships be-tween the vacuum and air pressure levels and the device outputs,stiffness and geometry, respectively. Using these relationships, ref-erence and comparison values were selected for each output, andpsychophysical experiments were conducted to determine the We-ber Fraction for rigidity (an alternate terminology for nonlinearstiffness, used in the experiment prompt) and geometry, representedby the eccentricity of the elliptical profile of the cell. The WeberFractions for stiffness and geometry were 16.0% and 14.3%, re-spectively. No significant correlation was found between humanperception of these stimuli and the forces/torques applied to thedevices during haptic exploration. These results will enable moreaccurate representations of virtual environments using an array ofhaptic jamming cells under development for medical training andsimulation.
Index Terms: H.5.2 [Information Interfaces and Presenta-tion]: User Interfaces—Haptic I/O; H.1.2 [Models and Principles]:User/Machine Systems—Human factors; L.2.0.b [Haptics]: Hap-tics Technology—Tactile Devices;
1 INTRODUCTION
An “encountered-type” tactile display allows a user to freely ex-plore a virtual environment. Ideally, the display does not requirethe user to wear or hold the device and can present new or chang-ing information about the environment whenever the user touchesit. This type of device has been previously developed with manydifferent technologies. Pin arrays have been used to convey forceand shape information to the fingertip, e.g. [1]. Rheological flu-ids arrays can change their mechanical properties when subjectedto either electric [2] or magnetic [3] fields. “Digital clay” has beenproposed as a controllably deformable surface for both computerinput and output; one device uses an array of fluidic-driven actua-tors [4].
Most tactile displays specialize in controlling either geometry orstiffness, but not both. This paper expands on the previous develop-ment of a novel haptic surface display that can control both its stiff-ness and its geometry [5]. Briefly, this Haptic Jamming device usesan array of hollow silicone cells filled with coarse coffee grounds;each cell is capable of changing its stiffness by vacuuming the in-
Geometry Rigidity
Low pressure
High pressure
Low vacuum
High vacuum
Figure 1: Single haptic jamming cells displaying different possibleoutputs. (Top left) A cell at low chamber pressure and no vacuum,producing a slightly ellipsoidal lump. (Bottom left) A cell at high cham-ber pressure and no vacuum, producing a less eccentric ellipsoid.(Top right) A cell at no vacuum and no chamber pressure, producinga highly compliant lump. (Bottom right) A cell at high vacuum and nochamber pressure, producing a flatter and highly rigid lump.
side of the cell, thereby jamming the particles of the coffee groundstogether and presenting an overall more rigid substance. The arrayis clamped over a pressure-regulated air chamber. In a cell’s softstate, increasing the air pressure to inflate the chamber underneathresults in the cell ballooning outward. By selectively vacuumingcells in an array and adjusting the chamber pressure, different ma-terial stiffnesses and geometries can be presented (Figure 1).
Previous experiments with single-cell versions of the device havecharacterized the effects of cell diameter, air pressure, vacuumlevel, and support type on the geometry and compliance of the cell[5]. This paper adds to the previous empirical characterization ofdevice output by measuring user perception of changes in geome-try and stiffness, defined by the just noticeable difference (JND),point of subjective equality (PSE), and corresponding Weber Frac-tions (WF). We first review the technology behind Haptic Jammingand previous research on user perception of geometry and com-pliance; we then describe our experimental procedures and reportthe calculated JNDs, PSEs, and WFs. The device was originallydesigned for an encountered-type combined cutaneous/kinestheticdisplay for medical training; characterization of user perceptionwill allow for more accurate and useful presentation of virtual med-ical environments to users.
2 BACKGROUND
The concept of particle jamming has been heavily researchedby physicists and materials scientists for decades, and has re-cently spurred numerous applications in engineering fields. Severalrobotics applications use the ability to rapidly change a material’sproperties back and forth between flexible and rigid states, includ-ing a universal gripper that can deform around an object before be-coming rigid to pick it up [11], a flexible cable-driven manipulatorthat can become rigid in any configuration [12], and a shell of par-ticle jamming cells that enable robotic locomotion of a ball-like
structure [13]. The ability to deform and stiffen a material has alsoinspired a number of novel tactile user interfaces [14] [15] [16].Moving beyond simply switching between flexible and rigid statesto adjusting the levels in between, Mitsuda et al. [17] developeda particle jamming tube that runs along the length a user’s arm tosimulate moving through virtual environments of varying viscosityand stiffness.
This study is also related to a vast literature on stiffness and ge-ometry perception. An elastic object’s stiffness describes its resis-tance to deformation when a force is applied. The mechanical be-havior of the particle jamming cells used in our work cannot becharacterized as a pure stiffness, as the resistance also depends ondeformation rate, In addition, the cells are not completely elastic(plastic deformation is possible) and the stiffness is nonlinear (al-though it is nearly linear for a range of applied force). Yet, weconsider stiffness (or rigidity) to be the most succinct descriptionof the dominant mechanical property of a particle jamming cell.The perceived stiffness of a particle jamming cell is likely due tothe force-displacement relationship resulting from a combinationof (1) the deformation of the surface of the cell and (2) gross move-ment of the cell in the direction of the applied force. Many studiesexist that quantify human stiffness discrimination capabilities (e.g.[8, 9, 10]), and stiffness WFs have been reported ranging from 0.15to 0.99. In our study, subjects freely explore a physical surface witha single hand in order to determine the size of a particle jammingcell. Thus, stereognosis (which invokes both tactile and propriocep-tive modalities) is used to identify cell size. While there is a grow-ing literature on size perception of stimuli such as ours for movingsingle point contacts, as well as multiple static point contacts, wehave found no existing WF measurements for size perception dur-ing free surface exploration.
3 METHODS
We built two single-cell Haptic Jamming devices and determinedmathematical best-fit relationships between actuation levels (cellvacuum and chamber pressure) and the corresponding device outputproperties (stiffness and size, respectively). We then used the de-vices in a two-alternative forced choice psychophysical experimentin order to characterize human perception of these device proper-ties.
3.1 Device Design and ControlFollowing the manufacturing procedures described in detail in [5],we constructed two 1.5-inch diameter circular-cell haptic jammingdevices. These devices were constructed with the cell in the unsup-ported configuration, meaning that there was no physical supportdirectly beneath the cell itself. Rather, it was suspended from theedges by a layer of silicone clamped between the acrylic pieces out-side the cell. The boxes were assembled from laser-cut acrylic, andthe silicone cells were created from custom laser-cut acrylic molds.The silicone cells had a 1/16-inch wall thickness and a 0.414-cubic-inch volume; each was filled with 7 teaspoons of coarse coffeegrounds, slightly more than the nominal volume of the cell in or-der to prevent sagging over the unsupported air chamber.
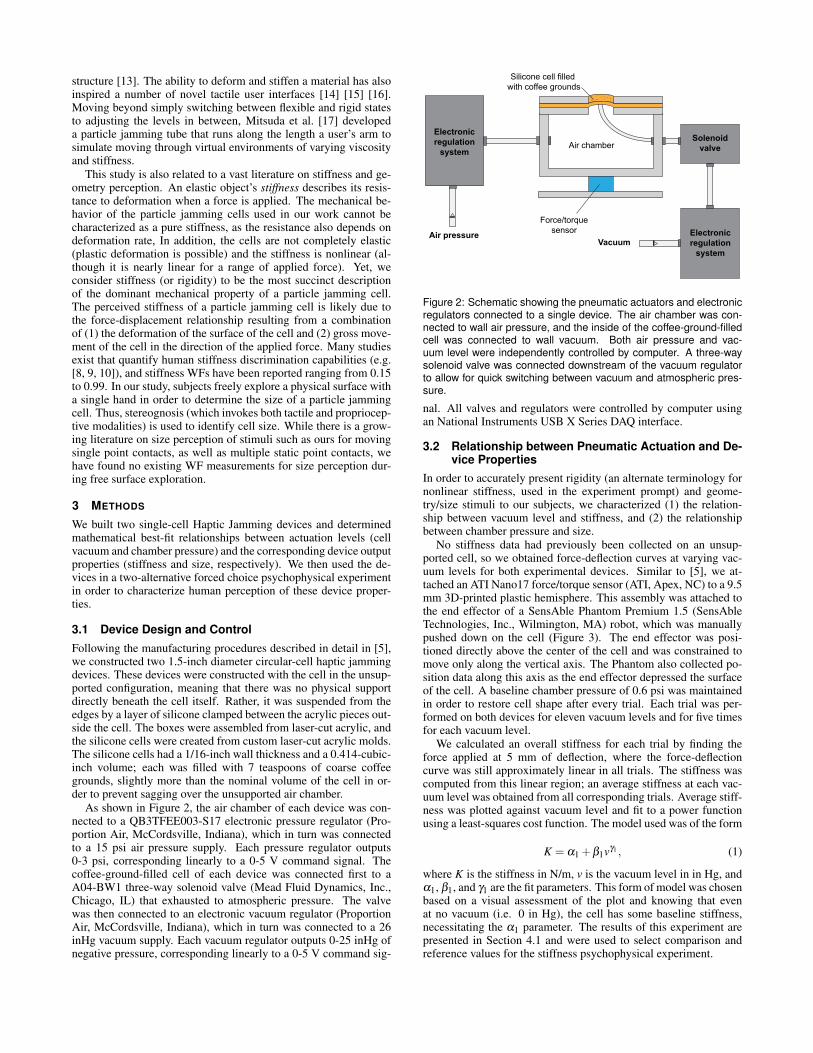
As shown in Figure 2, the air chamber of each device was con-nected to a QB3TFEE003-S17 electronic pressure regulator (Pro-portion Air, McCordsville, Indiana), which in turn was connectedto a 15 psi air pressure supply. Each pressure regulator outputs0-3 psi, corresponding linearly to a 0-5 V command signal. Thecoffee-ground-filled cell of each device was connected first to aA04-BW1 three-way solenoid valve (Mead Fluid Dynamics, Inc.,Chicago, IL) that exhausted to atmospheric pressure. The valvewas then connected to an electronic vacuum regulator (ProportionAir, McCordsville, Indiana), which in turn was connected to a 26inHg vacuum supply. Each vacuum regulator outputs 0-25 inHg ofnegative pressure, corresponding linearly to a 0-5 V command sig-
Silicone cell filled with coffee grounds
Air chamber
Air pressure
Force/torquesensor
Vacuum
Electronicregulation
systemSolenoid
valve
Electronicregulation
system
Figure 2: Schematic showing the pneumatic actuators and electronicregulators connected to a single device. The air chamber was con-nected to wall air pressure, and the inside of the coffee-ground-filledcell was connected to wall vacuum. Both air pressure and vac-uum level were independently controlled by computer. A three-waysolenoid valve was connected downstream of the vacuum regulatorto allow for quick switching between vacuum and atmospheric pres-sure.
nal. All valves and regulators were controlled by computer usingan National Instruments USB X Series DAQ interface.
3.2 Relationship between Pneumatic Actuation and De-vice Properties
In order to accurately present rigidity (an alternate terminology fornonlinear stiffness, used in the experiment prompt) and geome-try/size stimuli to our subjects, we characterized (1) the relation-ship between vacuum level and stiffness, and (2) the relationshipbetween chamber pressure and size.
No stiffness data had previously been collected on an unsup-ported cell, so we obtained force-deflection curves at varying vac-uum levels for both experimental devices. Similar to [5], we at-tached an ATI Nano17 force/torque sensor (ATI, Apex, NC) to a 9.5mm 3D-printed plastic hemisphere. This assembly was attached tothe end effector of a SensAble Phantom Premium 1.5 (SensAbleTechnologies, Inc., Wilmington, MA) robot, which was manuallypushed down on the cell (Figure 3). The end effector was posi-tioned directly above the center of the cell and was constrained tomove only along the vertical axis. The Phantom also collected po-sition data along this axis as the end effector depressed the surfaceof the cell. A baseline chamber pressure of 0.6 psi was maintainedin order to restore cell shape after every trial. Each trial was per-formed on both devices for eleven vacuum levels and for five timesfor each vacuum level.
We calculated an overall stiffness for each trial by finding theforce applied at 5 mm of deflection, where the force-deflectioncurve was still approximately linear in all trials. The stiffness wascomputed from this linear region; an average stiffness at each vac-uum level was obtained from all corresponding trials. Average stiff-ness was plotted against vacuum level and fit to a power functionusing a least-squares cost function. The model used was of the form
K = α1 +β1vγ1 , (1)
where K is the stiffness in N/m, v is the vacuum level in in Hg, andα1, β1, and γ1 are the fit parameters. This form of model was chosenbased on a visual assessment of the plot and knowing that evenat no vacuum (i.e. 0 in Hg), the cell has some baseline stiffness,necessitating the α1 parameter. The results of this experiment arepresented in Section 4.1 and were used to select comparison andreference values for the stiffness psychophysical experiment.

Figure 3: Setup used to measure force-deflection data for a singlehaptic jamming cell. A force/torque sensor was attached to the endeffector of a Phantom Premium robot and was used to manually pal-pate the center of the cell. Position data was recorded from the Phan-tom Premium.
We used data collected in [5] to quantify how chamber pressureaffects geometry. In that prior work, the geometry data was re-ported as the eccentricity a/b of the elliptical profile of the inflatedcell (where a is the semi-major axis and b is the semi-minor axis).However, this metric yields an infinite eccentricity for an uninflatedcell (when chamber pressure is 0 psi). We therefore inverted thedata and plotted pressure against 1/Eccentricity b/a in order to forma plot similar to that obtained when evaluating stiffness, and thedata was fit to a power function using a least-squares cost function.The model used was of the form
s = α2 pβ2 , (2)
where s is 1/Eccentricity, p is the chamber pressure in psi, and α2and β2 are the fit parameters. This model type was chosen based ona visual assessment of the plot and knowing that at no pressure (i.e.0 psi), the cell is flat and has a 1/Eccentricity of 0. The results ofthis experiment are presented in Section 4.1 and were used to selectcomparison and reference values for the geometry psychophysicalexperiment.
3.3 Psychophysical Experiments
3.3.1 Subjects
Nine healthy subjects were used to measure the JND, PSE, and WFof stiffness and geometry for the Haptic Jamming devices. Thesubjects consisted of eight males and one female; all were righthanded, and their ages ranged from 21 to 28. All subjects were con-sidered fully trained because they all participated in an earlier pilotof the experiment. The experiment was approved by the StanfordUniversity Institutional Review Board, and subjects gave informedconsent.
3.3.2 Rigidity (Stiffness) Perception
Each subject sat in a chair facing the apparatus, as pictured in Fig-ure 4. The setup consisted of the two unsupported, 1.5-inch celldevices placed side by side. Each device was rigidly attached to thetop of a force/torque sensor in order to record the forces and torquesapplied over the course of the experiment. Both devices were sur-rounded by a curtained box so that subjects could touch the deviceswithout visual feedback.
The two-alternative forced-choice experiment followed themethod of constant stimuli [6]. Subjects were asked to freely ex-plore the lumps on both devices and state which lump felt more
Figure 4: A subject interacts with the experimental apparatus. Twosingle-cell devices were placed side by side and covered by a cur-tain. Subjects were asked to state which device presented a largerstimulus (either rigidity or size) based on touch alone.
rigid. Both devices maintained a baseline chamber pressure of 0.6psi in order to restore shape after every trial.
In each trial, one device presented a reference stimulus value,while the other presented a comparison stimulus value. The refer-ence value was selected to be the middle of possible stiffness valuesbased on the mechanical characterization results described in Sec-tion 4. A total of nine comparison values were selected so thatfour comparison values were smaller than the reference, four werelarger than the reference, and one was equal to the reference. Theextremes of the comparison values were selected to be the smallestand largest possible stiffnesses based on the experiments describedin Section 3.2, and comparison values were equally spaced apartfrom the reference value.
Each of the nine comparison values was presented ten times inrandom order over the course of the experiment, and each com-parison value was presented an equal number of times on each de-vice to avoid a bias for one device over the other. Subjects weretherefore asked to make a total of 90 stiffness comparisons. Sub-jects used the dominant hand to explore the devices until a decisionwas made; they recorded their responses by clicking either ‘Left’ or‘Right,’ corresponding to which device they thought felt more rigid,on a computer GUI. Subject responses and force/torque data wererecorded after every trial. There was no time limit for each trial, andsubjects were asked to make their best guess if the decision seemedtoo difficult. Subjects were given an optional ten-minute break afterafter every forty-five trials.
3.3.3 Geometry Perception
After completing the stiffness perception trials, subjects performedtrials related to perception of geometry (size of the ellipsoidal sur-face). They were asked to determine which of the two devices feltlarger, following the same procedures described in Section 3.3.2. Atotal of nine geometry values were selected so that four compari-son values were smaller than the reference, four were larger thanthe reference, and one was equal to the reference (see Section 4 forcomparison values). The reference geometry value was selected tobe the mean of the geometry values corresponding to 0.2 psi and1.5 psi (the range of values tested in the data acquired in Section3.2). This pressure range was chosen to correspond most closely tothe curve fit in Figure 6 and to protect the air chamber from damagecaused by too high of a pressure.

0 1 2 3 4 50
1
2
3
4
5
6
7
8
9
10
Deflection (mm)
Forc
e (N
)
0 in Hg1 in Hg2 in Hg3 in Hg4 in Hg6 in Hg8 in Hg10 in Hg15 in Hg20 in Hg24 in HgLeft DeviceRight Device
Figure 5: Force (N) plotted against deflection (mm) for all vacuum lev-els and both devices. The solid lines represent data from the deviceused on the left during the psychophysical experiments; the dashedlines represent data from the righthand device.
4 RESULTS
4.1 Device PropertiesThe force-deflection data obtained from both devices were plottedtogether for all vacuum levels (Figure 5). We identified a deflectionof 5 mm as a location where all the trials remained in the linear re-gion. Based on research suggesting that stiffness is perceived as theforce applied divided by the perceived penetration [18], we dividedthe force at 5 mm of deflection by 5 mm to obtain the stiffness. Theaverage stiffness for each vacuum level was plotted against vacuumlevel (Figure 6).
The data obtained from the stiffness and shape data collectionexperiments described in Section 3.2 were found to satisfactorilyfollow the proposed model function shapes. For the relationship be-tween rigidity and vacuum level, the fit had an R2 value of 0.9904,and the parameters α1, β1, and γ1 from Equation (1) were 121.0305N/m, 215.0339 N/m, and 0.6269, respectively. For the relation-ship between 1/Eccentricity and chamber pressure, the fit had anR2 value of 0.9908, and the parameters α2 and β2 from Equation(2) were 0.6965 and 0.4837, respectively.
Reference and comparison values for the psychophysical experi-ments were selected based on the curve fits. For stiffness, the refer-ence value was chosen to be 929.9 N/m, the value halfway betweenthe highest and lowest possible stiffnesses. The reference valuewas included as one comparison value, and the other comparisonvalues were then chosen to be equally spaced apart (in stiffness val-ues) from the reference value to the extremes on either side. Thecomparison values used in the stiffness psychophysical experimentwere 121.0, 323.3, 525.5, 727.7, 929.9, 1132.1, 1134.3, 1536.6, and1738.8 N/m.
For 1/Eccentricity, the reference value was chosen to be 0.584,the mean value of the eccentricities corresponding to 0.2 and 1.5psi. The reference value was included as one comparison value, andthe other comparison values were then chosen to be equally spacedapart (in b/a values) from the reference value to these boundaryeccentricities. The comparison values used in the geometry psy-chophysical experiment were 0.320, 0.386, 0.452, 0.518, 0.584,0.650, 0.716, 0.782, and 0.848.
4.2 Psychophysical ResultsFor the stiffness and size psychophysical experiments, the propor-tion of times each subject responded that the comparison value was
0 0.2 0.4 0.6 0.8 1 1.2 1.4 1.60
0.1
0.2
0.3
0.4
0.5
0.6
0.7
0.8
0.9
1
1/Ec
cent
ricity
(b/a
)
Pressure Level (psi)
0 5 10 15 20 250
200
400
600
800
1000
1200
1400
1600
1800
2000
Stiff
ness
(N/m
)
Vacuum Level (in Hg)
Figure 6: (Top) Stiffness (N/m) plotted against vacuum level (in Hg).Blue dots represent individual palpation trials, the red markers rep-resent the average for all trials from each vacuum level, and the blueline is the power function curve fit. The R2 value for the fit was 0.9904.All trials for both devices were plotted together due to high variabilityfor each trial. (Bottom) 1/Eccentricity of a cell inflation profile plot-ted against chamber pressure (psi). The red markers represent datafrom an individual trial, and the blue line is the power function curvefit. The R2 value for the fit was 0.9908.greater than the reference value was plotted against the comparisonvalues. A psychometric function was fit to each plot using the psig-nifit MATLAB toolbox (http://bootstrap-software.org/psignifit/).Example plots and fits for a representative subject are shown inFigure 7. The toolbox reports three relevant values: the PSE, thestimulus value corresponding to a proportion of 0.25 (J25), and thestimulus value corresponding to a proportion of 0.75 (J75). TheJND is defined to be the mean of the differences between the PSEand these two J values, or
JND =(PSE − J25)+(J75 −PSE)
2(3)
The WF is calculated using
WF =JNDPSE
(4)
The results of the psychophysical experiments are summarizedin Table 1. The average WF for stiffness perception was 16.0%with a standard deviation of 7.4%, and the average WF for size per-ception was 14.3% with a standard deviation of 2.6%. For each sub-ject, the average peak force applied in the direction normal to the

Table 1: Results from the stiffness (left) and size (right) psychophysical experiments. For the stiffness experiment, mean peak force appliednormal to the device surface (i.e. pressing down) was reported for each subject. For the size experiment, mean peak resultant torque in theplane of the device surface (i.e. pressing from side-to-side to determine shape) was reported for each subject..
Rigidity (Stiffness) Perception Experiment Geometry (1/Eccentricity) Perception Experiment
Subject JND (N/m) PSE (N/m) Weber Mean Peak JND (m/m) PSE (m/m) Weber Mean PeakFraction (%) z-Force (N) Fraction (%) xy-Torque (N*m)
1 231.5 1015.9 22.8 7.21 0.10 0.59 16.9 0.222 141.6 955.9 14.8 8.40 0.06 0.59 10.5 0.133 100.3 945.2 10.6 12.98 0.08 0.59 13.3 0.214 200.1 984.1 20.3 5.61 0.09 0.59 14.7 0.145 90.5 992.9 9.1 7.83 0.08 0.61 12.9 0.116 327.2 1263.2 25.9 5.44 0.11 0.60 18.5 0.147 183.2 858.4 21.4 8.17 0.08 0.59 13.4 0.088 162.8 998.8 16.3 10.59 0.07 0.59 12.1 0.109 28.0 908.5 3.0 8.97 0.10 0.59 16.4 0.12
Mean 162.74 991.42 16.03 8.36 0.09 0.59 14.33 0.14Std. Dev. 87.63 113.22 7.40 2.36 0.02 0.01 2.61 0.05
plane of the device surface was calculated for each stiffness trial,and the average peak resultant torque in the plane of the device sur-face was found for each shape trial in order to test for correlationsbetween any psychophysical metric (JND, PSE, or WF) and theforces/torques applied to the devices. After linear regression, mini-mal correlation (R2 ≤ 0.4) was found for all of these comparisons.
5 DISCUSSION
When compared to WF values reported in other literature (as men-tioned in the Section 2), the values found in our experiments seemreasonable for both stiffness and size. Additionally, no large cor-relation was found between forces/torques applied and subject per-ception (as described in the previous section), indicating that thesubjects likely did not rely on applied forces to judge rigidity andsize. This result seems promising for accurate portrayal of desiredstiffnesses and geometries in future implementation of a medicaltraining device, as the device may be used by people who applydifferent magnitudes of forces. The psychophysical metrics calcu-lated in this paper can help optimize the designs of jamming sys-tems for use as haptic displays. The JND and WF contribute insightinto the ranges of stiffnesses and geometries that a device should becapable of outputting in order for the user to perceive a variety oftactile sensations from different configurations. They also help ap-proximate the actuator resolution necessary for the device to displaythese ranges smoothly, as perceived by the human sense of touch.
Further psychophysical experiments could yield more informa-tion about human perception of these devices. The mean peakforces exerted by the subjects exceeded the maximum forces shownin Figure 5 because the subjects plastically deformed the devicesduring each trial. The experiments shown in Figure 5 served tocharacterize linear stiffness and so did not broach into the plasticregime. Additionally, the properties of the granular material mayin fact change after repeated deformation. Future work can attemptto characterize the effects of repeated and plastic deformation onperception.
We also conducted these experiments using one baseline pres-sure for stiffness and no vacuum for geometry. These two proper-ties, however, likely depend on each other, and so human perceptionof these two properties will also depend on each other. In addition,although the WF ideally remains constant for all reference values,this ideal needs to be tested and supported by experimental data.
Modifications to the devices used in the psychophysical exper-iments presented in this paper could yield more accurate results.During manufacturing, we realized that creating two completelyidentical devices was extremely difficult. The amount that a cellstiffens when subjected to vacuum or balloons when subjected to
pressure depends the amount of coffee grounds within the cell, anddespite use of a measuring spoon, the granular nature of the coffeegrounds made it hard to tell exactly what volume of coffee groundshad been inserted into the cells. Additionally, the coffee groundshave a tendency to move within the cell, meaning that multiple pal-pations could present different stiffnesses (as shown by the highvariability in the calculated stiffness values in Figure 6. Subjectchose the left device more often than the right device (69.6% of thetime, on average) in the size experiments, meaning that the amountof coffee grounds in each cell could have differed by a significantamount or that the compliance of the silicone could have differed.More systematic methods of mixing silicone and inserting coffeegrounds may improve system performance and lower the JNDs.
6 CONCLUSION
Creating an effective tactile display and controlling it for haptic in-teractions requires sufficient understanding of the human percep-tion of the physical properties it presents. We conducted a set ofperceptual experiments to evaluate how the levels of vacuum andair pressure applied to our device affect the perception of size andrigidity in this particular setup. Quantitative measures of deviceoutput (stiffness and eccentricity) provided the basis for the refer-ence levels and step sizes in each of the perceptual experiments.Data from all subjects fit sufficiently to psychometric functions andthe mean JNDs, PSEs, and Weber fractions for both experimentsare within range of similar metrics calculated for human perceptionof stiffness and size in prior research using other devices. This re-sult suggests that our device is an effective means to present userswith environments of varying stiffness and shape.
More thorough characterization of human perception of a HapticJamming display can be performed. In particular, we are interestedin gauging the feasibility of using the device in medical simulationas a training tool for palpation tasks or other procedures that requirea clinician to rely upon his or her sense of touch to make a diagno-sis. For example, a Haptic Jamming display could alter its state torepresent a variety of tissue types with embedded lumps of vary-ing compliance to simulate tumors or fluid-filled cysts. Toward thisend, we plan on conducting an exploratory palpation experimentto evaluate the effects of vacuum level, air chamber pressure, celldiameter, and thickness of a separate covering material on a user’sability to pinpoint the locations of lumps on a larger display.
Additionally, we plan on integrating a Haptic Jamming displayonto the end effector of a robot that will move it around a largerworkspace. The user will look at a spatially aligned virtual en-vironment and freely explore the encountered-type haptic displaybeneath it. A hand tracker will allow the robot to move the display

0.3 0.4 0.5 0.6 0.7 0.8 0.90
0.1
0.2
0.3
0.4
0.5
0.6
0.7
0.8
0.9
1
1/Eccentricity (b/a)
Prop
ortio
n (C
ompa
rison
> R
efer
ence
)
200 400 600 800 1000 1200 1400 1600 18000
0.1
0.2
0.3
0.4
0.5
0.6
0.7
0.8
0.9
1
Stiffness (N/m)
Prop
ortio
n (C
ompa
rison
> R
efer
ence
)
Figure 7: Example psychophysical data and psychometric functionfits for a representative subject, Subject 8. (Top) The subject showedgood discrimination of stiffness. Every value greater than the ref-erence was judged to be greater, and every value lesser than thereference judged to be lesser, most of the time. (Bottom) The subjectwas not as discriminatory for size but was still able to locate valuesabove and below reference most of the time..
to the current location of exploration and adjust the properties ofthe haptic jamming device to match the characteristics of that par-ticular region of the environment. Further studies will examine theeffects of adding this form of encountered-type haptic feedback onthe realism of the virtual environment as a whole.
ACKNOWLEDGEMENTS
This work was supported by U.S. Army Medical Research and Ma-teriel Command grant #W81XWH-11-C-0050 (to AMO), the Na-tional Science Foundation Graduate Research Fellowship Program(to AAS), and Stanford University (to AMG). Any opinions, find-ings, and conclusions or recommendations in this material are thoseof the authors and do not necessarily reflect the views of the spon-sors.
REFERENCES
[1] C. Wagner, S. Lederman, and R. Howe. A tactile shape display usingRC servomotors. In Symposium on Haptic Interfaces for Virtual Envi-ronment and Teleoperator Systems, pp. 354-355, 2002.
[2] P. Taylor, D. Pollet, A. Hosseini-Sianaki, and C. Varley. Advances inan electrorheological fluid based tactile array. Displays, 18(3):135-141,1998.
[3] Y. Liu, R. Davidson, P. Taylor, J. Ngu, and J. Zarraga. Single cell mag-netorheological fluid based tactile display. Displays, 26(1):29-35, 2005.
[4] H. Zhu and W. J. Book. Control Concepts For Digital Clay. In Proc. 7thIFAC Symposium on Robot Control, pages 347-352, 2003.
[5] A. Stanley, J. Gwilliam, and A. Okamura. Haptic jamming: A de-formable geometry, variable stiffness tactile display using pneumaticsand particle jamming. In Proc. IEEE World Haptics Conference, pp.25-30, 2013.
[6] G. Gescheider. Psychophysics: Method, Theory, and Application. 2nded., pp. 1-46. Hillsdale, New Jersey: Lawrence Erlbaum Associates,Inc, 1985.
[7] R. H. LaMotte. Softness discrimination with a tool. Journal of Neuro-physiology, 83(4):1777-1786, 2000.
[8] P. E. Roland and H. Ladegaard-Pedersen. A quantitative analysis of sen-sations of tensions and of kinaesthesia in man. Brain, 100(4):671-692,1977.
[9] M. A. Srinivasan and R. H. LaMotte. Tactual discrimination of soft-nesss. Journal of Neurophysiology, 73(1):88-101, 1995.
[10] H. Z. Tan, X. D. Pang, and N. I. Durlach. Manual resolution of length,force, and compliance. In the Proceedings of the First Symposium onHaptic Interfaces for Virtual Environment and Teleoperator Systems,American Society of Mechanical Engineers Dynamic Systems and Con-trol Division, pp. 13-18, 1992.
[11] J. R. Amend, E. Brown, N. Rodenberg, H. M. Jaeger, and H. Lipson. APositive Pressure Universal Gripper Based on the Jamming of GranularMaterial. IEEE Transactions on Robotics, Vol. 28, No. 2, pp. 341-350,2012.
[12] N. G. Cheng, M. B. Lobovsky, S. J. Keating, A. M. Setapen, K. I.Gero, A. E. Hosoi, and K. D. Iagnemma. Design and analysis of a ro-bust, low-cost, highly articulated manipulator enabled by jamming ofgranular media. In Proc. IEEE International Conference on Roboticsand Automation, pp. 4328-4333, 2012.
[13] E. Steltz, A. Mozeika, N. Rodenberg, E. Brown, and H. M. Jaeger.JSEL: Jamming Skin Enabled Locomotion. In Proc. IEEE/RSJ Inter-national Conference on Intelligent Robots and Systems, pp. 5672-5677,2009.
[14] S. Follmer, D. Leithinger, A. Olwal, N. Cheng, and H. Ishii. Jamminguser interfaces: Programmable particle stiffness and sensing for mal-leable and shape-changing devices. In Proc. ACM Symposium on Userinterface software and technology, pp. 519-528, 2012.
[15] A. Mazzone, C. Spagno, and A. Kunz. The HoverMesh: A De-formable Structure Based on Vacuum Cells. In Proc. ACM SIGCHI In-ternational Conference on Advances in Computer Entertainment Tech-nology, pp. 187-193, 2004.
[16] N. Aihara, T. Sato, and H. Koike. Highly deformable interactive 3Dsurface display. In Proc. ACM Symposium on User Interface Softwareand Technology, pp. 91-92, 2012.
[17] T. Mitsuda, S. Kuge, M. Wakabayashi, and S. Kawamura. Wearableforce display using a particle mechanical constraint. Presence: Teleop-erators and Virtual Environments, 11(6):569-577, 2002.
[18] A. Pressman, L. J. Welty, A. Karniel, and F. A. Mussa-Ivaldi. Percep-tion of Delayed Stiffness. The International Journal of Robotics Re-search, 26(11-12), 1191-1203, 2007.
![Multilayer Haptic Feedback for Pen-Based Tablet Interaction · 2019-02-14 · jamming interfaces [20] and Tablehop [67] provide flexible and shape-changing user interfaces with controllable](https://img.pdfslide.net/doc/110x75/5f5b1cbbe785d96702135b17/multilayer-haptic-feedback-for-pen-based-tablet-interaction-2019-02-14-jamming.jpg)