Embed Size (px)
Citation preview

Contract n° 2017CE160AT133 Prepared by: Ipsos Date: 9 March 2020
Regional and Urban Policy
Perception Survey on the Quality of
Life in European Cities 2019
Evaluation Report

EUROPEAN COMMISSION
Produced by on behalf of the Directorate-General for Regional and Urban Policy
Unit B1 - Policy Development and Economic Analysis
E-mail: [email protected]
European Commission
B-1000 Brussels

EUROPEAN COMMISSION
Directorate-General for Regional and Urban Policy 2020 3
Perception Survey on the Quality of
Life in European Cities 2019
Evaluation Report

EUROPEAN COMMISSION
Directorate-General for Regional and Urban Policy 2020 5


TABLE OF CONTENTS
1 INTRODUCTION ..................................................................................................... 5
2 PROJECT OVERVIEW .............................................................................................. 6
2.1 Timing ............................................................. Error! Bookmark not defined.
2.2 Sample design.............................................................................................. 6
2.2.1 Sample size and associated margin of error ........................................ 6
2.2.2 Sample methodology ........................................................................ 7
2.3 Questionnaire design ................................................................................... 14
2.3.1 Screening questions ....................................................................... 14
2.3.2 Socio-demographic background questions ......................................... 16
2.3.3 Weighting questions ....................................................................... 16
2.3.4 Changes related to GDPR compliance ............................................... 17
2.4 Pilot testing................................................................................................ 18
2.5 Main fieldwork ............................................................................................ 18
2.5.1 Timing .......................................................................................... 18
2.5.2 Fieldwork follow-up ........................................................................ 18
2.6 Reporting and data delivery ......................................................................... 19
2.6.1 Pre-fieldwork reporting ......................... Error! Bookmark not defined.
2.6.2 Data delivery ................................................................................ 19
3 WEIGHTING ........................................................................................................ 20
3.1 Weighting procedure ................................................................................... 20
3.1.1 Post-stratification & design weighting ............................................... 20
3.1.2 Weight trimming ............................................................................ 22
3.2 Weighting benchmarks ................................................................................ 23
3.2.1 Age and gender ............................................................................. 23
3.2.2 Phone ownership ........................................................................... 24
3.3 Design effects and weighting efficiency per city .............................................. 26
4 SAMPLE PERFORMANCE ANALYSIS ......................................................................... 28
4.1 Target population versus achieved distribution ............................................... 28
4.1.1 Age .............................................................................................. 28
4.1.2 Gender ......................................................................................... 33
4.1.3 Phone ownership ........................................................................... 35
4.1.4 Eligibility ....................................................................................... 37
5 FIELDWORK PERFORMANCE ANALYSIS ................................................................... 40
5.1 Interview validation .................................................................................... 40
5.2 Interview breakoffs ..................................................................................... 41
5.3 Item non-response ..................................................................................... 41
5.4 Response rates ........................................................................................... 43
6 DATA COMPARISON 2019-2015 ............................................................................. 46
7 RECOMMENDATIONS FOR FUTURE WAVES .............................................................. 47
ANNEX 1. FINAL QUESTIONNAIRE ................................................................................. 49

1 Introduction
This evaluation report is one of two parts of the final report for the 2019 Perception Survey
on the Quality of Life in European Cities. It presents an overview of the design, preparation
and execution of the Perception Survey. It also discusses the survey’s performance in
terms of sampling, fieldwork quality and accuracy of the collected data. Finally, this report
also lays out some recommendations for possible changes to the survey design that could
improve the performance of future waves of the Perception Survey.
This evaluation report is accompanied by a technical report, which forms the second part
of the final report. The technical report lists, per city, the most important sample
performance data (amount of sample used, eligibility rate, refusals, response rate, average
interview length, etc.)

2 Project overview
This chapter gives a concise overview of the different steps of the 2019 Perception Survey,
from the questionnaire design until the final data deliveries.
2.1 Sample design
The Perception Survey targets citizens of all (greater) cities within the scope of the survey
– covering a total of 83 cities. The target population includes all people aged 15 and above,
who satisfy the requirements outlined below:
1. Being a resident of the city surveyed;
2. Having sufficient command of (one of) the respective national/regional
language(s) or English, which allows them to comfortably answer the
questionnaire;
3. Living in a private household, which means that the target population will exclude
prisoners, residents of retirement homes, etc. who are difficult to reach via a
telephone survey.
Regarding the first requirement, the scope is technically defined for each city in terms of a
set of Local Area Units (LAUs) that together comprise the area of the city under scope. The
residence of a given respondent in one of these LAUs determines their eligibility for the
survey. The list of LAUs in scope per city is added to this Evaluation Report as Annex 2.
Regarding the second requirement, the language command was assessed by the
interviewer at the start of the survey. In case it was clear that a respondent is not able to
answer questions in one of the official languages, they were offered to conduct the
interview in English.
Regarding the third requirement, the survey in practice targeted all residents aged 15+
with private access to a telephone, which is de facto confirmed by a given respondent being
reachable by phone during the fieldwork.
2.1.1 Sample size and associated margin of error
The target sample size was 700 complete interviews in each city surveyed. This means
that interviews were gathered from 58 100 respondents in total, all of which are citizens
who are resident in one of the (greater) cities under scope The following chart depicts how
the margin of error associated with survey estimates can vary as a function of sample size,
assuming a confidence level of 95%.

Quality of Life in European Cities Survey 2019
Directorate-General for Regional and Urban Policy 2020 7
2.1.2 Sample methodology
Telephone samples require a specific design in order to cover the entire target population
and to reduce a) potential coverage bias and b) non-response bias. Some aspects are
country-specific, such as prefixes, operators, overall telephone penetration, penetration of
mobile phones and penetration of mobile only. As a growing share of the population is
becoming “mobile only” (i.e. persons who only have access to a mobile phone), the optimal
composition of telephone samples should take into account the incidence of households
that are reachable only via mobile numbers. Each telephone mode (fixed line or mobile)
also covers a specific profile with parameters such as age and urbanization degree.
According to the 2017 Eurobarometer on E-communications, omitting “mobile only”
persons implies 37% of the EU households are not included in the sample frame.1
In order to ensure maximum population coverage resulting in a representative sample, a
mixed (or “dual frame”) approach was taken for this Perception Survey, which takes into
account the respective distributions of persons who only have access to a mobile phone
(i.e. “mobile only”), persons who only have access to a fixed line phone (i.e. “fixed only”)
and persons who have access to both mobile and fixed line phones (i.e. “mixed”). Based
on these data, the necessary distribution of mobile phone and landline sample units needed
in the sample frame is calculated. By utilizing two separate, overlapping sample frames to
interview a population of interest, this approach currently guarantees the maximum and
most representative coverage of the population of interest.
Below we provide an overview of the methodology used for sampling, including the
procedures for random selection of telephone numbers from the sampling frames as well
as for respondent selection within a given household. Both are identical across the
surveyed cities.
The sampling frames based on the dual-frame methodology proposed were developed via
the following steps:
Step 1: Sampling frames
1 http://ec.europa.eu/commfrontoffice/publicopinion/index.cfm/ResultDoc/download/DocumentKy/83478
±9.8%
±6.9%
±5.7%
±4.9%
±4.4%±4.0%
±3.7%±3.5%
±3.3% ±3.1% ±3.0% ±2.8% ±2.7% ±2.6% ±2.5%
100 200 300 400 500 600 700 800 900 1000 1100 1200 1300 1400 1500
Ma
rgin
of
Err
or
Required Sample Size

Quality of Life in European Cities Survey 2019
Directorate-General for Regional and Urban Policy 2020 8
For every city, a random gross sample was drawn from a larger sample frame. This ensures
that each person belonging to the target universe will have a chance to participate in the
survey.
The landline sample was generated through Random Digit Dialling (RDD). With RDD,
dedicated software is used to generate telephone numbers, starting from an initial list of
prefixes (which can be linked to a great extend to cities) and primary numbers. This initial
list is taken from available public records like registers and phone books. From the numbers
in this list, new telephone numbers are created and used by adding and subtracting digits
from the existing telephone number. For example if in the register/phone book
+322/xxx.xx.xx links to the city of Brussels, then new telephone numbers for Brussels can
be generated keeping the prefix and replacing e.g. the last two digits (e.g.
+322/xxx.xx.yy). In this way the number has been randomly generated.
The mobile sample is compiled based on national phone number registers (if available
for mobile numbers in a given country) and through publicly available online data (such as
from social media). It should be noted that such data is collected anonymously and only
with reference to the available geographic information linked to the number (such as the
country or region in which the phone number resides). The latter is necessary to identify
the mobile phone number as belonging to a certain country or city.
Where detailed geographic information is available it was also used to verify in this first
stage that the numbers in the sample are spread proportionally over the different
subregions of the city. Concretely, we wanted to avoid that most or all of the sample is
located in one specific subregion of a city, which could greatly bias the results of the
Survey.
The composition of the prefixes and primary numbers is thus a key element to guarantee
that sufficient geographical spread can be obtained. Once the primary numbers and their
geographic information are determined, the landline samples for specific cities are
generated via Random Digit Dialling. Next the sample is pulsed to filter out non-connected
and invalid numbers (=numbers that don’t exist/don’t result in a connection) as well as
business/non-residential numbers.
Step 2: Gross sample composition
When the sample frames per city are determined, the gross samples can be drawn from
it. As already indicated above, the 2019 Perception Survey uses a dual frame sampling
approach, using both mobile and fixed line numbers. The mobile sample is drawn at random
from the available mobile numbers for each city. To determine the size of the gross sample
needed for a target complete sample of 700 per city, we estimate the necessary
oversampling rate based on an assumed response rate, and set the oversampling rate
in the gross samples for the main field is defined at a ratio of 1:24. This amounts
to a gross sample of 16 800 numbers per city.
For each city, separate landline and mobile frames are built and separate samples
are drawn from that for each city. The size of the sample drawn per phone type depends
on the phone type ownership data for each city. However, as reliable statistics on phone
ownership on city level are not available, the proportion of mobile and landline numbers in
each city sample is based on available data on the country level (i.e., for all cities in a
given country we use the same phone type distribution). For the EU countries, United
Kingdom, Norway and Iceland the distribution data are calculated based on phone

Quality of Life in European Cities Survey 2019
Directorate-General for Regional and Urban Policy 2020 9
ownership data collected in the 2017 wave of the Consumer Market Monitoring Survey.2
The rationale behind using these alternative targets is further elaborated in the weighting
section. For the other countries, phone ownership data is based on the latest available
Eurobarometer data or on data made available by local statistics institutes. The phone
ownership targets are used for defining the sampling frames, but are also used for
monitoring the sample performance during the fieldwork and used for weighting.
Population statistics on phone ownership distinguish between landline ownership, mobile
phone ownership and mixed ownership (i.e., those who have both types of phone).
However, in order to determine the proportion of landline and mobile numbers in our gross
samples, the “mixed” population needs to be recalculated to come to a binary sample
distribution. For that reason, the mobile and landline samples are defined and calculated
as follows:
Mobile sample: potential respondents within a given country that can be reached via a
mobile line (regardless of whether they can also be reached via a fixed line). As such, this
sample includes respondents from both the mobile only and mixed population.
% 𝑴𝒐𝒃𝒊𝒍𝒆 𝒔𝒂𝒎𝒑𝒍𝒆 =𝑷𝒓𝒐𝒑𝒐𝒓𝒕𝒊𝒐𝒏 𝒐𝒇 𝒎𝒐𝒃𝒊𝒍𝒆 𝒍𝒊𝒏𝒆𝒔
𝑻𝒐𝒕𝒂𝒍 𝒑𝒐𝒑𝒖𝒍𝒂𝒕𝒊𝒐𝒏 𝒐𝒇 𝒑𝒉𝒐𝒏𝒆 𝒏𝒖𝒎𝒃𝒆𝒓𝒔=
𝑴 + 𝑴𝑭
(𝑴 + 𝑴𝑭) + (𝑭 + 𝑴𝑭)
F = fixed only; M = mobile only; and MF = mobile and fixed (mixed)
Fixed sample: potential respondents within a given country that can be reached via a
fixed line (regardless of whether they can also be reached via mobile line). As such, this
sample includes respondents from both the fixed line only and mixed population.
%𝑭𝒊𝒙𝒆𝒅 𝒍𝒊𝒏𝒆 𝒔𝒂𝒎𝒑𝒍𝒆 =𝑷𝒓𝒐𝒑𝒐𝒓𝒕𝒊𝒐𝒏 𝒐𝒇 𝒇𝒊𝒙𝒆𝒅 𝒍𝒊𝒏𝒆𝒔
𝑻𝒐𝒕𝒂𝒍 𝒑𝒐𝒑𝒖𝒍𝒂𝒕𝒊𝒐𝒏 𝒐𝒇 𝒑𝒉𝒐𝒏𝒆 𝒏𝒖𝒎𝒃𝒆𝒓𝒔=
𝑭 + 𝑴𝑭
(𝑴 + 𝑴𝑭) + (𝑭 + 𝑴𝑭)
F = fixed only; M = mobile only; and MF = mobile and fixed (mixed)
For example, if Germany would be set to have the following proportions in the study: 83%
mixed, 9% fixed only, 8% mobile only, the local teams would compose a gross sample of
50.3% fixed numbers, calculated as ((83%+9%)/((83%+9%)+(83%+8%))), and 49.7%
mobile numbers ((83%+8%)/((83%+9%)+(83%+8%))).
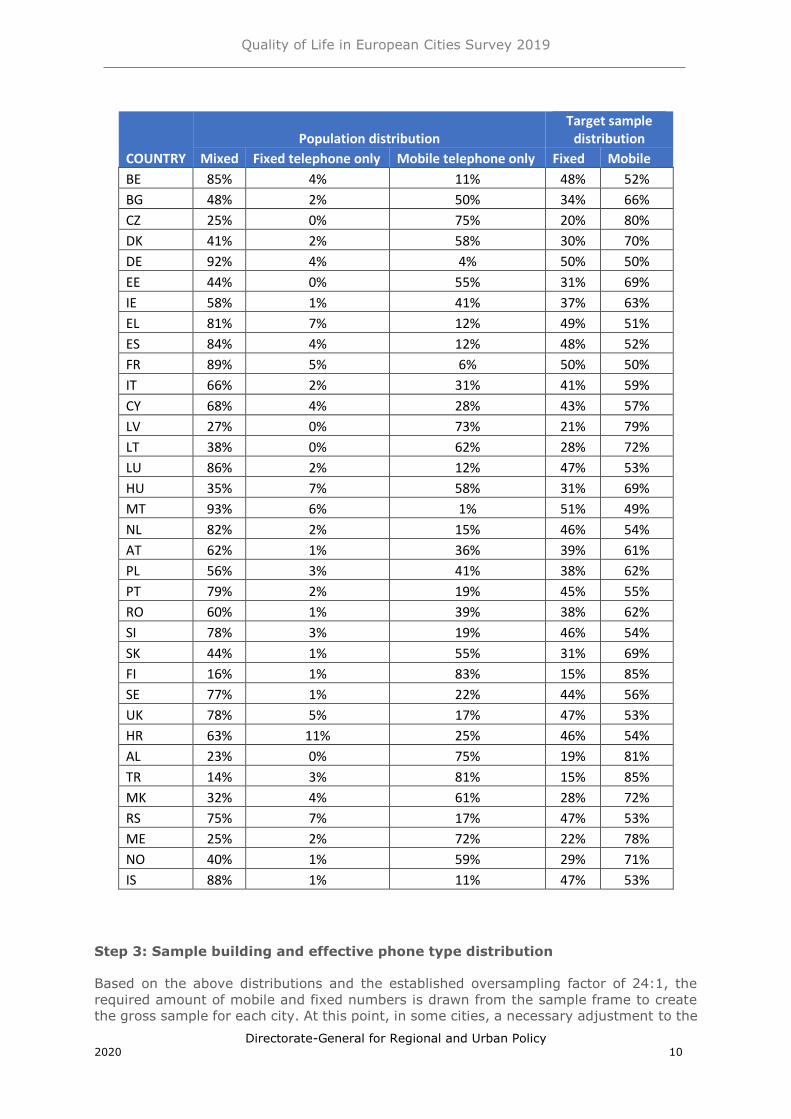
It should be noted that these distributions are not fixed targets but are rather used as an
instrument to determine the composition of the gross samples so that they are maximally
representative of the population in terms of phone ownership. As such, they represent the
calling proportion of mobile versus fixed lines within each country. The table below presents
an example of how the % Mobile sample and % Fixed sample are linked to these
distributions of phone ownership for each country, based on available phone ownership
data.
2 https://ec.europa.eu/info/policies/consumers/consumer-protection/evidence-based-consumer-policy/market-monitoring_en
Quality of Life in European Cities Survey 2019
Directorate-General for Regional and Urban Policy 2020 10
COUNTRY
Population distribution Target sample
distribution
Mixed Fixed telephone only Mobile telephone only Fixed Mobile
BE 85% 4% 11% 48% 52%
BG 48% 2% 50% 34% 66%
CZ 25% 0% 75% 20% 80%
DK 41% 2% 58% 30% 70%
DE 92% 4% 4% 50% 50%
EE 44% 0% 55% 31% 69%
IE 58% 1% 41% 37% 63%
EL 81% 7% 12% 49% 51%
ES 84% 4% 12% 48% 52%
FR 89% 5% 6% 50% 50%
IT 66% 2% 31% 41% 59%
CY 68% 4% 28% 43% 57%
LV 27% 0% 73% 21% 79%
LT 38% 0% 62% 28% 72%
LU 86% 2% 12% 47% 53%
HU 35% 7% 58% 31% 69%
MT 93% 6% 1% 51% 49%
NL 82% 2% 15% 46% 54%
AT 62% 1% 36% 39% 61%
PL 56% 3% 41% 38% 62%
PT 79% 2% 19% 45% 55%
RO 60% 1% 39% 38% 62%
SI 78% 3% 19% 46% 54%
SK 44% 1% 55% 31% 69%
FI 16% 1% 83% 15% 85%
SE 77% 1% 22% 44% 56%
UK 78% 5% 17% 47% 53%
HR 63% 11% 25% 46% 54%
AL 23% 0% 75% 19% 81%
TR 14% 3% 81% 15% 85%
MK 32% 4% 61% 28% 72%
RS 75% 7% 17% 47% 53%
ME 25% 2% 72% 22% 78%
NO 40% 1% 59% 29% 71%
IS 88% 1% 11% 47% 53%
Step 3: Sample building and effective phone type distribution
Based on the above distributions and the established oversampling factor of 24:1, the
required amount of mobile and fixed numbers is drawn from the sample frame to create
the gross sample for each city. At this point, in some cities, a necessary adjustment to the

Quality of Life in European Cities Survey 2019
Directorate-General for Regional and Urban Policy 2020 11
target phone type distribution was made. This is done when there were not enough primary
phone numbers with geolocation information to reach the target amount of mobile phone
numbers for the gross sample. While sources to collect primary landline numbers from are
abundantly available, for some cities such information is much less easy to collect, either
because public listings are incomplete or because it depends on what information is publicly
obtainable via social media and other open sources. This explains why there can be clear
differences even within a country. Extra data collection efforts were made for cities where
the originally available primary number list was insufficient. A number of possible ways to
tackle this issue were considered. A first possibility was to include in the gross sample also
mobile phone numbers for which no geographic information is available. This, however,
would in most cities considerably raise the risk of lowering the incidence rate of the sample
(i.e., the amount of respondents on mobile numbers that live in the target cities), because
for any random mobile phone number in a given country the chances are low that the
associated respondent lives in one of the target cities. Including such numbers would then
decrease the calling efficiency and therefore increasing the time and resources needed for
the fieldwork. Therefore, this option was only applied in countries where the population of
the target city/cities is a considerable part of the total country population – and where
there is consequently a high enough chance that a randome mobile phone respondent is a
resident of the target city. Specifically, this was done in Valletta (Malta) and Luxembourg
City (Luxembourg).
In countries where this was not a practically feasible option, the lower proportion of mobile
phone numbers was compensated by adding more landline numbers to the gross sample.
This led to the following effective stratification of the gross sample for phone type, in each
city:
TARGET (%) SAMPLE (%)
Mobile Fixed Mobile Fixed
Graz 61% 39% 61% 39%
Wien 61% 39% 61% 39%
Antwerpen 52% 48% 52% 48%
Bruxelles / Brussel 52% 48% 52% 48%
Liège 52% 48% 52% 48%
Burgas 66% 34% 56% 44%
Sofia 66% 34% 66% 34%
Zagreb 54% 46% 54% 46%
Lefkosia 57% 43% 23% 77%
Ostrava 80% 20% 73% 27%
Praha 80% 20% 80% 20%
Aalborg 70% 30% 70% 30%
København 70% 30% 70% 30%
Tallinn 69% 31% 29% 71%
Helsinki / Helsingfors 85% 15% 85% 15%
Oulu / Uleåborg 85% 15% 85% 15%
Bordeaux 50% 50% 50% 50%
Lille 50% 50% 50% 50%
Marseille 50% 50% 50% 50%
Rennes 50% 50% 50% 50%
Strasbourg 50% 50% 50% 50%
Paris 50% 50% 50% 50%

Quality of Life in European Cities Survey 2019
Directorate-General for Regional and Urban Policy 2020 12
Berlin 50% 50% 50% 50%
Dortmund 50% 50% 50% 50%
Essen 50% 50% 50% 50%
Hamburg 50% 50% 50% 50%
Leipzig 50% 50% 50% 50%
Munich 50% 50% 50% 50%
Rostock 50% 50% 40% 60%
Athina 51% 49% 51% 49%
Irakleio 51% 49% 32% 68%
Budapest 69% 31% 64% 36%
Miskolc 69% 31% 19% 81%
Dublin 63% 37% 63% 37%
Bologna 59% 41% 59% 41%
Naples 59% 41% 59% 41%
Palermo 59% 41% 59% 41%
Rome 59% 41% 59% 41%
Turin 59% 41% 59% 41%
Verona 59% 41% 52% 48%
Vilnius 72% 28% 30% 70%
Luxembourg 53% 47% 53% 47%
Riga 79% 21% 11% 89%
Valletta 49% 51% 49% 51%
Amsterdam 54% 46% 48% 52%
Groningen 54% 46% 28% 72%
Rotterdam 54% 46% 52% 48%
Białystok 62% 38% 62% 38%
Gdańsk 62% 38% 62% 38%
Kraków 62% 38% 62% 38%
Warszawa 62% 38% 62% 38%
Braga 55% 45% 55% 45%
Lisboa 55% 45% 55% 45%
Bucharest 62% 38% 62% 38%
Cluj-Napoca 62% 38% 62% 38%
Piatra Neamt 62% 38% 32% 68%
Bratislava 69% 31% 69% 31%
Košice 69% 31% 52% 48%
Ljubljana 54% 46% 54% 46%
Barcelona 52% 48% 52% 48%
Madrid 52% 48% 52% 48%
Málaga 52% 48% 52% 48%
Oviedo 52% 48% 52% 48%
Malmö 56% 44% 29% 71%
Stockholm 56% 44% 56% 44%
Belfast 53% 47% 53% 47%

Quality of Life in European Cities Survey 2019
Directorate-General for Regional and Urban Policy 2020 13
In cities where the proportion of mobile phone numbers in the gross sample was lower
than the assumed country proportion, mobile phone numbers were prioritized in the
fieldwork. This means that in the first weeks of the fieldwork a higher number of mobile
phone numbers were called, with the aim of maximizing the proportion of mobile numbers
in the final sample.
Identification of eligible postcodes.
Postcodes are central to the sample design of the Perception Survey and were also used
during the fieldwork to determine in the majority of the cities the eligibility of respondents.
It was thus very important that all (and only) the postcodes belonging to the target city
regions were identified. To achieve this, a multi-step process was followed.
First, GIS-data from postcode areas in all countries (obtained from national postal
administrations) were overlayed on GIS-data from the target LAUs per city. This way it
could be determined which postcodes were used within the cities’ boundaries.
In most countries, the boundaries of postcode areas and LAUs coincide. If that is the case,
it can be exactly determined which postcodes belong to which LAUs. However, in some
countries, both types of areas crosscut each other. This means that if we know for a given
sample unit or respondent the postcode, it cannot be determined in which LAU they live.
If the postcode area falls fully within the target city, this doesn’t pose large problems.
However, when a postcode area falls partly within and partly outside of the target city, it
is impossible to determine with 100% certainty whether a sample unit with this postcode
is eligible or not. To determine how likely it is that any sample unit with such a postcode
is eligible for participation in the survey, we calculated the proportion of the population in
these postcode areas that lives within the target city. We propose that if this proportion is
25% or higher, a sample unit with this postcode is considered always eligible. If the
proportion is below that threshold, we consider the sample unit always ineligible.
Concretely, this would mean the following:
Cardiff 53% 47% 53% 47%
Glasgow 53% 47% 53% 47%
London 53% 47% 53% 47%
Manchester 53% 47% 53% 47%
Tyneside conurbation 53% 47% 53% 47%
Reykjavík 53% 47% 48% 52%
Oslo 71% 29% 71% 29%
Genève 25% 75% 25% 75%
Zurich 25% 75% 25% 75%
Tirana 81% 19% 81% 19%
Skopje 72% 28% 72% 28%
Podgorica 78% 22% 6% 94%
Beograd 54% 46% 54% 46%
Ankara 85% 15% 49% 51%
Istanbul 85% 15% 60% 40%
Antalya 85% 15% 24% 76%
Diyarbakir 85% 15% 3% 97%

Quality of Life in European Cities Survey 2019
Directorate-General for Regional and Urban Policy 2020 14
In the postcode areas that we would not include in the sample, where less than
25% of the population lives within the target city, the average population proportion
living within the target city is just 4% (i.e., a random sample unit with this postcode
has 96% chance of being ineligible)
In the postcode areas that we would keep in the sample, where 25% or more of
the population lives within the target city, the average population proportion living
within the target city is 79%) (i.e., a random sample unit with this postcode has
21% chance of being ineligible)
These figures show that a cut-off of 25% guarantees a high chance that ineligible units are
kept out of the sample, while at the same time only removing a very small number of
eligible respondents.
2.2 Questionnaire design
The primary objective when preparing the questionnaire for use in the 2019 Perception
Survey was to keep the substantive questions as much as possible identical to the 2015
questionnaire, so that comparisons could be drawn. Some changes were made, however,
to the screening questions, the socio-demographic background questions, and the
questions needed for weighting. This was done either at the inception of the project or
after the pilot test. All of these changes were made with the objective of increasing data
accuracy. Also, a few changes were made to the questionnaire to comply fully with the
GDPR, in force since 2018.
2.2.1 Screening questions
Multiple screening questions where added to questionnaire, to be asked at the start of the
questionnaire. The goal of these screening questions is to make sure that all respondents
to the survey are within the target scope of the survey – aged 15 or over and residing in
one of the target cities.
For the screening of age, we use the following questions. When calling a landline number,
the age screening is combined with the “last birthday” question. This is used to randomly
select a member of the household, thus avoiding the bias of self-selection by the person
that has picked up the phone. In comparison to the previous wave, the age question has
been made more general, no longer asking for a specific date of birth, but only for the age
of the respondent. This is easier to respond and less intrusive, thus likely increasing the
response rate, and it also only collects the necessary information as we don’t need the
exact date of birth.
Screening questions for age:
What is your age? (Mobile numbers)
Please can I speak to the person aged 15 or older within your household whose
birthday it was most recently? (Landline numbers)
For the screening on regional eligibility, in most cities we asked the target respondent the
postcode of their residence, and subsequently matched that with a list of all postcodes
used in the city (specifically, the postcodes used in the LAUs that together form the target
city). If the postcode is not used in the city, this implies that the respondent lives outside
of the city, and the respondent was screened out. An exception is the situation where the

Quality of Life in European Cities Survey 2019
Directorate-General for Regional and Urban Policy 2020 15
postcode given by the respondent belongs to another city included in the survey. In that
case, the interview was still conducted, and the respondent was moved to the sample from
the city in which he resides.
Screening question for postcode:
What is your postcode?
In some countries asking for the respondent’s postcode was not possible. This is either
because the postcode could allow to identify an individual household, in which case
recording the postcode would have required additional consent from the respondent. Or,
in some countries it could be guaranteed that all respondents would know their postcode,
typically because of recent changes to the postcode system causing people to know their
old, but possibly not yet their new postcode (or vice versa). The countries where this is the
case are the Netherlands, the United Kingdom, Portugal, Bulgaria, Romania and Ireland.
In these countries, instead of asking for postcode to determine eligibility, we ask directly
for the respondent’s region of residence. In order to determine how to best ask this, the
main principle is to keep the question as simple as possible. For example, for London, the
target region is Greater London. Because Greater London is a commonly known region, we
can ask a respondent directly whether they live in Greater London. However, in a city like
Glasgow, such a single denomination for the whole target city region does not exist. For
that reason, in such cities we include in the question all subregions (e.g., municipalities,
counties) needed to identify the residence of the respondent.
Screening question for region (example of London and Glasgow)
London
Do you live in Greater London?
Glasgow
Do you live in …
1. The city of Glasgow
2. The council area of East Dunbartonhsire
3. The council area of East Renfrewshire
4. The council area of Renfrewshire
Finally, in Lisbon, both screening via postcode as well as via region (Friguesia in Lisbon)
proved challenging. The pilot test showed that part of the respondents could not with
certainty confirm either, and therefore tend to answer “Lisbon” when asked their region of
residence – referring to the city at large. Because their responses still indicated that they
live in the target region, we added to the screening question an extra response option
“Lisboa”. This avoided that respondents who don’t know their Freguesia, although there is
nevertheless a high chance that they live in the target city, would need to be screened out.

Quality of Life in European Cities Survey 2019
Directorate-General for Regional and Urban Policy 2020 16
2.2.2 Socio-demographic background questions
After the pilot test, some changes were made to the socio-demographic background
questions. The reasons for this was in all cases that the background questions were
sometimes long and difficult to answer, putting large burden on the respondents and
creating a risk of inaccuracies in their responses. These changes concerned the following
questions in the original questionnaire:
D8. Which of the following best describes your household composition? With
household, we mean all people that typically live with you in the same residence.
Please include anyone who is temporarily away for work, study or vacation
D9. How many people usually live in your household? Please include yourself.
D8 caused confusion among several respondents, as well as some resistance because of
the length of the response options – especially because it comes at the end of the interview.
Additionally, the follow-up question in D9 also showed to confuse respondents because
they have the feeling that they already gave that information in D8.
However, since D8 is a standardized background question, too large changes to D8 were
difficult, because this can jeopardize comparability with previous waves and other cities
that have organized the survey independently. Nevertheless, we proposed to make one
adjustment, by replacing the question order and asking D9 before D8. This allowed to ask
only D9 to people living alone, because they could automatically be coded as a one-person
household in D8.3 Second, in doing so, the response option list in D9 becomes slightly
shorter, because the option “one-person household” does not need to be asked anymore.
D11. Which of the following best describes your current working status?
For D11 as well, the large number of response options - that are in themselves also rather
long and similar to each other - regularly caused confusion and impatience among
respondents. We made a similar adjustment as for D8, by first asking a simpler question
that covers most of the respondents: “Do you currently have a job? (Interviewer
instruction: include employees, employers, self-employed and people working as a relative
assisting on family business)”
This question was applied to 60% of the pilot survey sample. Asking this simpler question
first thus avoids presenting the full list of response options to the majority of respondents,
and it shortened the list of response options to those that fall in another category and still
needed to be asked question D11.
2.2.3 Weighting questions
Specific weighting questions were added to allow collection of the data needed to calculate
weights. This applies to 2 aspects of the weighting:
3 This concerns about 20% of the sample according to the pilot test.

Quality of Life in European Cities Survey 2019
Directorate-General for Regional and Urban Policy 2020 17
Phone ownership. The sample design assumes that landline phones are accessible
by all household members, and that mobile phones are personally owned and thus
accessible only to the person that answers the phone. In the survey, we measure
the access to mobile and landline phones, so that we can weight for the higher
selection probability of people that have access to both a landline and a mobile
phone (as opposed to only a landline or a mobile phone).
D14. Do you personally own a mobile phone?
D15. Do you have a landline phone in the household?
Household size. The target population of the Perception Survey are city residents
aged 15 or over. In order to accurately calculate the design weight for the landline
sample (to take into account the selection probability of people reached within their
household via a landline), we need to measure the number of eligible people within
each household – i.e., all household members aged 15 or over. A question to gather
this was added to the final questionnaire, as a follow-up to question D9:
D9. How many people usually live in your household? Please include yourself.
D9b. How many of these are aged 15 and older? Please include yourself.
2.2.4 Changes related to GDPR compliance
The European Union’s General Data Protection Regulation (GDPR, Regulation (EU)
2016/679), entered into force on 24 May 2016 and applicable since 25 May 2018, puts
strong responsibility on survey organizers to assure the protection of people’s privacy and
the correct handling of their personal data. Informing respondents of their rights and how
any personal data are treated, and acquiring consent to collect, process and store their
data are two key elements of the GDPR. To that end, the questionnaire was adjusted in
several places:
A privacy notice (to which respondents are referred for a full overview of what
kinds of personal data are gathered from them, how these are stored, what
respondents’ rights are with regard to these data and who they can contact with
questions, concerns or the request to delete their data) was added.
The design of the introduction was designed in such a way that it was ensured
that informed consent was gathered from the selected respondent. In practice, this
means that for respondents on the landline sample, consent is only confirmed by
the final respondent. Because of within-household selection, this might not
necessarily be the first person to answer the phone. The consent confirmation was
therefore moved from the very start of the interview (with the first respondent on
the phone) to the moment that the finally selected target respondent comes to the
phone.
Q15 asks respondents about their current health situation. Under GDPR, health
information is considered a special category of personal data. Consequently, stricter
rules apply for gathering these data. Respondents need to be asked consent to ask
such information before the question is asked and need to be told explicitly that
answering the question is voluntary. To comply with this, a question is added right
before Q15:
Q15a. The next question is about your health status. Please remember that all your
responses will be treated confidentially. You do not have to answer this question if
you do not want to. Are you happy to proceed?

Quality of Life in European Cities Survey 2019
Directorate-General for Regional and Urban Policy 2020 18
1. Yes
2. No
In order to avoid that this emphasis on the personal nature of the question scares
off respondents and leads to preliminary break-offs, question Q15 was moved to
the very end of the questionnaire. If respondents refused to be asked a question
about their health, this was coded as a refusal for question Q15, and the interview
was considered a complete.
2.3 Pilot testing
The pilot test methodology was identical to the setup that is envisaged for the main
fieldwork. The exact same sample, script, translations and technical infrastructure were
used for the questionnaire. Fieldwork monitoring procedures and quality checks were also
the same as used for the main fieldwork. All interviewers and supervisors participating in
the survey were briefed beforehand, and those participating in the pilot test received
specific instructions about what to focus on in the test. This allowed to evaluate the full
survey design in all countries.
The pilot test took place between 6 and 15 May. Calling took place predominantly in the
late afternoon and evening during weekdays. Other times of the day were available for
appointments. In each city, 30 complete interviews were conducted. No quota were set.
2.4 Main fieldwork
2.4.1 Timing
Because the survey fieldwork was estimated to take about 9 weeks and the fieldwork could
not begin earler than June, it was decided to split the fieldwork in two parts, with a pause
between 15 July and 1 September. This way it could be avoided to conduct fieldwork in the
summer period of July and August, 2 months that generally see a steep decline in response
rates because of the summer holidays.
The fieldwork start was originally set for 6 June, but was eventually moved to 12 June –
the reason for this being a number of adjustments to the questionnaire that had to be
implemented and replaced.
Despite this short delay in the start of the fieldwork, the fieldwork ended on 27 September
2019, as originally scheduled.
2.4.2 Fieldwork follow-up
The fieldwork was followed up closely on a weekly basis along the following parameters:
Total completes, per city (in absolute numbers and percentage of the total target)
Distribution of the sample for each city according to:

Quality of Life in European Cities Survey 2019
Directorate-General for Regional and Urban Policy 2020 19
o Age and gender (to monitor deviations from the population)
o Phone type (to monitor sample performance in the mobile and landline
frames)
o LAU (where available4, to monitor the spread of the sample over the whole
city)
Percentage of ineligible screened-out respondents because of their sub-city region
of residence, per city (to monitor the quality of the sample in terms of incidence
rate)
Number of bad quality cases, per city
Average interview duration, per country
For the interrupted interviews: how often a particular question was the last question
answered (to help evaluate whethere there are any questions that have a higher
chance of leading to interview break-offs)
Non-response percentage per question
In the first week of the fieldwork, members from the research team also listend in to live
interviews in several countries to evaluate the interview quality (in Belgium, the
Netherlands, France, Germany and Poland).
2.5 Reporting and data delivery
2.5.1 Data delivery
The following data files were prepared:
A first datafile containing ‘conventional’ question/response labels and codes,
corresponding to the questions and responses as given in the English master
questionnaire. Besides the response data this file also contains paradata such as
interview time and date, weighting factors and sample background data.
A second datafile which uses Eurobase labels and codes. This coding system is
developed by Eurostat and has been revised and expanded so that it can be applied
to the 2019 version of the Perception Survey.
In addition to these microdata files, a table of indicators (i.e., question responses)
in aggregated form, as weighted totals computed for each city. This is delivered as
an Excel file.
2.5.2 Recoding of question Q13_5 for Tirana
Question 13_5 asked to what extent respondents agreed to the following statement:
4 In Ireland and the United Kingdom it was not possible to follow up on the distribution of the sample at LAU level, because respondents are only screened for their residence in the city as a whole (e.g., “Greater London”).

Quality of Life in European Cities Survey 2019
Directorate-General for Regional and Urban Policy 2020 20
‘There is corruption in my local public administration’
In the Albanian translation used in Tirana (AL), this was erroneously translated as ‘there
is no corruption in my local public administration’ – that is, the inverse of the master item.
For this reason to allow for consistent reporting and comparability between all cities of the
survey, the responses for Tirana to this question were recoded to their inverse as well.
Specifically, the following recoding was applied:
‘Strongly agree’ to ‘strongly disagree’
‘Somewhat agree’ to ‘somewhat disagree’
‘Somewhat disagree’ to ‘somewhat agree’
‘Strongly disagree’ to ‘strongly agree’
Don’t know responses were not recoded.
3 Weighting
3.1 Weighting procedure
The following calibration weighting factors were taken into account in the weighting
approach:
• Age (four subgroups: 15-24, 25-39, 40-54 and 55+)
• Gender (male and female)
Initially, it was also considered to include sub-city level (commune) residence into account
for weighting, to ensure that the results would be representative for the whole city by
avoiding biases stemming from the possibility that some parts of a city would be
overrepresented in the data. This, however, ran against the practical difficulty that in many
cities the number of lower-level communes is very high, making outright weighting at that
level impossible. Grouping of communes into larger groups is in theory a measure to
resolve that issue. However, in order to do that, it would be necessary to first determine
which communes would for coherent wholes, and on what basis such merging would be
done besides mere geographical adjacency. This also means that, in absence of clear
parameters to determine the properties of such larger city regions (e.g., does one region
clearly differ from another in terms of population age, income, social status), there is no
clear way to verify whether a weighting according to regional distribution of the sample is
even warranted. For these reasons, it was decided to not weight the data according to sub-
city level region. However, because of the fact that the base principle of striving for a good
spread across city regions is still useful and will likely improve the quality of the sample,
as an alternative measure this spread was aimed for as much as possible in the sampling
stage. That is, in the gross sample for each city it was checked whether the distribution of
phone numbers over the city LAUs was proportionate to the population distribution.
In addition to a post-stratification weight on age and gender, a design weight was also
applied to control for unequal selection probabilities of sample units (see the following
section for more information on the rationale behind this approach), based on phone type
ownership (% mobile, % fixed, % mobile and fixed).
3.1.1 Post-stratification & design weighting
The sample was weighted in each country using a post-stratification weight, including age
and gender, and a design weight.

Quality of Life in European Cities Survey 2019
Directorate-General for Regional and Urban Policy 2020 21
The use of a design weight has become common in telephone surveys when calling on both
mobile and fixed lines (dual frame) as there is an overlap between frames with respondents
who could be sampled from both. This means that the probability to be selected equals the
probability of being called on one’s fixed line plus the probability of being called on one’s
mobile line minus the probability of being called both on one’s fixed and mobile line.
𝜋𝑖 = 𝜋𝑖 (𝐹𝑁) + 𝜋𝑖(𝑀𝑁) − 𝜋𝑖(𝐹𝑁 ⋂ 𝑀𝑁)
(Where FN is the population of people with a fixed line and MN the population of people
with a mobile line.)
The latter term, however, is generally very small and can be excluded from the analysis:
𝜋𝑖 = 𝜋𝑖 (𝐹𝑁) + 𝜋𝑖(𝑀𝑁) − 𝜋𝑖(𝐹𝑁 ⋂ 𝑀𝐹)
Another aspect to take into account is that a mobile line is typically used by an individual,
while a fixed line is typically a household device, and is thus shared by several (eligible)
persons; however, only one person in the household will answer the phone, which means
that his/her selection probability will be lower. A full calculation of the selection probability
should therefore rely on data on the number of phone lines per respondent as well as the
number of people per line.
This is taken into account in the following formula:
𝜋𝑖 ≈𝑛𝐹
𝑁𝐹
∗ 𝐹𝑖
𝑍𝑖
+ 𝑛𝑀
𝑁𝑀
∗𝑀𝑖
𝑍𝑖
nF = sample size fixed numbers; NF = population size fixed numbers ; nM=sample
size mobile numbers; NM=population size mobile numbers
Fi = number of fixed lines the respondent can be reached on, Zi = number of persons
that can be reach via these fixed lines
Mi = number of mobile lines the respondent can be reached on, Zm = number of
persons that can be reach via these mobile lines
However, this theory has come under pressure over the past years due to several flaws:
Having several people using the same fixed line in a household lowers their
probability to be selected, but chances are also higher that at least one person is at
home, which increases the selection probability.
If someone uses several mobile lines, their selection probability increases, although
it is unlikely that this person will have both mobile phones with them and switched
on at all times.
Based on these comments and the need to include several additional questions for the full
approach, a different approach was applied. The expected number of people available per
line was set to 1 for both fixed and mobile lines, resulting in the following formula:
𝜋𝑖 ≈𝑛𝐹
𝑁𝐹
∗ 𝐹𝑖 + 𝑛𝑀
𝑁𝑀
∗ 𝑀𝑖
In this formula, the terms Fi and Mi are equal to 1 if the respondent owns respectively a
fixed/mobile line, regardless of the number of fixed/mobile lines they can be reached on.

Quality of Life in European Cities Survey 2019
Directorate-General for Regional and Urban Policy 2020 22
3.1.2 Weight trimming
Weight trimming was also applied so that any computed non-response weights outside the
following limits are recoded to the boundary of these limits:
1
3 ≤
𝐸(𝑤𝐻𝐷)𝑤𝐻𝐷
𝐸(𝑤𝐻𝑁)𝑤𝐻𝑁
≤ 3
wHD = household design weight
wHN = the weight determined after adjustment (calibration)
E(wHD) and E(wHN) = their respective mean values
This approach does not rely on an absolute threshold, but offers a relative threshold based
on the data.
3.1.3 Population extrapolation
Finally, in addition to the two weights used, the Perception Survey microdata also contain
a population weighting factor. This allows to extrapolate the results from each city to their
actual population size, instead of the sample sizes of the survey. This is useful in case one
wants to group the data from multiple cities (e.g., all cities from one country) – in that
case it can be preferred to have each city only contribute to the grouped results
proportionate to their population size (e.g., Groningen less than Amsterdam and Rotterdam
in the Netherlands).
3.1.4 Using the weights
The microdata contains 3 weighting variables:
1. The design weight factor
2. A factor combining the design weight and the post-stratification weight (named
‘reslinweight’)
3. The population weight factor
The aggregated results by city have been calculated using the second factor, ‘reslinweight’.
When replicating the results for single cities, this factor should always be used. In case one
wants to balance the samples using other socio-demographic samples than age and
gender, this is possible, and then the design weight factor can be used as a starting point.
In case one wants to recalculate the design weight, the variable ‘mobfix’ contains the phone
type information (which respondents had access to a mobile phone, landline or both)
needed to do that.
Finally, as said, the population weight factor should only be used if one wants to combine
the results from multiple cities and wants to take into account the differences in population
sizes between those cities. This factor has not been used to produce the aggregate results
by city under this contract, as those tables only consider cities individually. However, for
the calculation of significant differences between cities the sample size does come into
play, since the significant differences as shown in the tables are calculated by comparing
a city’s result to the average of all cities. For this average, the population differences were

Quality of Life in European Cities Survey 2019
Directorate-General for Regional and Urban Policy 2020 23
not taken into account, since it was considered most appropriate in this context to compare
cities as equal entities, rather than groups of people that differ in size.
3.2 Weighting benchmarks
3.2.1 Age and gender
Weighting benchmarks for age and gender (which were also used during the fieldwork for
monitoring of the sample performance) were based on Eurostat data for all cities within
the EU and the United Kingdom.5 For all these countries, age and gender targets were
determined for the population aged 15 or over. For other countries, local sources were
used. For cities in these countries it was not always possible to determine the gender
distribution for the 15+ population. In that case, the distribution of the full population was
used. Given that gender distributions differ only marginally over age, this can safely be
assumed to have no significant impact. An overvies of the sources used for non-EU cities
is presented in the table below. Also, for these cities the population data are not always
fully corresponding to the city as defined for the Perception Survey. Wherever this was not
possible, the closest equivalent region was used.
City Source Remark
Zürich Age:
https://www.bfs.admin.ch/bfs/en/ho
me/statistics/catalogues-
databases/tables.assetdetail.5886149
.html
Gender:
https://www.bfs.admin.ch/bfs/en/ho
me/statistics/catalogues-
databases/tables.assetdetail.5866903
.html
Data for gender are for full
population, not 15+
Genève Age:
https://www.bfs.admin.ch/bfs/en/ho
me/statistics/catalogues-
databases/tables.assetdetail.5886149
.html
Gender:
https://www.bfs.admin.ch/bfs/en/ho
me/statistics/catalogues-
databases/tables.assetdetail.5866903
.html
Data for gender are for full
population, not 15+
Tirana http://databaza.instat.gov.al/pxweb/e
n/DST/START__Census2011/Census2
Data for the Tirana prefecture
5 https://ec.europa.eu/eurostat/web/cities/data/database

Quality of Life in European Cities Survey 2019
Directorate-General for Regional and Urban Policy 2020 24
103/?rxid=7fdc84f5-4567-4c7b-96ae-
0ac767c7a2eb
Reykjavik https://px.hagstofa.is/pxen/pxweb/en
/Ibuar/Ibuar__mannfjoldi__2_byggdir
__sveitarfelog/MAN02005.px/table/ta
bleViewLayout1/?rxid=ae1b6f70-
8f91-4f12-8056-4b048c1f64fd
Podgorica http://monstat.org/eng/pxweb.php
Skopje http://makstat.stat.gov.mk/PXWeb/p
xweb/en/MakStat/MakStat__Naseleni
e__ProcenkiNaselenie/225_Popis_reg
_3112_PolVoz_ang.px/?rxid=46ee0f6
4-2992-4b45-a2d9-cb4e5f7ec5ef
Data for Skjopje region
Oslo https://www.ssb.no/en/statbank/tabl
e/07459/tableViewLayout1
Beograd http://publikacije.stat.gov.rs/G2018/P
dfE/G201813045.pdf
Ankara https://biruni.tuik.gov.tr/bolgeselistat
istik/tabloOlustur.do#
Antalya https://biruni.tuik.gov.tr/bolgeselistat
istik/tabloOlustur.do#
Diyarbakir https://biruni.tuik.gov.tr/bolgeselistat
istik/tabloOlustur.do#
Istanbul https://biruni.tuik.gov.tr/bolgeselistat
istik/tabloOlustur.do#
3.2.2 Phone ownership
Phone ownership targets were determined estimated based on the achieved sample
for the Market Monitoring Survey 2017 (MMS 2017).6 The MMS 2017 data is based
on a bigger sample size and the more robust data. First, with a sample of 137,608
respondents, the achieved sample of the MMS 2017 is much larger than the sample of the
Eurobarometer study (n = 27,739 respondents). Second, the phone ownership information
in the MMS data is based on a sample of all contacted respondents, while the
Eurobarometer study only includes respondents that were willing to participate in the
study. In this way, the MMS data is more robust, as it does not include a participation bias.
6 https://ec.europa.eu/info/policies/consumers/consumer-protection/evidence-based-consumer-policy/market-monitoring_en

Quality of Life in European Cities Survey 2019
Directorate-General for Regional and Urban Policy 2020 25
Household telephone access per country based on the Market Monitoring Survey
2017
In the countries where MMS data are not available, we resort in the first place to the most
recent Eurobarometer/Eurostat data. If no recent data can be found there, national statistic
institute sources were used instead.
COUNTRY Population distribution Sample distribution
Mixed Fixed telephone only Mobile telephone only Fixed Mobile
BE 85% 4% 11% 48% 52%
BG 48% 2% 50% 34% 66%
CZ 25% 0% 75% 20% 80%
DK 41% 2% 58% 30% 70%
DE 92% 4% 4% 50% 50%
EE 44% 0% 55% 31% 69%
IE 58% 1% 41% 37% 63%
EL 81% 7% 12% 49% 51%
ES 84% 4% 12% 48% 52%
FR 89% 5% 6% 50% 50%
IT 66% 2% 31% 41% 59%
CY 68% 4% 28% 43% 57%
LV 27% 0% 73% 21% 79%
LT 38% 0% 62% 28% 72%
LU 86% 2% 12% 47% 53%
HU 35% 7% 58% 31% 69%
MT 93% 6% 1% 51% 49%
NL 82% 2% 15% 46% 54%
AT 62% 1% 36% 39% 61%
PL 56% 3% 41% 38% 62%
PT 79% 2% 19% 45% 55%
RO 60% 1% 39% 38% 62%
SI 78% 3% 19% 46% 54%
SK 44% 1% 55% 31% 69%
FI 16% 1% 83% 15% 85%
SE 77% 1% 22% 44% 56%
UK 78% 5% 17% 47% 53%
HR 63% 11% 25% 46% 54%
AL 23% 0% 75% 19% 81%
TR 14% 3% 81% 15% 85%
MK 32% 4% 61% 28% 72%
RS 75% 7% 17% 47% 53%
ME 25% 2% 72% 22% 78%
NO 40% 1% 59% 29% 71%
IS 88% 1% 11% 47% 53%

Quality of Life in European Cities Survey 2019
Directorate-General for Regional and Urban Policy 2020 26
3.3 Design effects and weighting efficiency per city
The below table gives an overview of the design effects for each city (combining the design
weight and the post-stratification weight), as well as the sample balance, used here as a
measure for weighting efficiency. The weighting efficiency is good in almost all cities, but
can be considered low in Antalya, Diyarbakir and Ankara, and to a lesser extent Istanbul
and Riga (taking into account a desired weighting efficiency of 70% or higher). Given that
in all these cities the deviations in age and gender distribution are not especially high, the
reason for this lower efficiency needs to be sought in the phone type access deviations that
have impacted the design weight.
City Design Effects7 Sample balance8
Graz 1.18 84.4
Wien 1.19 84.4
Antwerpen 1.10 90.5
Bruxelles / Brussel 1.12 89.4
Liège 1.13 88.6
Burgas 1.22 81.8
Sofia 1.22 81.9
Zagreb 1.13 88.9
Lefkosia 1.13 88.1
Ostrava 1.36 73.8
Praha 1.42 70.4
Aalborg 1.26 79.3
København 1.26 79.1
Tallinn 1.27 79.0
Helsinki / Helsingfors 1.19 84.1
Oulu / Uleåborg 1.20 83.6
Bordeaux 1.09 91.8
Lille 1.11 90.2
Marseille 1.12 89.1
Rennes 1.16 86.2
Strasbourg 1.13 88.7
7 The design effect (deff) for each city is calculated using Kish’s formula (1965). The deff indicates how much the
expected sampling error in a survey deviates from the sampling error that can be expected under simple
random sampling which is the gold standard in sample surveys. To calculate deff, the number of sample
observations is multiplied by the sum of the squared weights over the square of the sum of the weights for
each city.
8 The sample balance is the inverse of the weight factor – i.e., 1 divided by the weight factor. It shows the size of
the weighted sample as a percentage of the unweighted sample.

Quality of Life in European Cities Survey 2019
Directorate-General for Regional and Urban Policy 2020 27
Paris 1.12 89.7
Berlin 1.11 90.4
Dortmund 1.13 88.5
Essen 1.11 89.7
Hamburg 1.10 90.9
Leipzig 1.13 88.6
München 1.12 89.5
Rostock 1.15 86.7
Athina 1.10 91.1
Irakleio 1.07 93.6
Budapest 1.29 77.7
Miskolc 1.33 75.1
Dublin 1.21 82.5
Bologna 1.14 87.7
Napoli 1.15 86.8
Palermo 1.16 86.2
Roma 1.17 85.6
Torino 1.17 85.4
Verona 1.16 86.5
Vilnius 1.23 81.2
Luxembourg 1.10 90.7
Rīga 1.46 68.6
Valletta 1.09 91.4
Amsterdam 1.16 86.6
Groningen 1.09 91.4
Rotterdam 1.10 90.6
Białystok 1.15 87.0
Gdańsk 1.14 87.7
Kraków 1.14 87.6
Warszawa 1.13 88.5
Braga 1.12 89.5
Lisboa 1.16 86.3
Bucureşti 1.18 84.4
Cluj-Napoca 1.19 84.2
Piatra Neamţ 1.18 84.4
Bratislava 1.20 83.1
Košice 1.29 77.4
Ljubljana 1.17 85.5
Barcelona 1.12 89.5
Madrid 1.12 89.3
Málaga 1.11 89.9
Oviedo 1.11 89.9
Malmö 1.20 83.6

Quality of Life in European Cities Survey 2019
Directorate-General for Regional and Urban Policy 2020 28
Stockholm 1.23 81.1
Belfast 1.19 84.4
Cardiff 1.18 85.0
Glasgow 1.13 88.3
London 1.16 86.4
Manchester 1.10 90.8
Tyneside conurbation 1.11 90.3
Reykjavík 1.17 85.4
Oslo 1.18 84.6
Genève 1.10 90.6
Zürich 1.11 89.9
Tirana 1.18 84.6
Skopje 1.36 73.4
Podgorica 1.25 79.8
Beograd 1.16 85.8
Ankara 1.60 62.6
Istanbul 1.45 68.7
Antalya 1.80 55.7
Diyarbakir 1.70 58.9
4 Sample performance analysis
4.1 Target population versus achieved distribution
4.1.1 Age
The table on the following page shows the unweighted distribution of the sample over
broader age groups. Throughout the fieldwork, potential skews, particularly towards older
age groups, were an important focus point.
Wit the full sample collected, a slight underrepresentation of younger people can indeed
be observed. Looking at the individual age categories, the deviation is no source of concern,
taking as a rule of thumb that a deviation of 5% in any direction is acceptable. This is
confirmed by the weighting efficiency figures (see 3.3 above), which see no strong impact
from this skew. Even when counting together the deviations from the 2 youngest age
groups, the average deviation remains at 4%. There are, however, differences between
cities. It can be noted, for instances, that several cities in the UK (London, Cardiff, Belfast,
Glasgow) have an underrepresentation of the 15-34 age group of between 9 and 11% -
though the skew is far less in Newcastle and the Tyneside Conurbation. Other cities that
show a larger skew when combining the two younges age groups are Rennes (-12%),
Stockholm (-10%) and Podgorica (-10%).
On ther other hand, in all Turkish cities – but in no other city in any country – there is an
overrepresentation of younger people. An exceptionally high overrepresentation of younger
people is seen in Diyarbakir (+18% in the age group 15-34).

Quality of Life in European Cities Survey 2019
Directorate-General for Regional and Urban Policy 2020 29
The reasons for these differences between cities are not clear and cannot immediately be
found in the available data. The general skew towards older people, however, is not
uncommon in CATI surveys. Keeping this tendency in mind, the 2019 Perception Survey
performed rather well, keeping the skew limited to acceptable levels.

city 15-24 years 25 – 34 years 35 –44 years 45 – 54 years 55 – 64 years 65 and older Average deviation per city
sample target sample target sample target sample target sample target sample target
Graz 15% 17% 17% 20% 14% 15% 18% 16% 16% 12% 20% 20% 2% Wien 12% 14% 15% 19% 15% 17% 20% 18% 16% 13% 22% 20% 3% Antwerpen 11% 14% 17% 20% 18% 17% 17% 15% 14% 13% 23% 21% 2% Bruxelles / Brussel 13% 15% 19% 22% 20% 19% 19% 16% 14% 12% 15% 16% 2% Liège 10% 14% 20% 18% 15% 16% 17% 16% 17% 15% 21% 22% 2% Burgas 9% 11% 18% 16% 21% 20% 17% 16% 15% 16% 20% 21% 1% Sofia 10% 12% 18% 21% 20% 20% 15% 14% 14% 13% 23% 20% 2% Zagreb 12% 13% 16% 18% 15% 17% 18% 16% 17% 16% 22% 20% 2% Lefkosia 13% 16% 20% 22% 17% 18% 18% 16% 16% 13% 17% 15% 2% Ostrava 8% 11% 16% 16% 20% 18% 15% 17% 17% 15% 24% 23% 2% Praha 7% 9% 16% 18% 23% 22% 17% 16% 15% 13% 22% 22% 1% Aalborg 15% 19% 14% 17% 14% 15% 19% 16% 15% 14% 23% 20% 3% København 16% 18% 25% 28% 19% 19% 14% 13% 12% 10% 14% 12% 2% Tallinn 8% 11% 17% 20% 18% 18% 16% 14% 17% 15% 24% 22% 2% Helsinki / Helsingfors 12% 14% 19% 21% 17% 18% 16% 15% 15% 13% 21% 19% 1% Oulu / Uleåborg 14% 18% 16% 19% 15% 17% 16% 14% 18% 14% 21% 19% 3% Bordeaux 18% 21% 17% 18% 15% 15% 14% 14% 15% 12% 21% 19% 2% Lille 19% 21% 16% 19% 14% 16% 17% 15% 12% 13% 22% 17% 3% Marseille 14% 16% 12% 16% 13% 16% 17% 16% 18% 14% 26% 23% 3% Rennes 22% 28% 14% 19% 13% 13% 14% 12% 16% 11% 21% 17% 4% Strasbourg 15% 21% 18% 19% 13% 15% 18% 14% 15% 13% 21% 18% 3% Paris 13% 16% 15% 20% 17% 18% 19% 16% 16% 13% 20% 17% 3% Berlin 9% 11% 18% 20% 15% 16% 18% 17% 18% 14% 22% 22% 2% Dortmund 10% 13% 13% 16% 15% 14% 19% 18% 19% 15% 24% 23% 2% Essen 9% 12% 15% 16% 11% 14% 19% 17% 18% 15% 28% 25% 3% Hamburg 9% 12% 17% 19% 16% 16% 20% 18% 15% 13% 23% 21% 2% Leipzig 8% 11% 19% 22% 17% 15% 15% 15% 14% 13% 27% 24% 2%

Quality of Life in European Cities Survey 2019
Directorate-General for Regional and Urban Policy 2020 31
München 9% 12% 20% 22% 17% 17% 19% 17% 16% 12% 19% 20% 2% Rostock 7% 11% 17% 20% 11% 13% 18% 15% 18% 15% 29% 26% 3% Athina 10% 12% 14% 18% 17% 19% 17% 17% 19% 14% 23% 21% 3% Irakleio 13% 16% 15% 20% 22% 20% 18% 16% 16% 13% 16% 16% 3% Budapest 8% 11% 13% 17% 18% 20% 19% 14% 18% 15% 25% 23% 3% Miskolc 10% 13% 10% 14% 16% 18% 17% 15% 20% 17% 27% 23% 3% Dublin 12% 16% 22% 25% 21% 19% 16% 15% 11% 12% 19% 14% 3% Bologna 8% 9% 14% 14% 15% 17% 16% 18% 16% 14% 31% 29% 1% Napoli 13% 15% 13% 15% 16% 17% 21% 18% 17% 15% 20% 20% 2% Palermo 9% 13% 16% 14% 17% 16% 18% 18% 17% 15% 23% 23% 2% Roma 8% 10% 9% 12% 20% 17% 21% 20% 17% 15% 25% 25% 2% Torino 8% 10% 14% 13% 11% 16% 20% 18% 18% 15% 29% 29% 2% Verona 9% 11% 10% 12% 14% 15% 17% 18% 19% 15% 31% 29% 2% Vilnius 9% 11% 23% 23% 20% 18% 17% 15% 11% 14% 20% 19% 2% Luxembourg 9% 11% 17% 22% 19% 19% 16% 15% 13% 11% 26% 21% 3% Riga 7% 10% 17% 19% 19% 17% 17% 15% 16% 16% 24% 24% 2% Valletta 11% 13% 13% 18% 17% 16% 15% 13% 17% 16% 27% 23% 3% Amsterdam 11% 15% 19% 23% 16% 18% 18% 16% 17% 13% 19% 14% 4% Groningen 24% 28% 19% 21% 16% 14% 15% 13% 12% 11% 14% 13% 2% Rotterdam 12% 16% 18% 20% 19% 17% 19% 16% 13% 13% 19% 18% 2% Bialystok 9% 13% 22% 21% 20% 18% 17% 15% 15% 16% 17% 18% 2% Gdansk 10% 11% 21% 20% 20% 18% 15% 13% 16% 17% 18% 21% 2% Kraków 11% 12% 23% 21% 18% 18% 11% 13% 15% 16% 22% 20% 1% Warszawa 9% 9% 21% 20% 17% 19% 14% 12% 19% 17% 20% 22% 2% Braga 11% 14% 16% 15% 22% 19% 20% 18% 15% 16% 16% 19% 2% Lisboa 8% 11% 14% 13% 21% 18% 19% 16% 16% 15% 22% 28% 3% Bucuresti 6% 8% 15% 18% 20% 22% 16% 17% 19% 16% 24% 20% 3% Cluj-Napoca 6% 8% 17% 19% 20% 21% 16% 17% 18% 16% 23% 19% 2% Piatra Neamt 7% 10% 15% 16% 19% 20% 19% 17% 19% 18% 21% 19% 2% Bratislava 5% 8% 19% 18% 23% 22% 17% 14% 18% 16% 18% 21% 2%

Quality of Life in European Cities Survey 2019
Directorate-General for Regional and Urban Policy 2020 32
Košice 8% 12% 16% 18% 18% 20% 18% 16% 19% 15% 21% 19% 2% Ljubljana 9% 14% 13% 16% 16% 18% 18% 16% 19% 15% 25% 21% 3% Barcelona 10% 11% 13% 15% 17% 20% 20% 17% 15% 14% 25% 23% 2% Madrid 11% 11% 12% 15% 19% 20% 22% 18% 16% 14% 20% 22% 2% Málaga 12% 12% 14% 15% 18% 19% 19% 18% 17% 15% 20% 20% 1% Oviedo 8% 9% 11% 12% 20% 19% 20% 18% 19% 17% 22% 25% 2% Malmö 12% 14% 17% 23% 14% 18% 18% 14% 18% 12% 21% 19% 4% Stockholm 8% 13% 16% 20% 14% 18% 21% 16% 18% 13% 23% 18% 5% Belfast 11% 17% 13% 18% 12% 16% 21% 17% 18% 13% 25% 19% 5% Cardiff 17% 22% 14% 20% 11% 15% 18% 14% 18% 12% 22% 17% 5% Glasgow 12% 17% 18% 23% 18% 15% 20% 16% 17% 13% 15% 16% 4% London 8% 14% 21% 24% 17% 20% 19% 16% 15% 12% 20% 15% 4% Manchester 14% 16% 16% 19% 12% 16% 19% 17% 15% 13% 24% 19% 3% Tyneside conurbation 12% 17% 16% 17% 17% 14% 18% 16% 18% 14% 19% 21% 3% Reykjavík 10% 16% 18% 21% 14% 17% 20% 15% 17% 14% 21% 17% 4% Oslo 12% 14% 22% 26% 14% 19% 18% 15% 15% 12% 19% 15% 3% Genève 12% 11% 14% 11% 15% 13% 21% 15% 17% 15% 21% 33% 5% Zürich 9% 10% 8% 15% 19% 16% 17% 15% 18% 12% 29% 17% 5% Tirana 22% 24% 23% 18% 17% 16% 14% 16% 11% 13% 13% 13% 2% Skopje 9% 15% 16% 18% 22% 19% 22% 17% 18% 14% 13% 18% 4% Podgorica 13% 18% 15% 20% 20% 17% 16% 17% 19% 15% 17% 13% 4% Beograd 8% 13% 15% 18% 16% 16% 19% 16% 19% 18% 23% 19% 3% Ankara 14% 15% 18% 16% 23% 16% 22% 13% 10% 10% 13% 8% 4% Istanbul 17% 15% 24% 17% 25% 18% 15% 13% 12% 8% 7% 7% 4% Antalya 15% 14% 18% 15% 21% 17% 20% 14% 14% 10% 12% 8% 4% Diyarbakir 25% 19% 28% 17% 22% 13% 10% 8% 6% 5% 9% 5% 6% Average deviation per age group 3% 3% 2% 2% 3% 3%

4.1.2 Gender
The table below shows the unweighted gender distribution in the final sample for each city.
Only one skew stands out from other cities: For Skopje the sample contains 7% more
males than expected based on population figures (56% vs. 49). While this might be in part
due to the fact that the Skopje population data used for benchmarking do not cover the
exact city as defined for the Perception Survey, the discrepancy between males and
females is still higher than what one would normally expect in a general population survey.
Here too, however, the reason for this skew cannot be identified from the available survey
data.
city male female Deviation Per city sample target sample target
Graz 47% 48% 53% 52% 1%
Wien 49% 48% 51% 52% 1%
Antwerpen 47% 49% 53% 51% 2%
Bruxelles / Brussel 46% 49% 54% 51% 2%
Liège 48% 48% 52% 52% 1%
Burgas 46% 47% 54% 53% 1%
Sofia 48% 47% 52% 53% 0%
Zagreb 46% 46% 54% 54% 0%
Lefkosia 49% 47% 51% 53% 2%
Ostrava 44% 48% 56% 52% 4%
Praha 49% 48% 51% 52% 1%
Aalborg 51% 50% 49% 50% 1%
København 50% 49% 50% 51% 1%
Tallinn 47% 44% 53% 56% 3%
Helsinki / Helsingfors 48% 48% 52% 52% 0%
Oulu / Uleåborg 49% 50% 51% 50% 0%
Bordeaux 46% 46% 54% 54% 0%
Lille 47% 47% 53% 53% 0%
Marseille 46% 47% 54% 53% 1%
Rennes 47% 47% 53% 53% 0%
Strasbourg 47% 47% 53% 53% 0%
Paris 49% 47% 51% 53% 2%
Berlin 45% 49% 55% 51% 3%
Dortmund 47% 49% 53% 51% 2%
Essen 48% 48% 52% 52% 0%
Hamburg 48% 49% 52% 51% 1%
Leipzig 47% 49% 53% 51% 2%
München 51% 48% 49% 52% 3%
Rostock 48% 49% 52% 51% 1%
Athina 50% 47% 50% 53% 3%
Irakleio 46% 48% 54% 52% 2%
Budapest 47% 46% 53% 54% 2%
Miskolc 44% 46% 56% 54% 1%

Quality of Life in European Cities Survey 2019
Directorate-General for Regional and Urban Policy 2020 34
Dublin 51% 48% 49% 52% 2%
Bologna 46% 47% 54% 53% 1%
Napoli 51% 48% 49% 52% 3%
Palermo 49% 47% 51% 53% 2%
Roma 46% 47% 54% 53% 1%
Torino 47% 47% 53% 53% 0%
Verona 47% 47% 53% 53% 0%
Vilnius 45% 44% 55% 56% 2%
Luxembourg 49% 50% 51% 50% 1%
Riga 44% 43% 56% 57% 1%
Valletta 50% 50% 50% 50% 0%
Amsterdam 50% 49% 50% 51% 2%
Groningen 51% 49% 49% 51% 1%
Rotterdam 49% 49% 51% 51% 0%
Bialystok 49% 46% 51% 54% 2%
Gdansk 48% 47% 52% 53% 1%
Kraków 48% 46% 52% 54% 2%
Warszawa 47% 45% 53% 55% 2%
Braga 48% 47% 52% 53% 1%
Lisboa 47% 46% 53% 54% 2%
Bucuresti 46% 46% 54% 54% 0%
Cluj-Napoca 48% 46% 52% 54% 1%
Piatra Neamt 46% 46% 54% 54% 0%
Bratislava 48% 46% 52% 54% 1%
Košice 43% 47% 57% 53% 4%
Ljubljana 44% 48% 56% 52% 4%
Barcelona 48% 48% 52% 52% 0%
Madrid 48% 47% 52% 53% 2%
Málaga 49% 47% 51% 53% 2%
Oviedo 50% 46% 50% 54% 4%
Malmö 50% 49% 50% 51% 1%
Stockholm 52% 49% 48% 51% 2%
Belfast 48% 48% 52% 52% 0%
Cardiff 52% 49% 48% 51% 3%
Glasgow 49% 48% 51% 52% 1%
London 49% 50% 51% 50% 1%
Manchester 47% 49% 53% 51% 2%
Tyneside conurbation 50% 49% 50% 51% 2%
Reykjavík 47% 51% 53% 49% 3%
Oslo 49% 50% 51% 50% 0%
Genève 49% 48% 51% 52% 0%
Zürich 49% 50% 51% 50% 1%

Quality of Life in European Cities Survey 2019
Directorate-General for Regional and Urban Policy 2020 35
Tirana 52% 49% 48% 51% 3%
Skopje 56% 49% 44% 51% 7%
Podgorica 50% 48% 50% 52% 2%
Beograd 49% 47% 51% 53% 2%
Ankara 51% 50% 49% 50% 2%
Istanbul 52% 50% 48% 50% 2%
Antalya 51% 50% 49% 50% 1%
Diyarbakir 52% 51% 48% 49% 1%
Average deviation per gender category
2% 2%
4.1.3 Phone ownership
Since the 2019 Perception Survey worked with dual-frame approach for the sample design,
it was important to monitor during the fieldwork the distribution of numbers from the 2
sample frames (landline and mobiles) in the completed sample. This distribution is not only
relevant for the calculation of the design weights (see chapter 3), but it also indirectly
impacts the socio-demographic profile of the sample. For instance, mobile phone users are
typically somewhat younger than landline users.
As already noted (see chapter 2), for the mobile number frame it was not in each city
possible to build a gross sample that contained the envisaged amount of phone numbers
(24 times the target sample). As a countermeasure more landline numbers were included
in the gross sample in these cities. For that reason mobile phone numbers were prioritized
in these cities an called more often if needed, with the goal to increase the proportion of
mobile numbers in the final sample and bring it as close as possible to the target
distribution. This was a success in most cities. Only in 12 cities, there was a deviation from
the mobile sample targets of more than 10%, with notable spikes in Riga and Podgorica.
It should be noted, however, that such deviations are only problematic to the extent that
they result in biases in the socio-demographic profile of the samples as well. As shown
above, such biases are only limited for the parameters taken into consideration (age and
gender).
City Mobile sample Mobile target deviation mobile sample9
Fixed sample Fixed target
Graz 61% 61% 0% 39% 39%
Wien 61% 61% 0% 39% 39%
Antwerpen 52% 52% 0% 48% 48%
Bruxelles /
Brussel 52% 52% 0% 48% 48%
Liège 52% 52% 0% 48% 48%
Burgas 56% 66% -10% 44% 34%
Sofia 66% 66% 0% 34% 34%
Zagreb 53% 54% -1% 47% 46%
9 The deviation for the fixed sample is the inverse – e.g., +10% for Burgas

Quality of Life in European Cities Survey 2019
Directorate-General for Regional and Urban Policy 2020 36
Lefkosia 38% 57% -19% 62% 43%
Ostrava 73% 80% -7% 27% 20%
Praha 80% 80% 0% 20% 20%
Aalborg 70% 70% 0% 30% 30%
København 69% 70% -1% 31% 30%
Tallinn 50% 69% -19% 50% 31%
Helsinki /
Helsingfors 85% 85% 0% 15% 15%
Oulu /
Uleåborg 85% 85% 0% 15% 15%
Bordeaux 49% 50% -1% 51% 50%
Lille 50% 50% 0% 50% 50%
Marseille 50% 50% 0% 50% 50%
Rennes 51% 50% 1% 49% 50%
Strasbourg 49% 50% -1% 51% 50%
Paris 50% 50% 0% 50% 50%
Berlin 50% 50% 0% 50% 50%
Dortmund 50% 50% 0% 50% 50%
Essen 50% 50% 0% 50% 50%
Hamburg 50% 50% 0% 50% 50%
Leipzig 50% 50% 0% 50% 50%
München 56% 50% 6% 44% 50%
Rostock 50% 50% 0% 50% 50%
Athina 51% 51% 0% 49% 49%
Irakleio 30% 51% -21% 70% 49%
Budapest 64% 69% -5% 36% 31%
Miskolc 51% 69% -18% 49% 31%
Dublin 63% 63% 0% 37% 37%
Bologna 59% 59% 0% 41% 41%
Napoli 59% 59% 0% 41% 41%
Palermo 59% 59% 0% 41% 41%
Roma 59% 59% 0% 41% 41%
Torino 59% 59% 0% 41% 41%
Verona 52% 59% -7% 48% 41%
Vilnius 54% 72% -18% 46% 28%
Luxembourg 56% 53% 3% 44% 47%
Rīga 32% 79% -47% 68% 21%
Valletta 49% 49% 0% 51% 51%
Amsterdam 47% 54% -7% 53% 46%
Groningen 26% 54% -28% 74% 46%
Rotterdam 54% 54% 0% 46% 46%
Białystok 62% 62% 0% 38% 38%
Gdańsk 62% 62% 0% 38% 38%
Kraków 62% 62% 0% 38% 38%

Quality of Life in European Cities Survey 2019
Directorate-General for Regional and Urban Policy 2020 37
Warszawa 62% 62% 0% 38% 38%
Braga 55% 55% 0% 45% 45%
Lisboa 55% 55% 0% 45% 45%
Bucureşti 62% 62% 0% 38% 38%
Cluj-Napoca 62% 62% 0% 38% 38%
Piatra Neamţ 62% 62% 0% 38% 38%
Bratislava 69% 69% 0% 31% 31%
Košice 50% 69% -19% 50% 31%
Ljubljana 54% 54% 0% 46% 46%
Barcelona 53% 52% 1% 47% 48%
Madrid 51% 52% -1% 49% 48%
Málaga 52% 52% 0% 48% 48%
Oviedo 51% 52% -1% 49% 48%
Malmö 52% 56% -4% 48% 44%
Stockholm 57% 56% 1% 43% 44%
Belfast 54% 53% 1% 46% 47%
Cardiff 53% 53% 0% 47% 47%
Glasgow 54% 53% 1% 46% 47%
London 54% 53% 1% 46% 47%
Manchester 53% 53% 0% 47% 47%
Tyneside
conurbation 53% 53% 0% 47% 47%
Reykjavík 52% 53% -1% 48% 47%
Oslo 71% 71% 0% 29% 29%
Genève 25% 25% 0% 75% 75%
Zürich 23% 25% -2% 77% 75%
Tirana 81% 81% 0% 19% 19%
Skopje 72% 72% 0% 28% 28%
Podgorica 16% 78% -62% 84% 22%
Beograd 54% 54% 0% 46% 46%
Ankara 77% 85% -8% 23% 15%
Istanbul 76% 85% -9% 24% 15%
Antalya 57% 85% -28% 43% 15%
Diyarbakir 45% 85% -40% 55% 15%
4.1.4 Eligibility
The total proportion of respondents (on the total of respondents that were asked the
screening questions) that was ineligible for participation because they lived outside of the
targeted city regions was 21% over all cities. This means an overall incidence rate of 79%.
However, there are clear differences between the cities, as can be seen in the table below.
In 23 cities, the proportion of screen-outs because of a residence outside of the target city
is above 25%, and in seven it was above 50%, meaning that there was a higher chance
that the respondent would not be eligible for participation than that they would be eligible.

Quality of Life in European Cities Survey 2019
Directorate-General for Regional and Urban Policy 2020 38
This can have several possible causes, ranging from a lacking reliability in the available
source material that was used to link sample units to post codes (i.e., respondents actually
live in another post code area than they have indicated according to the source), to
difficulties among respondents to correctly state their postcode.
It should in any case be noted that a lower incidence rate in a city does not mean that the
sample for that city is lacking quality in terms of representativity. Rather, it means that
more gross sample is needed for these cities to reach the target number of completes.
This, however, had no impact on the fieldwork planning.
City % ineligible
Cluj-Napoca 62.5%
Oulu / Uleåborg 59.1%
Tirana 58.1%
Ankara 57.8%
Verona 57.4%
Torino 55.3%
Bologna 51.6%
Valletta 48.7%
Istanbul 46.5%
Helsinki / Helsingfors 43.3%
Roma 38.1%
Antwerpen 37.5%
Liège 33.1%
Oviedo 32.5%
Ljubljana 31.3%
Miskolc 29.1%
Madrid 28.9%
Piatra Neamţ 28.3%
Málaga 28.1%
Barcelona 27.4%
Amsterdam 25.4%
Bucureşti 25.3%
Diyarbakir 25.1%
Skopje 24.8%
Palermo 24.6%
Rīga 24.2%
Kraków 23.4%
Warszawa 23.1%
Gdańsk 22.2%
Białystok 21.1%
Rotterdam 21.1%
Beograd 20.0%

Quality of Life in European Cities Survey 2019
Directorate-General for Regional and Urban Policy 2020 39
Graz 19.1%
Bratislava 18.9%
Burgas 18.8%
Bordeaux 18.5%
Sofia 17.9%
Marseille 17.9%
Belfast 17.0%
Ostrava 17.0%
Bruxelles / Brussel 16.8%
Rostock 16.8%
Budapest 16.7%
København 16.7%
Strasbourg 16.6%
Oslo 16.4%
Aalborg 16.4%
Athina 16.3%
Antalya 15.8%
Groningen 15.7%
Paris 15.6%
München 14.7%
Malmö 14.6%
Dortmund 14.1%
Praha 14.0%
Hamburg 13.7%
Braga 13.7%
Lefkosia 13.7%
Essen 13.4%
Cardiff 13.4%
Lille 13.2%
Napoli 13.0%
Wien 12.7%
Zagreb 12.2%
Stockholm 11.8%
Vilnius 11.4%
Glasgow 11.3%
Tyneside conurbation 10.3%
Rennes 9.9%
Dublin 9.8%
Irakleio 9.8%
Leipzig 9.1%
Košice 8.6%
Podgorica 8.2%
Luxembourg 7.6%

Quality of Life in European Cities Survey 2019
Directorate-General for Regional and Urban Policy 2020 40
Tallinn 7.3%
Berlin 6.9%
London 6.7%
Genève 6.0%
Zürich 4.6%
Lisboa 4.5%
Manchester 4.4%
Reykjavík 3.0%
5 Fieldwork performance analysis
5.1 Interview validation
During the fieldwork, a series of checks were performed once per week on all interviews
to verify their quality. This was done via the following parameters:
- interview length: interviews were flagged if their length was below 50% of the average
length for interviews in a country.10 For instance, if the average interview length in a
country is 10 minutes, interviews shorter than 5 minutes are flagged.
- straightlining: interviews were flagged if they showed straightlining in 4 of the following
multi-item questions (i.e., have the same response in all items): Q1 (10 items), Q2 (7),
Q4 (4) , Q6 (5), Q13 (5). For Q1 and Q2, straightlining on all but one of the items (i.e., 9
in Q1 and 6 in Q2 also counts as straightlining, given the high number of items.
- item non-response: interviews were flagged if there is a non-response (i.e., answering
“don’t know” or refusing to answer) on at least 30% of the substantive questions and 50%
of the socio-demo background questions. Separately, interviews are also flagged if there
is a 75% non-response rate in the large question blocks Q1 and Q2.
Any interview that was flagged for 2 of the above checks was selected for removal.
Suspicious interviews were assessed and treated (i.e., excluded and replaced) during the
fieldwork itself, so that no interviews had to me removed from the final sample.
The table below gives an overview of the interviews removed based on these checks, per
city (in cities not mentioned no cases had to be removed).
city Count %
Graz 3 0.3%
Praha 1 0.1%
Aalborg 3 0.3%
Helsinki / Helsingfors
1 0.1%
Strasbourg 1 0.1%
10 The separate calculation per country is meant to take into account natural interview length differences between
countries due to language and cultural differences.

Quality of Life in European Cities Survey 2019
Directorate-General for Regional and Urban Policy 2020 41
Rostock 3 0.3%
Dublin 3 0.4%
Rotterdam 1 0.1%
Braga 1 0.1%
Lisboa 1 0.1%
Madrid 3 0.2%
Oviedo 2 0.1%
Manchester 1 0.1%
Reykjavík 1 0.1%
Genève 4 0.5%
Zürich 2 0.2%
Podgorica 1 0.1%
Beograd 1 0.1%
5.2 Interview breakoffs
The table below shows the main different parts of the questionnaire, each time with the
break-off percentage (as proportion of the total group of people that terminated the
interview before the end). In other words, the table shows at which points in the survey
respondents were most likely to quit. It stands out from this overview that the likelihood
to break off the interview is at its highest during the Q3 question block. This is not
surprising, since Q3 is the third consecutive item block after Q1 and Q2, together
comprising of 23 questions. In total, just over half of the interview break-offs occurs before
the start of Q4. From Q4 on, the break-off probability decreases again, but with a spike in
Q6 – which is again a 5-item question block.
It is notable that once the background questions are reached, almost all respondents reach
the end of the interview – only 1.5% of the break-offs occurs during the socio-demographic
background questions.
question (block)
break-off percentage
cumulative
screener 0.2% 0.2%
Q1 7.7% 7.9%
Q2 17.0% 24.9%
Q3 26.6% 51.5%
Q4 10.4% 61.9%
Q5 6.7% 68.6%
Q6 16.0% 84.6%
Q7-Q12 9.4% 94.0%
Q13 4.5% 98.5%
Q14-end 1.5% 100.0%
5.3 Item non-response
The next table below shows the 10 question items with the highest non-response rate.
question non-response
(%)

Quality of Life in European Cities Survey 2019
Directorate-General for Regional and Urban Policy 2020 42
Q13.5 There is corruption in my local public
administration 20.20%
Q3.3 Is the city where you live a good place or not a
good place to live for the following groups? Gay or lesbian people.
15.38%
Q4.2 On the whole, are you very satisfied, fairly
satisfied, not very satisfied or not at all satisfied with
your personal job situation
15.35%
Q1.7 Generally speaking, please tell me if you are very
satisfied, rather satisfied, rather unsatisfied or very
unsatisfied with each of the following issues in your city
or area. - Schools and other educational facilities.
13.91%
Q1.3 Generally speaking, please tell me if you are very
satisfied, rather satisfied, rather unsatisfied or very
unsatisfied with each of the following issues in your city
or area. - Sport facilities such as sport fields and indoor
sports halls.
13.37%
Q2.2 It is easy to find a good job in my city. 11.04%
Q13.4 Information and services of my local public
administration can be easily accessed online 10.33%
Q13.1 Is the city where you live a good place or not a
good place to live for the following groups? Immigrants from other countries.
9.88%
Q2.5 It is easy to find good housing in my city at a
reasonable price. 9.59%
Q3.4 Is the city where you live a good place or not a
good place to live for the following groups? Racial and ethnic minorities.
9.45%
Q15 In general, how is your health? 8.03%
It is likely that the main reason for the higher non-response in these items is the fact that
some respondents feel that they do not have enough knowledge of, or experience with,
the topics of these questions. For instance, people who do not use a city’s educational or
sport facilities may not be able to tell whether they are satisfied with them in response to
questions Q1.3 and Q1.7, respectively. Similarly, if they have no (recent) experience with
searching for a job or a house, they might conclude that they don’t know whether it is easy
to find one in their city (cf. questions Q2.2 and Q2.5, respectively).
Two special cases are the following:
- Q4.2 is asked to all respondents, also those who are retired and still in school. For the
latter groups, the response is coded as “don’t know” during the interview, and will after
the fieldwork be recoded to “not applicable”.
- Q15 discusses the respondent’s health, which is a special category of personal data (see
2.3.4). The sensitivity of the question is in itself already likely to increase non-response.
In addition to that, GDPR requires an explicit consent verification before the question can
be asked. 5% of respondents opted out after being asked consent in Q15a, and another
3% chose not to answer the question after agreeing to hear it – bringing the total non-
response rate for Q15 to 8%.

Quality of Life in European Cities Survey 2019
Directorate-General for Regional and Urban Policy 2020 43
5.4 Response rates
5.4.1 Response rates in the 2019 Perception Survey
The technical report contains an overview per city of the response rate, calculated
according to AAPOR guidelines. Specifically, the Technical Report contains the following
figures:
AAPOR response rate type 1. This is the most conservative response rate type.
It represents the number of complete interviews (700 in all cities) as a percentage
of the total working not-ineligible sample that was used in the fieldwork. With ‘not-
ineligible’ we mean all respondents that were not confirmed ineligible – a large part
of this being people that refuse to participate and for which eligibility could not be
confirmed. Ineligible respondents are not taken into account for the response rate
calculation because they do not belong to the target
AAPOR response rate type 3. This response rate figure considers partial
interviews also as successful interviews (in the sense that responses were
gathered), thus counting them together with complete interviews in the calculation
of the response rate.
AAPOR response rate type 4. This response rate type also counts partial
interviews as successful. In addition to that, it makes an assumption about the
eligibility of those respondents that could not be screened (i.e., that were not
reached of refused to participate before the screening questions could be asked).
This is calculated by adding to the calculation a factor that assumes the proportion
in the full sample that was actually ineligible (and should thus not be included in
the response rate calculation). This factor is the ratio of confirmed eligible vs.
confirmed ineligible respondents, as measured by the screening questions.
The below table shows AAPOR response rate type 4 per city. This response rate calculation
gives the best idea of how many sample units that could have led to a complete interview
actually did, precisely because it includes an approximation of how much of the base
sample was actually not eligible.
The response rate in most cities was below the 4% that was estimated at the beginning of
the project, most often ranging between 2 and 4%. In some cities, particularly those in
Turkey (12.2% on average) and Romania (10.5%), the response rate was notably higher.
City AAPOR RR4
Graz 2.8%
Wien 1.7%
Antwerpen 3.7%
Bruxelles / Brussel 3.1%
Liège 2.9%
Burgas 2.8%
Sofia 2.3%
Zagreb 1.8%
Lefkosia 2.5%
Ostrava 3.2%
Praha 3.5%

Quality of Life in European Cities Survey 2019
Directorate-General for Regional and Urban Policy 2020 44
Aalborg 2.3%
København 2.4%
Tallinn 2.9%
Helsinki / Helsingfors
2.6%
Oulu / Uleåborg 2.6%
Bordeaux 2.4%
Lille 2.6%
Marseille 2.1%
Rennes 1.9%
Strasbourg 2.5%
Paris 2.2%
Berlin 2.9%
Dortmund 2.3%
Essen 2.7%
Hamburg 2.9%
Leipzig 2.6%
München 3.5%
Rostock 2.4%
Athina 2.6%
Irakleio 2.4%
Budapest 3.0%
Miskolc 3.6%
Dublin 2.5%
Bologna 4.8%
Napoli 8.2%
Palermo 5.3%
Roma 4.5%
Torino 4.5%
Verona 5.2%
Vilnius 3.5%
Luxembourg 2.7%
Riga 4.0%
Valletta 4.3%
Amsterdam 3.6%
Groningen 3.7%
Rotterdam 2.7%
Bialystok 3.9%
Gdansk 4.6%
Kraków 4.1%
Warszawa 3.9%
Braga 4.8%
Lisboa 4.3%
Bucuresti 6.2%

Quality of Life in European Cities Survey 2019
Directorate-General for Regional and Urban Policy 2020 45
Cluj-Napoca 9.7%
Piatra Neamt 11.3%
Bratislava 3.1%
Košice 2.5%
Ljubljana 3.2%
Barcelona 2.9%
Madrid 2.9%
Málaga 3.2%
Oviedo 3.5%
Malmö 2.6%
Stockholm 2.5%
Belfast 2.5%
Cardiff 2.3%
Glasgow 2.2%
London 2.6%
Manchester 2.2%
Tyneside conurbation
2.1%
Reykjavík 3.1%
Oslo 2.8%
Genève 2.3%
Zürich 1.7%
Tirana 8.0%
Skopje 6.9%
Podgorica 1.8%
Beograd 6.9%
Ankara 11.5%
Istanbul 11.9%
Antalya 12.6%
Diyarbakir 12.6%
5.4.2 Impact and significance of response rates
While the response rate achieved in the 2019 Perception Survey can be considered low in
absolute terms (only about 2 in every 100 phone numbers in the gross sample resulting in
a complete interview), the response rate is not significantly below what is nowadays often
seen in CATI surveys. The decline of landline connections and the shifting habits of phone
use (towards chat message applications like Whatsapp and video messaging, rather than
phone conversations), and increased used of number recognition and number blocking on
mobile phones, makes reaching respondents ever more difficult. This is a challenge that
concerns all CATI surveys.
A general objective when organizing surveys is indeed to maximize response rates, this
both from the perspective of fieldwork efficiency as well as maintaining data quality by
avoiding non-response bias. It is the latter (non-response bias) that is sometimes seen as
the biggest risk related to declining response rates.
Non-response bias is the phenomenon where survey data are affected by non-response
because the opinions from those that participated in the survey are significantly different

Quality of Life in European Cities Survey 2019
Directorate-General for Regional and Urban Policy 2020 46
from those that did not respond. It needs to be emphasized, however, that the relationship
between response rates and potential non-response bias is a complex one, and that low
non-response is a necessary but not a sufficient condition of non-response bias.
Specifically, non-response bias only applies to individual variables (rather than surveys as
a whole), and only if there is a non-zero correlation between a given variable and the
likelihood that someone participates in the survey. It also needs to be taken into account
that any non-response bias that is related to variables that are also used for weighting
(i.e., when younger respondents are harder to reach) is already balanced out – of course
only to a certain level of skews in these variables – by the weighting.
Academic studies of non-response fall into two types, Absolute Non-Response studies and
Relative Non-Response studies. Absolute Non-Response studies compare survey estimates
to good estimates of a “true” value of a variable, normally from the Census to look at total
non-response bias. Relative non-response bias studies assess how survey estimates
change with increasing fieldwork effort (e.g. number of contact attempts, extent of
reissuing). There are two key academic meta-analysis studies:
• Groves and Peycheva (2008) 11 conducted a meta-analysis of Absolute Non-
Response in 59 studies (covering 959 estimates). While they found examples of
large non-response bias existing, they also found that there was a very low
correlation between non-response bias and response rates, and greater
variation within studies than between them. They argue for the importance of
finding theories that link unit non-response to non-response bias and make a
distinction between missing respondents that don’t introduce bias and those
that do. An example would be young men, living on their own, and whether they
play sport. These type of households tend to be underrepresented in household
surveys. Weighting can help account for this, but only if those who are
interviewed are similar to those who are not. If, for example, not enough
fieldwork effort is made and those who are out playing sport several time a week
are not contacted, it could be assumed that bias would remain after weighting.
This, however, is taking into account explicitly in the Perception Survey
fieldwork setup by conducting multiple contact attempts and by spreading these
attempts over different times of the day and the week – thus succeeding in
keeping the skew towards older people relatively low.
• Sturgis et al (2016) 12 examined relative non-response bias and fieldwork effort
in 541 non-demographic variables in six surveys. They conclude that “response
rate appears to have only a weak association with non-response bias”.
In short, it is important to remember that while non-response bias does occur, it is
important to be aware of the relative importance of response rates in the overall set of
factors that eventually determine survey outcomes. With respect to survey fieldwork
organization and effective use of the available resources, it needs to be considered on a
survey-by-survey basis whether extra fieldwork effort to increase response rates or to
reach a certain pre-set target in this regards is the right strategy, given that its likely
impact will be low.
6 Data comparison 2019-2015
11 https://academic.oup.com/poq/article-abstract/72/2/167/1920564/The-Impact-of-Nonresponse-Rates-on-Nonresponse
12 https://academic.oup.com/poq/article-abstract/81/2/523/2676922

Quality of Life in European Cities Survey 2019
Directorate-General for Regional and Urban Policy 2020 47
Annex 2 contains a table showing the differences between the 2019 and the 2015 results
of the Perception Survey (overall, combined for all cities). This comparison was made to
verify whether the changes in the sample design, the screening procedure and the
weighting of the data had any impact on the data that would cause deviations that go
beyond what could be considered normal variance or trend changes between two waves.
7 Recommendations for future waves
- The 2019 Perception Survey applied a new sampling approach that relied on the
availability of publicly available geolocation data linked to phone numbers to identify
eligible mobile phone sample. In evaluation of this approach, 2 major conclusions can be
drawn. First, in most cities the approach proved successful in building a sample that was
at the same time big enough (enough numbers could be gathered to yield the target
amount of mobile number interviews in the final sample) and accurate enough (in most
cities a clear majority of the selected units proved indeed to be eligible, greatly increasing
calling efficiency). Second, building a mobile phone sample in this way is time-intensive,
and in the scheduling of a future wave – should the same method be applied – enough
time should be foreseen to build a mobile sample in this way.
- Measured per age group, the deviations from the targets are quite small. There is,
however, a slight skew away from younger people (-35). This may in part be due to a
higher proportion of landline numbers in the sample, though as said the landline skew is
only moderate in the final sample. More importantly, it is also the case that younger people
are simply harder to reach over the phone, even via mobile phones. While the results of
the 2019 Perception Survey do not show reason for great concern yet, there is a possibility
that this trend in CATI surveys will continue. In the longer term, it is therefore advisable
to look into the possibilities that other survey modes (e.g., web and smartphone) and other
recruitment modes (e.g., via social media) have to offer. This should of course be
accompanied with an analysis of mode and sample source biases and the effects that they
can have on comparability.
- Already during the pilot, it became clear that the questionnaire has some elements that
create a heightened risk of observation issues. First, the sequence of big grid questions in
the beginning of the survey puts a big burden on the respondents, as is demonstrated by
the fact that we can observe a big dropout around the Q2-Q4 block. It should be noted
that while a dropout is an issue mostly for the fieldwork efficiency, with less impact on the
data quality itself (because the data from terminated interviews are not counted), it is also
indicative of a risk that responses to these questions from respondents that remain in the
interview (and are thus included in the results) are also of lower quality. This can be solved
by either making the questionnaire more focussed (i.e. shorter), or by splitting the grids
in smaller parts and spreading them over the interview, so that the cognitive load of the
interview is distributed more evenly.
Second, trying to measure respondents’ occupation in a way that is comparable with
universe statistics is notoriously difficult to do efficiently in a CATI survey. If comparison
with benchmark statistics is necessary, coding occupation according to ISCO codes is
necessary. However, identifying the right ISCO category for a respondent’s given
occupation is complex, and accuracy of this task can be considerably increased by using
an approach with multiple questions. Within the present design, however, this might be
difficult, since the questionnaire is already quite long. If this is to remain a background
variable in future waves, and if comparison against universe statistics is deemed
necessary, we advise that it is still asked by using one question, as is presently done but
with giving enough examples to interviewers on how to code the most common types of
occupations. However, if the occupation data are only needed for comparison between
cities and for research purposes without comparison to a wider universe, it can be
considered to use questions with response categories that are easier to grasp for

Quality of Life in European Cities Survey 2019
Directorate-General for Regional and Urban Policy 2020 48
respondents. An example could be for instance the categories used in the Market
Monitoring Survey over the past years:
What is your current occupation?
1. Self-employed
2. Manager
3. Other white collar
4. Blue collar
5. Student
6. House-person and other not in employment
7. Seeking a job
8. Retired
- Any future wave should always identify the best screening option per city to identify
whether respondents live in the target region. This cannot always be done via postcode,
but as the Lisboa example (see 2.3.1) shows, it is also not always easy to ask for local
regions. Moreover, as administrative and statistical boundaries, as well as postcode
systems, change, it needs to be determined for each new wave whether previously used
screening questions can still work. Local expertise is indispensable here.
- English was offered in all cities as an optional language to take the interview in, in order
to include as much as possible immigrant populations that might not (yet) speak the local
language well enough to be able (or feel comfortable) to do the interview in that language.
However, it was only very rarely used – the most in Paris (7 times) and Luxembourg (9
times). To the extent that it is easy for fieldwork agencies to offer this option, it is worth
considering keeping this option. This is most likely in centrally organised fieldwork, working
from a small number of hubs. In case of heavily decentralized fieldwork, with local agencies
in each country, offering English might require extra investment from these local centres
that will not pay off, given the rare use of the option by respondents.

Annex 1. Final questionnaire
Introduction text Language. [PROG: SINGLE RESPONSE] Code the respondent language (DO NOT READ OUT)
1 Albanian show if country_sample = 32 (AL) or 33 (MK)
2 Bulgarian show if country_sample = 3 (BG)
3 Catalan show if country_sample = 26 (ES)
4 Croatian show if country_sample = 4 (HR)
5 Czech show if country_sample = 6 (CZ)
6 Danish show if country_sample = 7 (DK)
7 Dutch show if country_sample = 2 (BE) or 20 (NL)
8 English Always show
9 Estonian show if country_sample = 8 (EE)
10 Finnish show if country_sample = 9 (FI)
11 French show if country_sample = 2 (BE) or 10 (FR) or 17 (LU)
12 German show if country_sample = 1 (AT) or 11 (DE) or 17 (LU) or 31 (CH)
13 Greek show if country_sample = 5 (CY) or 12 (EL)
14 Hungarian show if country_sample = 13 (HU)
15 Icelandic show if country_sample = 29 (IS)
16 Italian show if country_sample = 15 (IT) or 31 (CH)
17 Latvian show if country_sample = 18 (LV)
18 Lithuanian show if country_sample = 16 (LT)
19 Macedonian show if country_sample = 33 (MK)
20 Maltese show if country_sample = 19 (MT)
21 Montenegrin show if country_sample = 34 (ME)
22 Norwegian show if country_sample = 30 (NO)
23 Poland show if country_sample = 21 (PL)
24 Portugal show if country_sample = 22 (PT)
25 Romanian show if country_sample = 23 (RO)
26 Russian show if country_sample = 8 (EE) or 18 (LV)
27 Serbian show if country_sample = 35 (RS)
28 Slovakian show if country_sample = 24 (SK)
29 Slovenian show if country_sample = 25 (SI)
30 Spanish show if country_sample = 26 (ES)
31 Swedish show if country_sample = 27 (SE)
32 Turkish show if country_sample = 36 (TR)
Intro1. [PROG: TEXT; Show if sample_country is not 28 (UK)]

Quality of Life in European Cities Survey 2019
Directorate-General for Regional and Urban Policy 2020 50
Good morning/afternoon/evening. My name is XXX and I’m calling on behalf of Ipsos, a market research firm. We are conducting a large study for the European Commission on how people experience their life in the city. [PROG: if SampleType = 1 (mobile): continue to Intro_consentmob; if SampleType = 2 (fixed): continue to D0.]
Intro2. [PROG: TEXT; Show if sample_country = 28 (UK)] Good morning/afternoon/evening. My name is XXX and I’m calling on behalf of Ipsos, a market research firm. We are conducting a large study for an international public body on how people experience their life in the city. Interviewer Instruction: if the respondent asks for which public body the study is conducted, you can mention the European Commission. [PROG: if SampleType = 1 (mobile): continue to Intro_consent; if SampleType = 2 (fixed): continue to D0.]
D0. [PROG: SINGLE RESPONSE; Show if SampleType = 2 (fixed)] Please can I speak to the person aged 15 or older within your household whose birthday it was most recently? 1. Yes 2. Person is not available. 99. No, refusal
[PROG: IF D0 = 99 : Screen out]
D0b. [PROG: SINGLE RESPONSE; Show if D0 = 2] When would be a good moment to call back to this person? [PROG: Show appointment screen]
Intro1_2. [PROG: TEXT; Show if D0 = 1 and if sample_country is not 28 (UK)] Interviewer instruction: repeat introduction if a new respondent comes to the line: Intro1. Good morning/afternoon/evening. My name is XXX and I’m calling on behalf of Ipsos, a market research firm. We are conducting a large study for the European Commission on how people experience their life in the city.)
Intro2_2. [PROG: TEXT; Show if D0 = 1 and if sample_country is 28 (UK)]

Quality of Life in European Cities Survey 2019
Directorate-General for Regional and Urban Policy 2020 51
Interviewer instruction: repeat introduction if a new respondent comes to the line: Intro2.Good morning/afternoon/evening. My name is XXX and I’m calling on behalf of Ipsos, a market research firm. We are conducting a large study for an international public body on how people experience their life in the city.) Interviewer Instruction: if the respondent asks for which public body the study is conducted, you can mention the European Commission.
Introconsent. [PROG: TEXT; Show to all] The survey will take about 10 minutes. We guarantee you that all your answers will remain anonymous, and that no personal data will be shared in any way. Before we start, I just want to clarify that participation in the survey is voluntary and you can change your mind at any time. Are you happy to proceed with the interview? Only read IF NECESSARY: If you would like to read the Privacy Notice beforehand you can access it online at https://survey.ipsos.be/privacynoticeQoLCities.pdf
Screener D1. [PROG: Quantity, 3 digits, range min. 0 – max. 115 + 999] What is your age? 999. Don’t know/No Answer/Refuses (DO NOT READ OUT)
D1_recode. [PROG: HIDDEN VARIABLE; recode the response from D1 into the corresponding age category] 1. 15-19 2. 20-24 3. 25-34 4. 35-44 5. 45-54 6. 55-64 7. 65-74 8. 75+ 999. Don’t know/No Answer/Refuses
[PROG: IF D1 < 15 : Screen out] [PROG: IF D1 = 999 : Screen out]
D2. [PROG: SINGLE RESPONSE] What is your sex? (DO NOT READ OUT, to be observed by interviewer)

Quality of Life in European Cities Survey 2019
Directorate-General for Regional and Urban Policy 2020 52
1. Male 2. Female
D3a. [PROG: SINGLE RESPONSE; show if country_sample = 28 (UK), 14 (IE), 3 (BG), 23 (RO), 20 (NL)] Do you live in …
1 The city of Belfast show if City_sample = 2801 (Belfast)
2 The city of Lisburn show if City_sample = 2801 (Belfast)
3 The borough of Castlereagh show if City_sample = 2801 (Belfast)
4 The city of Cardiff show if City_sample = 2802 (Cardiff)
5 The city of Glasgow show if City_sample = 2803 (Glasgow)
6 The council area of East Dunbartonhsire show if City_sample = 2803 (Glasgow)
7 The council area of East Renfrewshire show if City_sample = 2803 (Glasgow)
8 The council area of Renfrewshire show if City_sample = 2803 (Glasgow)
9 Greater London show if City_sample = 2804 (London)
10 The city of Newcastle upon Tyne show if City_sample = 2806 (Tyneside Conurbation)
11 The borough of North Tyneside show if City_sample = 2806 (Tyneside Conurbation)
12 The borough of South Tyneside show if City_sample = 2806 (Tyneside Conurbation)
13 The metropolitan Borough of Gateshead show if City_sample = 2806 (Tyneside Conurbation)
14 Dublin County show if City_sample = 1401 (Dublin)
15 The city of Burgas show if City_sample = 301 (Burgas)
16 Sofia Capital Municipality show if City_sample = 302 (Sofia)
17 Municipiul Bucureşti show if City_sample = 2301 (Bucuresti)
18 Municipiul Cluj-Napoca show if City_sample = 2302 (Cluj Napoca)
19 Municipiul Piatra Neamţ show if City_sample = 2303 (Piatra Neamt)
20 De gemeente Amsterdam show if City_sample = 2001 (Amsterdam)
21 De gemeente Amstelveen show if City_sample = 2001 (Amsterdam)
22 De gemeente Diemen show if City_sample = 2001 (Amsterdam)
23 De gemeente ouder-Amstel show if City_sample = 2001 (Amsterdam)
24 De gemeente Rotterdam show if City_sample = 2003 (Rotterdam)
25 De gemeente Ablasserdam show if City_sample = 2003 (Rotterdam)
26 De gemeente Barendrecht show if City_sample = 2003 (Rotterdam)
27 De gemeente Capelle-aan-den-IJssel show if City_sample = 2003 (Rotterdam)
28 De gemeente Dordrecht show if City_sample = 2003 (Rotterdam)
29 De gemeente Hendrik-Ido-Ambacht show if City_sample = 2003 (Rotterdam)
30 De gemeente Krimpen aan den IJssel show if City_sample = 2003 (Rotterdam)
31 De gemeente Papendrecht show if City_sample = 2003 (Rotterdam)
32 De gemeente Ridderkerk show if City_sample = 2003 (Rotterdam)
33 De gemeente Schiedam show if City_sample = 2003 (Rotterdam)
34 De gemeente Vlaardingen show if City_sample = 2003 (Rotterdam)
35 De gemeente Zwijndrecht show if City_sample = 2003 (Rotterdam)
36 De gemeente Groningen show if City_sample = 2002 (Groningen)
37 Greater Manchester show if City_sample = 2805 (Manchester)

Quality of Life in European Cities Survey 2019
Directorate-General for Regional and Urban Policy 2020 53
98 No, I live somewhere else (DO NOT READ OUT)
99 Don’t know/No Answer/Refuses (DO NOT READ OUT)
[PROG: IF D3a = 99 : Screen out] [PROG: IF D3a = 98 : Screen out and show message “I’m sorry, you do not live in the right region to participate in this survey.“ Note: it is important the screen out is done after D3a in order to collect their answers still in D3a for sample analysis purposes
D3b. [PROG: SINGLE RESPONSE; Drop down list; show if country_sample = 22 (PT)] In which Freguesia do you live? Interviewer instruction: Do not read out list
1 Adaúfe show if City_sample = 2201 (Braga)
2 Águas Livres show if City_sample = 2202 (Lisboa)
3 Ajuda show if City_sample = 2202 (Lisboa)
4 Alcabideche show if City_sample = 2202 (Lisboa)
5 Alcântara show if City_sample = 2202 (Lisboa)
6 Alfragide show if City_sample = 2202 (Lisboa)
7 Algés, Linda-a-Velha e Cruz Quebrada-Dafundo show if City_sample = 2202 (Lisboa)
8 Almada, Cova da Piedade, Pragal e Cacilhas show if City_sample = 2202 (Lisboa)
9 Alto do Seixalinho, Santo André e Verderena show if City_sample = 2202 (Lisboa)
10 Alvalade show if City_sample = 2202 (Lisboa)
11 Amora show if City_sample = 2202 (Lisboa)
12 Areeiro show if City_sample = 2202 (Lisboa)
13 Arentim e Cunha show if City_sample = 2201 (Braga)
14 Arroios show if City_sample = 2202 (Lisboa)
15 Avenidas Novas show if City_sample = 2202 (Lisboa)
16 Barcarena show if City_sample = 2202 (Lisboa)
17 Barreiro e Lavradio show if City_sample = 2202 (Lisboa)
18 Beato show if City_sample = 2202 (Lisboa)
19 Belém show if City_sample = 2202 (Lisboa)
20 Benfica show if City_sample = 2202 (Lisboa)
21 Braga (Maximinos, Sé e Cividade) show if City_sample = 2201 (Braga)
22 Braga (São José de São Lázaro e São João do Souto) show if City_sample = 2201 (Braga)
23 Braga (São Vicente) show if City_sample = 2201 (Braga)
24 Braga (São Vítor) show if City_sample = 2201 (Braga)
25 Bucelas show if City_sample = 2202 (Lisboa)
26 Cabreiros e Passos (São Julião) show if City_sample = 2201 (Braga)
27 Camarate, Unhos e Apelação show if City_sample = 2202 (Lisboa)
28 Campo de Ourique show if City_sample = 2202 (Lisboa)
29 Campolide show if City_sample = 2202 (Lisboa)

Quality of Life in European Cities Survey 2019
Directorate-General for Regional and Urban Policy 2020 54
30 Caparica e Trafaria show if City_sample = 2202 (Lisboa)
31 Carcavelos e Parede show if City_sample = 2202 (Lisboa)
32 Carnaxide e Queijas show if City_sample = 2202 (Lisboa)
33 Carnide show if City_sample = 2202 (Lisboa)
34 Cascais e Estoril show if City_sample = 2202 (Lisboa)
35 Celeirós, Aveleda e Vimieiro show if City_sample = 2201 (Braga)
36 Charneca de Caparica e Sobreda show if City_sample = 2202 (Lisboa)
37 Corroios show if City_sample = 2202 (Lisboa)
38 Costa da Caparica show if City_sample = 2202 (Lisboa)
39 Crespos e Pousada show if City_sample = 2201 (Braga)
40 Encosta do Sol show if City_sample = 2202 (Lisboa)
41 Escudeiros e Penso (Santo Estêvão e São Vicente) show if City_sample = 2201 (Braga)
42 Espinho show if City_sample = 2201 (Braga)
43 Esporões show if City_sample = 2201 (Braga)
44 Este (São Pedro e São Mamede) show if City_sample = 2201 (Braga)
45 Estrela show if City_sample = 2202 (Lisboa)
46 Falagueira-Venda Nova show if City_sample = 2202 (Lisboa)
47 Fanhões show if City_sample = 2202 (Lisboa)
48 Fernão Ferro show if City_sample = 2202 (Lisboa)
49 Ferreiros e Gondizalves show if City_sample = 2201 (Braga)
50 Figueiredo show if City_sample = 2201 (Braga)
51 Gualtar show if City_sample = 2201 (Braga)
52 Guisande e Oliveira (São Pedro) show if City_sample = 2201 (Braga)
53 Lamas show if City_sample = 2201 (Braga)
54 Laranjeiro e Feijó show if City_sample = 2202 (Lisboa)
104 Lisboa show if City_sample = 2202 (Lisboa)
55 Lomar e Arcos show if City_sample = 2201 (Braga)
56 Loures show if City_sample = 2202 (Lisboa)
57 Lousa show if City_sample = 2202 (Lisboa)
58 Lumiar show if City_sample = 2202 (Lisboa)
59 Marvila show if City_sample = 2202 (Lisboa)
60 Merelim (São Paio), Panoias e Parada de Tibães show if City_sample = 2201 (Braga)
61 Merelim (São Pedro) e Frossos show if City_sample = 2201 (Braga)
62 Mina de Água show if City_sample = 2202 (Lisboa)
63 Mire de Tibães show if City_sample = 2201 (Braga)
64 Misericórdia show if City_sample = 2202 (Lisboa)
65 Morreira e Trandeiras show if City_sample = 2201 (Braga)
66 Moscavide e Portela show if City_sample = 2202 (Lisboa)
67 Nogueira, Fraião e Lamaçães show if City_sample = 2201 (Braga)
68 Nogueiró e Tenões show if City_sample = 2201 (Braga)
69 Odivelas show if City_sample = 2202 (Lisboa)
70 Oeiras e São Julião da Barra, Paço de Arcos e Caxias show if City_sample = 2202 (Lisboa)
71 Olivais show if City_sample = 2202 (Lisboa)
72 Padim da Graça show if City_sample = 2201 (Braga)

Quality of Life in European Cities Survey 2019
Directorate-General for Regional and Urban Policy 2020 55
73 Palhais e Coina show if City_sample = 2202 (Lisboa)
74 Palmeira show if City_sample = 2201 (Braga)
75 Parque das Nações show if City_sample = 2202 (Lisboa)
76 Pedralva show if City_sample = 2201 (Braga)
77 Penha de França show if City_sample = 2202 (Lisboa)
78 Pontinha e Famões show if City_sample = 2202 (Lisboa)
79 Porto Salvo show if City_sample = 2202 (Lisboa)
80 Póvoa de Santo Adrião e Olival Basto show if City_sample = 2202 (Lisboa)
81 Priscos show if City_sample = 2201 (Braga)
82 Ramada e Caneças show if City_sample = 2202 (Lisboa)
83 Real, Dume e Semelhe show if City_sample = 2201 (Braga)
84 Ruilhe show if City_sample = 2201 (Braga)
85 Sacavém e Prior Velho show if City_sample = 2202 (Lisboa)
86 Santa Clara show if City_sample = 2202 (Lisboa)
87 Santa Iria de Azoia, São João da Talha e Bobadela show if City_sample = 2202 (Lisboa)
88 Santa Lucrécia de Algeriz e Navarra show if City_sample = 2201 (Braga)
89 Santa Maria Maior show if City_sample = 2202 (Lisboa)
90 Santo Antão e São Julião do Tojal show if City_sample = 2202 (Lisboa)
91 Santo António show if City_sample = 2202 (Lisboa)
92 Santo António da Charneca show if City_sample = 2202 (Lisboa)
93 Santo António dos Cavaleiros e Frielas show if City_sample = 2202 (Lisboa)
94 São Domingos de Benfica show if City_sample = 2202 (Lisboa)
95 São Domingos de Rana show if City_sample = 2202 (Lisboa)
96 São Vicente show if City_sample = 2202 (Lisboa)
97 Seixal, Arrentela e Aldeia de Paio Pires show if City_sample = 2202 (Lisboa)
98 Sequeira show if City_sample = 2201 (Braga)
99 Sobreposta show if City_sample = 2201 (Braga)
100 Tadim show if City_sample = 2201 (Braga)
101 Tebosa show if City_sample = 2201 (Braga)
102 Venteira show if City_sample = 2202 (Lisboa)
103 Vilaça e Fradelos show if City_sample = 2201 (Braga)
998 No, I live somewhere else (DO NOT READ OUT)
999 Don’t know/No Answer/Refuses (DO NOT READ OUT)
[PROG: IF D3b = 999 : Screen out] [PROG: IF D3b = 998 : Screen out and show message “I’m sorry, you do not live in the right region to participate in this survey.“ Note: it is important the screen out is done after D3b in order to collect their answers still in D3b for sample analysis purposes
D3c_1. [PROG: Open end box; range: min. 3 characters – max. 3 characters; show if country_sample = 19 (MT)] What is your postcode?

Quality of Life in European Cities Survey 2019
Directorate-General for Regional and Urban Policy 2020 56
Interviewer instruction: only use letters to record the postcode, no numbers 999. Don’t know/No Answer/Refuses (DO NOT READ OUT)
D3c_2. [PROG: Quantity; 3 digits; range: min 100 – max 999; show if country_sample = 29 (IS)] What is your postcode? Interviewer instruction: only use numbers to record the postcode, no spaces or hyphens 999. Don’t know/No Answer/Refuses (DO NOT READ OUT)
D3c_3. [PROG: Quantity; 4 digits; range: min 0000 – max 9999; show if country_sample = 30 (NO)] What is your postcode? Interviewer instruction: only use numbers to record the postcode, no spaces or hyphens 9999. Don’t know/No Answer/Refuses (DO NOT READ OUT)
D3c_4. [PROG: Quantity; 4 digits; range: min 1000 – max 9999; show if country_sample = 1 (AT), 2 (BE), 5 (CY), 7 (DK), 13 (HU), 17 (LU), 18 (LV), 25 (SI), 31 (CH), 32 (AL), 33 (MK))] What is your postcode? Interviewer instruction: only use numbers to record the postcode, no spaces or hyphens 9999. Don’t know/No Answer/Refuses (DO NOT READ OUT)
D3c_5. [PROG: Quantity; 5 digits; range: min 00000 – max 99999; show if country_sample = 8 (EE), 9 (FI), 10 (FR), 11 (DE), 15 (IT), 16 (LT), 21 (PL), 24 (SK), 26 (ES), 34 (ME), 35 (RS), 36 (TR)] What is your postcode? Interviewer instruction: only use numbers to record the postcode, no spaces or hyphens 99999. Don’t know/No Answer/Refuses (DO NOT READ OUT)
D3c_6. [PROG: Quantity; 5 digits; range: min 10000 – max 99999; show if country_sample = 4 (HR), 6 (CZ), 12 (EL), 27 (SE))] What is your postcode? Interviewer instruction: only use numbers to record the postcode, no spaces or hyphens 999999. Don’t know/No Answer/Refuses (DO NOT READ OUT)
[PROG: IF D3c_1 = 999 : Screen out] [PROG: IF D3c_2 = 999 : Screen out] [PROG: IF D3c_3 = 9999 : Screen out] [PROG: IF D3c_4 = 9999 : Screen out] [PROG: IF D3c_5 = 99999 : Screen out] [PROG: IF D3c_6 = 999999 : Screen out]

Quality of Life in European Cities Survey 2019
Directorate-General for Regional and Urban Policy 2020 57
[PROG: match input in D3c_1-6 against list “D3c – postcodes” in Annex. Only match against postcodes from sample country (columns A-B in annex list), not from other countries! If postcode does not match against a code in the list, go to D3d: Screen out and show message “I’m sorry, you do not live in the right region to participate in this survey.“ Note: it is important the screen out is done after D3c in order to collect their answers still in D3c for sample analysis purposes]
D3_cityrecode. [PROG: HIDDEN VARIABLE; recode D3c_1-6 into city_code value (see sheet D3C – postcodes in annex] Note: labels of D3_cityrecode are identical to city_sample build the variable using the info from column I, F, B,E, C e.g. if D3c_4 (column I) = 1070 (column F) & Country_sample = 2 (Column B) D3_cityrecode = 202 (column E) Bruxelles/Brussel (column C) IF country_sample = 28 (UK), 14 (IE), 3 (BG), 23 (RO), 20 (NL) or 22 (PT) autocode D3_cityrecode = city_sample
D3_lau_recode. [PROG: HIDDEN VARIABLE; recode D3c_1-6 into lau_code value (see sheet D3C – postcodes in annex] Note: labels of D3_lau_recode are identical to lau_sample build the variable using the info from column I, F, B,D, G e.g. if D3c_4 (column I) = 1070 (column F) & Country_sample = 2 (Column B) D3_lau_recode = 202001 (column D) Anderlecht (column G) + IF country_sample = 28 (UK), 14 (IE), 3 (BG), 23 (RO), 20 (NL) or 22 (PT) use the below tables for the recode
If D3a = D3c_lau_recode =
1 2801001
2 2801002
3 2801002
4 2802001
5 2803002
6 2803001
7 2803003
8 2803004

Quality of Life in European Cities Survey 2019
Directorate-General for Regional and Urban Policy 2020 58
10 2806001
11 2806002
12 2806003
13 2806004
15 301001
16 302001
17 2301001
18 2302001
19 2303001
20 2001002
21 2001001
22 2001003
23 2001004
24 2003009
25 2003001
26 2003002
27 2003003
28 2003004
29 2003005
30 2003006
31 2003007
32 2003008
33 2003010
34 2003011
35 2003012
36 2002001
Recode D3b into lau_code as follows:
if D3b = D3_lau_recode =
1 2201001
2 2202045
3 2202005
4 2202001
5 2202006
6 2202044
7 2202041
8 2202055
9 2202060
10 2202015
11 2202063
12 2202016
13 2201019
14 2202017

Quality of Life in European Cities Survey 2019
Directorate-General for Regional and Urban Policy 2020 59
15 2202018
16 2202039
17 2202061
18 2202007
19 2202019
20 2202008
21 2201020
22 2201021
23 2201013
24 2201014
25 2202029
26 2201022
27 2202038
28 2202020
29 2202009
30 2202056
31 2202003
32 2202042
33 2202010
34 2202004
35 2201023
36 2202057
37 2202064
38 2202054
39 2201024
40 2202046
41 2201025
42 2201002
43 2201003
44 2201026
45 2202021
46 2202047
47 2202030
48 2202065
49 2201027
50 2201004
51 2201005
52 2201028
53 2201006
54 2202058
55 2201029
56 2202031
57 2202032
58 2202011
59 2202012

Quality of Life in European Cities Survey 2019
Directorate-General for Regional and Urban Policy 2020 60
60 2201030
61 2201031
62 2202048
63 2201007
64 2202022
65 2201032
66 2202033
67 2201033
68 2201034
69 2202050
70 2202043
71 2202013
72 2201008
73 2202062
74 2201009
75 2202023
76 2201010
77 2202024
78 2202051
79 2202040
80 2202052
81 2201011
82 2202053
83 2201035
84 2201012
85 2202034
86 2202025
87 2202035
88 2201036
89 2202026
90 2202036
91 2202027
92 2202059
93 2202037
94 2202014
95 2202002
96 2202028
97 2202066
98 2201015
99 2201016
100 2201017
101 2201018
102 2202049
103 2201037

Quality of Life in European Cities Survey 2019
Directorate-General for Regional and Urban Policy 2020 61
104 No LAU recode
D4. [PROG: hidden empty variable] DEGURBA
Main Questionnaire Q1. [PROG: SINGLE RESPONSE GRID] Generally speaking, please tell me if you are very satisfied, rather satisfied, rather unsatisfied or very unsatisfied with each of the following issues in your city or area. Rows [PROG: Randomise items 1-10] 1. Public transport, for example the bus, tram or metro. 2. Health care services, doctors and hospitals. 3. Sport facilities such as sport fields and indoor sports halls. 4. Cultural facilities such as concert halls, theatres, museums and libraries. 5. Green spaces such as parks and gardens. 6. Public spaces such as markets, squares, pedestrian areas. 7. Schools and other educational facilities. 8. The quality of the air. 9. The noise level. 10. Cleanliness. Columns 4. Very satisfied 3. Rather satisfied 2. Rather unsatisfied 1. Very unsatisfied 99. Don’t know/No Answer/Refuses (DO NOT READ OUT)
Q2. [PROG: SINGLE RESPONSE GRID] I will read you a few statements. Please tell me whether you strongly agree, somewhat agree, somewhat disagree or strongly disagree with each of these statements. Rows [PROG: Randomise items 1-7; Treat 3-4 and 6-7 as fixed pairs: Make sure that item 4 always comes right after 3, and item 7 right after 6] 1. I'm satisfied to live in my city. 2. It is easy to find a good job in my city. 3. I feel safe walking alone at night in my city. 4. I feel safe walking alone at night in my neighbourhood. 5. It is easy to find good housing in my city at a reasonable price. 6. Generally speaking, most people in my city can be trusted.

Quality of Life in European Cities Survey 2019
Directorate-General for Regional and Urban Policy 2020 62
7. Generally speaking, most people in my neighbourhood can be trusted. Columns 4. Strongly agree 3. Somewhat agree 2. Somewhat disagree 1. Strongly disagree 99. Don’t know/No Answer/Refuses (DO NOT READ OUT)
Q3. [PROG: SINGLE RESPONSE GRID] Is the city where you live a good place or not a good place to live for the following groups? Rows [PROG: Randomise Rows; Keep item 1 always first, randomise items 2-6] 1. People in general. [PROG: Fixed] 2. Racial and ethnic minorities. 3. Gay or lesbian people. 4. Immigrants from other countries. 5. Young families with children. 6. Elderly people. Columns 1. A good place to live 2. Not a good place to live 99. Don’t know/No Answer/Refuses (DO NOT READ OUT)
Q4. [PROG: SINGLE RESPONSE GRID] On the whole, are you very satisfied, fairly satisfied, not very satisfied or not at all satisfied with: Rows [PROG: Randomise items 1-4] 1. The neighbourhood where you live 2. Your personal job situation. 3. The financial situation of your household. 4. The life you lead. Columns 4. Very satisfied 3. Fairly satisfied 2. Not very satisfied 1. Not at all satisfied 99. Don’t know/No Answer/Refuses (DO NOT READ OUT)
Q5. [PROG: MULTIPLE RESPONSE; max. 2 responses allowed] On a typical day, which mode(s) of transport do you use most often?… Interviewer instruction: allow 2 responses if offered spontaneously by the respondent, but do not probe if only 1 is given.

Quality of Life in European Cities Survey 2019
Directorate-General for Regional and Urban Policy 2020 63
1. Car 2. Motorcycle 3. Bicycle 4. Foot 5. Train 6. Urban public transport (bus, tram or metro) 7. Other 98. Do not commute [PROG: Single Response] 99. Don’t know/No Answer/Refuses (DO NOT READ OUT) [PROG: Single Response]
Q6. [PROG: SINGLE RESPONSE GRID] Thinking about public transport in your city, based on your experience or perceptions, please tell me whether you strongly agree, somewhat agree, somewhat disagree or strongly disagree with each of these statements. Public transport in your city is: Rows [PROG: Randomise items 1-5] 1. Affordable 2. Safe 3. Easy to get 4. Frequent (comes often) 5. Reliable (comes when it says it will) Columns 4. Strongly agree 3. Somewhat agree 2. Somewhat disagree 1. Strongly disagree 99. Don’t know/No Answer/Refuses (DO NOT READ OUT)
Q7. [PROG: SINGLE RESPONSE] In the city where you live, do you have confidence in the local police force? 1. Yes 2. No 99. Don’t know/No Answer/Refuses (DO NOT READ OUT)
Q8. [PROG: SINGLE RESPONSE] Within the last 12 months, was any money or property stolen from you or another household member in your city? 1. Yes 2. No 99. Don’t know/No Answer/Refuses (DO NOT READ OUT)
Q9. [PROG: SINGLE RESPONSE] Within the last 12 months, have you been assaulted or mugged in your city?

Quality of Life in European Cities Survey 2019
Directorate-General for Regional and Urban Policy 2020 64
1. Yes 2. No 99. Don’t know/No Answer/Refuses (DO NOT READ OUT)
Q10. [PROG: SINGLE RESPONSE] Within the last 12 months, would you say you had difficulties to pay your bills at the end of the month … 1. Most of the time 2. From time to time 3. Almost never/never 99. Don’t know/No Answer/Refuses (DO NOT READ OUT)
Q11. [PROG: SINGLE RESPONSE] Do you feel that if you needed material help (e.g. money, loan or an object) you could receive it from relatives, friends, neighbours or other persons you know? 1. Yes 2. No 99. Don’t know/No Answer/Refuses (DO NOT READ OUT)
Q12. [PROG: SINGLE RESPONSE] Do you feel that if you needed non-material help (e.g. somebody to talk to, help with doing something or collecting something) you could receive it from relatives, friends, neighbours or other persons you know? 1. Yes 2. No 99. Don’t know/No Answer/Refuses (DO NOT READ OUT)
Q13. [PROG: SINGLE RESPONSE GRID] I will read you a few statements about the local public administration in your city. Please tell me whether you strongly agree, somewhat agree, somewhat disagree or strongly disagree with each of these statements. Rows [PROG: Randomise items 1-5] 1. I am satisfied with the amount of time it takes to get a request solved by my local public administration. 2. The procedures used by my local public administration are straightforward and easy to understand 3. The fees charged by my local public administration are reasonable 4. Information and services of my local public administration can be easily accessed online 5. There is corruption in my local public administration Columns 4. Strongly agree

Quality of Life in European Cities Survey 2019
Directorate-General for Regional and Urban Policy 2020 65
3. Somewhat agree 2. Somewhat disagree 1. Strongly disagree 99. Don’t know/No Answer/Refuses (DO NOT READ OUT)
Q14. [PROG: SINGLE RESPONSE] Compared to five years ago, would you say the quality of life in your city or area has: 1. Decreased 2. Stayed the same 3. Increased 99. Don’t know/No Answer/Refuses (DO NOT READ OUT)
Socio Demographic questions D5. [PROG: SINGLE RESPONSE; insert answer list “D5 – Countries”as drop down] In which country were you born?
D6. [PROG: SINGLE RESPONSE] Have you ever lived in another city for at least 1 year? 1. Yes 2. No 99. Don’t know/No Answer/Refuses (DO NOT READ OUT)
D7. [PROG: Quantity; only if D6 = 1; min. 0; max. 115] How many years have you been living in your current city since last moving here? Interviewer instruction: If respondent answers “less than 1 year”, code as 0 999. Don’t know/No Answer/Refuses (DO NOT READ OUT)
D9. [PROG: Quantity; min. 1; max. 15] How many people usually live in your household? Please include yourself.
D9b. [PROG: Quantity; only if D9 > 1; min.1.; max. = answer given in D9] How many of these are aged 15 and older? Please include yourself. [PROG: autocode D9b = 1 if D9 = 1]

Quality of Life in European Cities Survey 2019
Directorate-General for Regional and Urban Policy 2020 66
D8. [PROG: SINGLE RESPONSE. ONLY IF D9 > 1] Which of the following best describes your household composition? With household, we mean all people that typically live with you in the same residence. Please include anyone who is temporarily away for work, study or vacation [PROG: autocode D8 = 1 if D9 = 1] 1. One-person household [PROG: do not show. If D9 = 1, autocode D8 = 1] 2. Lone parent with at least one child aged less than 25 3. Lone parent with all children aged 25 or more 4. Couple without any child(ren) 5. Couple with at least one child aged less than 25 6. Couple with all children aged 25 or more 7. Other type of household 99. Don’t know/No Answer/Refuses (DO NOT READ OUT)
D10local. [PROG: SINGLE RESPONSE; insert answer list “D10 – education”; use the value and show “Educ categories ENGLISH” in the master questionnaire and the “Educ categories LOCAL” for the local translations] What is the highest level of education you have successfully completed? Interviewer instruction: DO NOT READ OUT response options unless needed to proceed 99. Don’t know/No Answer/Refuses (DO NOT READ OUT)
D10ISCED. [PROG: HIDDEN VARIABLE; recode the response from D10local into the corresponding isced level as indicated in the column “isced code”] 1. Less than Primary education (ISCED 0) 2. Primary education (ISCED 1) 3. Lower secondary education (ISCED 2) 4. Upper secondary education (ISCED 3) 5. Post-secondary non-tertiary education (ISCED 4) 6. Short-cycle tertiary education (ISCED 5) 7. Bachelor or equivalent (ISCED 6) 8. Master or equivalent (ISCED 7) 9. Doctoral or equivalent (ISCED 8) 10. Don’t know/No Answer/Refuses
D11a. [PROG: SINGLE RESPONSE] Do you currently have a job? Interviewer instruction: Include employees, employers, self-employed and people working as a relative assisting on family business. DO NOT INCLUDE people in compulsory military service or full-time homemakers.

Quality of Life in European Cities Survey 2019
Directorate-General for Regional and Urban Policy 2020 67
1. Yes 2. No 99. Don’t know/No Answer/Refuses
D11. [PROG: SINGLE RESPONSE, DO NOT SHOW IF D11a = 1] Which of the following best describes your current working status? 1. At work as employee or employer/self-employed/relative assisting on family business [PROG: do not show. If D11a = 1, autocode D11 = 1] 2. Unemployed, not looking actively for a job 3. Unemployed, looking actively for a job 4. Retired 5. Unable to work due to long-standing health problems 6. In full-time education (at school, university, etc.) / student 7. Full-time homemaker/responsible for ordinary shopping and looking after home 8. Compulsory military or civilian service 9. Other 99. Don’t know/No Answer/Refuses (DO NOT READ OUT)
D12. [PROG: SINGLE RESPONSE; only ask if D11 =1] What is your current job? Interviewer instruction: DO NOT READ OUT response options unless needed to proceed. If respondent is unsure, ask to state their exact job/function and propose a suitable category. If a respondent is in the military, always code as “armed forces occupation”, regardless of their job within the military. 1. Manager 2. Professional 3. Technician and associate professional 4. Clerical support worker 5. Services and sales worker 6. Agricultural, forestry or fishery worker 7. Craft or related trade worker 8. Plant or machine operator or assembler 9. Elementary occupation 10. Armed forces occupation [PROG: autocode D12 = 10 if D11 = 8] 99. Don’t know/No Answer/Refuses (DO NOT READ OUT)
D13. [PROG: SINGLE RESPONSE; ask if D11 = 1 or D11 = 8] Which of the following best describes your job? 1. Full-time job 2. Part-time job 99. Don’t know/No Answer/Refuses (DO NOT READ OUT)
D14. [PROG: SINGLE RESPONSE; ask if SampleType = 2 (Fixed)] Do you personally own a mobile phone?

Quality of Life in European Cities Survey 2019
Directorate-General for Regional and Urban Policy 2020 68
1. Yes 2. No [PROG: autocode D14 = 1 if SampleType = 1 (mobile sample)]
D15. [PROG: SINGLE RESPONSE; ask if SampleType = 1 (Mobile)] Do you have a landline phone in the household? 1. Yes 2. No [PROG: autocode D15 = 1 if SampleType = 2 (fixed sample)]
Mobfix. [PROG: HIDDEN VARIABLE; recode the response from D14 and D15 into the corresponding category]
1. Fixed only: If (SampleType = 2 and D14 = 2) 2. Mobile only: if (SampleType = 1 and D15 = 2) 3. Mixed: if (SampleType = 2 and D14 = 1) OR or (SampleType = 1 and D15 = 1)
Q15a [PROG: SINGLE RESPONSE] The next question is about your health status. Please remember that all your responses will be treated confidentially. You do not have to answer this question if you do not want to. Are you happy to proceed?
1. Yes
2. No Q15. [PROG: SINGLE RESPONSE, ask if Q15a=1] In general, how is your health? [PROG: autocode Q15=99 if Q15a = 2] 5. Very good 4. Good 3. Fair (neither good or bad) 2. Bad 1. Very bad 99. Don’t know/No Answer/Refuses (DO NOT READ OUT) Outro1.
Only read IF NECESSARY: Thank you for taking the time to participate in this study. You can access the privacy notice here: https://survey.ipsos.be/privacynoticeQoLCities.pdf. This explains the purposes for

Quality of Life in European Cities Survey 2019
Directorate-General for Regional and Urban Policy 2020 69
processing your personal data as well as your rights under data protection regulations to access your personal data, withdraw consent, object to processing of your personal data and other required information.


Annex 2. List of LAUs per city
Country City Name LAU CODE LAU LABEL
AL Tirana AL0310 Durrës
AL Tirana AL1150 Tiranë
AL Tirana AL1151 Kamëz
AT Wien 90001 Wien
AT Graz 60101 Graz
BE Bruxelles / Brussel 21001 Anderlecht
BE Bruxelles / Brussel 21002 Auderghem / Oudergem
BE Bruxelles / Brussel 21003 Berchem-Sainte-Agathe / Sint-Agatha-Berchem
BE Bruxelles / Brussel 21004 Bruxelles / Brussel
BE Bruxelles / Brussel 21005 Etterbeek
BE Bruxelles / Brussel 21006 Evere
BE Bruxelles / Brussel 21007 Forest / Vorst
BE Bruxelles / Brussel 21008 Ganshoren
BE Bruxelles / Brussel 21009 Ixelles / Elsene
BE Bruxelles / Brussel 21010 Jette
BE Bruxelles / Brussel 21011 Koekelberg
BE Bruxelles / Brussel 21012 Molenbeek-Saint-Jean / Sint-Jans-Molenbeek
BE Bruxelles / Brussel 21013 Saint-Gilles / Sint-Gillis
BE Bruxelles / Brussel 21014 Saint-Josse-ten-Noode / Sint-Joost-ten-Node
BE Bruxelles / Brussel 21015 Schaerbeek / Schaarbeek
BE Bruxelles / Brussel 21016 Uccle / Ukkel
BE Bruxelles / Brussel 21017 Watermael-Boitsfort / Watermaal-Bosvoorde
BE Bruxelles / Brussel 21018 Woluwe-Saint-Lambert / Sint-Lambrechts-Woluwe
BE Bruxelles / Brussel 21019 Woluwe-Saint-Pierre / Sint-Pieters-Woluwe
BE Antwerpen 11002 Antwerpen / Anvers
BE Liège 62003 Ans
BE Liège 62015 Beyne-Heusay
BE Liège 62038 Fléron
BE Liège 62051 Herstal
BE Liège 62063 Liège / Luik
BE Liège 62093 Saint-Nicolas
BE Liège 62096 Seraing
BG Sofia 68134 София
BG Burgas 07079 Бургас
CH Zürich CH0054 Dietlikon
CH Zürich CH0062 Kloten
CH Zürich CH0066 Opfikon
CH Zürich CH0069 Wallisellen
CH Zürich CH0097 Rümlang
CH Zürich CH0131 Adliswil
CH Zürich CH0135 Kilchberg (ZH)
CH Zürich CH0136 Langnau am Albis

Quality of Life in European Cities Survey 2019
Directorate-General for Regional and Urban Policy 2020 72
CH Zürich CH0139 Rüschlikon
CH Zürich CH0141 Thalwil
CH Zürich CH0161 Zollikon
CH Zürich CH0191 Dübendorf
CH Zürich CH0200 Wangen-Brüttisellen
CH Zürich CH0243 Dietikon
CH Zürich CH0245 Oberengstringen
CH Zürich CH0247 Schlieren
CH Zürich CH0249 Unterengstringen
CH Zürich CH0250 Urdorf
CH Zürich CH0261 Zürich
CH Genève CH6608 Carouge (GE)
CH Genève CH6612 Chêne-Bougeries
CH Genève CH6613 Chêne-Bourg
CH Genève CH6617 Cologny
CH Genève CH6621 Genève
CH Genève CH6628 Lancy
CH Genève CH6631 Onex
CH Genève CH6633 Plan-les-Ouates
CH Genève CH6634 Pregny-Chambésy
CH Genève CH6640 Thônex
CH Genève CH6641 Troinex
CH Genève CH6643 Vernier
CH Genève CH6645 Veyrier
CY Lefkosia 1000 Λευκωσία
CY Lefkosia 1010 Άγιος Δομέτιος
CY Lefkosia 1011 Έγκωμη Λευκωσίας
CY Lefkosia 1012 Στρόβολος
CY Lefkosia 1013 Αγλαντζιά ή Αγλαγγιά
CY Lefkosia 1021 Λακατάμεια
CY Lefkosia 1022 Συνοικισμός Ανθούπολης
CY Lefkosia 1023 Λατσιά ή Λακκιά
CY Lefkosia 1024 Γέρι
CZ Praha 554782 Praha
CZ Ostrava 554821 Ostrava
DE Berlin 11000000 Berlin, Stadt
DE Hamburg 02000000 Hamburg, Freie und Hansestadt
DE München 09162000 München, Landeshauptstadt
DE Essen 05113000 Essen, Stadt
DE Leipzig 14713000 Leipzig, Stadt
DE Dortmund 05913000 Dortmund, Stadt
DE Rostock 13003000 Rostock, Hansestadt
DK København 101 København
DK København 147 Frederiksberg

Quality of Life in European Cities Survey 2019
Directorate-General for Regional and Urban Policy 2020 73
DK København 153 Brøndby
DK København 157 Gentofte
DK København 159 Gladsaxe
DK København 161 Glostrup
DK København 163 Herlev
DK København 165 Albertslund
DK København 167 Hvidovre
DK København 173 Lyngby-Taarbæk
DK København 175 Rødovre
DK København 183 Ishøj
DK København 185 Tårnby
DK København 187 Vallensbæk
DK København 253 Greve
DK Aalborg 851 Aalborg
EE Tallinn 0784 Tallinn
EL Athina 45010000 Ψευδοδημοτικη Κοινοτητα Αθηναίων
EL Athina 45020000 Ψευδοδημοτικη Κοινοτητα Βύρωνος
EL Athina 45030000 Ψευδοδημοτικη Κοινοτητα Γαλατσίου
EL Athina 45040101 Δημοτική Κοινότητα Δάφνης
EL Athina 45040201 Δημοτική Κοινότητα Υμηττού
EL Athina 45050000 Ψευδοδημοτικη Κοινοτητα Ζωγράφου
EL Athina 45060000 Ψευδοδημοτικη Κοινοτητα Ηλιουπόλεως
EL Athina 45070000 Ψευδοδημοτικη Κοινοτητα Καισαριανής
EL Athina 45080101 Δημοτική Κοινότητα Νέας Φιλαδελφείας
EL Athina 45080201 Δημοτική Κοινότητα Νέας Χαλκηδόνος
EL Athina 46010000 Ψευδοδημοτικη Κοινοτητα Αμαρουσίου
EL Athina 46020000 Ψευδοδημοτικη Κοινοτητα Αγίας Παρασκευής
EL Athina 46030000 Ψευδοδημοτικη Κοινοτητα Βριλησσίων
EL Athina 46040000 Ψευδοδημοτικη Κοινοτητα Ηρακλείου
EL Athina 46050101 Δημοτική Κοινότητα Κηφισιάς
EL Athina 46050201 Δημοτική Κοινότητα Εκάλης
EL Athina 46050301 Δημοτική Κοινότητα Νέας Ερυθραίας
EL Athina 46060101 Δημοτική Κοινότητα Πεύκης
EL Athina 46060201 Δημοτική Κοινότητα Λυκοβρύσεως
EL Athina 46070000 Ψευδοδημοτικη Κοινοτητα Μεταμορφώσεως
EL Athina 46080000 Ψευδοδημοτικη Κοινοτητα Νέας Ιωνίας
EL Athina 46090101 Δημοτική Κοινότητα Χολαργού
EL Athina 46090201 Δημοτική Κοινότητα Παπάγου
EL Athina 46100101 Δημοτική Κοινότητα Μελισσίων
EL Athina 46100201 Δημοτική Κοινότητα Νέας Πεντέλης
EL Athina 46100301 Δημοτική Κοινότητα Πεντέλης
EL Athina 46110101 Δημοτική Κοινότητα Ψυχικού
EL Athina 46110201 Δημοτική Κοινότητα Νέου Ψυχικού
EL Athina 46110301 Δημοτική Κοινότητα Φιλοθέης
EL Athina 46120000 Ψευδοδημοτικη Κοινοτητα Χαλανδρίου

Quality of Life in European Cities Survey 2019
Directorate-General for Regional and Urban Policy 2020 74
EL Athina 47010000 Ψευδοδημοτικη Κοινοτητα Περιστερίου
EL Athina 47020000 Ψευδοδημοτικη Κοινοτητα Αγίας Βαρβάρας
EL Athina 47030101 Δημοτική Κοινότητα Αγίων Αναργύρων
EL Athina 47030201 Δημοτική Κοινότητα Καματερού
EL Athina 47040000 Ψευδοδημοτικη Κοινοτητα Αιγάλεω
EL Athina 47050000 Ψευδοδημοτικη Κοινοτητα Ιλιου
EL Athina 47060000 Ψευδοδημοτικη Κοινοτητα Πετρουπόλεως
EL Athina 47070000 Ψευδοδημοτικη Κοινοτητα Χαϊδαρίου
EL Athina 48010000 Ψευδοδημοτικη Κοινοτητα Καλλιθέας
EL Athina 48020000 Ψευδοδημοτικη Κοινοτητα Αγίου Δημητρίου
EL Athina 48030000 Ψευδοδημοτικη Κοινοτητα Αλίμου
EL Athina 48040000 Ψευδοδημοτικη Κοινοτητα Γλυφάδας
EL Athina 48050101 Δημοτική Κοινότητα Αργυρούπολης
EL Athina 48050201 Δημοτική Κοινότητα Ελληνικού
EL Athina 48060101 Δημοτική Κοινότητα Μοσχάτου
EL Athina 48060201 Δημοτική Κοινότητα Ταύρου
EL Athina 48070000 Ψευδοδημοτικη Κοινοτητα Νέας Σμύρνης
EL Athina 48080000 Ψευδοδημοτικη Κοινοτητα Παλαιού Φαλήρου
EL Athina 49010101 Δημοτική Κοινότητα Αχαρνών
EL Athina 49010201 Δημοτική Κοινότητα Θρακομακεδόνων
EL Athina 49020101 Δημοτική Κοινότητα Βούλας
EL Athina 49020201 Δημοτική Κοινότητα Βάρης
EL Athina 49020301 Δημοτική Κοινότητα Βουλιαγμένης
EL Athina 49080201 Δημοτική Κοινότητα Γλυκών Νερών
EL Athina 49090101 Δημοτική Κοινότητα Γέρακα
EL Athina 49090201 Δημοτική Κοινότητα Ανθούσας
EL Athina 49090301 Δημοτική Κοινότητα Παλλήνης
EL Athina 50050101 Δημοτική Κοινότητα Άνω Λιοσίων
EL Athina 50050201 Δημοτική Κοινότητα Ζεφυρίου
EL Athina 51010000 Ψευδοδημοτικη Κοινοτητα Πειραιώς
EL Athina 51020101 Δημοτική Κοινότητα Κερατσινίου
EL Athina 51020201 Δημοτική Κοινότητα Δραπετσώνας
EL Athina 51030000 Ψευδοδημοτικη Κοινοτητα Κορυδαλλού
EL Athina 51040101 Δημοτική Κοινότητα Νικαίας
EL Athina 51040201 Δημοτική Κοινότητα Αγίου Ιωάννου Ρέντη
EL Irakleio 71010100 Ψευδοδημοτικη Κοινοτητα Ηρακλείου
ES Madrid 28006 Alcobendas
ES Madrid 28007 Alcorcón
ES Madrid 28049 Coslada
ES Madrid 28058 Fuenlabrada
ES Madrid 28065 Getafe
ES Madrid 28074 Leganés
ES Madrid 28079 Madrid
ES Madrid 28080 Majadahonda

Quality of Life in European Cities Survey 2019
Directorate-General for Regional and Urban Policy 2020 75
ES Madrid 28092 Móstoles
ES Madrid 28106 Parla
ES Madrid 28115 Pozuelo de Alarcón
ES Madrid 28123 Rivas-Vaciamadrid
ES Madrid 28127 Rozas de Madrid, Las
ES Madrid 28130 San Fernando de Henares
ES Madrid 28134 San Sebastián de los Reyes
ES Barcelona 08003 Alella
ES Barcelona 08015 Badalona
ES Barcelona 08019 Barcelona
ES Barcelona 08056 Castelldefels
ES Barcelona 08073 Cornellà de Llobregat
ES Barcelona 08077 Esplugues de Llobregat
ES Barcelona 08089 Gavà
ES Barcelona 08101 Hospitalet de Llobregat, L'
ES Barcelona 08118 Masnou, El
ES Barcelona 08125 Montcada i Reixac
ES Barcelona 08126 Montgat
ES Barcelona 08169 Prat de Llobregat, El
ES Barcelona 08180 Ripollet
ES Barcelona 08184 Rubí
ES Barcelona 08187 Sabadell
ES Barcelona 08194 Sant Adrià de Besòs
ES Barcelona 08200 Sant Boi de Llobregat
ES Barcelona 08205 Sant Cugat del Vallès
ES Barcelona 08211 Sant Feliu de Llobregat
ES Barcelona 08217 Sant Joan Despí
ES Barcelona 08221 Sant Just Desvern
ES Barcelona 08238 Sant Quirze del Vallès
ES Barcelona 08245 Santa Coloma de Gramenet
ES Barcelona 08252 Barberà del Vallès
ES Barcelona 08266 Cerdanyola del Vallès
ES Barcelona 08279 Terrassa
ES Barcelona 08281 Teià
ES Barcelona 08282 Tiana
ES Barcelona 08301 Viladecans
ES Barcelona 08904 Badia del Vallès
ES Málaga 29067 Málaga
ES Oviedo 33044 Oviedo
FI Helsinki / Helsingfors 049 Espoo / Esbo
FI Helsinki / Helsingfors 091 Helsinki / Helsingfors
FI Helsinki / Helsingfors 092 Vantaa / Vanda
FI Helsinki / Helsingfors 235 Kauniainen / Grankulla
FI Oulu / Uleåborg 564 Oulu / Uleåborg
FR Paris 75101 Paris 1er Arrondissement

Quality of Life in European Cities Survey 2019
Directorate-General for Regional and Urban Policy 2020 76
FR Paris 75102 Paris 2e Arrondissement
FR Paris 75103 Paris 3e Arrondissement
FR Paris 75104 Paris 4e Arrondissement
FR Paris 75105 Paris 5e Arrondissement
FR Paris 75106 Paris 6e Arrondissement
FR Paris 75107 Paris 7e Arrondissement
FR Paris 75108 Paris 8e Arrondissement
FR Paris 75109 Paris 9e Arrondissement
FR Paris 75110 Paris 10e Arrondissement
FR Paris 75111 Paris 11e Arrondissement
FR Paris 75112 Paris 12e Arrondissement
FR Paris 75113 Paris 13e Arrondissement
FR Paris 75114 Paris 14e Arrondissement
FR Paris 75115 Paris 15e Arrondissement
FR Paris 75116 Paris 16e Arrondissement
FR Paris 75117 Paris 17e Arrondissement
FR Paris 75118 Paris 18e Arrondissement
FR Paris 75119 Paris 19e Arrondissement
FR Paris 75120 Paris 20e Arrondissement
FR Paris 77055 Brou-sur-Chantereine
FR Paris 77083 Champs-sur-Marne
FR Paris 77108 Chelles
FR Paris 77121 Collégien
FR Paris 77139 Courtry
FR Paris 77169 Émerainville
FR Paris 77258 Lognes
FR Paris 77294 Mitry-Mory
FR Paris 77337 Noisiel
FR Paris 77373 Pontault-Combault
FR Paris 77390 Roissy-en-Brie
FR Paris 77468 Torcy
FR Paris 77479 Vaires-sur-Marne
FR Paris 77514 Villeparisis
FR Paris 78005 Achères
FR Paris 78007 Aigremont
FR Paris 78015 Andrésy
FR Paris 78092 Bougival
FR Paris 78123 Carrières-sous-Poissy
FR Paris 78124 Carrières-sur-Seine
FR Paris 78126 Celle-Saint-Cloud
FR Paris 78133 Chambourcy
FR Paris 78138 Chanteloup-les-Vignes
FR Paris 78146 Chatou
FR Paris 78158 Chesnay

Quality of Life in European Cities Survey 2019
Directorate-General for Regional and Urban Policy 2020 77
FR Paris 78165 Clayes-sous-Bois
FR Paris 78168 Coignières
FR Paris 78172 Conflans-Sainte-Honorine
FR Paris 78190 Croissy-sur-Seine
FR Paris 78208 Élancourt
FR Paris 78251 Fourqueux
FR Paris 78297 Guyancourt
FR Paris 78311 Houilles
FR Paris 78350 Louveciennes
FR Paris 78358 Maisons-Laffitte
FR Paris 78367 Mareil-Marly
FR Paris 78372 Marly-le-Roi
FR Paris 78382 Maurecourt
FR Paris 78383 Maurepas
FR Paris 78396 Mesnil-le-Roi
FR Paris 78418 Montesson
FR Paris 78423 Montigny-le-Bretonneux
FR Paris 78481 Pecq
FR Paris 78490 Plaisir
FR Paris 78498 Poissy
FR Paris 78502 Port-Marly
FR Paris 78524 Rocquencourt
FR Paris 78551 Saint-Germain-en-Laye
FR Paris 78586 Sartrouville
FR Paris 78621 Trappes
FR Paris 78624 Triel-sur-Seine
FR Paris 78642 Verneuil-sur-Seine
FR Paris 78643 Vernouillet
FR Paris 78644 Verrière
FR Paris 78646 Versailles
FR Paris 78650 Vésinet
FR Paris 78674 Villepreux
FR Paris 78686 Viroflay
FR Paris 78688 Voisins-le-Bretonneux
FR Paris 91021 Arpajon
FR Paris 91027 Athis-Mons
FR Paris 91044 Ballainvilliers
FR Paris 91097 Boussy-Saint-Antoine
FR Paris 91103 Brétigny-sur-Orge
FR Paris 91114 Brunoy
FR Paris 91122 Bures-sur-Yvette
FR Paris 91136 Champlan
FR Paris 91161 Chilly-Mazarin
FR Paris 91174 Corbeil-Essonnes
FR Paris 91182 Courcouronnes

Quality of Life in European Cities Survey 2019
Directorate-General for Regional and Urban Policy 2020 78
FR Paris 91191 Crosne
FR Paris 91201 Draveil
FR Paris 91215 Épinay-sous-Sénart
FR Paris 91216 Épinay-sur-Orge
FR Paris 91225 Étiolles
FR Paris 91228 Évry
FR Paris 91235 Fleury-Mérogis
FR Paris 91272 Gif-sur-Yvette
FR Paris 91286 Grigny
FR Paris 91312 Igny
FR Paris 91326 Juvisy-sur-Orge
FR Paris 91345 Longjumeau
FR Paris 91347 Longpont-sur-Orge
FR Paris 91363 Marcoussis
FR Paris 91377 Massy
FR Paris 91421 Montgeron
FR Paris 91425 Montlhéry
FR Paris 91432 Morangis
FR Paris 91434 Morsang-sur-Orge
FR Paris 91457 Norville
FR Paris 91458 Nozay
FR Paris 91471 Orsay
FR Paris 91477 Palaiseau
FR Paris 91479 Paray-Vieille-Poste
FR Paris 91494 Plessis-Pâté
FR Paris 91521 Ris-Orangis
FR Paris 91549 Sainte-Geneviève-des-Bois
FR Paris 91552 Saint-Germain-lès-Arpajon
FR Paris 91553 Saint-Germain-lès-Corbeil
FR Paris 91570 Saint-Michel-sur-Orge
FR Paris 91573 Saint-Pierre-du-Perray
FR Paris 91577 Saintry-sur-Seine
FR Paris 91587 Saulx-les-Chartreux
FR Paris 91589 Savigny-sur-Orge
FR Paris 91600 Soisy-sur-Seine
FR Paris 91645 Verrières-le-Buisson
FR Paris 91657 Vigneux-sur-Seine
FR Paris 91659 Villabé
FR Paris 91661 Villebon-sur-Yvette
FR Paris 91665 Ville-du-Bois
FR Paris 91666 Villejust
FR Paris 91667 Villemoisson-sur-Orge
FR Paris 91685 Villiers-sur-Orge
FR Paris 91687 Viry-Châtillon

Quality of Life in European Cities Survey 2019
Directorate-General for Regional and Urban Policy 2020 79
FR Paris 91689 Wissous
FR Paris 91691 Yerres
FR Paris 91692 Ulis
FR Paris 92002 Antony
FR Paris 92004 Asnières-sur-Seine
FR Paris 92007 Bagneux
FR Paris 92009 Bois-Colombes
FR Paris 92012 Boulogne-Billancourt
FR Paris 92014 Bourg-la-Reine
FR Paris 92019 Châtenay-Malabry
FR Paris 92020 Châtillon
FR Paris 92022 Chaville
FR Paris 92023 Clamart
FR Paris 92024 Clichy
FR Paris 92025 Colombes
FR Paris 92026 Courbevoie
FR Paris 92032 Fontenay-aux-Roses
FR Paris 92033 Garches
FR Paris 92035 Garenne-Colombes
FR Paris 92036 Gennevilliers
FR Paris 92040 Issy-les-Moulineaux
FR Paris 92044 Levallois-Perret
FR Paris 92046 Malakoff
FR Paris 92047 Marnes-la-Coquette
FR Paris 92048 Meudon
FR Paris 92049 Montrouge
FR Paris 92050 Nanterre
FR Paris 92051 Neuilly-sur-Seine
FR Paris 92060 Plessis-Robinson
FR Paris 92062 Puteaux
FR Paris 92063 Rueil-Malmaison
FR Paris 92064 Saint-Cloud
FR Paris 92071 Sceaux
FR Paris 92072 Sèvres
FR Paris 92073 Suresnes
FR Paris 92075 Vanves
FR Paris 92076 Vaucresson
FR Paris 92077 Ville-d'Avray
FR Paris 92078 Villeneuve-la-Garenne
FR Paris 93001 Aubervilliers
FR Paris 93005 Aulnay-sous-Bois
FR Paris 93006 Bagnolet
FR Paris 93007 Blanc-Mesnil
FR Paris 93008 Bobigny
FR Paris 93010 Bondy

Quality of Life in European Cities Survey 2019
Directorate-General for Regional and Urban Policy 2020 80
FR Paris 93013 Bourget
FR Paris 93014 Clichy-sous-Bois
FR Paris 93015 Coubron
FR Paris 93027 Courneuve
FR Paris 93029 Drancy
FR Paris 93030 Dugny
FR Paris 93031 Épinay-sur-Seine
FR Paris 93032 Gagny
FR Paris 93033 Gournay-sur-Marne
FR Paris 93039 Île-Saint-Denis
FR Paris 93045 Lilas
FR Paris 93046 Livry-Gargan
FR Paris 93047 Montfermeil
FR Paris 93048 Montreuil
FR Paris 93049 Neuilly-Plaisance
FR Paris 93050 Neuilly-sur-Marne
FR Paris 93051 Noisy-le-Grand
FR Paris 93053 Noisy-le-Sec
FR Paris 93055 Pantin
FR Paris 93057 Pavillons-sous-Bois
FR Paris 93059 Pierrefitte-sur-Seine
FR Paris 93061 Pré-Saint-Gervais
FR Paris 93062 Raincy
FR Paris 93063 Romainville
FR Paris 93064 Rosny-sous-Bois
FR Paris 93066 Saint-Denis
FR Paris 93070 Saint-Ouen
FR Paris 93071 Sevran
FR Paris 93072 Stains
FR Paris 93073 Tremblay-en-France
FR Paris 93074 Vaujours
FR Paris 93077 Villemomble
FR Paris 93078 Villepinte
FR Paris 93079 Villetaneuse
FR Paris 94001 Ablon-sur-Seine
FR Paris 94002 Alfortville
FR Paris 94003 Arcueil
FR Paris 94004 Boissy-Saint-Léger
FR Paris 94011 Bonneuil-sur-Marne
FR Paris 94015 Bry-sur-Marne
FR Paris 94016 Cachan
FR Paris 94017 Champigny-sur-Marne
FR Paris 94018 Charenton-le-Pont
FR Paris 94019 Chennevières-sur-Marne

Quality of Life in European Cities Survey 2019
Directorate-General for Regional and Urban Policy 2020 81
FR Paris 94021 Chevilly-Larue
FR Paris 94022 Choisy-le-Roi
FR Paris 94028 Créteil
FR Paris 94033 Fontenay-sous-Bois
FR Paris 94034 Fresnes
FR Paris 94037 Gentilly
FR Paris 94038 Haÿ-les-Roses
FR Paris 94041 Ivry-sur-Seine
FR Paris 94042 Joinville-le-Pont
FR Paris 94043 Kremlin-Bicêtre
FR Paris 94044 Limeil-Brévannes
FR Paris 94046 Maisons-Alfort
FR Paris 94047 Mandres-les-Roses
FR Paris 94052 Nogent-sur-Marne
FR Paris 94053 Noiseau
FR Paris 94054 Orly
FR Paris 94055 Ormesson-sur-Marne
FR Paris 94056 Périgny
FR Paris 94058 Perreux-sur-Marne
FR Paris 94059 Plessis-Trévise
FR Paris 94060 Queue-en-Brie
FR Paris 94065 Rungis
FR Paris 94067 Saint-Mandé
FR Paris 94068 Saint-Maur-des-Fossés
FR Paris 94069 Saint-Maurice
FR Paris 94071 Sucy-en-Brie
FR Paris 94073 Thiais
FR Paris 94074 Valenton
FR Paris 94075 Villecresnes
FR Paris 94076 Villejuif
FR Paris 94077 Villeneuve-le-Roi
FR Paris 94078 Villeneuve-Saint-Georges
FR Paris 94079 Villiers-sur-Marne
FR Paris 94080 Vincennes
FR Paris 94081 Vitry-sur-Seine
FR Paris 95014 Andilly
FR Paris 95018 Argenteuil
FR Paris 95019 Arnouville
FR Paris 95051 Beauchamp
FR Paris 95060 Bessancourt
FR Paris 95063 Bezons
FR Paris 95088 Bonneuil-en-France
FR Paris 95127 Cergy
FR Paris 95176 Cormeilles-en-Parisis
FR Paris 95183 Courdimanche

Quality of Life in European Cities Survey 2019
Directorate-General for Regional and Urban Policy 2020 82
FR Paris 95197 Deuil-la-Barre
FR Paris 95203 Eaubonne
FR Paris 95205 Écouen
FR Paris 95210 Enghien-les-Bains
FR Paris 95218 Éragny
FR Paris 95219 Ermont
FR Paris 95252 Franconville
FR Paris 95256 Frépillon
FR Paris 95257 Frette-sur-Seine
FR Paris 95268 Garges-lès-Gonesse
FR Paris 95277 Gonesse
FR Paris 95288 Groslay
FR Paris 95306 Herblay
FR Paris 95323 Jouy-le-Moutier
FR Paris 95369 Margency
FR Paris 95424 Montigny-lès-Cormeilles
FR Paris 95426 Montlignon
FR Paris 95427 Montmagny
FR Paris 95428 Montmorency
FR Paris 95450 Neuville-sur-Oise
FR Paris 95476 Osny
FR Paris 95491 Plessis-Bouchard
FR Paris 95500 Pontoise
FR Paris 95539 Saint-Brice-sous-Forêt
FR Paris 95555 Saint-Gratien
FR Paris 95563 Saint-Leu-la-Forêt
FR Paris 95572 Saint-Ouen-l'Aumône
FR Paris 95574 Saint-Prix
FR Paris 95582 Sannois
FR Paris 95585 Sarcelles
FR Paris 95598 Soisy-sous-Montmorency
FR Paris 95607 Taverny
FR Paris 95637 Vauréal
FR Paris 95680 Villiers-le-Bel
FR Strasbourg 67043 Bischheim
FR Strasbourg 67118 Eckbolsheim
FR Strasbourg 67204 Hœnheim
FR Strasbourg 67218 Illkirch-Graffenstaden
FR Strasbourg 67267 Lingolsheim
FR Strasbourg 67365 Ostwald
FR Strasbourg 67447 Schiltigheim
FR Strasbourg 67482 Strasbourg
FR Bordeaux 33039 Bègles
FR Bordeaux 33063 Bordeaux

Quality of Life in European Cities Survey 2019
Directorate-General for Regional and Urban Policy 2020 83
FR Bordeaux 33069 Bouscat
FR Bordeaux 33075 Bruges
FR Bordeaux 33119 Cenon
FR Bordeaux 33162 Eysines
FR Bordeaux 33167 Floirac
FR Bordeaux 33192 Gradignan
FR Bordeaux 33249 Lormont
FR Bordeaux 33281 Mérignac
FR Bordeaux 33318 Pessac
FR Bordeaux 33522 Talence
FR Bordeaux 33550 Villenave-d'Ornon
FR Lille 59009 Villeneuve-d'Ascq
FR Lille 59163 Croix
FR Lille 59193 Emmerin
FR Lille 59220 Faches-Thumesnil
FR Lille 59247 Forest-sur-Marque
FR Lille 59278 Hallennes-lez-Haubourdin
FR Lille 59286 Haubourdin
FR Lille 59299 Hem
FR Lille 59328 Lambersart
FR Lille 59332 Lannoy
FR Lille 59343 Lesquin
FR Lille 59346 Lezennes
FR Lille 59350 Lille
FR Lille 59360 Loos
FR Lille 59367 Lys-lez-Lannoy
FR Lille 59368 Madeleine
FR Lille 59378 Marcq-en-Barœul
FR Lille 59386 Marquette-lez-Lille
FR Lille 59410 Mons-en-Barœul
FR Lille 59421 Mouvaux
FR Lille 59426 Neuville-en-Ferrain
FR Lille 59507 Ronchin
FR Lille 59508 Roncq
FR Lille 59512 Roubaix
FR Lille 59527 Saint-André-lez-Lille
FR Lille 59566 Sequedin
FR Lille 59585 Templemars
FR Lille 59598 Toufflers
FR Lille 59599 Tourcoing
FR Lille 59636 Wambrechies
FR Lille 59646 Wasquehal
FR Lille 59648 Wattignies
FR Lille 59650 Wattrelos
FR Rennes 35238 Rennes

Quality of Life in European Cities Survey 2019
Directorate-General for Regional and Urban Policy 2020 84
FR Marseille 13002 Allauch
FR Marseille 13055 Marseille
FR Marseille 13075 Plan-de-Cuques
HR Zagreb 01333 Grad Zagreb
HU Budapest 02112 Budapest 17. ker.
HU Budapest 03179 Budapest 02. ker.
HU Budapest 04011 Budapest 19. ker.
HU Budapest 05467 Budapest 04. ker.
HU Budapest 06026 Budapest 20. ker.
HU Budapest 08208 Budapest 16. ker.
HU Budapest 09566 Budapest 01. ker.
HU Budapest 10214 Budapest 22. ker.
HU Budapest 10700 Budapest 10. ker.
HU Budapest 11314 Budapest 15. ker.
HU Budapest 13189 Budapest 21. ker.
HU Budapest 13392 Budapest 05. ker.
HU Budapest 14216 Budapest 11. ker.
HU Budapest 16337 Budapest 14. ker.
HU Budapest 16586 Budapest 06. ker.
HU Budapest 18069 Budapest 03. ker.
HU Budapest 24299 Budapest 13. ker.
HU Budapest 24697 Budapest 12. ker.
HU Budapest 25405 Budapest 08. ker.
HU Budapest 29285 Budapest 18. ker.
HU Budapest 29586 Budapest 09. ker.
HU Budapest 29744 Budapest 07. ker.
HU Budapest 34139 Budapest 23. ker.
HU Miskolc 30456 Miskolc
IE Dublin 02001 Arran Quay A
IE Dublin 02002 Arran Quay B
IE Dublin 02003 Arran Quay C
IE Dublin 02004 Arran Quay D
IE Dublin 02005 Arran Quay E
IE Dublin 02006 Ashtown A
IE Dublin 02007 Ashtown B
IE Dublin 02008 Ayrfield
IE Dublin 02009 Ballybough A
IE Dublin 02010 Ballybough B
IE Dublin 02011 Ballygall A
IE Dublin 02012 Ballygall B
IE Dublin 02013 Ballygall C
IE Dublin 02014 Ballygall D
IE Dublin 02015 Ballymun A
IE Dublin 02016 Ballymun B

Quality of Life in European Cities Survey 2019
Directorate-General for Regional and Urban Policy 2020 85
IE Dublin 02017 Ballymun C
IE Dublin 02018 Ballymun D
IE Dublin 02019 Ballymun E
IE Dublin 02020 Ballymun F
IE Dublin 02021 Beaumont A
IE Dublin 02022 Beaumont B
IE Dublin 02023 Beaumont C
IE Dublin 02024 Beaumont D
IE Dublin 02025 Beaumont E
IE Dublin 02026 Beaumont F
IE Dublin 02027 Botanic A
IE Dublin 02028 Botanic B
IE Dublin 02029 Botanic C
IE Dublin 02030 Cabra East A
IE Dublin 02031 Cabra East B
IE Dublin 02032 Cabra East C
IE Dublin 02033 Cabra West A
IE Dublin 02034 Cabra West B
IE Dublin 02035 Cabra West C
IE Dublin 02036 Cabra West D
IE Dublin 02037 Clontarf East A
IE Dublin 02038 Clontarf East B
IE Dublin 02039 Clontarf East C
IE Dublin 02040 Clontarf East D
IE Dublin 02041 Clontarf East E
IE Dublin 02042 Clontarf West A
IE Dublin 02043 Clontarf West B
IE Dublin 02044 Clontarf West C
IE Dublin 02045 Clontarf West D
IE Dublin 02046 Clontarf West E
IE Dublin 02047 Drumcondra South A
IE Dublin 02048 Drumcondra South B
IE Dublin 02049 Drumcondra South C
IE Dublin 02050 Edenmore
IE Dublin 02051 Finglas North A
IE Dublin 02052 Finglas North B
IE Dublin 02053 Finglas North C
IE Dublin 02054 Finglas South A
IE Dublin 02055 Finglas South B
IE Dublin 02056 Finglas South C
IE Dublin 02057 Finglas South D
IE Dublin 02058 Grace Park
IE Dublin 02059 Grange A
IE Dublin 02060 Grange B
IE Dublin 02061 Grange C

Quality of Life in European Cities Survey 2019
Directorate-General for Regional and Urban Policy 2020 86
IE Dublin 02062 Grange D
IE Dublin 02063 Grange E
IE Dublin 02064 Harmonstown A
IE Dublin 02065 Harmonstown B
IE Dublin 02066 Inns Quay A
IE Dublin 02067 Inns Quay B
IE Dublin 02068 Inns Quay C
IE Dublin 02069 Kilmore A
IE Dublin 02070 Kilmore B
IE Dublin 02071 Kilmore C
IE Dublin 02072 Kilmore D
IE Dublin 02073 Mountjoy A
IE Dublin 02074 Mountjoy B
IE Dublin 02075 North City
IE Dublin 02076 North Dock A
IE Dublin 02077 North Dock B
IE Dublin 02078 North Dock C
IE Dublin 02079 Phoenix Park
IE Dublin 02080 Priorswood A
IE Dublin 02081 Priorswood B
IE Dublin 02082 Priorswood C
IE Dublin 02083 Priorswood D
IE Dublin 02084 Priorswood E
IE Dublin 02085 Raheny-Foxfield
IE Dublin 02086 Raheny-Greendale
IE Dublin 02087 Raheny-St. Assam
IE Dublin 02088 Rotunda A
IE Dublin 02089 Rotunda B
IE Dublin 02090 Whitehall A
IE Dublin 02091 Whitehall B
IE Dublin 02092 Whitehall C
IE Dublin 02093 Whitehall D
IE Dublin 02094 Chapelizod
IE Dublin 02095 Cherry Orchard A
IE Dublin 02096 Carna
IE Dublin 02097 Cherry Orchard C
IE Dublin 02098 Crumlin A
IE Dublin 02099 Crumlin B
IE Dublin 02100 Crumlin C
IE Dublin 02101 Crumlin D
IE Dublin 02102 Crumlin E
IE Dublin 02103 Crumlin F
IE Dublin 02104 Decies
IE Dublin 02105 Drumfinn

Quality of Life in European Cities Survey 2019
Directorate-General for Regional and Urban Policy 2020 87
IE Dublin 02106 Inchicore A
IE Dublin 02107 Inchicore B
IE Dublin 02108 Kilmainham A
IE Dublin 02109 Kilmainham B
IE Dublin 02110 Kilmainham C
IE Dublin 02111 Kimmage A
IE Dublin 02112 Kimmage B
IE Dublin 02113 Kimmage C
IE Dublin 02114 Kimmage D
IE Dublin 02115 Kimmage E
IE Dublin 02116 Kylemore
IE Dublin 02117 Mansion House A
IE Dublin 02118 Mansion House B
IE Dublin 02119 Merchants Quay A
IE Dublin 02120 Merchants Quay B
IE Dublin 02121 Merchants Quay C
IE Dublin 02122 Merchants Quay D
IE Dublin 02123 Merchants Quay E
IE Dublin 02124 Merchants Quay F
IE Dublin 02125 Pembroke East A
IE Dublin 02126 Pembroke East B
IE Dublin 02127 Pembroke East C
IE Dublin 02128 Pembroke East D
IE Dublin 02129 Pembroke East E
IE Dublin 02130 Pembroke West A
IE Dublin 02131 Pembroke West B
IE Dublin 02132 Pembroke West C
IE Dublin 02133 Rathfarnham
IE Dublin 02134 Rathmines East A
IE Dublin 02135 Rathmines East B
IE Dublin 02136 Rathmines East C
IE Dublin 02137 Rathmines East D
IE Dublin 02138 Rathmines West A
IE Dublin 02139 Rathmines West B
IE Dublin 02140 Rathmines West C
IE Dublin 02141 Rathmines West D
IE Dublin 02142 Rathmines West E
IE Dublin 02143 Rathmines West F
IE Dublin 02144 Royal Exchange A
IE Dublin 02145 Royal Exchange B
IE Dublin 02146 Saint Kevin's
IE Dublin 02147 South Dock
IE Dublin 02148 Terenure A
IE Dublin 02149 Terenure B
IE Dublin 02150 Terenure C

Quality of Life in European Cities Survey 2019
Directorate-General for Regional and Urban Policy 2020 88
IE Dublin 02151 Terenure D
IE Dublin 02152 Ushers A
IE Dublin 02153 Ushers B
IE Dublin 02154 Ushers C
IE Dublin 02155 Ushers D
IE Dublin 02156 Ushers E
IE Dublin 02157 Ushers F
IE Dublin 02158 Walkinstown A
IE Dublin 02159 Walkinstown B
IE Dublin 02160 Walkinstown C
IE Dublin 02161 Wood Quay A
IE Dublin 02162 Wood Quay B
IE Dublin 03001 Ballinascorney
IE Dublin 03002 Ballyboden
IE Dublin 03003 Bohernabreena
IE Dublin 03004 Clondalkin-Ballymount
IE Dublin 03005 Clondalkin-Cappaghmore
IE Dublin 03006 Clondalkin-Dunawley
IE Dublin 03007 Clondalkin-Monastery
IE Dublin 03008 Clondalkin-Moorfield
IE Dublin 03009 Clondalkin-Rowlagh
IE Dublin 03010 Clondalkin Village
IE Dublin 03011 Edmondstown
IE Dublin 03012 Firhouse-Ballycullen
IE Dublin 03013 Firhouse-Knocklyon
IE Dublin 03014 Firhouse Village
IE Dublin 03015 Lucan-Esker
IE Dublin 03016 Lucan Heights
IE Dublin 03017 Lucan-St. Helens
IE Dublin 03018 Newcastle
IE Dublin 03019 Palmerston Village
IE Dublin 03020 Palmerston West
IE Dublin 03021 Rathcoole
IE Dublin 03022 Rathfarnham-Ballyroan
IE Dublin 03023 Rathfarnham-Butterfield
IE Dublin 03024 Rathfarnham-Hermitage
IE Dublin 03025 Rathfarnham-St. Enda's
IE Dublin 03026 Rathfarnham Village
IE Dublin 03027 Saggart
IE Dublin 03028 Tallaght-Avonbeg
IE Dublin 03029 Tallaght-Belgard
IE Dublin 03030 Tallaght-Fettercairn
IE Dublin 03031 Tallaght-Glenview
IE Dublin 03032 Tallaght-Jobstown

Quality of Life in European Cities Survey 2019
Directorate-General for Regional and Urban Policy 2020 89
IE Dublin 03033 Tallaght-Killinardan
IE Dublin 03034 Tallaght-Kilnamanagh
IE Dublin 03035 Tallaght-Kiltipper
IE Dublin 03036 Tallaght-Kingswood
IE Dublin 03037 Tallaght-Millbrook
IE Dublin 03038 Tallaght-Oldbawn
IE Dublin 03039 Tallaght-Springfield
IE Dublin 03040 Tallaght-Tymon
IE Dublin 03041 Templeogue-Cypress
IE Dublin 03042 Templeogue-Kimmage Manor
IE Dublin 03043 Templeogue-Limekiln
IE Dublin 03044 Templeogue-Orwell
IE Dublin 03045 Templeogue-Osprey
IE Dublin 03046 Templeogue Village
IE Dublin 03047 Terenure-Cherryfield
IE Dublin 03048 Terenure-Greentrees
IE Dublin 03049 Terenure-St. James
IE Dublin 04001 Airport
IE Dublin 04002 Balbriggan Rural
IE Dublin 04003 Balbriggan Urban
IE Dublin 04004 Baldoyle
IE Dublin 04005 Balgriffin
IE Dublin 04006 Ballyboghil
IE Dublin 04007 Balscadden
IE Dublin 04008 Blanchardstown-Abbotstown
IE Dublin 04009 Blanchardstown-Blakestown
IE Dublin 04010 Blanchardstown-Coolmine
IE Dublin 04011 Blanchardstown-Corduff
IE Dublin 04012 Blanchardstown-Delwood
IE Dublin 04013 Blanchardstown-Mulhuddart
IE Dublin 04014 Blanchardstown-Roselawn
IE Dublin 04015 Blanchardstown-Tyrrelstown
IE Dublin 04016 Castleknock-Knockmaroon
IE Dublin 04017 Castleknock-Park
IE Dublin 04018 Clonmethan
IE Dublin 04019 Donabate
IE Dublin 04020 Dubber
IE Dublin 04021 Garristown
IE Dublin 04022 Hollywood
IE Dublin 04023 Holmpatrick
IE Dublin 04024 Howth
IE Dublin 04025 Kilsallaghan
IE Dublin 04026 Kinsaley
IE Dublin 04027 Lucan North
IE Dublin 04028 Lusk

Quality of Life in European Cities Survey 2019
Directorate-General for Regional and Urban Policy 2020 90
IE Dublin 04029 Malahide East
IE Dublin 04030 Malahide West
IE Dublin 04031 Portmarnock North
IE Dublin 04032 Portmarnock South
IE Dublin 04033 Rush
IE Dublin 04034 Skerries
IE Dublin 04035 Sutton
IE Dublin 04036 Swords-Forrest
IE Dublin 04037 Swords-Glasmore
IE Dublin 04038 Swords-Lissenhall
IE Dublin 04039 Swords-Seatown
IE Dublin 04040 Swords Village
IE Dublin 04041 The Ward
IE Dublin 04042 Turnapin
IE Dublin 05001 Ballinteer-Broadford
IE Dublin 05002 Ballinteer-Ludford
IE Dublin 05003 Ballinteer-Marley
IE Dublin 05004 Ballinteer-Meadowbroads
IE Dublin 05005 Ballinteer-Meadowmount
IE Dublin 05006 Ballinteer-Woodpark
IE Dublin 05007 Ballybrack
IE Dublin 05008 Blackrock-Booterstown
IE Dublin 05009 Blackrock-Carysfort
IE Dublin 05010 Blackrock-Central
IE Dublin 05011 Blackrock-Glenomena
IE Dublin 05012 Blackrock-Monkstown
IE Dublin 05013 Blackrock-Newpark
IE Dublin 05014 Blackrock-Seapoint
IE Dublin 05015 Blackrock-Stradbrook
IE Dublin 05016 Blackrock-Templehill
IE Dublin 05017 Blackrock-Williamstown
IE Dublin 05018 Cabinteely-Granitefield
IE Dublin 05019 Cabinteely-Kilbogget
IE Dublin 05020 Cabinteely-Loughlinstown
IE Dublin 05021 Cabinteely-Pottery
IE Dublin 05022 Churchtown-Castle
IE Dublin 05023 Churchtown-Landscape
IE Dublin 05024 Churchtown-Nutgrove
IE Dublin 05025 Churchtown-Orwell
IE Dublin 05026 Churchtown-Woodlawn
IE Dublin 05027 Clonskeagh-Belfield
IE Dublin 05028 Clonskeagh-Farranboley
IE Dublin 05029 Clonskeagh-Milltown
IE Dublin 05030 Clonskeagh-Roebuck

Quality of Life in European Cities Survey 2019
Directorate-General for Regional and Urban Policy 2020 91
IE Dublin 05031 Clonskeagh-Windy Arbour
IE Dublin 05032 Dalkey-Avondale
IE Dublin 05033 Dalkey-Bullock
IE Dublin 05034 Dalkey-Coliemore
IE Dublin 05035 Dalkey Hill
IE Dublin 05036 Dalkey Upper
IE Dublin 05037 Dundrum-Balally
IE Dublin 05038 Dundrum-Kilmacud
IE Dublin 05039 Dundrum-Sandyford
IE Dublin 05040 Dundrum-Sweetmount
IE Dublin 05041 Dundrum-Taney
IE Dublin 05042 Dun Laoghaire-East Central
IE Dublin 05043 Dun Laoghaire-Glasthule
IE Dublin 05044 Dun Laoghaire-Glenageary
IE Dublin 05045 Dun Laoghaire-Monkstown Farm
IE Dublin 05046 Dun Laoghaire-Mount Town
IE Dublin 05047 Dun Laoghaire-Sallynoggin East
IE Dublin 05048 Dun Laoghaire-Sallynoggin South
IE Dublin 05049 Dun Laoghaire-Sallynoggin West
IE Dublin 05050 Dun Laoghaire-Sandycove
IE Dublin 05051 Dun Laoghaire-Salthill
IE Dublin 05052 Dun Laoghaire-West Central
IE Dublin 05053 Foxrock-Beechpark
IE Dublin 05054 Foxrock-Carrickmines
IE Dublin 05055 Foxrock-Deansgrange
IE Dublin 05056 Foxrock-Torquay
IE Dublin 05057 Glencullen
IE Dublin 05058 Killiney North
IE Dublin 05059 Killiney South
IE Dublin 05060 Shankill-Rathmichael
IE Dublin 05061 Shankill-Rathsallagh
IE Dublin 05062 Shankill-Shanganagh
IE Dublin 05063 Stillorgan-Deerpark
IE Dublin 05064 Stillorgan-Kilmacud
IE Dublin 05065 Stillorgan-Leopardstown
IE Dublin 05066 Stillorgan-Merville
IE Dublin 05067 Stillorgan-Mount Merrion
IE Dublin 05068 Stillorgan-Priory
IE Dublin 05069 Tibradden
IS Reykjavík 0000 Reykjavík
IS Reykjavík 1000 Kópavogur
IS Reykjavík 1100 Seltjarnarnes
IS Reykjavík 1300 Garðabær
IS Reykjavík 1400 Hafnarfjörður
IS Reykjavík 1604 Mosfellsbær

Quality of Life in European Cities Survey 2019
Directorate-General for Regional and Urban Policy 2020 92
IS Reykjavík 1606 Kjósarhreppur
IT Roma 058091 Roma
IT Napoli 063001 Acerra
IT Napoli 063002 Afragola
IT Napoli 063003 Agerola
IT Napoli 063004 Anacapri
IT Napoli 063005 Arzano
IT Napoli 063006 Bacoli
IT Napoli 063007 Barano d'Ischia
IT Napoli 063008 Boscoreale
IT Napoli 063009 Boscotrecase
IT Napoli 063010 Brusciano
IT Napoli 063011 Caivano
IT Napoli 063012 Calvizzano
IT Napoli 063013 Camposano
IT Napoli 063014 Capri
IT Napoli 063015 Carbonara di Nola
IT Napoli 063016 Cardito
IT Napoli 063017 Casalnuovo di Napoli
IT Napoli 063018 Casamarciano
IT Napoli 063019 Casamicciola Terme
IT Napoli 063020 Casandrino
IT Napoli 063021 Casavatore
IT Napoli 063022 Casola di Napoli
IT Napoli 063023 Casoria
IT Napoli 063024 Castellammare di Stabia
IT Napoli 063025 Castello di Cisterna
IT Napoli 063026 Cercola
IT Napoli 063027 Cicciano
IT Napoli 063028 Cimitile
IT Napoli 063029 Comiziano
IT Napoli 063030 Crispano
IT Napoli 063031 Forio
IT Napoli 063032 Frattamaggiore
IT Napoli 063033 Frattaminore
IT Napoli 063034 Giugliano in Campania
IT Napoli 063035 Gragnano
IT Napoli 063036 Grumo Nevano
IT Napoli 063037 Ischia
IT Napoli 063038 Lacco Ameno
IT Napoli 063039 Lettere
IT Napoli 063040 Liveri
IT Napoli 063041 Marano di Napoli
IT Napoli 063042 Mariglianella

Quality of Life in European Cities Survey 2019
Directorate-General for Regional and Urban Policy 2020 93
IT Napoli 063043 Marigliano
IT Napoli 063044 Massa Lubrense
IT Napoli 063045 Melito di Napoli
IT Napoli 063046 Meta
IT Napoli 063047 Monte di Procida
IT Napoli 063048 Mugnano di Napoli
IT Napoli 063049 Napoli
IT Napoli 063050 Nola
IT Napoli 063051 Ottaviano
IT Napoli 063052 Palma Campania
IT Napoli 063053 Piano di Sorrento
IT Napoli 063054 Pimonte
IT Napoli 063055 Poggiomarino
IT Napoli 063056 Pollena Trocchia
IT Napoli 063057 Pomigliano d'Arco
IT Napoli 063058 Pompei
IT Napoli 063059 Portici
IT Napoli 063060 Pozzuoli
IT Napoli 063061 Procida
IT Napoli 063062 Qualiano
IT Napoli 063063 Quarto
IT Napoli 063064 Ercolano
IT Napoli 063065 Roccarainola
IT Napoli 063066 San Gennaro Vesuviano
IT Napoli 063067 San Giorgio a Cremano
IT Napoli 063068 San Giuseppe Vesuviano
IT Napoli 063069 San Paolo Bel Sito
IT Napoli 063070 San Sebastiano al Vesuvio
IT Napoli 063071 Sant'Agnello
IT Napoli 063072 Sant'Anastasia
IT Napoli 063073 Sant'Antimo
IT Napoli 063074 Sant'Antonio Abate
IT Napoli 063075 San Vitaliano
IT Napoli 063076 Saviano
IT Napoli 063077 Scisciano
IT Napoli 063078 Serrara Fontana
IT Napoli 063079 Somma Vesuviana
IT Napoli 063080 Sorrento
IT Napoli 063081 Striano
IT Napoli 063082 Terzigno
IT Napoli 063083 Torre Annunziata
IT Napoli 063084 Torre del Greco
IT Napoli 063085 Tufino
IT Napoli 063086 Vico Equense
IT Napoli 063087 Villaricca

Quality of Life in European Cities Survey 2019
Directorate-General for Regional and Urban Policy 2020 94
IT Napoli 063088 Visciano
IT Napoli 063089 Volla
IT Napoli 063090 Santa Maria la Carità
IT Napoli 063091 Trecase
IT Napoli 063092 Massa di Somma
IT Torino 001272 Torino
IT Palermo 082053 Palermo
IT Bologna 037006 Bologna
IT Verona 023091 Verona
LT Vilnius 13 Vilniaus miesto savivaldybė
LU Luxembourg 0304 Luxembourg
LV Rīga 0010000 Rīga
ME Podgorica 20176 Podgorica
MK Skopje MK0080102 Skopje - Aerodrom
MK Skopje MK0080301 Vizbegovo
MK Skopje MK0080305 Skopje - Butel
MK Skopje MK0080405 Indžikovo
MK Skopje MK0080408 Singelić
MK Skopje MK0080409 Skopje - Gazi Baba
MK Skopje MK0080411 Stajkovci
MK Skopje MK0080507 Skopje - Đorče Petrov
MK Skopje MK0080802 Gorno Nerezi
MK Skopje MK0080803 Skopje - Karpoš
MK Skopje MK0080902 Skopje - Kisela Voda
MK Skopje MK0080903 Usje
MK Skopje MK0081111 Krušopek
MK Skopje MK0081113 Qubin
MK Skopje MK0081121 Skopje - Saraj
MK Skopje MK0081123 Šiševo
MK Skopje MK0081401 Skopje - Centar
MK Skopje MK0081501 Skopje - Čair
MK Skopje MK0081701 Gorno Orizari
MK Skopje MK0081702 Skopje - Šuto Orizari
MT Valletta MT01101 Valletta
MT Valletta MT01103 Birgu
MT Valletta MT01104 L-Isla
MT Valletta MT01105 Bormla
MT Valletta MT01108 Ħaż-Żabbar
MT Valletta MT01117 Fgura
MT Valletta MT01118 Floriana
MT Valletta MT01129 Kalkara
MT Valletta MT01133 Luqa
MT Valletta MT01134 Marsa
MT Valletta MT01145 Paola

Quality of Life in European Cities Survey 2019
Directorate-General for Regional and Urban Policy 2020 95
MT Valletta MT01157 Santa Luċija
MT Valletta MT01162 Tarxien
MT Valletta MT01165 Xgħajra
MT Valletta MT01206 Ħal Qormi
MT Valletta MT01214 Birkirkara
MT Valletta MT01221 Gżira
MT Valletta MT01227 Ħamrun
MT Valletta MT01241 Msida
MT Valletta MT01246 Pembroke
MT Valletta MT01247 Pieta'
MT Valletta MT01252 San Ġiljan
MT Valletta MT01253 San Ġwann
MT Valletta MT01258 Santa Venera
MT Valletta MT01259 Sliema
MT Valletta MT01260 Swieqi
MT Valletta MT01261 Ta' Xbiex
NL Amsterdam GM0362 Amstelveen
NL Amsterdam GM0363 Amsterdam
NL Amsterdam GM0384 Diemen
NL Amsterdam GM0437 Ouder-Amstel
NL Rotterdam GM0482 Alblasserdam
NL Rotterdam GM0489 Barendrecht
NL Rotterdam GM0502 Capelle aan den IJssel
NL Rotterdam GM0505 Dordrecht
NL Rotterdam GM0531 Hendrik-Ido-Ambacht
NL Rotterdam GM0542 Krimpen aan den IJssel
NL Rotterdam GM0590 Papendrecht
NL Rotterdam GM0597 Ridderkerk
NL Rotterdam GM0599 Rotterdam
NL Rotterdam GM0606 Schiedam
NL Rotterdam GM0622 Vlaardingen
NL Rotterdam GM0642 Zwijndrecht
NL Groningen GM0014 Groningen
NO Oslo 0301 Oslo kommune
PL Warszawa 1007141286501 Warszawa
PL Kraków 1001121216101 Kraków
PL Gdańsk 1004221436101 Gdańsk
PL Białystok 1006201376101 Białystok
PT Lisboa 110501 Alcabideche
PT Lisboa 110506 São Domingos de Rana
PT Lisboa 110507 Carcavelos e Parede
PT Lisboa 110508 Cascais e Estoril
PT Lisboa 110601 Ajuda
PT Lisboa 110602 Alcântara
PT Lisboa 110607 Beato

Quality of Life in European Cities Survey 2019
Directorate-General for Regional and Urban Policy 2020 96
PT Lisboa 110608 Benfica
PT Lisboa 110610 Campolide
PT Lisboa 110611 Carnide
PT Lisboa 110618 Lumiar
PT Lisboa 110621 Marvila
PT Lisboa 110633 Olivais
PT Lisboa 110639 São Domingos de Benfica
PT Lisboa 110654 Alvalade
PT Lisboa 110655 Areeiro
PT Lisboa 110656 Arroios
PT Lisboa 110657 Avenidas Novas
PT Lisboa 110658 Belém
PT Lisboa 110659 Campo de Ourique
PT Lisboa 110660 Estrela
PT Lisboa 110661 Misericórdia
PT Lisboa 110662 Parque das Nações
PT Lisboa 110663 Penha de França
PT Lisboa 110664 Santa Clara
PT Lisboa 110665 Santa Maria Maior
PT Lisboa 110666 Santo António
PT Lisboa 110667 São Vicente
PT Lisboa 110702 Bucelas
PT Lisboa 110705 Fanhões
PT Lisboa 110707 Loures
PT Lisboa 110708 Lousa
PT Lisboa 110726 Moscavide e Portela
PT Lisboa 110727 Sacavém e Prior Velho
PT Lisboa 110728 Santa Iria de Azoia, São João da Talha e Bobadela
PT Lisboa 110729 Santo Antão e São Julião do Tojal
PT Lisboa 110730 Santo António dos Cavaleiros e Frielas
PT Lisboa 110731 Camarate, Unhos e Apelação
PT Lisboa 111002 Barcarena
PT Lisboa 111009 Porto Salvo
PT Lisboa 111012 Algés, Linda-a-Velha e Cruz Quebrada-Dafundo
PT Lisboa 111013 Carnaxide e Queijas
PT Lisboa 111014 Oeiras e São Julião da Barra, Paço de Arcos e Caxias
PT Lisboa 111512 Alfragide
PT Lisboa 111513 Águas Livres
PT Lisboa 111514 Encosta do Sol
PT Lisboa 111515 Falagueira-Venda Nova
PT Lisboa 111516 Mina de Água
PT Lisboa 111517 Venteira
PT Lisboa 111603 Odivelas
PT Lisboa 111608 Pontinha e Famões

Quality of Life in European Cities Survey 2019
Directorate-General for Regional and Urban Policy 2020 97
PT Lisboa 111609 Póvoa de Santo Adrião e Olival Basto
PT Lisboa 111610 Ramada e Caneças
PT Lisboa 150303 Costa da Caparica
PT Lisboa 150312 Almada, Cova da Piedade, Pragal e Cacilhas
PT Lisboa 150313 Caparica e Trafaria
PT Lisboa 150314 Charneca de Caparica e Sobreda
PT Lisboa 150315 Laranjeiro e Feijó
PT Lisboa 150407 Santo António da Charneca
PT Lisboa 150409 Alto do Seixalinho, Santo André e Verderena
PT Lisboa 150410 Barreiro e Lavradio
PT Lisboa 150411 Palhais e Coina
PT Lisboa 151002 Amora
PT Lisboa 151005 Corroios
PT Lisboa 151006 Fernão Ferro
PT Lisboa 151007 Seixal, Arrentela e Aldeia de Paio Pires
PT Braga 030301 Adaúfe
PT Braga 030312 Espinho
PT Braga 030313 Esporões
PT Braga 030315 Figueiredo
PT Braga 030319 Gualtar
PT Braga 030322 Lamas
PT Braga 030325 Mire de Tibães
PT Braga 030330 Padim da Graça
PT Braga 030331 Palmeira
PT Braga 030334 Pedralva
PT Braga 030336 Priscos
PT Braga 030338 Ruilhe
PT Braga 030349 Braga (São Vicente)
PT Braga 030351 Braga (São Vítor)
PT Braga 030354 Sequeira
PT Braga 030355 Sobreposta
PT Braga 030356 Tadim
PT Braga 030357 Tebosa
PT Braga 030363 Arentim e Cunha
PT Braga 030364 Braga (Maximinos, Sé e Cividade)
PT Braga 030365 Braga (São José de São Lázaro e São João do Souto)
PT Braga 030366 Cabreiros e Passos (São Julião)
PT Braga 030367 Celeirós, Aveleda e Vimieiro
PT Braga 030368 Crespos e Pousada
PT Braga 030369 Escudeiros e Penso (Santo Estêvão e São Vicente)
PT Braga 030370 Este (São Pedro e São Mamede)
PT Braga 030371 Ferreiros e Gondizalves
PT Braga 030372 Guisande e Oliveira (São Pedro)
PT Braga 030373 Lomar e Arcos
PT Braga 030374 Merelim (São Paio), Panoias e Parada de Tibães

Quality of Life in European Cities Survey 2019
Directorate-General for Regional and Urban Policy 2020 98
PT Braga 030375 Merelim (São Pedro) e Frossos
PT Braga 030376 Morreira e Trandeiras
PT Braga 030377 Nogueira, Fraião e Lamaçães
PT Braga 030378 Nogueiró e Tenões
PT Braga 030379 Real, Dume e Semelhe
PT Braga 030380 Santa Lucrécia de Algeriz e Navarra
PT Braga 030381 Vilaça e Fradelos
RO Bucureşti 179132 Municipiul Bucureşti
RO Cluj-Napoca 54975 Municipiul Cluj-Napoca
RO Piatra Neamţ 120726 Municipiul Piatra Neamţ
RS Beograd 70106 Belgrade - Voždovac
RS Beograd 70114 Belgrade - Vračar
RS Beograd 70149 Belgrade - Zvezdara
RS Beograd 70157 Belgrade - Zemun
RS Beograd 70181 Belgrade - Novi Beograd
RS Beograd 70203 Belgrade - Palilula
RS Beograd 70211 Belgrade - Rakovica
RS Beograd 70220 Belgrade - Savski venac
RS Beograd 70246 Belgrade - Stari grad
RS Beograd 70254 Belgrade - Čukarica
RS Beograd 80314 Pančevo
SE Stockholm 0123 Järfälla
SE Stockholm 0126 Huddinge
SE Stockholm 0127 Botkyrka
SE Stockholm 0136 Haninge
SE Stockholm 0138 Tyresö
SE Stockholm 0162 Danderyd
SE Stockholm 0163 Sollentuna
SE Stockholm 0180 Stockholm
SE Stockholm 0182 Nacka
SE Stockholm 0183 Sundbyberg
SE Stockholm 0184 Solna
SE Stockholm 0186 Lidingö
SE Malmö 1280 Malmö
SI Ljubljana 061 Ljubljana
SK Bratislava 528595 Bratislava - mestská časť Staré Mesto
SK Bratislava 529311 Bratislava - mestská časť Podunajské Biskupice
SK Bratislava 529320 Bratislava - mestská časť Ružinov
SK Bratislava 529338 Bratislava - mestská časť Vrakuňa
SK Bratislava 529346 Bratislava - mestská časť Nové Mesto
SK Bratislava 529354 Bratislava - mestská časť Rača
SK Bratislava 529362 Bratislava - mestská časť Vajnory
SK Bratislava 529371 Bratislava - mestská časť Devínska Nová Ves
SK Bratislava 529389 Bratislava - mestská časť Dúbravka

Quality of Life in European Cities Survey 2019
Directorate-General for Regional and Urban Policy 2020 99
SK Bratislava 529397 Bratislava - mestská časť Karlova Ves
SK Bratislava 529401 Bratislava - mestská časť Devín
SK Bratislava 529419 Bratislava - mestská časť Lamač
SK Bratislava 529427 Bratislava - mestská časť Záhorská Bystrica
SK Bratislava 529435 Bratislava - mestská časť Čunovo
SK Bratislava 529443 Bratislava - mestská časť Jarovce
SK Bratislava 529460 Bratislava - mestská časť Petržalka
SK Bratislava 529494 Bratislava - mestská časť Rusovce
SK Košice 598119 Košice - mestská časť Kavečany
SK Košice 598127 Košice - mestská časť Ťahanovce
SK Košice 598151 Košice - mestská časť Sever
SK Košice 598186 Košice - mestská časť Staré Mesto
SK Košice 598194 Košice - mestská časť Lorinčík
SK Košice 598208 Košice - mestská časť Pereš
SK Košice 598216 Košice - mestská časť Myslava
SK Košice 598224 Košice - mestská časť Západ
SK Košice 598682 Košice - mestská časť Dargovských hrdinov
SK Košice 599018 Košice - mestská časť Košická Nová Ves
SK Košice 599093 Košice - mestská časť Barca
SK Košice 599786 Košice - mestská časť Šebastovce
SK Košice 599794 Košice - mestská časť Krásna
SK Košice 599816 Košice - mestská časť Nad jazerom
SK Košice 599824 Košice - mestská časť Juh
SK Košice 599841 Košice - mestská časť Šaca
SK Košice 599859 Košice - mestská časť Poľov
SK Košice 599875 Košice - mestská časť Sídlisko Ťahanovce
SK Košice 599883 Košice - mestská časť Sídlisko KVP
SK Košice 599891 Košice - mestská časť Džungľa
SK Košice 599913 Košice - mestská časť Vyšné Opátske
SK Košice 599972 Košice - mestská časť Luník IX
TR Ankara TR6001 Altindag
TR Ankara TR6002 Çankaya
TR Ankara TR6003 Etimesgut
TR Ankara TR6005 Keçiören
TR Ankara TR6006 Mamak
TR Ankara TR6007 Sincan
TR Ankara TR6008 Yenimahalle
TR Ankara TR6025 Pursaklar
TR Antalya TR7017 Kepez
TR Antalya TR7018 Konyaalti
TR Antalya TR7019 Muratpasa
TR Diyarbakir TR21014 Baglar
TR Diyarbakir TR21015 Kayapinar
TR Diyarbakir TR21016 Sur
TR Diyarbakir TR21017 Yenisehir

Quality of Life in European Cities Survey 2019
Directorate-General for Regional and Urban Policy 2020 100
TR Istanbul TR16001 Nilüfer
TR Istanbul TR16002 Osmangazi
TR Istanbul TR16003 Yildirim
TR Istanbul TR16005 Gemlik
TR Istanbul TR16006 Gürsu
TR Istanbul TR16008 Inegöl
TR Istanbul TR16012 Kestel
TR Istanbul TR34002 Avcilar
TR Istanbul TR34003 Bagcilar
TR Istanbul TR34004 Bahçelievler
TR Istanbul TR34005 Bakirköy
TR Istanbul TR34006 Bayrampasa
TR Istanbul TR34007 Besiktas
TR Istanbul TR34008 Beykoz
TR Istanbul TR34009 Beyoglu
TR Istanbul TR34011 Esenler
TR Istanbul TR34012 Eyüp
TR Istanbul TR34013 Fatih
TR Istanbul TR34014 Gaziosmanpasa
TR Istanbul TR34015 Güngören
TR Istanbul TR34016 Kadiköy
TR Istanbul TR34017 Kagithane
TR Istanbul TR34018 Kartal
TR Istanbul TR34019 Küçükçekmece
TR Istanbul TR34020 Maltepe
TR Istanbul TR34021 Pendik
TR Istanbul TR34022 Sariyer
TR Istanbul TR34023 Sisli
TR Istanbul TR34024 Tuzla
TR Istanbul TR34025 Ümraniye
TR Istanbul TR34026 Üsküdar
TR Istanbul TR34027 Zeytinburnu
TR Istanbul TR34028 Büyükçekmece
TR Istanbul TR34030 Silivri
TR Istanbul TR34031 Sultanbeyli
TR Istanbul TR34033 Atasehir
TR Istanbul TR34034 Çekmeköy
TR Istanbul TR34035 Sancaktepe
TR Istanbul TR34036 Sultangazi
TR Istanbul TR34037 Arnavutköy
TR Istanbul TR34038 Basaksehir
TR Istanbul TR34039 Beylikdüzü
TR Istanbul TR34040 Esenyurt
TR Istanbul TR41001 Gebze

Quality of Life in European Cities Survey 2019
Directorate-General for Regional and Urban Policy 2020 101
TR Istanbul TR41002 Gölcük
TR Istanbul TR41004 Karamürsel
TR Istanbul TR41005 Körfez
TR Istanbul TR41006 Derince
TR Istanbul TR41007 Basiskele
TR Istanbul TR41008 Çayirova
TR Istanbul TR41009 Darica
TR Istanbul TR41010 Dilovasi
TR Istanbul TR41011 Izmit
TR Istanbul TR41012 Kartepe
TR Istanbul TR54005 Hendek
TR Istanbul TR54013 Adapazari
TR Istanbul TR54014 Arifiye
TR Istanbul TR54015 Erenler
TR Istanbul TR54016 Serdivan
TR Istanbul TR59000 Tekirdag Merkez
TR Istanbul TR59001 Çerkezköy
TR Istanbul TR59002 Çorlu
TR Istanbul TR59005 Marmaraereglisi
TR Istanbul TR77000 Yalova Merkez
TR Istanbul TR77001 Altinova
TR Istanbul TR77004 Çiftlikköy
TR Istanbul TR81000 Düzce Merkez
TR Istanbul TR81002 Cumayeri
TR Istanbul TR81003 Çilimli
TR Istanbul TR81005 Gümüsova
UK London E09000001 City of London
UK London E09000002 Barking and Dagenham
UK London E09000003 Barnet
UK London E09000004 Bexley
UK London E09000005 Brent
UK London E09000006 Bromley
UK London E09000007 Camden
UK London E09000008 Croydon
UK London E09000009 Ealing
UK London E09000010 Enfield
UK London E09000011 Greenwich
UK London E09000012 Hackney
UK London E09000013 Hammersmith and Fulham
UK London E09000014 Haringey
UK London E09000015 Harrow
UK London E09000016 Havering
UK London E09000017 Hillingdon
UK London E09000018 Hounslow
UK London E09000019 Islington

Quality of Life in European Cities Survey 2019
Directorate-General for Regional and Urban Policy 2020 102
UK London E09000020 Kensington and Chelsea
UK London E09000021 Kingston upon Thames
UK London E09000022 Lambeth
UK London E09000023 Lewisham
UK London E09000024 Merton
UK London E09000025 Newham
UK London E09000026 Redbridge
UK London E09000027 Richmond upon Thames
UK London E09000028 Southwark
UK London E09000029 Sutton
UK London E09000030 Tower Hamlets
UK London E09000031 Waltham Forest
UK London E09000032 Wandsworth
UK London E09000033 Westminster
UK Glasgow S30000015 East Dunbartonshire
UK Glasgow S30000019 Glasgow City
UK Glasgow S30000020 East Renfrewshire
UK Glasgow S30000021 Renfrewshire
UK Manchester E08000001 Bolton
UK Manchester E08000002 Bury
UK Manchester E08000003 Manchester
UK Manchester E08000004 Oldham
UK Manchester E08000005 Rochdale
UK Manchester E08000006 Salford
UK Manchester E08000007 Stockport
UK Manchester E08000008 Tameside
UK Manchester E08000009 Trafford
UK Manchester E08000010 Wigan
UK Cardiff W06000015 Cardiff
UK Belfast UKN06 Belfast
UK Belfast UKN14 Lisburn and Castlereagh
UK Tyneside conurbation E08000021 Newcastle upon Tyne
UK Tyneside conurbation E08000022 North Tyneside
UK Tyneside conurbation E08000023 South Tyneside
UK Tyneside conurbation E08000037 Gateshead