Embed Size (px)
Citation preview
Perceptions of the trunk
road network in Scotland
September 2013
Internal / Client Use Only

Legal notice
© 2013 Ipsos MORI – all rights reserved. The contents of this report constitute the sole and exclusive property of Ipsos MORI. Ipsos MORI retains all right, title and interest, including without limitation copyright, in or to any Ipsos MORI trademarks, technologies, methodologies, products, analyses, software and know-how included or arising out of this report or used in connection with the preparation of this report. No license under any copyright is hereby granted or implied. The contents of this report are of a commercially sensitive and confidential nature and intended solely for the review and consideration of the person or entity to which it is addressed. No other use is permitted and the addressee undertakes not to disclose all or part of this report to any third party (including but not limited, where applicable, pursuant to the Freedom of Information Act 2000) without the prior written consent of the Company Secretary of Ipsos MORI.
Contents
Executive summary ....................................................................... 2
1. Introduction ............................................................................. 5
2. Perceptions of trunk roads .................................................... 7
3. Road works & winter maintenance ...................................... 12
4. Lighting, markings and signage .......................................... 15
5. Cycle lanes and footways .................................................... 18
6. Improving the trunk road network ....................................... 22
7. Disruption due to weather .................................................... 26
8. Information about the trunk road network .......................... 30
9. Tyres ...................................................................................... 38
10. Appendix A: Survey questionnaire ...................................... 39
11. Appendix B: Map of the trunk road network in Scotland ... 56

1
© 2013 Ipsos MORI.
Summary
Perceptions of the trunk road network in Scotland- Internal / Client Use Only
2
This work was carried out in accordance with the requirements of the international quality standard for Market Research,
ISO 20252:2006.
© 2013 Ipsos MORI.
Executive summary
Perceptions of trunk roads
Satisfaction with the condition of trunk road surfaces has returned to the level recorded in
2011, despite increasing last year. A third (32%) of respondents expressed satisfaction with
this aspect of provision, while 57% expressed dissatisfaction
Of those who were dissatisfied with trunk road surfaces, nearly all (94%) had encountered
road defects which they felt were unsafe. Half said they “always” or “usually” encountered
defects, while a third said they “sometimes” did. Consistent with all previous waves of the
survey, pot holes were by far the most commonly experienced type of defect.
Once again, the majority of respondents were satisfied with the management of vegetation
on verges and the central verge (61%) and with the amount of litter and debris on the road
surface (57%). However, a majority were dissatisfied with the speed with which road defects
are repaired (68%) and with the quality of repairs (57%). Despite some improvement last
year, levels of satisfaction with the management of vegetation, the speed with which defects
are repaired, and the quality of repairs have decreased.
Road works and winter maintenance
Satisfaction with aspects of roads works and related provision on the trunk road network
never exceeded 50%. Indeed, a quarter or more respondents were dissatisfied with most
such aspects. These results are virtually unchanged on last year.
Following the significant improvement in perceptions of winter maintenance recorded in last
year’s survey, levels of satisfaction have again increased, albeit by a smaller margin. For the
first time since 2009, a majority of respondents were satisfied with both the promptness with
which roads were gritted (55%) and the promptness with which roads were cleared (54%).
However, there is still room for improvement, with a third (33%) in each case expressing
dissatisfaction.
Lighting, marking and signage
Views of lighting, markings and signage on the trunk road network were generally positive.
Respondents were most satisfied with: the visibility of road signage (74%); the provision of
lighting along roads (70%); and the provision of signs at decision making points (68%).

Perceptions of the trunk road network in Scotland- Internal / Client Use Only
3
This work was carried out in accordance with the requirements of the international quality standard for Market Research,
ISO 20252:2006.
© 2013 Ipsos MORI.
Perceptions of cycle lanes and footways
Consistent with last year’s results, cycle lane users were more likely to be dissatisfied than
satisfied with the general condition of cycle lane surfaces (46% expressed dissatisfaction
while 30% expressed satisfaction). Further, a majority of users were dissatisfied with: the
availability of cycle lanes (72%); the availability of crossing points (59%); the quality of
repairs (57%); the speed with which defects were repaired (55%); and the provision of
lighting (52%).
Despite increasing last year, satisfaction with the general condition of footway surfaces
decreased to the level recorded in 2011, with 44% of respondents expressing satisfaction
and an equal proportion expressing dissatisfaction. Views of other features of footways were
more positive. A majority of users were satisfied with: the availability of footways (68%); the
provision of lighting (67%); the availability of pedestrian crossing points (67%); the amount of
railing or barriers (57%); and the availability of dropped kerbs (55%).
Perceived changes to the trunk road network over past two years
Consistent with the significant upturn in perceptions of winter maintenance in the 2012
survey, the proportion of respondents who felt that aspects of winter maintenance had “got
better” in the past two years has once again increased, to around a third of respondents.
Meanwhile, the proportion of respondents who felt that aspects of road works had got better
over the past two years was the same as in 2011 and 2012, with only one in ten respondents
feeling that each aspect had ‘got better’. The majority of respondents (60%) felt that the
general condition of road surfaces had ‘got worse’ in the past two years.
Overall priorities for improving the trunk road network
Respondents were presented with a list of all the priorities they had identified over the course
of the survey and asked to select from this list the two or three improvements they would
most like to see made. The key priorities for improvement again related to trunk road
surfaces: the general condition of road surfaces (44%); the quality of repairs (37%); and the
speed with which road defects are repaired (37%).
Disruption due to weather
The type of severe weather disruption most commonly experienced by trunk road users in
the last 12 months was snow or ice on the road (63% had experienced this at least once or
twice), followed by heavy rain or hail (43%), floods (38%) and high winds (34%). The most
Perceptions of the trunk road network in Scotland- Internal / Client Use Only
4
This work was carried out in accordance with the requirements of the international quality standard for Market Research,
ISO 20252:2006.
© 2013 Ipsos MORI.
common, specific ways in which users journeys had been affected by severe weather were
delays of up to 30 minutes (30%), having to use alternative routes (27%) and having to
cancel journeys (23%).
A majority of trunk road users were satisfied with the accuracy and availability of warnings
and information before severe weather (59%), with the availability of up to date information
during severe weather (60%) and with the availability of information after severe weather
(52%).
Around half were satisfied with the measures taken to deal with disruptions on trunk roads
after severe weather (49%) and around two in five (43%) were satisfied with the availability of
alternative routes and diversions.
Information about the trunk road network
Radio and television were the most common sources of information about the status and
condition of trunk roads affected by severe weather conditions, mentioned by 48% and 43%
of respondents respectively. The next most common source was the Traffic Scotland
website, mentioned by 15%. Since 2012, there has been a slight increase in the proportion of
respondents accessing information through Smartphone applications (from 2% to 7%).
Respondents were asked if they had looked for information about winter maintenance on
trunks roads over the past year. The most popular sources reported by respondents who had
looked for such information were television, radio and the Traffic Scotland website,
mentioned by 31%, 28% and 28% respectively.
The proportion of respondents (with internet access) who had viewed the Traffic Scotland
website was the same as in 2012 (at 35%), despite a gradual increase over previous waves
of the survey. Views of the website remained generally positive, with around 9 in 10 users
rating it as good.
Tyres
The most important consideration for respondents when they are buying tyres was “How well
the tyre brakes on wet roads” (rated as important by 94% of those asked), followed by “The
cost of the tyre” (87%) and “The impact of the tyre on the car’s fuel consumption” (72%).
Fewer than half (47%) rated as important “How much noise the tyre makes.”
Perceptions of the trunk road network in Scotland- Internal / Client Use Only
5
This work was carried out in accordance with the requirements of the international quality standard for Market Research,
ISO 20252:2006.
© 2013 Ipsos MORI.
1 Introduction
This report presents the findings of a survey of trunk road users in Scotland, conducted by
Ipsos MORI on behalf of Transport Scotland. The survey is the latest in a series, with
previous waves conducted in 2007, 2009, 2010, 2011 and 2012.
1.1 The survey questionnaire
The questionnaire was largely the same as that used in previous waves, and the specific
themes covered included:
road conditions and defects
road works
road lighting, markings and signage
cycle lanes and footways
disruption due to weather
information about the trunk road network and perceptions of the Traffic Scotland
website
factors influencing drivers’ choice of tyre
A copy of the questionnaire is provided in Appendix A.
1.2 Methodology
Ipsos MORI interviewed a representative quota sample of 1,999 adults (aged 18 and over)
across Scotland. All interviews were conducted face-to-face in respondents’ homes, using
CAPI (Computer Assisted Personal Interviewing).
Fieldwork was conducted in two phases to minimise the potential impact of seasonal effects
– the tendency for respondents to give different answers depending on the time of the year.
The first phase was conducted between 11th March and 7th May 2013, and the second phase
between 15th June and 28th July 2013.
Only individuals who had travelled on the trunk road network over the previous 12 months
were eligible to take part in the survey. To establish eligibility, interviewers showed
respondents a map of the trunk road network in Scotland (see Appendix B) and asked them
how often they had travelled on a trunk road in the last 12 months, (including as a

Perceptions of the trunk road network in Scotland- Internal / Client Use Only
6
This work was carried out in accordance with the requirements of the international quality standard for Market Research,
ISO 20252:2006.
© 2013 Ipsos MORI.
passenger). People who answered “never” were screened out. Throughout the interviews,
respondents were reminded to base their answers on their experiences of using trunk roads
only, as opposed to roads in general, when answering questions.
The survey data have been weighted by age, gender and working status using the latest
ONS mid-year census estimates.
All fieldwork and project management was carried out to ISO20252 standards.
1.3 Presentation and interpretation of the findings
The survey findings represent the views of a sample of Scottish adults, and not the entire
population of Scotland. As such they are subject to sampling tolerances meaning that
differences between sub-groups or over time may not always be statistically significant.
Throughout the report, we have only commented upon differences which are statistically
significant (at the 0.05 level) – i.e. where we can be reasonably certain that they are unlikely
to have occurred by chance.
Where percentages do not sum to 100%, this may be due to computer rounding, the
exclusion of ‘don’t know’ categories or multiple answers. An asterisk (*) denotes any value of
less than half a per cent but more than zero.
Perceptions of the trunk road network in Scotland- Internal / Client Use Only
7
This work was carried out in accordance with the requirements of the international quality standard for Market Research,
ISO 20252:2006.
© 2013 Ipsos MORI.
2 Perceptions of trunk roads
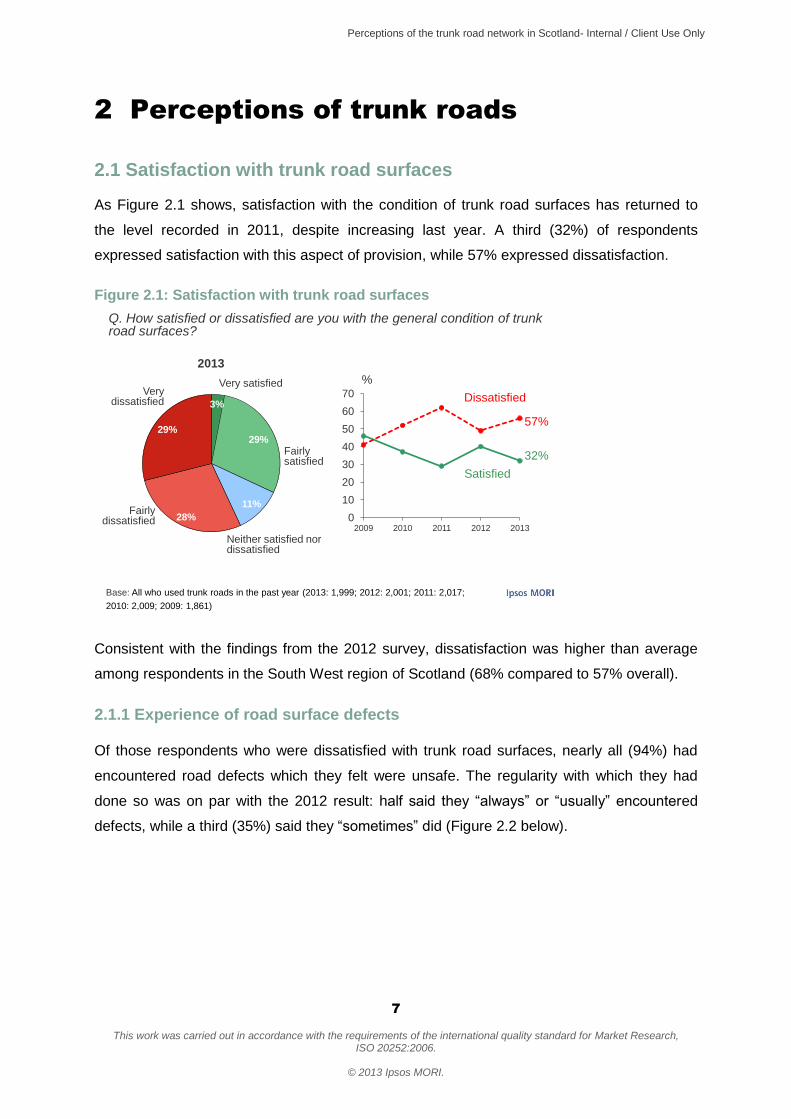
2.1 Satisfaction with trunk road surfaces
As Figure 2.1 shows, satisfaction with the condition of trunk road surfaces has returned to
the level recorded in 2011, despite increasing last year. A third (32%) of respondents
expressed satisfaction with this aspect of provision, while 57% expressed dissatisfaction.
Figure 2.1: Satisfaction with trunk road surfaces
0
10
20
30
40
50
60
70
2009 2010 2011 2012 2013
3%
29%
11%
28%
29%
Fairly dissatisfied
Very dissatisfied
Fairly satisfied
Satisfied
%
32%
Very satisfied
Standard Life Favourability – Trends
Neither satisfied nor dissatisfied
Q. How satisfied or dissatisfied are you with the general condition of trunk road surfaces?
Base: All who used trunk roads in the past year (2013: 1,999; 2012: 2,001; 2011: 2,017;
2010: 2,009; 2009: 1,861)
2013
57%
Dissatisfied
Consistent with the findings from the 2012 survey, dissatisfaction was higher than average
among respondents in the South West region of Scotland (68% compared to 57% overall).
2.1.1 Experience of road surface defects Of those respondents who were dissatisfied with trunk road surfaces, nearly all (94%) had
encountered road defects which they felt were unsafe. The regularity with which they had
done so was on par with the 2012 result: half said they “always” or “usually” encountered
defects, while a third (35%) said they “sometimes” did (Figure 2.2 below).

Perceptions of the trunk road network in Scotland- Internal / Client Use Only
8
This work was carried out in accordance with the requirements of the international quality standard for Market Research,
ISO 20252:2006.
© 2013 Ipsos MORI.
Figure 2.2: Experience of road defects
0
10
20
30
40
50
60
2009 2010 2011 2012 2013
23%
27%
35%
10%
5%
Usually
Never % Always/usually
50%Always
Standard Life Favourability – Trends
Sometimes
Base: All who were dissatisfied with the general condition of road surfaces (2013: 1,1,23; 2012:
989; 2011: 1,253; 2010: 1,050; 2009: 758)
Rarely
Q. When using trunk roads, how often, if at all, do you encounter road defects which you feel are unsafe?
As was the case last year, respondents in the North West, South West and North East
reported encountering road defects more often than those in the South East: a majority in
these regions (60%, 54% and 53% respectively) “always” or “usually” encountered defects,
compared with 35% in the South East.
Consistent with all previous waves of the survey, pot holes were by far the most commonly
experienced type of road defect, as can be seen in Table 2.1, below.
Table 2.1: Specific road surface defects experienced, 2009-2013
2009 2010 2011 2012 2013
% % % % %
Potholes 62 73 77 75 76
Poor repairs 9 5 8 8 8
Uneven or bumpy surfaces 14 12 8 8 7
Slippery roads caused by ice/ snow 2 3 2 2 2
Water on roads 3 2 1 1 2
Cracking 2 2 1 1 1
Ironwork in need of repair 1 1 1 1 1
Deterioration of road edge 2 1 1 1 1
Poor skid resistance 1 * * * 1
Base: All dissatisfied with trunk road surfaces who had experienced defects
729 998 1,221 947 1,061

Perceptions of the trunk road network in Scotland- Internal / Client Use Only
9
This work was carried out in accordance with the requirements of the international quality standard for Market Research,
ISO 20252:2006.
© 2013 Ipsos MORI.
2.2 Satisfaction with other aspects of the trunk road network
As Figure 2.3 (below) shows, the majority of respondents were satisfied with the
management of vegetation on verges and the central verge (61%) and with the amount of
litter and debris on the road surface (57%). However, a majority were dissatisfied with the
speed with which road defects such as potholes are repaired (68%) and with the quality of
repairs (57%).
Figure 2.3: Satisfaction with other aspects of the trunk road network
9%
8%
5%
4
4
2
52%
49%
40%
37%
26%
17%
18%
16%
15%
20%
12%
10%
12%
17%
26%
24%
29%
30%
6%
9%
11%
13%
28%
38%
Drainage of water from road surface
Amount of litter/ debris on road surface
Quality of repairs
Amount of traffic congestion
Management of vegetation
Speed with which defects are repaired
Q. How satisfied or dissatisfied are you with the following aspects of the general state and condition of trunk roads?
Base: All who had used trunk roads in the past year (1,999)
% Very dissatisfied % Don’t know
% Neither/nor
% Fairly dissatisfied
% Very satisfied % Fairly satisfied
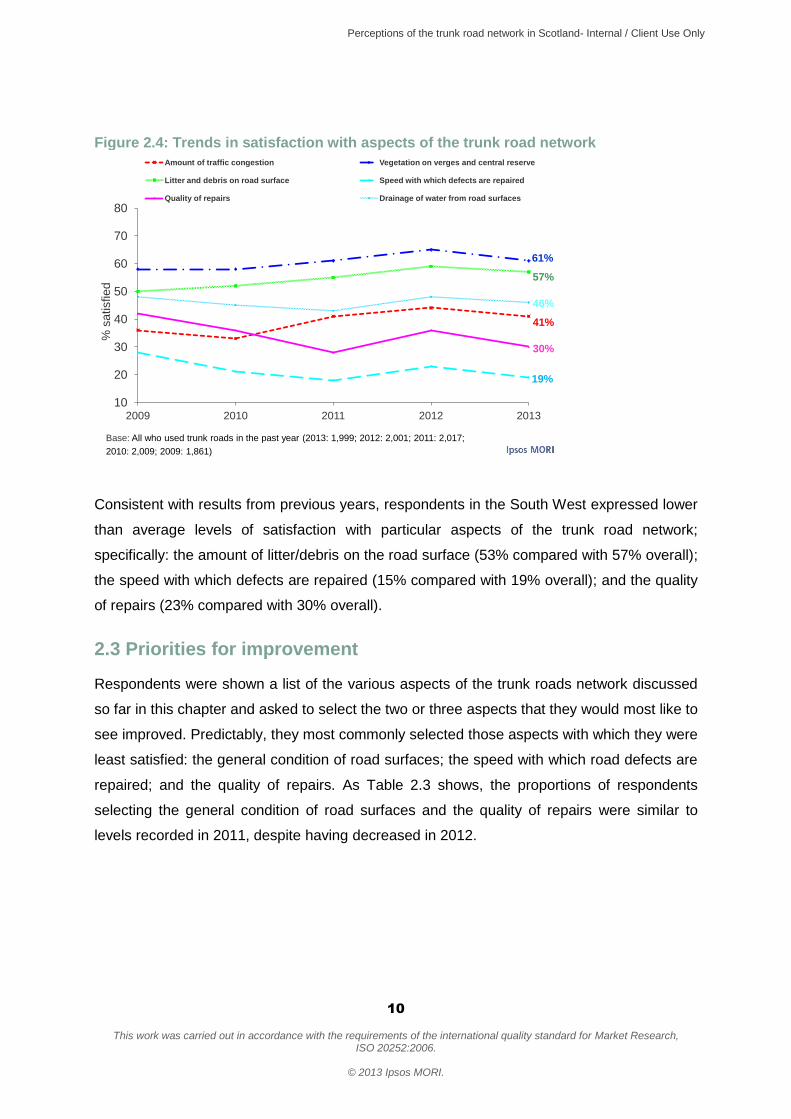
Despite some improvement last year, levels of satisfaction with the management of
vegetation, the speed with which defects are repaired, and the quality of repairs have
decreased – by four, four and six percentage points, respectively – to levels reported in 2011
(Figure 2.4). There were no statistically significant changes in perceptions of other aspects
of the network.
Perceptions of the trunk road network in Scotland- Internal / Client Use Only
10
This work was carried out in accordance with the requirements of the international quality standard for Market Research,
ISO 20252:2006.
© 2013 Ipsos MORI.
Figure 2.4: Trends in satisfaction with aspects of the trunk road network
10
20
30
40
50
60
70
80
2009 2010 2011 2012 2013
Amount of traffic congestion Vegetation on verges and central reserve
Litter and debris on road surface Speed with which defects are repaired
Quality of repairs Drainage of water from road surfaces
% s
atisfie
d
61%
57%
46%
30%
19%
41%
Base: All who used trunk roads in the past year (2013: 1,999; 2012: 2,001; 2011: 2,017;
2010: 2,009; 2009: 1,861)
Consistent with results from previous years, respondents in the South West expressed lower
than average levels of satisfaction with particular aspects of the trunk road network;
specifically: the amount of litter/debris on the road surface (53% compared with 57% overall);
the speed with which defects are repaired (15% compared with 19% overall); and the quality
of repairs (23% compared with 30% overall).
2.3 Priorities for improvement
Respondents were shown a list of the various aspects of the trunk roads network discussed
so far in this chapter and asked to select the two or three aspects that they would most like to
see improved. Predictably, they most commonly selected those aspects with which they were
least satisfied: the general condition of road surfaces; the speed with which road defects are
repaired; and the quality of repairs. As Table 2.3 shows, the proportions of respondents
selecting the general condition of road surfaces and the quality of repairs were similar to
levels recorded in 2011, despite having decreased in 2012.

Perceptions of the trunk road network in Scotland- Internal / Client Use Only
11
This work was carried out in accordance with the requirements of the international quality standard for Market Research,
ISO 20252:2006.
© 2013 Ipsos MORI.
Table 2.3: Priorities for improvement, 2009-2013
2009 2010 2011 2012 2013
% % % % %
The general condition of road surfaces 49 50 58 55 59
Speed with which defects are repaired 42 52 57 51 54
Quality of repairs 38 38 52 47 53
Amount of congestion 33 31 23 25 24
Drainage of water 17 16 19 19 17
Amount of litter/ debris on road surface 18 13 10 13 11
Management of vegetation 7 6 6 6 7
Base: All who had used trunk roads at some point in the last year
2,017 2,009 2,017 2,001 1,999
Reflecting their lower than average levels of satisfaction with the general condition of road
surfaces, the speed with which road defects are repaired, and the quality of repairs,
respondents in the South West were more likely than the sample as a whole to select these
aspects as priorities for improvement (65%, 58% and 59% compared with 59%, 54% and
53% respectively). At the same time, respondents in the South West were less likely than
those in other areas to select the amount of traffic congestion as a priority for improvement
(18% compared with 24% overall).
Perceptions of the trunk road network in Scotland- Internal / Client Use Only
12
This work was carried out in accordance with the requirements of the international quality standard for Market Research,
ISO 20252:2006.
© 2013 Ipsos MORI.
3 Road works & winter maintenance
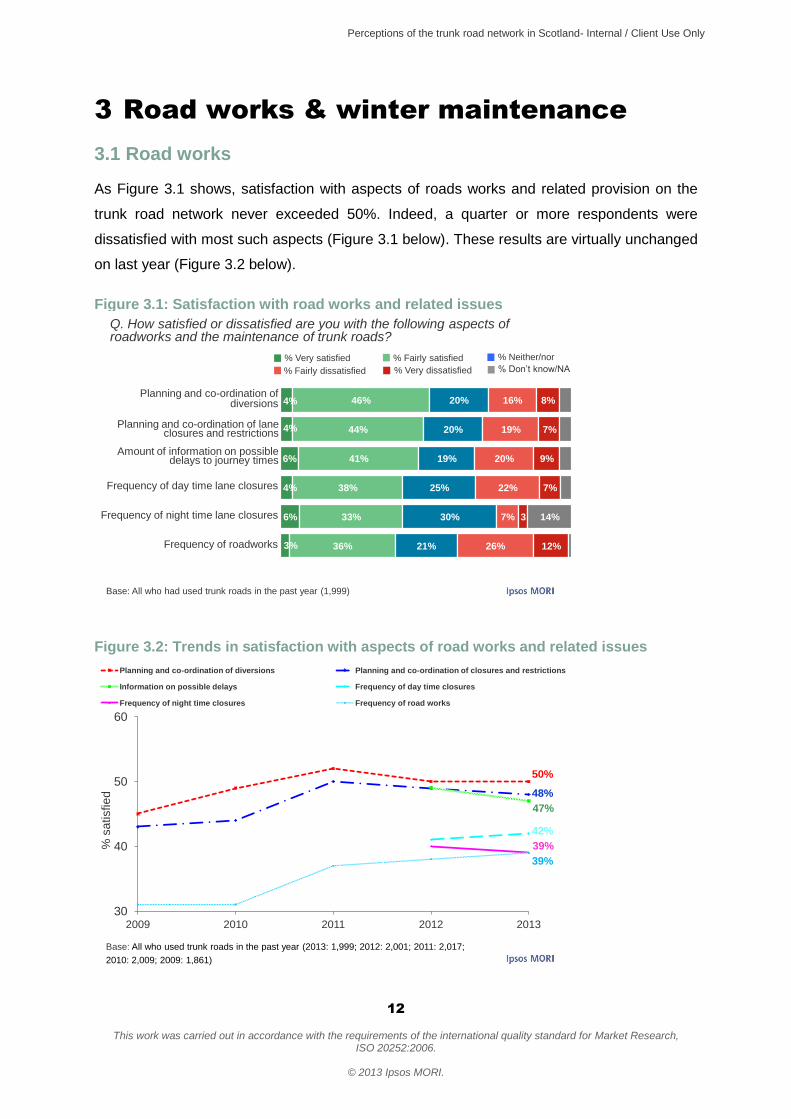
3.1 Road works
As Figure 3.1 shows, satisfaction with aspects of roads works and related provision on the
trunk road network never exceeded 50%. Indeed, a quarter or more respondents were
dissatisfied with most such aspects (Figure 3.1 below). These results are virtually unchanged
on last year (Figure 3.2 below).
Figure 3.1: Satisfaction with road works and related issues
4%
4%
6%
4%
6%
3%
46%
44%
41%
38%
33%
36%
20%
20%
19%
25%
30%
21%
16%
19%
20%
22%
7%
26%
8%
7%
9%
7%
3
12%
14%
Planning and co-ordination of lane closures and restrictions
Amount of information on possible delays to journey times
Frequency of night time lane closures
Frequency of day time lane closures
Planning and co-ordination of diversions
Frequency of roadworks
Q. How satisfied or dissatisfied are you with the following aspects of roadworks and the maintenance of trunk roads?
Base: All who had used trunk roads in the past year (1,999)
% Very dissatisfied % Don’t know/NA
% Neither/nor
% Fairly dissatisfied
% Very satisfied % Fairly satisfied
Figure 3.2: Trends in satisfaction with aspects of road works and related issues
30
40
50
60
2009 2010 2011 2012 2013
Planning and co-ordination of diversions Planning and co-ordination of closures and restrictions
Information on possible delays Frequency of day time closures
Frequency of night time closures Frequency of road works
% s
atisfie
d 48%
47%
42%
39%
39%
50%
Base: All who used trunk roads in the past year (2013: 1,999; 2012: 2,001; 2011: 2,017;
2010: 2,009; 2009: 1,861)
Perceptions of the trunk road network in Scotland- Internal / Client Use Only
13
This work was carried out in accordance with the requirements of the international quality standard for Market Research,
ISO 20252:2006.
© 2013 Ipsos MORI.
Respondents in the South West and South East were more likely than those in the North
West and North East to be dissatisfied with the frequency of road works (42% and 41%
compared with 31% and 31% respectively).
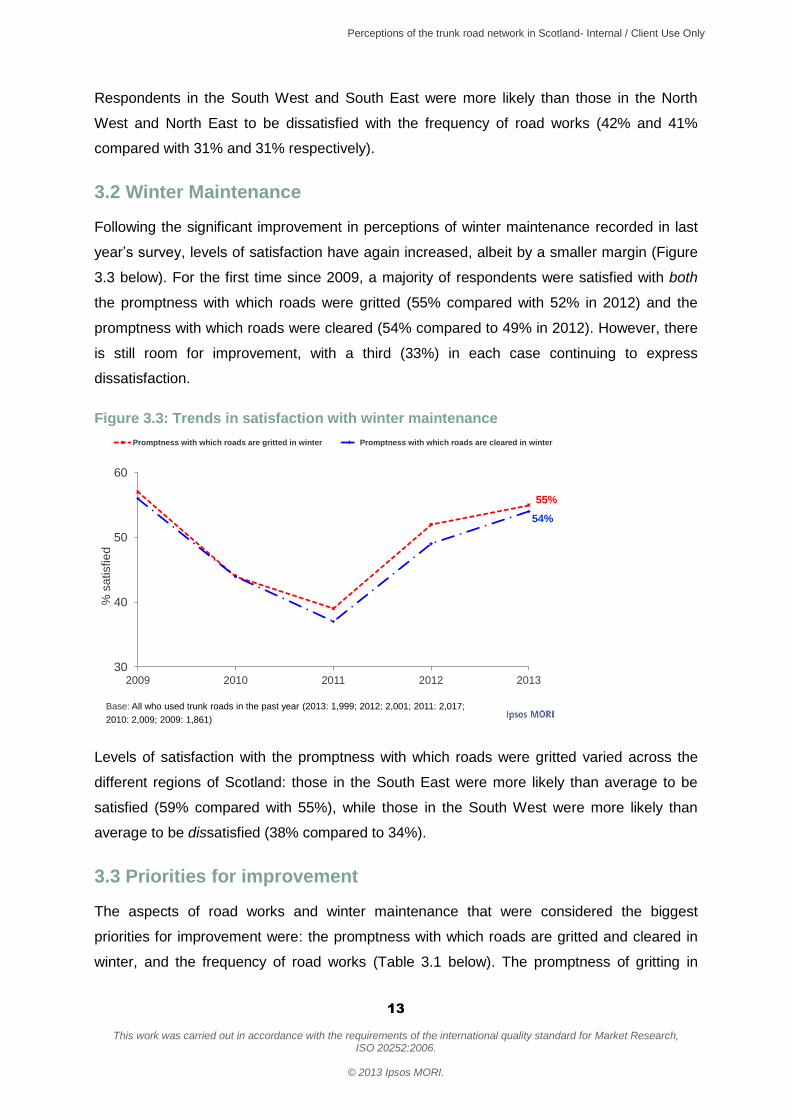
3.2 Winter Maintenance
Following the significant improvement in perceptions of winter maintenance recorded in last
year’s survey, levels of satisfaction have again increased, albeit by a smaller margin (Figure
3.3 below). For the first time since 2009, a majority of respondents were satisfied with both
the promptness with which roads were gritted (55% compared with 52% in 2012) and the
promptness with which roads were cleared (54% compared to 49% in 2012). However, there
is still room for improvement, with a third (33%) in each case continuing to express
dissatisfaction.
Figure 3.3: Trends in satisfaction with winter maintenance
30
40
50
60
2009 2010 2011 2012 2013
Promptness with which roads are gritted in winter Promptness with which roads are cleared in winter
% s
atisfie
d
54%
55%
Base: All who used trunk roads in the past year (2013: 1,999; 2012: 2,001; 2011: 2,017;
2010: 2,009; 2009: 1,861)
Levels of satisfaction with the promptness with which roads were gritted varied across the
different regions of Scotland: those in the South East were more likely than average to be
satisfied (59% compared with 55%), while those in the South West were more likely than
average to be dissatisfied (38% compared to 34%).
3.3 Priorities for improvement
The aspects of road works and winter maintenance that were considered the biggest
priorities for improvement were: the promptness with which roads are gritted and cleared in
winter, and the frequency of road works (Table 3.1 below). The promptness of gritting in
Perceptions of the trunk road network in Scotland- Internal / Client Use Only
14
This work was carried out in accordance with the requirements of the international quality standard for Market Research,
ISO 20252:2006.
© 2013 Ipsos MORI.
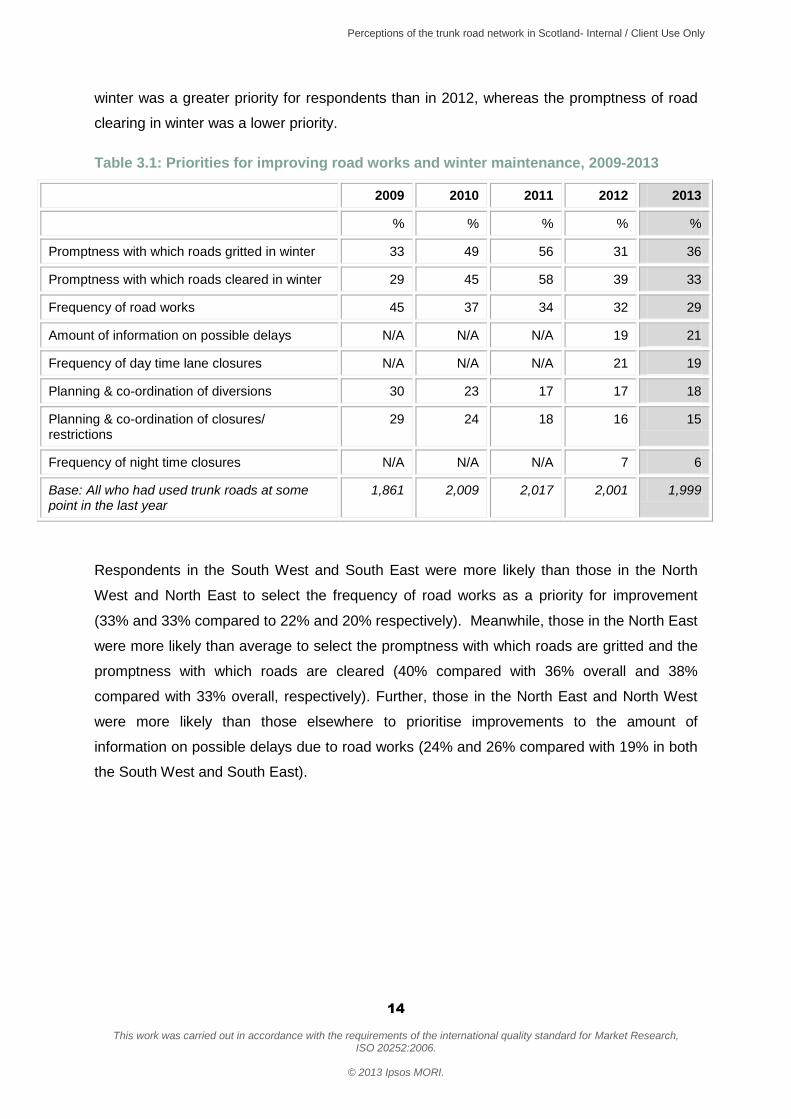
winter was a greater priority for respondents than in 2012, whereas the promptness of road
clearing in winter was a lower priority.
Table 3.1: Priorities for improving road works and winter maintenance, 2009-2013
2009 2010 2011 2012 2013
% % % % %
Promptness with which roads gritted in winter 33 49 56 31 36
Promptness with which roads cleared in winter 29 45 58 39 33
Frequency of road works 45 37 34 32 29
Amount of information on possible delays N/A N/A N/A 19 21
Frequency of day time lane closures N/A N/A N/A 21 19
Planning & co-ordination of diversions 30 23 17 17 18
Planning & co-ordination of closures/ restrictions
29 24 18 16 15
Frequency of night time closures N/A N/A N/A 7 6
Base: All who had used trunk roads at some point in the last year
1,861 2,009 2,017 2,001 1,999
Respondents in the South West and South East were more likely than those in the North
West and North East to select the frequency of road works as a priority for improvement
(33% and 33% compared to 22% and 20% respectively). Meanwhile, those in the North East
were more likely than average to select the promptness with which roads are gritted and the
promptness with which roads are cleared (40% compared with 36% overall and 38%
compared with 33% overall, respectively). Further, those in the North East and North West
were more likely than those elsewhere to prioritise improvements to the amount of
information on possible delays due to road works (24% and 26% compared with 19% in both
the South West and South East).
Perceptions of the trunk road network in Scotland- Internal / Client Use Only
15
This work was carried out in accordance with the requirements of the international quality standard for Market Research,
ISO 20252:2006.
© 2013 Ipsos MORI.
4 Lighting, markings and signage
4.1 Satisfaction with lighting, markings and signage
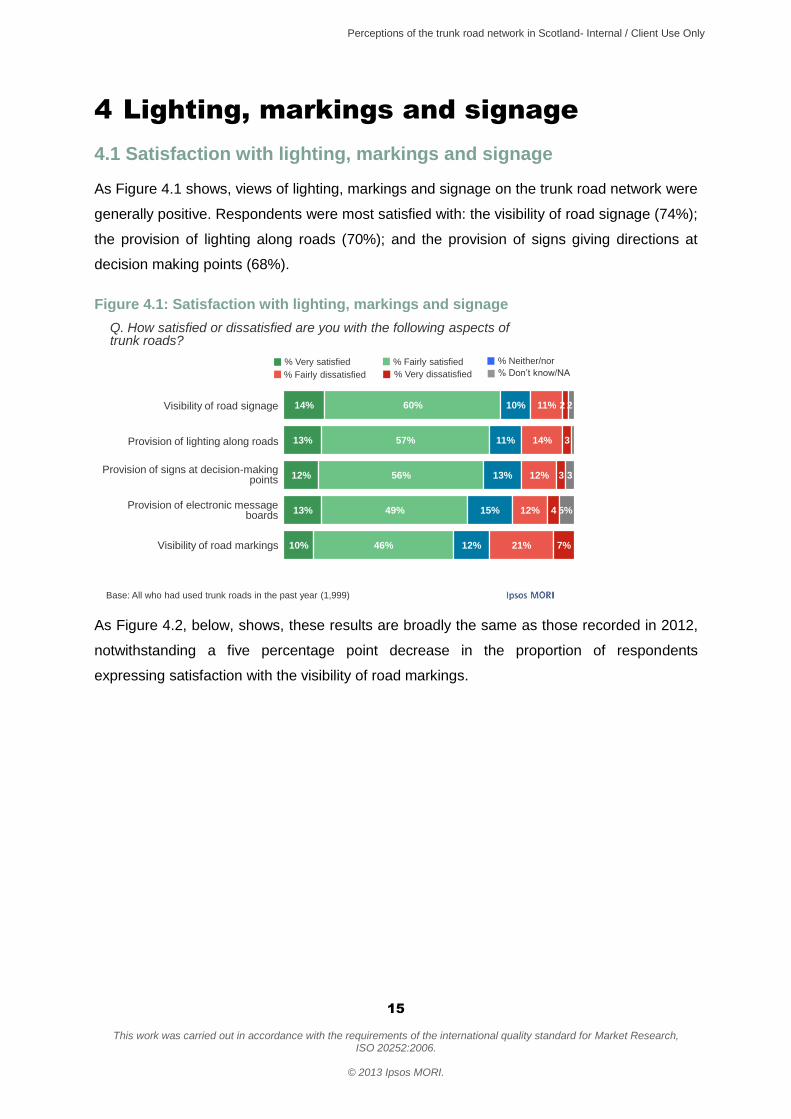
As Figure 4.1 shows, views of lighting, markings and signage on the trunk road network were
generally positive. Respondents were most satisfied with: the visibility of road signage (74%);
the provision of lighting along roads (70%); and the provision of signs giving directions at
decision making points (68%).
Figure 4.1: Satisfaction with lighting, markings and signage
14%
13%
12%
13%
10%
60%
57%
56%
49%
46%
10%
11%
13%
15%
12%
11%
14%
12%
12%
21%
2
3
3
4
7%
2
3
5%
Provision of lighting along roads
Provision of electronic message boards
Provision of signs at decision-making points
Visibility of road signage
Visibility of road markings
Q. How satisfied or dissatisfied are you with the following aspects of trunk roads?
Base: All who had used trunk roads in the past year (1,999)
% Very dissatisfied % Don’t know/NA
% Neither/nor
% Fairly dissatisfied
% Very satisfied % Fairly satisfied
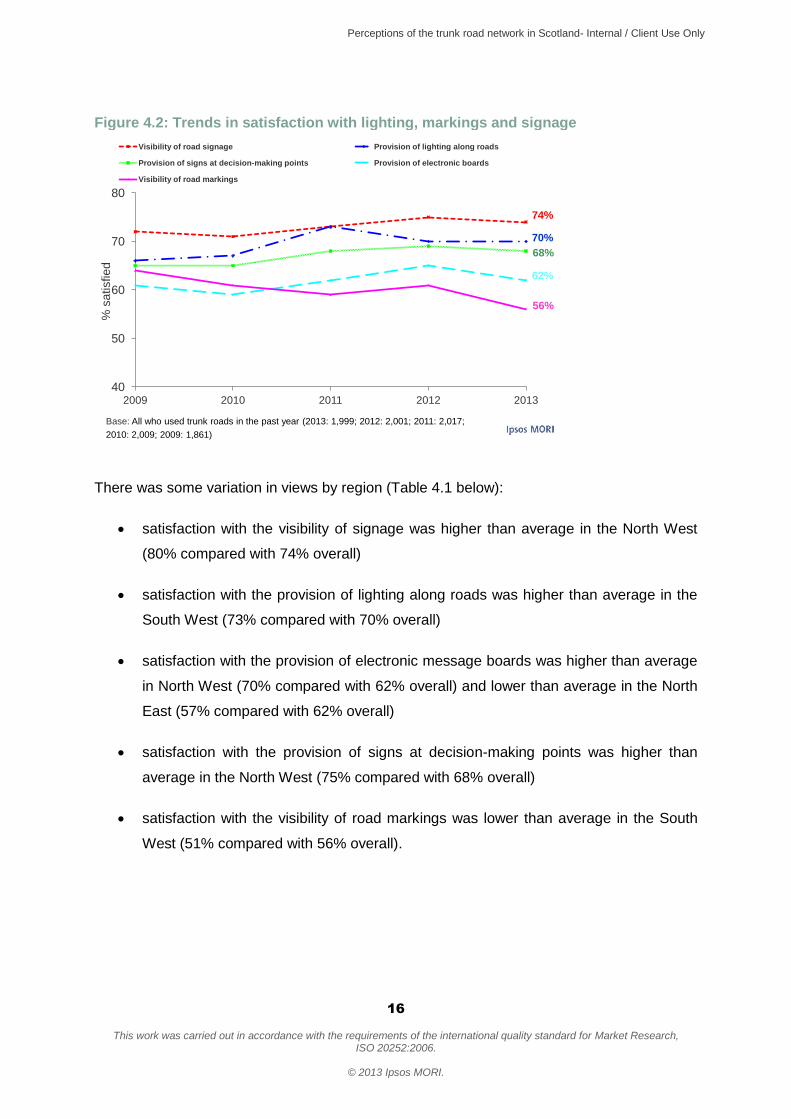
As Figure 4.2, below, shows, these results are broadly the same as those recorded in 2012,
notwithstanding a five percentage point decrease in the proportion of respondents
expressing satisfaction with the visibility of road markings.
Perceptions of the trunk road network in Scotland- Internal / Client Use Only
16
This work was carried out in accordance with the requirements of the international quality standard for Market Research,
ISO 20252:2006.
© 2013 Ipsos MORI.
Figure 4.2: Trends in satisfaction with lighting, markings and signage
40
50
60
70
80
2009 2010 2011 2012 2013
Visibility of road signage Provision of lighting along roads
Provision of signs at decision-making points Provision of electronic boards
Visibility of road markings
% s
atisfie
d
70%
68%
62%
56%
74%
Base: All who used trunk roads in the past year (2013: 1,999; 2012: 2,001; 2011: 2,017;
2010: 2,009; 2009: 1,861)
There was some variation in views by region (Table 4.1 below):
satisfaction with the visibility of signage was higher than average in the North West
(80% compared with 74% overall)
satisfaction with the provision of lighting along roads was higher than average in the
South West (73% compared with 70% overall)
satisfaction with the provision of electronic message boards was higher than average
in North West (70% compared with 62% overall) and lower than average in the North
East (57% compared with 62% overall)
satisfaction with the provision of signs at decision-making points was higher than
average in the North West (75% compared with 68% overall)
satisfaction with the visibility of road markings was lower than average in the South
West (51% compared with 56% overall).
Perceptions of the trunk road network in Scotland- Internal / Client Use Only
17
This work was carried out in accordance with the requirements of the international quality standard for Market Research,
ISO 20252:2006.
© 2013 Ipsos MORI.
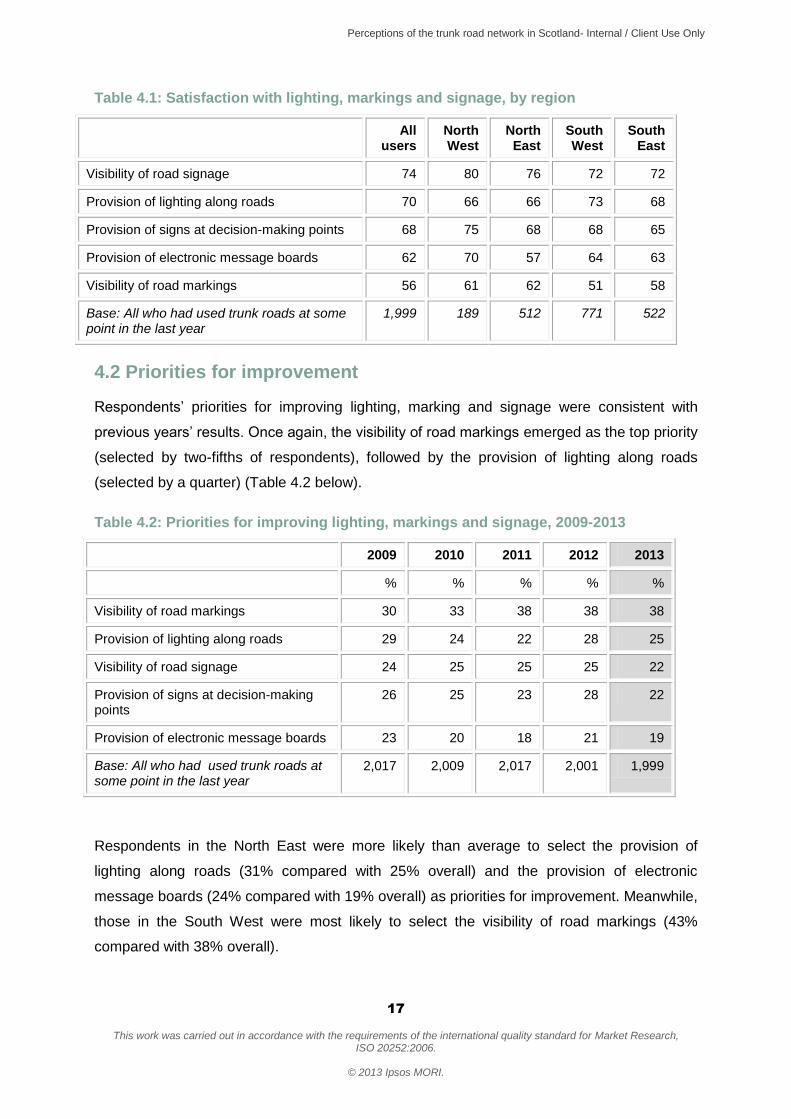
Table 4.1: Satisfaction with lighting, markings and signage, by region
All users
North West
North East
South West
South East
Visibility of road signage 74 80 76 72 72
Provision of lighting along roads 70 66 66 73 68
Provision of signs at decision-making points 68 75 68 68 65
Provision of electronic message boards 62 70 57 64 63
Visibility of road markings 56 61 62 51 58
Base: All who had used trunk roads at some point in the last year
1,999 189 512 771 522
4.2 Priorities for improvement
Respondents’ priorities for improving lighting, marking and signage were consistent with
previous years’ results. Once again, the visibility of road markings emerged as the top priority
(selected by two-fifths of respondents), followed by the provision of lighting along roads
(selected by a quarter) (Table 4.2 below).
Table 4.2: Priorities for improving lighting, markings and signage, 2009-2013
2009 2010 2011 2012 2013
% % % % %
Visibility of road markings 30 33 38 38 38
Provision of lighting along roads 29 24 22 28 25
Visibility of road signage 24 25 25 25 22
Provision of signs at decision-making points
26 25 23 28 22
Provision of electronic message boards 23 20 18 21 19
Base: All who had used trunk roads at some point in the last year
2,017 2,009 2,017 2,001 1,999
Respondents in the North East were more likely than average to select the provision of
lighting along roads (31% compared with 25% overall) and the provision of electronic
message boards (24% compared with 19% overall) as priorities for improvement. Meanwhile,
those in the South West were most likely to select the visibility of road markings (43%
compared with 38% overall).

Perceptions of the trunk road network in Scotland- Internal / Client Use Only
18
This work was carried out in accordance with the requirements of the international quality standard for Market Research,
ISO 20252:2006.
© 2013 Ipsos MORI.
5 Cycle lanes and footways
This section examines views of cycle lanes and footways on the trunk road network among
respondents who had used these facilities in the last 12 months: 2% of the sample in the
case of cycle lanes and 9% in the case of footways. The results for cycle lanes are only
based on 44 people and, as a result, should be treated as indicative rather than
representative of the views of all users of cycle lanes in Scotland.
5.1 Satisfaction with cycle lane and footway surfaces
As Figure 5.1 shows, cycle lane users were once again more likely to be dissatisfied than
satisfied with the general condition of cycle lane surfaces (46% compared with 30% overall).
Figure 5.1: Satisfaction with the general condition of cycle lanes surfaces
Very satisfied
Fairly satisfied
Neither satisfied nor dissatisfied
Fairly dissatisfied
Very dissatisfied
Q. How satisfied or dissatisfied are you with the general condition of cycle lane surfaces?
Base: All who had used a cycle lane on trunk roads in the last 12 months (44)
10%
20%
23%
23%
23%
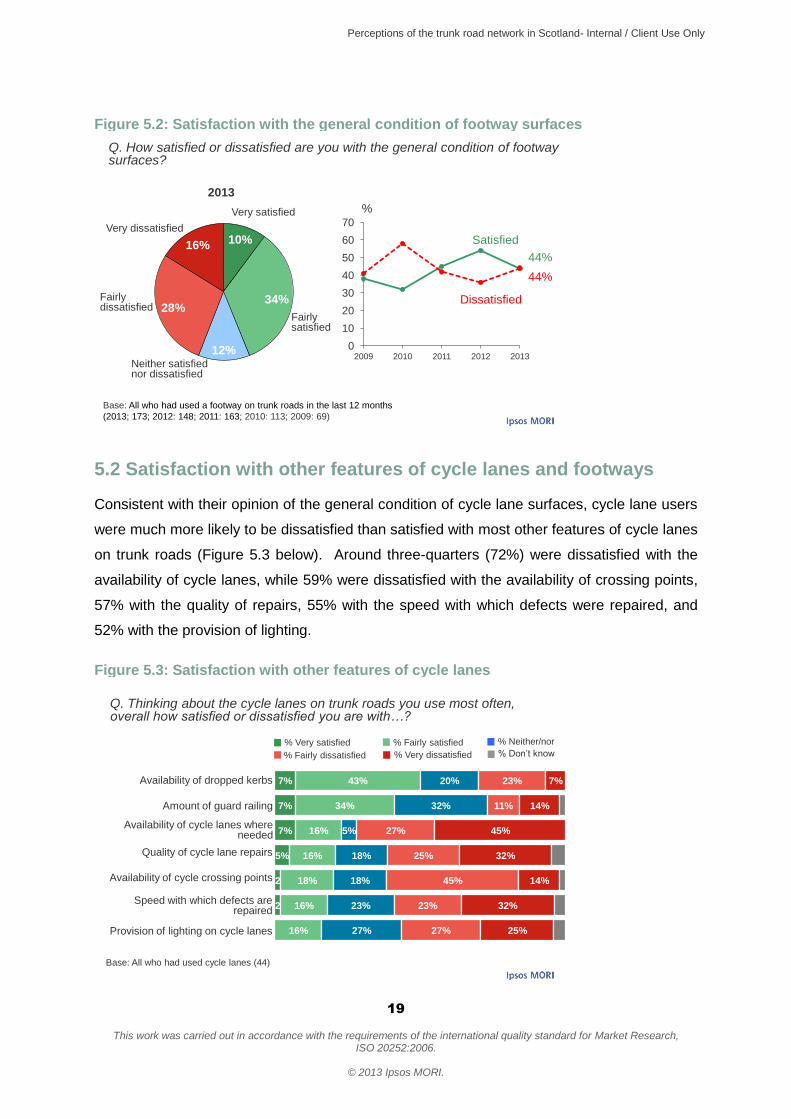
Satisfaction with the general condition of footway surfaces, meanwhile, was consistent with
the level recorded in 2011, despite increasing last year. Just over two in five (44%) footway
users expressed satisfaction with this area of provision and an equal proportion expressed
dissatisfaction.
Perceptions of the trunk road network in Scotland- Internal / Client Use Only
19
This work was carried out in accordance with the requirements of the international quality standard for Market Research,
ISO 20252:2006.
© 2013 Ipsos MORI.
Figure 5.2: Satisfaction with the general condition of footway surfaces
0
10
20
30
40
50
60
70
2009 2010 2011 2012 2013
10%
34%
12%
28%
16%
Fairly dissatisfied
Very dissatisfied
Fairly satisfied
Satisfied
%
44%
Very satisfied
Standard Life Favourability – Trends
Neither satisfied nor dissatisfied
Q. How satisfied or dissatisfied are you with the general condition of footway surfaces?
2013
44%
Dissatisfied
Base: All who had used a footway on trunk roads in the last 12 months
(2013; 173; 2012: 148; 2011: 163; 2010: 113; 2009: 69)
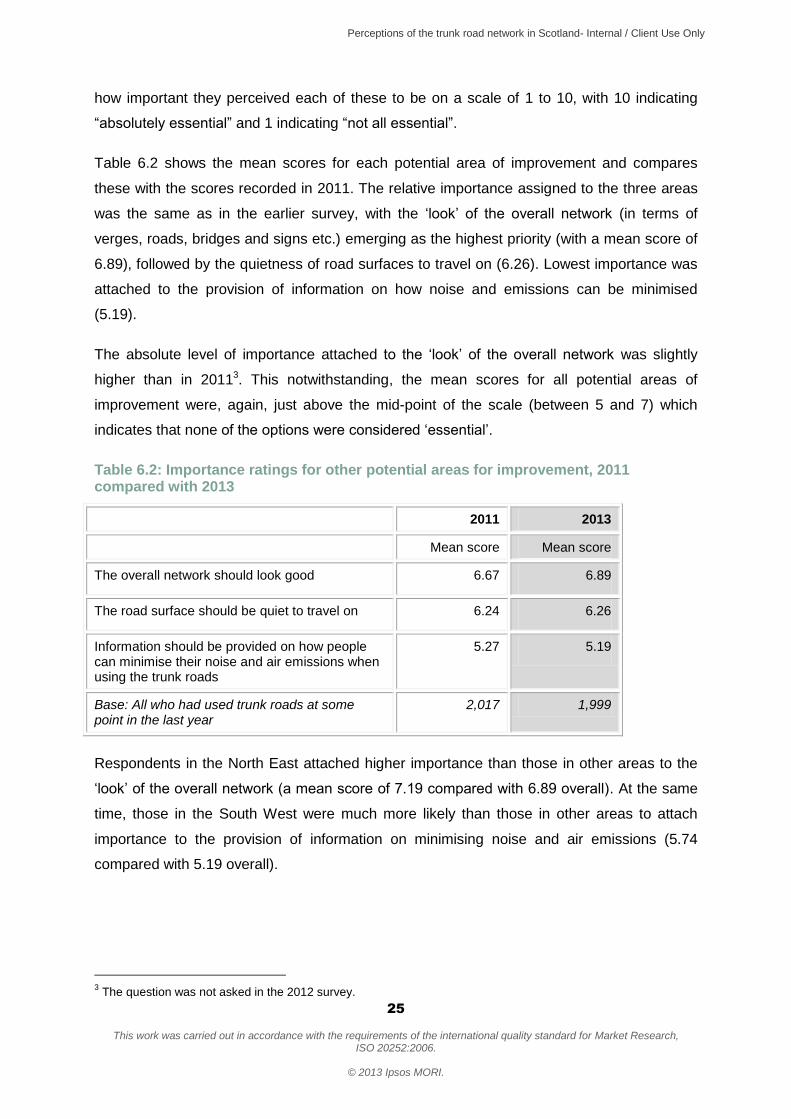
5.2 Satisfaction with other features of cycle lanes and footways
Consistent with their opinion of the general condition of cycle lane surfaces, cycle lane users
were much more likely to be dissatisfied than satisfied with most other features of cycle lanes
on trunk roads (Figure 5.3 below). Around three-quarters (72%) were dissatisfied with the
availability of cycle lanes, while 59% were dissatisfied with the availability of crossing points,
57% with the quality of repairs, 55% with the speed with which defects were repaired, and
52% with the provision of lighting.
Figure 5.3: Satisfaction with other features of cycle lanes
7%
7%
7%
5%
2
2
43%
34%
16%
16%
18%
16%
16%
20%
32%
5%
18%
18%
23%
27%
23%
11%
27%
25%
45%
23%
27%
7%
14%
45%
32%
14%
32%
25%
Availability of cycle crossing points
Provision of lighting on cycle lanes
Amount of guard railing
Availability of cycle lanes where needed
Quality of cycle lane repairs
Availability of dropped kerbs
Speed with which defects are repaired
Q. Thinking about the cycle lanes on trunk roads you use most often, overall how satisfied or dissatisfied you are with…?
Base: All who had used cycle lanes (44)
% Very dissatisfied % Don’t know
% Neither/nor
% Fairly dissatisfied
% Very satisfied % Fairly satisfied

Perceptions of the trunk road network in Scotland- Internal / Client Use Only
20
This work was carried out in accordance with the requirements of the international quality standard for Market Research,
ISO 20252:2006.
© 2013 Ipsos MORI.
As Figure 5.4 shows, the comparable results for footways were much more positive. A
majority of users were satisfied with: the availability of footways (68%); the provision of
lighting (67%); the availability of pedestrian crossing points (67%); the amount of railing or
barriers on trunk roads (57%); and the availability of dropped kerbs (55%). However,
reflecting views of the general condition of footway surfaces, perceptions of the speed with
which footway defects were repaired and the quality of repairs were more mixed (34% and
43% respectively were satisfied with these aspects, while 45% and 40% respectively were
dissatisfied).
Figure 5.4: Satisfaction with other features of footways
14%
17%
11%
11%
14%
7%
6%
54%
50%
56%
46%
41%
36%
28%
10%
8%
5%
15%
19%
16%
20%
14%
17%
22%
18%
18%
22%
21%
8%
8%
5%
10%
7%
18%
24%
Availability of dropped kerbs
Provision of lighting on footways
Availability of pedestrian crossing points
Quality of footway repairs
Amount of guard railing
Availability of footways where needed
Speed with which defects are repaired
Q. Thinking about the footways on trunk roads you use most often, overall how satisfied or dissatisfied you are with…?
Base: All who had used footways (173)
% Very dissatisfied % Don’t know
% Neither/nor
% Fairly dissatisfied
% Very satisfied % Fairly satisfied
5.3 Priorities for improving cycle lanes and footways
Those who had used either cycle lanes or footways on the network, or both, were asked to
identify, from a pre-defined list1, what the priorities for improvement should be. As in previous
years, the two most commonly selected areas for improvement were the quality of footway
repairs (28%) and the general condition of footway surfaces (27%) (Table 5.1 below).
1 The list varied depending on whether the respondent had used cycle lanes or footways or both. Those who had
used only cycle lanes were presented with a list comprising cycle lane improvements only, while those who had used only footways were presented with a list comprising exclusively footway improvements. Those who used both were presented with a merged version of these two lists.

Perceptions of the trunk road network in Scotland- Internal / Client Use Only
21
This work was carried out in accordance with the requirements of the international quality standard for Market Research,
ISO 20252:2006.
© 2013 Ipsos MORI.
Table 5.1: Priorities for improving cycle lanes and footways – top ten responses
2009 2010 2011 2012 2013
% % % % %
Quality of footway repairs 17 38 19 20 28
General condition of footway surfaces 25 45 32 30 27
Availability of dropped kerbs - 14 11 15 17
Availability of pedestrian crossing points - 15 14 17 16
Provision of lighting on footways 25 15 12 15 16
Speed with which footways defects are repaired 24 32 18 15 14
Amount of guard railing - 7 8 11 13
Availability of cycle lanes where needed 30 13 8 18 12
General condition of cycle lane surfaces 14 11 12 12 10
Availability of footways where they are needed 23 11 7 6 8
Base: All who had used cycle lanes and/or footways in the last year
101 148 203 200 205
Among cyclists specifically, the top priorities for improvement differed, with 57% of this group
selecting the availability of cycle lanes (57%) (reflecting their dissatisfaction with this aspect)
and 45% selecting the general condition of cycle lane surfaces (45%).

Perceptions of the trunk road network in Scotland- Internal / Client Use Only
22
This work was carried out in accordance with the requirements of the international quality standard for Market Research,
ISO 20252:2006.
© 2013 Ipsos MORI.
6 Improving the trunk road network
6.1 Perceived changes to the trunk road network over past two years
All trunk road users were asked whether specific features of the network had improved,
stayed the same or got worse over the past two years. As Figure 6.1 shows, views were
fairly mixed for the different aspects. A majority of respondents felt that the drainage of water
from surfaces (55%) and the visibility of road markings (53%) had stayed the same in the
past two years, while around two fifths (44%) felt that the frequency with which they had
encountered road works had stayed the same. However, the same proportion (44%) of
respondents felt that this aspect had got worse. Meanwhile, consistent with the high levels of
dissatisfaction with the general condition of road surfaces (reported in Chapter 2), the
majority (60%) of respondents felt that this aspect had got worse in the past two years.
Only one in ten respondents felt that the visibility of road markings, the drainage of water
from the road surfaces, the general condition of road surfaces, and the frequency with which
they encountered road works had got better in the past two years.
Views in respect of winter maintenance were more positive: around a third of respondents
felt that the promptness with which roads were gritted and the promptness with which roads
were cleared had got better in the past two years (32% and 29% respectively), while around
a fifth (23% and 20% respectively) felt that these aspects had got worse. However, as was
the case with most other aspects, the more common view was that these aspects had stayed
the same over the past two years.

Perceptions of the trunk road network in Scotland- Internal / Client Use Only
23
This work was carried out in accordance with the requirements of the international quality standard for Market Research,
ISO 20252:2006.
© 2013 Ipsos MORI.
Figure 6.1: Changes to features of trunk road network over past two years
32%
29%
12%
11%
11%
9%
43%
48%
53%
55%
27%
44%
23%
20%
31%
30%
60%
44%
3%
3%
5%
4%
2%
3%
Drainage of water from road surfaces
Promptness with which roads are cleared in winter
General condition of road surfaces
Visibility of road markings
Promptness with which roads are gritted in winter
Frequency with which you encounter road works
Q. Do you think that each of the following aspects of trunk roads have got better, worse, or stayed the same over the past two years?
Base: All who had used trunk roads in the past year (1,999)
% Don’t know% Got worse% Got better % Stayed the same
As Figure 6.2 shows, and consistent with the significant upturn in satisfaction with winter
maintenance reported in Chapter 2, the proportion of respondents who felt that these aspects
of provision had got better in the past two years once again increased. The results for the
other aspects were unchanged.
Figure 6.2: % saying each feature has “got better” in the past two years, 2009 – 2013
0
10
20
30
40
2009 2010 2011 2012 2013
General condition of road surfaces Drainage of water from road surfaces
Visibility of road markings Frequency with which you encounter roadworks
Promptness with which roads are cleared in winter Promptness with which roads are gritted in winter
12%
29%
% g
ot b
ett
er
Base: All who used trunk roads in the past year (2013: 1,999; 2012: 2,001; 2011: 2,017;
2010: 2,009; 2009: 1,861)
11%11%
9%
32%
As was the case in 2011 and 2012, respondents in the South West were more likely than the
sample as a whole to say that the general condition of road surfaces and the visibility of road
markings had got worse in the past two years (67% compared with 60% and 36% compared

Perceptions of the trunk road network in Scotland- Internal / Client Use Only
24
This work was carried out in accordance with the requirements of the international quality standard for Market Research,
ISO 20252:2006.
© 2013 Ipsos MORI.
with 31%, respectively). (This is consistent with the lower than average levels of satisfaction
with these two aspects among respondents in this region, highlighted in Chapter 2).
6.2 Future improvements to the trunk road network
In order to elicit respondents’ overall priorities for the network, they were presented with a list
of all the priorities they had identified over the course of the survey2 and asked to select from
this list the two or three improvements they would most like to see made. As Table 6.1
shows, the key priorities for improvement again related to trunk road surfaces: the general
condition of road surfaces (44%); the quality of repairs (37%); and the speed with which road
defects are repaired (37%). Other aspects were selected by fewer than half as many
respondents.
Table 6.1: Overall priorities for improving the trunk road network – top 10 mentions, 2009 – 2013
2009 2010 2011 2012 2013
% % % % %
The general condition of road surfaces 32 36 45 43 44
The quality of repairs 20 27 35 33 37
The speed with which road defects are repaired 21 32 38 34 37
The promptness with which roads are gritted in winter
13 22 23 15 16
The amount of traffic congestion 17 17 12 13 13
The promptness with which roads are cleared in winter
8 17 25 14 12
The visibility of road markings 8 9 8 10 11
The drainage of water from road surfaces 9 7 11 10 10
The provision of lighting along roads 10 6 5 8 7
The frequency with which you encounter road works
12 12 9 7 7
Base: All who had used trunk roads at some point in the last year
2,043 2,009 2,017 2,001 1,999
In addition to the priorities identified in Table 6.1, respondents were presented with some
other areas for improvement which Transport Scotland could focus on (Table 6.2) and asked
2 That is priorities they identified in relation to: features of trunk roads; road works and winter maintenance;
lighting, markings and signage; and, where applicable, cycle lanes and footways
Perceptions of the trunk road network in Scotland- Internal / Client Use Only
25
This work was carried out in accordance with the requirements of the international quality standard for Market Research,
ISO 20252:2006.
© 2013 Ipsos MORI.
how important they perceived each of these to be on a scale of 1 to 10, with 10 indicating
“absolutely essential” and 1 indicating “not all essential”.
Table 6.2 shows the mean scores for each potential area of improvement and compares
these with the scores recorded in 2011. The relative importance assigned to the three areas
was the same as in the earlier survey, with the ‘look’ of the overall network (in terms of
verges, roads, bridges and signs etc.) emerging as the highest priority (with a mean score of
6.89), followed by the quietness of road surfaces to travel on (6.26). Lowest importance was
attached to the provision of information on how noise and emissions can be minimised
(5.19).
The absolute level of importance attached to the ‘look’ of the overall network was slightly
higher than in 20113. This notwithstanding, the mean scores for all potential areas of
improvement were, again, just above the mid-point of the scale (between 5 and 7) which
indicates that none of the options were considered ‘essential’.
Table 6.2: Importance ratings for other potential areas for improvement, 2011 compared with 2013
2011 2013
Mean score Mean score
The overall network should look good 6.67 6.89
The road surface should be quiet to travel on 6.24 6.26
Information should be provided on how people can minimise their noise and air emissions when using the trunk roads
5.27 5.19
Base: All who had used trunk roads at some point in the last year
2,017 1,999
Respondents in the North East attached higher importance than those in other areas to the
‘look’ of the overall network (a mean score of 7.19 compared with 6.89 overall). At the same
time, those in the South West were much more likely than those in other areas to attach
importance to the provision of information on minimising noise and air emissions (5.74
compared with 5.19 overall).
3 The question was not asked in the 2012 survey.
Perceptions of the trunk road network in Scotland- Internal / Client Use Only
26
This work was carried out in accordance with the requirements of the international quality standard for Market Research,
ISO 20252:2006.
© 2013 Ipsos MORI.
7 Disruption due to weather
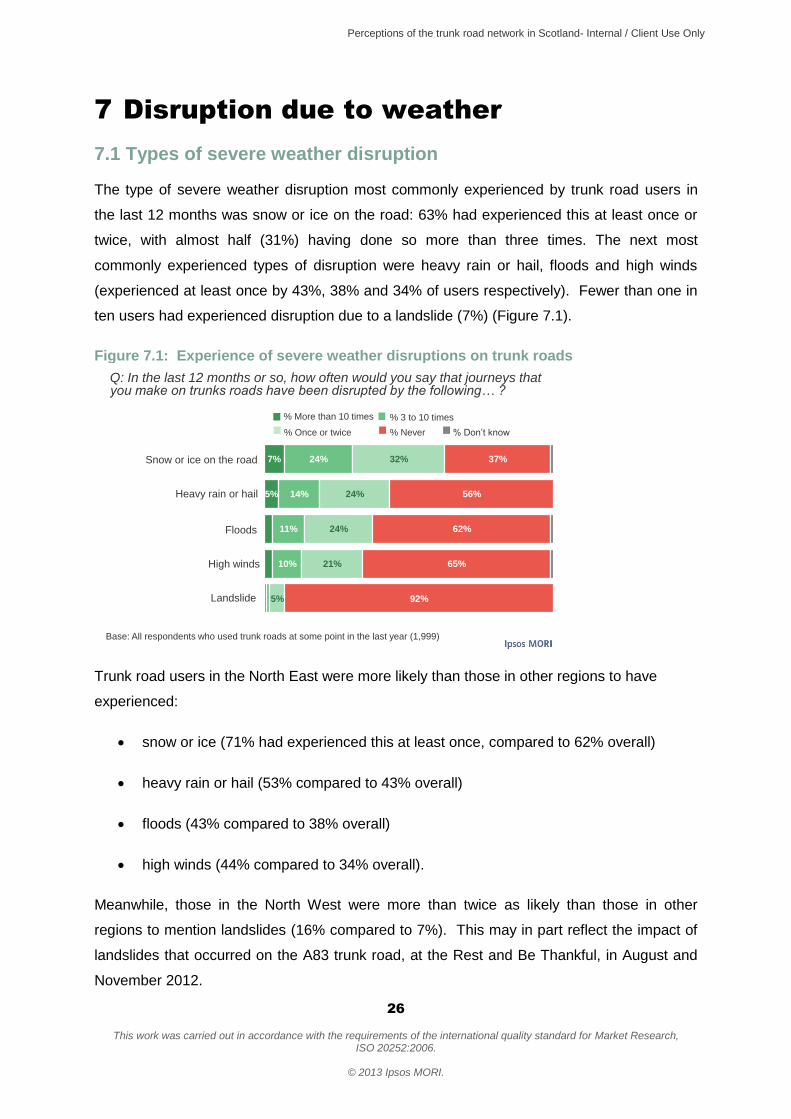
7.1 Types of severe weather disruption
The type of severe weather disruption most commonly experienced by trunk road users in
the last 12 months was snow or ice on the road: 63% had experienced this at least once or
twice, with almost half (31%) having done so more than three times. The next most
commonly experienced types of disruption were heavy rain or hail, floods and high winds
(experienced at least once by 43%, 38% and 34% of users respectively). Fewer than one in
ten users had experienced disruption due to a landslide (7%) (Figure 7.1).
Figure 7.1: Experience of severe weather disruptions on trunk roads
7%
5%
24%
14%
11%
10%
32%
24%
24%
21%
5%
37%
56%
62%
65%
92%
High winds
Heavy rain or hail
Floods
Landslide
Snow or ice on the road
Q: In the last 12 months or so, how often would you say that journeys that you make on trunks roads have been disrupted by the following… ?
Base: All respondents who used trunk roads at some point in the last year (1,999)
% Once or twice % Never
% More than 10 times % 3 to 10 times
% Don’t know
Trunk road users in the North East were more likely than those in other regions to have
experienced:
snow or ice (71% had experienced this at least once, compared to 62% overall)
heavy rain or hail (53% compared to 43% overall)
floods (43% compared to 38% overall)
high winds (44% compared to 34% overall).
Meanwhile, those in the North West were more than twice as likely than those in other
regions to mention landslides (16% compared to 7%). This may in part reflect the impact of
landslides that occurred on the A83 trunk road, at the Rest and Be Thankful, in August and
November 2012.

Perceptions of the trunk road network in Scotland- Internal / Client Use Only
27
This work was carried out in accordance with the requirements of the international quality standard for Market Research,
ISO 20252:2006.
© 2013 Ipsos MORI.
Figure 7.2 shows the most common, specific ways in which respondents’ journeys had been
affected by severe weather. Three in ten respondents said that their journey was delayed by
up to 30 minutes, while similar proportions said they had had to use an alternative route or
cancel their journey completely. Fifteen percent said that their journey had been delayed for
between 30 minutes and an hour, and 11% said it was delayed for longer than this.
Figure 7.2: Journeys affected by severe weather
30%
27%
23%
15%
11%
6%
2%
%
Journey completed with a delay of 1 to 3 hours
Journey completed with delay of 30 minutes to an hour
I had to cancel my journey
I had to use an alternative route
I had to use an alternative mode of transport
Journey completed with a delay of over 3 hours
Journey completed with delay of less than 30 minutes
Q. Thinking back to the last time your journey was disrupted as a result of [severe weather conditions], in which of these ways were you affected?
Base: All who had experienced disruption to at least one journey in the past year as a result of
severe weather (1,471)
Those in the North West were more likely than average to have had to cancel a journey (32%
compared to 23% overall), while those in the South West were more likely to have had to use
an alternative route (36% compared to 27%).
7.2 Warnings and information about the condition of trunk roads during severe weather All respondents were asked to report how satisfied they were with the accuracy and
availability of warnings and information about the condition of trunk roads before, during and
after severe weather. Overall, three in five (59%) respondents were satisfied with the
accuracy of warnings and information before severe weather and with the availability of up to
date information during severe weather (60%). A slightly smaller proportion (52%) were
satisfied with the availability of information after severe weather (Figure 7.3).

Perceptions of the trunk road network in Scotland- Internal / Client Use Only
28
This work was carried out in accordance with the requirements of the international quality standard for Market Research,
ISO 20252:2006.
© 2013 Ipsos MORI.
Figure 7.3: Accuracy and availability of warnings and information during severe weather
8%
8%
6%
51%
52%
46%
17%
17%
23%
15%
15%
16%
4
3
3
4
5
6
Accuracy of warnings and information about the likely
condition of trunk roads beforesevere weather
Q. How satisfied or dissatisfied are you with the…?
Base: All who had used trunk roads in the past year (1,999)
% Very dissatisfied % Don’t know/NA
% Neither/nor
% Fairly dissatisfied
% Very satisfied % Fairly satisfied
Availability of up to date information on the condition of
trunk roads during severe weather
Availability of information on the condition of trunk roads after
severe weather
Trunk road users in the North West were more likely than average to be satisfied with the
accuracy of warnings and information before severe weather (68% compared to 59% overall)
and with the availability of up to date information during severe weather (71% compared to
60%).
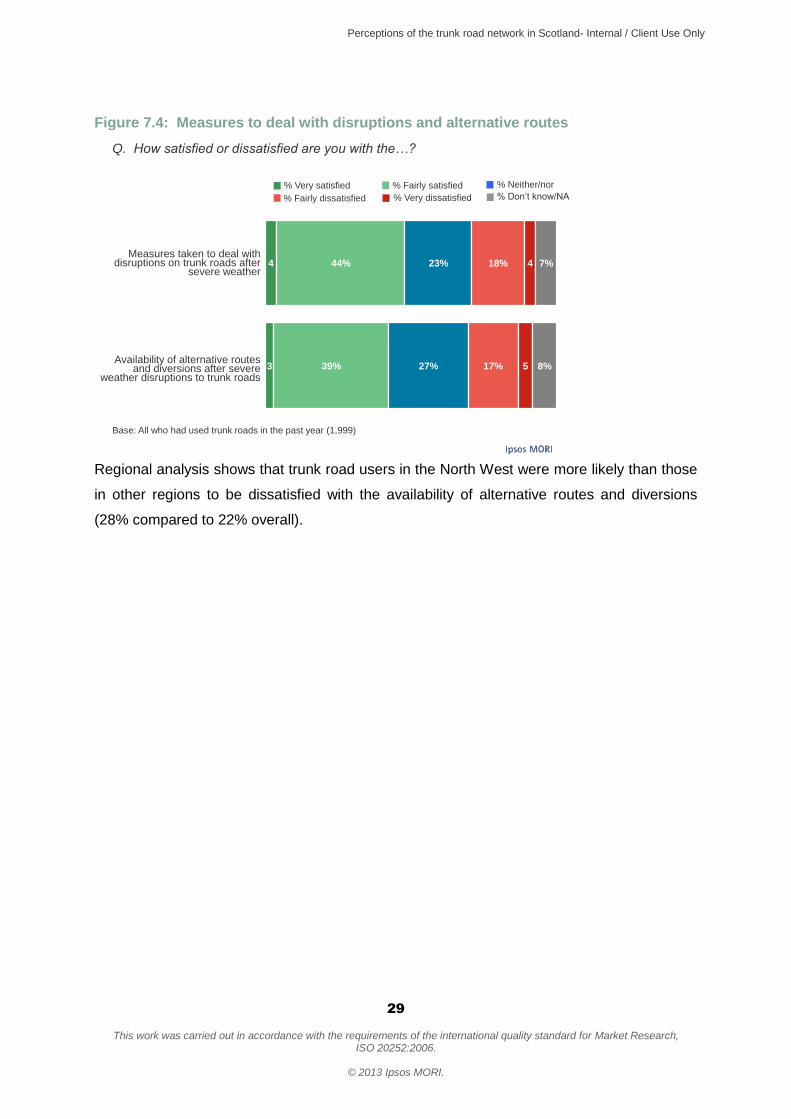
7.3 Measures to deal with disruptions due to severe weather Around half of trunk road users were satisfied with measures taken to deal with disruptions
on trunk roads after severe weather (48%) and around two in five (42%) were satisfied with
the availability of alternative routes and diversions. In each case, around one in five were
dissatisfied, while similar proportions were neutral in their opinion (Figure 7.4).
Perceptions of the trunk road network in Scotland- Internal / Client Use Only
29
This work was carried out in accordance with the requirements of the international quality standard for Market Research,
ISO 20252:2006.
© 2013 Ipsos MORI.
Figure 7.4: Measures to deal with disruptions and alternative routes
4
3
44%
39%
23%
27%
18%
17%
4
5
7%
8%
Measures taken to deal with disruptions on trunk roads after
severe weather
Q. How satisfied or dissatisfied are you with the…?
Base: All who had used trunk roads in the past year (1,999)
% Very dissatisfied % Don’t know/NA
% Neither/nor
% Fairly dissatisfied
% Very satisfied % Fairly satisfied
Availability of alternative routes and diversions after severe
weather disruptions to trunk roads
Regional analysis shows that trunk road users in the North West were more likely than those
in other regions to be dissatisfied with the availability of alternative routes and diversions
(28% compared to 22% overall).
Perceptions of the trunk road network in Scotland- Internal / Client Use Only
30
This work was carried out in accordance with the requirements of the international quality standard for Market Research,
ISO 20252:2006.
© 2013 Ipsos MORI.
8 Information about the trunk road
network
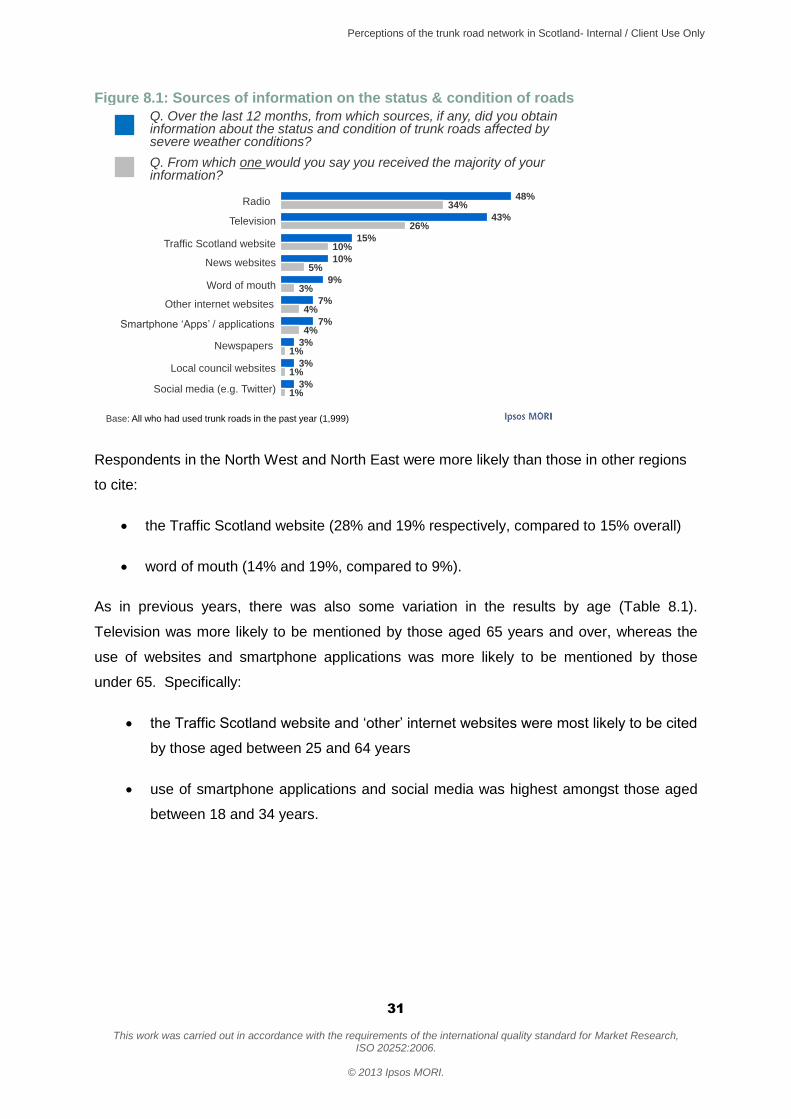
8.1 Sources of information on the status & condition of roads during severe weather conditions Radio and television were found to be the most common sources of information about the
status and condition of roads affected by severe weather conditions, mentioned by 48% and
43% of respondents respectively. The next most common sources were the Traffic Scotland
website (15%), news websites (10%) and word of mouth (9%). Social media (such as
Facebook and Twitter) was included as a response option for the first time this year and was
mentioned by 3% of respondents (Figure 8.1).
Changes to the question wording preclude direct comparison of these results with those from
previous waves. Still, it can be said that the two sets of findings are broadly consistent
notwithstanding an apparent increase since 2012 in the proportion of respondents citing the
use of Smartphone applications (from 2% to 7% 2012).4
4 In 2010, 2011 and 2012 respondents were asked to choose the sources of information they used “during the
cold spells we had over last winter…” This year they were asked to choose the sources of information they used
to obtain information “about trunk roads affected by severe weather” and then where they had looked for
information/would prefer to look for information about winter maintenance (see section 8.2 for the findings relating
to winter maintenance).
Perceptions of the trunk road network in Scotland- Internal / Client Use Only
31
This work was carried out in accordance with the requirements of the international quality standard for Market Research,
ISO 20252:2006.
© 2013 Ipsos MORI.
Figure 8.1: Sources of information on the status & condition of roads
48%
43%
15%
10%
9%
7%
7%
3%
3%
3%
34%
26%
10%
5%
3%
4%
4%
1%
1%
1%Social media (e.g. Twitter)
Television
Traffic Scotland website
News websites
Other internet websites
Smartphone ‘Apps’ / applications
Local council websites
Radio
Q. Over the last 12 months, from which sources, if any, did you obtain information about the status and condition of trunk roads affected by severe weather conditions?
Q. From which one would you say you received the majority of your information?
Base: All who had used trunk roads in the past year (1,999)
Word of mouth
Newspapers
Respondents in the North West and North East were more likely than those in other regions
to cite:
the Traffic Scotland website (28% and 19% respectively, compared to 15% overall)
word of mouth (14% and 19%, compared to 9%).
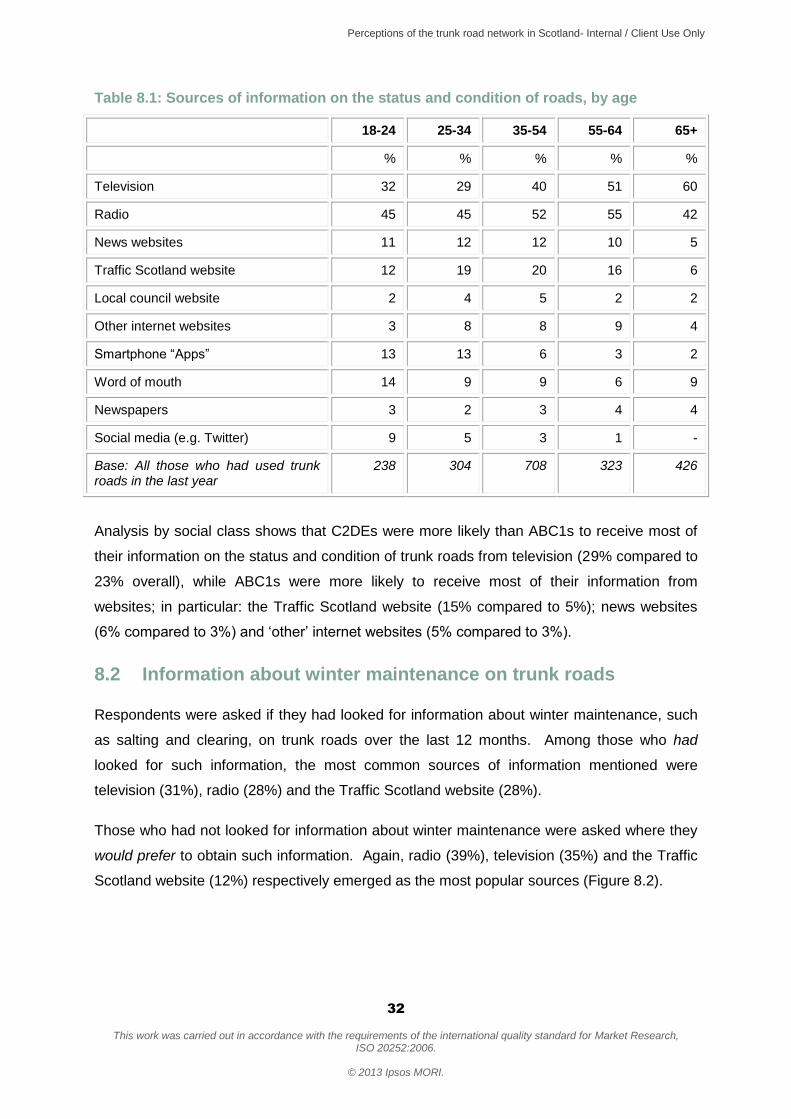
As in previous years, there was also some variation in the results by age (Table 8.1).
Television was more likely to be mentioned by those aged 65 years and over, whereas the
use of websites and smartphone applications was more likely to be mentioned by those
under 65. Specifically:
the Traffic Scotland website and ‘other’ internet websites were most likely to be cited
by those aged between 25 and 64 years
use of smartphone applications and social media was highest amongst those aged
between 18 and 34 years.
Perceptions of the trunk road network in Scotland- Internal / Client Use Only
32
This work was carried out in accordance with the requirements of the international quality standard for Market Research,
ISO 20252:2006.
© 2013 Ipsos MORI.
Table 8.1: Sources of information on the status and condition of roads, by age
18-24 25-34 35-54 55-64 65+
% % % % %
Television 32 29 40 51 60
Radio 45 45 52 55 42
News websites 11 12 12 10 5
Traffic Scotland website 12 19 20 16 6
Local council website 2 4 5 2 2
Other internet websites 3 8 8 9 4
Smartphone “Apps” 13 13 6 3 2
Word of mouth 14 9 9 6 9
Newspapers 3 2 3 4 4
Social media (e.g. Twitter) 9 5 3 1 -
Base: All those who had used trunk roads in the last year
238 304 708 323 426
Analysis by social class shows that C2DEs were more likely than ABC1s to receive most of
their information on the status and condition of trunk roads from television (29% compared to
23% overall), while ABC1s were more likely to receive most of their information from
websites; in particular: the Traffic Scotland website (15% compared to 5%); news websites
(6% compared to 3%) and ‘other’ internet websites (5% compared to 3%).
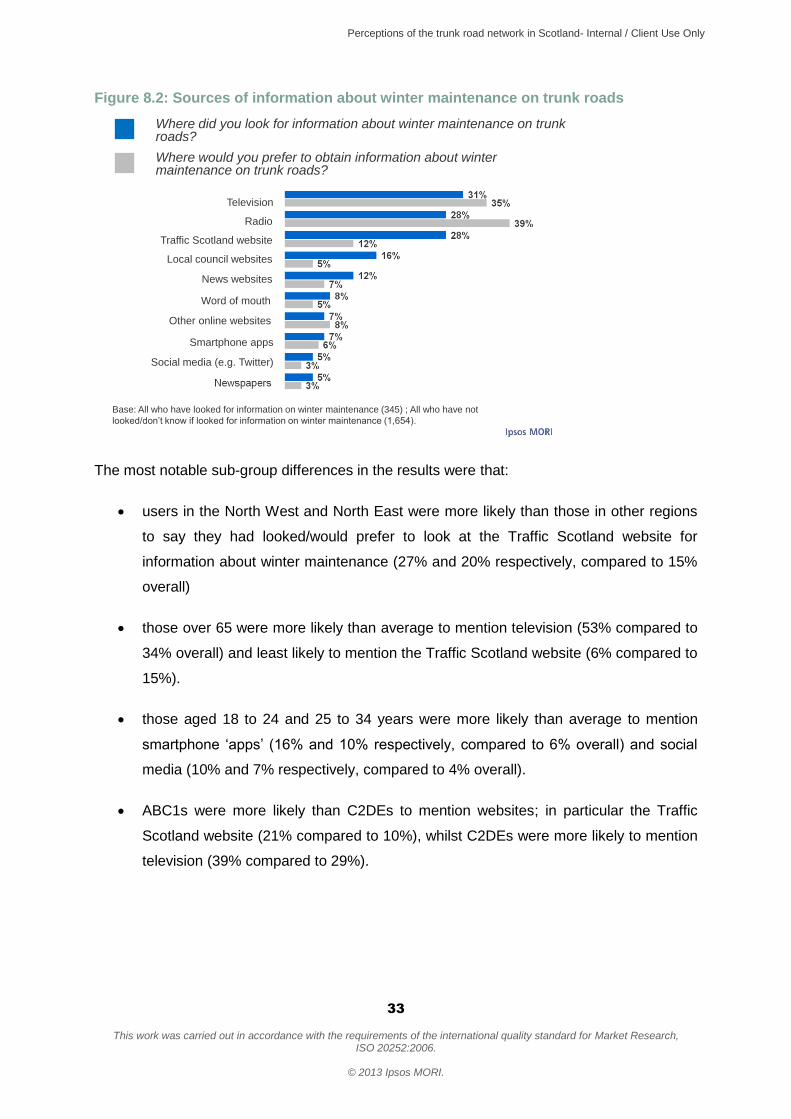
8.2 Information about winter maintenance on trunk roads Respondents were asked if they had looked for information about winter maintenance, such
as salting and clearing, on trunk roads over the last 12 months. Among those who had
looked for such information, the most common sources of information mentioned were
television (31%), radio (28%) and the Traffic Scotland website (28%).
Those who had not looked for information about winter maintenance were asked where they
would prefer to obtain such information. Again, radio (39%), television (35%) and the Traffic
Scotland website (12%) respectively emerged as the most popular sources (Figure 8.2).
Perceptions of the trunk road network in Scotland- Internal / Client Use Only
33
This work was carried out in accordance with the requirements of the international quality standard for Market Research,
ISO 20252:2006.
© 2013 Ipsos MORI.
Figure 8.2: Sources of information about winter maintenance on trunk roads
Radio
Traffic Scotland website
Local council websites
Word of mouth
Other online websites
Social media (e.g. Twitter)
Television
Where did you look for information about winter maintenance on trunk roads?
Where would you prefer to obtain information about winter maintenance on trunk roads?
Base: All who have looked for information on winter maintenance (345) ; All who have not
looked/don’t know if looked for information on winter maintenance (1,654).
News websites
Smartphone apps
The most notable sub-group differences in the results were that:
users in the North West and North East were more likely than those in other regions
to say they had looked/would prefer to look at the Traffic Scotland website for
information about winter maintenance (27% and 20% respectively, compared to 15%
overall)
those over 65 were more likely than average to mention television (53% compared to
34% overall) and least likely to mention the Traffic Scotland website (6% compared to
15%).
those aged 18 to 24 and 25 to 34 years were more likely than average to mention
smartphone ‘apps’ (16% and 10% respectively, compared to 6% overall) and social
media (10% and 7% respectively, compared to 4% overall).
ABC1s were more likely than C2DEs to mention websites; in particular the Traffic
Scotland website (21% compared to 10%), whilst C2DEs were more likely to mention
television (39% compared to 29%).
Perceptions of the trunk road network in Scotland- Internal / Client Use Only
34
This work was carried out in accordance with the requirements of the international quality standard for Market Research,
ISO 20252:2006.
© 2013 Ipsos MORI.
8.3 Information provided by Traffic Scotland
8.3.1 Use of digital sources of information provided by Traffic Scotland
The proportion of all respondents (with internet access) who had viewed the Traffic Scotland
website has remained stable since 2012 (35%), despite increasing gradually over previous
waves of the survey. The most regular users of the site were:
men (38% compared to 33% of women)
respondents aged between 25 and 64 years (38% of 25 to 34 year olds; 40% of 35 to
54 year olds; 40% of 55 to 64 year olds compared to 24% of 18 to 24 year olds and
26% of those aged 65 and over)
trunk roads users in the North West and North East regions (45% and 40%
respectively, compared to 35% overall)
ABC1 respondents (44% compared to 25% C2DEs).
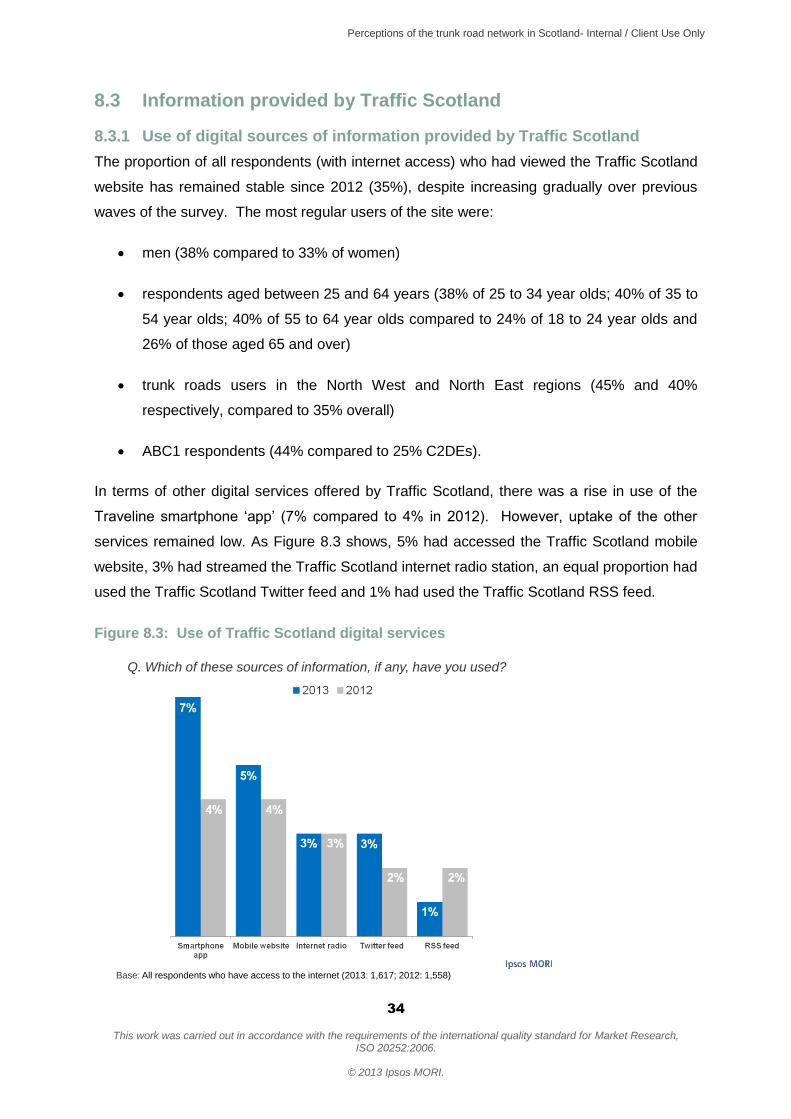
In terms of other digital services offered by Traffic Scotland, there was a rise in use of the
Traveline smartphone ‘app’ (7% compared to 4% in 2012). However, uptake of the other
services remained low. As Figure 8.3 shows, 5% had accessed the Traffic Scotland mobile
website, 3% had streamed the Traffic Scotland internet radio station, an equal proportion had
used the Traffic Scotland Twitter feed and 1% had used the Traffic Scotland RSS feed.
Figure 8.3: Use of Traffic Scotland digital services
Q. Which of these sources of information, if any, have you used?
Base: All respondents who have access to the internet (2013: 1,617; 2012: 1,558)
Perceptions of the trunk road network in Scotland- Internal / Client Use Only
35
This work was carried out in accordance with the requirements of the international quality standard for Market Research,
ISO 20252:2006.
© 2013 Ipsos MORI.
8.3.2 Perceptions of the Traffic Scotland website
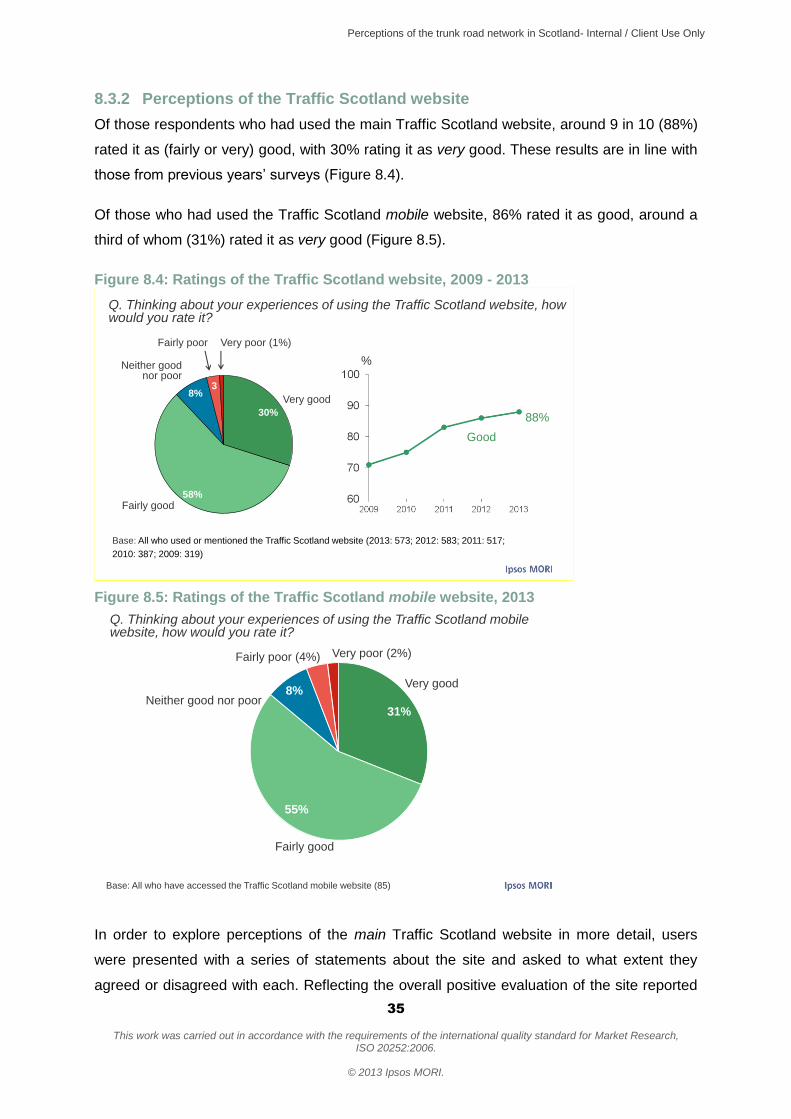
Of those respondents who had used the main Traffic Scotland website, around 9 in 10 (88%)
rated it as (fairly or very) good, with 30% rating it as very good. These results are in line with
those from previous years’ surveys (Figure 8.4).
Of those who had used the Traffic Scotland mobile website, 86% rated it as good, around a
third of whom (31%) rated it as very good (Figure 8.5).
Figure 8.4: Ratings of the Traffic Scotland website, 2009 - 2013
30%
58%
8%3
Fairly good
Very poor (1%)
Good
%
88%
Very good
Standard Life Favourability – Trends
Neither good nor poor
Q. Thinking about your experiences of using the Traffic Scotland website, how would you rate it?
Base: All who used or mentioned the Traffic Scotland website (2013: 573; 2012: 583; 2011: 517;
2010: 387; 2009: 319)
Fairly poor
Figure 8.5: Ratings of the Traffic Scotland mobile website, 2013
31%
55%
8%
Very poor (2%)
Very good
Fairly good
Base: All who have accessed the Traffic Scotland mobile website (85)
Q. Thinking about your experiences of using the Traffic Scotland mobile website, how would you rate it?
Neither good nor poor
Fairly poor (4%)
In order to explore perceptions of the main Traffic Scotland website in more detail, users
were presented with a series of statements about the site and asked to what extent they
agreed or disagreed with each. Reflecting the overall positive evaluation of the site reported
Perceptions of the trunk road network in Scotland- Internal / Client Use Only
36
This work was carried out in accordance with the requirements of the international quality standard for Market Research,
ISO 20252:2006.
© 2013 Ipsos MORI.
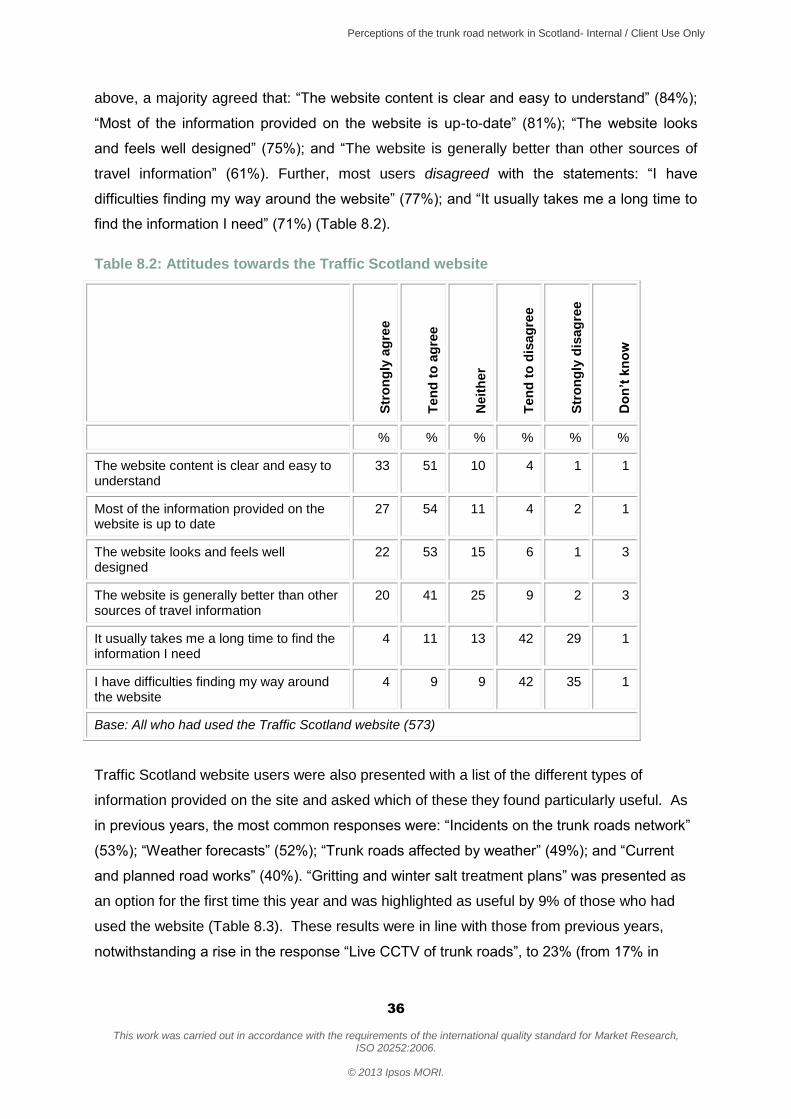
above, a majority agreed that: “The website content is clear and easy to understand” (84%);
“Most of the information provided on the website is up-to-date” (81%); “The website looks
and feels well designed” (75%); and “The website is generally better than other sources of
travel information” (61%). Further, most users disagreed with the statements: “I have
difficulties finding my way around the website” (77%); and “It usually takes me a long time to
find the information I need” (71%) (Table 8.2).
Table 8.2: Attitudes towards the Traffic Scotland website
Str
on
gly
ag
ree
Ten
d t
o a
gre
e
Neit
her
Ten
d t
o d
isag
ree
Str
on
gly
dis
ag
ree
Do
n’t
kn
ow
% % % % % %
The website content is clear and easy to understand
33 51 10 4 1 1
Most of the information provided on the website is up to date
27 54 11 4 2 1
The website looks and feels well designed
22 53 15 6 1 3
The website is generally better than other sources of travel information
20 41 25 9 2 3
It usually takes me a long time to find the information I need
4 11 13 42 29 1
I have difficulties finding my way around the website
4 9 9 42 35 1
Base: All who had used the Traffic Scotland website (573)
Traffic Scotland website users were also presented with a list of the different types of
information provided on the site and asked which of these they found particularly useful. As
in previous years, the most common responses were: “Incidents on the trunk roads network”
(53%); “Weather forecasts” (52%); “Trunk roads affected by weather” (49%); and “Current
and planned road works” (40%). “Gritting and winter salt treatment plans” was presented as
an option for the first time this year and was highlighted as useful by 9% of those who had
used the website (Table 8.3). These results were in line with those from previous years,
notwithstanding a rise in the response “Live CCTV of trunk roads”, to 23% (from 17% in

Perceptions of the trunk road network in Scotland- Internal / Client Use Only
37
This work was carried out in accordance with the requirements of the international quality standard for Market Research,
ISO 20252:2006.
© 2013 Ipsos MORI.
2012), a level consistent with the comparable results from 2010 and 2011 (24% and 22%
respectively).
Table 8.3: Perceptions of information available on Traffic Scotland website, 2010 – 2013
2010 2011 2012 2013
% % % %
Incidents on the trunk road network 49 54 56 53
Weather forecasts 35 51 53 52
Trunk roads affected by weather 45 57 49 49
Current and planned road works 51 45 42 40
Live CCTV of trunk roads 24 22 17 23
Journey times between different destinations 16 16 17 19
Planned events N/A N/A 10 10
Gritting and winter salt treatment plans N/A N/A N/A 9
Electronic message boards 7 6 6 4
Park and ride facilities 2 3 2 2
Base: All who had used the Traffic Scotland site 387 517 583 573
All respondents who had used the Traffic Scotland website were also asked, unprompted, if
there were any other types of information that could usefully be provided through the site. Of
the 573 respondents asked, 106 provided suggestions, with the most common emerging
themes being:
more detailed and up to date information about proposed upcoming and current road
works and road closures
more CCTV cameras on trunk roads
more regular website updates and real time information on the condition and status of
trunk roads
additional information to aid the planning of journeys; such as the provision of
alternative routes, live journey times and a journey planner on the smartphone app.
Other suggestions included the availability of local weather conditions and weather warnings
and the provision of more detailed local information on the condition and status of trunk and
non-trunk roads.
Perceptions of the trunk road network in Scotland- Internal / Client Use Only
38
This work was carried out in accordance with the requirements of the international quality standard for Market Research,
ISO 20252:2006.
© 2013 Ipsos MORI.
9 Tyres
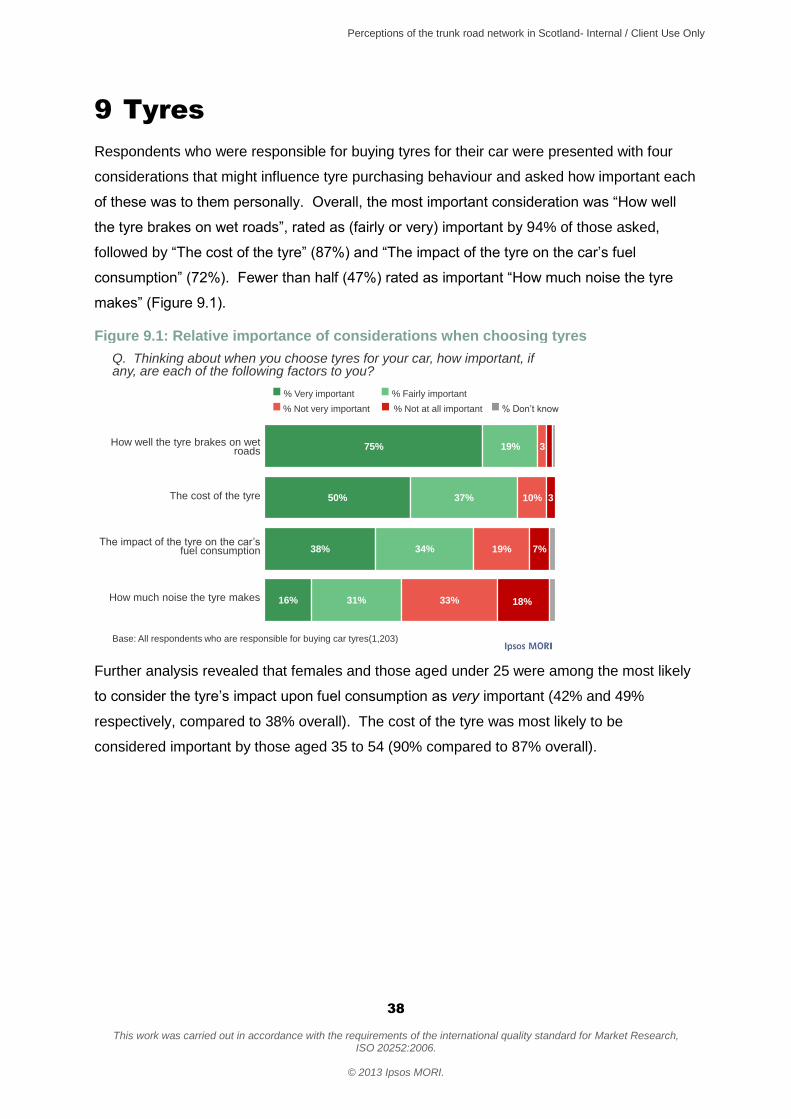
Respondents who were responsible for buying tyres for their car were presented with four
considerations that might influence tyre purchasing behaviour and asked how important each
of these was to them personally. Overall, the most important consideration was “How well
the tyre brakes on wet roads”, rated as (fairly or very) important by 94% of those asked,
followed by “The cost of the tyre” (87%) and “The impact of the tyre on the car’s fuel
consumption” (72%). Fewer than half (47%) rated as important “How much noise the tyre
makes” (Figure 9.1).
Figure 9.1: Relative importance of considerations when choosing tyres
75%
50%
38%
16%
19%
37%
34%
31%
3
10%
19%
33%
3
7%
18%
% Not at all important
How much noise the tyre makes
How well the tyre brakes on wet roads
Q. Thinking about when you choose tyres for your car, how important, if any, are each of the following factors to you?
Base: All respondents who are responsible for buying car tyres(1,203)
% Don’t know% Not very important
% Very important % Fairly important
The cost of the tyre
The impact of the tyre on the car’s fuel consumption
Further analysis revealed that females and those aged under 25 were among the most likely
to consider the tyre’s impact upon fuel consumption as very important (42% and 49%
respectively, compared to 38% overall). The cost of the tyre was most likely to be
considered important by those aged 35 to 54 (90% compared to 87% overall).

Perceptions of the trunk road network in Scotland- Internal / Client Use Only
39
This work was carried out in accordance with the requirements of the international quality standard for Market Research,
ISO 20252:2006.
© 2013 Ipsos MORI.
10 Appendix A: Survey questionnaire
INTRODUCTION
Good morning/afternoon/evening. My name is …… from Ipsos MORI, the research organisation, and we are carrying out a survey about aspects of life in Scotland. The interview will take about 20 minutes.
I would like to assure you that all the information we collect will be kept in the strictest confidence, and used for research purposes only. It will not be possible to identify any particular individual or address in the results.
PRESENT RESPONDENT WITH MAP OF TRUNK ROAD NETWORK
This is a map of Scotland’s trunk road network. Trunk roads include motorways and A roads.
ASK ALL Q1. How often have you travelled on a trunk road in Scotland in the last 12 months,
either as a passenger or a driver? SINGLE CODE
5 or more days a week 1
2-4 days a week 2
Once a week 3
Less than once a week but more than once a month
4
Once a month 5
Less than once a month 6
Never 7
Don’t know 8
ASK ALL WHO USE TRUNK ROADS AT SOME POINT (CODES 1-6) AT Q1. OTHERS GO TO SCREEN SHOWING:
In that case, you are not eligible to take part in the survey. However, thank you for your time.
THEN CLOSE SURVEY
SHOWCARD A Q2. In which of these ways do you travel on the trunk roads? Please read out the letters that apply. MULTICODE OK
A As a driver of a car/van 1
B As a passenger in a car/van 2
C As a driver of a goods vehicle, bus or coach
3
D As a passenger in a bus or coach
4
E As a motorcyclist 5
F As a cyclist 6
G Walking on footways alongside trunk roads
7
Other (PLEASE WRITE IN AND CODE ‘8 ‘)
8
Don’t know 9
Perceptions of the trunk road network in Scotland- Internal / Client Use Only
40
This work was carried out in accordance with the requirements of the international quality standard for Market Research,
ISO 20252:2006.
© 2013 Ipsos MORI.
ASK ALL WHO SAY THEY DRIVE ON THE TRUNK ROAD NETWORK AT Q2 (CODES 1 OR 3) AND WHO SAY THEY USE THE TRUNK ROAD NETWORK AT LEAST ONCE A WEEK AT Q1 (CODES 1, 2 OR 3) OTHERS GO TO Q4 Q3. You mentioned that you drove on the trunk road network. In an average week, how
many miles do you cover by driving on the trunk road network? READ OUT a) – c) SINGLE CODE
a) Less than 25 miles 1
b) Between 25 and 100 miles 2
c) Over 100 miles 3
Don’t know 4
ASK ALL SHOW MAP AGAIN Q4. Within which of these regions do you use trunk roads most
often? SINGLE CODE
North West 1
North East 2
South West 3
South East 4
Don’t know 5
ASK ALL WHO MENTION A REGION (CODES 1-4) AT Q4 OTHERS GO TO PREABLE BEFORE QTS5 SHOW MAP AGAIN Q5. And on which of the specific trunk roads within this
region do you most frequently travel? PROBE FULLY AND WRITE IN.
ANY ANSWER (WRITE IN AND CODE '1) 1
Don't know X
ASK ALL FOR THOSE WHO CODE DON’T KNOW (CODE 5) AT QTS3, OR WHO CODE DON’T KNOW (CODE 3) AT Q5 READ OUT: For the remaining questions, I’d like you to focus on the trunk roads in Scotland you use most often.
FOR ALL OTHERS READ OUT: For the remaining questions, I’d like you to focus on these trunk roads in Scotland you use most often.
Q6. Do you mainly travel on these roads.. READ OUT a) – c) SINGLE CODE
a) During rush hours (7am-9am and/or 4pm to 7pm)
1
b) During off peak hours (9am to 4pm and/or 7pm to 7am)
2
c) During both periods 3
Other 4
Don’t know 5
Perceptions of the trunk road network in Scotland- Internal / Client Use Only
41
This work was carried out in accordance with the requirements of the international quality standard for Market Research,
ISO 20252:2006.
© 2013 Ipsos MORI.
SHOWCARD B Q7. I’m now going to read out a number of aspects of the general state and condition of trunk roads and I’d like you to tell me how satisfied or dissatisfied you are with each. READ OUT a) – g) SINGLE CODE EACH ROW RANDOMISE ORDER
Very
Satisfie
d
Fairly
Satisfie
d
Neither
satisfie
d
nor
dis
satisfied
Fairly
dis
satisfied
Very
dis
satisfied
Don’t k
now
N/A
a) The general condition of road surfaces
1 2 3 4 5 6 7
b) The management of vegetation on verges and central reserves
1 2 3 4 5 6 7
c) The amount of litter and debris on the road surface
1 2 3 4 5 6 7
d) The speed with which road defects such as potholes are
repaired
1 2 3 4 5 6 7
e) The quality of repairs 1 2 3 4 5 6 7
f) The drainage of water from road surfaces
1 2 3 4 5 6 7
g) The amount of traffic congestion 1 2 3 4 5 6 7
SHOWCARD C Q8. Here is a list of the things we just talked about. From this list, which 2 or 3 would you most like to see improved? MULTICODE UP TO 3 ONLY
The general condition of road surfaces
1
The management of vegetation on verges and central reserves
2
The amount of litter and debris on the road surface
3
The speed with which road defects such as potholes are
repaired
4
The quality of repairs 5
The drainage of water from road surfaces
6
The amount of traffic congestion 7
Other write in 8
None of these 9
Don’t know 10
Perceptions of the trunk road network in Scotland- Internal / Client Use Only
42
This work was carried out in accordance with the requirements of the international quality standard for Market Research,
ISO 20252:2006.
© 2013 Ipsos MORI.
SHOWCARD D Q9. For the next few questions I’d like you to think about road works and the maintenance of trunk roads. Still thinking about the trunk roads that you use most often, how satisfied or dissatisfied are you with the…. READ OUT a) – h) SINGLE CODE EACH ROW RANDOMISE ORDER
Very
Satisfie
d
Fairly
Satisfie
d
Neither
satisfie
d
nor
dis
satisfied
Fairly
dis
satisfied
Very
dis
satisfied
Don’t k
now
N/A
a) Frequency with which you encounter road works 1 2 3 4 5 6 7
b) Planning and coordination of diversions when road works take place
1 2 3 4 5 6 7
c) Planning and coordination of lane closures and restrictions when road works take place
1 2 3 4 5 6 7
d) Frequency of day time lane closures for road works
1 2 3 4 5 6 7
e) Frequency of night time lane closures for road works
1 2 3 4 5 6 7
f) Amount of information available on possible delays to journey times because of road works
that are taking place
1 2 3 4 5 6 7
g) Promptness with which roads are cleared in the winter
1 2 3 4 5 6 7
h) Promptness with which roads are gritted in winter
1 2 3 4 5 6 7
SHOWCARD E Q10. Here is a list of the things we just talked about. From this list, which 2 or 3 would you most like to see improved? MULTICODE UP TO 3 ONLY
The frequency with which you encounter road works
1
The planning and coordination of diversions when road works take
place
2
The planning and coordination of lane closures and restrictions when road works take place
3
Frequency of day time lane closures for road works
4
Frequency of night time lane closures for road works
5
Amount of information available on possible delays to journey
times because of road works that are taking place
6
The promptness with which roads are cleared in the winter
7
The promptness with which roads are gritted in winter
8
Other write in 9
None of these 10
Don’t know 11

Perceptions of the trunk road network in Scotland- Internal / Client Use Only
43
This work was carried out in accordance with the requirements of the international quality standard for Market Research,
ISO 20252:2006.
© 2013 Ipsos MORI.
SHOWCARD F Q11. We are also interested in your opinions of some other aspects of trunk roads. Again, thinking about the trunk roads you use most often how satisfied or dissatisfied are you with the… READ OUT a) – e) SINGLE CODE EACH ROW RANDOMISE ORDER
Very
Satisfie
d
Fairly
Satisfie
d
Neither
satisfie
d
Nor
dis
satisfied
Fairly
dis
satisfied
Very
dis
satisfied
Don’t k
now
N/A
a) Provision of lighting along roads 1 2 3 4 5 6 7
b) Visibility of road markings 1 2 3 4 5 6 7
c) Visibility of road signage 1 2 3 4 5 6 7
d) Provision of signs giving directions at decision making points
1 2 3 4 5 6 7
e) INSERT ON CAPI SCREEN INSTRUCTION FOR
INTERVIEWERS : SHOW RESPONDENTS SHOWCARD BB
WITH DEFINITION Provision of electronic message
boards to give warnings of congestion and delays
1 2 3 4 5 6 7
SHOWCARD G Q12. Here is a list of the things we just talked about. From this list, which 2 or 3 would you most like to see improved? MULTICODE UP TO 3 ONLY
The provision of lighting along roads
1
The visibility of road markings 2
The visibility of road signage 3
The provision of signs giving directions at decision making
points
4
The provision of electronic message boards to give
warnings of congestion and delays
5
Other write in 6
None of these 7
Don’t know 8
ASK ALL WHO SAY THEY CYCLE OR USE FOOTWAYS OR BOTH (CODES 6 OR 7 OR 6+7) AT Q2 OTHERS GO TO Q15 FOR THOSE WHO CYCLE AND USE FOOTWAYS (CODE 6+7) AT Q2 INSERT <cycle lanes and footways> INTO QUESTION WORDING, THEY SHOULD BE ASKED OPTIONS A-N
FOR THOSE WHO ONLY CYCLE (CODE 6) AT Q2 INSERT <cycle lanes> INTO QUESTION WORDING, THEY SHOULD BE ASKED OPTIONS A-H
FOR THOSE WHO ONLY USE FOOTWAYS (CODE 7) AT Q2 INSERT <footways> INTO QUESTION WORDING, THEY SHOULD BE ASKED OPTIONS I-P

Perceptions of the trunk road network in Scotland- Internal / Client Use Only
44
This work was carried out in accordance with the requirements of the international quality standard for Market Research,
ISO 20252:2006.
© 2013 Ipsos MORI.
SHOWCARD H Q13. For the next few questions, I’d like you to think about the <INSERT APPROPRIATE TEXT FROM ABOVE> on trunk roads you use most often. Overall how satisfied or dissatisfied would you say you are with the… SINGLE CODE EACH ROW RANDOMISE ORDER
Very
Satisfie
d
Fairly
Satisfie
d
Neither
satisfie
d
Nor
dis
satisfied
Fairly
dis
satisfied
Very
dis
satisfied
Don’t k
now
N/A
a) general condition of cycle lane surfaces
1 2 3 4 5 6 7
b) provision of lighting on cycle lanes
1 2 3 4 5 6 7
c) speed with which cycle lane defects such as potholes are
repaired
1 2 3 4 5 6 7
d) quality of cycle lane repairs 1 2 3 4 5 6 7
e) availability of cycle lanes where they are needed
1 2 3 4 5 6 7
f) availability of dropped kerbs (that is when the edge of the
pavement is lowered to help with pushing bikes up or down the
pavement)
1 2 3 4 5 6 7
g) availability of cycle crossing points where they are needed
1 2 3 4 5 6 7
h) amount of guard railing or other physical barriers on trunk roads
1 2 3 4 5 6 7
i) general condition of footway surfaces
1 2 3 4 5 6 7
j) provision of lighting on footways 1 2 3 4 5 6 7
k) speed with which footway defects are repaired
1 2 3 4 5 6 7
l) quality of footway repairs 1 2 3 4 5 6 7
m) availability of footways where they are needed
1 2 3 4 5 6 7
n) availability of pedestrian crossing points where they are needed
o) availability of dropped kerbs (that is when the edge of the
pavement is lowered to help with crossing the road)
1 2 3 4 5 6 7
p) amount of guard railing or other physical barriers on trunk roads
1 2 3 4 5 6 7

Perceptions of the trunk road network in Scotland- Internal / Client Use Only
45
This work was carried out in accordance with the requirements of the international quality standard for Market Research,
ISO 20252:2006.
© 2013 Ipsos MORI.
ASK ALL WHO SAY THEY CYCLE OR USE FOOTWAYS OR BOTH (CODES 6 OR 7, 6+7) AT Q2
OTHERS GO TO Q15
FOR THOSE WHO CYCLE AND USE FOOTWAYS (CODE 6+7) AT Q2, CAPI SCREEN SHOULD SHOW OPTIONS A-N AND INTERVIEWER INSTRUCTIONS SHOULD SAY: SHOWCARD I FOR THOSE WHO USE CYCLE AND USE FOOTWAYS
FOR THOSE WHO ONLY CYCLE (CODE 6) AT Q2, CAPI SCREEN SHOULD SHOW OPTIONS A-H AND INTERVIEWER INSTRUCTIONS SHOULD SAY: SHOWCARD J FOR THOSE WHO ONLY CYCLE
FOR THOSE WHO ONLY USE FOOTWAYS (CODE 7) AT Q2, CAPI SCREEN SHOULD SHOW OPTIONS I-P AND INTERVIEWER INSTRUCTIONS SHOULD SAY: SHOWCARD K FOR THOSE WHO ONLY USE FOOTWAYS
Q14. Here is a list of the things we just talked about. From this list, which 2 or 3 would you most like to see improved? MULTICODE UP TO 3 ONLY NOTE FOR SCRIPTING: DO NOT SHOW LETTERING A)-P) ON SCRIPT
a) The general condition of cycle lane surfaces
1
b) The provision of lighting on cycle lanes 2
c) The speed with which cycle lane defects such as potholes are repaired
3
d) The quality of cycle lane repairs 4
e) The availability of cycle lanes where they are needed
5
f) availability of dropped kerbs (that is when the edge of the pavement is lowered to help with pushing bikes up or
down the pavement)
6
g) availability of cycle crossing points where they are needed
7
h) amount of guard railing or other physical barriers on trunk roads
8
i) The general condition of footway surfaces 9
j) The provision of lighting on footways 10
k) The speed with which footway defects are repaired
11
l) The quality of footway repairs 12
m) The availability of footways where they are needed
13
n) availability of pedestrian crossing points where they are needed
14
o) availability of dropped kerbs (that is when the edge of the pavement is
lowered to help with crossing the road)
15
p) amount of guard railing or other physical barriers on trunk roads
16
Other write in 17
None of these 18
Don’t know 19
Perceptions of the trunk road network in Scotland- Internal / Client Use Only
46
This work was carried out in accordance with the requirements of the international quality standard for Market Research,
ISO 20252:2006.
© 2013 Ipsos MORI.
ASK ALL Q15. Here is a list of all the improvements you said you would like to see made over
the last few questions. From this list, which are the 2 or 3 most important ones? TURN CAPI MACHINE TO RESPONDENT SHOW LIST OF ALL IMPROVEMENTS MENTIONED FROM Q8, Q10, Q12 and Q14 (if applicable) MULTICODE UP TO 3 ONLY
SHOWCARD L Q16. Do you think that each of the following aspects of trunk roads has got better, worse or stayed the same over the past two years? READ OUT a) – f) SINGLE CODE EACH ROW RANDOMISE ORDER
Got better
Got worse
Stayed about
the same
Don’t know
a) General condition of road surfaces
1 2 3 4
b) Drainage of water from road surfaces
1 2 3 4
c) Visibility of road markings 1 2 3 4
d) Frequency with which you encounter road works
1 2 3 4
e) Promptness with which roads are cleared in the winter
1 2 3 4
f) Promptness with which roads are gritted in winter
1 2 3 4
QTS2013A
SHOWCARD M Q17. I am now going to read a list of some other improvements that could be made on the trunk road network. Please say how essential you feel each is by giving a score of 1 out of 10, where 1 is not at all essential and 10 is absolutely essential. READ OUT a)-c) SINGLE CODE EACH ROW RANDOMISE ORDER
a) The road surface should be quiet to travel on
1 2 3 4 5 6 7 8 9 10 DK
b) The overall road network should look good, i.e. verges, roads,
bridges, signs etc.
1 2 3 4 5 6 7 8 9 10 DK
c) Information should be provided on how people can minimise their noise and air emissions when
using trunk roads
1 2 3 4 5 6 7 8 9 10 DK

Perceptions of the trunk road network in Scotland- Internal / Client Use Only
47
This work was carried out in accordance with the requirements of the international quality standard for Market Research,
ISO 20252:2006.
© 2013 Ipsos MORI.
ASK ALL WHO SAY THAT THEY ARE FAIRLY/VERY DISSATIFIED WITH THE GENERAL CONDITION OF ROAD SURFACES (CODES 4 OR 5) AT Q7 OTHERS GO TO Q20 SHOWCARD N Q18. You mentioned that you were dissatisfied with the general
condition of road surfaces. When using trunk roads how often, if at all, do you encounter road defects which you feel are unsafe? SINGLE CODE
Always 1
Usually 2
Sometimes 3
Rarely 4
Never 5
Don’t know 6
ASK ALL WHO SAY AT LEAST RARELY (CODES 1-4) AT Q18, OTHERS GO TO Q20 SHOWCARD O Q19. And what is the specific defect in most of these cases? Just
read out the letter that applies. SINGLE CODE
A Uneven/bumpy surface 1
B Potholes 2
C Poor repairs 3
D Cracking 4
E Ironwork in need of repair (i.e. manholes, drain covers etc.)
5
F Deterioration of road edge 6
G Slippery roads caused by ice/snow
7
H Poor skid resistance 8
I Water on roads 9
J Poor road makings 10
Other – write in 11
Don’t know 12 ASK ALL SHOWCARD P Q20. The next few questions focus on disruptions to trunk roads
caused by severe weather. How satisfied or dissatisfied are you with the…. READ OUT a) – e) SINGLE CODE EACH ROW
Very
Satisfie
d
Fairly
Satisfie
d
Neither
satisfie
d
nor
dis
satisfied
F
airly
dis
satisfied
Very
dis
satisfied
Don’t k
now
N/A
a) Accuracy of warnings and information about the likely condition of trunk roads
before severe weather 1 2 3 4 5 6 7
b) Availability of up to date information on the condition of trunk roads during severe
weather
1 2 3 4 5 6 7
c) Availability of information on the condition of trunk roads after severe weather
1 2 3 4 5 6 7
d) Measures taken to deal with disruptions on trunk roads after severe weather
1 2 3 4 5 6 7
e) Availability of alternative routes and diversions after severe weather
disruptions to trunk roads
1 2 3 4 5 6 7
Perceptions of the trunk road network in Scotland- Internal / Client Use Only
48
This work was carried out in accordance with the requirements of the international quality standard for Market Research,
ISO 20252:2006.
© 2013 Ipsos MORI.
SHOWCARD Q Q21. In the last 12 months or so, how often would you say journeys that you make on trunk roads have been disrupted by the following…? By disruption, I mean anything from having to use an alternative mode of transport to being delayed or having to cancel a journey. READ OUT SINGLE CODE EACH ROW RANDOMISE ORDER
Once or twice
3 to 10 times
More than 10 times
Never Don’t know/ Can’t
remember
a) Floods 1 2 3 4 5
b) Landslide 1 2 3 4 5
c) Snow or ice on the road 1 2 3 4 5
d) Heavy rain or hail 1 2 3 4 5
e) High winds 1 2 3 4 5
ALL WHO HAVE EXPERIENCED DISRUPTION TO AT LEAST ONE JOURNEY IN THE PAST YEAR AT Q21 (CODES 1 THROUGH TO 3 AT ANY OF THE ITEMS) OTHERS GO TO Q23 FOR THOSE WHO HAVE EXPERIENCED DISRUPTION AS A RESULT OF MORE THAN ONE TYPE OF WEATHER INCIDENT AT Q21 (IE CODES 1 THROUGH TO 3 AT MORE THAN 1 OF THE ITEMS), CAPI SCRIPT RANDOMLY SELECT ONE INCIDENT TO ASK Q22 IN RELATION TO SHOWCARD R Q22. And thinking back to the last time your journey was
disrupted as a result of [INSERT SEVERE WEATHER INCIDENT EXPERIENCED AT QTS2013C], in which of these ways were you affected? Please just read out the letters that apply. MULTICODE OK
A I had to cancel my journey 1
B I had to use an alternative mode of transport 2
C I had to use an alternative route 3
D I completed my journey with a delay of less than 30 minutes 4
E I completed my journey with a delay of more than 30 minutes but less than hour
5
F I completed my journey with a delay of 1 to 3 hours 6
G I completed my journey with a delay of more than 3 hours 7
H My journey was affected in another way (PLEASE WRITE IN)
8
Don’t know 9
ASK ALL Q23. Over the last 12 months, from which sources, if any, did you obtain information
about the status and condition of trunk roads affected by severe weather conditions? SHOW RESPONDENT TRUNK ROAD MAP AGAIN AND SAY: Just a reminder that I’m talking about these A roads and motorways, not other local roads. IF NECESSARY: By severe weather conditions, I mean things like strong winds or snow on roads which can affect your journeys on the network. MULTICODE OK
Perceptions of the trunk road network in Scotland- Internal / Client Use Only
49
This work was carried out in accordance with the requirements of the international quality standard for Market Research,
ISO 20252:2006.
© 2013 Ipsos MORI.
ASK ALL WHO CODE MORE THAN ONE RESPONSE AT Q23 AND ONLY SHOW OPTIONS THAT HAVE BEEN CODED AT Q23 OTHERS GO TO Q25 Q24. And of the sources you just mentioned, from which one would you say you received the majority of your information about the status and condition of trunk roads during severe weather conditions? SINGLE CODE
QTS22A QTS22B
Television 1 1
Radio 2 2
News websites 3 3
Traffic Scotland website 4 4
Local council website 5 5
Other internet websites, please write in
6 6
Smartphone ‘Apps’/applications 7 7
Word of mouth 8 8
Newspapers 9 9
Social media (e.g. twitter) 10 10
Other, please write in 11 11
Did not receive any information 12 12
Don’t know 13 13
Q25. Over the last 12 months, have you looked for any information about winter maintenance, such as salting and clearing, on trunk roads? SINGLE CODE
Yes 1
No 2
Don’t know 3
VARY Q26 WORDING BASED ON ANSWERS AT Q25 THOSE WHO HAVE LOOKED FOR INFORMATION ON WINTER MAINTENANCE
AT Q25 (CODE 1) ASK: Q26. Where did you look for information about winter maintenance on trunk roads? MULTICODE OK
ALL OTHERS (CODES 2 OR 3 AT Q25) ASK: Q26. And in future, where would you prefer to obtain information about winter maintenance on trunk roads? MULTICODE OKA
Television 1
Radio 2
Social media like twitter 3
News websites 4
Local council websites 5
Other online website 6
Traffic Scotland website 7
Traffic Scotland internet radio 8
Traffic Scotland freephone Care Line
9
Smartphone apps 10
Newspapers 11
Word of mouth 12

Perceptions of the trunk road network in Scotland- Internal / Client Use Only
50
This work was carried out in accordance with the requirements of the international quality standard for Market Research,
ISO 20252:2006.
© 2013 Ipsos MORI.
Other write in 13
Wouldn’t/didn’t look for this 14
Don’t know 15
Q27. Moving on slightly, can I just check whether you have access to the internet at all? SINGLE CODE ONLY.
Yes 1
No 2
Don’t know 3
ASK ALL WHO HAVE ACCESS TO THE INTERNET AT Q27 (CODE 1) OTHERS GO TO Q35 SHOWCARD S Q28. I’d like to get your views on other types of information about
trunk roads available to the public. Which of these sources of information, if any, have you used? MULTICODE
Traffic Scotland website 1
Traffic Scotland mobile website 2
The Traveline smartphone app 3
Traffic Scotland internet radio station
4
Traffic Scotland twitter feed 5
Traffic Scotland RSS feed 6
None of these 7
Don’t know 8

Perceptions of the trunk road network in Scotland- Internal / Client Use Only
51
This work was carried out in accordance with the requirements of the international quality standard for Market Research,
ISO 20252:2006.
© 2013 Ipsos MORI.
ASK THOSE WHO HAVE USED THE TRAFFIC SCOTLAND WEBSITE (CODE 1 OR CODE 2) AT Q28 OTHERS GO TO Q34 FOR THOSE WHO HAVE USED BOTH THE TRAFFIC SCOTLAND WEBSITE AND THE MOBILE
WEBSITE AT Q28 (CODES 1 + 2) PLEASE SHOW: SHOWCARD T Q29. Thinking about your experiences of using the Traffic Scotland web site, how would you rate it? By that I mean the website that you access mainly through a PC or laptop, as opposed to through your mobile phone. SINGLE CODE FOR THOSE WHO HAVE USED THE TRAFFIC SCOTLAND WEBSITE BUT NOT THE TRAFFIC SCOTLAND MOBILE WEBSITE (I.E.CODE 1 AND ANY OTHER CODES APART FROM CODE 2) SHOW: SHOWCARD T Q29. Thinking about your experiences of using the Traffic Scotland web site, how would you rate it? THOSE WHO HAVE USED THE TRAFFIC SCOTLAND MOBILE WEBSITE BUT NOT THE TRAFFIC SCOTLAND MAIN WEBSITE (IE CODE 2 AND ANY OTHER CODES APART FROM CODE 1) GO TO Q30.
ONLY ASK THOSE WHO SAID THAT THEY HAD ACCESSED THE TRAFFIC SCOTLAND MOBILE WEBSITE AT QTS24 (CODE 2 ANY COMBINATION) OTHERS GO TO QTS25C SHOWCARD T AGAIN Q30. Thinking about your experiences of using the Traffic Scotland mobile website, how would you rate it? SINGLE CODE
TS25A QTS25B
Very good 1 1
Fairly good 2 2
Neither good nor poor 3 3
Fairly poor 4 4
Very poor 5 5
Don’t know 6 6

Perceptions of the trunk road network in Scotland- Internal / Client Use Only
52
This work was carried out in accordance with the requirements of the international quality standard for Market Research,
ISO 20252:2006.
© 2013 Ipsos MORI.
FOR THOSE WHO HAVE USED BOTH THE TRAFFIC SCOTLAND WEBSITE AND THE MOBILE WEBSITE AT
Q28 (CODES 1 + 2) PLEASE SHOW: SHOWCARD U I am now going to read out some statements about the main Traffic Scotland website. Just a reminder that by I mean the website that you access mainly through a PC or laptop, as opposed to through your mobile phone. Q31. Still thinking about your experiences of using the website, to what extent do you agree or disagree with each statement? FOR THOSE WHO HAVE USED THE TRAFFIC SCOTLAND WEBSITE BUT NOT THE TRAFFIC SCOTLAND MOBILE WEBSITE (I.E.CODE 1 AND ANY OTHER CODES APART FROM CODE 2) SHOW: SHOWCARD U I am now going to read out some statements about the Traffic Scotland website. Q31. Still thinking about your experiences of using the website, to what extent do you agree or disagree with each statement? THOSE WHO HAVE USED THE TRAFFIC SCOTLAND MOBILE WEBSITE BUT NOT THE TRAFFIC SCOTLAND MAIN WEBSITE (IE CODE 2 AND ANY OTHER CODES APART FROM CODE 1) GO TO Q34. SINGLE CODE EACH ROW RANDOMISE LIST
Str
on
gly
ag
ree
Ten
d t
o a
gre
e
Neit
her
ag
ree
no
r d
isag
ree
Ten
d t
o
dis
ag
ree
Str
on
gly
dis
ag
ree
Do
n’t
kn
ow
N/A
I have difficulties finding my way around the website 1 2 3 4 5 6
The website looks and feels well designed 1 2 3 4 5 6
The website content is clear and easy to understand 1 2 3 4 5 6
It usually takes me a long time to find the information I need 1 2 3 4 5 6
Most of the information provided on the website is up-to-date 1 2 3 4 5 6
The website is generally better than other sources of travel information
1 2 3 4 5 6
SHOWCARD V Q32. Here is a list of some of the different types of information that are available on
the Traffic Scotland website. Based on your experiences of using the website, which of these types of information, if any, would you say are particularly useful? Please just read out the letters that apply.CODE 3 MAX
A Incidents on the trunk road network 1
B Trunk roads that are affected by weather 2
C Current and planned roadworks 3
D Journey times between different destinations 4
E Park and ride facilities 5
F Weather forecast or warnings 6
G Electronic message boards 7
H Live CCTV of trunk roads 8
I Planned events 10
J Gritting and winter salt treatment plans 11
Other travel information 12
Don’t know 13
Perceptions of the trunk road network in Scotland- Internal / Client Use Only
53
This work was carried out in accordance with the requirements of the international quality standard for Market Research,
ISO 20252:2006.
© 2013 Ipsos MORI.
Q33. Is there any other information which could be provided through the Traffic Scotland website which you would find useful? WRITE IN
Don’t know X
ASK ALL
IF NO ACCESS TO THE INTERNET OR DK AT Q27 (CODE 2 OR 3) SHOW: Q34. How many cars or light vans are there in your household? IF HAVE ACCESS TO THE INTERNET AT Q27 (CODE 1) SHOW: Q34. Moving on slightly, how many cars or light vans are there in your household? SINGLE CODE
1 car or light van 1
2 cars/light vans 2
3+ cars/light vans 3
None 4
Refused/don’t know 5
ASK ALL WHO SAY THAT THEIR HOUSEHOLD HAS A CAR AT Q34 (CODES 1 THROUGH TO 3) OTHERS GO TO QA Q35. And can I just check whether you are responsible for buying tyres for
your car(s)? SINGLE CODE
Yes 1
No 2
Refused/don’t know 3
ASK ALL WHO SAY THAT THEY ARE RESPONSIBLE FOR CHOOSING CAR TYRES AT Q35 (CODE 1) OTHERS GO TO Q37 SHOWCARD W Q36. Thinking about when you choose tyres for your car, how
important, if at all, are each of the following factors to you? Please select your answer from the scale on this card. READ OUT a)-d) SINGLE CODE EACH ROW RANDOMISE ORDER
Very important
Fairly important
Not very important
Not at all important
Don’t know
a) The cost of the tyre 1 2 3 4 5 b) The impact of the tyre
on the cars’ fuel consumption
1 2 3 4 5
c) How much noise the tyre makes
1 2 3 4 5
d) How well the tyre breaks on wet roads
1 2 3 4 5

Perceptions of the trunk road network in Scotland- Internal / Client Use Only
54
This work was carried out in accordance with the requirements of the international quality standard for Market Research,
ISO 20252:2006.
© 2013 Ipsos MORI.
DEMOGRAPHICS SECTION
ASK ALL Q37. CODE RESPONDENTS GENDER
SINGLE CODE
Male 1
Female 2
Q38. AGE SINGLE CODE
18 1
19-24 2
25-34 3
35-44 4
45-54 5
55-59 6
60-64 7
65-74 8
75+ 9
Q39. Working Status of Respondent:
Working - Full time (30+ hrs) 1
- Part-time (9-29 hrs) 2
Unemployed 3
Not working - retired 4
- looking after house/children 5
- invalid/disabled 6
Student 7
Other (PLEASE SPECIFY) 8
Q40. Occupation of Chief Income Earner Position/rank/grade
Industry/type of company
Quals/degree/apprenticeship
Number of staff responsible for
Q41. Class: SINGLE CODE
A 1
B 2
C1 3
C2 4
D 5
E 6

Perceptions of the trunk road network in Scotland- Internal / Client Use Only
55
This work was carried out in accordance with the requirements of the international quality standard for Market Research,
ISO 20252:2006.
© 2013 Ipsos MORI.
Q42. Do you have any long-term illness, health problem or disability which limits your daily activities or the work you can do? SINGLE CODE ONLY
Yes 1
No 2
Refused/don’t know 5
SHOWCARD X Q43. What is your household’s total income from all sources over the last 12 months? Just read out the letter from the card. SINGLE CODE.
Per Week Per Year
A Less that £100 Less that £5,200 1
B £100 to £199 £5,200 to £10,399 2
C £200 to £299 £10,400 to £15,599 3
D £300 to £499 £15,600 to £25,999 4
E £500 to 699 £26,000 to 36,399 5
F £700 to £949 £36,400 to £49,399 6
G £950 to £1,199 £49,400 to £62,399 7
H £1,200 to £1,499 £62,400 to £77,999 8
I £1,500 or more £78,000 or more 9
Q44. WRITE IN NUMBER OF ADULTS IN THE HOUSEHOLD
Q45. WRITE IN NUMBER OF CHILDREN IN THE HOUSEHOLD (UP TO 15 YEARS OLD)
ASK IF CHILDREN IN THE HOUSEHOLD AT Q45
Q46. What ages are the children in the household? MULTICODE OK
0-4 1
5-7 2
8-10 3
11-15 4
Don’t know 5
ASK ALL SHOWCARD Y Q47. Which of these best describes the ownership of your home? Please read out the letter that applies. SINGLE CODE ONLY.
A Owned outright (including leasehold)
1
B Buying on mortgage 2 C Rented from Council 3 D Rented from housing association 4 E Rented from private landlord 5 Other 6
******TIME STAMP********
*****END OF INTERVIEW*****
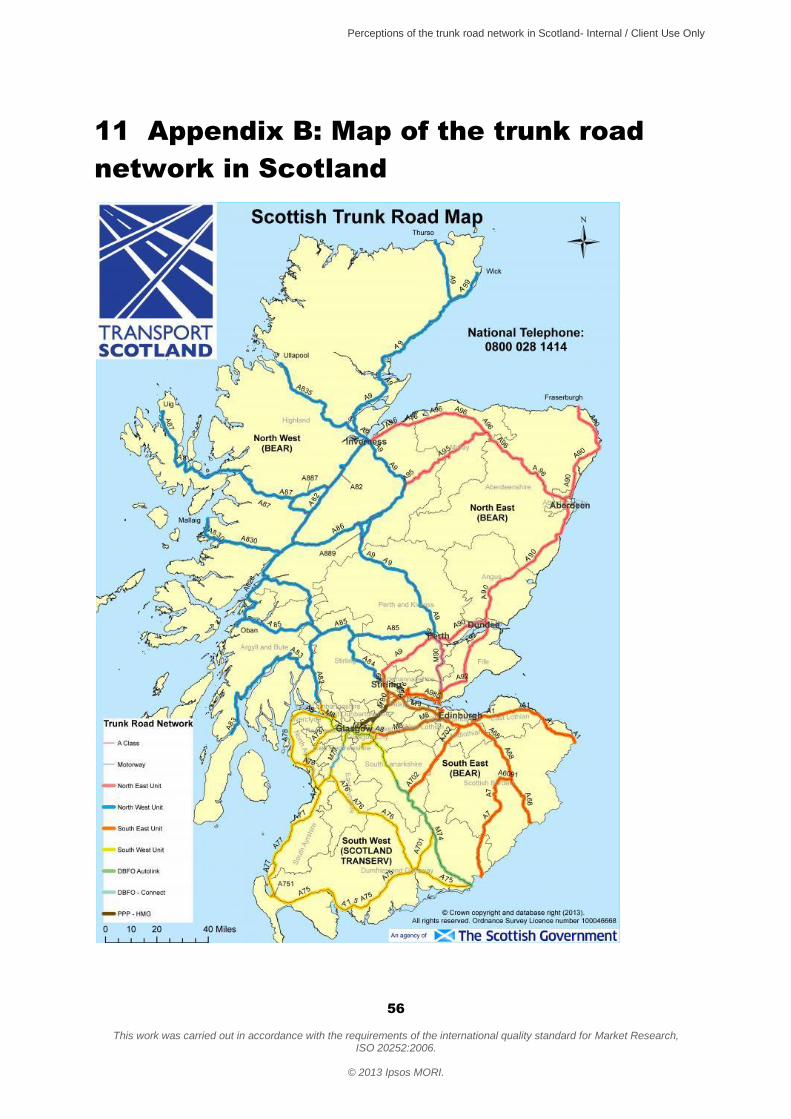
Perceptions of the trunk road network in Scotland- Internal / Client Use Only
56
This work was carried out in accordance with the requirements of the international quality standard for Market Research,
ISO 20252:2006.
© 2013 Ipsos MORI.
11 Appendix B: Map of the trunk road
network in Scotland