Embed Size (px)
Citation preview

World Review of Business Research
Vol. 7. No. 1. March 2017 Issue. Pp. 1- 19
Perceptions on Business Strategy of Small and Medium-Sized Enterprises
Andries du Plessis*
The purpose of this article is to examine how the perceptions of employees could have an influence in business strategy. The problem statement and main research question is: How can employees’ perceptions influence the outcome of business strategy of SMEs in Lao PDR? This article critically reviews the literature pertaining to perceptions and attitudes. Perception involves a sophisticated thinking process, from obtaining data from the external environment, analysing, and converting it through the cognitive process. People’s perceptions of reality have great influence on their behaviour. The significance of this article is: SMEs in Lao PDR can develop better understanding about the influence of employees’ perceptions on the outcome of business strategy. The findings show strong evidence that supports the relationship between employees’ perceptions about strategy and business performance; employees who had some interest in business strategy accounted for 37%, those with a moderate interest in strategy, 42%, and those very interested in strategy at 16%. Some recommendations are given at the end of the article before the conclusions section.
Field of Research: Management
1. Introduction After the establishment of Lao PDR in 1975, the government had taken control over the economy of the country. Most businesses in the private sector had become state-owned enterprises. Managers and employees worked together in large entities and business strategies and organisational policies were directly under the supervision of the government. The market had entered the monopolistic state, which led to there being no competition in the industries and lesser need for business strategies. In addition, the closed country policy had dampened the economic growth by ignoring the benefits of foreign trade. During this period, businesses in Lao PDR began stagnating and experiencing difficulty to keep up good performance ("Laos economic situation," n.d.). The economic reform also encouraged small businesses in Lao PDR to thrive. There had been an increasing number of companies in recent years, which was attributed to a greater volume of foreign investments. Moreover, many overseas companies are establishing their businesses in Lao PDR in order to tap into the profitable market. ________________________________________________________________ *Dr Andries J du Plessis, Senior Lecturer, Unitec, Auckland, New Zealand, [email protected]

Du Plessis
2
As a result, business competition is becoming more intense and threatens the well-being of existing companies in the market ("Lao business sector," n.d.). Companies in Lao PDR mostly are small and medium-sized enterprises (SMEs). In 2006, there were about 126,913 enterprises, and SMEs accounted for 90 per cent of the total enterprises in Lao PDR. SMEs are playing a crucial role in stimulating the development of the country, and the government is paying more attention to them by developing policies that are conducive to the growth of SMEs (Lao National Chamber of Commerce and Industry [LNCCI], n.d.). Due to the inflow of foreign direct investment and the lower trading barrier, these factors have changed the conventional way of doing business, which was usually a lack of competitiveness, and created opportunities and threats for companies in Lao PDR. Thus, it requires the application of business strategy to allow SMEs to be able to compete effectively in the market (Du Plessis, Marriott & Manichith, 2016; Kyophilavong, 2007). Recently, employees who work for SMEs in Laos began to familiarise themselves with the use of business strategy. The owners/managers often apply the strategy based on their own experience and understanding without considering the perceptions of employees. The employees have usually been told to follow the guidance and directions given by the managers, and the way they perceive about the business of their companies is often being understated (Kyophilavong, 2007). Perception is an important issue that needs to be understood for better behaviour management. Employees consistently perceive themselves and things around them, then make an interpretation of this information that leads to the behaviour they think appropriate for certain situations (Agarwal, 2009). However, it is unknown about the extent of employees’ perceptions in relation the business strategy. This research seeks to explore the extent of employees’ perceptions in relation to business strategy, and the main research question is: How can employees’ perceptions influence the outcome of business strategy of SMEs in Lao PDR? Based on the main research question, the researcher has developed the following research sub-questions: 1) What is the effect of employees’ perceptions about business performance in relation to
business strategy of their SMEs? 2) What is the effect of employees’ perceptions about business strategy? To determine the difference in the perceptions of employees regarding business strategy, the researchers have established the following hypothesis: H2o: There is no difference in the perceptions of employees regarding business strategy. H2a: There is a difference in the perceptions of employees regarding business strategy. The purpose of this research is to understand the influence of employees’ perceptions about business strategy in order to identify the factors that contribute to a successful strategy that could make the firms adjust themselves appropriately in the current business environment. This research is important to SMEs in Lao PDR in order to develop more understanding about the influence of employees’ perceptions on the outcome of business strategy. The next section is an in-depth interview in previous research done in this area explaining the perceptions of employees supported by figures and discussing business strategy. The

Du Plessis
3
methodology section follows with the analysis of the results as the next section. Some recommendations are followed by the conclusion of this article.
2. Literature Review According to Du Plessis, Douangphichit, and Dodd (2016) the definition of small and medium-sized enterprises (SMEs) is different among countries. Many studies have categorised SMEs by the size of employees. In the United Kingdom, SMEs are defined as firms with employees fewer than 250 people. In the European Union, SMEs are companies with less than 25 per cent of the stakes owned by other organisations, and the number of employees does not exceed 250 people (Bourletidis, 2013; Nwankwo & Gbadamosi, 2010). SMEs are the major type of companies around the world. They represent between 95 – 99 per cent of all businesses in different countries. SMEs are everywhere and scattered across the industries. They have become a prominent force to drive the economic growth of a country (Organisation for Economic Co-operation and Development [OECD], 2006). Nwankwo and Gbadamosi (2010) also note that SMEs can be classified by three major characteristics which are described as an economic definition. These characteristics are: • They control a fairly small portion of market share in the market. • They are mostly managed by owners and have quite a simple management hierarchy. • They are autonomous and less formal than large organisations. Furthermore, SMEs are different from large companies because of the uncertainty, innovation, and revolution factors. They have limited access to important resources that prevents them from fully exploiting opportunities in the marketplace (Hayes, 2009). In addition, Munro (2013) describes the difference in size in both the number of personnel and financial capability has distinguished SMEs from large companies. SME owner-managers are people who have invested their money in businesses based on their ideas and interest with the expectation of receiving profit and generating income from those businesses. They are considered to be in a better spot than those of large corporations to apply their ideas and creativity on their business operations. In contrast to corporate managers, SME owner-managers will not need to endure the pressures that occur by representing the interests of shareholders, which might prevent them from performing at their peak. Hence, they are more productive and induce more growth to companies (Murthy, 2009; Werner, 2008). In addition, Burke (2011) states that SME owner-managers can encourage employees to develop their skills and experience by paying attention to human resource management (HRM) by trying to eliminate problems that arise from HRM in order to increase the effectiveness of employees and the growth of SMEs. 2.1 SMEs in Developing Countries and in Lao PDR There are no previous studies or literature on this topic done in Lao and this is the first known study. In most developing countries, SMEs make up a large portion in the total number of firms and employment. In low-income countries, most businesses are in the form of small-sized enterprises that run their businesses alongside a small number of large organisations.

Du Plessis
4
In middle-income countries, medium-sized enterprises are more prevalent and make up the majority of businesses and employment. In many countries, the size of companies is changing from small-sized enterprises towards large-sized enterprises as the income per capita increases. In other words, the number of small-sized enterprises is decreasing as the country becomes more and more developed (Du Plessis, Marriott & Manichith, 2016; Hallberg, 2000; Kiggundu, 2002). However, Hallberg (2000) argues that despite the fact that SMEs acquire a large portion of workforce, it is not conclusive that SMEs are more labour intensive than large corporations. The evidence shows that the size of the firm is not a reliable measurement to identify labour intensity. It tends to fluctuate across industries rather than by firm-sized clusters. In addition, Beck, Demirgüç-Kunt, and Levine (2003) suggest that the evidence does not support the statement that SMEs are the major force of employment growth. Despite these SMEs have a high rate of job creation, however, they also have a high rate of job destruction as they fail to grow and go out of business. Hence, SMEs are more likely to have less job security than larger firms. Fischer and Reuber (2000) point out that the majority of SMEs are one-person businesses. Working proprietors is the largest employment category and accounts for more than half of total SME labour force in most developing countries. Their family members who are active in the businesses, whether being paid or not, account for another quarter. The rest of the labour force includes employees and trainees or apprentices. Moreover, Burke (2011) explains that when we classify microenterprises as SMEs, it shows that most of SME owner-managers are women. They mostly run their businesses as home-based SMEs, and often omitted from official statistics. However, their contribution to economic growth is fairly substantial in many developing countries. 2.2 Employees’ Perceptions French, Rayner, Rees, and Rumbles (2011) as well as Du Plessis (2015a) state that perception is the process of selection, management, and interpretation of objects, experiences, and situations in the environment which is realised through five senses of individuals. Perception involves a sophisticated thinking process, starting from obtaining data from the external environment, analysing, and converting it through the cognitive process. The result of this process may vary among individuals. People’s perceptions of reality have greater influence on their behaviour than reality itself. In addition, Ahmad, Gilkar, and Darzi (2008) describe perception as an important cognitive and psychological factor that influences human behaviour. It is the way people make the translation of situations they have experienced through a complex reasoning system.

Du Plessis
5
Figure 1: The Perceptual Process Source: French et al. (2011, p. 80)
People keep interacting with their surrounding environment. However, only a few of these interactions can become their perceptions. The perceptual selectivity refers to the process of filtering human contact with the environment to a limited number of interactions. It is influenced by internal factors such as attitude, personality, and motivation; and external factors such as shape, size, familiarity, and motion (Aquinas, 2008). People may occasionally have different perceptions towards the same object. The differences may result from the perceiver’s internal factors, the circumstances, and the external factors of the target (Du Plessis, Nel & Al-Shamaa, 2012; Ranganayakulu, 2005). Du Plessis, Frederick, and Maritz (2013) and Agarwal (2009) note that social perception relates to the way people perceive each other in society. Psychological processes are the main factors affecting social perception, which result in attribution, stereotyping, and halo effect. Attribution is concerned with how people perceive the cause that leads to their behaviour or the behaviour of others. Stereotyping refers to the way people judge a person based on the group in which he or she belongs without considering the personal quality of that individual. The halo effect occurs when people have an impression of a person who possesses a particular characteristic that can create respect and admiration (Murray, Poole, & Jones, 2006). Perception can have an impact on the decision-making process of an individual, which is important to the organisation. The decision-making process is concerned with receiving, selecting, analysing, and interpreting the data, then finalising the decision using the above information combined with the perception of an individual (Singh, 2010). Perception helps create competitive advantage for the firms by improving the quality of products and making them more attractive to consumers and firms can set a premium price for their products. Employees with positive perceptions towards achievement could bring success to the organisations, whereas employees with negative perceptions towards achievement may lead to organisational failure (Mills, Mills, Bratton, & Forshaw, 2007). 2.3 Perceptions Influencing Employees’ Behaviour Du Plessis (2015a) and Sims (2002) explain that it is not only personal needs and drives that determine personnel behaviour in the workplace. Their behaviour is also influenced by their own perceptions. Perception plays a crucial role in dictating our behaviour because we react

Du Plessis
6
to things differently based on how we perceive them. It is an important part that needs to be understood for better behavioural management. In addition, Du Plessis, Nel & Al-Shamaa (2012) and Ranganayakulu (2005) state that employees consistently perceive themselves, other people, and things around them in the organisations. They make the interpretation of this information and come up with the action or behaviour they think appropriate for the situations. Their behaviour will create either a positive or negative effect for the firms. Du Plessis (2015b) and Agarwal (2009) note that the way perception affects employees’ behaviour could be explained by the success-failure model. This model occurs when an employee attempts to achieve something through various external interactions. If these interactions can lead to success, the employee will have a positive perception and view himself as a successful person. A successful individual is ready and prepared for new challenges, open to new experiences, capable of dealing with work pressure and uncertainty, confident, persevering, and having the ability to solve difficult problems (Singh, 2010). Question 2, below, is supported by the above literature in that employees’ perceptions about the strategy of their companies can affect their actions and behaviour towards their work. The perceptions of people have a great impact on their attitudes, which are one of the major factors responsible for people’s behaviour. An attitude is the feelings of an individual, which can be positive or negative, towards something he or she encountered. These feelings are developed through the individual’s experience and perception to form specific responses to people or situations (Aquinas, 2008). An attitude is not the actual behaviour; it is the intended behaviour. Managers should not ignore the importance of intended behaviour. Attitudes affect interpersonal relations of employees, direct their behaviour, and influence organisational performance (Du Plessis, 2015b; French et al., 2011; Lee, Park, & Lee, 2013). People’s behaviour is also influenced by their personalities. Personality is the result of self-perception. It is a complex psychological process, which relates to the experience and innate characteristics of the individuals. Personality involves physical appearance, self-esteem, and interpersonal ability (Sinha, 2008). Moreover, personality can be perceived as the unique trait and quality of a person. It refers to the way people behave, think, respond, and feel in the standard pattern. People have different personalities, and their personalities sometimes can be the reasons for their behaviour. The internal and external environment of the organisation is playing a vital role in shaping employees’ personalities (Du Plessis, Nel & Al-Shamaa, 2012; Du Plessis, Frederick, & Maritz, 2013; Champoux, 2011). 2.4 What Is Business Strategy? The definition of strategy varies among theorists, researchers and managers. There is no one single definition that could explain clearly about the meaning of strategy. According to Google, 58 million answers are found when searching for the term strategy. The word “strategy” has a long history of application ranging from the Chinese Sun Tzu to the Greek Heraclitus and Pericles who used strategies for military purposes. An Italian Machiavelli developed strategies for state governance and management control during the time of political uncertainty (Du Plessis, Marriott & Manichith, 2016; Clegg, Carter, Kornberger, & Schweitzer, 2011). In the past, strategists and organisations applied strategies into their plans in order to achieve different objectives. As a result, the concept of strategy is based on

Du Plessis
7
a specific situation, and these situations have created a variety of definitions of strategy (Du Plessis, Sun, Marriott, 2012; Ulwick, 2005). In the business context, De Wit and Meyer (2010) and Du Plessis, Sun, Marriott (2012) point out that there are three dimensions of strategy. They are strategy process, strategy content and strategy context. Strategy process is related to how to develop and implement a strategy, who will carry out the tasks, and when the activities should take place. Strategy content is related to what should be comprised in the strategy of a company. Strategy context is related to where a strategy will be applied, such as the niche market or the industry. In addition, Clegg et al. (2011) explain that strategy is concerned with major plan developments where managers using all available resources to maximise company performance in a competitive market on behalf of stakeholders. Strategy also helps managers to solve business problems they experience on a daily basis through case studies or theories from textbooks (Du Plessis, Marriott & Manichith, 2016Faulkner & Campbell, 2006).
Figure 2: Three Dimensions of Strategy
Source: De Wit and Meyer (2010, p. 5)
Thus, these 3 dimensions of strategy is the foundation for SMEs to formulate and implement business strategy effectively.
3. Methodology This research studies the phenomenon by exploring the reality in a scientific way. As a result, this research is based on the positivist paradigm, which aims at reflecting the facts by avoiding the researcher’s intervention or influence on the subject, in order to deliver an outcome that is objective. The result of the findings is expected to be impartial, unbiased, and provide scientific evidence to support or reject hypotheses that are the key components to accomplish research objectives. Positivists rely on cause-and-effect theories to study the phenomena, then they organise those theories and find the way to develop hypotheses, which they could test later. The common methods used to test a hypothesis are variable manipulations, which can be done by the assistance of statistical software. Researchers then observe and record the results

Du Plessis
8
generated by the software. This type of research is generally referred to as the scientific research (McNabb, 2010). Positivists apply the scientific methods to the research of social reality. These methods comprise phenomenalism, inductivism, and deductivism principles (Bryman, 2012). In contrast to the positivist paradigm, constructivist paradigm focuses on subjective reality and rejects the possibility of completely objective reality. Social constructivists believe that we are unable to comprehend the true nature of reality. From this point of view, they argue that the knowledge is not necessarily the reality, but it is the result of social exchange; and when we agree about the knowledge, it becomes the truth (White & McBurney, 2013). Social constructivists challenge the fundamental principles used by positivists to uncover the truth. They argue that the research must involve the study of socioeconomic, cultural, and historical contexts in relation to the subjects, which will help gaining new knowledge about the phenomena (Lodico, Spaulding, & Voegtle, 2010). The quantitative approach is different from qualitative approach in many ways. Simply said, qualitative approach is focused on explaining characteristics of people and their perceptions about situations without using statistical measurements. On the other hand, quantitative method involves a researcher applying numerical data collection and mathematical method to understand characteristics of people and reality (Thomas, 2003). However, there are some researchers who are not satisfied with such a simple explanation about the difference between the two methods. Hence, they dedicate their time to try to distinguish between quantitative and qualitative in far more detail (Ridenour & Newman, 2008). 3.1 Data Collection The research applied the survey method for data collection. The advantage of this method is the ability to collect data from a large sample, which can increase the accuracy of the findings. The survey can cover a broader area of the target population than other methods, which could be able to generalise the findings and represent the reliable results that are needed for the research (Rubin & Babbie, 2012). Hence, the survey method was considered to be the most appropriate method for this research in which the data derived from this method was translated into statistical data for further quantitative analysis. 3.2 Target Population The target population of this research is employees of SMEs in Lao PDR. Because the research topic is concerned with the influence of employees’ perceptions on the outcome of business strategy, the researcher focuses only on employees who work for SMEs in Laos. Their opinions on the issues are suitable in reflecting the relationship between a variety of factors relating to the environment in which their companies operate and the outcome of the business strategy of their SMEs. 3.3 Sample Size The sample size of this study comprises 100 respondents. This number may be relatively small in size, but compared to the size of companies in Laos, which mostly are small-size companies, these respondents are the employees of SMEs from various business sectors.

Du Plessis
9
Thus, this sample size should be sufficient for the analysis of data and the generation of findings. Bryman (2012) notes that there is no exact answer about how large a sample size should be. A certain sample size might be enough based on the research environment, and it is not completely true that the larger the size of a sample, the greater the precision of a sample. In addition, due to the limited amount of time and budget, the researcher applied the non-probability sampling method by randomly selecting SMEs in Laos and sending out the survey questionnaires to these companies. 3.4 The Questionnaire According to McLafferty (2010), questionnaires are very important to survey research. Each questionnaire is designed specifically for a particular research project. There are many forms of questionnaires written differently based on situations, purposes of the research, and data collection methods. Its contribution to the success of the research is obvious to the researchers who use the questionnaire as a research instrument. In addition, Brace (2013) states that the questionnaire is used to provide a standardised approach to all respondents, so the researchers can be sure that the questions are asked exactly in the same way. One of the key elements of survey research is to ask questions of different individuals in the same manner. Hence, this research used the questionnaire as a research instrument because of its advantages such as cost saving and anonymity. The questionnaire allowed the data that was collected from the respondents to be converted into computer readable data for statistical analysis and study. The questionnaire took about 20 minutes to complete, and contained 33 questions. It had been translated into the Lao language to help local respondents understand the questions, so that they could answer the questionnaire correctly.
4. Data Analysis The data collected from questionnaires was processed and entered into statistical analysis program SPSS. All relevant information was observed and analysed. This information played a crucial role in achieving research objectives, and contributed significantly to the interpretation of the research findings. The data analysis method is discussed as follows: 4.1 Univariate Analysis It involves the analysis of only one single variable without concern for other variables. Sometimes it can be more than one variable, but without observing their relationships. It is used mainly for descriptive purposes, such as explaining the frequency of each variable in figure or percentage through frequency tables and diagrams (Bryman, 2012). Frequency tables describe the figures in a form of rows and columns. It is the clearest method for analysing numerical data such as nominal and ordinal values. Univariate analysis is often used in exploratory research to observe how the data from different categories is distributed in the sample (Sekaran & Bougie, 2009).

Du Plessis
10
4.2 Bivariate Analysis It refers to the analysis of two different variables in order to study their relationships and test the hypothesis. This means that we look for the evidence to identify the existence of the relationships between these variables. Different techniques have been employed to analyse their relationships, depending on the nature of the variables. Bivariate analysis is primary for explanatory purposes, and describes what has been found based on statistical data and value (Rubin & Babbie, 2012). For example, cross-tabulation helps observe frequencies of numerical data in specific categories for more than one variable. Cross-tabulation is the simplest approach to summarise the data from any sample size in terms of columns and rows (Kothari, 2008). 4.3 Multivariate Analysis It refers to the analysis of three or more variables at the same time. This type of analysis is more complicated than the previous two and requires certain knowledge of statistical analysis in order to interpret the data more effectively. This analysis technique is very practical and gives a sense of reality, and provides support for decision-making. The analysis involves examining spurious relationships between variables, identifying intervening variables, and recognising moderated relationships among variables (Marlow & Boone, 2011). Multivariate analysis is concerned with the attempt to determine the influences of different independent variables on a single dependent variable. Some multivariate techniques are multiple regression, correlation, ANOVA, and factor analysis (Dantzker & Hunter, 2012).
5. Findings and Discussion of Results This section discusses relevant demographic information of respondents. It involves the identification of gender, age groups, levels of education, work experience and so on. The observation of this data gives the researcher a general grasp about the respondents, and provides useful information for later analysis. Section A comprises 6 questions, starting from Question 1 to 6. Each of the questions is discussed in detail as follows: Question 1: The respondents were asked about their gender, and the findings are shown in
Table 4.1.
Table 1: Gender of Respondents Frequency Percent Valid Percent Cumulative Percent
Valid Male 54 54.0 54.0 54.0
Female 46 46.0 46.0 100.0
Total 100 100.0 100.0
In Table 1, the total number of respondents is 100 people, by which 54% of respondents are male and 46% of respondents are female. The result shows that the number of male respondents is slightly higher than female respondents. Hence, the contribution of gender in this survey is considered to be fairly proportionate. Question 2: The respondents were asked about their age groups, and the findings are shown in Figure 3 below.

Du Plessis
11
In Figure 3 below, the graph depicts that the majority of respondents belong to the age group of 25-30 years old, which represent at 53%; the age group of 31-40 years old represents at 26%; 19-24 years old represents at 17%; and the remaining age groups represent at 4% of the total respondents. The findings indicate that the new generation of young workforce is filling up the businesses in Lao PDR.
Figure 3: Age Groups of Respondents
Question 3: The respondents were asked about their levels of education, and the findings are shown in Figure 4.
Figure 4: Levels of Education

Du Plessis
12
The result in Figure 4 above, illustrates that the majority of respondents have received their education at bachelor’s degree level, which account for 68%. This is followed by master’s degree, diploma, and high school level at 20%, 8%, and 4% respectively. The result suggests that employees who work in SMEs mostly are well educated. However, the quality of educational system in Laos may affect the effectiveness of bachelor’s degree when compared to other developed countries. Question 4: The respondents were asked about their work experience, and the findings are shown in Table 2 below.
Table 2: Work Experience
Frequency Percent Valid
Percent Cumulative
Percent
Valid Less than 1 year 13 13.0 13.0 13.0
1-3 years 40 40.0 40.0 53.0
4-6 years 26 26.0 26.0 79.0
7 years and above 21 21.0 21.0 100.0
Total 100 100.0 100.0
According to the information in Table 2, 40% of employees have 1-3 years of work experience, 26% of them have 4-6 years of work experience, 21% of them have 7 years and above of work experience and 13% of them have less than one year of work experience. The findings display that many employees have limited work experience in the organisations. This group of employees may lack certain knowledge and skills to perform their tasks efficiently. However, the groups of more experienced employees represent almost a half of total respondents, which indicate that their expertise and capabilities may help driving the business of their companies. Question 5: The respondents were asked how long have they been working with their current companies, and the findings are shown in Table 3.
Table 3: Number of years working in the company
Frequency Percent Valid
Percent Cumulative
Percent
Valid Less than 1 year 20 20.0 20.0 20.0
1-3 years 48 48.0 48.0 68.0
4-6 years 16 16.0 16.0 84.0
7 years and above 16 16.0 16.0 100.0
Total 100 100.0 100.0
In Table 3 above, the result demonstrates that a majority of employees are working with their current companies between 1-3 years at 48%, and in less than a year at 20%. The remaining periods are rather small, which account for 16% between 4-6 years, and 16% between 7 years and above. The result suggests that most of respondents are either constantly looking

Du Plessis
13
for a more suitable job or accumulating enough experience then move on to find a better job in other companies. Question 6: The respondents were asked how many employees in their current company, and the findings are shown in Figure 5 below.
Figure 5: Number of Employees in the Company
The information presented in Figure 5 above, displays that most of respondents are working at the company with the number of employees between 50-99 people at 53%, between 11-19 people at 22%, between 20-39 people at 15%, and other categories account for the rest 10%. The result indicates that a large proportion of respondents are working at medium-sized enterprises, which represent more than 70% of the total figures. Hence, the research results
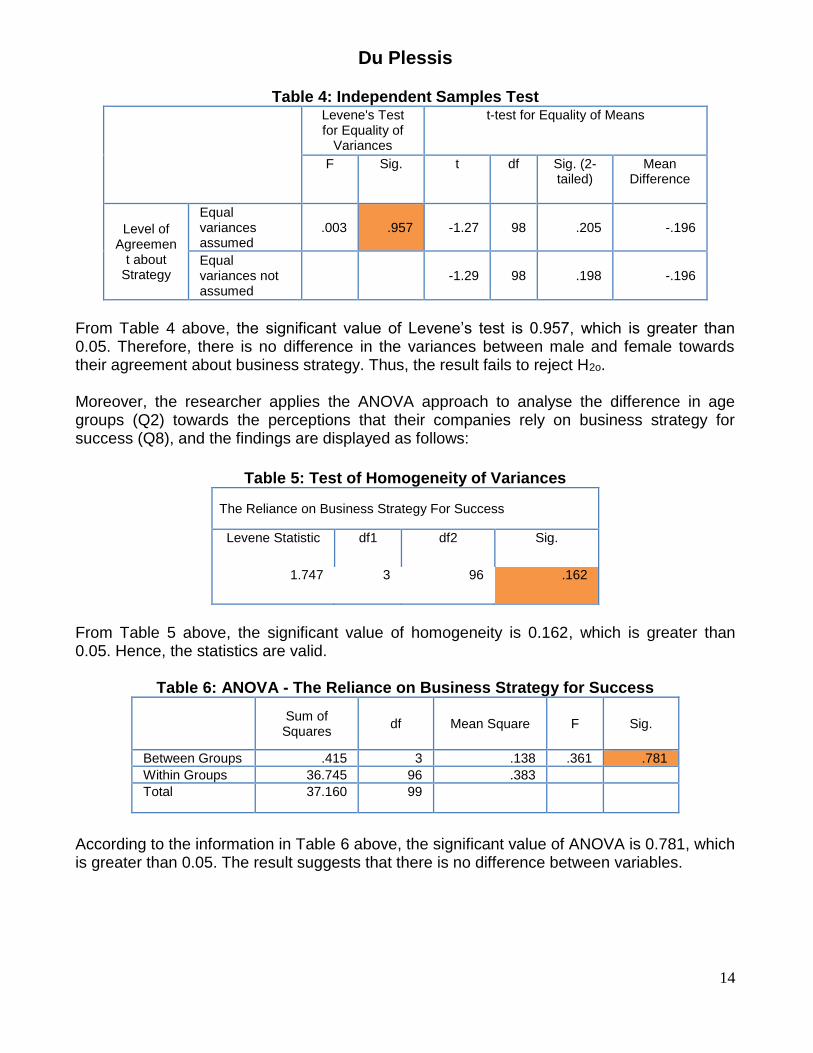
may tend to be more appropriate for medium-sized enterprises. In the problem statement in Section 3 above it was made clear that the one objective is to determine the difference in the perceptions of employees regarding business strategy, the researchers have established the following hypothesis: H2o – There is no difference in the perceptions of employees regarding business strategy. H2a – There is a difference in the perceptions of employees regarding business strategy. The researchers used the t-test method to analyse the difference between male and female (Q1) towards their levels of agreement that business strategy is necessary for any company (Q7), and the result is displayed as follows:
Du Plessis
14
Table 4: Independent Samples Test Levene's Test
for Equality of Variances
t-test for Equality of Means
F Sig. t df Sig. (2-tailed)
Mean Difference
Level of Agreemen
t about Strategy
Equal variances assumed
.003 .957 -1.27 98 .205 -.196
Equal variances not assumed
-1.29 98 .198 -.196
From Table 4 above, the significant value of Levene’s test is 0.957, which is greater than 0.05. Therefore, there is no difference in the variances between male and female towards their agreement about business strategy. Thus, the result fails to reject H2o. Moreover, the researcher applies the ANOVA approach to analyse the difference in age groups (Q2) towards the perceptions that their companies rely on business strategy for success (Q8), and the findings are displayed as follows:
Table 5: Test of Homogeneity of Variances
The Reliance on Business Strategy For Success
Levene Statistic df1 df2 Sig.
1.747 3 96 .162
From Table 5 above, the significant value of homogeneity is 0.162, which is greater than 0.05. Hence, the statistics are valid.
Table 6: ANOVA - The Reliance on Business Strategy for Success
Sum of Squares
df Mean Square F Sig.
Between Groups .415 3 .138 .361 .781
Within Groups 36.745 96 .383
Total 37.160 99
According to the information in Table 6 above, the significant value of ANOVA is 0.781, which is greater than 0.05. The result suggests that there is no difference between variables.

Du Plessis
15
Table 7: Post Hoc Tests - Multiple Comparisons
Dependent Variable: The Reliance on Business Strategy For Success
Tukey HSD
(I) Age Group of
Respondents
(J) Age Group of Respondents
Mean Difference
(I-J)
Std. Error
Sig.
95% Confidence Interval
Lower Bound
Upper Bound
19-24 years old
25-30 years old -.029 .172 .998 -.48 .42
31-40 years old .081 .193 .975 -.42 .59
41 years old and above
.235 .344 .903 -.66 1.13
25-30 years old
19-24 years old .029 .172 .998 -.42 .48
31-40 years old .110 .148 .879 -.28 .50
41 years old and above
.264 .321 .843 -.57 1.10
31-40 years old
19-24 years old -.081 .193 .975 -.59 .42
25-30 years old -.110 .148 .879 -.50 .28
41 years old and above
.154 .332 .967 -.71 1.02
41 years old and above
19-24 years old -.235 .344 .903 -1.13 .66
25-30 years old -.264 .321 .843 -1.10 .57
31-40 years old -.154 .332 .967 -1.02 .71
The information in Table 7 above describes the relationship between variables in more detail, especially the significant values, which can identify the difference between them. The findings show that the significant values between these age groups are greater than 0.05, which
means that there is no difference between variables. Hence, the findings support H2o. To answer the question: “What is the effect of employees’ perceptions about business performance in relation to business strategy of their SMEs”, the findings show strong evidence that supports the relationship between employees’ perceptions about strategy and business performance. However, it requires not only the strategy itself that needs to be effective, but also the perceptions of employees. Employees’ perceptions are important and cannot be ignored. Employees are motivated and eager for achievement when they perceive the strategy of their companies can lead to increased performance and bring the benefits to them in the workplace.

Du Plessis
16
To answer “What is the effect of employees’ perceptions about business strategy?” the answer is from the analysis of Q12 using the frequency approach, the result demonstrated that employees who had some interest in business strategy accounted for 37%, those with a moderate interest in strategy were at 42%, and those who were very interested in strategy represented at 16%. The combined percentage of employees who had an interest in business strategy was 95%. The findings imply that most employees of SMEs in Laos recognise the importance of business strategy. Furthermore, three analyses were conducted to examine the difference in employees’ perceptions towards business strategy in which the results support hypothesis H2o – There is no difference in the perceptions of employees regarding business strategy. These results are obtained from the analyses of questions in Section A and B, which are as follows: The analysis of the difference between male and female (Q1) towards their levels of agreement that business strategy is necessary for any company (Q7) showed that there was no difference in the variances between male and female towards their agreement about business strategy. These findings indicate that employees perceive the significance of strategy and it’s greatly contribution to the company regardless of their gender. A majority of business people agree that business strategy is necessary for the company. Business strategy allows a company to build the competitive advantage, which will help the firm to outperform its competitors. When employees perceive the necessity of strategy, they are more focused on their work, and ready to perform at their best to carry out the strategy successfully. The study of the difference in age groups (Q2) towards the perceptions that their companies rely on business strategy for success (Q8) illustrated that the significant value of ANOVA was 0.781, which was greater than 0.05, and the significant values of multiple comparisons between these age groups were also greater than 0.05. Hence, the results suggest that there is no difference in age groups towards their perceptions about the importance of business strategy. Business strategy can be adjusted accordingly based on the skills and experience of the strategists. Managers and employees are responsible for the development and execution of the strategy. Despite their differences in age groups, skills, and knowledge; they must treat the strategy seriously in order to achieve their objectives. The study of the difference in respondents’ levels of education (Q3) towards their agreement about the importance of business strategy (Q10) showed the significant value of ANOVA was 0.708, which was greater than 0.05, and the significant values of multiple comparisons between these variables were also greater than 0.05. Therefore, the findings imply that there is no difference in employees’ levels of education regarding their perceptions about the importance of business strategy. Skilful and well-educated employees who perceive the importance of business strategy are likely to perform their jobs successfully. In addition, employees with lower levels of education can improve their skills if they follow the strategic plan and are given the authority to complete their tasks. Therefore, the findings help achieving objective 2, which verifies the validity of hypothesis 2 (H2).
Du Plessis
17
Hence, the perceptions of employees should be one of the factors that determine the successful business strategy of SMEs in Lao PDR. These perceptions play a crucial role in defining the outcome of strategy. Owners/managers need to ensure that employees are having positive perceptions in order to increase the chance of success when applying business strategy.
8. Conclusions The literature seems clear, that the perceptions of people have a great impact on their attitudes, which are one of the major factors responsible for people’s behaviour. Perception involves a sophisticated thinking process, starting from obtaining data from the external environment, analysing, and converting it through the cognitive process. The result of this process may vary among individuals. People’s perceptions of reality have greater influence on their behaviour than reality itself. The above analyses aim at answering question 1 and 2 – “What is the effect of employees’ perceptions about business performance in relation to business strategy of their SMEs?” and “What is the effect of employees’ perceptions about business strategy?” The results illustrate that a majority of employees have a positive perception towards business strategy regardless of their gender, age groups, and levels of education. Companies can take advantage of applying business strategy and enjoy the benefits it provides. It can help employees to understand the position of their firms in the market, increase their knowledge, accumulate their experience, and improve their efforts to accomplish organisational objectives. A positive perception towards business strategy is a good sign for the company. Employees will become more active and ready to undertake arduous tasks if they perceive the strategy can help improve their skills and abilities.
References Agarwal, K 2009. Perception management. The management tactics, New Delhi, India:
Global India Publications. Ahmad, SF, Gilkar, NA & Darzi, JA 2008. Organisational behaviour. New Delhi, India: Atlantic
Publishers. Aquinas, PG 2008. Organizational behaviour, Concepts, realities, applications, and
challenges. New Delhi, India: Excel Books. Beck, T, Demirgüç-Kunt, A & Levine, R 2003. Small and medium enterprises, growth, and
poverty: Cross-country evidence. Washington, DC: World Bank. Bourletidis, K 2013. ‘The strategic management of market information to SMEs during
economic crisis’. Procedia - Social and Behavioural Sciences, vol 73, 598-606. doi: 10.1016/j.sbspro.2013.02.096
Brace, I 2013. Questionnaire design. How to plan, structure and write survey material for effective market research (3rd ed.). London, England: Kogan Page.
Bryman, A 2012. Social research methods, Research (4th ed.). New York, NY: Oxford University Press.

Du Plessis
18
Burke, RJ 2011. Human resource management in small and medium-sized enterprises: Benefits and challenges. In CL Cooper & RJ Burke (Eds.), Human resource management in small business: Achieving peak performance (pp. 10-70). Northampton, MA: Edward Elgar.
Champoux, JE 2011. Organizational behaviour. Integrating individuals, groups, and organizations (4th ed.). Binghamton, NY: Routledge.
Clegg, SR, Carter, C, Kornberger, M & Schweitzer, J 2011. Strategy, Theory and practice. London, England: SAGE Publications.
Dantzker, ML, & Hunter, RD 2012. Research methods. Criminology and criminal justice (3rd ed.). In Woburn, MA: Jones & Bartlett Learning.
De Wit, B & Meyer, R 2010. Strategy. Process, content, context, an international perspective (4th ed.). Hampshire, England: South-Western Cengage Learning.
Du Plessis, AJ, Marriott JR & Manichith, P 2016. ‘Key capabilities for strategic leaders in Lao commercial banking sector to maximise competitive advantage’. Journal of Community Positive Practices vol 16 no1: pp 56-67.
Du Plessis, AJ, Douangphichit, N and Dodd, P 2016. HRM in relation to employee motivation and job performance in the hospitality industry. Journal of International Business Research and Marketing, vol 1 no. 4, May 2016: pp 1-13
Du Plessis, AJ 2015a. HRM and ER in South Africa: contemporary theory and practice. In Du Plessis, AJ (Ed) Munyeka, W, Chipunza, C, Samuel, MO, Naidoo, K, Keyser, E & Gura,
M. Juta Publishers, Cape Town, South Africa. Du Plessis, AJ 2015b. Evidence of the changing activities, goals and roles of HR
practitioners. Journal of Community Positive Practices Vol 15 no. 1, pp 3-16 Du Plessis, AJ, Frederick, H & Maritz, A 2013. Education and training deficits in industrial
clusters: Empirical evidence that managers can use to rectify the skills gap in Auckland precinct. National Academy of Management. Actual Problems of Economics, vol 2 no. 3, pp 12-20.
Du Plessis, AJ, Sun, J, Marriott, RJ 2012. Comparison of cultural diversity in a traditional Asian and a Western joint venture in China: some empirical evidence. Paper presented at the World Business and Economics Research Conference, 10-11 December, Auckland, New Zealand.
Du Plessis, AJ, Nel PS & Al-Shamaa, S 2012. ‘Exploring the perceptions of tertiary students’ perceptions and attitudes towards environmental sustainability’. International Journal of Advances in Management Sciences, vol 1, no 3: pp November: 91-100.
Faulkner, DO & Campbell, A 2006. The Oxford handbook of strategy. A strategy overview and competitive strategy, New York, NY: Oxford University Press.
Fischer, E & Reuber, R 2000. Industrial clusters and SME promotion in developing countries. London, England: Commonwealth Secretariat.
French, R, Rayner, C, Rees, G & Rumbles, S 2011. Organizational behaviour (2nd ed.). Hoboken, NJ: John Wiley & Sons.
Hallberg, K 2000. A market-oriented strategy for small and medium scale enterprises. Washington, DC: World Bank.
Hayes, G 2009. A practical guide to business valuations for SMEs. New South Wales, Australia: CCH Australia.
Kiggundu, MN 2002. Managing globalization in developing countries and transition economies: Building capacities for a changing world. Westport, CT: Praeger.
Kothari, CR 2008. Research methodology: Methods and techniques (2nd ed.). New Delhi, India: New Age International.

Du Plessis
19
Kyophilavong, P 2007. SMEs development in Lao PDR. (n.d.): ERIA. Retrieved from http://www.eria.org/SMEs Development in Lao PDR.pdf.
Laos economic situation. n.d. Retrieved August 06, 2013, from ASEAN-Australia-New Zealand Free Trade Agreement http://www.asean.fta.govt.nz/laos-economic-situation.
Lee, EM, Park, SY & Lee, HJ 2013. Employee perception of CSR activities: Its antecedents and consequences. Journal of Business Research, vol. 66. no. 10, 1716-1724. doi: 10.1016/j.jbusres.2012.11.008
Lodico, MG, Spaulding, DT & Voegtle, KH 2010. Methods in educational research: From theory to practice (2nd ed.). Los Angeles, CA: Jossey-Bass.
Marlow, CR & Boone, S 2011. Research methods for generalist social work. Los Angeles, CA: Brooks/Cole.
McNabb, DE 2010. Research methods for political science: Quantitative and qualitative approaches (2nd ed.). New York, NY: M.E. Sharpe.
Mills, AJ, Mills, JCH, Bratton, J & Forshaw, C 2007. Organizational behaviour in a global context. Peterborough, Canada: Broadview Press.
Munro, D 2013. A guide to SME financing. New York, NY: Palgrave Macmillan. Murray, P, Poole, D & Jones, G 2006. Contemporary issues in management and
organisational behaviour. Mason, OH: Thomson Learning. Murthy, US 2009. Conducting creativity brainstorming sessions in small and medium-sized
enterprises using computer-mediated communication tools. In G. Dhillon, BC Stahl & R Baskerville (Eds.), Information systems - Creativity and innovation in small and medium-sized enterprises (pp. 42-59). New York, NY: Springer.
Nwankwo, S & Gbadamosi, T 2010). Entrepreneurship marketing: Principles and practice of SME marketing. Binghamton, NY: Routledge.
Organisation for Economic Co-operation and Development. (2006). The SME financing gap: Theory and evidence. Paris, France: Author.
Ranganayakulu, KCS 2005. Organisational behaviour. New Delhi, India: Atlantic Publishers. Ridenour, CS & Newman, I 2008. Mixed methods research: Exploring the interactive
continuum. Chicago, IL: Southern Illinois University Press. Rubin, A & Babbie, E 2012. Essential research methods for social work (3rd ed.). Los
Angeles, CA: Brooks/Cole. Sekaran, U & Bougie, R 2009. Research methods for business: A skill building approach (5th
ed.). Chichester, England: John Wiley & Sons. Sims, RR 2002. Managing organizational behaviour. Westport, CT: Quorum Books. Singh, K 2010. Organizational behaviour: Text and cases. New Delhi, India: Pearson
Education. Sinha, JBP 2008. Culture and organizational behaviour. New Delhi, India: SAGE
Publications. Thomas, RM 2003. Blending qualitative and quantitative research methods in theses and
dissertations. Los Angeles, CA: Corwin Press. Ulwick, AW 2005. Business strategy formulation: Theory, process and the intellectual
Revolution. Westport, CT: Quorum Books. White, TL & McBurney, DH 2013. Research methods (9th ed.). Los Angeles, CA: Wadsworth.