Embed Size (px)
Citation preview
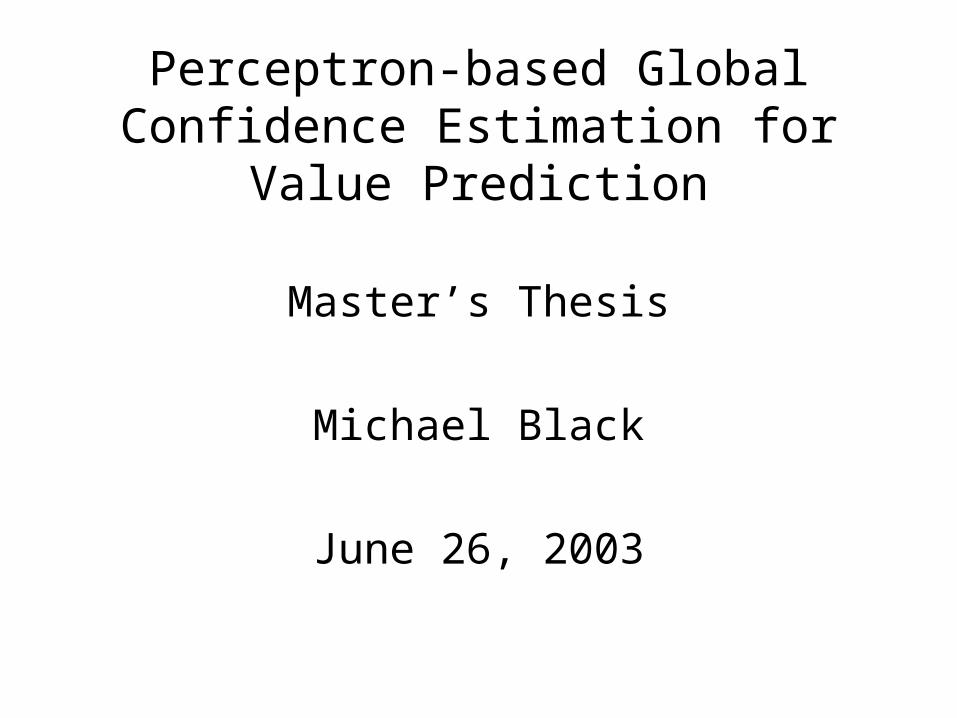
Perceptron-based Global Confidence Estimation for Value Prediction
Master’s Thesis
Michael Black
June 26, 2003
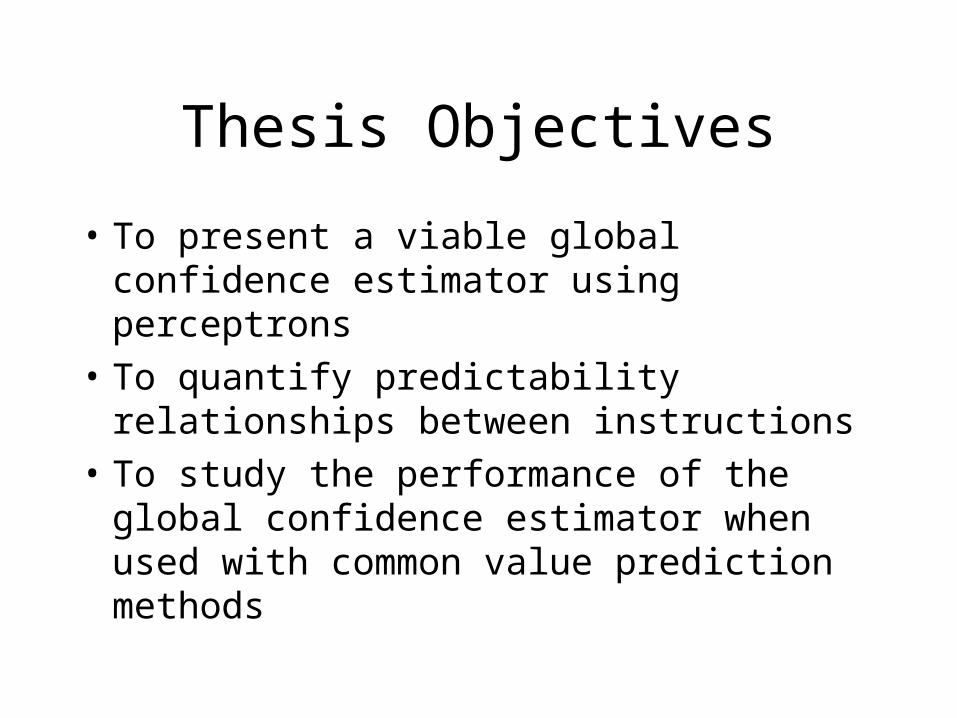
Thesis Objectives
• To present a viable global confidence estimator using perceptrons
• To quantify predictability relationships between instructions
• To study the performance of the global confidence estimator when used with common value prediction methods
Presentation Outline
• Background:– Data Value Prediction– Confidence Estimation
• Predictability Relationships
• Perceptrons
• Perceptron-based Confidence Estimator
• Experimental Results and Conclusions
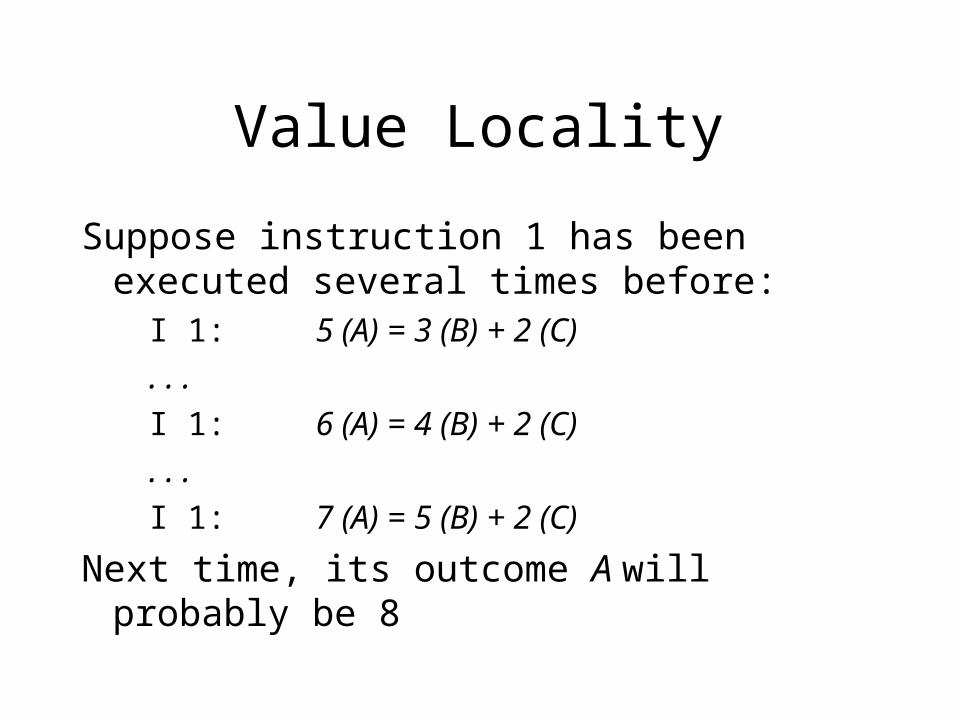
Value Locality
Suppose instruction 1 has been executed several times before:
I 1: 5 (A) = 3 (B) + 2 (C)
. . .
I 1: 6 (A) = 4 (B) + 2 (C)
. . .
I 1: 7 (A) = 5 (B) + 2 (C)
Next time, its outcome A will probably be 8
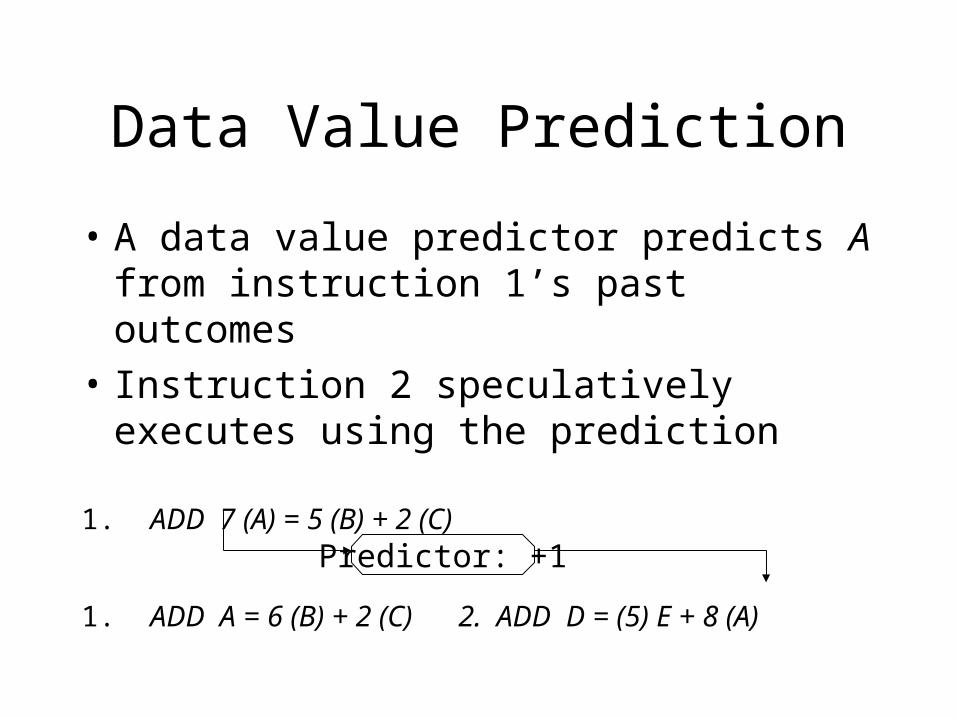
Data Value Prediction
• A data value predictor predicts A from instruction 1’s past outcomes
• Instruction 2 speculatively executes using the prediction
1. ADD 7 (A) = 5 (B) + 2 (C)
1. ADD A = 6 (B) + 2 (C) 2. ADD D = (5) E + 8 (A)
Predictor: +1
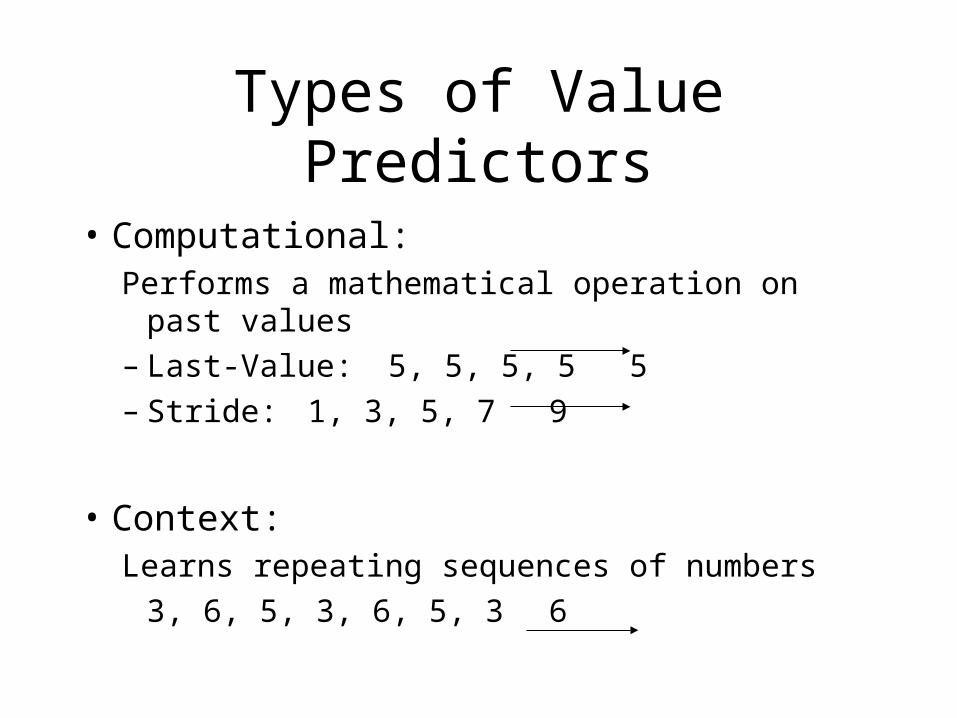
Types of Value Predictors
• Computational:Performs a mathematical operation on past values– Last-Value: 5, 5, 5, 5 5 – Stride: 1, 3, 5, 7 9
• Context:Learns repeating sequences of numbers
3, 6, 5, 3, 6, 5, 3 6
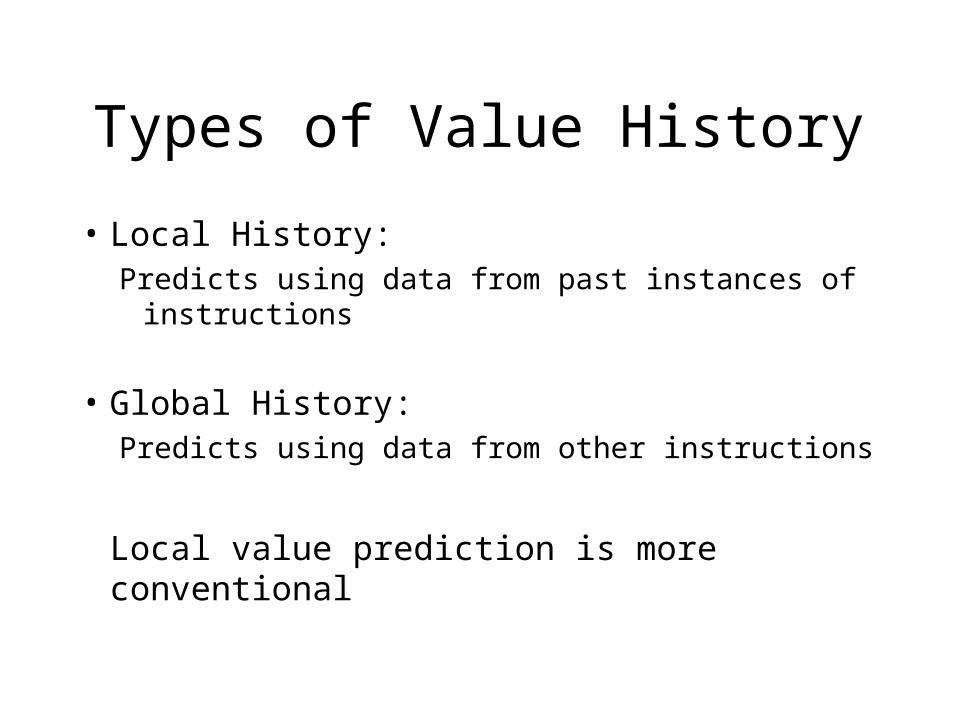
Types of Value History
• Local History:Predicts using data from past instances of
instructions
• Global History:Predicts using data from other instructions
Local value prediction is more conventional
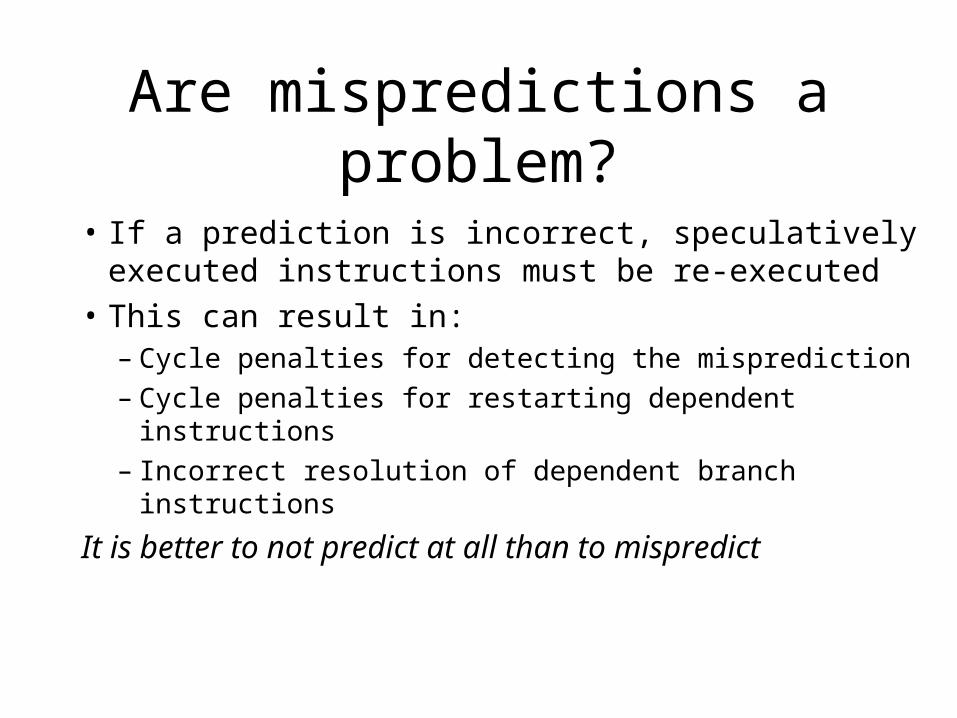
Are mispredictions a problem?
• If a prediction is incorrect, speculatively executed instructions must be re-executed
• This can result in:– Cycle penalties for detecting the misprediction– Cycle penalties for restarting dependent instructions– Incorrect resolution of dependent branch instructions
It is better to not predict at all than to mispredict
Confidence Estimator
• Decides whether to make a prediction for an instruction
• Bases decisions on the accuracy of past predictions
• Common confidence estimation method:Saturating Up-Down Counter
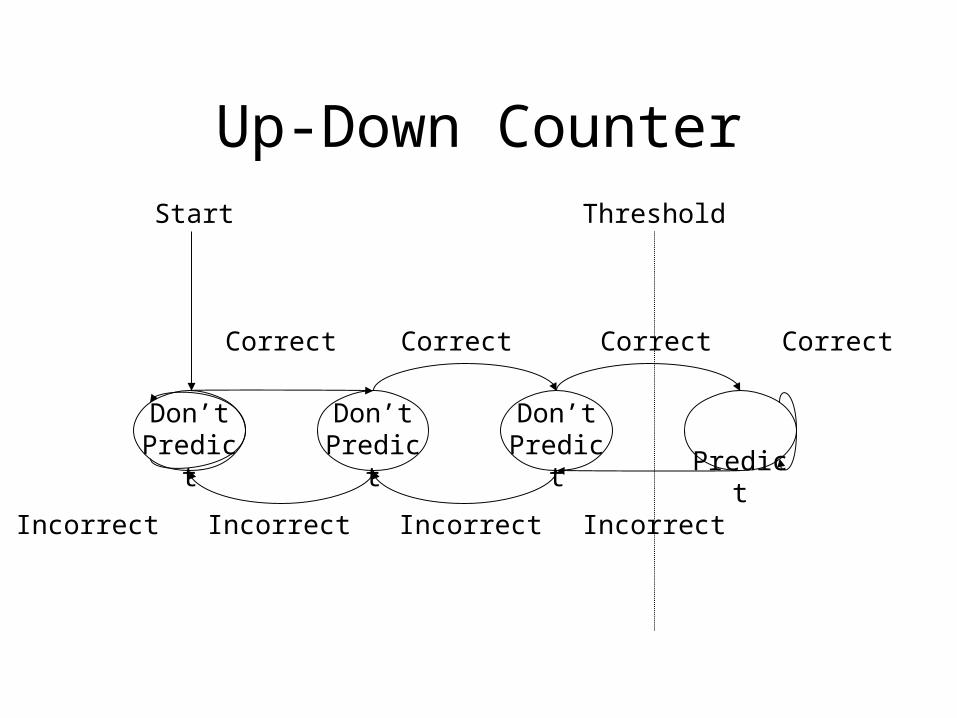
Up-Down Counter
Don’t Predict
Don’t Predict
Don’t Predict
Predict
Start
Correct
Incorrect
Correct Correct Correct
IncorrectIncorrectIncorrect
Threshold
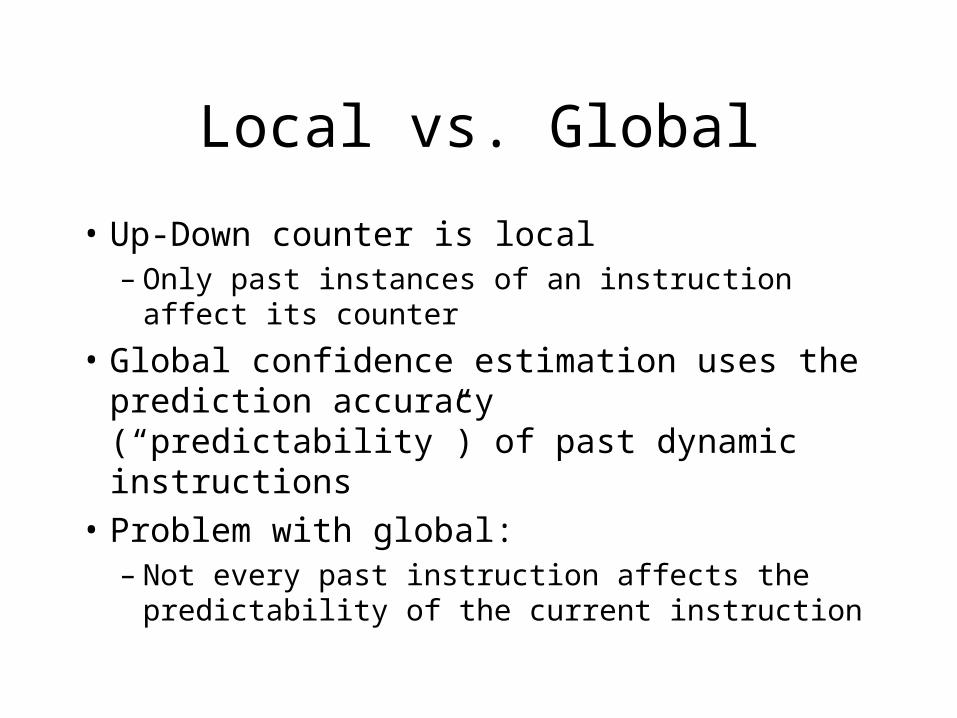
Local vs. Global
• Up-Down counter is local– Only past instances of an instruction affect its
counter
• Global confidence estimation uses the prediction accuracy (“predictability”) of past dynamic instructions
• Problem with global:– Not every past instruction affects the predictability
of the current instruction
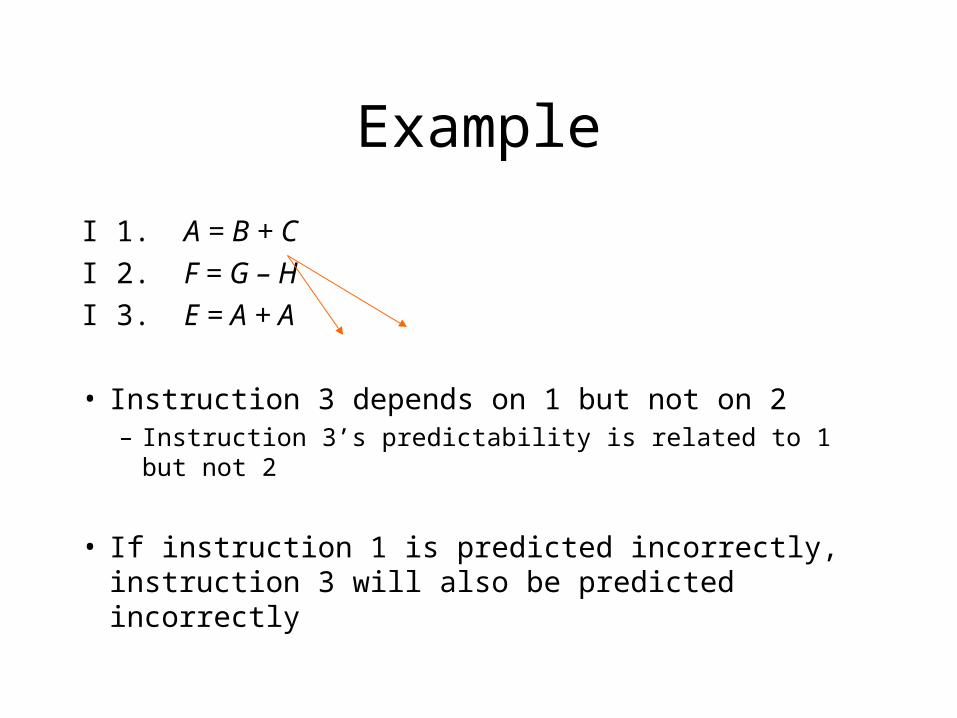
Example
I 1. A = B + C
I 2. F = G – H
I 3. E = A + A
• Instruction 3 depends on 1 but not on 2– Instruction 3’s predictability is related to 1 but not 2
• If instruction 1 is predicted incorrectly, instruction 3 will also be predicted incorrectly
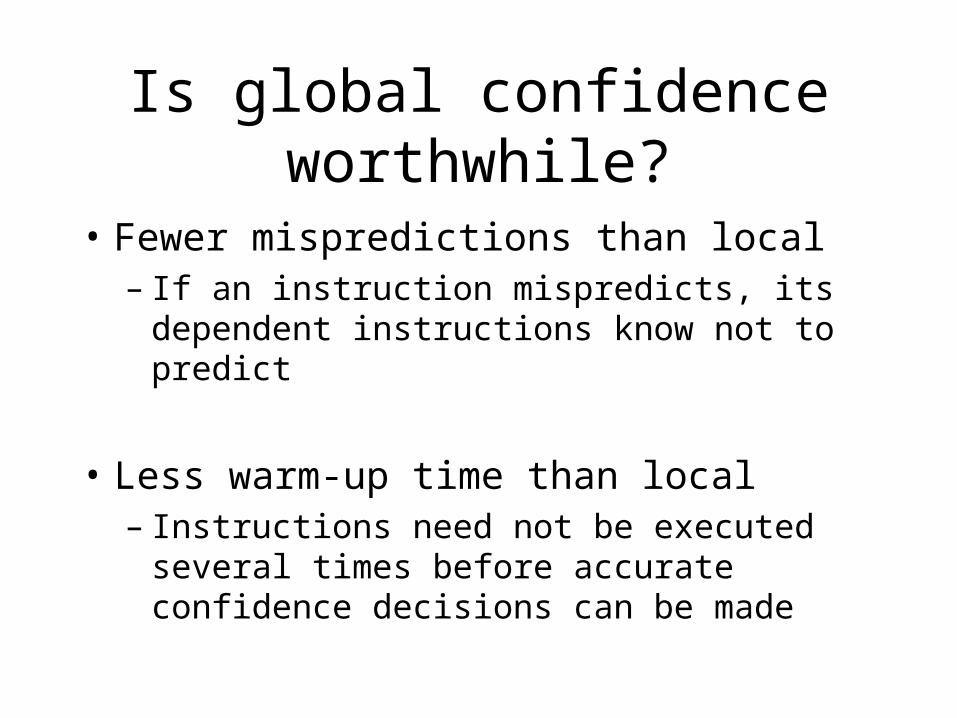
Is global confidence worthwhile?
• Fewer mispredictions than local– If an instruction mispredicts, its dependent
instructions know not to predict
• Less warm-up time than local– Instructions need not be executed several times
before accurate confidence decisions can be made
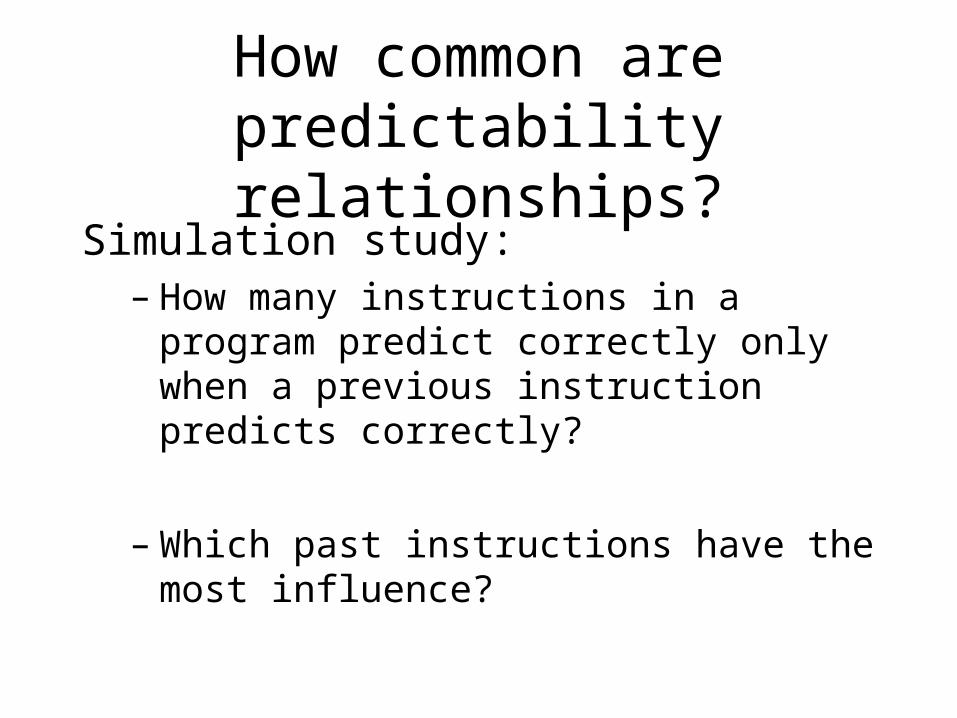
How common are predictability relationships?
Simulation study:– How many instructions in a program predict
correctly only when a previous instruction predicts correctly?
– Which past instructions have the most influence?
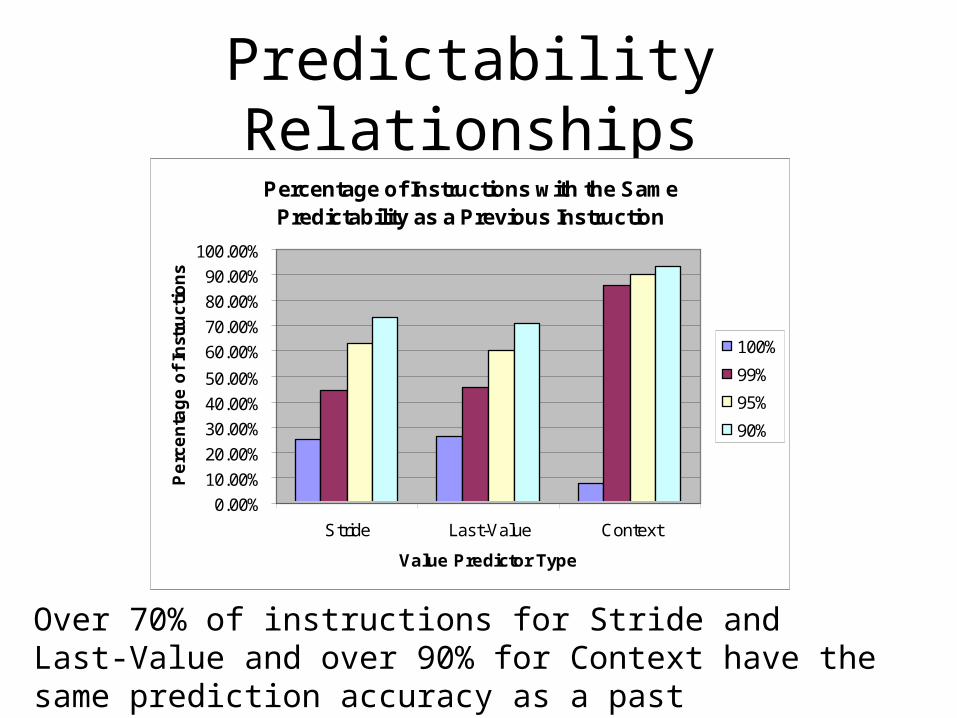
Predictability RelationshipsPercentage of Instructions with the Same
Predictability as a Previous Instruction
0.00%
10.00%
20.00%
30.00%
40.00%
50.00%
60.00%
70.00%
80.00%
90.00%
100.00%
Stride Last-Value Context
Value Predictor Type
Pe
rce
nta
ge
of
Inst
ruct
ion
s
100%
99%
95%
90%
Over 70% of instructions for Stride and Last-Value and over 90% for Context have the same prediction accuracy as a past instruction 90% of the time!
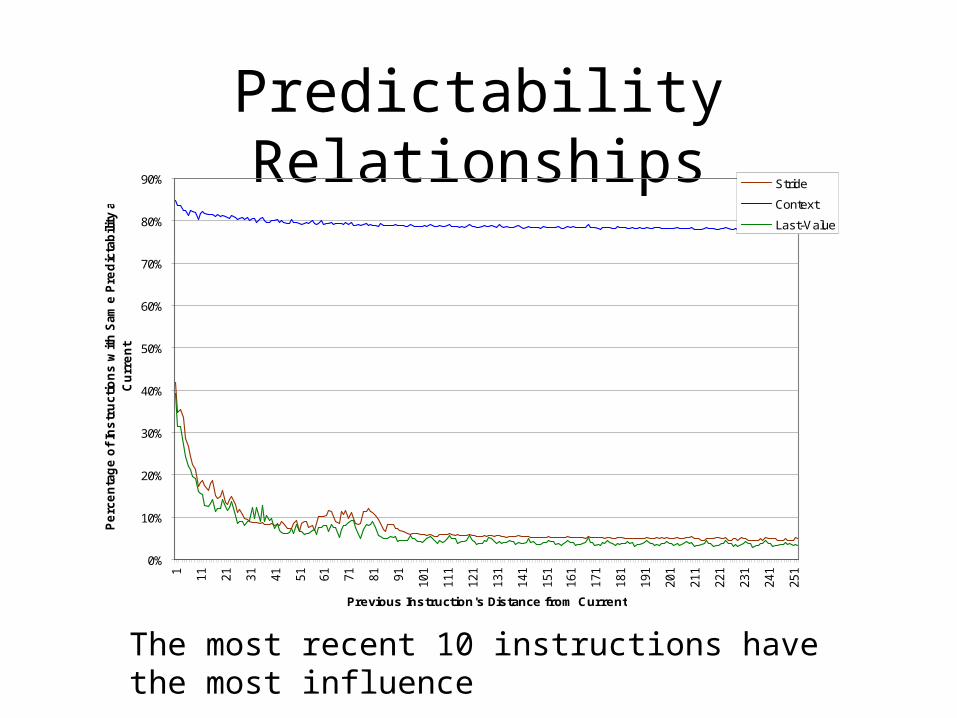
Predictability Relationships
0%
10%
20%
30%
40%
50%
60%
70%
80%
90%1 11
21
31
41
51
61
71
81
91
101
111
121
131
141
151
161
171
181
191
201
211
221
231
241
251
Previous Instruction's Distance from Current
Pe
rce
nta
ge
of
Ins
tru
cti
on
s w
ith
Sam
e P
red
icta
bilit
y a
s
Cu
rre
nt
Stride
Context
Last-Value
The most recent 10 instructions have the most influence
Global Confidence Estimation
A global confidence estimator must:
1. Identify for each instruction which past instructions have similar predictability
2. Use their prediction accuracy to decide whether to predict or not predict
Neural Network
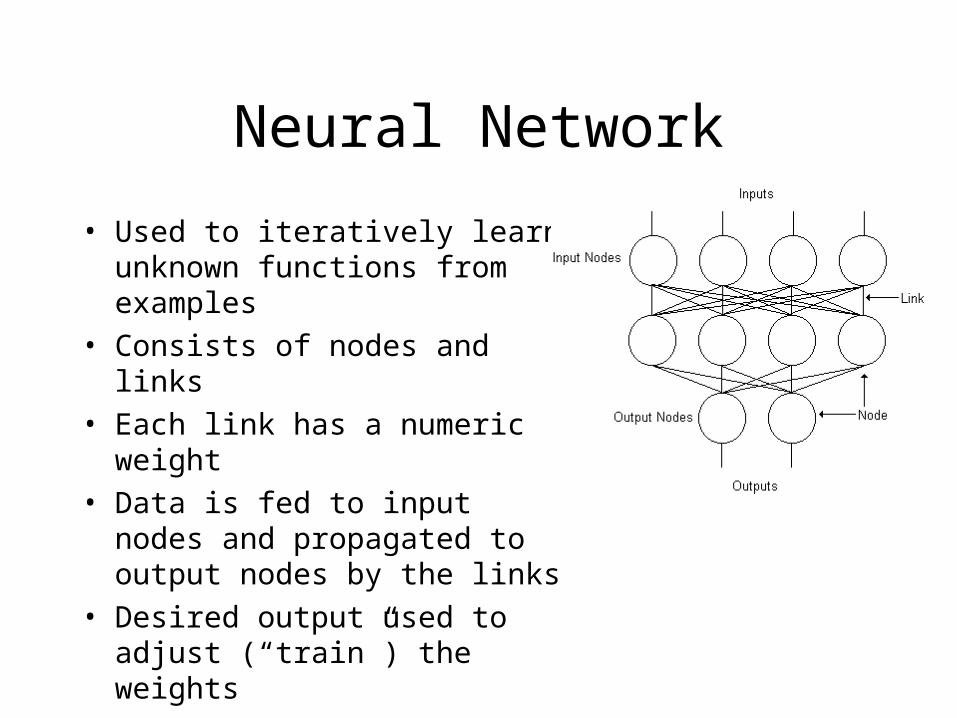
• Used to iteratively learn unknown functions from examples
• Consists of nodes and links
• Each link has a numeric weight
• Data is fed to input nodes and propagated to output nodes by the links
• Desired output used to adjust (“train”) the weights
Perceptron
• Perceptrons only have input and output nodes
• They are much easier to implement and train than larger neural networks
• Can only learn linearly separable functions
Perceptron Computation
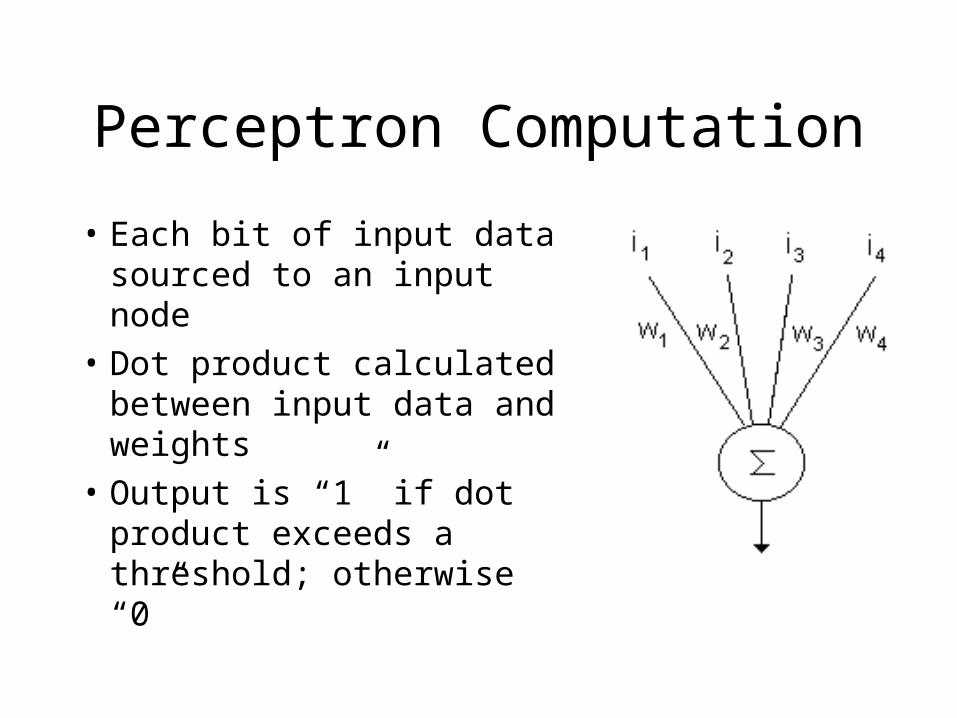
• Each bit of input data sourced to an input node
• Dot product calculated between input data and weights
• Output is “1” if dot product exceeds a threshold; otherwise “0”
Perceptron Training
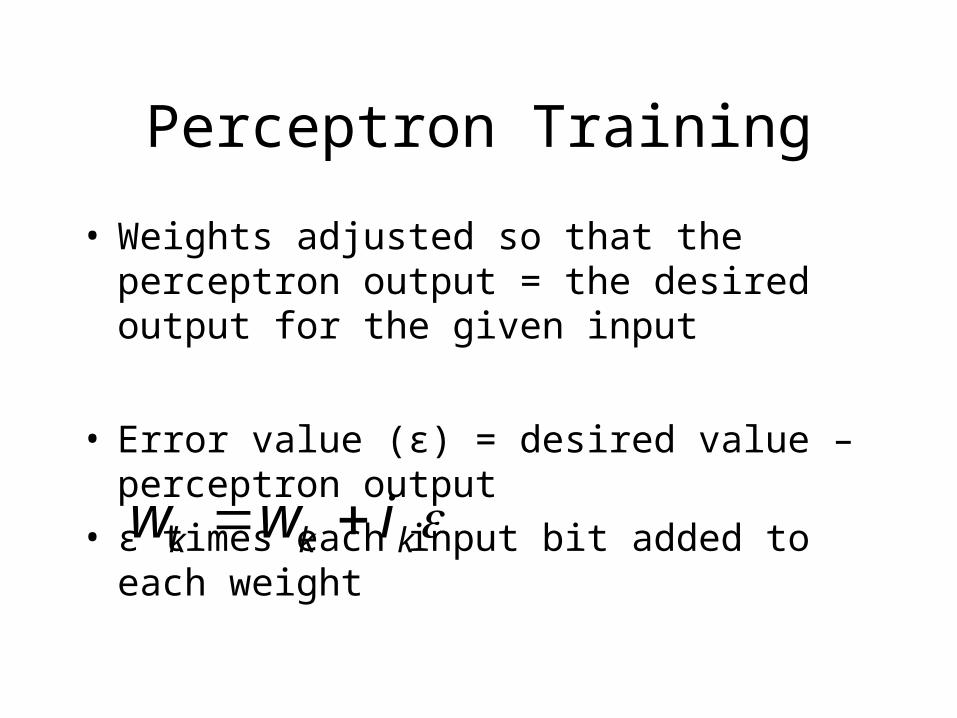
• Weights adjusted so that the perceptron output = the desired output for the given input
• Error value (ε) = desired value – perceptron output• ε times each input bit added to each weight
kkk iww
Weights
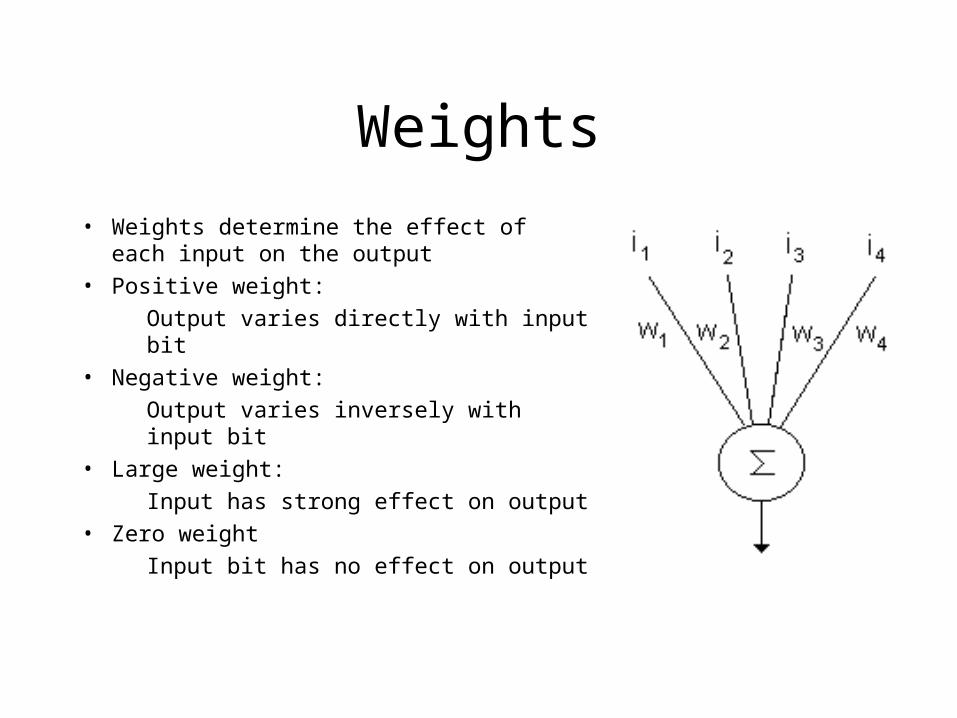
• Weights determine the effect of each input on the output
• Positive weight:
Output varies directly with input bit
• Negative weight:
Output varies inversely with input bit
• Large weight:
Input has strong effect on output
• Zero weight
Input bit has no effect on output
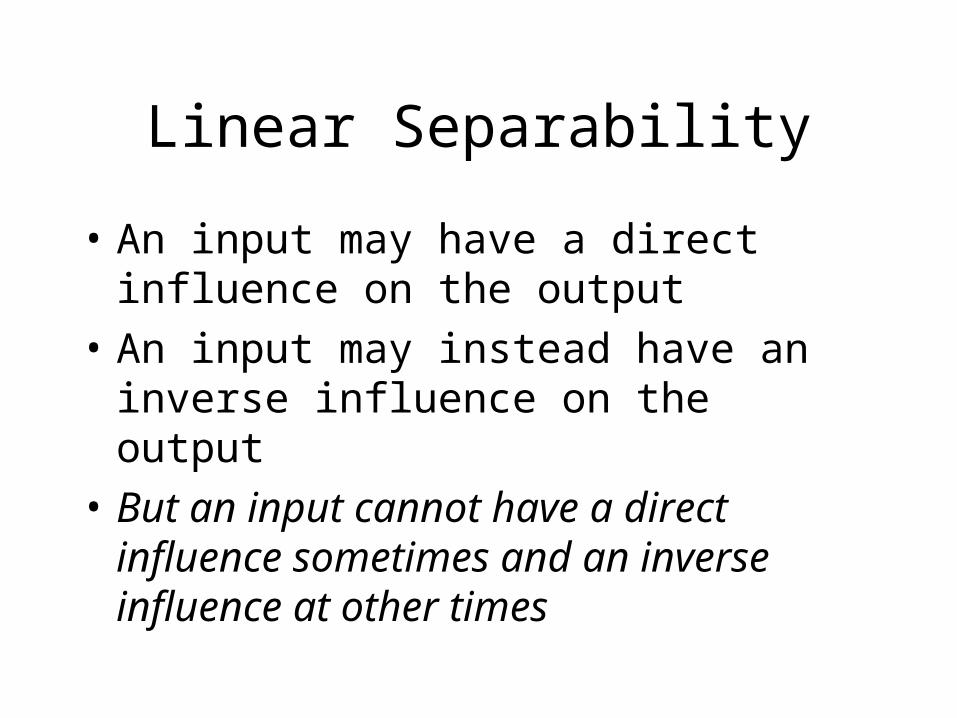
Linear Separability
• An input may have a direct influence on the output
• An input may instead have an inverse influence on the output
• But an input cannot have a direct influence sometimes and an inverse influence at other times
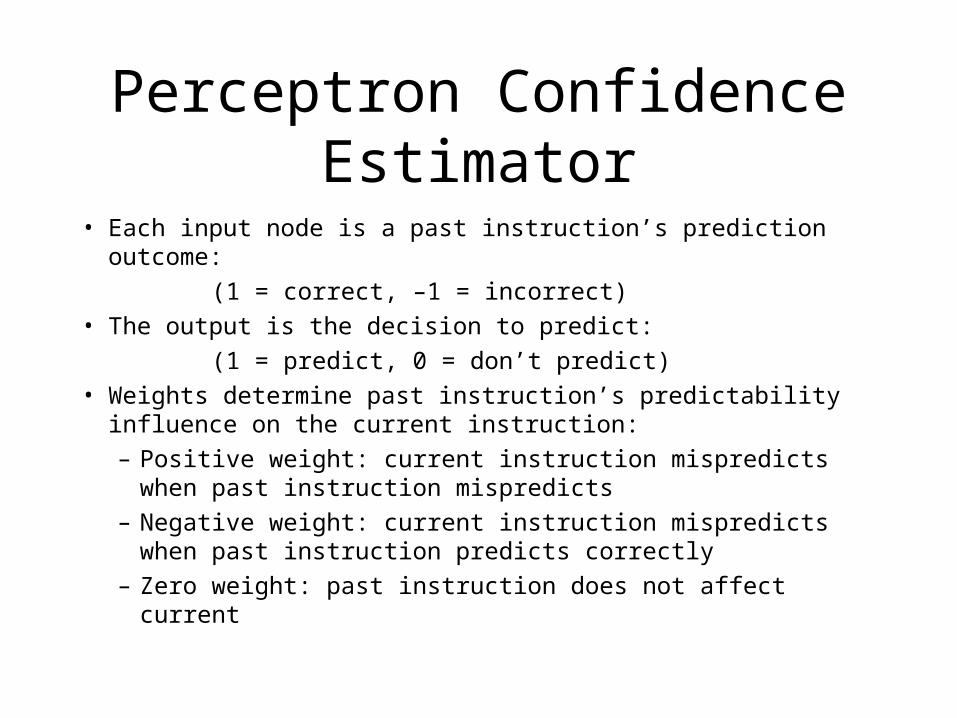
Perceptron Confidence Estimator
• Each input node is a past instruction’s prediction outcome:
(1 = correct, –1 = incorrect)• The output is the decision to predict:
(1 = predict, 0 = don’t predict)• Weights determine past instruction’s predictability influence on
the current instruction:– Positive weight: current instruction mispredicts when past
instruction mispredicts– Negative weight: current instruction mispredicts when past
instruction predicts correctly– Zero weight: past instruction does not affect current
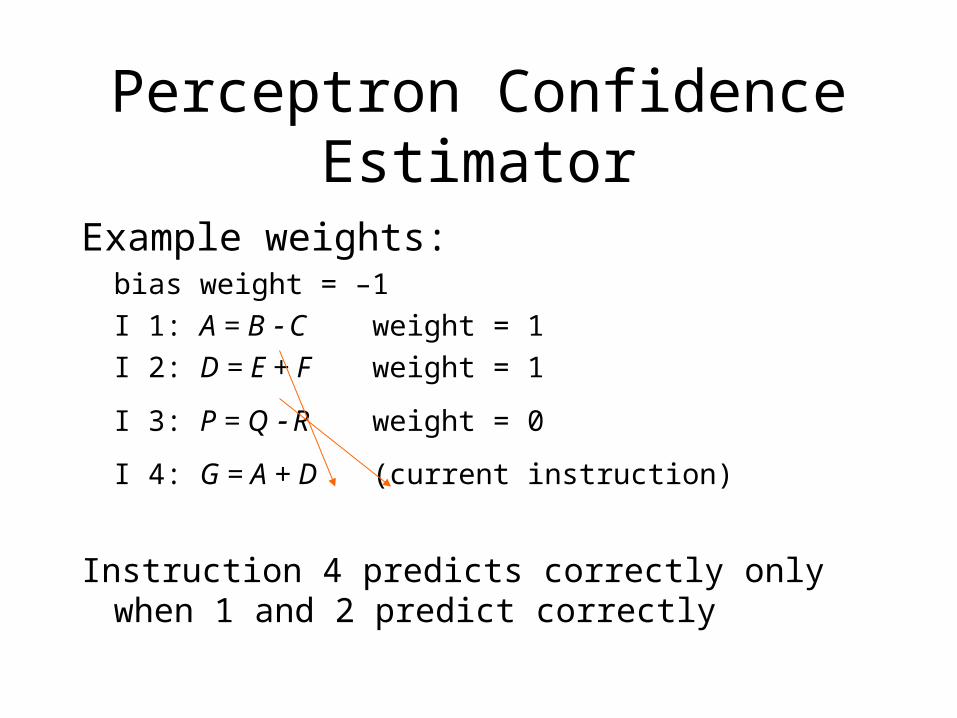
Perceptron Confidence Estimator
Example weights:bias weight = –1
I 1: A = B C weight = 1
I 2: D = E + F weight = 1
I 3: P = Q R weight = 0
I 4: G = A + D (current instruction)
Instruction 4 predicts correctly only when 1 and 2 predict correctly
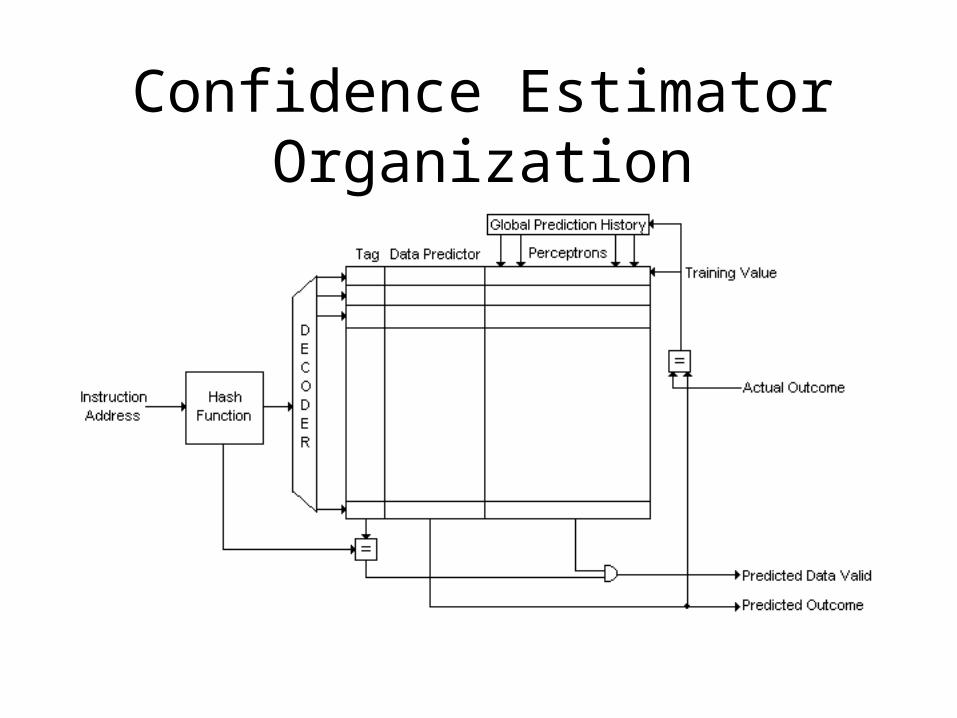
Confidence Estimator Organization
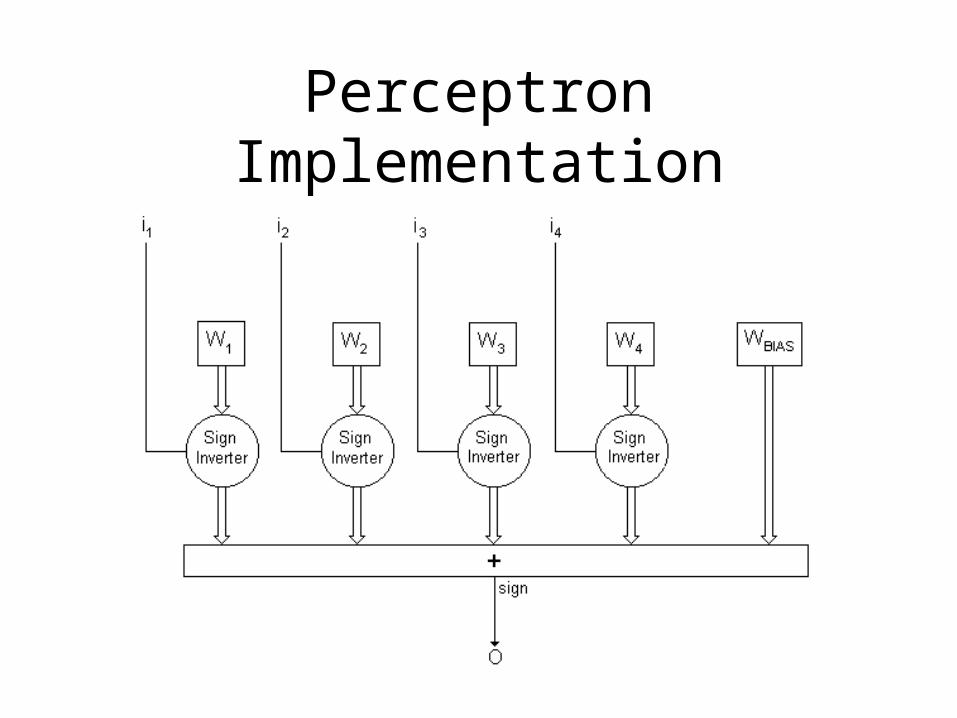
Perceptron Implementation
Weight Value Distribution
Simulation Study:– What are typical perceptron weight values?– How does the type of predictor influence the
weight distribution?– What minimum range do the weights need to
have?
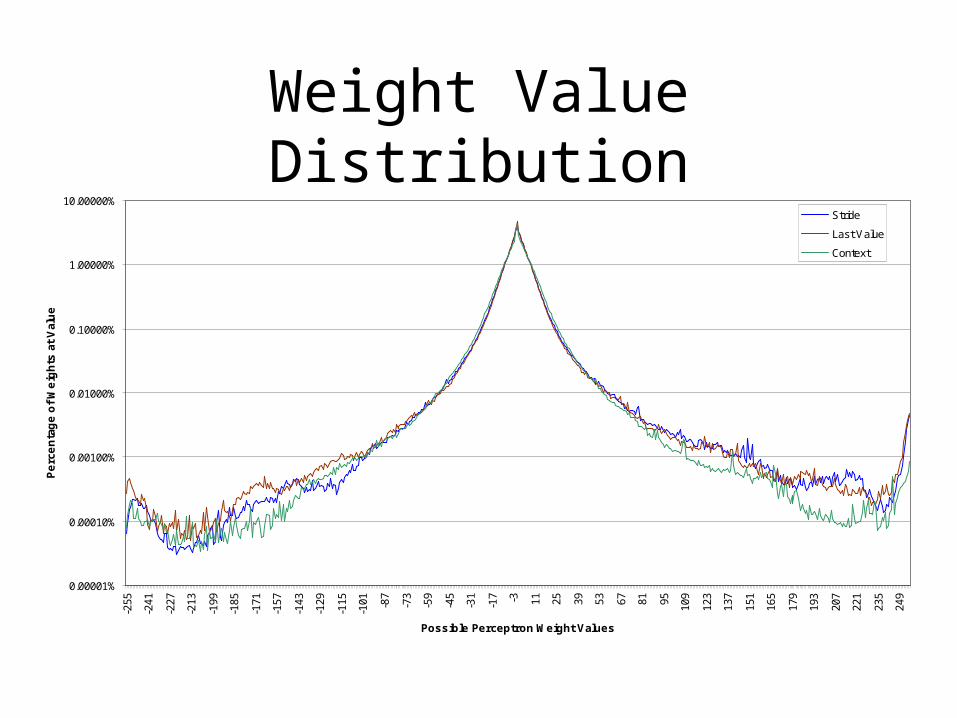
Weight Value Distribution
0.00001%
0.00010%
0.00100%
0.01000%
0.10000%
1.00000%
10.00000%
-255
-241
-227
-213
-199
-185
-171
-157
-143
-129
-115
-101 -87
-73
-59
-45
-31
-17 -3 11 25 39 53 67 81 95 109
123
137
151
165
179
193
207
221
235
249
Possible Perceptron Weight Values
Pe
rce
nta
ge
of
We
igh
ts a
t V
alu
e
Stride
Last Value
Context
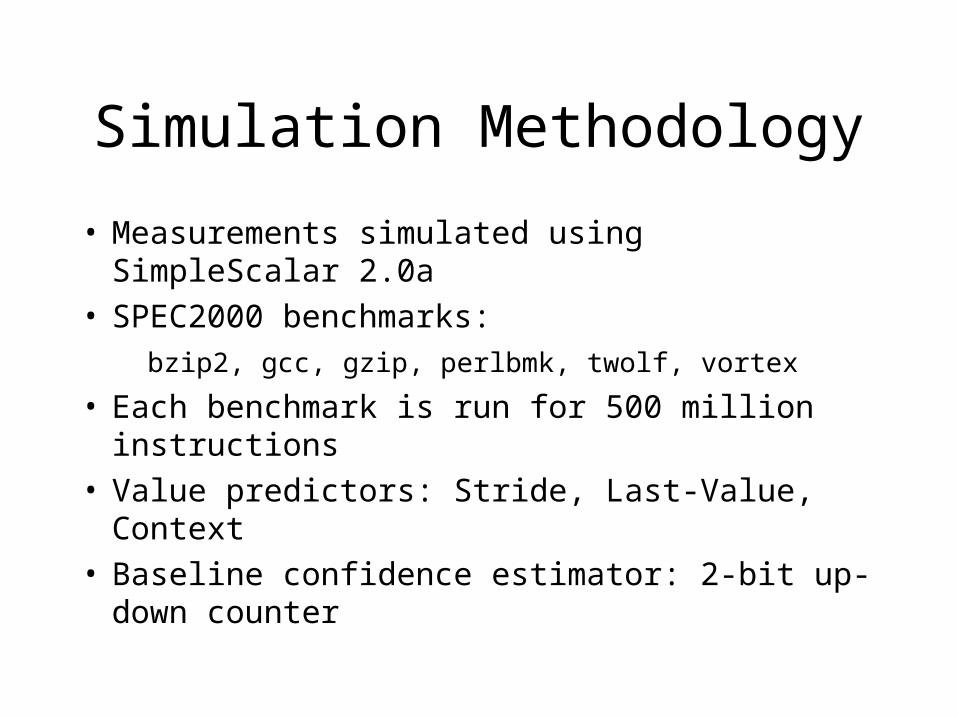
Simulation Methodology
• Measurements simulated using SimpleScalar 2.0a• SPEC2000 benchmarks:
bzip2, gcc, gzip, perlbmk, twolf, vortex
• Each benchmark is run for 500 million instructions
• Value predictors: Stride, Last-Value, Context• Baseline confidence estimator: 2-bit up-down
counter
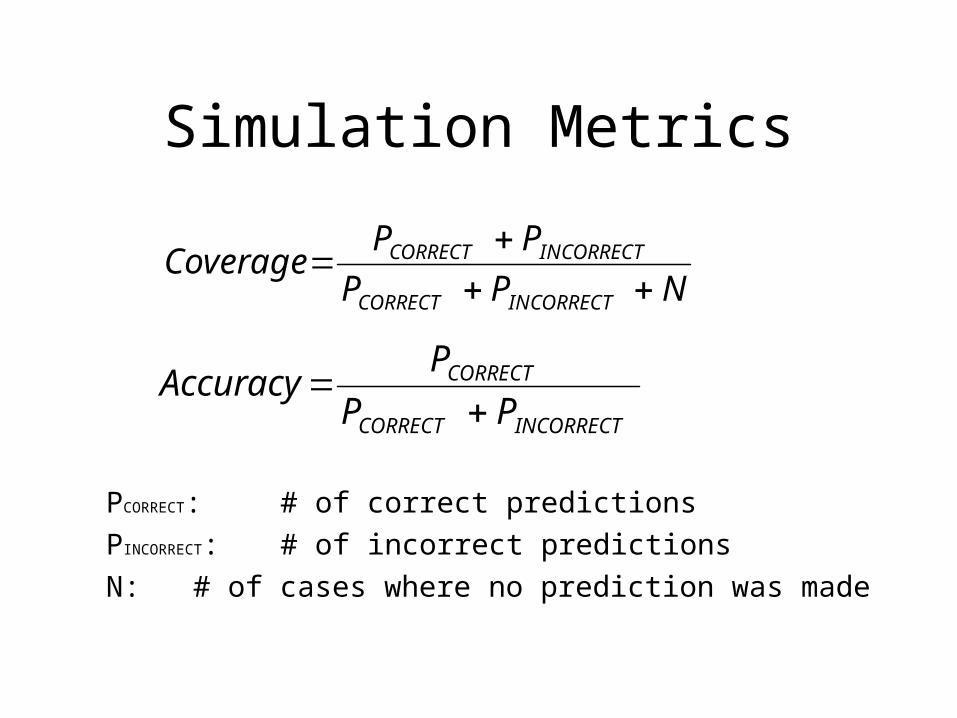
Simulation Metrics
PCORRECT: # of correct predictions
PINCORRECT: # of incorrect predictions
N: # of cases where no prediction was made
NPP
PPCoverage
INCORRECTCORRECT
INCORRECTCORRECT
INCORRECTCORRECT
CORRECT
PP
PAccuracy
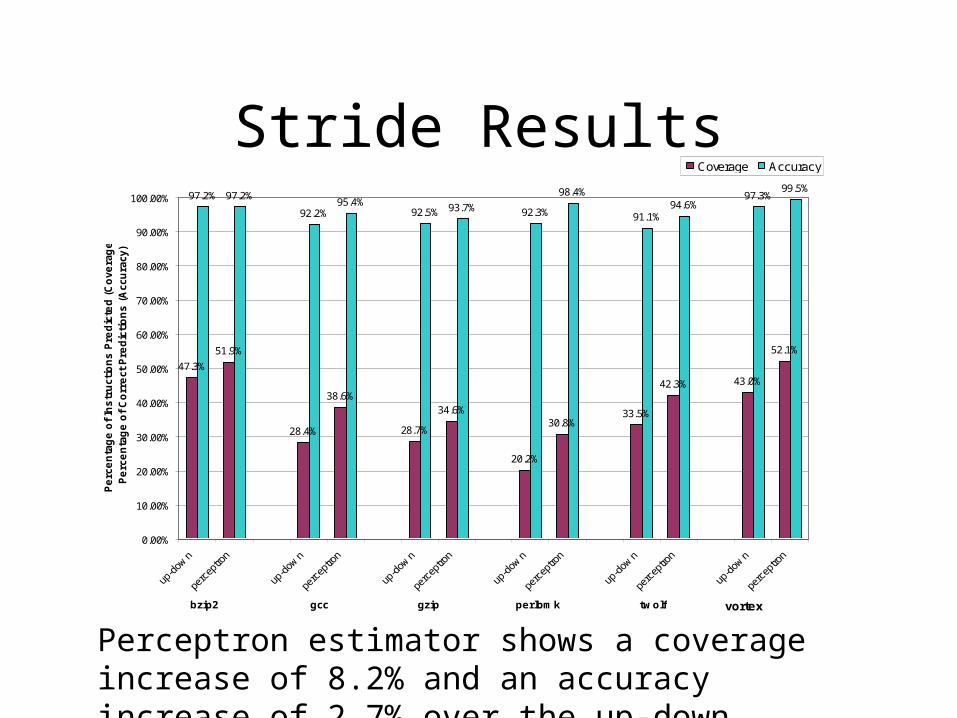
Stride Results
47.3%
51.9%
28.4%
38.6%
28.7%
34.6%
20.2%
30.8%33.5%
42.3% 43.0%
52.1%
97.2% 97.2%
92.2%95.4%
92.5% 93.7% 92.3%
98.4%
91.1%94.6%
97.3%99.5%
0.00%
10.00%
20.00%
30.00%
40.00%
50.00%
60.00%
70.00%
80.00%
90.00%
100.00%
Pe
rce
nta
ge
of
Ins
tru
cti
on
s P
red
icte
d (
Co
ve
rag
e)
Pe
rce
nta
ge
of
Co
rre
ct
Pre
dic
tio
ns
(A
ccu
racy)
Coverage Accuracy
gzipgcc perlbmkbzip2 twolf vortex
Perceptron estimator shows a coverage increase of 8.2% and an accuracy increase of 2.7% over the up-down counter
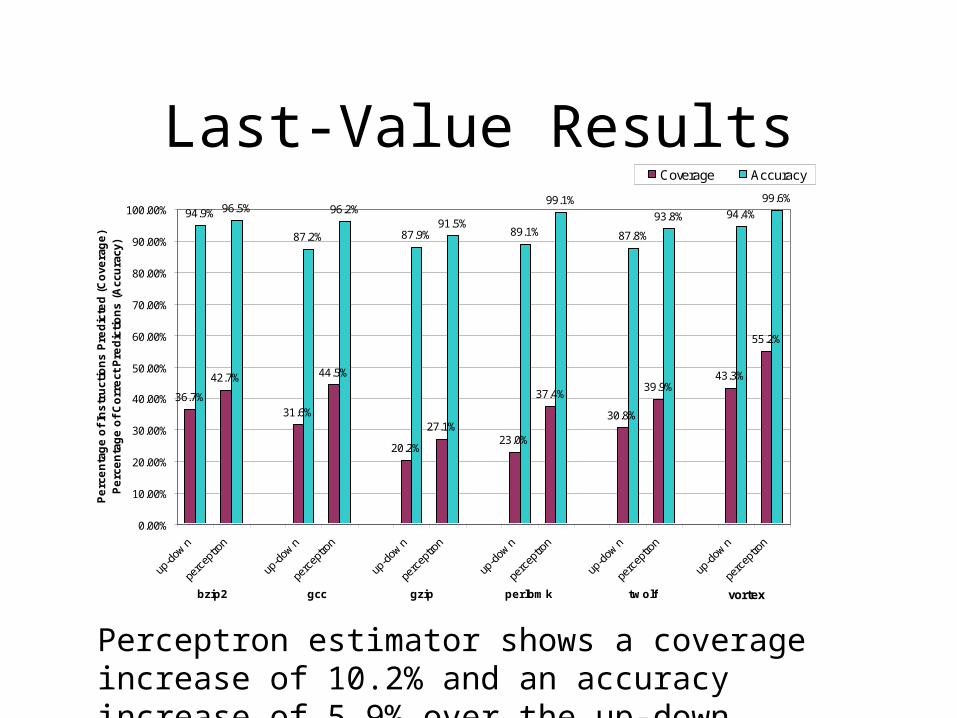
Last-Value Results
36.7%
42.7%
31.6%
44.5%
20.2%
27.1%23.0%
37.4%
30.8%
39.9%43.3%
55.2%
94.9% 96.5%
87.2%
96.2%
87.9%91.5%
89.1%
99.1%
87.8%
93.8% 94.4%
99.6%
0.00%
10.00%
20.00%
30.00%
40.00%
50.00%
60.00%
70.00%
80.00%
90.00%
100.00%
up-d
own
perc
eptro
n
up-d
own
perc
eptro
n
up-d
own
perc
eptro
n
up-d
own
perc
eptro
n
up-d
own
perc
eptro
n
up-d
own
perc
eptro
n
Pe
rce
nta
ge
of
Ins
tru
ctio
ns
Pre
dic
ted
(C
ove
rag
e)
Pe
rce
nta
ge
of
Co
rre
ct P
red
icti
on
s (
Acc
ura
cy)
Coverage Accuracy
gzipgcc perlbmkbzip2 twolf vortex
Perceptron estimator shows a coverage increase of 10.2% and an accuracy increase of 5.9% over the up-down counter
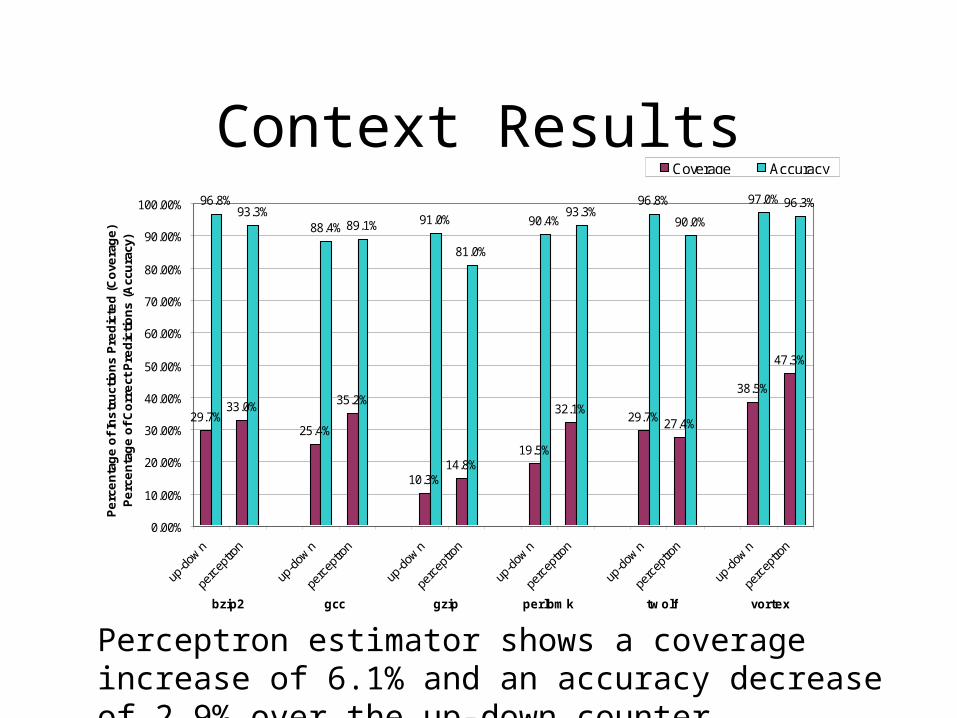
Context Results
29.7%33.0%
25.4%
35.2%
10.3%14.8%
19.5%
32.1%29.7% 27.4%
38.5%
47.3%
96.8%93.3%
88.4% 89.1% 91.0%
81.0%
90.4%93.3%
96.8%
90.0%
97.0% 96.3%
0.00%
10.00%
20.00%
30.00%
40.00%
50.00%
60.00%
70.00%
80.00%
90.00%
100.00%
Pe
rce
nta
ge
of
Ins
tru
ctio
ns
Pre
dic
ted
(C
ove
rag
e)
Pe
rce
nta
ge
of
Co
rre
ct P
red
icti
on
s (
Acc
ura
cy)
Coverage Accuracy
gzipgcc perlbmkbzip2 twolf vortex
Perceptron estimator shows a coverage increase of 6.1% and an accuracy decrease of 2.9% over the up-down counter
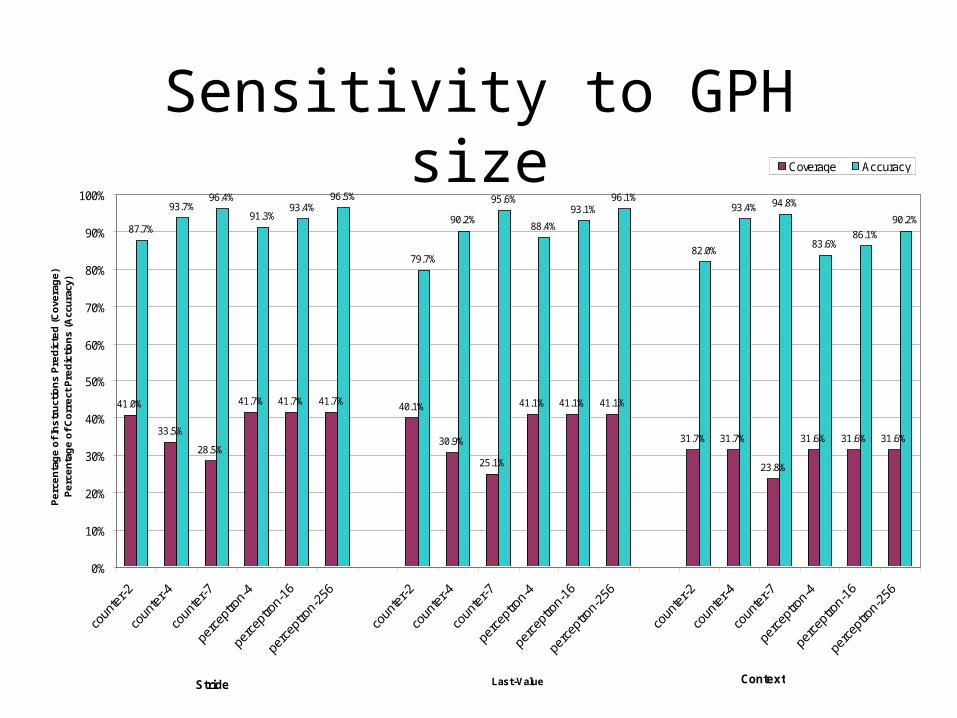
Sensitivity to GPH size
41.0%
33.5%
28.5%
41.7% 41.7% 41.7% 40.1%
30.9%
25.1%
41.1% 41.1% 41.1%
31.7% 31.7%
23.8%
31.6% 31.6% 31.6%
87.7%
93.7%96.4%
91.3%93.4%
96.5%
79.7%
90.2%
95.6%
88.4%
93.1%96.1%
82.0%
93.4% 94.8%
83.6%86.1%
90.2%
0%
10%
20%
30%
40%
50%
60%
70%
80%
90%
100%
Last-Value
Pe
rce
nta
ge
of
Ins
tru
ctio
ns
Pre
dic
ted
(C
ove
rag
e)
Pe
rce
nta
ge
of
Co
rre
ct P
red
icti
on
s (
Acc
ura
cy)
Coverage Accuracy
Stride Context
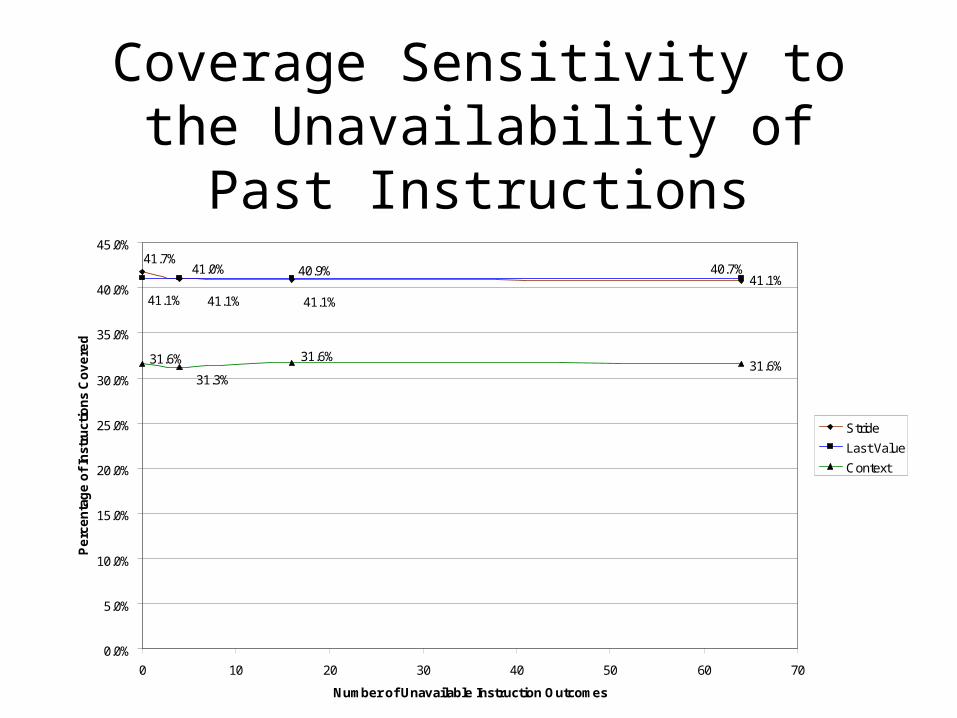
Coverage Sensitivity to the Unavailability of Past Instructions
41.1%
31.6%
40.7%40.9%41.7%
41.0%
41.1%41.1% 41.1%
31.6%31.6%
31.3%
0.0%
5.0%
10.0%
15.0%
20.0%
25.0%
30.0%
35.0%
40.0%
45.0%
0 10 20 30 40 50 60 70
Number of Unavailable Instruction Outcomes
Pe
rce
nta
ge
of
Inst
ruct
ion
s C
ov
ere
d
Stride
Last Value
Context
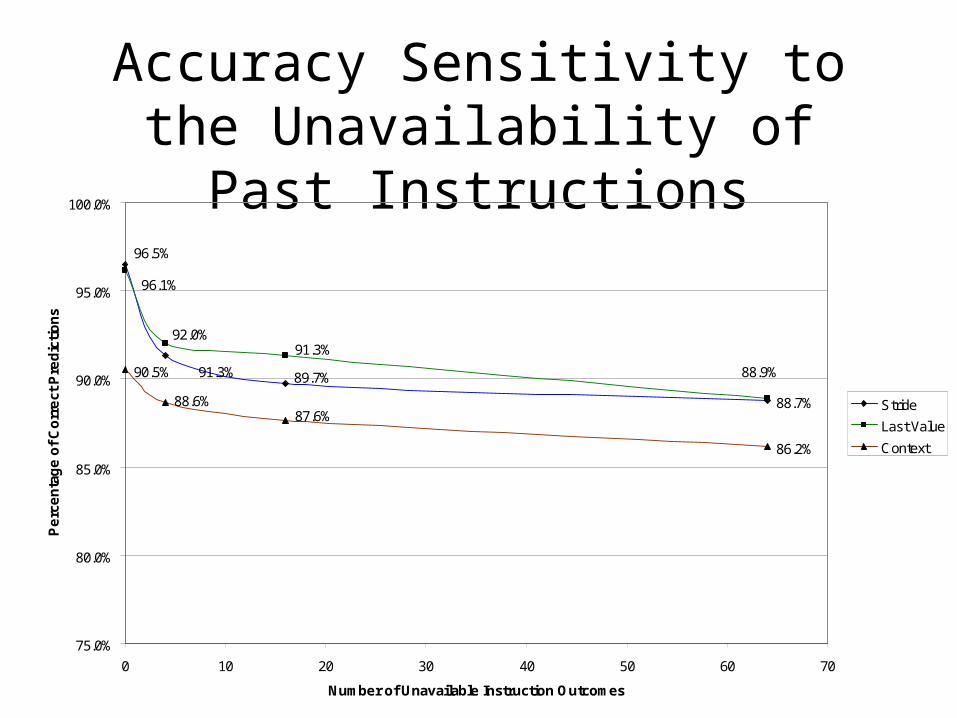
Accuracy Sensitivity to the Unavailability of Past Instructions
88.7%
90.5%
86.2%
89.7%91.3%
96.5%
91.3%
88.9%
96.1%
92.0%
88.6%87.6%
75.0%
80.0%
85.0%
90.0%
95.0%
100.0%
0 10 20 30 40 50 60 70
Number of Unavailable Instruction Outcomes
Pe
rce
nta
ge
of
Co
rre
ct P
red
icti
on
s
Stride
Last Value
Context
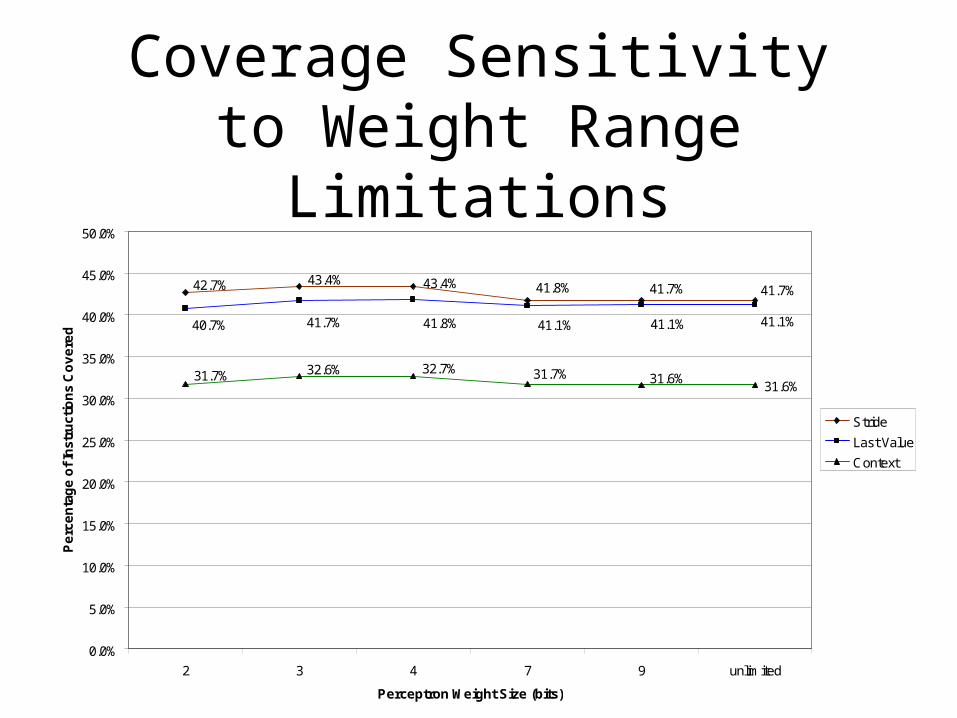
Coverage Sensitivity to Weight Range Limitations
43.4%43.4%42.7% 41.7%41.7%41.8%
41.1%41.1%41.1%41.8%41.7%40.7%
31.6%31.6%31.7%32.7%32.6%31.7%
0.0%
5.0%
10.0%
15.0%
20.0%
25.0%
30.0%
35.0%
40.0%
45.0%
50.0%
2 3 4 7 9 unlimited
Perceptron Weight Size (bits)
Pe
rce
nta
ge
of
Inst
ruct
ion
s C
ov
ere
d
Stride
Last Value
Context
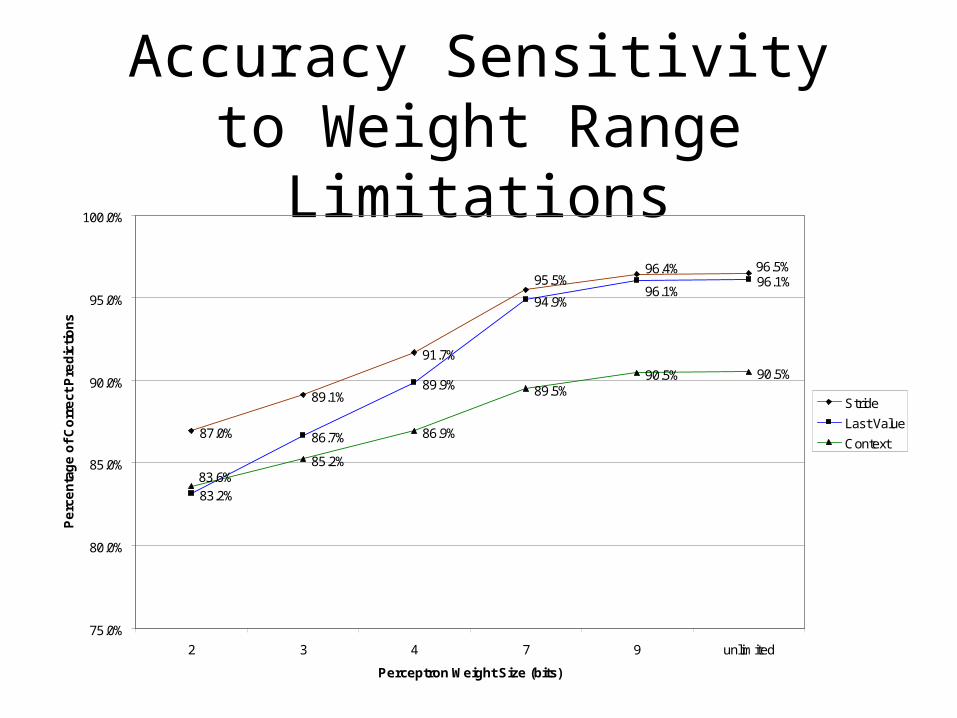
Accuracy Sensitivity to Weight Range Limitations
87.0%
89.1%
91.7%
83.2%
86.7%
89.9%
94.9%
96.1%
85.2%
86.9%
89.5%90.5% 90.5%
96.5%96.4%95.5%
96.1%
83.6%
75.0%
80.0%
85.0%
90.0%
95.0%
100.0%
2 3 4 7 9 unlimited
Perceptron Weight Size (bits)
Pe
rce
nta
ge
of
Co
rre
ct P
red
icti
on
s
Stride
Last Value
Context
Conclusions
• Mispredictions are a problem in data value prediction
• Benchmark programs exhibit strong predictability relationships between instructions
• Perceptrons enable confidence estimators to exploit these predictability relationships
• Perceptron-based confidence estimation tends to show significant improvement over up-down counter confidence estimation