Embed Size (px)
Citation preview

Perceptual Distance and Visual Search
Data Science - Visual Neuroscience Lecture 1
Physical distance versus perceptual distance
◮ Why are we (as yet) better at vision than machines?
◮ Sophisticated representation of objects.“Pixel distance” very different from perceptual distance
◮ In this module: Study experimental data that attempts to quantifyperceptual distance
Measuring perceptual distance
versusversus versus
Ideas?
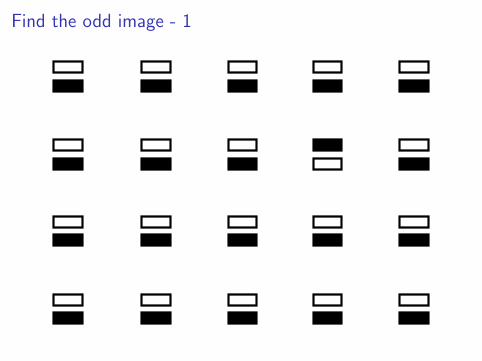
Find the odd image - 1

Find the odd image - 2

Find the odd image - 3
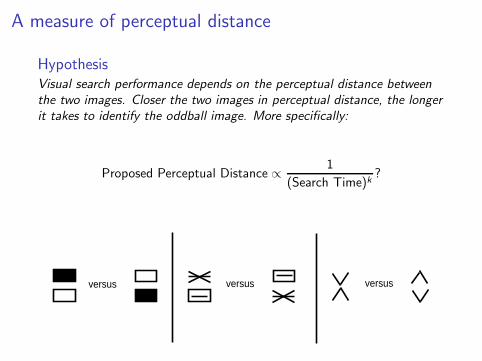
A measure of perceptual distance
HypothesisVisual search performance depends on the perceptual distance between
the two images. Closer the two images in perceptual distance, the longer
it takes to identify the oddball image. More specifically:
Proposed Perceptual Distance ∝1
(Search Time)k?
versusversus versus
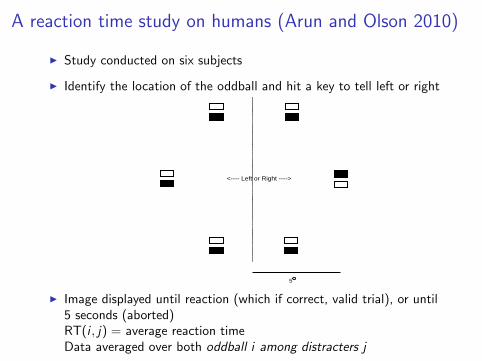
A reaction time study on humans (Arun and Olson 2010)
◮ Study conducted on six subjects
◮ Identify the location of the oddball and hit a key to tell left or right
<---- Left or Right ---->
5
◮ Image displayed until reaction (which if correct, valid trial), or until5 seconds (aborted)RT(i , j) = average reaction timeData averaged over both oddball i among distracters j

Baseline reaction time
<---- Left or Right ---->
5
◮ RTb = baseline reaction time
◮ s(i , j) = RT(i , j)− RTb
◮ Perceptual distance between i and j is ∝ 1/s(i , j)
◮ RTb = 328ms.
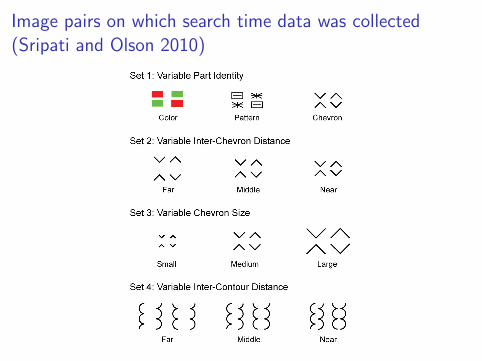
Image pairs on which search time data was collected
(Sripati and Olson 2010)
A direct view into the brain of rhesus macaques
◮ Try to nail the responses in the brain, and see how different they are.
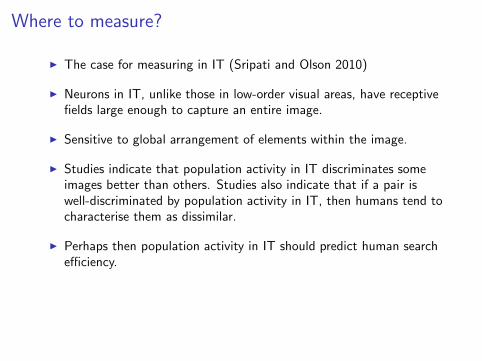
Where to measure?
◮ The case for measuring in IT (Sripati and Olson 2010)
◮ Neurons in IT, unlike those in low-order visual areas, have receptivefields large enough to capture an entire image.
◮ Sensitive to global arrangement of elements within the image.
◮ Studies indicate that population activity in IT discriminates someimages better than others. Studies also indicate that if a pair iswell-discriminated by population activity in IT, then humans tend tocharacterise them as dissimilar.
◮ Perhaps then population activity in IT should predict human searchefficiency.
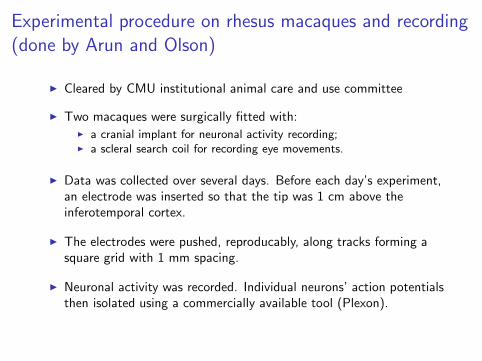
Experimental procedure on rhesus macaques and recording
(done by Arun and Olson)
◮ Cleared by CMU institutional animal care and use committee
◮ Two macaques were surgically fitted with:◮ a cranial implant for neuronal activity recording;◮ a scleral search coil for recording eye movements.
◮ Data was collected over several days. Before each day’s experiment,an electrode was inserted so that the tip was 1 cm above theinferotemporal cortex.
◮ The electrodes were pushed, reproducably, along tracks forming asquare grid with 1 mm spacing.
◮ Neuronal activity was recorded. Individual neurons’ action potentialsthen isolated using a commercially available tool (Plexon).

A direct view into the brain of rhesus macaques
◮ Two macaques were trained to fixate on the + while a series ofstimuli appeared one after another.
++
++
++
2
200 ms on200 ms off 200 ms on
200 ms off 200 ms on200 ms off 200 ms on
200 ms off 200 ms on200 ms off
200 ms on200 ms off
◮ Images were randomly interleaved. Neuronal activity recorded(inferotemporal cortex) over several 2 second rounds.

The neuronal data
◮ Inferotemporal cortex - gross object features emerge here
◮ Firing rates of N = 174 neurons in response to these six images
◮ Data collected in a similar manner for a total of 24 images
◮ For each image i , the neuronal response is summarized by the firingrate vector (λi (n), 1 ≤ n ≤ N).
Image i 7→ λi =
λi (1)λi (2)...
λi (N)

The main question
◮ For the pair (i , j), perceptual distance ought to be a function of how“different” λi and λj are.
◮ What function?
◮ How does it relate to reaction time?

A model grounded in a theory
◮ What would the prefrontal cortex do if it got observations from thehuman analogue of the inferotemporal cortex and could control theeye?

Aspects of search
◮ Find in the shortest possible time. Cost = delay.
◮ Local focus. You could choose where you wanted to look next.
◮ Two types of pictures. But you didn’t “know” either. Learnt whichis which on the fly.
◮ But you learnt just enough to tell a picture in location 1 was sameas or different from the picture in location 2.
◮ When you changed focus, you often chose a location nearer to thecurrent location.
◮ You waited until you were sure about the oddball location.

A model for search - sequential hypothesis testing
◮ Hypothesis h = (ℓ, i , j): The oddball location is ℓ and its type i
among distracters j . Ground truth.
◮ Divide time into slots.
◮ Control: Given observations and decisions in all previous slots(history),
◮ decide to stop and declare the oddball, or◮ decide to continue, and direct the eye to focus on location b, one of
the six locations.
◮ Observation: If the object in location b is k , then N Poisson pointprocesses with rates (λk(n), 1 ≤ n ≤ N).
◮ Policy π: For each time slot, given history, a prescription for action.To stop or not to stop?If continue, where to look?If stop, what to decide?
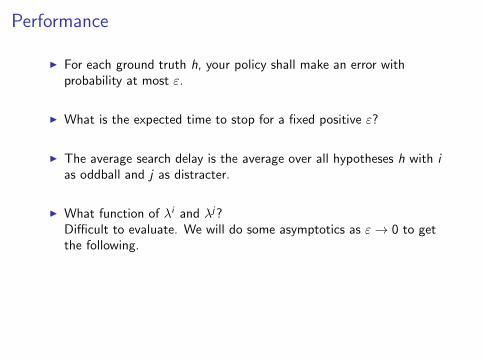
Performance
◮ For each ground truth h, your policy shall make an error withprobability at most ε.
◮ What is the expected time to stop for a fixed positive ε?
◮ The average search delay is the average over all hypotheses h with i
as oddball and j as distracter.
◮ What function of λi and λj?Difficult to evaluate. We will do some asymptotics as ε → 0 to getthe following.
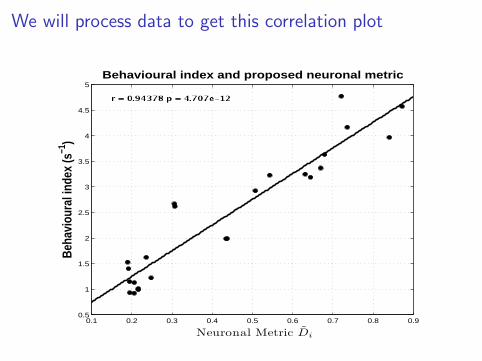
We will process data to get this correlation plot
0.1 0.2 0.3 0.4 0.5 0.6 0.7 0.8 0.90.5
1
1.5
2
2.5
3
3.5
4
4.5
5
Neuronal Metric D̃i
Beha
viou
ral i
ndex
(s−1
)Behavioural index and proposed neuronal metric
What we will learn in this module
◮ Hypothesis testing
◮ Hypothesis testing with a stopping criterion
◮ Data processing inequality, and relative entropy
◮ A brief view into asymptotic analysis
◮ Testing for a distribution - Kolmogorov-Smirnoff test
◮ ANOVA and variants