Embed Size (px)
Citation preview
Visualization
Perceptual aspects 2016-11-08
Stefan Seipel

Overview
Quick overview over this lesson
Physiology of the human eye
Visual acuity and performance
Color, brightness and contrast
Use of colors
Pop-out effect
Cognitive limits

Physiology
Visual Angle
d
sds
2tan2;
2tan2 1
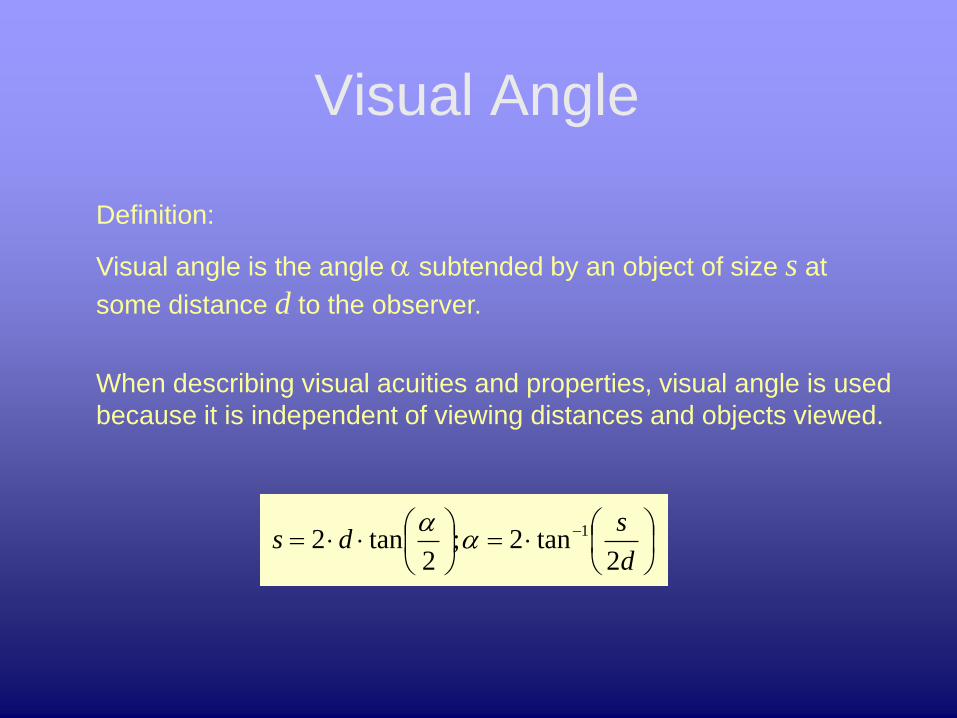
Definition:
Visual angle is the angle subtended by an object of size s at
some distance d to the observer.
When describing visual acuities and properties, visual angle is used
because it is independent of viewing distances and objects viewed.
Retina Receptors of two types : cones and rods
Rods (sv. stavar):
Sensitive at low light level
Approximately 100 million
Contribute little at daylight (oversaturated at daylight levels)
Are interconnected over larger areas
Cones (sv. tappar):
Effective at daylight levels
Color sensitive
Are highly packet at the fovea (180 per degree visual angle)
Approx. 100.000 at the fovea
Approximately 6 million in total
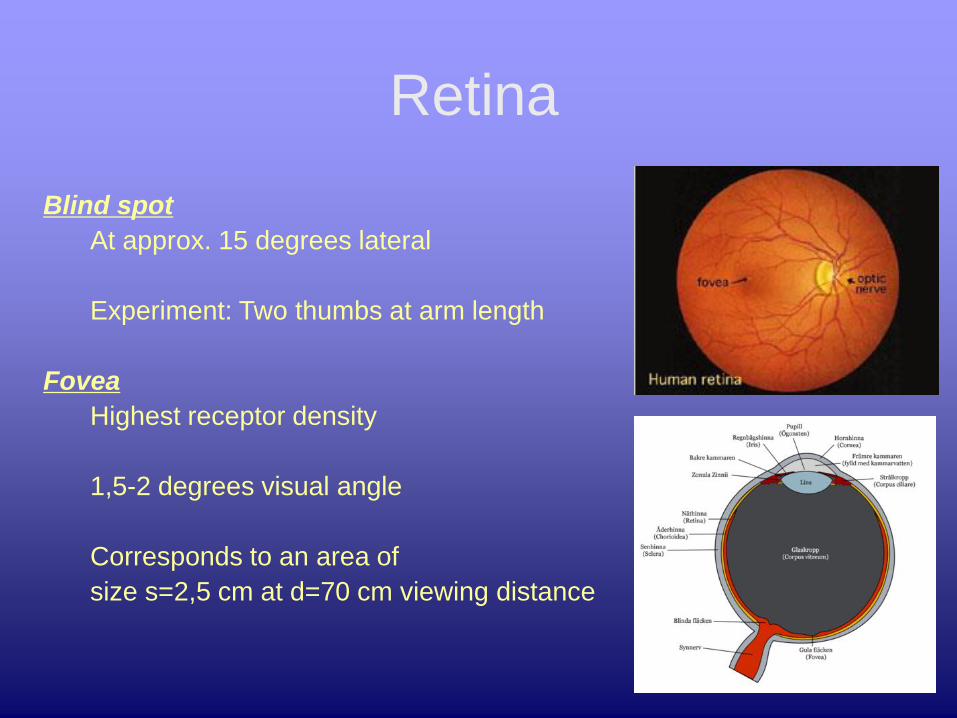
Retina
Blind spot
At approx. 15 degrees lateral
Experiment: Two thumbs at arm length
Fovea
Highest receptor density
1,5-2 degrees visual angle
Corresponds to an area of
size s=2,5 cm at d=70 cm viewing distance
Visual Angle
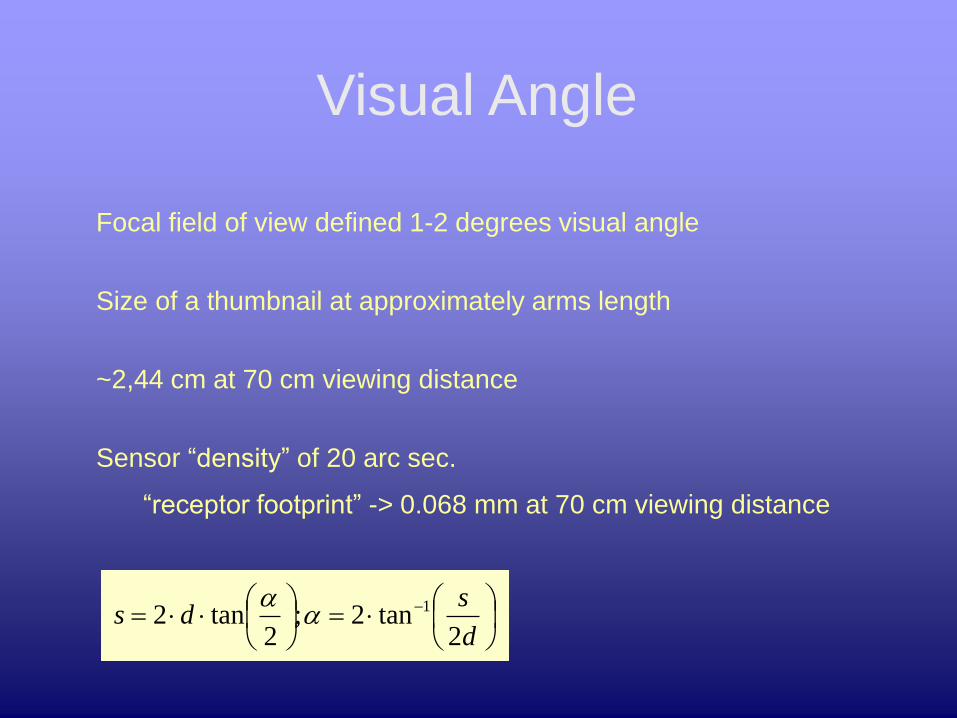
Focal field of view defined 1-2 degrees visual angle
Size of a thumbnail at approximately arms length
~2,44 cm at 70 cm viewing distance
Sensor “density” of 20 arc sec.
“receptor footprint” -> 0.068 mm at 70 cm viewing distance
d
sds
2tan2;
2tan2 1

Visual Acuities
Point acuity: 1 minute of arc
Grating acuity: 1-2 minutes of arc
Letter acuity: 5 minutes of arc (5,8 mm at 4 meters distance)
Vernier acuity: 10 seconds of arc
Acuity fall-off across visual field: See figure right
Several receptors interconnected -> superacuities
Acuity depends on brightness/contrast
100
50
0
100
50
0
0 10103050 50300 10103050 5030
Fovea
Blin
d s
pot
NoseTemple
Fovea
Blin
d s
pot
NoseTemple
Rela
tive a
cuity
(% o
f m
axim
um
)
Distance from fovea (in degrees visual angle)

Visual Acuities Utilization of Vernier acuity: Reading caliper scales
Spectral sensitivity of cones
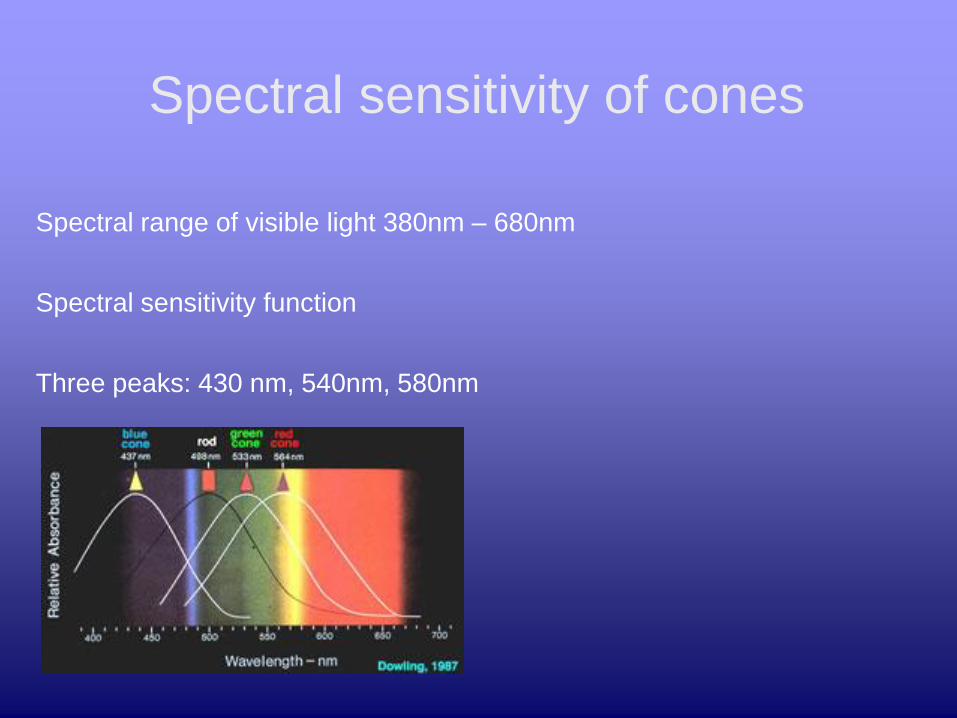
Spectral range of visible light 380nm – 680nm
Spectral sensitivity function
Three peaks: 430 nm, 540nm, 580nm
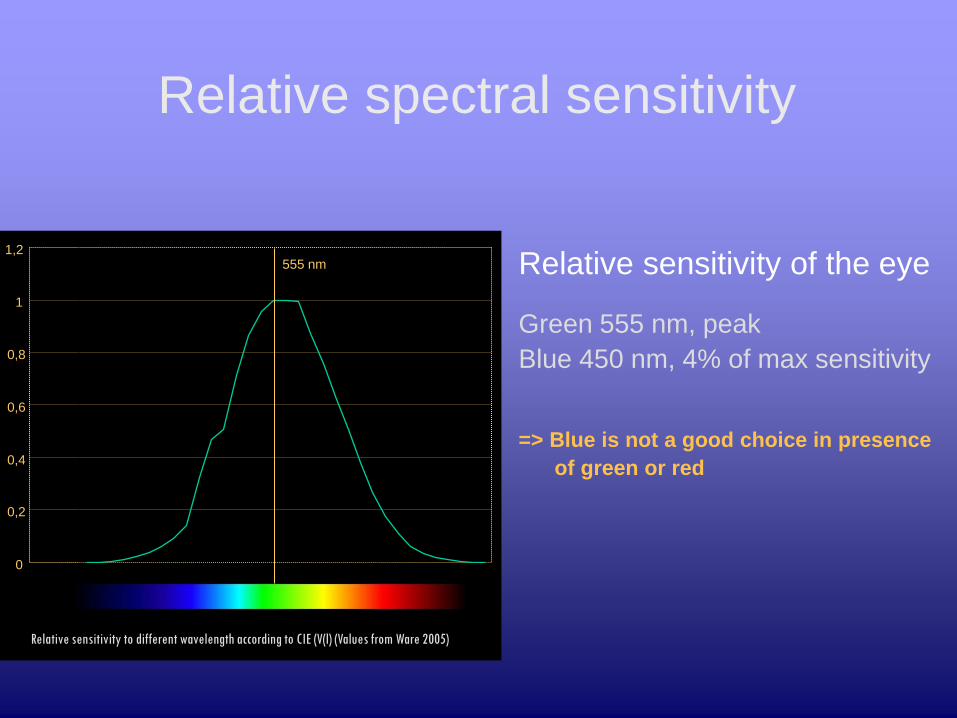
Relative sensitivity of the eye
Green 555 nm, peak
Blue 450 nm, 4% of max sensitivity
=> Blue is not a good choice in presence
of green or red
Relative sensitivity to different wavelength according to CIE (V(l) (Values from Ware 2005)
0
0,2
0,4
0,6
0,8
1
1,2 555 nm
Relative spectral sensitivity

Visual Acuities – Some illusions
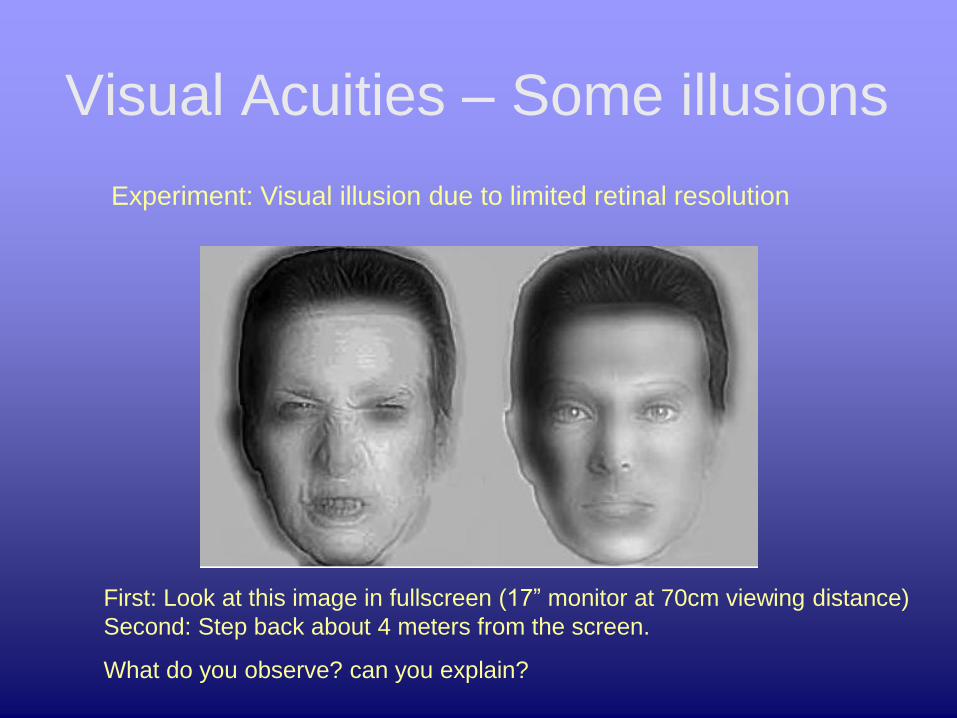
Experiment: Visual illusion due to limited retinal resolution
First: Look at this image in fullscreen (17” monitor at 70cm viewing distance)
Second: Step back about 4 meters from the screen.
What do you observe? can you explain?
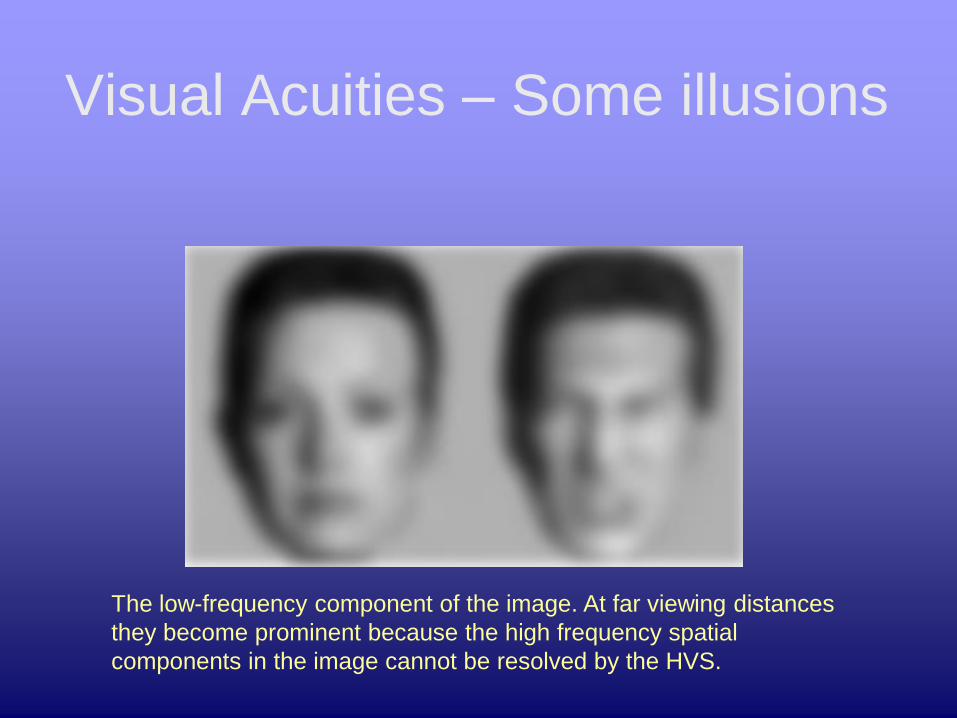
Visual Acuities – Some illusions
The low-frequency component of the image. At far viewing distances
they become prominent because the high frequency spatial
components in the image cannot be resolved by the HVS.
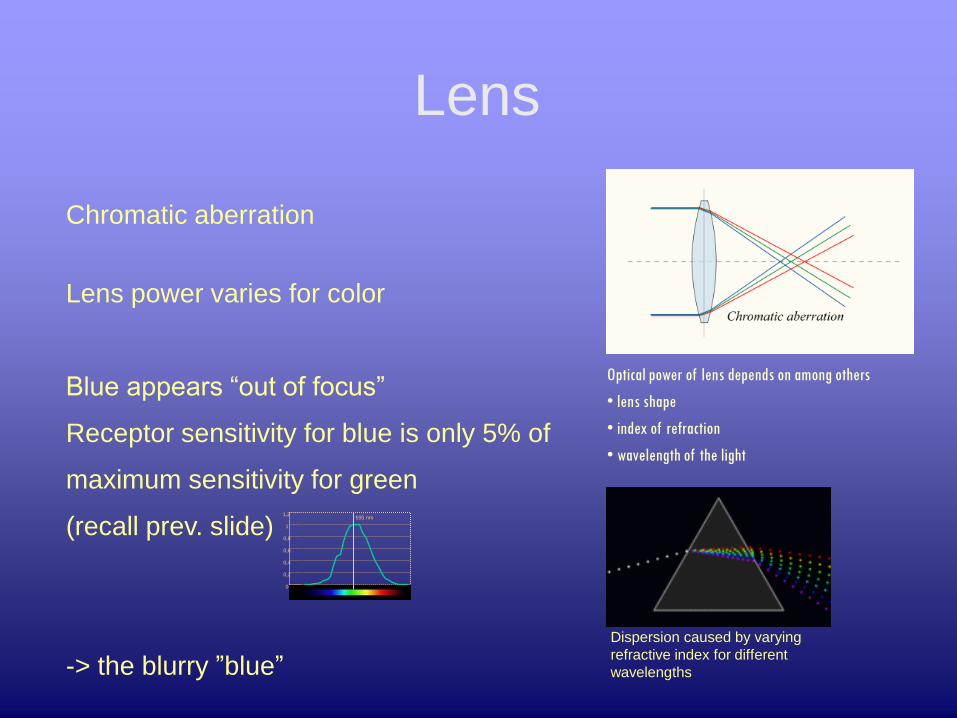
Lens
Chromatic aberration
Lens power varies for color
Blue appears “out of focus”
Receptor sensitivity for blue is only 5% of
maximum sensitivity for green
(recall prev. slide)
-> the blurry ”blue”
Dispersion caused by varying
refractive index for different
wavelengths
Optical power of lens depends on among others
• lens shape
• index of refraction
• wavelength of the light
0
0,2
0,4
0,6
0,8
1
1,2 555 nm
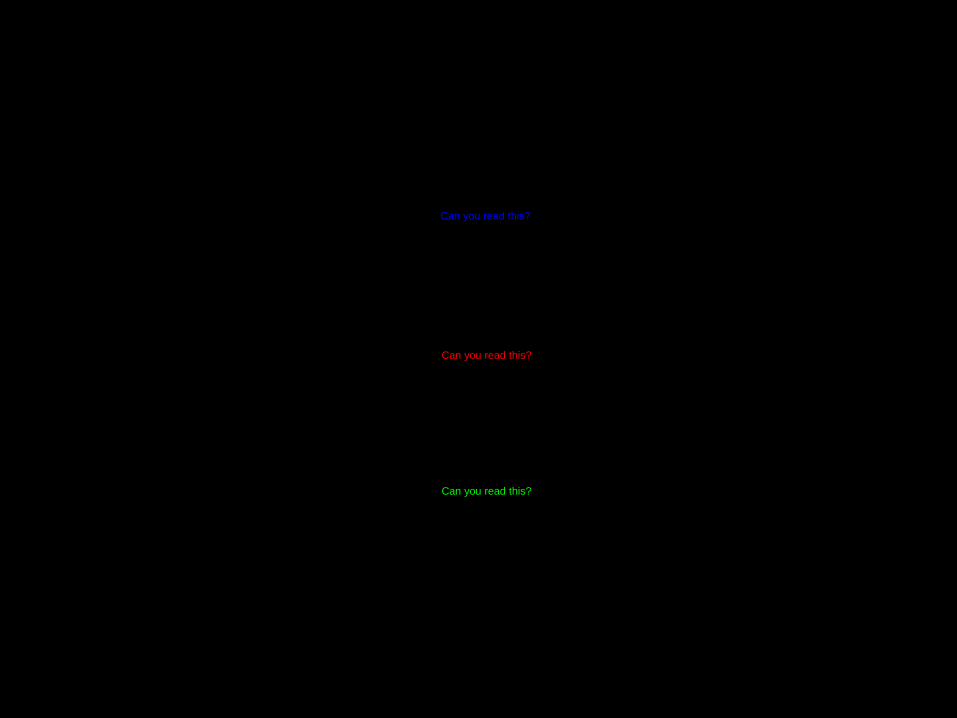
Can you read this?
Can you read this?
Can you read this?
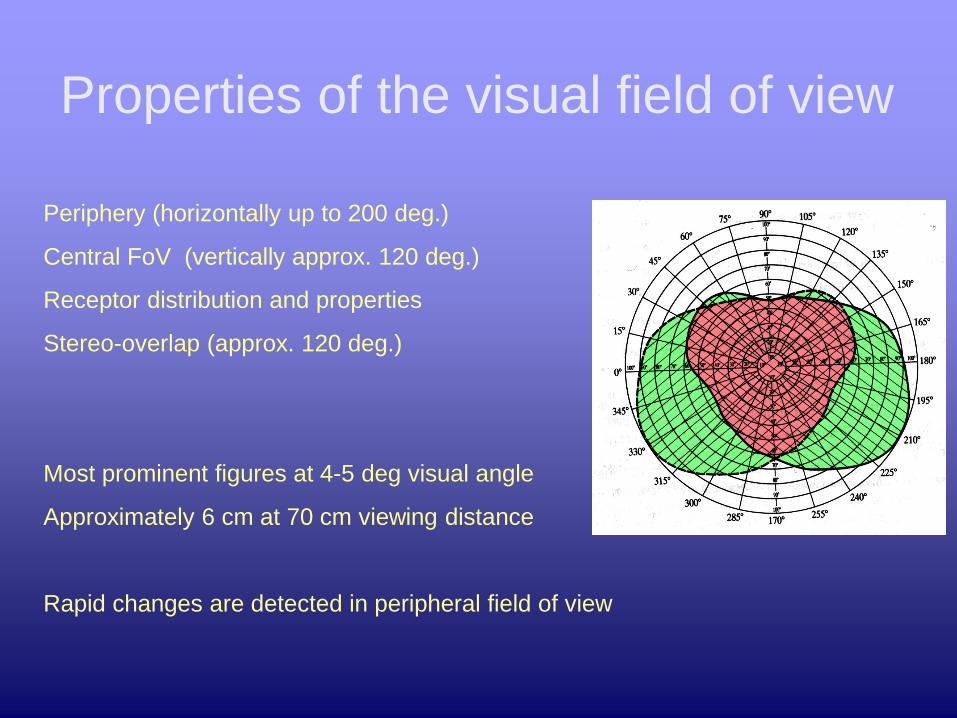
Properties of the visual field of view
Periphery (horizontally up to 200 deg.)
Central FoV (vertically approx. 120 deg.)
Receptor distribution and properties
Stereo-overlap (approx. 120 deg.)
Most prominent figures at 4-5 deg visual angle
Approximately 6 cm at 70 cm viewing distance
Rapid changes are detected in peripheral field of view

Properties of the visual field of view
Most prominent figures at 4-5 degrees visual angle
Approximately 6 cm at 70 cm viewing distance
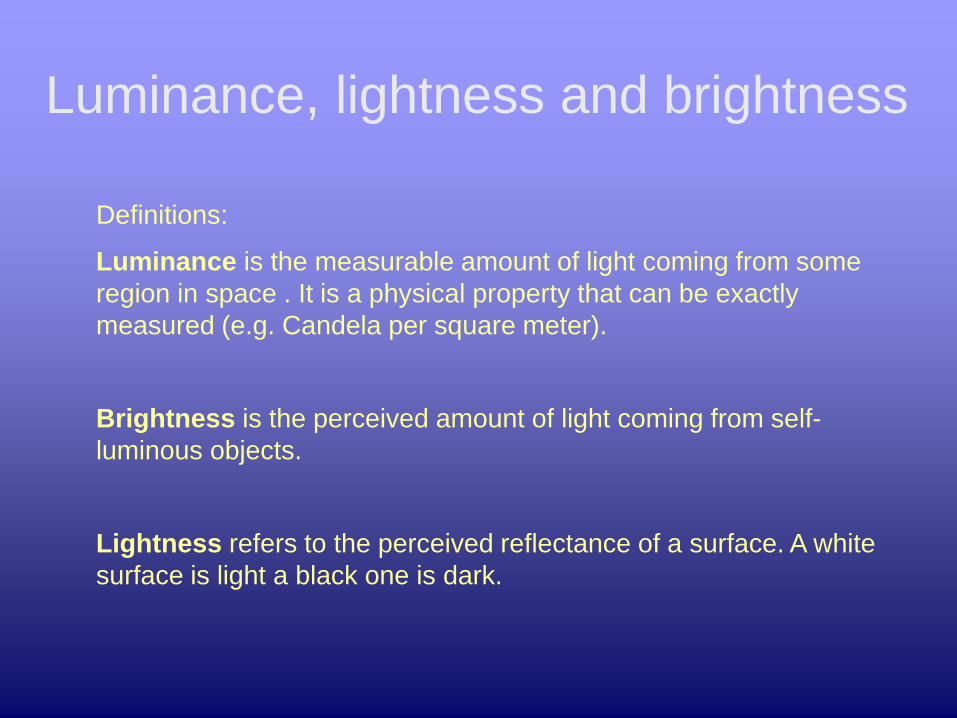
Luminance, lightness and brightness
Definitions:
Luminance is the measurable amount of light coming from some
region in space . It is a physical property that can be exactly
measured (e.g. Candela per square meter).
Brightness is the perceived amount of light coming from self-
luminous objects.
Lightness refers to the perceived reflectance of a surface. A white
surface is light a black one is dark.

Colors maps
Estimation of the lightness of colors depends on surround
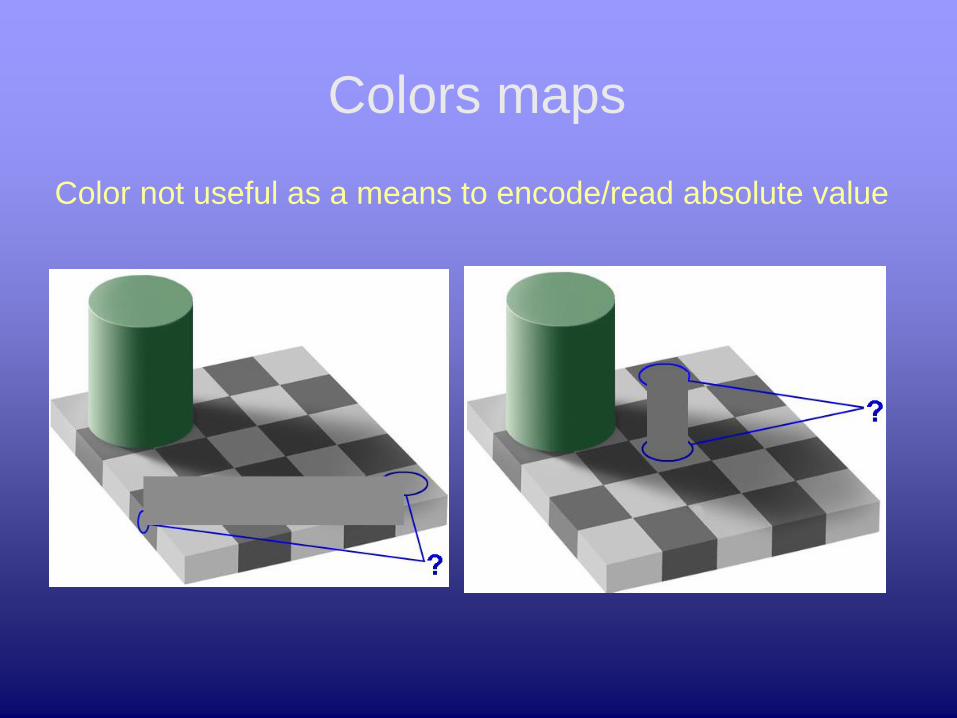
Colors maps
Color not useful as a means to encode/read absolute value

Perception of
lightness/brightness levels
The human visual system is not an absolute measuring device.
Perceived lightness/brightness depends on a number of factors:
• Overall ambient light level adjustment (photo pigment bleaching)
• The illuminant and spatial illumination conditions (see illusion next slide)
• Colors in the surround of an object (see illusion picture)
• Local contrast effects
Example:
A black object on a sunny day outside reflects more light than a white object
inside an office room. Yet, we perceive the black object as dark and the white one
as light.
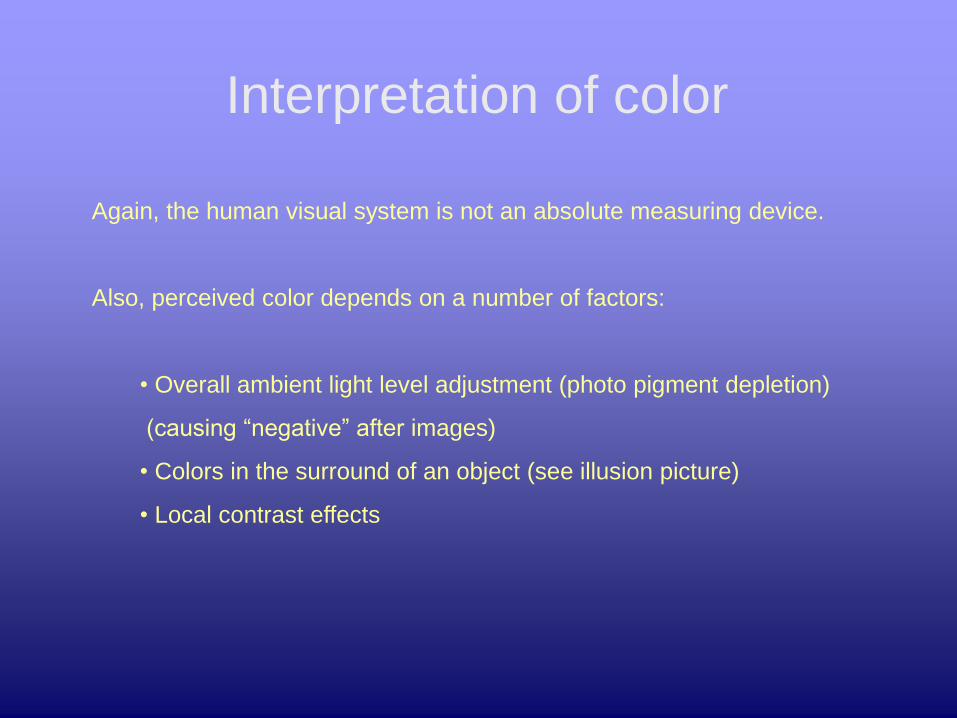
Interpretation of color
Again, the human visual system is not an absolute measuring device.
Also, perceived color depends on a number of factors:
• Overall ambient light level adjustment (photo pigment depletion)
(causing “negative” after images)
• Colors in the surround of an object (see illusion picture)
• Local contrast effects

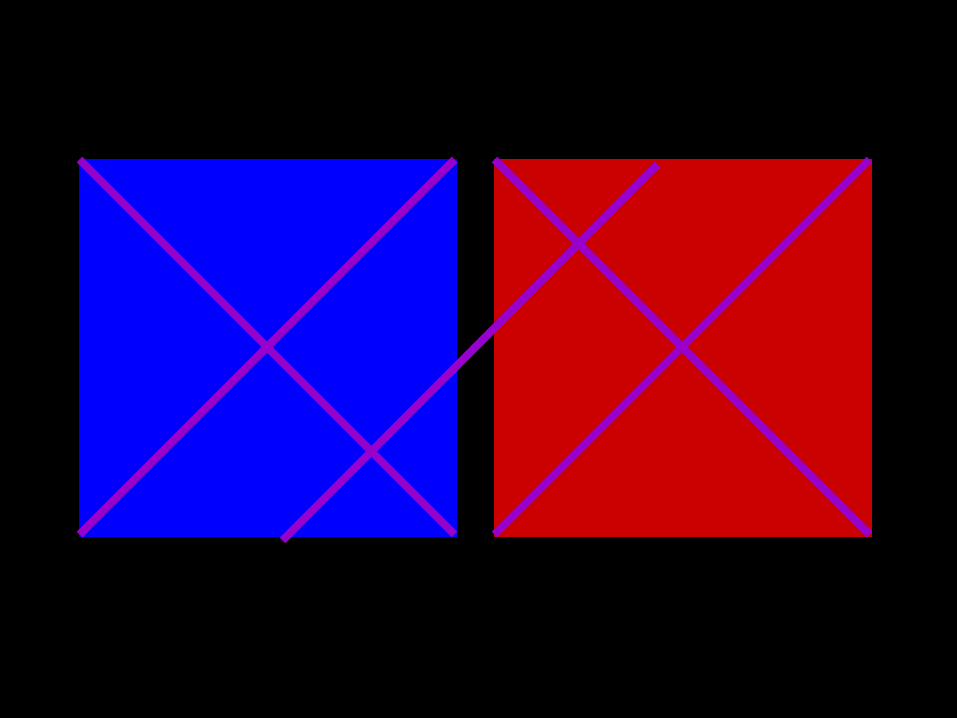

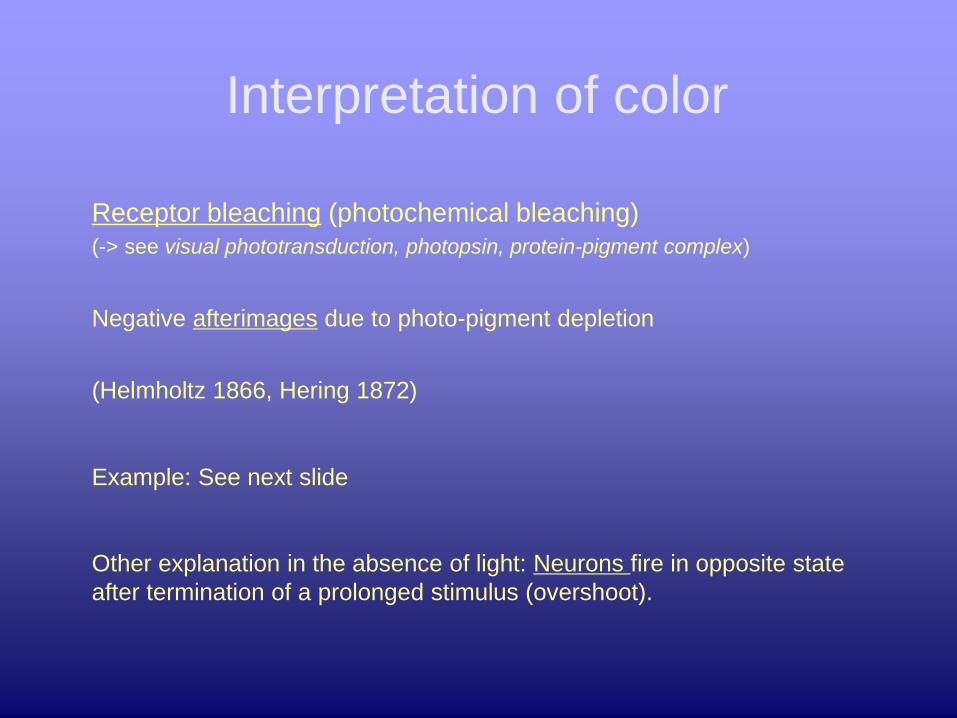
Interpretation of color
Receptor bleaching (photochemical bleaching)
(-> see visual phototransduction, photopsin, protein-pigment complex)
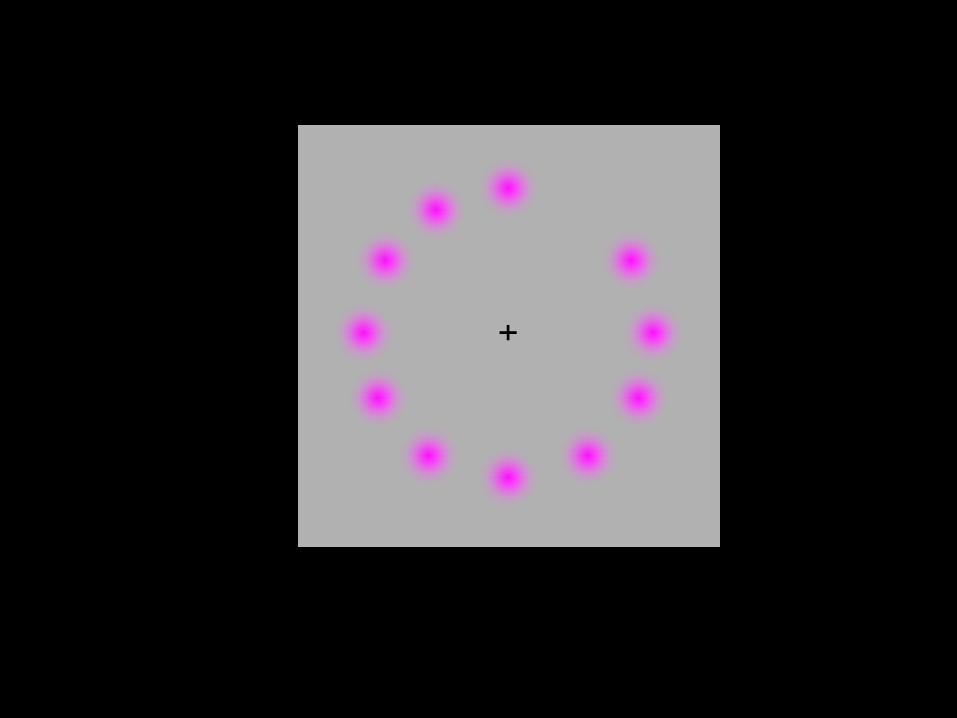
Negative afterimages due to photo-pigment depletion
(Helmholtz 1866, Hering 1872)
Example: See next slide
Other explanation in the absence of light: Neurons fire in opposite state
after termination of a prolonged stimulus (overshoot).

Color Adaptation
What color is the shirt of the lady not raising her hands?

Color Adaptation
Here is the original image, without filter.
And quite right. The color is yellow!
Color Adaptation
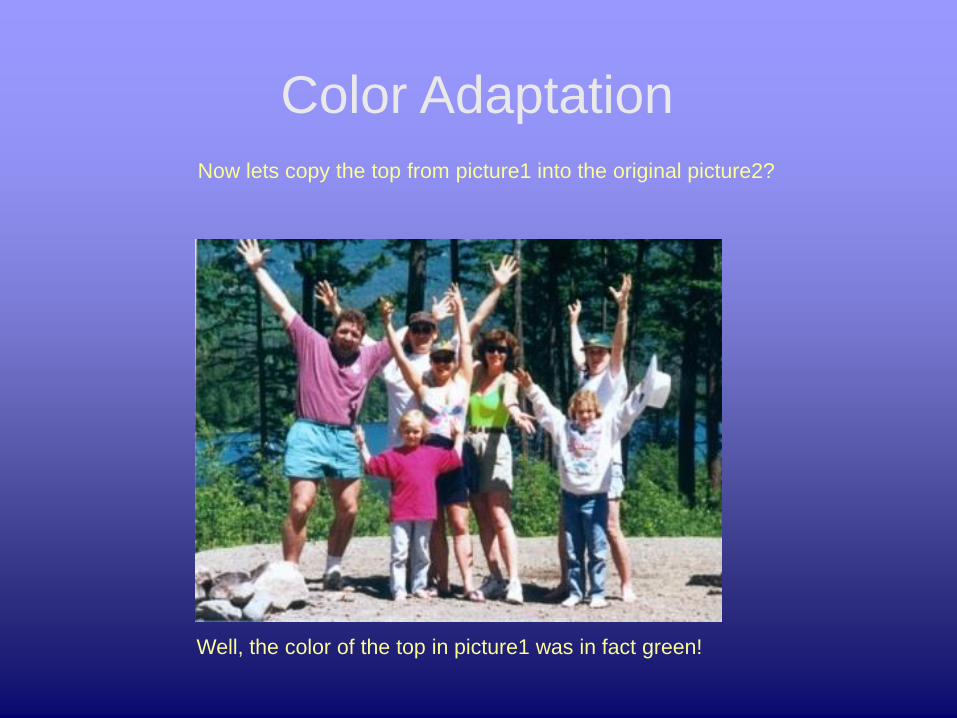
Now lets copy the top from picture1 into the original picture2?
Well, the color of the top in picture1 was in fact green!
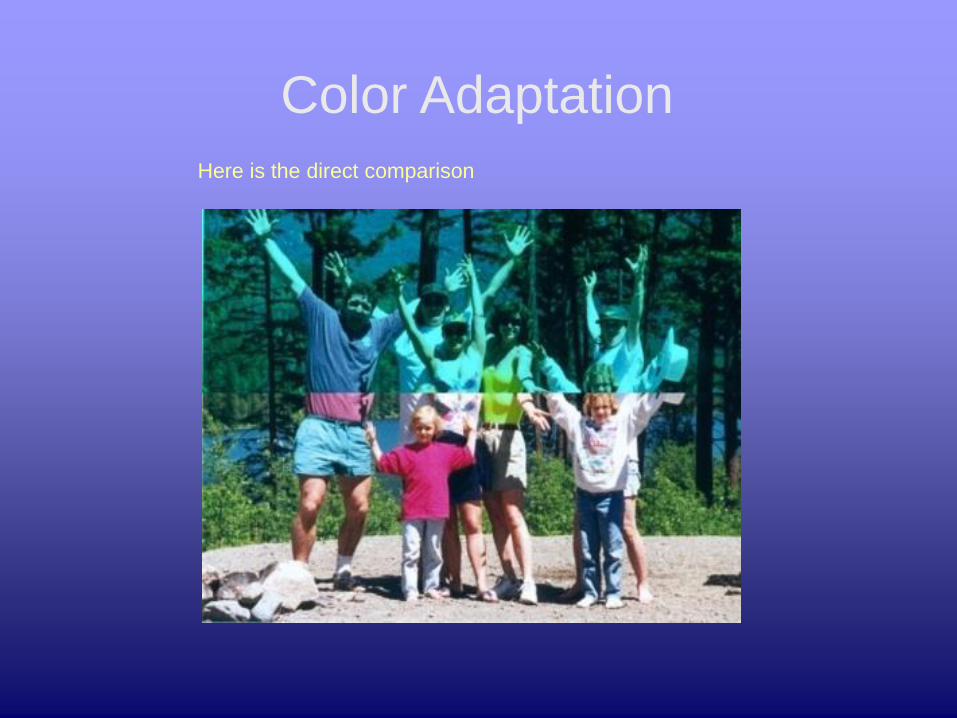
Color Adaptation
Here is the direct comparison

Contrast
Visual perception is not directly based on the neural signals of
the receptors in the retina, instead there is some neural
processing in several layers of retinal ganglion cells.

Contrast
Ganglion cells are organized with circular receptive fields that
can have an on-center or off center. Size of receptive fields vary
from central field of view to periphery.
Lateral inhibition (Hartline 1940)
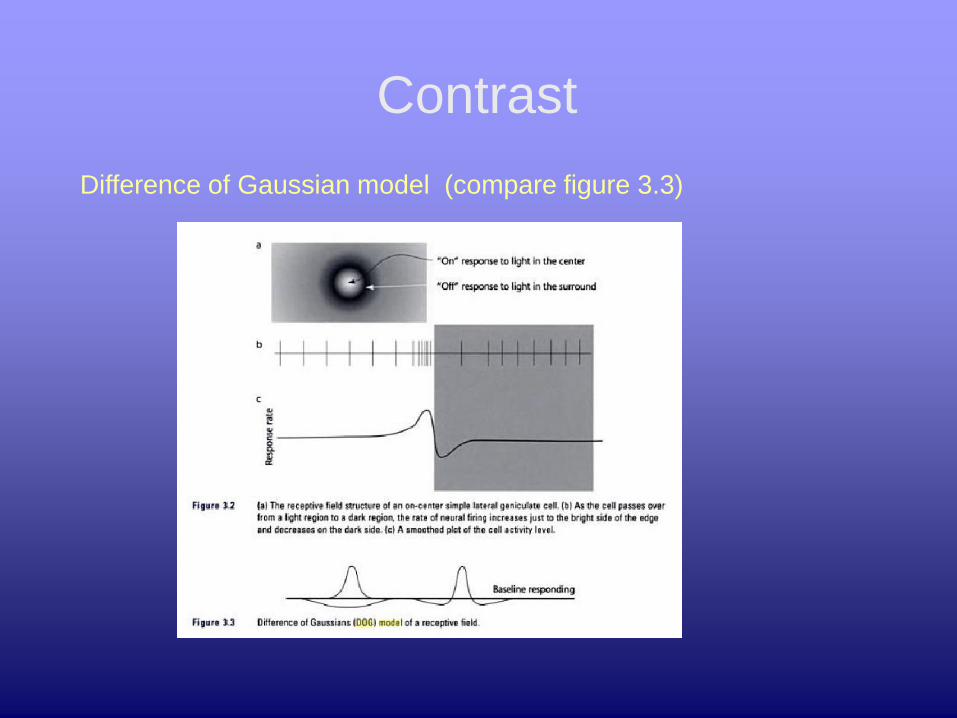
Contrast
Difference of Gaussian model (compare figure 3.3)
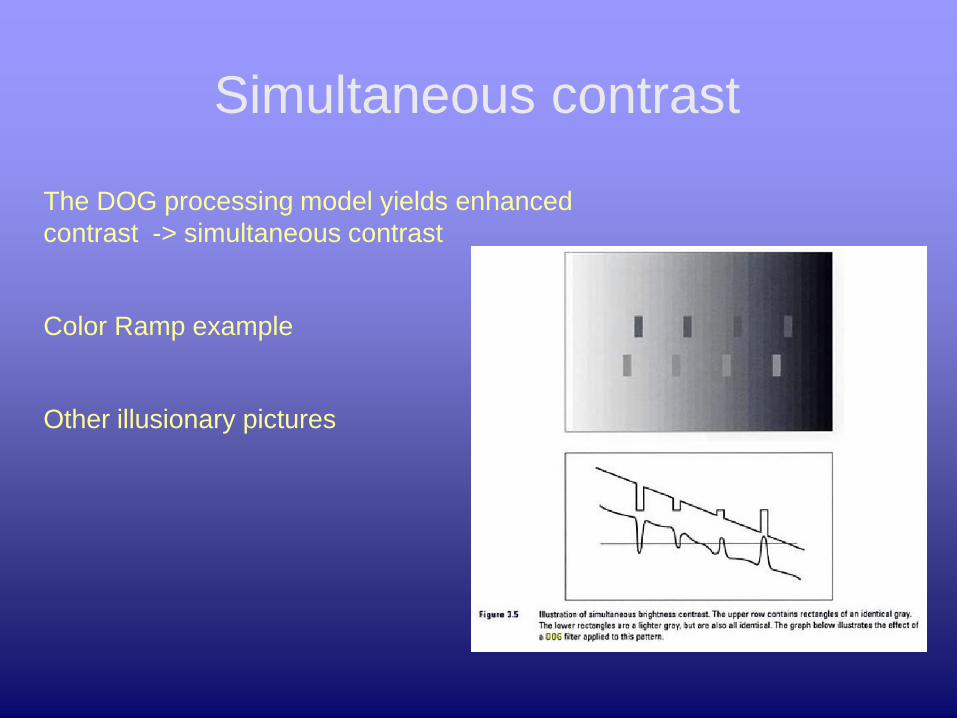
Simultaneous contrast
The DOG processing model yields enhanced
contrast -> simultaneous contrast
Color Ramp example
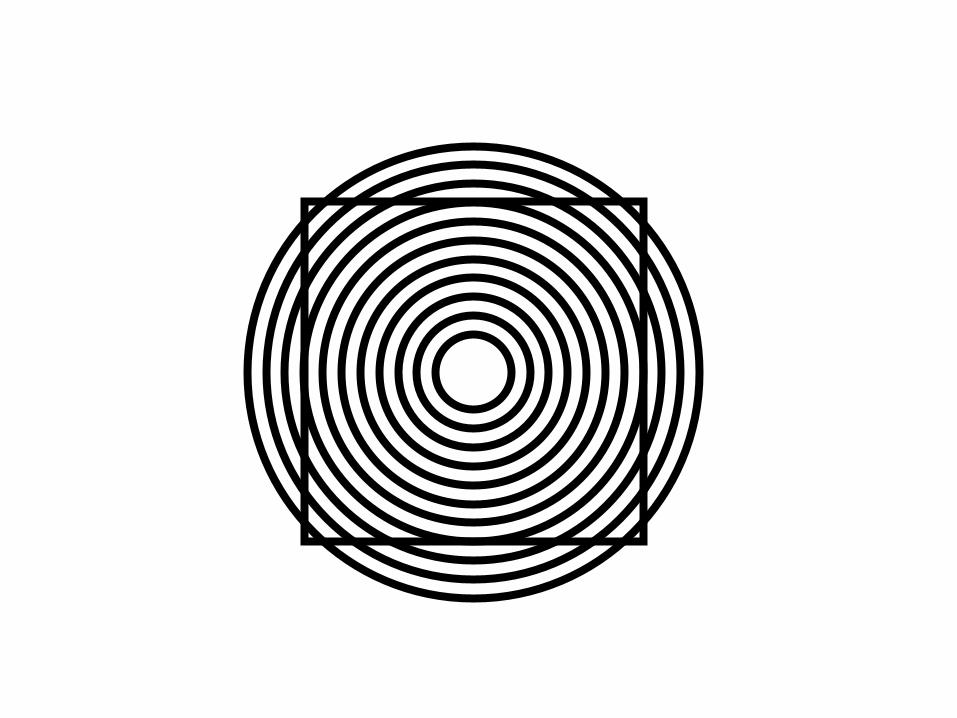
Other illusionary pictures


Hermann Grid

High Contrast and Visual Stress
Spatial frequency of 3 cycles per degree visual angle
In addition: Strong contrast (luminance)
See next 2 pictures


Opponent Process Theory
Ewald Hering (1920)
• Six base colors (unlike trichromacy theory)
• Differential and additive processing of
receptors signals
• Naming-, cultural and neurophysiological
support for this theory
Cone signals are hierarchically combined and processed in three
channels:
Yellow-Blue (R+G-B)
Red-Green (R-G)
Black-White (R+G+B)
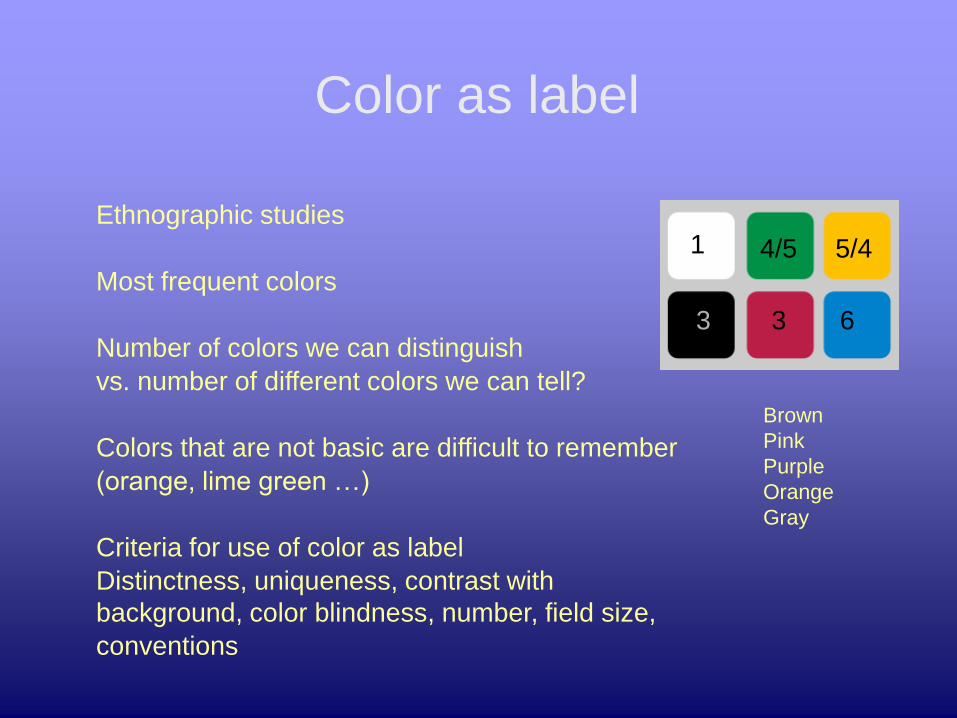
Color as label
Ethnographic studies
Most frequent colors
Number of colors we can distinguish
vs. number of different colors we can tell?
Colors that are not basic are difficult to remember
(orange, lime green …)
Criteria for use of color as label
Distinctness, uniqueness, contrast with
background, color blindness, number, field size,
conventions
1
3 3
4/5 5/4
6
Brown
Pink
Purple
Orange
Gray
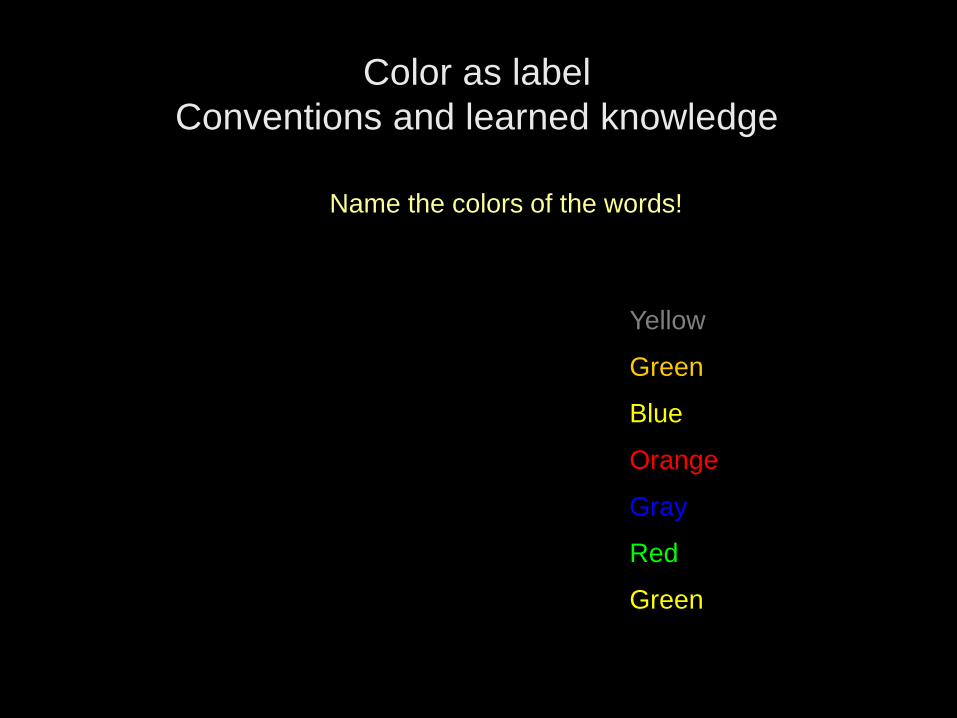
Color as label
Conventions and learned knowledge
Yellow
Green
Blue
Orange
Gray
Red
Green
Name the colors of the words!
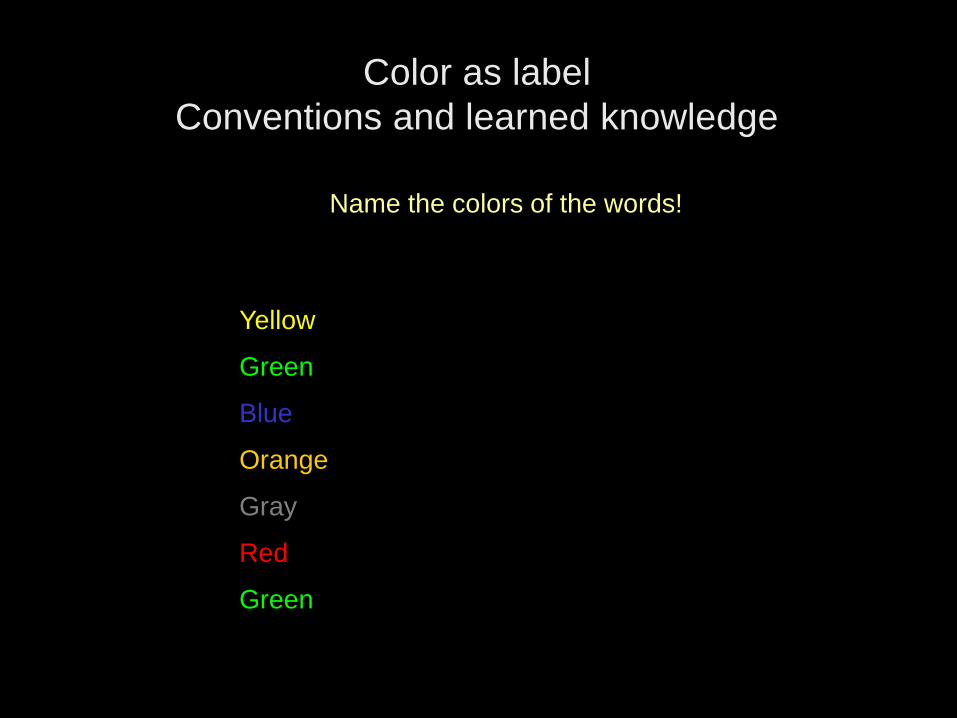
Color as label
Conventions and learned knowledge
Yellow
Green
Blue
Orange
Gray
Red
Green
Name the colors of the words!
Colors can show detail
Lightness contrast most important for readability of text and fine
detail
Note: Visual acuity depends on lightness/brightness of colors
Not too small structures

Colors call attention
Saturated colors on achromatic background/context are
processed pre-attentively.
Identification of colored features in this context requires no
cognitive processing.
Pre-attentive features are useful for rapid search tasks!
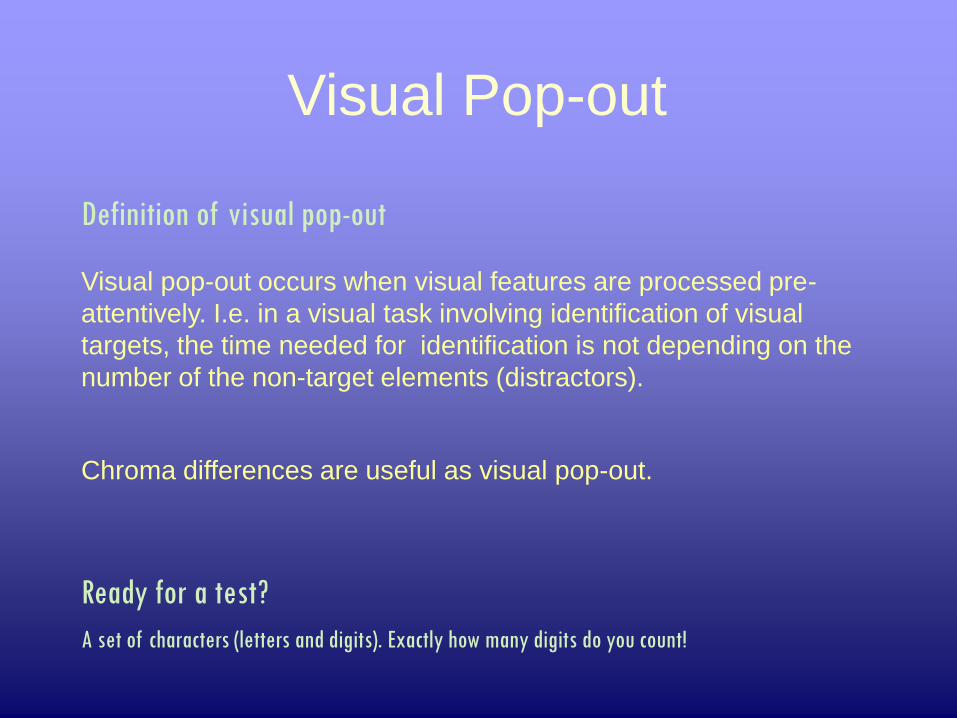
Visual Pop-out
Definition of visual pop-out
Visual pop-out occurs when visual features are processed pre-
attentively. I.e. in a visual task involving identification of visual
targets, the time needed for identification is not depending on the
number of the non-target elements (distractors).
Chroma differences are useful as visual pop-out.
Ready for a test?
A set of characters (letters and digits). Exactly how many digits do you count!
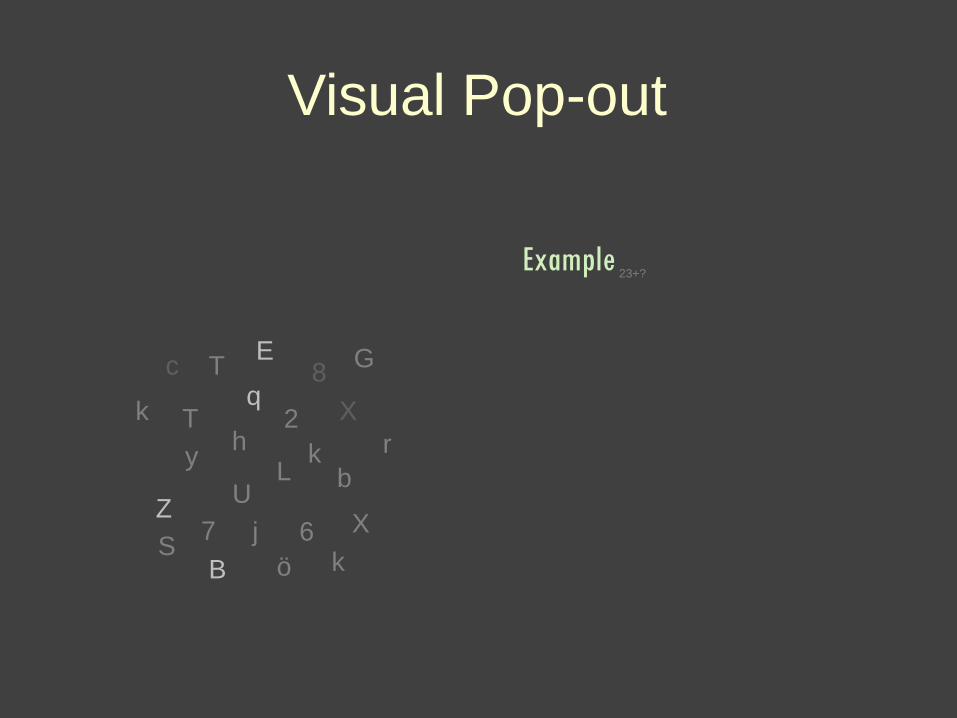
Visual Pop-out
Example
Z
S B
j
T
y
U
ö
h
T q
k L
X
r
G c
2
7 6
E 8
X
b
k
k
23+?

Visual Pop-out
Example
A Z
S d B
j
y y
U
ö
G
h d D
M j
T q
k
L
X
t
r
G c 5
U
7 R
E w
8 k
k
k
P
Y
P
A
u
z r
i
L
K L
L
E
W
r
Z
3
45+?
g
i
f
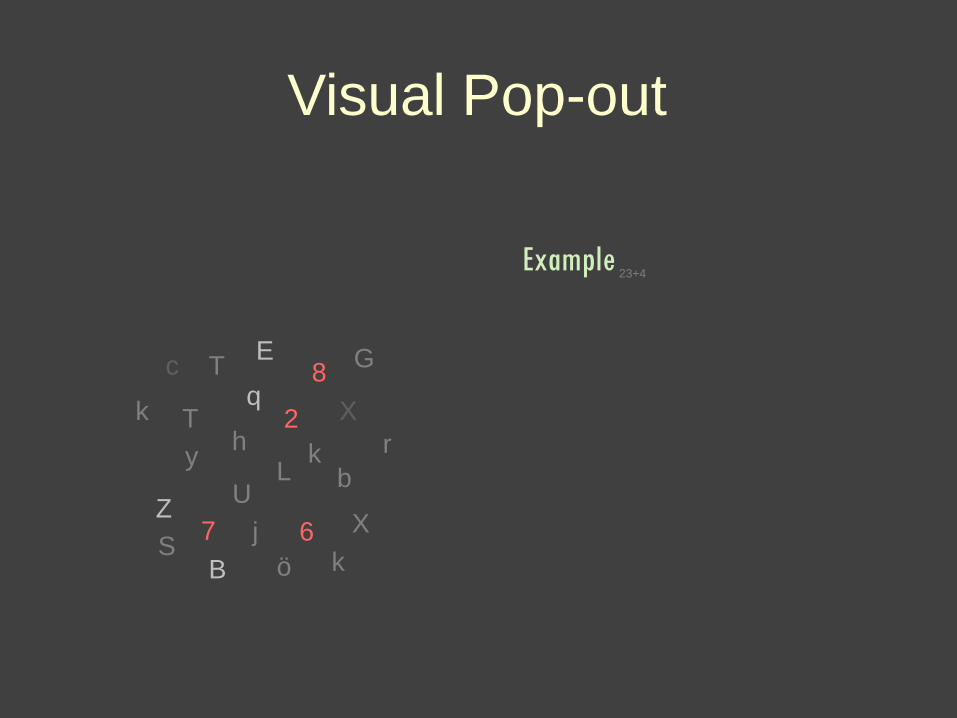
Visual Pop-out
Example
Z
S B
j
T
y
U
ö
h
T q
k L
X
r
G c
2
7 6
E 8
X
b
k
k
23+4
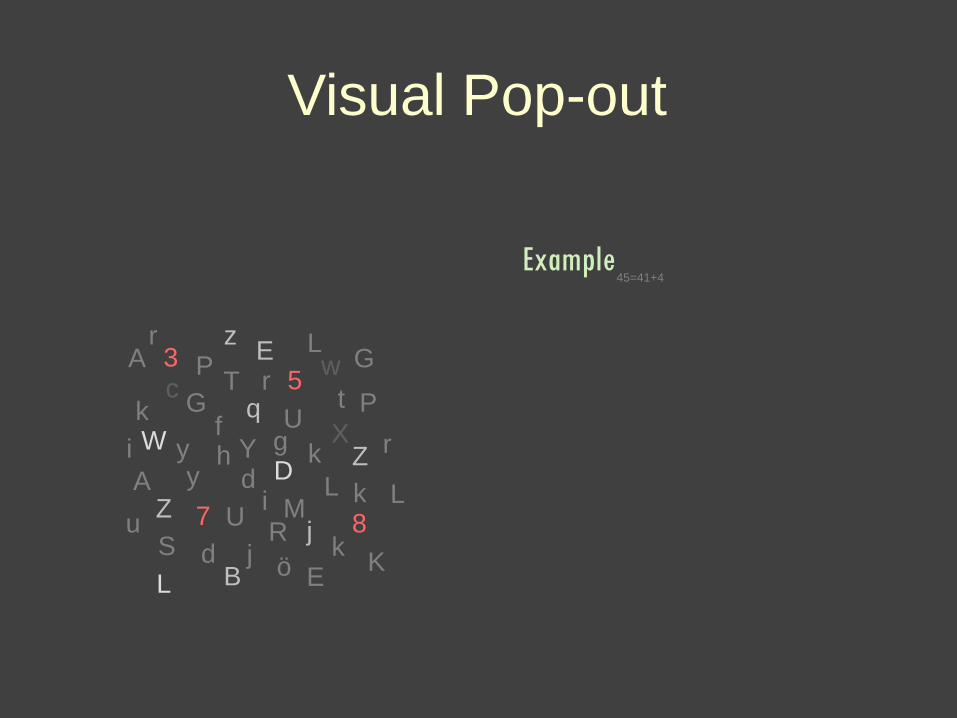
Visual Pop-out
Example
A Z
S d B
j
y y
U
ö
G
h d D
M j
T q
k
L
X
t
r
G c 5
U
7 R
E w
8 k
k
k
P
Y
P
A
u
z r
i
L
K L
L
E
W
r
Z
3
45=41+4
g
i
f

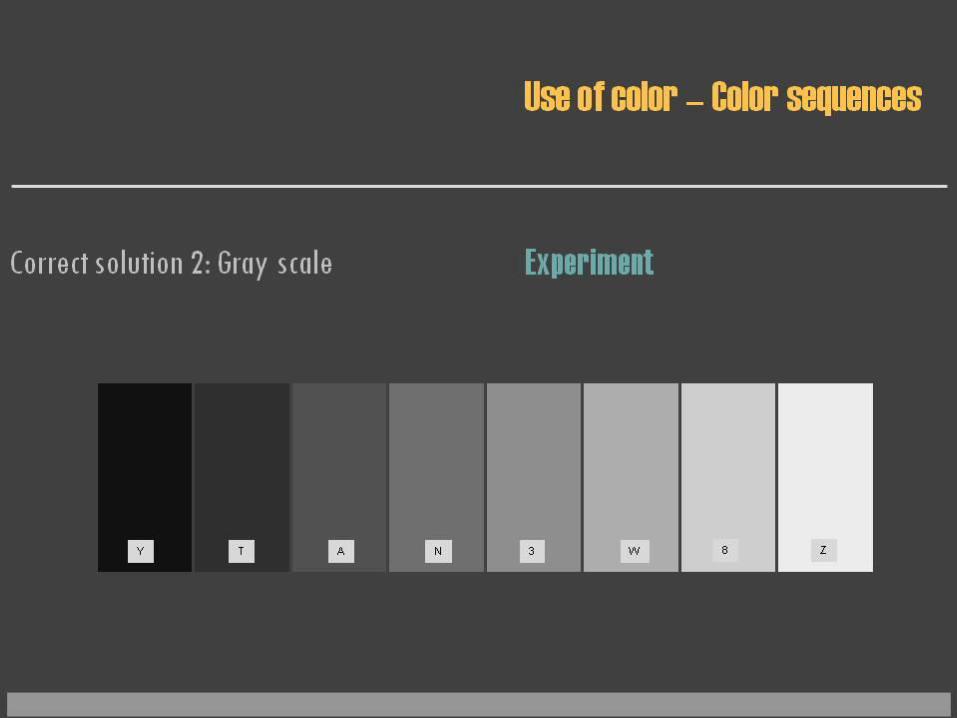
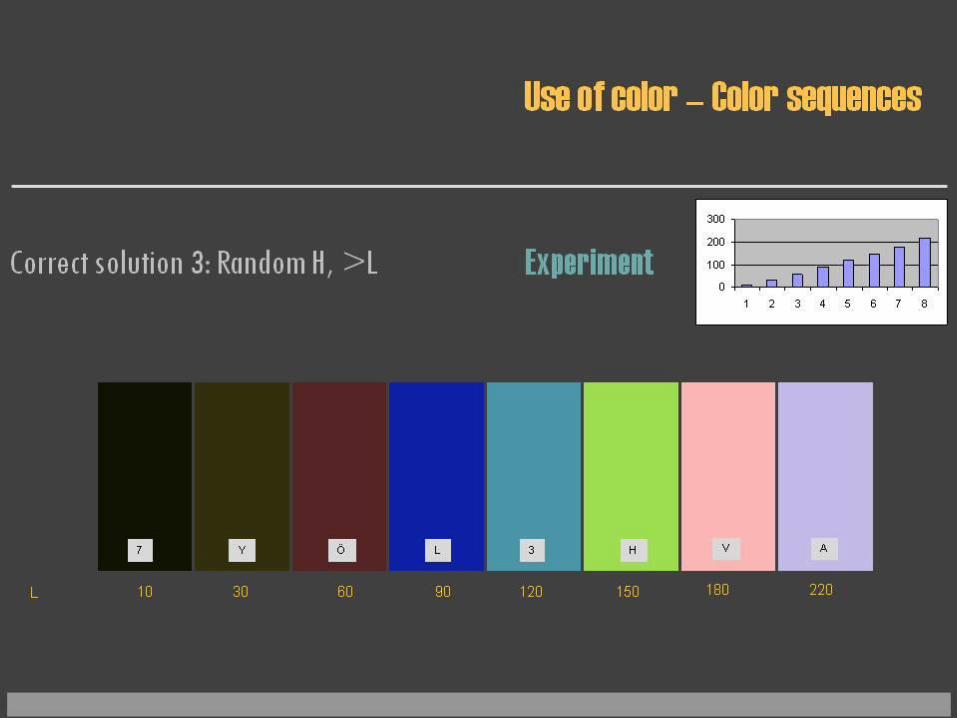
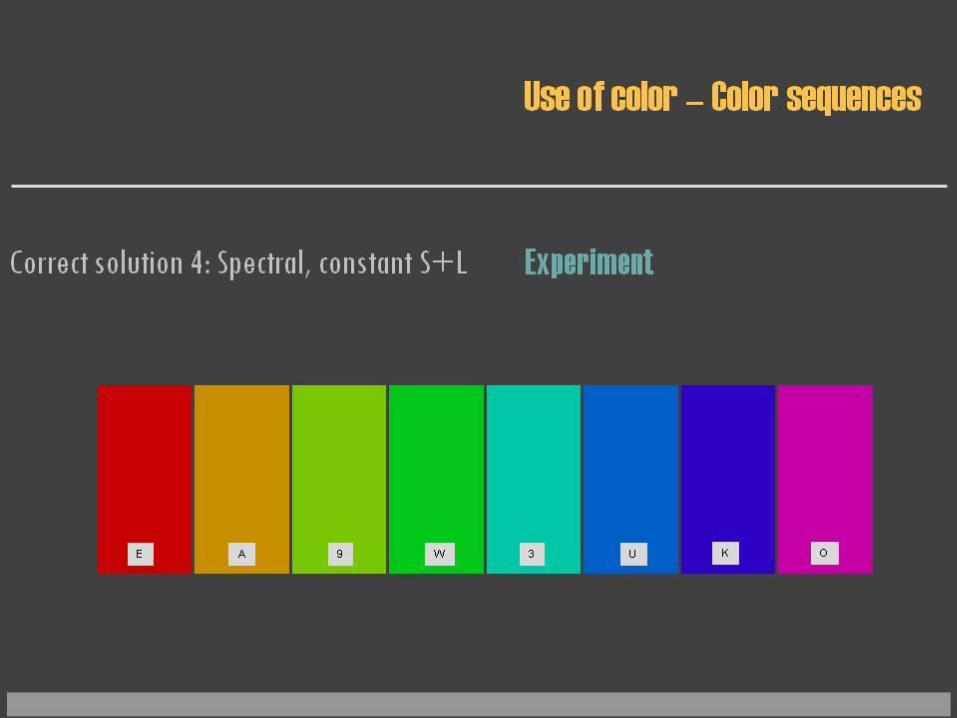
Colors represent quantities
Color maps -> representation of relatively ordered information
Perceptual linearity
Constant lightness contrast
Color maps for deviation detection
Not suited for absolute quantitative assessment!
Experiment: Sorting color-maps
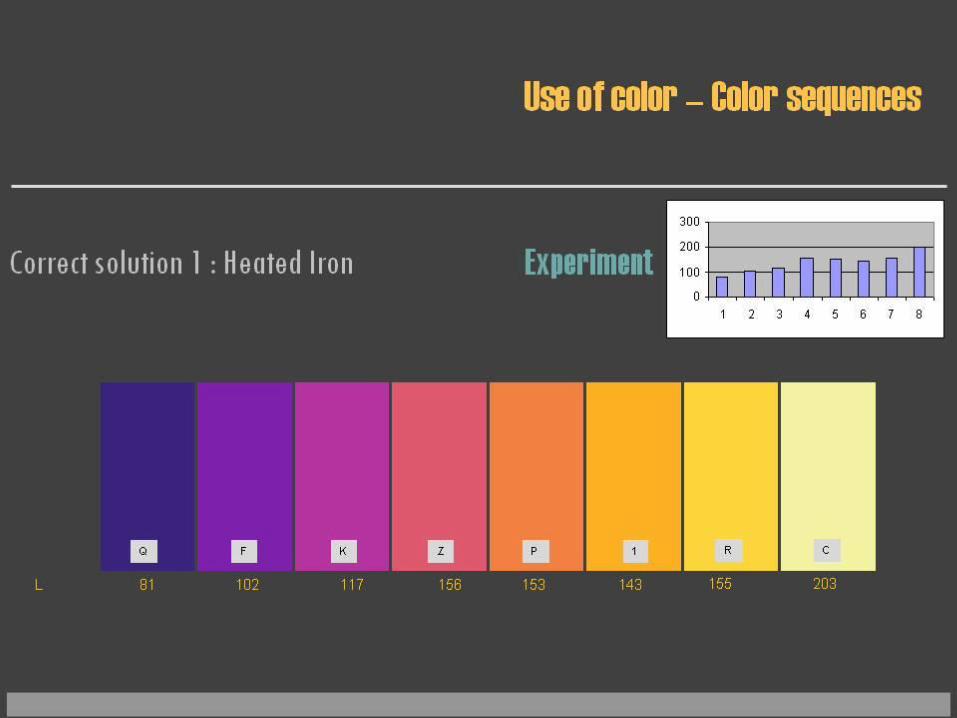

Example from a real case in the process industry
Efficient use of color
Stefan Seipel - IT-Forum 2015
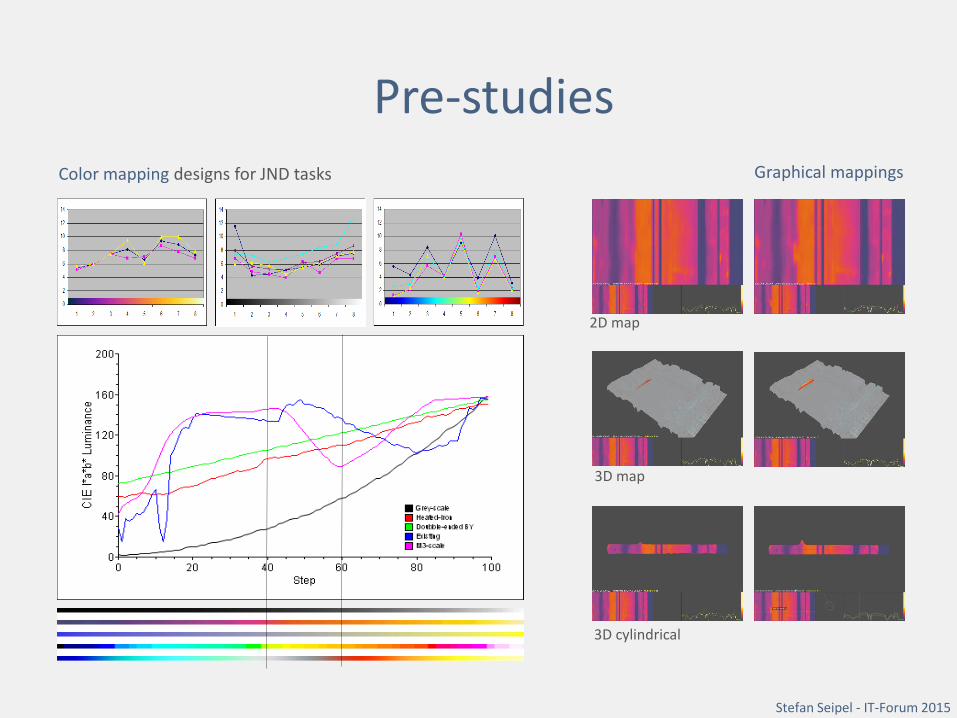
Pre-studies
Color mapping designs for JND tasks
Graphical mappings
2D map
3D map
3D cylindrical
Stefan Seipel - IT-Forum 2015

Validation study in the field
Temperature increase
0
50
100
150
200
250
300
350
400
0 1 2 3 4 5 6 7 8 9
Interval
De
gre
es C
40s
Stefan Seipel - IT-Forum 2015
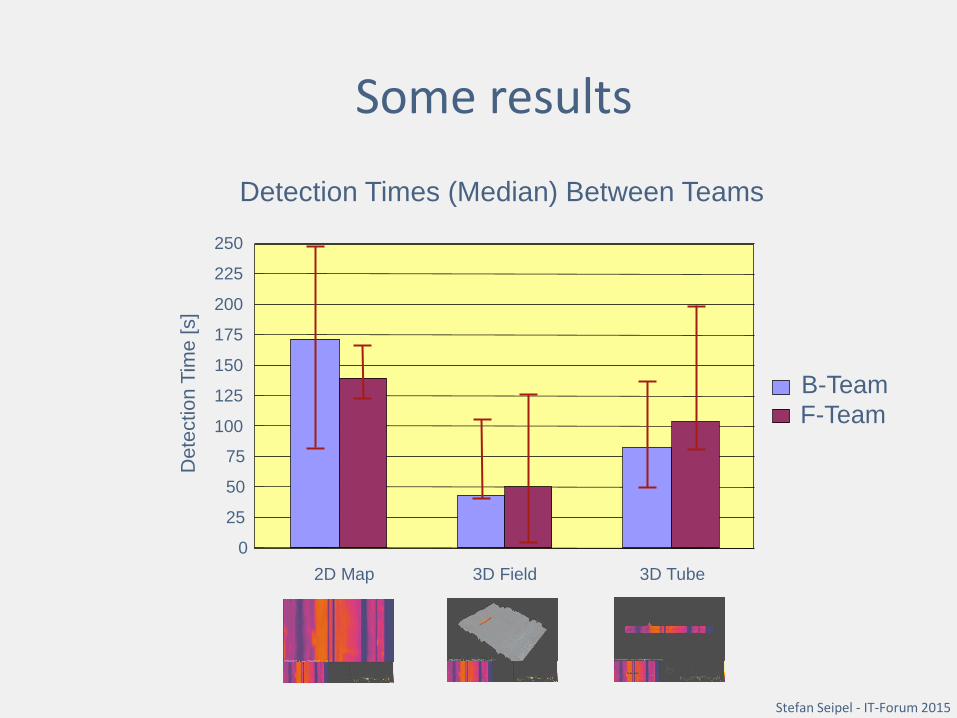
Some results
Detection Times (Median) Between Teams
0
25
50
75
100
125
150
175
200
225
250
2D Map 3D Field 3D Tube
B-Team F-Team
Dete
ctio
n T
ime
[s]
Stefan Seipel - IT-Forum 2015
Visualization
Potential and pitfalls
Visualization has an enormous potential!
”An image tells more than thousand words”
But:
”The eye sees what it wants to see”
CAVEAT: Illusions and perceptual limits

Visualization
Ambiguous representations
”The eye sees what it wants to see?”
Sax player or woman's face? Seal or donkey's face? Bacchus or couple kissing?
How you interpret the visual percept depends among others things
upon your personal attitude, expectations (context).
But visual angle is important, too!
Visual elements that subtend 4 degrees visual are most prominent.
Visualization
Cognitive limits
Visualizations have enormous potential!
”An image tells more than thousand words”
But:
”Human’s capacity for attention is limited”
Example: “Inattentional blindness” aka “perceptual blindness”

Inattentional blindness
Task : Count the passes of the black team in the following video!
Daniel Simons & Christopher Chabris
Visualizations have enormous potential!
”An image tells more than thousand words”
But:
”Human short term memory (working memory) is limited”
Example: “Change blindness”
Visualization
Cognitive limits

Change Blindness:

Visualization
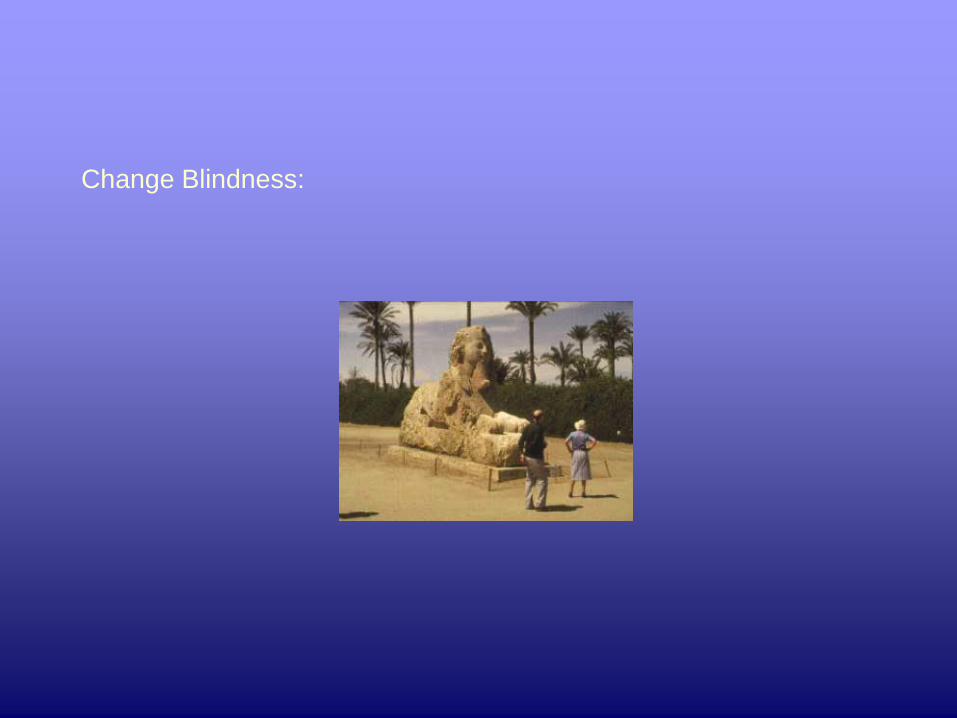
Change Blindness:
Visualization
Change Blindness:
Fairly large changes in a scene are not detected if they coincide
with some visual disruption.
(e.g. saccades, blinks, transient noise and distraction)
Failure to compare relevant visual information from current scene
with visual short term memory.

Visualization
Potential and pitfalls
The visual percept of size
is not constant.
Retinal size of objects is does not
predict real size.
Example:
Mix of 2D spatial size and 3D
perspective cues
Visualization
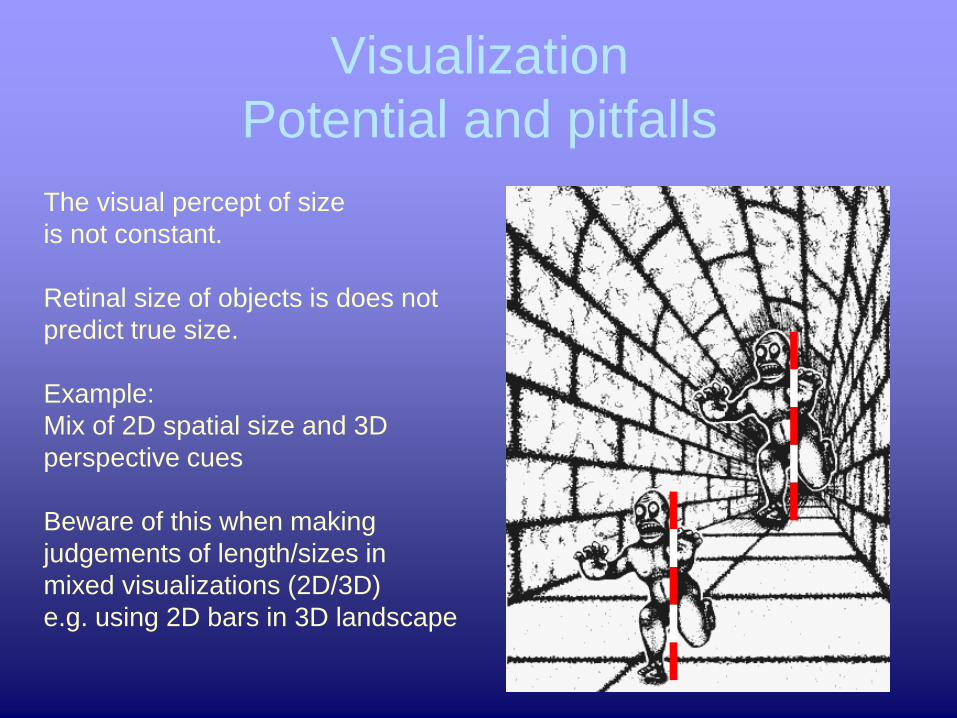
Potential and pitfalls
The visual percept of size
is not constant.
Retinal size of objects is does not
predict true size.
Example:
Mix of 2D spatial size and 3D
perspective cues
Beware of this when making
judgements of length/sizes in
mixed visualizations (2D/3D)
e.g. using 2D bars in 3D landscape

Visualization
Potential and pitfalls
Illusions from deliberately chosen inconsistent 3D cues (Ames Room)
By Adelbert Ames Jr. (Ophtalmologist), 1934;