Embed Size (px)
Citation preview
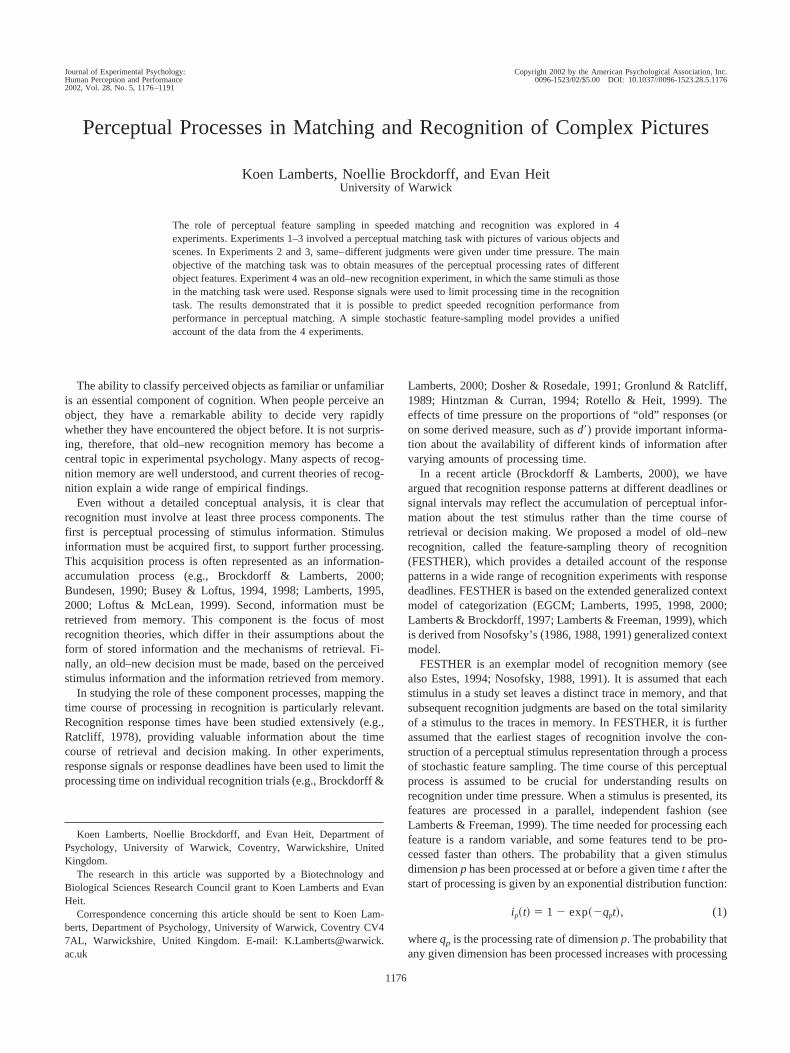
Perceptual Processes in Matching and Recognition of Complex Pictures
Koen Lamberts, Noellie Brockdorff, and Evan HeitUniversity of Warwick
The role of perceptual feature sampling in speeded matching and recognition was explored in 4experiments. Experiments 1–3 involved a perceptual matching task with pictures of various objects andscenes. In Experiments 2 and 3, same–different judgments were given under time pressure. The mainobjective of the matching task was to obtain measures of the perceptual processing rates of differentobject features. Experiment 4 was an old–new recognition experiment, in which the same stimuli as thosein the matching task were used. Response signals were used to limit processing time in the recognitiontask. The results demonstrated that it is possible to predict speeded recognition performance fromperformance in perceptual matching. A simple stochastic feature-sampling model provides a unifiedaccount of the data from the 4 experiments.
The ability to classify perceived objects as familiar or unfamiliaris an essential component of cognition. When people perceive anobject, they have a remarkable ability to decide very rapidlywhether they have encountered the object before. It is not surpris-ing, therefore, that old–new recognition memory has become acentral topic in experimental psychology. Many aspects of recog-nition memory are well understood, and current theories of recog-nition explain a wide range of empirical findings.
Even without a detailed conceptual analysis, it is clear thatrecognition must involve at least three process components. Thefirst is perceptual processing of stimulus information. Stimulusinformation must be acquired first, to support further processing.This acquisition process is often represented as an information-accumulation process (e.g., Brockdorff & Lamberts, 2000;Bundesen, 1990; Busey & Loftus, 1994, 1998; Lamberts, 1995,2000; Loftus & McLean, 1999). Second, information must beretrieved from memory. This component is the focus of mostrecognition theories, which differ in their assumptions about theform of stored information and the mechanisms of retrieval. Fi-nally, an old–new decision must be made, based on the perceivedstimulus information and the information retrieved from memory.
In studying the role of these component processes, mapping thetime course of processing in recognition is particularly relevant.Recognition response times have been studied extensively (e.g.,Ratcliff, 1978), providing valuable information about the timecourse of retrieval and decision making. In other experiments,response signals or response deadlines have been used to limit theprocessing time on individual recognition trials (e.g., Brockdorff &
Lamberts, 2000; Dosher & Rosedale, 1991; Gronlund & Ratcliff,1989; Hintzman & Curran, 1994; Rotello & Heit, 1999). Theeffects of time pressure on the proportions of “old” responses (oron some derived measure, such as d�) provide important informa-tion about the availability of different kinds of information aftervarying amounts of processing time.
In a recent article (Brockdorff & Lamberts, 2000), we haveargued that recognition response patterns at different deadlines orsignal intervals may reflect the accumulation of perceptual infor-mation about the test stimulus rather than the time course ofretrieval or decision making. We proposed a model of old–newrecognition, called the feature-sampling theory of recognition(FESTHER), which provides a detailed account of the responsepatterns in a wide range of recognition experiments with responsedeadlines. FESTHER is based on the extended generalized contextmodel of categorization (EGCM; Lamberts, 1995, 1998, 2000;Lamberts & Brockdorff, 1997; Lamberts & Freeman, 1999), whichis derived from Nosofsky’s (1986, 1988, 1991) generalized contextmodel.
FESTHER is an exemplar model of recognition memory (seealso Estes, 1994; Nosofsky, 1988, 1991). It is assumed that eachstimulus in a study set leaves a distinct trace in memory, and thatsubsequent recognition judgments are based on the total similarityof a stimulus to the traces in memory. In FESTHER, it is furtherassumed that the earliest stages of recognition involve the con-struction of a perceptual stimulus representation through a processof stochastic feature sampling. The time course of this perceptualprocess is assumed to be crucial for understanding results onrecognition under time pressure. When a stimulus is presented, itsfeatures are processed in a parallel, independent fashion (seeLamberts & Freeman, 1999). The time needed for processing eachfeature is a random variable, and some features tend to be pro-cessed faster than others. The probability that a given stimulusdimension p has been processed at or before a given time t after thestart of processing is given by an exponential distribution function:
ip�t� � 1 � exp��qpt�, (1)
where qp is the processing rate of dimension p. The probability thatany given dimension has been processed increases with processing
Koen Lamberts, Noellie Brockdorff, and Evan Heit, Department ofPsychology, University of Warwick, Coventry, Warwickshire, UnitedKingdom.
The research in this article was supported by a Biotechnology andBiological Sciences Research Council grant to Koen Lamberts and EvanHeit.
Correspondence concerning this article should be sent to Koen Lam-berts, Department of Psychology, University of Warwick, Coventry CV47AL, Warwickshire, United Kingdom. E-mail: [email protected]
Journal of Experimental Psychology: Copyright 2002 by the American Psychological Association, Inc.Human Perception and Performance2002, Vol. 28, No. 5, 1176–1191
0096-1523/02/$5.00 DOI: 10.1037//0096-1523.28.5.1176
1176
time. Each processed feature is integrated into the current percep-tual representation of the stimulus. This representation thus be-comes more complete as more features are processed. Whenever afeature is processed, the similarity of the current stimulus repre-sentation to the traces in memory changes (see Brockdorff &Lamberts, 2000), and these changes determine the probability thatthe stimulus will be recognized.
In experiments with response signals or response deadlines,responses may have to be initiated before stimulus processing iscomplete (i.e., before all stimulus features have been processed).In other studies (Lamberts, 1995, 1998, 2000, 2002; Lamberts &Brockdorff, 1997; Lamberts & Freeman, 1999), we have shownthat a similar principle explains a wide range of results on timingeffects in categorization. In FESTHER, it is assumed that therecognition functions in experiments with response signals alsoreflect the time course of feature sampling. Brockdorff and Lam-berts (2000) have shown that FESTHER can provide accurateaccounts of the response patterns for individual stimuli in a num-ber of recognition experiments in which artificial objects andwords were used as the stimuli and unpredictable response signalswere used to limit processing time. The response patterns wereoften complex in the sense that the response proportions did notalways vary monotonically as a function of available processingtime. The model’s feature-sampling assumptions proved sufficientto reproduce these complex patterns.
Among process models of recognition memory, FESTHER isquite unique in predicting a strong link between the time course ofperception and the time course of recognition (although Loftus &McLean, 1999, have made a related proposal, which we discuss indetail later). Traditional process models of recognition do notassign a central functional role to perceptual processes. Yet, ifFESTHER proves to be correct, it has the important implicationthat we cannot fully understand how people recognize visualstimuli unless we also understand how these stimuli are perceived.The experiments in this article aimed to further explore the role ofperceptual processing in recognition. If time-dependent variationin recognition judgments depends on the time course of perceptualprocessing, it should be possible to use information about the timecourse of stimulus perception to predict the time course of recog-nition judgments. That is, if the stimulus dimensions and theirprocessing rates are known, it is possible to make precise, testablepredictions about the time course of recognition. In the experi-ments in Brockdorff and Lamberts (2000), the stimulus dimensionswere always known (because artificial stimuli were used), but theprocessing rates of the dimensions were free parameters in themodel. Because perceptual processing rates were not measuredindependently, the experiments in Brockdorff and Lamberts (2000)did not provide direct evidence that perceptual processing rates ofstimulus dimensions affect the time course of recognition judg-ments. Moreover, the use of relatively simple artificial stimuli,with a small number of well-defined dimensions, restricted thegenerality of the conclusions that could be drawn from the exper-iments. In the research we report in this article, we aimed toremedy these shortcomings by attempting to predict the timecourse of recognition judgments of realistically complex stimuli onthe basis of independent measurements of dimensional processingrates.
This task raised two important challenges. First, the dimensionsof complex, realistic stimuli (such as photographs or drawings of
objects or scenes) are unknown, which makes it difficult to controlor manipulate similarity between such stimuli. Second, the deter-minants of feature processing rates are complex (see Lamberts,1998; Lamberts & Freeman, 1999), precluding the use of a simplemanipulation to produce stimulus sets with reliably different pro-cessing rates for specific features. To overcome these difficulties,we used a multiexperiment research strategy. We first carried outthree perceptual matching experiments, the aim of which wasprimarily to provide independent measures of perceptual process-ing rates of stimulus features. Our fourth experiment was a stan-dard recognition experiment, in which judgments were given undertime pressure.
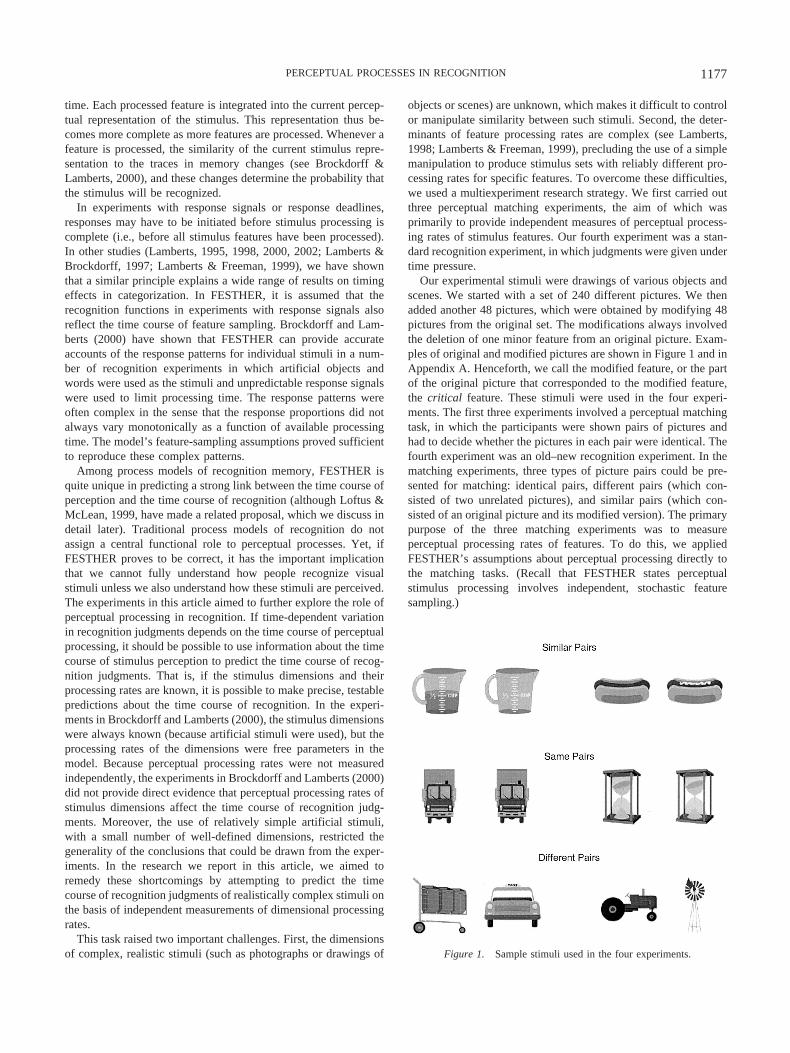
Our experimental stimuli were drawings of various objects andscenes. We started with a set of 240 different pictures. We thenadded another 48 pictures, which were obtained by modifying 48pictures from the original set. The modifications always involvedthe deletion of one minor feature from an original picture. Exam-ples of original and modified pictures are shown in Figure 1 and inAppendix A. Henceforth, we call the modified feature, or the partof the original picture that corresponded to the modified feature,the critical feature. These stimuli were used in the four experi-ments. The first three experiments involved a perceptual matchingtask, in which the participants were shown pairs of pictures andhad to decide whether the pictures in each pair were identical. Thefourth experiment was an old–new recognition experiment. In thematching experiments, three types of picture pairs could be pre-sented for matching: identical pairs, different pairs (which con-sisted of two unrelated pictures), and similar pairs (which con-sisted of an original picture and its modified version). The primarypurpose of the three matching experiments was to measureperceptual processing rates of features. To do this, we appliedFESTHER’s assumptions about perceptual processing directly tothe matching tasks. (Recall that FESTHER states perceptualstimulus processing involves independent, stochastic featuresampling.)
Figure 1. Sample stimuli used in the four experiments.
1177PERCEPTUAL PROCESSES IN RECOGNITION
In the first experiment, two pictures were presented simulta-neously on each trial, and the participants were instructed to judgetheir identity as quickly and accurately as possible. In this exper-iment, we were primarily interested in the response times (RTs) for“different” judgments of similar pairs of items. We assumed thatthe participants would respond “different” to these pairs as soon asthey detected the critical feature in both pictures. Because thestimuli in the matching task were presented simultaneously on thescreen, we interpreted the mean time for correct responses to eachsimilar pair as an ordinal index of the perceptual processing rate ofthe critical feature. On the basis of the RTs for correct responses,we carried out a median split, dividing the 48 similar pairs into aset of 24 pairs that yielded the fastest responses (the fast–similarset) and a set of 24 pairs that produced the slowest responses (theslow–similar set). This division was maintained throughout theother three experiments in the series.
On the basis of RTs alone, it is not possible to obtain a reliableestimate of perceptual processing times, unless the stimulus struc-ture is directly manipulated (see Lamberts, 2000). Experiments 2and 3 were designed to produce estimates of the average process-ing rates of the critical features in the fast–similar and slow–similar sets. In these experiments, the participants matched thesame pairs of pictures as in Experiment 1, but unpredictableresponse signals were used to limit the time available for respond-ing on any trial. The patterns of responses at different signalintervals can be used to obtain reliable estimates of processingrates (Brockdorff & Lamberts, 2000; Lamberts, 1998). Experi-ments 2 and 3 differed only in the sequence of events on each trial.In Experiment 2, the two pictures were presented simultaneouslyon the screen. In Experiment 3, presentation of the pictures wassequential, with an interstimulus interval (ISI) of 2,000 ms. On thebasis of the data from Experiments 2 and 3, we aimed to obtainconsistent estimates of the processing rates for the critical featuresin the fast–similar and slow–similar stimulus sets. The presentationmode of the picture pairs (simultaneous or sequential) was variedbetween the experiments, because this would allow us to obtain acritical test of the perceptual processing assumptions in the model.The assumption that feature processing times are exponentiallydistributed led us to predict different functional relations betweenavailable processing time and response rates in simultaneous andsequential matching, as explained in detail in the modeling sectionbelow.
The recognition task in Experiment 4 used the same stimuli asdid the matching tasks in Experiments 1, 2, and 3. After an initialstudy phase, different types of items were presented for recogni-tion. Old items were part of the study set, new items were unrelatedto the study set, and similar items differed on one critical featurefrom a stimulus in the study set. The similar test items weredivided into fast–similar items and slow–similar items, accordingto the match RTs in Experiment 1. Response signals could occurafter various lags, and the proportion of “old” responses aftervarious lags was the variable of interest.
Together, the four experiments provide a critical test of ourassumptions about feature sampling and perceptual processing inrecognition. If the timing effects that have been found in previousrecognition experiments with response deadlines or response sig-nals are due to the time course of feature sampling, then it shouldbe possible to fit the data from the matching and recognitionexperiments with a single set of processing rate parameters. The
results from the experiments may also have more general impli-cations for our understanding of the relation between perceptualmatching and recognition of pictures. Although these two taskshave been widely studied, there have been few previous attemptsto investigate the theoretical and empirical connections betweenthem (but see Ratcliff, 1981; Van Zandt, Colonius, & Proctor,2000; also relevant is Cohen & Nosofsky, 2000, which exploresthe relation between matching and categorization). Yet, even with-out much analysis, it is clear that same–different matching tasksshare many characteristics with standard old–new recognitiontasks. In matching, two stimuli are presented simultaneously or inclose succession, and the participants judge the identity of thestimuli. In recognition, participants first study a set of stimuli, andthen judge whether individual test stimuli occurred in the study set.Both tasks involve a comparison process. In matching, the com-parison is between two simultaneously presented stimuli or be-tween a stimulus in short-term memory and a stimulus on screen.In recognition, the comparison is between a test stimulus and apotentially large set of stimuli in long-term memory. Our resultsshould indicate to what extent a common framework for both tasksis feasible.
The remainder of this article is organized as follows. We firstpresent the four experiments, together with a brief discussion ofthe results. Next, we discuss the modeling principles that providethe link between the four data sets. Finally, we apply the model tothe data, and we discuss the implications of the modeling.
Experiment 1
In this experiment, participants were asked to give speededidentity judgments of pairs of drawings. The stimuli were colordrawings of various everyday office and household items, places,and people. The pictures were used to construct three classes ofstimulus pairs, called same, different, and similar. The same pairswere made up of two copies of the same picture, the different pairsconsisted of two different pictures, and the similar pairs were pairsof pictures produced by making one picture a copy of the otherpicture but with part of the image deleted (see Figure 1 forexamples). Pairs of pictures were presented on a computer screen,and participants were asked to decide as quickly as possiblewhether the two members of each pair were identical or different.
Method
Participants. A total of 20 undergraduate and graduate students fromthe University of Warwick were recruited through advertisements placedaround campus and paid £2 (approximately $3) each.
Apparatus and stimuli. The experiment was controlled by a Pentium400 MHz computer with a 17-inch color monitor with a resolution of 1,280pixels (horizontally) � 1,024 pixels (vertically). Responses were registeredby means of two microswitches connected to the computer’s parallel port.Responses were timed with an accuracy of 1 ms. The participants viewedthe screen from a distance of 60 cm.
A total of 288 drawings was used in the experiment to produce 48similar pairs, 48 different pairs, and 96 same pairs. All participants re-ceived the same pairs of stimuli, but in a different random order. Eachpicture occurred only in one pair. The drawings were in full color on awhite background. Each picture measured 5.7 cm � 5.7 cm, and eachstimulus pair consisted of two pictures side by side, centered on a blackscreen. The distance between the inner edges of the two pictures in a pairwas 6 mm.
1178 LAMBERTS, BROCKDORFF, AND HEIT
Design and procedure. Each participant attended one session consist-ing of 192 trials. Each stimulus pair was shown once. The left–rightposition of the pictures that made up the similar and different pairs wascounterbalanced across participants. On each trial, a cue (a cross) wasshown at the center of the screen for 500 ms. The screen was blank (black)for 100 ms, after which a stimulus pair appeared. The stimuli remained onscreen until a response was made or until 5 s had elapsed, whicheveroccurred first.
Participants were instructed to press the same button if the two picturesshown were exactly the same and to press the different button if thepictures were different in any way. Participants were asked to respond asaccurately and as quickly as possible. Accuracy feedback was providedafter every trial. Before the experimental session, participants were given30 practice trials with nonexperimental stimuli. During practice, the needfor quick responding was emphasized.
Results and Discussion
The mean RTs on trials with correct responses and the propor-tions correct on similar, different, and same pairs of pictures areshown in Table 1. A repeated measures analysis of variance(ANOVA) on the mean RTs revealed a reliable main effect ofmatch type, F(2, 38) � 25.78, p � .01, MSE � 16,970. Plannedcomparisons showed that all pairwise RT differences between thematch types were reliable: different versus similar, t(19) � 11.35,p � .01; different versus same, t(19) � 5.18, p � .01; same versussimilar, t(19) � 1.83, p � .05. An ANOVA of the proportionscorrect across the three match types also yielded a reliable maineffect, F(2, 38) � 59.34, p � .01, MSE � 0.003. All pairwiseaccuracy differences between the match types were reliable: dif-ferent versus similar, t(19) � 9.38, p � .01; different versus same,t(19) � 2.34, p � .01; same versus similar, t(19) � 7.51, p � .01.
Because we were particularly interested in the stimuli that madeup the similar pairs, the responses to these pairs were analyzedfurther. We ranked the 48 similar pairs according to mean RT forcorrect responses across participants. (See Appendix A for rankingand mean RT for all similar pairs.) The mean RT for the fastestpair was 569 ms, and that for the slowest pair was 1,229 ms. Next,we divided the similar pairs into two sets. The 24 pairs that yieldedthe fastest mean RTs formed the fast set, and the 24 pairs with theslowest mean RTs formed the slow set. Within the fast set, meanRTs ranged from 569 ms to 749 ms, with a set mean of 662 ms.Mean RTs in the slow set ranged from 751 ms to 1,229 ms, witha set mean of 936 ms. The total proportion of correct responseswas .93 in the fast set and .68 in the slow set.
As we indicated in the introduction, Experiment 1 was primarilycarried out to provide data on the relative speed of processing thecritical differences in a wide range of similar pairs. The differencein accuracy between the slow and fast sets of similar pairs ispotentially important here. The direction of the difference (more
errors on slow pairs) allows us to rule out differential speed–accuracy trading as a primary source of RT differences betweenthe slow and fast sets. However, the accuracy difference introducesthe risk that the median split not only separates slow from fastpairs but also separates pairs in which the difference is perceptiblefrom pairs in which the difference simply cannot be seen, regard-less of processing time. To rule out this possibility, we asked 2additional participants to carry out the matching task with exclu-sive emphasis on accuracy and without the requirement to respondas fast as possible. Both participants obtained perfect scores, whichallowed us to assume safely that the median split separated pairsthat differed only in the detection speed of the critical difference.
Experiment 2
As in Experiment 1, in this experiment participants were askedto give identity judgments of pairs of simultaneously presenteddrawings. The stimuli were the same as those in Experiment 1. Aresponse-signal procedure was used to limit the available responsetime on individual trials. On hearing a signal from the computer,participants were to decide immediately whether the two membersof each pair were identical or different. On the basis of theclassification into fast–similar and slow–similar pairs from Exper-iment 1, we expected higher proportions of correct “different”responses to the fast–similar pairs than to the slow–similar pairs,across all response-signal intervals.
Method
Participants. A total of 16 undergraduate students from the Universityof Warwick participated in partial fulfillment of a course requirement.
Apparatus and stimuli. These were the same as those in Experiment 1.Design and procedure. Each participant attended one session consist-
ing of 192 trials. Each stimulus pair was shown once. The left–rightposition of the pictures that made up the similar and different pairs wascounterbalanced across participants. A response-signal procedure was usedon each trial. On each trial, a cue (a cross) was shown at the center of thescreen for 500 ms. The screen was blank (black) for 100 ms, after whicha stimulus pair appeared. At variable time lags after stimulus onset (100,200, 300, 350, 400, or 600 ms), a 1000-Hz tone sounded, and the picturepair disappeared from the screen. Participants were instructed to respondimmediately upon hearing the tone. If no response was made within 350 msfrom the onset of the tone, or if a response was made before the onset ofthe tone, an appropriate error message was displayed.
Although all participants received the same match stimuli in the courseof the experiment, the presentation order of the match stimuli and theassignment of stimulus pairs to signal intervals were randomized betweenparticipants, with the constraint that the number of same (16), different (8),fast–similar (4), and slow–similar (4) pairs was the same in each of the sixresponse-signal conditions.
Participants were instructed to press the same button if the two picturesshown were exactly the same and to press the different button if thepictures were different in any way. Accuracy feedback was provided afterevery trial. Before the experimental session, participants were given 48practice trials with nonexperimental stimuli.
Results and Discussion
Only responses that were given within a 100- to 350-ms windowfrom the onset of a response signal were analyzed. Overall, aproportion of .15 responses were outside the response window, anda repeated measures ANOVA showed that this did not vary sig-
Table 1Mean Correct Response Times (RTs; in Milliseconds) andAccuracy as a Function of Match Type in Experiment 1
Match type Mean RT Proportion correct
Similar 761 .80Different 544 .97Same 839 .93
1179PERCEPTUAL PROCESSES IN RECOGNITION
nificantly with match type, F(3, 45) � 1. The proportions ofresponses outside the window were .15, .15, .13, and .13 forfast–similar, slow–similar, different, and same pairs, respectively.An ANOVA yielded a reliable effect of signal interval on propor-tions of responses outside the window, F(5, 75) � 7.29, p � .01,MSE � 0.030; and a significant interaction between match typeand signal interval, F(15, 255) � 2.19, p � .01, MSE � 0.018.Table 2 summarizes the proportions of responses that were outsidethe response window, by signal interval and match type. A de-crease in the proportion of responses outside the window withincreasing signal lags is a common occurrence in response-signalexperiments (e.g., Brockdorff & Lamberts, 2000). The interactionbetween match type and signal interval is potentially important.The data in Table 2 show that the proportions of excluded trials arequite similar for the same, slow–similar, and fast–similar trials,and that the interaction appears to be primarily due to the differenttrials. For the different trials, the proportion of excluded trials isgenerally low, except at the longest signal interval (.27), at whichit is higher than that for any other match type. Further analysesshowed that this proportion consisted primarily of anticipationerrors (89%). This is compatible with the notion that the differenttrials were easiest and that for these trials, the participants some-times found it difficult to delay a response until the signal at thelongest interval. Although there are no reasons to assume that thedifferences in discarded response proportions could have intro-duced artifacts in our analyses or modeling, we decided to carryout all analyses on the full data sets as well, without discarding anytrials. Because the conclusions from this exercise were identical tothose from the standard analyses (with discarded trials), we discussonly the standard analyses in this article.
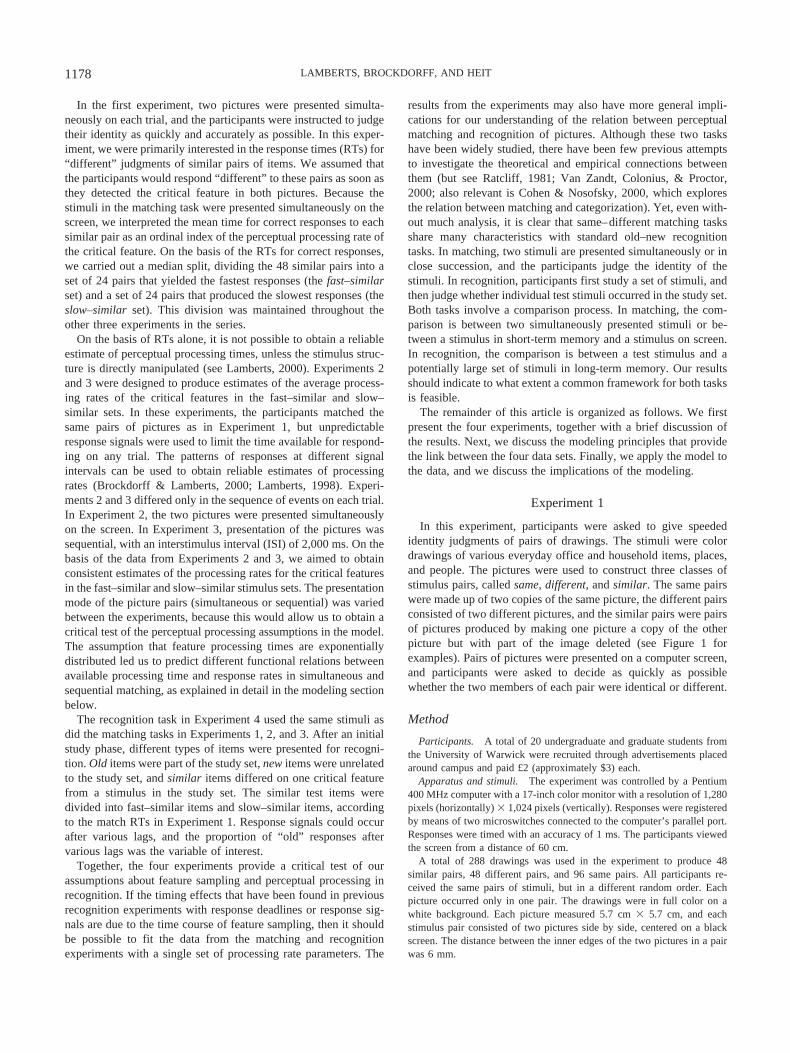
The proportions of “same” responses for the fast–similar, slow–similar, different, and same pairs are shown in Figure 2. AnANOVA on the proportions of “same” responses yielded a maineffect of match type, F(3, 45) � 247.90, p � .01, MSE � 0.036;and an interaction between match type and deadline, F(15, 225) �6.04, p � .01, MSE � 0.039. As can be seen from the figure,fast–similar picture pairs produced consistently higher proportionsof correct responses than did slow–similar pairs. A separateANOVA on the data from similar pairs showed only a reliablemain effect of match type (fast or slow), F(1, 15) � 102.96, p �.01, MSE � 0.035; a main effect of response-signal interval, F(5,75) � 4.45, p � .01, MSE � 0.070; and an interaction betweenmatch type and signal interval, F(5, 75) � 3.08, p � .05, MSE �0.066.
The results from Experiment 2 were largely as expected. Accu-racy generally increased at longer signal intervals. Of particularinterest was the difference between the two types of similar pairs.The fast–similar pairs generally produced higher proportions ofcorrect responses than did the slow–similar pairs, and the differ-ence between the two types became more pronounced at longersignal intervals. This confirms that the division into two groups onthe basis of RTs in Experiment 1 was useful, because it didseparate similar pairs with a rapidly detectable difference fromsimilar pairs with a slowly detectable difference. The theoreticalimplications of these data are discussed in the modeling section.
Experiment 3
This experiment was identical to Experiment 2, except for thetime course of stimulus presentation on each trial. The pictures thatmade up each pair were now presented sequentially. The picture onthe left-hand side of the display always appeared first, followed bythe picture on the right-hand side after a 2.0 s delay. As inExperiment 2, response signals were used to limit processing timeon individual trials.
Method
Participants. A total of 12 undergraduate students from the Universityof Warwick participated in partial fulfillment of a course requirement.
Apparatus and stimuli. These were the same as those in Experiments1 and 2.
Design and procedure. Each participant attended one session consist-ing of 192 trials. Each stimulus pair was shown once. The left–rightposition of the pictures that made up the similar and different pairs wascounterbalanced across participants. A response-signal procedure wasused. On each trial, the first picture in a pair appeared on the left-hand sideof the screen. After 2,000 ms, the second picture of the pair appeared on the
Table 2Proportions of Responses Outside the Response Window inExperiment 2, as a Function of Signal Interval (in Milliseconds)and Match Type
Interval
Match type
Fast–similar Slow–similar Different Same
100 .22 .30 .18 .25200 .17 .13 .08 .12300 .17 .13 .07 .09350 .13 .11 .08 .11400 .08 .05 .08 .10600 .11 .22 .27 .12
Figure 2. Observed proportions of “same” responses in Experiment 2.Responses to same, fast–similar, slow–similar, and different pairs areplotted against total time elapsed from presentation of stimulus (meanresponse time [RT] across all participants for all stimuli in each type) in thesix response-signal conditions (100, 200, 300, 350, 400, and 600 ms).
1180 LAMBERTS, BROCKDORFF, AND HEIT
right-hand side of the screen. At variable time lags after the right-handelement of the pair was displayed on screen (50, 100, 200, 300, 400, and600 ms), a 1000-Hz tone sounded, and the picture pair disappeared fromthe screen. Although all participants received the same match stimuli in thecourse of the experiment, the presentation order of the match stimuli andthe assignment of stimulus pairs to signal intervals was randomized be-tween participants, with the constraint that equal numbers of same, differ-ent, fast–similar, and slow–similar pairs were assigned to each response-signal condition.
Participants were instructed to respond immediately upon hearing thetone. If no response was made within 350 ms from the onset of the tone orif a response was made before the onset of the tone, an appropriate errormessage was displayed. Instructions, feedback, and practice trials were thesame as those in Experiment 2, with obvious modifications related to thesequential nature of the matching task.
Results and Discussion
The data from trials in which a response was given outside the100- to 350-ms window after signal onset were excluded from theanalyses. Overall, a proportion of .14 of responses were excludedin this way. As in Experiment 2, there were no reliable differencesbetween the proportions of excluded trials for different matchtypes, F(3, 33) � 1. The proportions of excluded trials were .16,.14, .13, and .13 for fast–similar, slow–similar, different, and samepairs, respectively. Again, the effect of signal interval on propor-tions of responses outside the window was reliable, F(5, 55) �9.89, p � .01, MSE � 0.203 (see Table 3), but there was nointeraction between signal interval and match type, F(15, 165) �1.03, p � .43, MSE � 0.018. The proportions of excluded tri-als were similar to those in Experiment 2, except for a higherproportion of exclusions at the 600-ms signal interval (.21).Most of the exclusions (88%) at this signal interval were antici-patory responses.
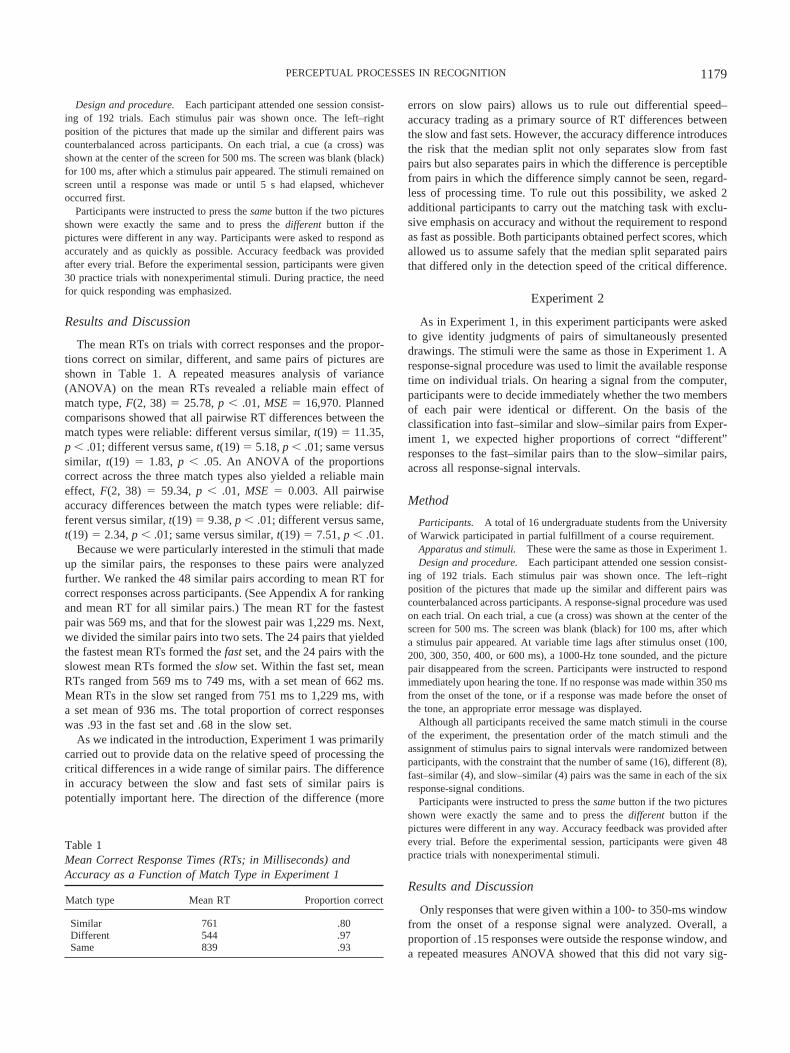
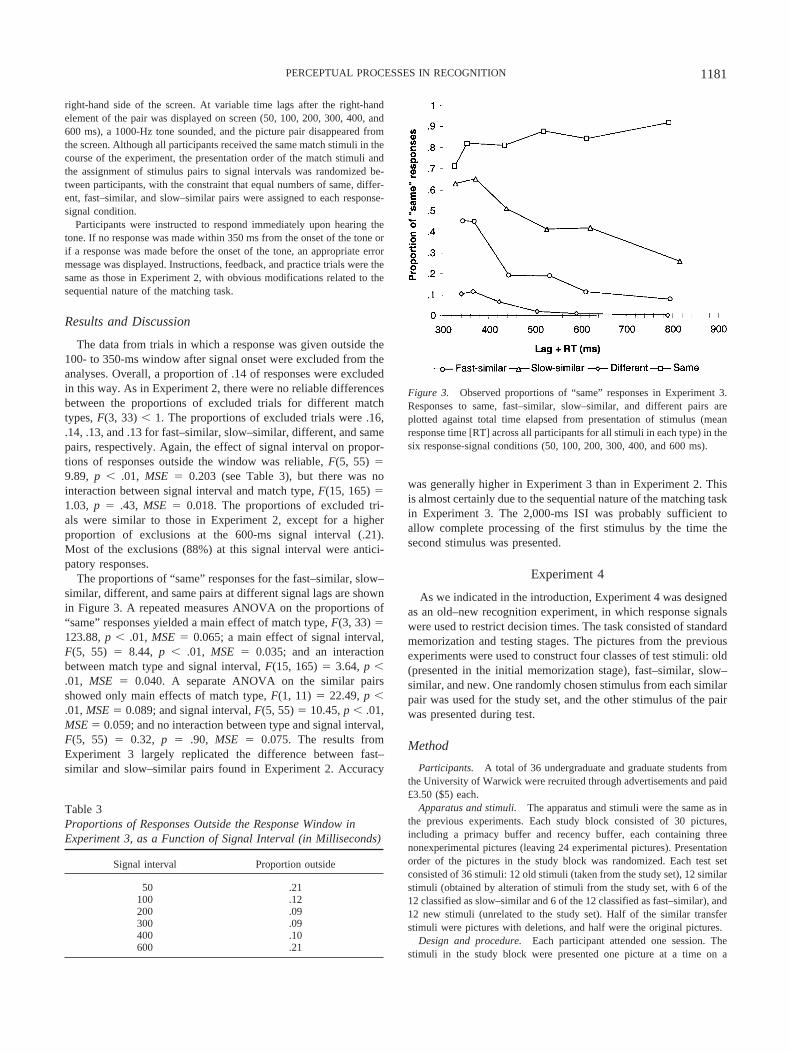
The proportions of “same” responses for the fast–similar, slow–similar, different, and same pairs at different signal lags are shownin Figure 3. A repeated measures ANOVA on the proportions of“same” responses yielded a main effect of match type, F(3, 33) �123.88, p � .01, MSE � 0.065; a main effect of signal interval,F(5, 55) � 8.44, p � .01, MSE � 0.035; and an interactionbetween match type and signal interval, F(15, 165) � 3.64, p �.01, MSE � 0.040. A separate ANOVA on the similar pairsshowed only main effects of match type, F(1, 11) � 22.49, p �.01, MSE � 0.089; and signal interval, F(5, 55) � 10.45, p � .01,MSE � 0.059; and no interaction between type and signal interval,F(5, 55) � 0.32, p � .90, MSE � 0.075. The results fromExperiment 3 largely replicated the difference between fast–similar and slow–similar pairs found in Experiment 2. Accuracy
was generally higher in Experiment 3 than in Experiment 2. Thisis almost certainly due to the sequential nature of the matching taskin Experiment 3. The 2,000-ms ISI was probably sufficient toallow complete processing of the first stimulus by the time thesecond stimulus was presented.
Experiment 4
As we indicated in the introduction, Experiment 4 was designedas an old–new recognition experiment, in which response signalswere used to restrict decision times. The task consisted of standardmemorization and testing stages. The pictures from the previousexperiments were used to construct four classes of test stimuli: old(presented in the initial memorization stage), fast–similar, slow–similar, and new. One randomly chosen stimulus from each similarpair was used for the study set, and the other stimulus of the pairwas presented during test.
Method
Participants. A total of 36 undergraduate and graduate students fromthe University of Warwick were recruited through advertisements and paid£3.50 ($5) each.
Apparatus and stimuli. The apparatus and stimuli were the same as inthe previous experiments. Each study block consisted of 30 pictures,including a primacy buffer and recency buffer, each containing threenonexperimental pictures (leaving 24 experimental pictures). Presentationorder of the pictures in the study block was randomized. Each test setconsisted of 36 stimuli: 12 old stimuli (taken from the study set), 12 similarstimuli (obtained by alteration of stimuli from the study set, with 6 of the12 classified as slow–similar and 6 of the 12 classified as fast–similar), and12 new stimuli (unrelated to the study set). Half of the similar transferstimuli were pictures with deletions, and half were the original pictures.
Design and procedure. Each participant attended one session. Thestimuli in the study block were presented one picture at a time on a
Table 3Proportions of Responses Outside the Response Window inExperiment 3, as a Function of Signal Interval (in Milliseconds)
Signal interval Proportion outside
50 .21100 .12200 .09300 .09400 .10600 .21
Figure 3. Observed proportions of “same” responses in Experiment 3.Responses to same, fast–similar, slow–similar, and different pairs areplotted against total time elapsed from presentation of stimulus (meanresponse time [RT] across all participants for all stimuli in each type) in thesix response-signal conditions (50, 100, 200, 300, 400, and 600 ms).
1181PERCEPTUAL PROCESSES IN RECOGNITION
computer screen at a rate of 3 s per picture. The participants were told thattheir task in the study phase was to try to remember each picture. Followingeach study block, a recognition test was given on 12 old, 12 similar (6slow–similar and 6 fast–similar) and 12 new pictures. Participants wereinstructed to press the old button if the test picture was present in the studyblock and to press the new button if the picture was different in any wayfrom any picture seen in the study block.
A response-signal procedure was used on each test trial. Pictures werepresented one at a time and appeared in the center of the screen on a blackbackground. Each test picture was shown once in the test phase. On eachtrial, a cue (a cross) was shown at the center of the screen for 500 ms. Thescreen was blank (black) for 100 ms, and then a picture appeared. Atvariable time lags after the stimulus onset on screen (100, 300, 500, 700,1,000, and 1,250 ms), a 1000-Hz tone sounded, and the stimulus disap-peared from the screen. Participants were instructed to respond immedi-ately upon hearing the tone. If no response was made within 350 ms of theonset of the tone, or if a response was made before the onset of the tone,an appropriate error message was displayed. No accuracy feedback wasprovided after the trials, but the proportion of correct responses and theproportion of responses made within 350 ms of the response signal wereshown after each block.
A total of four study–test experimental blocks were presented. Each ofthe four blocks contained a different set of pictures. Each participant wasshown the same old, similar, and new pictures within each block, but thepresentation order of the blocks and the order of the stimuli within eachblock were randomized. An equal number of pictures of each type (old,fast–similar, slow–similar, and new) was assigned (at random for eachparticipant) to each response-signal condition. Before the experimentalblocks, participants were given a practice block to familiarize them withthe experimental procedure. The practice block was identical to a test blockexcept that the stimuli used were not experimental stimuli.
Results and Discussion
The data were trimmed to remove trials in which participantseither took more than 350 ms to respond to the signal or respondedfaster than 100 ms after the response signal. An ANOVA on theproportions of discarded trials showed the expected main effect ofsignal interval, F(5, 175) � 67.29, p � .01, MSE � 0.073 (withmore trials discarded at the shortest intervals); but also a reliableeffect of stimulus type, F(3, 105) � 5.36, p � .01, MSE � 0.026.The effect of stimulus type is potentially problematic, becausedifferences in proportions of discarded trials can introduce artifi-cial shifts in proportions of correct responses. Table 4 shows theproportions of discarded trials for the four stimulus types in theexperiment. The proportion was lowest for the old and new stimuliand highest for the similar stimuli. The difference between thefast–similar and slow–similar types was small and nonsignificant.Moreover, this difference was in the opposite direction from whatmight be expected, with slightly more responses outside the win-dow for fast–similar stimuli than for slow–similar stimuli. It is
unlikely, therefore, that differential rates of discarded stimuliwould introduce significant artifacts in the data. As an additionalcheck, we also analyzed the data from Experiment 4 withoutdiscarding any responses. This alternative method of analysis didnot alter the results or the conclusions from the modeling in anymeaningful way.
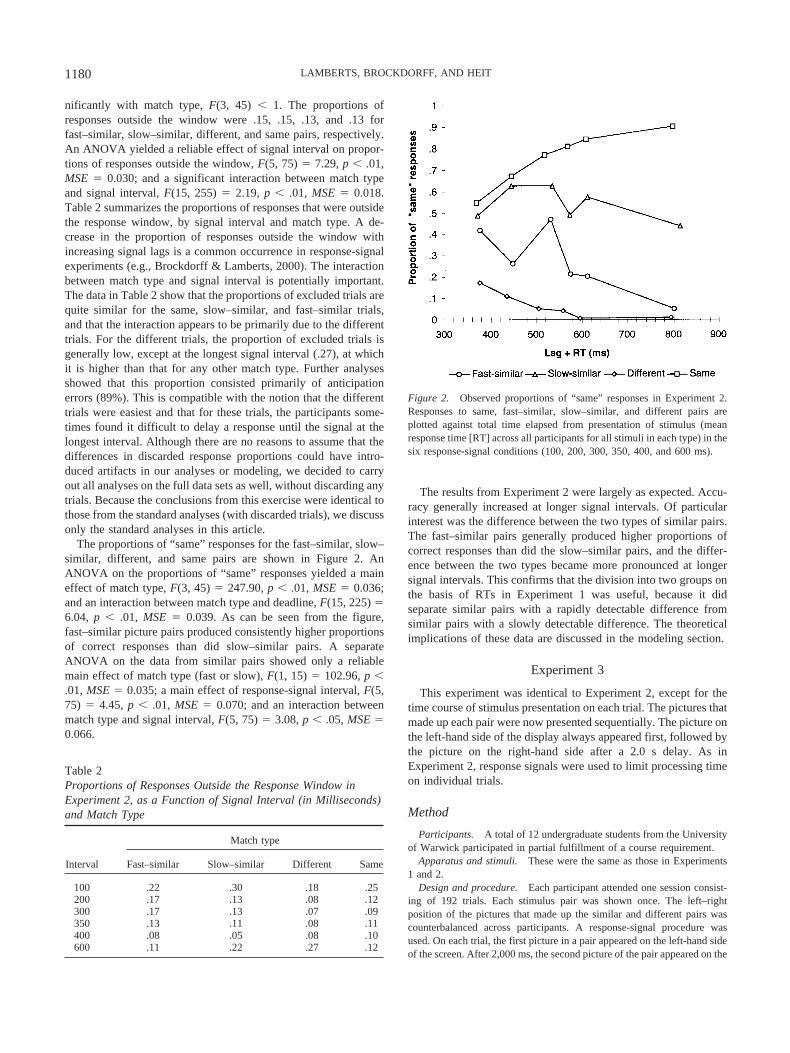
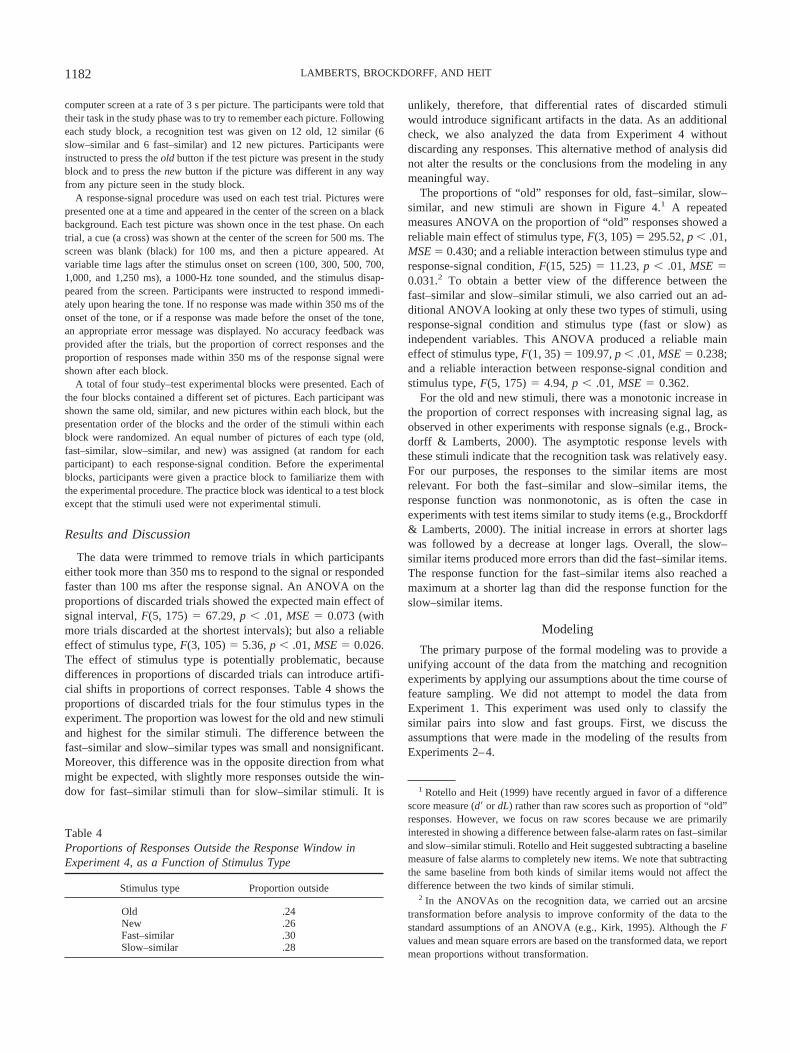
The proportions of “old” responses for old, fast–similar, slow–similar, and new stimuli are shown in Figure 4.1 A repeatedmeasures ANOVA on the proportion of “old” responses showed areliable main effect of stimulus type, F(3, 105) � 295.52, p � .01,MSE � 0.430; and a reliable interaction between stimulus type andresponse-signal condition, F(15, 525) � 11.23, p � .01, MSE �0.031.2 To obtain a better view of the difference between thefast–similar and slow–similar stimuli, we also carried out an ad-ditional ANOVA looking at only these two types of stimuli, usingresponse-signal condition and stimulus type (fast or slow) asindependent variables. This ANOVA produced a reliable maineffect of stimulus type, F(1, 35) � 109.97, p � .01, MSE � 0.238;and a reliable interaction between response-signal condition andstimulus type, F(5, 175) � 4.94, p � .01, MSE � 0.362.
For the old and new stimuli, there was a monotonic increase inthe proportion of correct responses with increasing signal lag, asobserved in other experiments with response signals (e.g., Brock-dorff & Lamberts, 2000). The asymptotic response levels withthese stimuli indicate that the recognition task was relatively easy.For our purposes, the responses to the similar items are mostrelevant. For both the fast–similar and slow–similar items, theresponse function was nonmonotonic, as is often the case inexperiments with test items similar to study items (e.g., Brockdorff& Lamberts, 2000). The initial increase in errors at shorter lagswas followed by a decrease at longer lags. Overall, the slow–similar items produced more errors than did the fast–similar items.The response function for the fast–similar items also reached amaximum at a shorter lag than did the response function for theslow–similar items.
Modeling
The primary purpose of the formal modeling was to provide aunifying account of the data from the matching and recognitionexperiments by applying our assumptions about the time course offeature sampling. We did not attempt to model the data fromExperiment 1. This experiment was used only to classify thesimilar pairs into slow and fast groups. First, we discuss theassumptions that were made in the modeling of the results fromExperiments 2–4.
1 Rotello and Heit (1999) have recently argued in favor of a differencescore measure (d� or dL) rather than raw scores such as proportion of “old”responses. However, we focus on raw scores because we are primarilyinterested in showing a difference between false-alarm rates on fast–similarand slow–similar stimuli. Rotello and Heit suggested subtracting a baselinemeasure of false alarms to completely new items. We note that subtractingthe same baseline from both kinds of similar items would not affect thedifference between the two kinds of similar stimuli.
2 In the ANOVAs on the recognition data, we carried out an arcsinetransformation before analysis to improve conformity of the data to thestandard assumptions of an ANOVA (e.g., Kirk, 1995). Although the Fvalues and mean square errors are based on the transformed data, we reportmean proportions without transformation.
Table 4Proportions of Responses Outside the Response Window inExperiment 4, as a Function of Stimulus Type
Stimulus type Proportion outside
Old .24New .26Fast–similar .30Slow–similar .28
1182 LAMBERTS, BROCKDORFF, AND HEIT
Experiment 2 involved matching of simultaneously presentedstimuli under various response deadlines. We assumed that per-ceptual processing of the stimuli involves stochastic, parallel, andindependent sampling of features and that the processing times areexponentially distributed. Because the stimuli in this experimentwere presented simultaneously, we assumed that the feature-sampling process started at the same time for both stimuli (thusassuming complete parallelism within and between stimuli). Wefurther assumed that the response signal interrupted perceptualprocessing of both stimuli, such that the time available for percep-tual processing on a group of trials with a given signal interval i (ti)was
ti � RTi � tres, (2)
in which RTi is the mean RT (measured from match stimuli onset)on the group of trials, and tres is the latency period after stimulusonset and the time needed for response production.3 In the mod-eling, tres was a single free parameter that applied across allexperiments.
On trials with similar pictures, computing the probability thatthe participants would detect a difference between the matchstimuli in the processing time available is relatively straightfor-ward. We assumed that similar pairs differed in only a singlefeature. Detection of the difference requires that the critical featureis processed in both pictures before the response is initiated:
pdet�simultaneous, similar, ti� � �1 � exp��qcritti�2, (3)
in which pdet(simultaneous, similar, ti) is the probability of detect-ing the difference between two simultaneously presented similarstimuli within perceptual processing time ti, and qcrit is the pro-cessing rate of the critical dimension. In the modeling, qcrit was afree parameter and allowed to have different values for the slow–similar and fast–similar pairs.
Next, we needed to determine the probability of a “same” or a“different” response. We assumed that the participants wouldalways respond “different” if they had detected a difference be-
tween the stimuli. However, in experiments with response signals,it is not realistic to assume that all “different” responses areactually based on detection of a difference. Especially at shortersignal intervals, in which the time pressure is quite severe, someproportion of “different” responses can be expected even on trialsin which the difference between the stimuli had not been detected.The data from trials with identical match stimuli were used toestimate the proportion of “different” responses to similar pairsthat were not the result of detection of a difference. For conve-nience, we call a “different” response to a similar or different paira hit and a “different” response to an identical pair a false alarm.We denote the hit and false alarm rates at signal interval i as Hi andFi, respectively. On trials with a similar or a different pair ofpictures, the total hit rate equals the weighted sum of the true hitrate (for which a difference has actually been detected) and the rateof “different” responses when a difference has not been detected(estimated by Fi):
Hi � pdet�ti� � �1 � pdet�ti� � ui, (4)
in which ui is equal to Fi.In this formulation, Fi is effectively used as a bias measure.
Formally, this model is equivalent to the single high-thresholdtheory of discrimination (Macmillan & Creelman, 1990). We alsoexplored other discrimination theories (such as the double high-threshold theory, Macmillan & Kaplan, 1985) in our modeling ofthe matching and recognition data, but the single high-thresholdmodel provided the best compromise between a good fit andparsimony across the data sets.
Modeling the choice proportions for different pairs in Experi-ment 2 was somewhat more complex. If we assumed that thestimuli in a different pair differed on all of the stimulus dimen-sions, we could show that the probability of detecting any differ-ence within a given time interval depends on the number ofstimulus dimensions that are involved in the comparison. Becausewe do not know the dimensional composition of the stimuli, weestimated the number of dimensions for comparison by a free
3 In Experiments 2, 3, and 4, the stimuli disappeared from the screen assoon as the response signal was presented. However, the stimuli were notmasked, so it is likely that perceptual processing continued for a short timeafter signal presentation. This leaves two alternative methods for estimat-ing perceptual processing times. The first method assumes that total per-ceptual processing time equals presentation time Ti (i.e., the signal interval)plus a constant that represents the duration of iconic memory: ti � Ti tvisual memory
. Although this method would be acceptable, it relies on theassumption that stimulus persistence time in memory after signal presen-tation is a constant. This assumption may not be correct; it is possible, forinstance, that persistence is longer at longer presentation times. Therefore,we chose the second method, which is based on observed RTs from whichwe subtracted a residual time to estimate perceptual processing times. Thismethod does not assume that visual persistence time is constant, but itrelies on the assumption that response production always has the sameduration. Although this assumption also may not be justified, we have usedit consistently in previous work (e.g., Brockdorff & Lamberts, 2000)without difficulties. In this article, as a final check, we also used the firstmethod to model the data. The model fits for the two methods were almostidentical (slightly better for the RT-based method), so we do not report themodeling outcomes obtained with the first estimation method.
Figure 4. Observed proportions of “old” responses in Experiment 4.Responses to old, fast–similar, slow–similar, and new stimuli are plottedagainst total time elapsed from presentation of stimulus (mean responsetime across all participants for all stimuli in each type) in the six response-signal conditions (100, 300, 500, 700, 1,000, and 1,250 ms). Error barsrepresent 95% confidence intervals.
1183PERCEPTUAL PROCESSES IN RECOGNITION
parameter, �. The probability of detecting any difference betweenthe stimuli in time interval ti is given by
pdet�simultaneous, different, ti� � 1 � �1 � �1 � exp��qti�2��,
(5)
in which q is the processing rate of the dimensions involved (wemade the simplifying assumption that all dimensions of bothstimuli had the same processing rate), and � is the number ofdimensions (see Appendix B for a derivation of this equation). Thedetection rates were translated into response rates in the same wayas the similar pairs (see Equation 4).
The response proportions from same pairs were not explicitlymodeled, because we assumed that these proportions reflected onlyresponse bias. However, the results from trials with identicalstimuli were taken into account in the modeling of the results fromsimilar and different trials (through Equation 4).
In Experiment 3, the matching task was sequential. We assumedthat the interstimulus interval was sufficiently long (at 2,000 ms)to allow complete processing of the first stimulus by the time thesecond stimulus was also presented. This assumption made itpossible to model the results from the similar and different trials.On similar trials, the difference between the stimuli would bedetected as soon as the critical dimension of the second matchstimulus had been processed:
pdet�sequential, similar, ti� � 1 � exp��qcritti�, (6)
in which all symbols have the same meaning as in Equation 5.(Note that ti now refers to the perceptual processing time for thesecond stimulus only.) As for the simultaneous matching task,the detection probability is translated into a response rate byEquation 4.
In modeling different trials, we again assumed that the stimulidiffered on a number of dimensions, estimated as �. The proba-bility that any difference between the match stimuli is detectedequals one minus the probability that no dimensions of the secondmatch stimulus have been processed in the interval ti:
pdet�sequential, different, ti� � 1 � �exp��qti��, (7)
in which the symbols have the same meaning as in Equation 5.Finally, we used the model to predict proportions of “old”
responses to similar and new test items in the recognition taskin Experiment 4. In modeling recognition, we relied only onFESTHER’s assumptions about feature sampling, without usingthe component of the model that translates total similarity tostudied items into choice probabilities. Instead, the recognitiontask was modeled entirely as an analog to the sequential matchingtask from Experiment 3. For test items that were similar to astudied item, we assumed that the probability of a correct “new”response was contingent on the detection of the difference betweenthe items. The probability of detecting the difference within timeinterval ti is given by
pdet�recognition, similar, ti� � 1 � exp���qcritti�. (8)
This equation is identical to Equation 6, with the exception ofthe rate scaling parameter �. This parameter reflects that therecognition task is sensitive not only to the perceptual processingrate of the critical stimulus dimension but also to the rate at which
the information about the critical dimension in memory becomesavailable. This particular model assumes that the total processingrate of the critical dimension (including its perceptual and retrievalcomponents) is proportional to the purely perceptual processingrate of the dimension, as measured by the matching tasks. Wejustify this assumption later, when we compare this model’s per-formance to that of models with different assumptions about thetime course of perception and retrieval. In any case, the best-fittingvalue of � provides information about the contribution of purelyperceptual processes to the time course of recognition.
The model for recognition of new items assumed that new itemsdiffered from studied items on all dimensions. This leads to thefollowing expression for the probability that any dimension of thetest stimulus has been processed in interval ti:
pdet�recognition, different, ti� � 1 � �exp���qti��. (9)
The detection probabilities in the recognition task were trans-lated into response proportions using Equation 4, in the same wayas the matching tasks. The only difference with the matching taskswas that a hit in recognition is defined here as a correct “new”response to a new or similar test item, whereas a false alarm wasdefined as a “new” response to an old item. (Note that thisdefinition differs from the conventional definition of hits and falsealarms in recognition tasks; see, e.g., Rotello & Heit, 1999.)
The data from Experiments 2–4 were modeled jointly, usingonly one set of six parameters. Three dimensional processing rateswere estimated: qcrit(fast) and qcrit(slow) were the processing ratesof the critical dimensions for fast–similar and slow–similar stimuli,respectively, and q was the (average) processing rate of the di-mensions of the stimuli from different pairs (in matching) or of thenew stimuli (in recognition). The fourth parameter was �, the ratescaling parameter which applied only to the recognition task. Thefifth parameter was the residual time, tres. Finally, � estimated thenumber of dimensions on which stimuli from different match pairsor new stimuli from recognition were compared. A maximum-likelihood criterion was used to determine the best-fitting param-eter values, assuming that response proportions in all tasks had ajoint binomial distribution. (See Lamberts, 1995, for a discussionof the likelihood function that was applied; see also Riefer &Batchelder, 1988.)
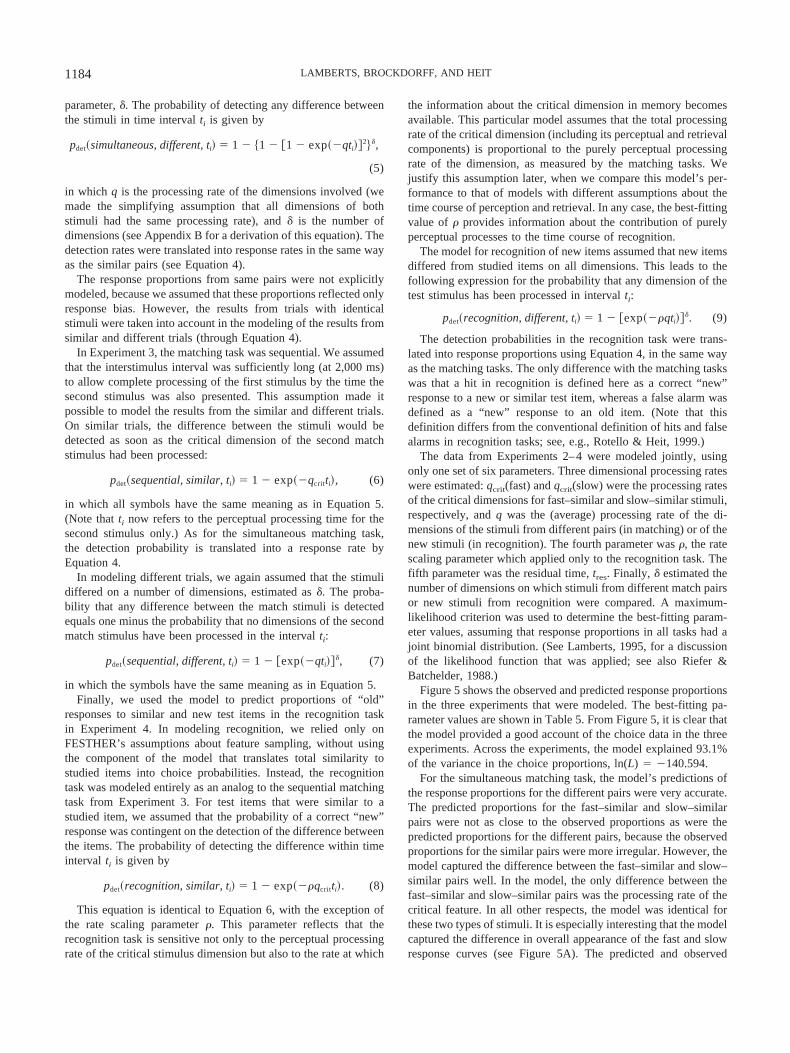
Figure 5 shows the observed and predicted response proportionsin the three experiments that were modeled. The best-fitting pa-rameter values are shown in Table 5. From Figure 5, it is clear thatthe model provided a good account of the choice data in the threeexperiments. Across the experiments, the model explained 93.1%of the variance in the choice proportions, ln(L) � �140.594.
For the simultaneous matching task, the model’s predictions ofthe response proportions for the different pairs were very accurate.The predicted proportions for the fast–similar and slow–similarpairs were not as close to the observed proportions as were thepredicted proportions for the different pairs, because the observedproportions for the similar pairs were more irregular. However, themodel captured the difference between the fast–similar and slow–similar pairs well. In the model, the only difference between thefast–similar and slow–similar pairs was the processing rate of thecritical feature. In all other respects, the model was identical forthese two types of stimuli. It is especially interesting that the modelcaptured the difference in overall appearance of the fast and slowresponse curves (see Figure 5A). The predicted and observed
1184 LAMBERTS, BROCKDORFF, AND HEIT
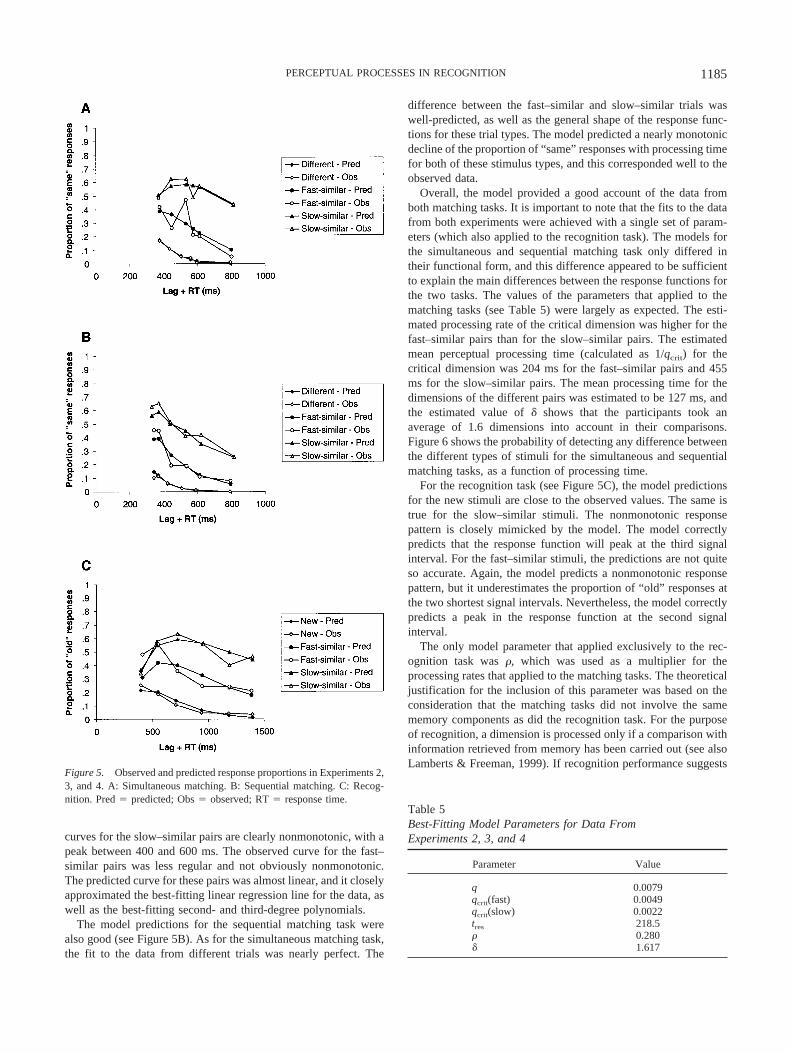
curves for the slow–similar pairs are clearly nonmonotonic, with apeak between 400 and 600 ms. The observed curve for the fast–similar pairs was less regular and not obviously nonmonotonic.The predicted curve for these pairs was almost linear, and it closelyapproximated the best-fitting linear regression line for the data, aswell as the best-fitting second- and third-degree polynomials.
The model predictions for the sequential matching task werealso good (see Figure 5B). As for the simultaneous matching task,the fit to the data from different trials was nearly perfect. The
difference between the fast–similar and slow–similar trials waswell-predicted, as well as the general shape of the response func-tions for these trial types. The model predicted a nearly monotonicdecline of the proportion of “same” responses with processing timefor both of these stimulus types, and this corresponded well to theobserved data.
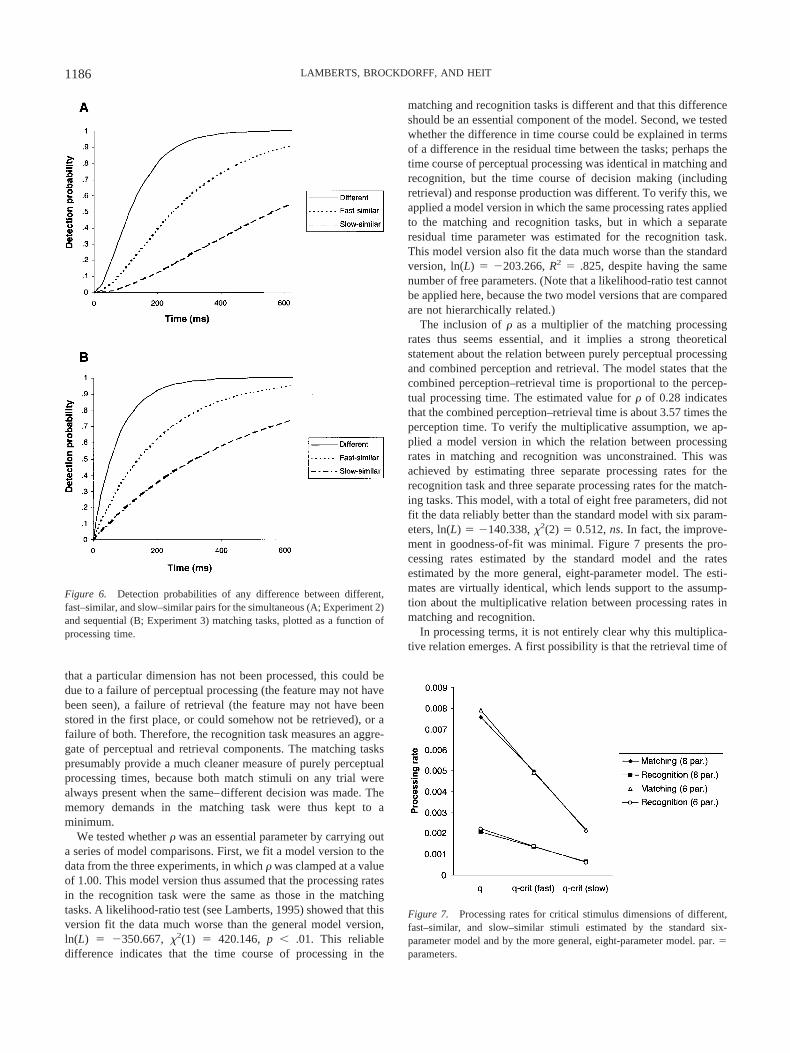
Overall, the model provided a good account of the data fromboth matching tasks. It is important to note that the fits to the datafrom both experiments were achieved with a single set of param-eters (which also applied to the recognition task). The models forthe simultaneous and sequential matching task only differed intheir functional form, and this difference appeared to be sufficientto explain the main differences between the response functions forthe two tasks. The values of the parameters that applied to thematching tasks (see Table 5) were largely as expected. The esti-mated processing rate of the critical dimension was higher for thefast–similar pairs than for the slow–similar pairs. The estimatedmean perceptual processing time (calculated as 1/qcrit) for thecritical dimension was 204 ms for the fast–similar pairs and 455ms for the slow–similar pairs. The mean processing time for thedimensions of the different pairs was estimated to be 127 ms, andthe estimated value of � shows that the participants took anaverage of 1.6 dimensions into account in their comparisons.Figure 6 shows the probability of detecting any difference betweenthe different types of stimuli for the simultaneous and sequentialmatching tasks, as a function of processing time.
For the recognition task (see Figure 5C), the model predictionsfor the new stimuli are close to the observed values. The same istrue for the slow–similar stimuli. The nonmonotonic responsepattern is closely mimicked by the model. The model correctlypredicts that the response function will peak at the third signalinterval. For the fast–similar stimuli, the predictions are not quiteso accurate. Again, the model predicts a nonmonotonic responsepattern, but it underestimates the proportion of “old” responses atthe two shortest signal intervals. Nevertheless, the model correctlypredicts a peak in the response function at the second signalinterval.
The only model parameter that applied exclusively to the rec-ognition task was �, which was used as a multiplier for theprocessing rates that applied to the matching tasks. The theoreticaljustification for the inclusion of this parameter was based on theconsideration that the matching tasks did not involve the samememory components as did the recognition task. For the purposeof recognition, a dimension is processed only if a comparison withinformation retrieved from memory has been carried out (see alsoLamberts & Freeman, 1999). If recognition performance suggests
Table 5Best-Fitting Model Parameters for Data FromExperiments 2, 3, and 4
Parameter Value
q 0.0079qcrit(fast) 0.0049qcrit(slow) 0.0022tres 218.5� 0.280� 1.617
Figure 5. Observed and predicted response proportions in Experiments 2,3, and 4. A: Simultaneous matching. B: Sequential matching. C: Recog-nition. Pred � predicted; Obs � observed; RT � response time.
1185PERCEPTUAL PROCESSES IN RECOGNITION
that a particular dimension has not been processed, this could bedue to a failure of perceptual processing (the feature may not havebeen seen), a failure of retrieval (the feature may not have beenstored in the first place, or could somehow not be retrieved), or afailure of both. Therefore, the recognition task measures an aggre-gate of perceptual and retrieval components. The matching taskspresumably provide a much cleaner measure of purely perceptualprocessing times, because both match stimuli on any trial werealways present when the same–different decision was made. Thememory demands in the matching task were thus kept to aminimum.
We tested whether � was an essential parameter by carrying outa series of model comparisons. First, we fit a model version to thedata from the three experiments, in which � was clamped at a valueof 1.00. This model version thus assumed that the processing ratesin the recognition task were the same as those in the matchingtasks. A likelihood-ratio test (see Lamberts, 1995) showed that thisversion fit the data much worse than the general model version,ln(L) � �350.667, �2(1) � 420.146, p � .01. This reliabledifference indicates that the time course of processing in the
matching and recognition tasks is different and that this differenceshould be an essential component of the model. Second, we testedwhether the difference in time course could be explained in termsof a difference in the residual time between the tasks; perhaps thetime course of perceptual processing was identical in matching andrecognition, but the time course of decision making (includingretrieval) and response production was different. To verify this, weapplied a model version in which the same processing rates appliedto the matching and recognition tasks, but in which a separateresidual time parameter was estimated for the recognition task.This model version also fit the data much worse than the standardversion, ln(L) � �203.266, R2 � .825, despite having the samenumber of free parameters. (Note that a likelihood-ratio test cannotbe applied here, because the two model versions that are comparedare not hierarchically related.)
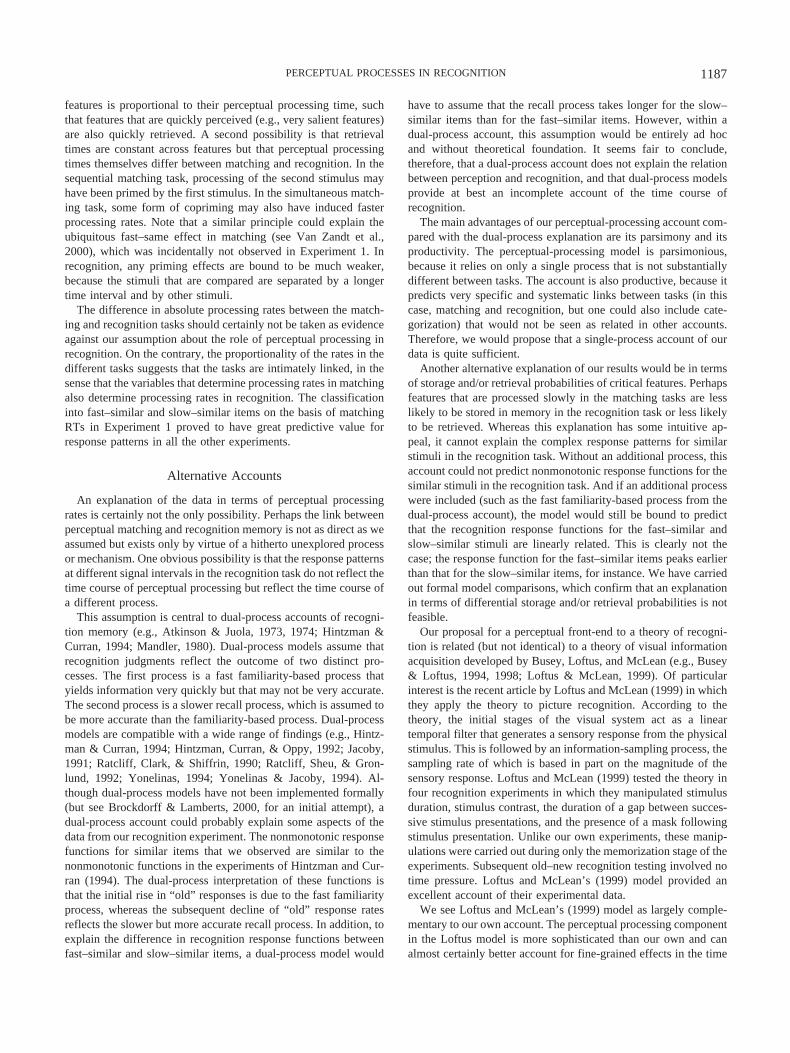
The inclusion of � as a multiplier of the matching processingrates thus seems essential, and it implies a strong theoreticalstatement about the relation between purely perceptual processingand combined perception and retrieval. The model states that thecombined perception–retrieval time is proportional to the percep-tual processing time. The estimated value for � of 0.28 indicatesthat the combined perception–retrieval time is about 3.57 times theperception time. To verify the multiplicative assumption, we ap-plied a model version in which the relation between processingrates in matching and recognition was unconstrained. This wasachieved by estimating three separate processing rates for therecognition task and three separate processing rates for the match-ing tasks. This model, with a total of eight free parameters, did notfit the data reliably better than the standard model with six param-eters, ln(L) � �140.338, �2(2) � 0.512, ns. In fact, the improve-ment in goodness-of-fit was minimal. Figure 7 presents the pro-cessing rates estimated by the standard model and the ratesestimated by the more general, eight-parameter model. The esti-mates are virtually identical, which lends support to the assump-tion about the multiplicative relation between processing rates inmatching and recognition.
In processing terms, it is not entirely clear why this multiplica-tive relation emerges. A first possibility is that the retrieval time of
Figure 7. Processing rates for critical stimulus dimensions of different,fast–similar, and slow–similar stimuli estimated by the standard six-parameter model and by the more general, eight-parameter model. par. �parameters.
Figure 6. Detection probabilities of any difference between different,fast–similar, and slow–similar pairs for the simultaneous (A; Experiment 2)and sequential (B; Experiment 3) matching tasks, plotted as a function ofprocessing time.
1186 LAMBERTS, BROCKDORFF, AND HEIT
features is proportional to their perceptual processing time, suchthat features that are quickly perceived (e.g., very salient features)are also quickly retrieved. A second possibility is that retrievaltimes are constant across features but that perceptual processingtimes themselves differ between matching and recognition. In thesequential matching task, processing of the second stimulus mayhave been primed by the first stimulus. In the simultaneous match-ing task, some form of copriming may also have induced fasterprocessing rates. Note that a similar principle could explain theubiquitous fast–same effect in matching (see Van Zandt et al.,2000), which was incidentally not observed in Experiment 1. Inrecognition, any priming effects are bound to be much weaker,because the stimuli that are compared are separated by a longertime interval and by other stimuli.
The difference in absolute processing rates between the match-ing and recognition tasks should certainly not be taken as evidenceagainst our assumption about the role of perceptual processing inrecognition. On the contrary, the proportionality of the rates in thedifferent tasks suggests that the tasks are intimately linked, in thesense that the variables that determine processing rates in matchingalso determine processing rates in recognition. The classificationinto fast–similar and slow–similar items on the basis of matchingRTs in Experiment 1 proved to have great predictive value forresponse patterns in all the other experiments.
Alternative Accounts
An explanation of the data in terms of perceptual processingrates is certainly not the only possibility. Perhaps the link betweenperceptual matching and recognition memory is not as direct as weassumed but exists only by virtue of a hitherto unexplored processor mechanism. One obvious possibility is that the response patternsat different signal intervals in the recognition task do not reflect thetime course of perceptual processing but reflect the time course ofa different process.
This assumption is central to dual-process accounts of recogni-tion memory (e.g., Atkinson & Juola, 1973, 1974; Hintzman &Curran, 1994; Mandler, 1980). Dual-process models assume thatrecognition judgments reflect the outcome of two distinct pro-cesses. The first process is a fast familiarity-based process thatyields information very quickly but that may not be very accurate.The second process is a slower recall process, which is assumed tobe more accurate than the familiarity-based process. Dual-processmodels are compatible with a wide range of findings (e.g., Hintz-man & Curran, 1994; Hintzman, Curran, & Oppy, 1992; Jacoby,1991; Ratcliff, Clark, & Shiffrin, 1990; Ratcliff, Sheu, & Gron-lund, 1992; Yonelinas, 1994; Yonelinas & Jacoby, 1994). Al-though dual-process models have not been implemented formally(but see Brockdorff & Lamberts, 2000, for an initial attempt), adual-process account could probably explain some aspects of thedata from our recognition experiment. The nonmonotonic responsefunctions for similar items that we observed are similar to thenonmonotonic functions in the experiments of Hintzman and Cur-ran (1994). The dual-process interpretation of these functions isthat the initial rise in “old” responses is due to the fast familiarityprocess, whereas the subsequent decline of “old” response ratesreflects the slower but more accurate recall process. In addition, toexplain the difference in recognition response functions betweenfast–similar and slow–similar items, a dual-process model would
have to assume that the recall process takes longer for the slow–similar items than for the fast–similar items. However, within adual-process account, this assumption would be entirely ad hocand without theoretical foundation. It seems fair to conclude,therefore, that a dual-process account does not explain the relationbetween perception and recognition, and that dual-process modelsprovide at best an incomplete account of the time course ofrecognition.
The main advantages of our perceptual-processing account com-pared with the dual-process explanation are its parsimony and itsproductivity. The perceptual-processing model is parsimonious,because it relies on only a single process that is not substantiallydifferent between tasks. The account is also productive, because itpredicts very specific and systematic links between tasks (in thiscase, matching and recognition, but one could also include cate-gorization) that would not be seen as related in other accounts.Therefore, we would propose that a single-process account of ourdata is quite sufficient.
Another alternative explanation of our results would be in termsof storage and/or retrieval probabilities of critical features. Perhapsfeatures that are processed slowly in the matching tasks are lesslikely to be stored in memory in the recognition task or less likelyto be retrieved. Whereas this explanation has some intuitive ap-peal, it cannot explain the complex response patterns for similarstimuli in the recognition task. Without an additional process, thisaccount could not predict nonmonotonic response functions for thesimilar stimuli in the recognition task. And if an additional processwere included (such as the fast familiarity-based process from thedual-process account), the model would still be bound to predictthat the recognition response functions for the fast–similar andslow–similar stimuli are linearly related. This is clearly not thecase; the response function for the fast–similar items peaks earlierthan that for the slow–similar items, for instance. We have carriedout formal model comparisons, which confirm that an explanationin terms of differential storage and/or retrieval probabilities is notfeasible.
Our proposal for a perceptual front-end to a theory of recogni-tion is related (but not identical) to a theory of visual informationacquisition developed by Busey, Loftus, and McLean (e.g., Busey& Loftus, 1994, 1998; Loftus & McLean, 1999). Of particularinterest is the recent article by Loftus and McLean (1999) in whichthey apply the theory to picture recognition. According to thetheory, the initial stages of the visual system act as a lineartemporal filter that generates a sensory response from the physicalstimulus. This is followed by an information-sampling process, thesampling rate of which is based in part on the magnitude of thesensory response. Loftus and McLean (1999) tested the theory infour recognition experiments in which they manipulated stimulusduration, stimulus contrast, the duration of a gap between succes-sive stimulus presentations, and the presence of a mask followingstimulus presentation. Unlike our own experiments, these manip-ulations were carried out during only the memorization stage of theexperiments. Subsequent old–new recognition testing involved notime pressure. Loftus and McLean’s (1999) model provided anexcellent account of their experimental data.
We see Loftus and McLean’s (1999) model as largely comple-mentary to our own account. The perceptual processing componentin the Loftus model is more sophisticated than our own and canalmost certainly better account for fine-grained effects in the time
1187PERCEPTUAL PROCESSES IN RECOGNITION
course of perception. However, FESTHER contains a more elab-orate decision and performance component, which is necessary toexplain many of the results that we have reported previously (seeBrockdorff & Lamberts, 2000). Therefore, a promising avenue forfuture research would be to integrate the perceptual assumptions ofLoftus et al.’s theory into FESTHER.
The fact remains, however, that FESTHER in its current formdoes not specify the nature of perceptual processing in recognitionin great detail. This relative lack of specificity is inevitable, givenour limited understanding of the time course of information accu-mulation in the perception of complex visual stimuli. The model’sassumption that perception involves stochastic accumulation ofinformation about stimulus features is a very general one, which iscompatible with a wide range of possible specific processes. Forinstance, the model can accommodate psychophysical evidence fortemporal asynchrony in visual perception, which shows that dif-ferent attributes of visual stimuli are consciously perceived atdifferent times after stimulus onset (e.g., Zeki & Bartels, 1998).When participants are asked to pair two rapidly alternating statesof two attributes, such as color and orientation of a line, they makeconsistent binding errors. Using this technique, it has been shownthat color is perceived about 30 or 40 ms before orientation, whichin turn is perceived faster than motion (Moutoussis & Zeki, 1997).These asynchronies have been attributed to the functional organi-zation of the visual system, with different visual attributes beingprocessed in different brain regions (Moutoussis & Zeki, 1997).However, little is known about asynchronies in the processing ofmore complex visual properties in complex visual stimuli. Thedata we reported in this article, together with the findings fromprevious experiments (e.g., Lamberts & Freeman, 1999), suggestthat these asynchronies typically involve larger timescales thanthose for simple visual properties.
Finally, we would like to discuss some of FESTHER’s specificprocessing assumptions and consider alternatives to these assump-tions. First is the assumption concerning the exponential distribu-tion of feature sampling times. The model-fitting results fromExperiments 2–4 suggest that this distribution is appropriate; theexponential model predicts response functions that have the cor-rect shape for the data. Although it is possible that other distribu-tions could also provide good fits, the exponential distribution hasmany advantages. It has been used successfully in other models ofinformation accumulation in perception and decision making (seeTownsend & Ashby, 1983). Lamberts (2000) has shown thatexponential processing functions can provide the basis not only forthe correct prediction of choice proportions and mean RTs incategorization but also for the prediction of RT distributions andlatency–accuracy functions. Lamberts and Freeman (1999) explic-itly compared an exponential-distribution model of the time courseof feature sampling in categorization with an alternative model inwhich processing probabilities of features were required only toincrease monotonically over time. Despite the latter model’sgreater flexibility and larger number of free parameters, it pro-duced only a negligible increase in goodness-of-fit compared withthe standard exponential model. Therefore, we believe that theassumption about exponential distribution of processing times isreasonable and that it is unlikely that an alternative distributionwould yield significantly better model fits.
The second model assumption concerns the stochastic indepen-dence of the sampling processes for different features. In previous
research on feature sampling in object perception, the assumptionof sampling independence has often been supported (e.g., Lam-berts & Freeman, 1999; Townsend, Hu, & Ashby, 1981; Wand-macher, 1976; Wandmacher, Kammerer, & Glowalla, 1980), al-though there have also been reports indicating that samplingindependence does not hold universally (e.g., Townsend & Ashby,1982; Townsend, Hu, & Evans, 1984). The data from the currentexperiments did not allow us to test the independence assumption(see Lamberts & Freeman, 1999, for a description of the method-ology of such a test). The independence assumption can be testedby comparing the goodness-of-fit of models that make the assump-tion with models that do not make the assumption. Such a com-parison requires a data set in which stimuli contain differentcombinations of features (as in a factorial design), which cannot beachieved with the realistically complex stimulus materials that weused in the current experiments. We do not see this as an importantshortcoming, however. The critical result of our experiments,which concerns the systematic relation between the time course ofperception and the time course of recognition, could also havebeen predicted from a model in which feature sampling was notindependent. In any case, an independence model is simpler thana model that allows for dependencies in feature sampling (seeLamberts & Freeman, 1999), and the fact that the independencemodel that we applied provided a good account of the data sug-gests that little could be gained from exploring models that aban-don the independence assumption.
Conclusions
The experiments in this article and the modeling results lead tothe following conclusions. First, there is a systematic empiricalrelation between the time course of perceptual matching and thetime course of recognition judgments. Stimuli that are comparedrapidly are also recognized more accurately when processing timeis limited. Second, this relation between the two tasks can beunderstood in terms of the processing rates of the stimulus dimen-sions. The model applications confirm that our assumptions aboutfeature sampling are sufficient to explain the results from all theexperiments. An important assumption in the modeling was thatprocessing rates in recognition are proportional to those inmatching.
Our results have general implications for process models ofrecognition. They indicate that the time course of perceptual pro-cessing could be an important element of an account of the timecourse of recognition. Stimuli that have the same logical status(such as the similar stimuli in our recognition experiment) can stillproduce very different response patterns, depending on howquickly their features are processed. This implies that processmodels of recognition can be complete only if they include someform of analysis of the perceptual structure of the stimuli.
References
Atkinson, R. C., & Juola, J. F. (1973). Factors influencing speed andaccuracy of word recognition. In S. Kornblum (Ed.), Attention andperformance IV (pp. 583–612). New York: Academic Press.
Atkinson, R. C., & Juola, J. F. (1974). Search and decision processes inrecognition memory. In D. H. Krantz, R. C. Atkinson, R. D. Luce, & P.Suppes (Eds.), Contemporary developments in mathematical psychol-
1188 LAMBERTS, BROCKDORFF, AND HEIT
ogy: Vol. 1. Learning, memory and thinking (pp. 243–293). San Fran-cisco, CA: Freeman.
Brockdorff, N., & Lamberts, K. (2000). A feature-sampling account of thetime course of old–new recognition judgments. Journal of ExperimentalPsychology: Learning, Memory, and Cognition, 26, 77–102.
Bundesen, C. (1990). A theory of visual attention. Psychological Review,97, 523–547.
Busey, T. A., & Loftus, G. R. (1994). Sensory and cognitive componentsof visual information acquisition. Psychological Review, 101, 446–469.
Busey, T. A., & Loftus, G. R. (1998). Binocular information acquisitionand visual memory. Journal of Experimental Psychology: Human Per-ception and Performance, 24, 1188–1214.
Cohen, A. L., & Nosofsky, R. M. (2000). An exemplar-retrieval model ofspeeded same–different judgments. Journal of Experimental Psychol-ogy: Human Perception and Performance, 26, 1549–1569.
Dosher, B. A., & Rosedale, G. (1991). Judgments of semantic and episodicrelatedness: Common time-course and failure of segregation. Journal ofMemory and Language, 30, 125–160.
Estes, W. K. (1994). Classification and cognition. New York: OxfordUniversity Press.
Gronlund, S. D., & Ratcliff, R. (1989). Time course of item and associativeinformation: Implications for global memory models. Journal of Exper-imental Psychology: Learning, Memory, and Cognition, 15, 846–858.
Hintzman, D. L., & Curran, T. (1994). Retrieval dynamics of recognitionand frequency judgments: Evidence for separate processes of familiarityand recall. Journal of Memory and Language, 33, 1–18.
Hintzman, D. L., Curran, T., & Oppy, B. (1992). Effects of similarity andrepetition on memory: Registration without learning? Journal of Exper-imental Psychology: Learning, Memory, and Cognition, 18, 667–680.
Jacoby, L. L. (1991). A process dissociation framework: Separating auto-matic from intentional uses of memory. Journal of Memory and Lan-guage, 30, 513–541.
Kirk, R. E. (1995). Experimental design: Procedures for the behavioralsciences. Pacific Grove, CA: Brooks/Cole.
Lamberts, K. (1995). Categorization under time pressure. Journal of Ex-perimental Psychology: General, 124, 161–180.
Lamberts, K. (1998). The time course of categorization. Journal of Exper-imental Psychology: Learning, Memory, and Cognition, 24, 695–711.
Lamberts, K. (2000). Information-accumulation theory of speeded catego-rization. Psychological Review, 107, 227–260.
Lamberts, K. (2002). Feature sampling in categorization and recognition ofobjects. Quarterly Journal of Experimental Psychology: Human Exper-imental Psychology, 55(A), 141–154.
Lamberts, K., & Brockdorff, N. (1997). Fast categorization of stimuli withmulti-valued dimensions. Memory & Cognition, 25, 296–304.
Lamberts, K., & Freeman, R. P. J. (1999). Building object representationsfrom parts: Tests of a stochastic sampling model. Journal of Experimen-tal Psychology: Human Perception and Performance, 25, 904–926.
Loftus, G. R., & McLean, J. E. (1999). A front end to a theory of picturerecognition. Psychonomic Bulletin & Review, 6, 394–411.
Macmillan, N. A., & Creelman, C. D. (1990). Response bias: Character-istics of detection theory, threshold theory, and “nonparametric” in-dexes. Psychological Bulletin, 107, 401–413.
Macmillan, N. A., & Kaplan, H. L. (1985). Detection theory analysis ofgroup data: Estimating sensitivity from average hit and false-alarm rates.Psychological Bulletin, 98, 185–199.
Mandler, G. (1980). Recognizing: The judgment of previous occurrence.Psychological Review, 87, 252–271.
Moutoussis, K., & Zeki, S. (1997). Functional segregation and temporalhierarchy of the visual perceptive systems. Proceedings of the RoyalSociety of London, Series B, 264, 1407–1414.
Nosofsky, R. M. (1986). Attention, similarity, and the identification–categorization relationship. Journal of Experimental Psychology: Gen-eral, 115, 39–57.
Nosofsky, R. M. (1988). Exemplar-based accounts of relations betweenclassification, recognition, and typicality. Journal of Experimental Psy-chology: Learning, Memory, and Cognition, 14, 700–708.
Nosofsky, R. M. (1991). Tests of an exemplar model for relating perceptualclassification and recognition memory. Journal of Experimental Psy-chology: Human Perception and Performance, 17, 3–27.
Ratcliff, R. (1978). A theory of memory retrieval. Psychological Review,85, 59–108.
Ratcliff, R. (1981). A theory of order relations in perceptual matching.Psychological Review, 88, 552–572.
Ratcliff, R., Clark, S. E., & Shiffrin, R. M. (1990). List-strength effect: I.Data and discussion. Journal of Experimental Psychology: Learning,Memory, and Cognition, 16, 163–178.
Ratcliff, R., Sheu, C.-F., & Gronlund, S. D. (1992). Testing global memorymodels using ROC curves. Psychological Review, 99, 518–535.
Riefer, D. M., & Batchelder, W. H. (1988). Multinomial modeling and themeasurement of cognitive processes. Psychological Review, 95, 318–339.
Rotello, C. M., & Heit, E. (1999). Two-process models of recognitionmemory: Evidence for recall-to-reject? Journal of Memory and Lan-guage, 40, 432–453.
Townsend, J. T., & Ashby, F. G. (1982). Experimental test of contempo-rary mathematical models of visual letter recognition. Journal of Exper-imental Psychology: Human Perception and Performance, 8, 834–864.
Townsend, J. T., & Ashby, F. G. (1983). Stochastic modeling of elementarypsychological processes. Cambridge, England: Cambridge UniversityPress.
Townsend, J. T., Hu, G. G., & Ashby, F. G. (1981). Perceptual samplingof orthogonal straight line features. Psychological Research, 43, 259–275.
Townsend, J. T., Hu, G. G., & Evans, R. J. (1984). Modeling featureperception in brief displays with evidence for positive interdependen-cies. Perception & Psychophysics, 36, 35–49.
Van Zandt, T, Colonius, H., & Proctor, R. W. (2000). A comparison of tworesponse time models applied to perceptual matching. PsychonomicBulletin & Review, 7, 208–256.
Wandmacher, J. (1976). Multicomponent theory of perception: Featureextraction and response decision in visual identification. PsychologicalResearch, 39, 17–37.
Wandmacher, J., Kammerer, E.-M., & Glowalla, U. (1980). Context de-pendence in visual feature processing. Psychological Research, 42,335–351.
Yonelinas, A. P. (1994). Receiver-operating characteristics in recognitionmemory: Evidence for a dual-process model. Journal of ExperimentalPsychology: Learning, Memory, and Cognition, 20, 1341–1354.
Yonelinas, A. P., & Jacoby, L. L. (1994). Dissociations of processes inrecognition memory: Effects of interference and of response speed.Canadian Journal of Experimental Psychology, 48, 516–534.
Zeki, S., & Bartels, A. (1998). The asynchrony of consciousness. Proceed-ings of the Royal Society of London, Series B, 265, 1583–1585.
(Appendixes follow)
1189PERCEPTUAL PROCESSES IN RECOGNITION
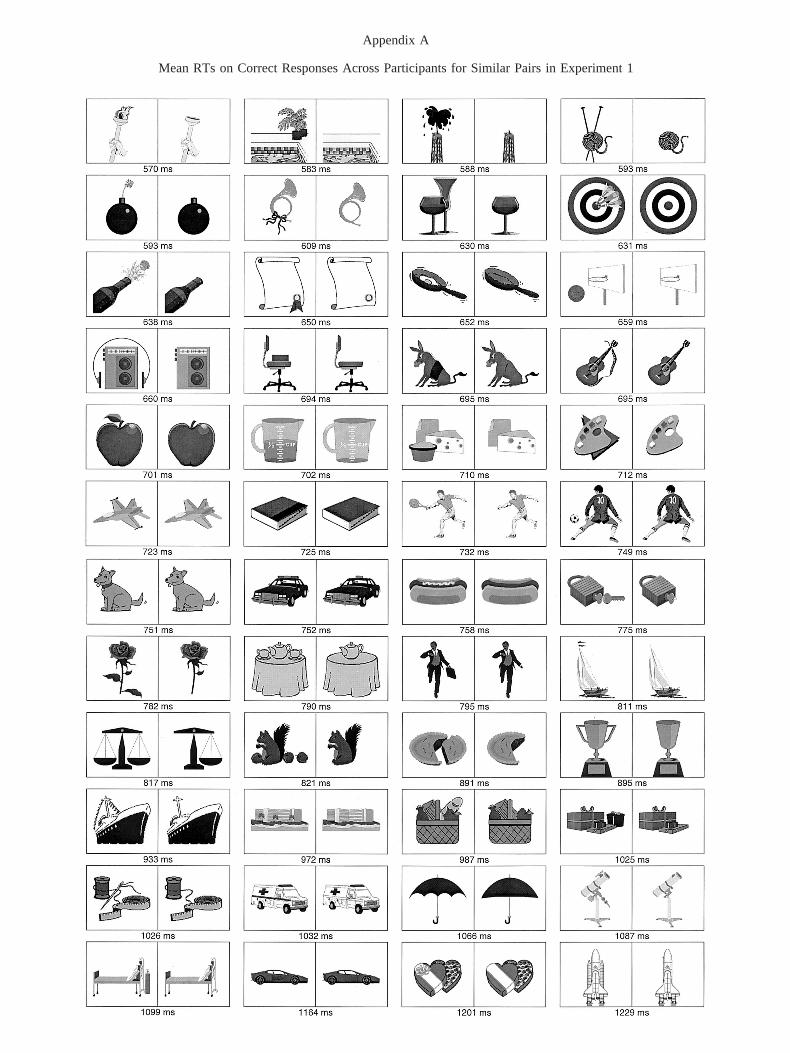
Appendix A
Mean RTs on Correct Responses Across Participants for Similar Pairs in Experiment 1
Appendix B
Derivation of Probability of Detection of Any DifferenceBetween Two Simultaneously Presented Stimuli
The probability that dimension x has been processed in Stimulus Awithin time interval ti is given by an exponential distribution function:
p�x processed, A� � 1 � exp��qxti�.
Given that the probability of dimension x having been processed inStimulus A is independent of dimension x having been processed inStimulus B, the probability that x has been processed in both A and B isgiven by
p�x processed, A and B) � [1 � exp(�qxti�]2.
It is assumed that if any difference exists between two stimuli on adimension x, then the difference will be detected if dimension x has beenprocessed in both stimuli. It follows that the probability that no differenceis detected on dimension x on both stimuli is
1 � p�x processed, A and B� � 1 � �1 � exp��qxti�2.
If it is assumed that the processing rates for all � dimensions are equaland independent, it follows that the probability that no difference isdetected between two simultaneously presented different stimuli in timeinterval ti is
pnot det�simultaneous, different, ti� � �1 � �1 � exp��qti�2��.
From the above, it follows that the probability that any differencebetween two simultaneously presented stimuli has been detected in time tiis given by
pdet�simultaneous, different, ti� � 1 � pnot det�simultaneous, different, ti�
� 1 � �1 � �1 � exp��qti�2��.
Received March 19, 2001Revision received January 18, 2002
Accepted February 19, 2002 �
1191PERCEPTUAL PROCESSES IN RECOGNITION