Embed Size (px)
Citation preview

UNIVERSITY OF NAIROBIDEPARTMENT OF CIVIL AND CONSTRUCTION ENGINEERING
PERFOMANCE ANALYSIS OF NAIROBI EASTERN BYPASS
Nairobi Eastern Bypass Capacity and Level of Service Study
BY
MAMBO EDWIN KIMANI
Reg. No. F16/36416/2010
A project submitted as a partial fulfillment of the requirement for theaward of the degree of
BACHELOR OF SCIENCE IN CIVIL & CONSTRUCTION ENGINEERING
2015

PERFOMANCE ANALYSIS OF EASTERN BYPASS 2015
PERFOMANCE ANALYSIS OF NAIROBI EASTERN BYPASSA CAPACITY AND LEVEL OF SERVICE ANALYSIS OF NAIROBI EASTERN BYPASS
Page i

PERFOMANCE ANALYSIS OF EASTERN BYPASS 2015
DEDICATIONI dedicate this project to:
My parents, Mr. and Mrs. Benedict Mambo. Through their sacrifice and effort I was able to get this far.
Dr. Mary W. Kimani for the kindness of her heart and her sacrifice in seeing me through school.
Martin and Joyce Kimani for their prayer and support in my academic journey. My siblings, friends and classmates who have been with me throughout my academic
journey.
Page ii

PERFOMANCE ANALYSIS OF EASTERN BYPASS 2015
ACKNOWLEDGEMENTSMy greatest gratitude goes to the Almighty God for the strength and provision that enabled me to complete this study.
I express my grateful appreciation to my supervisor, Eng. G.P.K Matheri, and Lecturer at The University of Nairobi , Department of Civil and Construction Engineering, who played an important role in guiding me and giving me invaluable advice on the study during its inception and development.
I also wish to thank all my classmates who assisted me in the collection of data.
Thank you all.
Mambo Edwin Kimani
April 2015
Page iii

PERFOMANCE ANALYSIS OF EASTERN BYPASS 2015
ABSTRACTThe continued increase in the number of motor vehicles in Kenya has led to great congestion on our roads, especially in the capital city Nairobi. The number of cars accessing Nairobi streets is rising by the day and this has led to major traffic snarl ups, as well as an increased number of accidents. These congestions are especially common on the highway comprising of Mombasa road, Uhuru Highway and Waiyaki Way, which is the main highway going through the city of Nairobi. Vehicles with no business in the Central Business District have for a long time been forced to use Uhuru Highway for lack of an alternative route. The congestion led to Kenya National Highways Authority designing and constructing alternate routes for such vehicles. Thus the inception, construction and operation of the three main bypasses around Nairobi, which are the Eastern, Northern, and Southern Bypasses.
The Nairobi Eastern Bypass project is a project that was started back in January 2011 and completed in May 2012. This section of the bypass starts from Mombasa road at the Cabanas interchange, passes through Pipeline and then Utawala and goes over Kangundo Road. The Eastern Bypass then proceeds all the way to the recently constructed Thika Super Highway. The total length of this section of road is 39km. The Nairobi Eastern bypass is an Asphalt Concrete pavement and is classified as a class B road. The Nairobi Eastern bypass is a two lane, two way single carriageway that is 9 m wide and has an open channel earth surface drain on either side. The Eastern Bypass was constructed to help ease the traffic congestion along Mombasa Road, through Uhuru Highway and into Waiyaki Way. For the purpose of this study, the stretch from Thika Superhighway to the Kangundo Road junction will be considered.
The performance evaluation established the capacity of the road and traffic flow being handled by the road in vehicles per hour. The study also determined the level of service of the road. In order to achieve the above parameters, a field data collection and analysis was done. The findings of the study have been properly outlined in chapter 4, 5 and 6 of this report. The objectives, which were to determine the operational capacity and level of service of the Nairobi Eastern Bypass, were met. In chapter 7 of this report, a number of recommendations have been forwarded based on the findings. Should these recommendations be implemented, then the problem of congestion on the road may be solved.
Page iv
PERFOMANCE ANALYSIS OF EASTERN BYPASS 2015
Table of Contents1. INTRODUCTION...................................................................................................................................1
1.1 GENERALINTRODUCTION...........................................................................................................1
1.2 BACKGROUND TO ROAD TRANSPORTATION IN KENYA.....................................................1
1.3 STUDY AREA..................................................................................................................................1
1.4 PROBLEM STATEMENT..............................................................................................................3
1.5 OBJECTIVES AND SCOPE OF STUDY.........................................................................................4
1.6 METHOD OF STUDY....................................................................................................................4
2. CHAPTER TWO: LITERATURE REVIEW..........................................................................................5
2.1. INTRODUCTION............................................................................................................................5
2.1.1. TWO LANE HIGHWAYS........................................................................................................5
2.2 DEFINITION OF TERMS................................................................................................................6
2.2.1. Flow, Speed, Density Relationship............................................................................................7
2.2.2. LEVEL OF SERVICE (LOS) FOR AN URBAN SINGLE CARIAGEWAY HIGHWAY:......8
2.3 FACTORS AFFECTING CAPACITY AND LOS..........................................................................10
2.3.1. Base Conditions......................................................................................................................10
2.3.2. Roadway Conditions...............................................................................................................10
2.3.3 Traffic Conditions....................................................................................................................11
2.3.4 Control Conditions....................................................................................................................11
2.3.5 Technology..............................................................................................................................11
2.4 ROAD CLASSIFICATION IN KENYA.........................................................................................11
2.4.1. Existing Road Classification System in an Urban Context......................................................11
2.4.2. Review of Kenyan Road Classification System by Kenya Roads Board................................13
2.5 CLASSIFICATION OF TWO-LANE HIGHWAYS (HCM 2000).................................................14
2.6 LITERATTURE BACKGROUND ON STUDY AREA.................................................................15
2.8 THEORETICAL BACKGROUND.................................................................................................16
2.8.1 Average Annual Daily Traffic (AADT)....................................................................................16
2.8.2 Average Daily Traffic (ADT)...................................................................................................16
2.8.3 Peak Hour Volume (PHV).......................................................................................................16
2.8.4 Vehicle Classification (VC).....................................................................................................17
2.8.5 Vehicle Miles of Travel (VMT)................................................................................................17
Page v

PERFOMANCE ANALYSIS OF EASTERN BYPASS 2015
2.9 CAPACITY.....................................................................................................................................17
2.10 TRAFFIC VOLUME COUNT......................................................................................................17
3.1.1 Manual Count Method..............................................................................................................18
2.10 DETERMINATION OF LEVEL OF SERVICE FOR A TWO LANE TWO WAY HIGHWAY. 19
2.10.1 TWO WAY TWO LANE SEGMENTS.................................................................................20
2.10.2 Determining LOS....................................................................................................................30
3. DATA COLLECTION.........................................................................................................................31
3.1 TRAFFIC VOLUME COUNT........................................................................................................31
3.2 SPEED COUNT..............................................................................................................................32
4. RESULTS AND ANALYSIS...............................................................................................................34
4.1 RESULTS........................................................................................................................................34
4.1.1 TRAFFIC COUNT RESULTS.................................................................................................34
4.1.2 SPEED COUNT RESULTS.....................................................................................................43
4.2 ANALYSIS.....................................................................................................................................44
4.3 DETERMINING LEVEL OF SERVICE OF THE ROAD..............................................................50
4.3.1 Determining free flow speed....................................................................................................50
4.3.2 Determining Demand Flow Rate.............................................................................................52
4.3.3 Determining The Average Travel Speed...................................................................................53
4.3.4 Determining Percent Time Spent Following.............................................................................54
4.3.5 Determining Level Of Service.................................................................................................54
5. DISCUSSION.......................................................................................................................................56
5.1 DISCUSSION ON TRAFFIC FLOW RESULTS............................................................................56
5.1.1 MORNING TRAFFIC..............................................................................................................56
5.1.2 EVENING TRAFFIC...............................................................................................................57
5.1.3 MID DAY TRAFFIC................................................................................................................58
5.1.4 OFF PEAK TRAFFIC.............................................................................................................58
5.2 DISCUSSION ON SPEED-FLOW RESULTS...............................................................................59
6. CONCLUSION.....................................................................................................................................60
6.1 CAPACITY AND LEVEL OF SERVICE.......................................................................................60
7. RECOMMENDATIONS.......................................................................................................................61
7.1 IMPROVING THE INFRASTRUCTURE......................................................................................61
Page vi
PERFOMANCE ANALYSIS OF EASTERN BYPASS 2015
7.2 TRAFFIC MANAGEMENT...........................................................................................................62
8. LIST OF REFERENCES.......................................................................................................................63
9. APPENDICES.......................................................................................................................................63
Page vii

PERFOMANCE ANALYSIS OF EASTERN BYPASS 2015
LIST OF TABLESTable 2.1: Pcu for different types of vehicle………………………………………………….. 7
Table 2.2: Road classification in an urban context …………….............................................. 12
Table 2.3: Functional road classification …………………………………………………….. 12
Table 2.4: Summary of current road classification in km in Kenya …………………………. 13
Table 2.5: LOS criteria for two lane highways in class 1 …………………………………... 21
Table 2.6: Grade adjustment factor (fg) to determine speeds on two-way
and directional segments …………………………………………………..…….. 24
Table 2.7: Grade adjustment factor (fg) to determine percent time-spent-following
on two-way and directional segments ……………………………………….….. 24
Table 2.8: Passenger-car equivalents for trucks and RVs to determine speeds of
two-way and directional segments ………………………………………………. 25
Table 2.9: Passenger-car equivalents for trucks and RVs to determine percent
time-spent-following on two-way and directional segments ……………………… 25
Table 2.10: Adjustment (fnp) for effect of no-passing zones on average travel
speed on two-way segments …………………………………………………… 28
Table 2.11: Adjustment (fd/np) for combined effect of directional distribution
of traffic and percentage of no-passing zones on percent
time-spent-following on two-way segments ………………………………….. 29
Table 4.1: Traffic volume counts headed to Kangundo Road …………………………… 34
Table 4.2: Traffic Volume Counts headed to Thika Road ……………………………… 35
Table 4.3: Corrected PCU Values for the traffic count headed to Kangundo Road …….. 37
Table 4.4: Corrected PCU Values for the traffic count headed to Thika Road ………… 38
Table 4.5: Average 15 minute traffic headed to Kangundo Road ………………………. 39
Table 4.6: Average 15 minute traffic headed to Thika Road ……………………………. 40
Page viii
PERFOMANCE ANALYSIS OF EASTERN BYPASS 2015
Table 4.7: Average Hourly Traffic Headed to Kangundo Road ………………………… 42
Table 4.8: Hourly Traffic counts headed to Thika Road ……………………………….. 42
Table 4.9: Directional Split ……………………………………………………………… 43
Table 4.10: Speed Counts for both directions …………………………………………………..… 43
Table 4.11: Proportion of Trucks and RVs headed to Kangundo Road …………………… 51
Table 4.12: Proportion of Trucks and RVs headed to Thika Road ……………………….. 51
Page ix

PERFOMANCE ANALYSIS OF EASTERN BYPASS 2015
LIST OF FIGURESFigure 1.1: General view of Nairobi roads …………………………………………….… 2
Figure 1.2: Aerial view of Study Area…………………………………………………… 2
Figure 1.3: Photo of Km 1+800 from the Thika Superhighway Junction ……………… 3
Figure 2.1: Figure showing level of service in relation to the operating
speeds and the volume/capacity ratio…………………………………..… 8
Figure 2.2: Methodology for determining the capacity and LOS of a two
lane highway……………………………………………………………… 20
Figure 2.3: Graphical representation of los criteria for two lane highways in
class 1 …………………………………………………………………….. 21
Figure 4.1 : Graph of Number of Different Types of Vehicles headed to
Kangundo Road …………………………………………….…………… 44
Figure 4.2: Graph of Numbers of Different Types of Vehicles Headed
to Thika Road …………………………………………………………… 45
Figure 4.3: Graph Of Average 15 Min Traffic Approaching from Thika Road
and Exiting to Kangundo Road ………………………………………… 46
Figure 4.4: Graph Of Average 15 Min Traffic Approaching from Kangundo
Road and Exiting to Thika Road ……………………………………….…. 47
Figure 4.5: Graph Of Average Hourly Traffic Approaching from Thika
Road and Exiting to Kangundo Road ……………………………………. 48
Figure 4.6: Graph Of Average Hourly Traffic Approaching from Kangundo
Road and Exiting to Thika Road ………………………………………….. 49
Figure 4.7: Pie Chart Showing Directional Split Between The Two Directions ………. 50
Figure 4.8: Figure Showing The level of service of the Road ………………………….. 55
Page x
PERFOMANCE ANALYSIS OF EASTERN BYPASS 2015
Page xi
PERFOMANCE ANALYSIS OF EASTERN BYPASS 2015
1. INTRODUCTION
1.1 GENERALINTRODUCTION
Transportation is concerned with the efficient and safe movement of people and goods from one point to another. It is the core means in which any thriving community can achieve development. It is therefore important for any civilization to integrate its transportation plans in its overall economic plans and make development of transportation infrastructure part of its overall development objectives. These objectives should be both in the long term as well as the short term. In the long term, they are called Strategic Transportation Planning. These long term plans involve a lot of complex procedures, rigorous studies as well as major financial requirements for their budgets. On the other hand, short term plans are called Transportation System Management (TSM)
As engineers are carrying out the initial design for the various transportation facilities in an area, not only should they consider solving a particular problem at hand, but it is also important for them to consider the current and future expected demand for the facilities they are designing. However, the future demand for these designed facilities sometimes exceeds what the engineers had projected. This leads to overcrowding of these facilities, leading to a strain not only to the users, but to the facilities as well. This happens when there is a sudden growth in population which leads to a higher number of goods.
1.2 BACKGROUND TO ROAD TRANSPORTATION IN KENYARoad transport is the predominant mode of transport and carries about 93% of all cargo and passenger traffic in Kenya.
The Kenya Roads Board has established Kenya's road network to be 160,886 km long. About 61,936km of these roads are classified according to the while the remaining 98,950km are not classified.
Responsibility for the management of the road network falls under the Ministry of Transport and Infrastructure and implemented through Kenya National Highways Authority (KeNHA), Kenya Rural Roads Authority (KeRRA), Kenya Urban Roads Authority (KURA) and Kenya Wildlife Service (KWS). The Eastern Bypass falls under the management of the Kenya National Highways Authority. (KRB1)
1.3 STUDY AREA The study area is the Nairobi Eastern By-Pass. The section of concern is from Thika Superhighway to the junction of Kangundo Road. The section has a total distance of 13.75
Page 1

PERFOMANCE ANALYSIS OF EASTERN BYPASS 2015
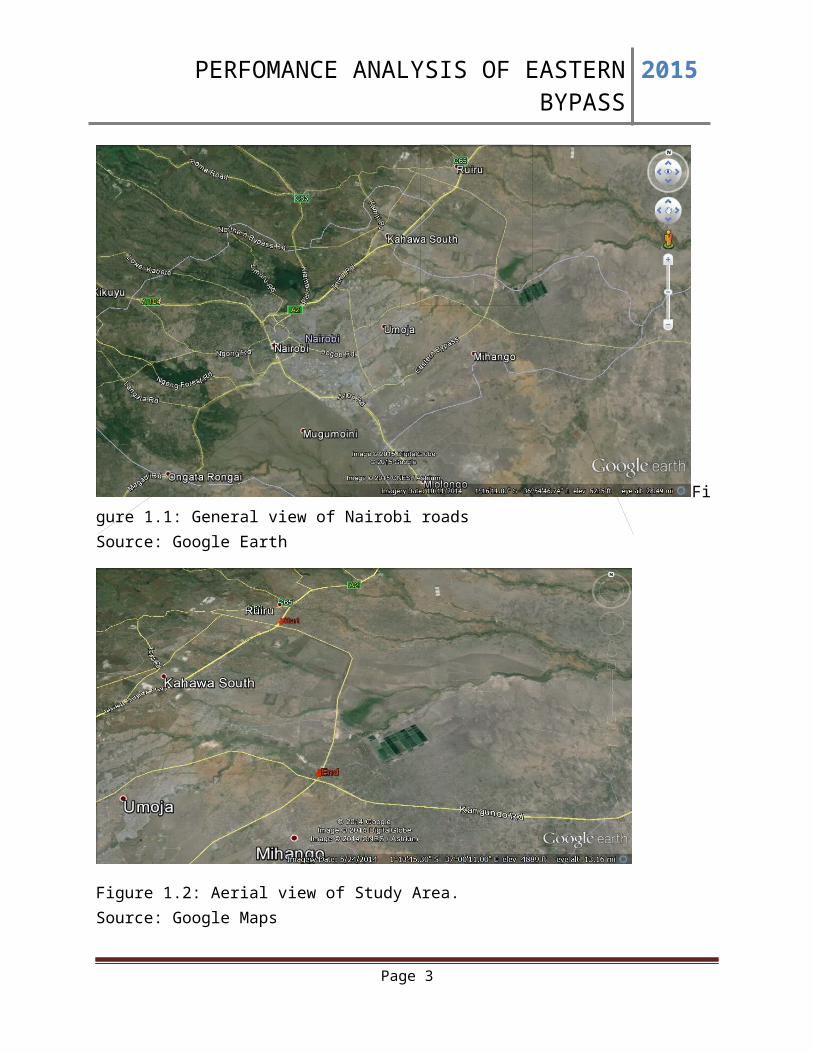
kilometers. The Eastern Bypass is an urban highway situated on the Eastern side of the Capital City of Kenya; Nairobi.
Figure 1.1: General view of Nairobi roads Source: Google Earth
Figure 1.2: Aerial view of Study Area. Source: Google Maps
Page 2
PERFOMANCE ANALYSIS OF EASTERN BYPASS 2015
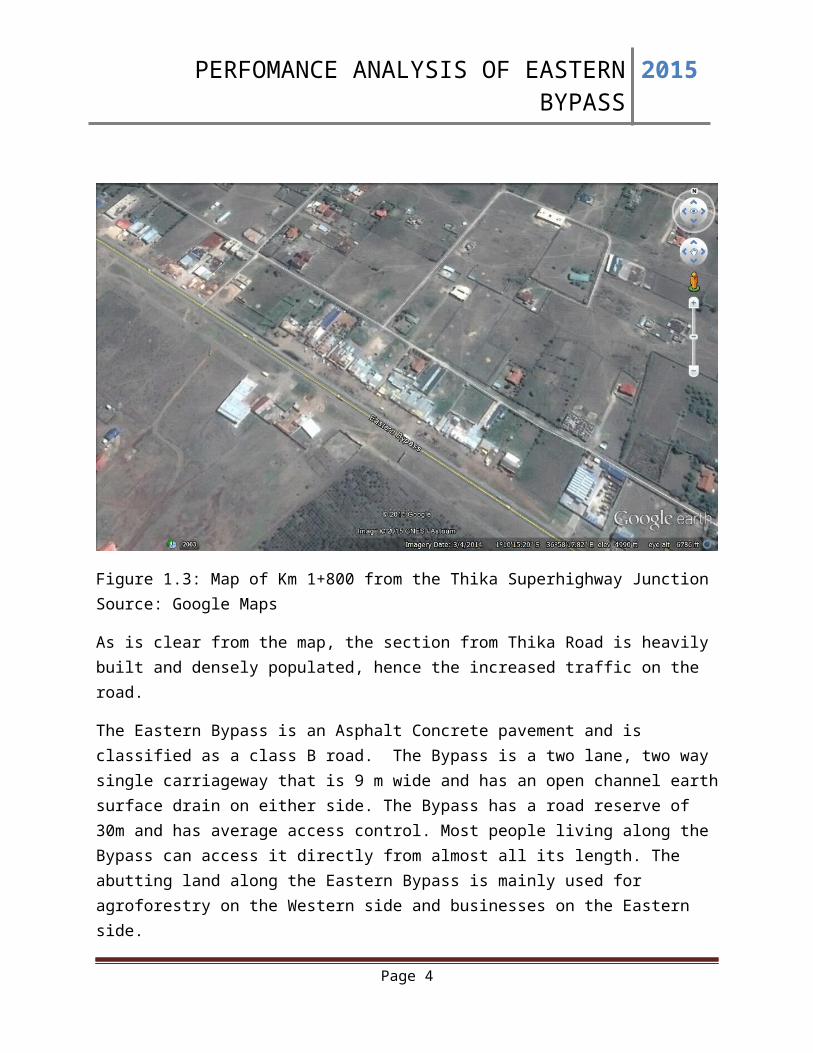
Figure 1.3: Map of Km 1+800 from the Thika Superhighway Junction Source: Google Maps
As is clear from the map, the section from Thika Road is heavily built and densely populated, hence the increased traffic on the road.
The Eastern Bypass is an Asphalt Concrete pavement and is classified as a class B road. The Bypass is a two lane, two way single carriageway that is 9 m wide and has an open channel earth surface drain on either side. The Bypass has a road reserve of 30m and has average access control. Most people living along the Bypass can access it directly from almost all its length. The abutting land along the Eastern Bypass is mainly used for agroforestry on the Western side and businesses on the Eastern side.
1.4 PROBLEM STATEMENTThe Nairobi Eastern Bypass is currently faced with the problem of vehicular traffic congestion which has led to long traffic queues. This has been contributed to by a number of factors which comprise all vehicle classes. Such factors include the slow moving lorries and fourteen seater public service vehicles (matatus) using the Bypass. Four seater personal vehicles and Sports Utility Vehicles have also increased in numbers on the roads. These long queues and shockwaves have led to a great reduction in the performance of the Eastern Bypass. This study will determine if the capacity has overshot 3400 pc/h (design capacity for a two lane two way highway in both directions)
Page 3
PERFOMANCE ANALYSIS OF EASTERN BYPASS 2015
1.5 OBJECTIVES AND SCOPE OF STUDYThis study aims at determining the operational capacity of Eastern Bypass, as well as determining its operational level of service.
To achieve the above objectives, the scope of this study will entail: field traffic data collection, traffic volume analysis and level of service analysis.
1.6 METHOD OF STUDYThe Highway Capacity Manual outlines appropriate procedures for the determination of the traffic capacity of a road. The process involves carrying out a field traffic count. This collected data is then analyzed by a procedure laid out on the Highway Capacity Manual. It is then used to determine the capacity.
The Highway Capacity Manual outlines that a speed count should be carried out and this used with the operational capacity to determine the Level of Service.
In light of this, field data collection on capacity and speed was carried out. This entailed conducting traffic counts as well as a speed survey. A literature review on the subject of capacity was also done. A review of previous studies on the road was also done. After all the studies were finished, an analysis of the collected data was also carried out.
Page 4

PERFOMANCE ANALYSIS OF EASTERN BYPASS 2015
2. CHAPTER TWO: LITERATURE REVIEW
2.1. INTRODUCTION
2.1.1. TWO LANE HIGHWAYS
Two-lane highways are a key element in the highway systems of most countries. They perform a variety of functions, are located in all geographic areas, and serve a wide range of traffic. Any consideration of operating quality must account for these disparate functions.(HCM2010)
Traffic operations on two-lane, two-way highways differ from those on other uninterrupted-flow facilities. Lane changing and passing are possible only in the face of oncoming traffic in the opposing lane. Passing demand increases rapidly as traffic volumes increase, and passing capacity in the opposing lane declines as volumes increase.(HCM2010)
Therefore, on two-lane highways, unlike other types of uninterrupted-flow facilities, normal traffic flow in one direction influences flow in the other direction. Motorists must adjust their travel speeds as volume increases and the ability to pass declines.(HCM2010)
Efficient mobility is the principal function of major two-lane highways that connect major traffic generators or that serve as primary links in state and national highway networks. These routes tend to serve long-distance commercial and recreational travelers, and long sections may pass through rural areas without traffic-control interruptions. Consistent high-speed operations and infrequent passing delays are desirable for these facilities.(HCM2010)
Other paved, two-lane rural highways serve for accessibility. They provide all-weather access to an area, often for relatively low traffic volumes. Cost-effective access is the dominant consideration. Although beneficial, high speed is not the principal concern. Delay—as indicated by the formation of platoons—is more relevant as a measure of service quality.(HCM2010)
Two-lane roads also serve scenic and recreational areas in which the vista and environment are meant to be experienced and enjoyed without traffic interruption or delay. A safe roadway is desired, but high-speed operation is neither expected nor desired. For these reasons, there are two performance measures to describe service quality for two-lane highways: percent time-spent-following and average travel speed.(HCM2010)
Percent time-spent-following represents the freedom to maneuver and the comfort and convenience of travel. It is the average percentage of travel time that vehicles must travel in platoons behind slower vehicles due to the inability to pass. Percent-time-spent-following is difficult to measure in the field. However, the percentage of vehicles traveling with headways of less than 3sec at a representative location can be used as a surrogate measure. (HCM2000)
Page 5
PERFOMANCE ANALYSIS OF EASTERN BYPASS 2015
Average travel speed reflects the mobility on a two-lane highway: it is the length of the highway segment divided by the average travel time of all vehicles traversing the segment in both directions during a designated interval.(HCM2010)
LOS criteria use both these performance measures. On major two-lane highways, for which efficient mobility is paramount, both percent time-spent-following and average travel speed define LOS. However, roadway alignments with reduced design speeds will limit the LOS that can be achieved. On highways for which accessibility is paramount and mobility less critical, LOS is defined only in terms of percent time-spent-following, without consideration of average travel speed.(HCM2010)
2.2 DEFINITION OF TERMSFlow (Q): This is the number of vehicles accessing a given part of the road per unit time. This is mainly measured in vehicles per hour. Traffic flow can be divided into two main types: interrupted flow and uninterrupted flow. Uninterrupted flow occurs when vehicles traversing a length of roadway are not required to stop by any cause external to the traffic stream, such as traffic control devices. It is most common in highways or interstates where there is limited access. Interrupted flow occurs when flow is periodically interrupted by external means mainly traffic signs and signals. It is common in urban centers and roads with unlimited access control. (Myer Kutz,2004)
Density (K): This refers to the number of vehicles on a given length of roadway or lane. It is determined in terms of vehicles per mile or per kilometer. It is a very difficult parameter to obtain and is mainly done by aerial photography. This makes it very expensive to obtain.
Speed (V): Myer Kutz(2004) defines speed as the distance a vehicle travels per unit time. It is the inverse of the time taken by a vehicle to traverse a given distance. In a highway, most vehicles will be traveling at different speeds. In quantifying traffic stream, the average speed is important. The average speed is found by averaging the individual speeds of all the vehicles in the study area.Speed is determined from the distance covered by a vehicle in unit time, or for a number of observations, the mean is computed from the distribution of speeds and is known as the time mean speed and if from the mean of the space distribution of speeds, it is known as the space mean speed. (Ashford and Wright, 2007)
Kadiyali,1997 outlines the three principal classifications of speed as follows:
i. Spot Speed: Is the instantaneous speed of a vehicle at a specified point along a road.
ii. Journey speed: Is the effective speed of a vehicle on a trip between two points.iii. Running speed: Is the average speed over a trip when the vehicle is moving.
According to Kadiyali,1997, there are three basic approaches that may be used to collect speed data. These are:
Page 6

PERFOMANCE ANALYSIS OF EASTERN BYPASS 2015
Measuring the travel time of a vehicle between two detectors or observers separated by a known fixed distance.Measuring time taken by a vehicle to cross an induction loop set at a road section.Measuring speed directly on the basis of the Doppler principle, i.e. using a radar speed meter, better known as a speed gun.
2.2.1. Flow, Speed, Density Relationship. These three parameters are the fundamentals for measuring the operation performance and level of service of a transportation facility such as a highway. Under uninterrupted conditions, flow, density and speed are related by the following equation
Flow = Density × Speed
Q = K × V Equation 1.
Capacity: According to Myer Kutz(2004), capacity is defined as a measure of the demand that a highway can potentially service. The Highway Capacity Manual (2010) defines capacity as “the maximum hourly rate at which persons or vehicles can be reasonably expected to traverse a point or uniform segment of a lane or roadway during a given time period, under prevailing roadway, traffic and roadway conditions”.(HCM 2010)
Demand: This is the principle measure of the amount of traffic using a given facility (HCM 2010)
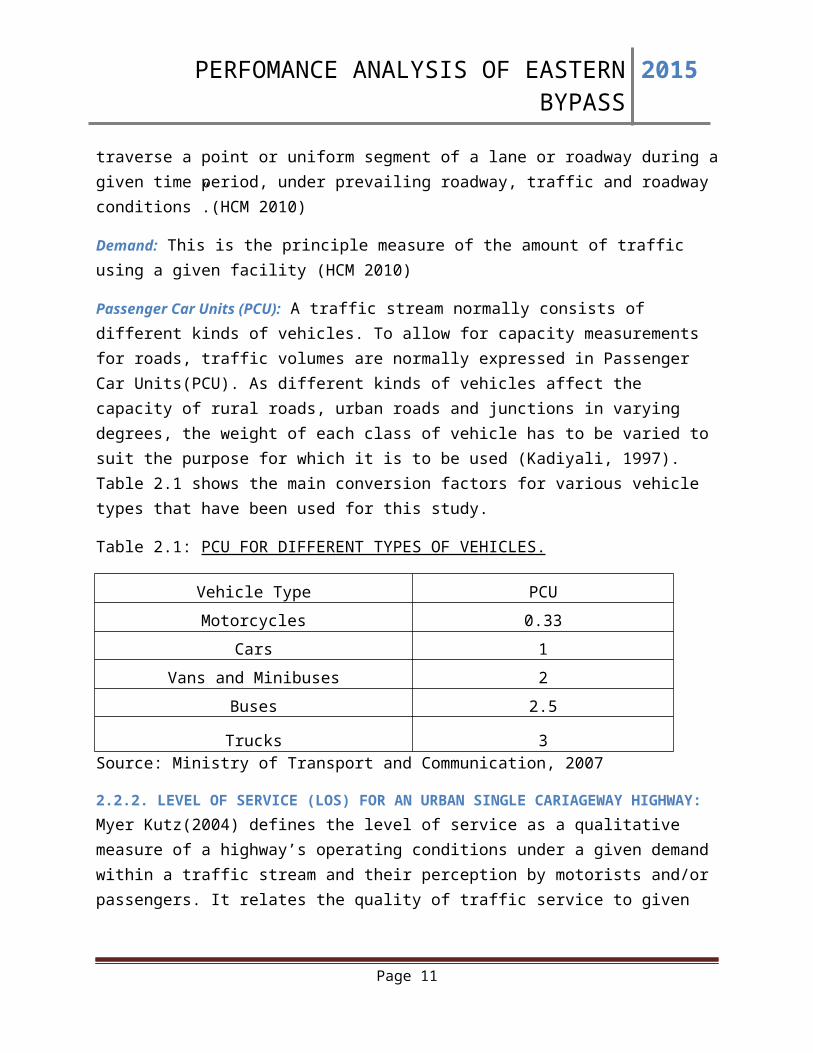
Passenger Car Units (PCU): A traffic stream normally consists of different kinds of vehicles. To allow for capacity measurements for roads, traffic volumes are normally expressed in Passenger Car Units(PCU). As different kinds of vehicles affect the capacity of rural roads, urban roads and junctions in varying degrees, the weight of each class of vehicle has to be varied to suit the purpose for which it is to be used (Kadiyali, 1997). Table 2.1 shows the main conversion factors for various vehicle types that have been used for this study.
Table 2.1: PCU FOR DIFFERENT TYPES OF VEHICLES.
Vehicle Type PCU
Motorcycles 0.33
Cars 1
Vans and Minibuses 2
Buses 2.5
Trucks 3Source: Ministry of Transport and Communication, 2007
Page 7
PERFOMANCE ANALYSIS OF EASTERN BYPASS 2015
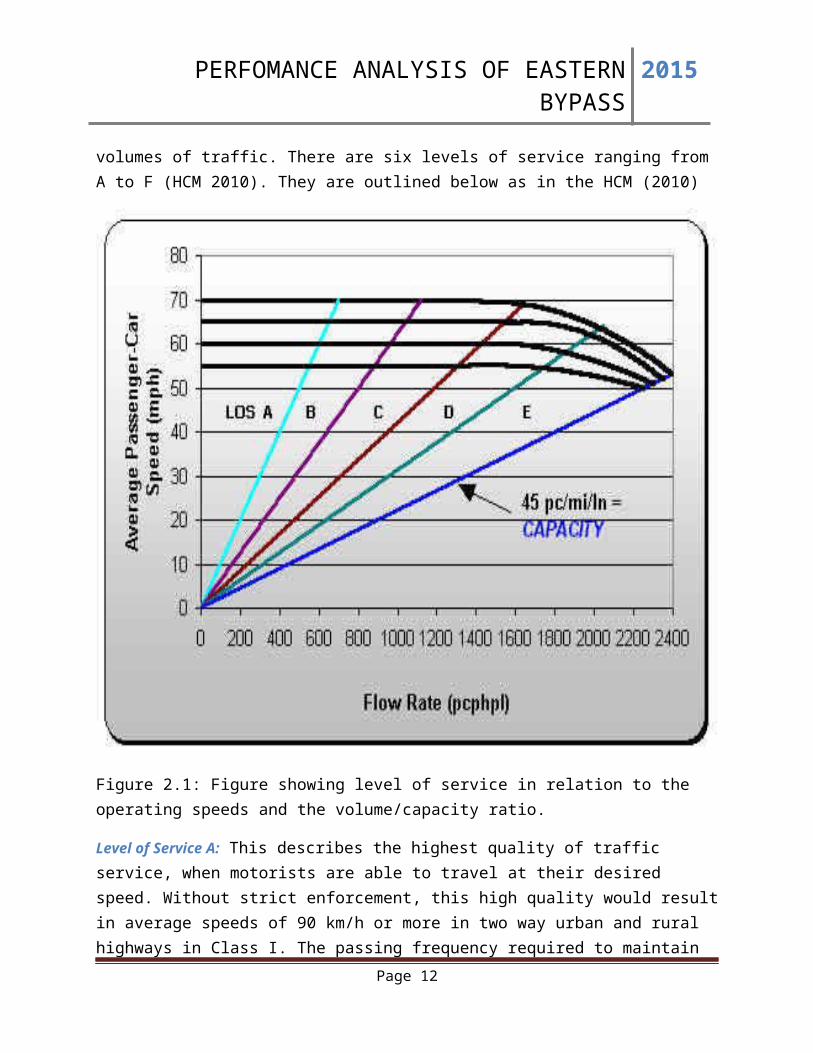
2.2.2. LEVEL OF SERVICE (LOS) FOR AN URBAN SINGLE CARIAGEWAY HIGHWAY: Myer Kutz(2004) defines the level of service as a qualitative measure of a highway’s operating conditions under a given demand within a traffic stream and their perception by motorists and/or passengers. It relates the quality of traffic service to given volumes of traffic. There are six levels of service ranging from A to F (HCM 2010). They are outlined below as in the HCM (2010)
Figure 2.1: Figure showing level of service in relation to the operating speeds and the volume/capacity ratio.
Level of Service A: This describes the highest quality of traffic service, when motorists are able to travel at their desired speed. Without strict enforcement, this high quality would result in average speeds of 90 km/h or more in two way urban and rural highways in Class I. The passing frequency required to maintain these speeds has not reached a demanding level, so that passing demand is well below passing capacity, and platoons of three or more vehicles are rare. Drivers
Page 8
PERFOMANCE ANALYSIS OF EASTERN BYPASS 2015
are delayed no more than 35% of their travel time by slow moving vehicles. A maximum flow rate of 490 pc/h total in both directions may be achieved with base conditions. On Class II highways, speeds may fall below 90 km/h but motorists will not be delayed more than 40% of their travel time in platoons.
Level of Service B: This characterizes traffic flow with speeds of 80 km/h or slightly higher on level terrain Class I highways. The desire for passing to maintain desired speeds becomes significant and approximates the passing capacity at the lower boundary of the Los B. Drivers are delayed in platoons up to 50% of the time. Service flow rates of 780 pc/h total in both directions can be achieved under base conditions. Above this flow rate, the number of platoons increases dramatically. On Class II highways, speeds may fall below 80 km/h, but motorists will not be delayed in platoons for more than 55% of their travel time.
Level of Service C: Describes further increases in flow, resulting in noticeable increases in platoon formation, platoon size and frequency of passing impediments. The average speed still exceeds 70 km/h on level terrain Class I highways, even though unrestricted passing demand exceeds passing capacity. At higher volumes, the chaining of platoons and significant reductions in passing capacity occur. Although traffic flow is stable, it is susceptible to congestion due to turning traffic and slow moving vehicles. Percent time spent following may reach 65%. A service flow rate of up to 1190 pc/h total in both directions can be accommodated under base conditions. On Class II highways, speeds may fall below 70 km/h, but motorists will not be delayed in platoons for more than 70% of their travel time.
Level of Service D: Describes unstable traffic flow. The two opposing traffic streams begin to operate separately at higher volume levels, as passing becomes extremely difficult. Passing demand is high, but passing capacity approaches zero. Mean platoon sizes of 5 to 10 vehicles are common, although speeds of 60 km/h still can be maintained under base conditions on Class I highways. The proportion of no passing zones along the roadway section usually has little influence on passing. Turning vehicles and roadside distractions cause major shock waves in the traffic stream. Motorists are delayed in platoons for nearly 80% of their travel time. Maximum service flow rates of 1830 pc/h total in both directions can be maintained under base conditions. On Class II highways, speeds may fall below 60 km/h but in no case will motorists be delayed in platoons for more than 85% of their travel time.
Level of Service E: Traffic flow conditions have a percent time-spent-following greater than 80% on Class I highways and greater than 85% on Class II. Even under base conditions, speeds may drop below 60 km/h. Average travel speeds on highways with less than base conditions will slower, even down to 40 km/h on sustained upgrades. Passing is virtually impossible at LOS E, and platooning becomes intense, as slower vehicles or other interruptions are encountered. The highest volume attainable under LOS E defines the capacity of the highway, generally 3,200 pc/h total in both directions. Operating conditions at capacity are unstable and difficult to predict.
Page 9

PERFOMANCE ANALYSIS OF EASTERN BYPASS 2015
Traffic operations seldom reach near capacity on rural highways, primarily because of lack of demand.
Level of Service F: Represents heavily congested flow with traffic demand exceeding capacity. Volumes are lower than capacity and speeds are highly variable.
2.3 FACTORS AFFECTING CAPACITY AND LOSThe Highway Capacity Manual (HCM2010) outlines the following as the factors that affect the capacity and Level of service of a two way two lane single carriageway.
2.3.1. Base ConditionsBase conditions assume good weather, good pavement conditions, users familiar with the facility, and no impediments to traffic flow. Base conditions for uninterrupted-flow facilities
include the following
Lane widths of 3.6m, Clearance of 1.8m between the edge of the travel lanes and the nearest obstructions or
objects at the roadside and in the median, Free-flow speed of 100km/h for multilane highways, Only passenger cars in the traffic stream (no heavy vehicles), Level terrain, No no-passing zones on two-lane highways, and No impediments to through traffic due to traffic control or turning vehicles.
2.3.2. Roadway ConditionsRoadway conditions include geometric and other elements. In some cases, these influence the capacity of a road; in others, they can affect a performance measure such as speed, but not the capacity or maximum flow rate of the facility. Roadway factors include the following:
Number of lanes, The type of facility and its development environment, Lane widths, Shoulder widths and lateral clearances, Design speed, Horizontal and vertical alignments, and Availability of exclusive turn lanes at intersections
The horizontal and vertical alignment of a highway depends on the design speed and the topography of the land on which it is constructed. In general, the severity of the terrain reduces capacity and service flow rates. This is significant for two-lane rural highways, such as the case study in this report where the severity of terrain not only can affect the operating capabilities of individual vehicles in the traffic stream, but also can restrict opportunities for passing slow-moving vehicles.
Page 10
PERFOMANCE ANALYSIS OF EASTERN BYPASS 2015
2.3.3 Traffic ConditionsTraffic conditions that influence capacities and service levels include:
Vehicle Type: The entry of heavy vehicles into the traffic stream affects the number of vehicles that can be served. Heavy vehicles adversely affect traffic in two ways:
They are larger than passenger cars and occupy more roadway space; and They have poorer operating capabilities than passenger cars, particularly with respect to
acceleration, deceleration, and the ability to maintain speed on upgrades.
Directional and Lane Distribution: Directional distribution has a dramatic impact on two-lane rural highway operation, which achieves optimal conditions when the amount of traffic is about the same in each direction.
2.3.4 Control ConditionsFor interrupted-flow facilities, the control of the time for movement of specific traffic flows is critical to capacity, service flow rates, and level of service. The most critical type of control is the traffic signal. The type of control in use, signal phasing, allocation of green time, cycle length, and the relationship with adjacent control measures affect operations.
2.3.5 TechnologyEmerging transportation technologies, also known as intelligent transportation systems (ITS), will enhance the safety and efficiency of vehicles and roadway systems. ITS includes any technology that allows drivers and traffic control system operators to gather and use real-time information to improve vehicle navigation, roadway system control, or both.
2.4 ROAD CLASSIFICATION IN KENYA
2.4.1. Existing Road Classification System in an Urban ContextThe complete functional classification system has been developed around the hierarchy of movements: main movement, transition, distribution, collection, access and termination. It is shown in Table 2.2. The two main shortcomings of the functional classification system in an urban environment are that it does not consider other modes of transportation and does not consider roadway functions outside of access and mobility. With respect to the lack of consideration of other road users, it is arguable that the hierarchy of movements on which the functional classification system is based is equally applicable to walking, cycling, public transit and the private motor vehicle. However, the facilities that would serve “main movement” for a motor vehicle are significantly different than the facilities serving the “main movement” for pedestrians. Generally speaking, the movement of motor vehicle traffic requires a smooth, direct and uninterrupted route and little in the way of amenities. In fact, clear zones at the side of the road are preferable for safety and convenience. The movement of pedestrian traffic is influenced much more by “comfort.”
Page 11

PERFOMANCE ANALYSIS OF EASTERN BYPASS 2015
Table 2.2: ROAD CLASSIFICATION IN AN URBAN CONTEXT
Classification
Characteristics
Principal Arterial
Serves major centers of activity with the highest traffic volumes and longest trip lengths. Integrated internally and between major rural connections. Service to abutting lands is subordinate to travel service to major movements. Design types are interstate, other freeways and other principal arterials
Minor arterial
Trips of moderate length at a lower level of mobility than principal arterials. Some emphasis on land access. May carry local bus routes and provide intracommunity continuity but does not penetrate neighborhoods.
Collector Provides both land access and traffic circulation within all areas. Penetrates neighborhoods and communities collecting and distributing traffic between neighborhoods and the arterial streets.
Local Primarily permits direct land access and connections to the higher order streets. Lowest level of mobility. Through traffic is usually deliberately discouraged.
Source: Forbes G.
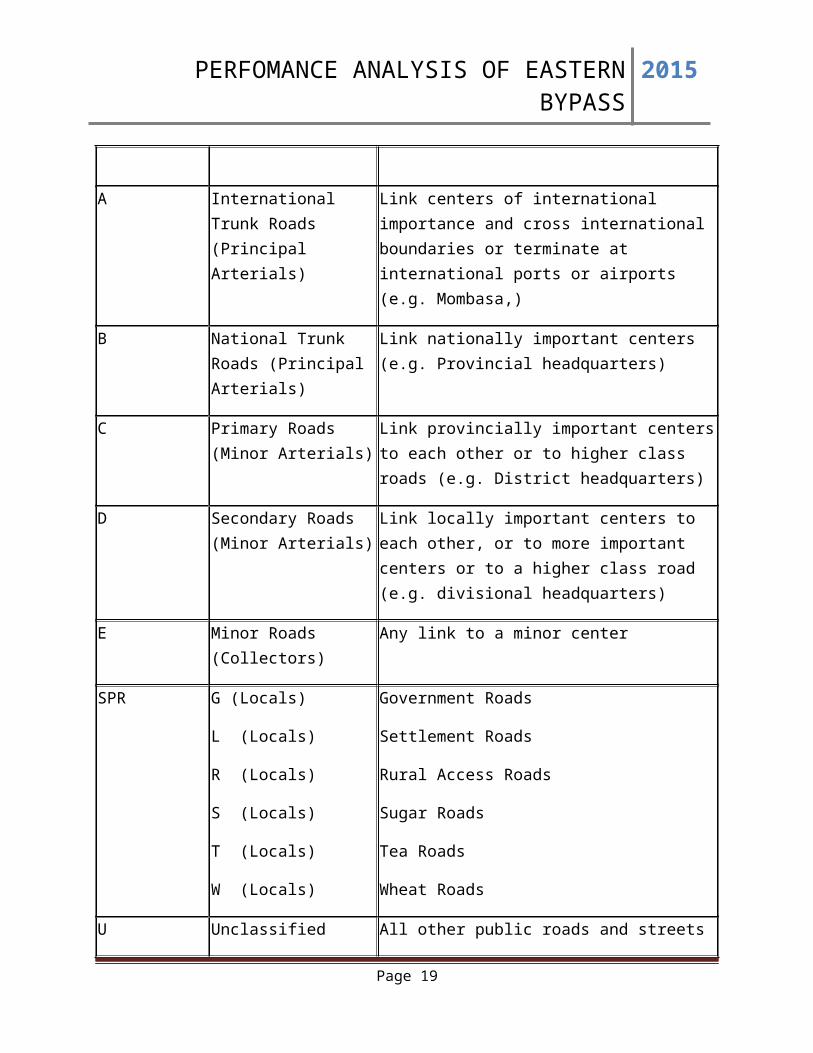
According to Kenya Roads Board, The Current Road Classification System in Kenya was developed over 30 years ago and has six road classes named from Classes A to E and a Special Purpose Road class. Each class is defined by the functional criteria related to administrative level of centers the roads connect.
Table 2.3: FUNCTIONAL ROAD CLASSIFICATION IN KENYA
CLASS DESCRIPTION FUNCTION
A International Trunk Roads (Principal Arterials)
Link centers of international importance and cross international boundaries or terminate at international ports or airports (e.g. Mombasa,)
B National Trunk Roads (Principal Arterials)
Link nationally important centers (e.g. Provincial headquarters)
C Primary Roads (Minor Arterials)
Link provincially important centers to each other or to higher class roads (e.g. District headquarters)
D Secondary Roads (Minor Arterials)
Link locally important centers to each other, or to more important centers or to a higher class road (e.g. divisional headquarters)
E Minor Roads (Collectors) Any link to a minor center
SPR G (Locals) Government Roads
Page 12
PERFOMANCE ANALYSIS OF EASTERN BYPASS 2015
L (Locals)
R (Locals)
S (Locals)
T (Locals)
W (Locals)
Settlement Roads
Rural Access Roads
Sugar Roads
Tea Roads
Wheat Roads
U Unclassified All other public roads and streets
Source: Kenya Roads Board
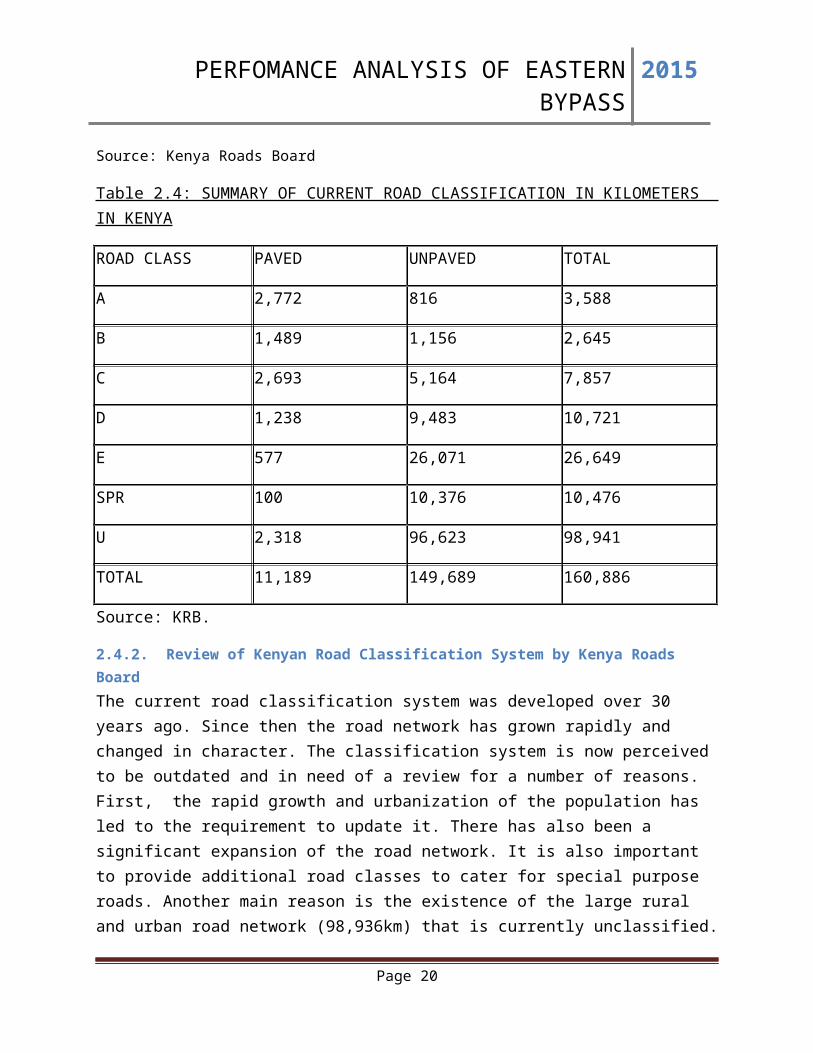
Table 2.4: SUMMARY OF CURRENT ROAD CLASSIFICATION IN KILOMETERS IN KENYA
ROAD CLASS PAVED UNPAVED TOTAL
A 2,772 816 3,588
B 1,489 1,156 2,645
C 2,693 5,164 7,857
D 1,238 9,483 10,721
E 577 26,071 26,649
SPR 100 10,376 10,476
U 2,318 96,623 98,941
TOTAL 11,189 149,689 160,886
Source: KRB.
2.4.2. Review of Kenyan Road Classification System by Kenya Roads BoardThe current road classification system was developed over 30 years ago. Since then the road network has grown rapidly and changed in character. The classification system is now perceived to be outdated and in need of a review for a number of reasons. First, the rapid growth and urbanization of the population has led to the requirement to update it. There has also been a significant expansion of the road network. It is also important to provide additional road classes to cater for special purpose roads. Another main reason is the existence of the large rural and urban road network (98,936km) that is currently unclassified. The successive changes in administration boundaries, affecting the validity of the original functional classification in terms
Page 13
PERFOMANCE ANALYSIS OF EASTERN BYPASS 2015
of administrative centers, notably at district level is also a reason for the revision of this classification. The current classification has some anomalies in class assignment, whereby some higher classes of roads have significantly lower standards or lower traffic volume than some lower classes of roads. The criteria used for the classification are relatively broad and subjective.
The present system is seen to be static and unable to adjust to changing circumstances. Rational planning and allocation of scarce funds to the road system is now perceived to require a more objective and quantifiable basis for prioritizing groups of roads than a simple functional classification system can provide.
Due to the limitations of the existing classification system, KRB, with funding from the Nordic Development Fund under the Northern Corridor Transport Improvement Project, commissioned a Consultant to develop a new Road Classification System in October 2006.The Consultant has reviewed the current classification system and compared with best international practices to develop a proposed new classification system.
The proposed reclassification system was presented to a stakeholder's meeting in July 2007 where it was adopted. It will take effect when approved by the Minister for Transport and Infrastructure.
The Proposed Kenyan Road Classification System (Kenya Roads Board)
KRB proposed the new classification system. It covers all public roads and extends to the presently unclassified rural and urban roads. The main thrust of the approach is to make the classification more objective and consistent by specifying quantifiable parameters (traffic, population, spacing) to guide the selection of appropriate road classes. It is also a dynamic system where road classes can be periodically reviewed to adapt to changes in traffic, function etc.
The proposed Road Classification System sees Kenya's road network as being composed of two distinct networks i.e. the Rural Roads Network (outside Cities and Municipalities) and the Urban Roads Network (within Cities and Municipalities) for all public roads with 9m or more road reserves. Although the new classification system retains A,B,C,D and E classes, the system has been extended to include additional classes. It should be noted that presently classified roads do not necessarily retain their road classes under the new classification.
2.5 CLASSIFICATION OF TWO-LANE HIGHWAYS (HCM 2000)Two-lane highways are categorized into two classes for analysis: (HCM 2010)
• Class I—These are two-lane highways on which motorists expect to travel at relatively high speeds. Two-lane highways that are major intercity routes, primary arterials connecting major traffic generators, daily commuter routes, or primary links in state or national highway networks
Page 14
PERFOMANCE ANALYSIS OF EASTERN BYPASS 2015
generally are assigned to Class I. Class I facilities most often serve long-distance trips or provide connecting links between facilities that serve long-distance trips.
• Class II—These are two-lane highways on which motorists do not necessarily expect to travel at high speeds. Two-lane highways that function as access routes to Class I facilities, serve as scenic or recreational routes that are not primary arterials, or pass through rugged terrain generally are assigned to Class II. Class II facilities most often serve relatively short trips, the beginning and ending portions of longer trips, or trips for which sightseeing plays a significant role.
The Eastern Bypass can be classified as a Class I highway since it provides a connecting link between two roads that serve long-distance trips, that is Thika Superhighway and Mombasa Road.
2.6 LITERATTURE BACKGROUND ON STUDY AREAThe area around the study area was originally an expansive bare land with no developments around it. However with the coming of the road, a lot of development has taken place. Local newspapers have depicted a spurt in the economic conditions of the area. According to the Standard newspaper:
“the area opened up and everyone wants to live there due to accessibility to Nairobi. At the point where the bypass connects to Kiambu-Ruiru Road before connecting to Thika Superhighway, unprecedented growth has been experienced, with investors building palatial homes and entertainment spots.” (Standard Media)
The paper further reports that business is booming in the area. The construction industry has thoroughly grown in the time since the building of the road. This has led to the interruption of traffic flow by construction vehicles and lorries.
Hardware shops are also reaping from the increased demand. Joseph Kiminda, a quarry business owner, says: “There is no single day you will not find a construction project in progress. This means good business for construction materials suppliers. We are busy.” (Standard Media)
The new road also introduced a route by the local transportation industry from the junction at Thika road to the junction at Kangundo road. The route is operated by fourteen or eleven seater vans known as matatus. These vehicles drop and pick passengers at random non-designated points on the road. As the vehicles decelerate to stop, this creates a shockwave of the vehicles behind it and increases the percentage time spent following. This imparts on the level of service of the road. The vehicles also cause a shockwave behind them as they join the road. The acceleration of these matatus cannot be compared with that of small personal cars and this causes vehicles to slow down to allow for the matatus joining the traffic stream.
Page 15
PERFOMANCE ANALYSIS OF EASTERN BYPASS 2015
Since the main purpose of the road was to divert traffic that had no business in the Central Business District, most of the goods trucks now use the Eastern Bypass. These trucks have a speed limit of 65 km/h. This speed creates hindrance to the movement of light vehicles whose speed limit is 110 km/h. This increases the percentage time spent following.
2.8 THEORETICAL BACKGROUND.Traffic volume studies are conducted to collect data on the number of vehicles and/or pedestrians that pass a point on a highway facility during a specified time period. Traffic volume studies are usually conducted when certain volume characteristics are needed, some of which follow:
2.8.1 Average Annual Daily Traffic (AADT) is the average of 24-hour counts collected every day of the year. AADTs are used in several traffic and transportation analyses for:
a. Estimation of highway user revenues
b. Computation of crash rates in terms of number of crashes per 100 million vehicle kilometers
c. Establishment of traffic volume trends
d. Evaluation of the economic feasibility of highway projects
e. Development of freeway and major arterial street systems
f. Development of improvement and maintenance programs
2.8.2 Average Daily Traffic (ADT) is the average of 24-hour counts collected over a number of days greater than one but less than a year. ADTs may be used for:
a. Planning of highway activities
b. Measurement of current demand
c. Evaluation of existing traffic flow
2.8.3 Peak Hour Volume (PHV) is the maximum number of vehicles that pass a point on a highway during a period of 60 consecutive minutes. PHVs are used for:
a. Functional classification of highways
b. Design of the geometric characteristics of a highway, for example, number of lanes, intersection signalization, or channelization
c. Capacity analysis
Page 16
PERFOMANCE ANALYSIS OF EASTERN BYPASS 2015
d. Development of programs related to traffic operations, for example, one-way street systems or traffic routing
e. Development of parking regulations
2.8.4 Vehicle Classification (VC) records volume with respect to the type of vehicles, for example, passenger cars, two-axle trucks, or three-axle trucks. VC is used in:
a. Design of geometric characteristics, with particular reference to turning-radii requirements, maximum grades, lane widths, and so forth
b. Capacity analyses, with respect to passenger-car equivalents of trucks
c. Adjustment of traffic counts obtained by machines
d. Structural design of highway pavements, bridges, and so forth
2.8.5 Vehicle Miles of Travel (VMT) is a measure of travel along a section of road. It is the product of the traffic volume (that is, average weekday volume or ADT) and the length of roadway in miles to which the volume is applicable. VMTs are used mainly as a base for allocating resources for maintenance and improvement of highways.
2.9 CAPACITY The capacity of a two-lane highway is 1,700 pc/h for each direction of travel. The capacity is nearly independent of the directional distribution of traffic on the facility, except that for extended lengths of two-lane highway, the capacity will not exceed 3,200 pc/h for both directions of travel combined. For short lengths of two-lane highway—such as tunnels or bridges—a capacity of 3,200 to 3,400 pc/h for both directions of travel combined may be attained but cannot be expected for an extended length.
2.10 TRAFFIC VOLUME COUNTTraffic volume studies are conducted to determine the number, movements, and classifications of roadway vehicles at a given location. These data can help identify critical flow time periods, determine the influence of large vehicles or pedestrians on vehicular traffic flow, or document traffic volume trends. The length of the sampling period depends on the type of count being taken and the intended use of the data recorded.
Two methods are available for conducting traffic volume counts:
manual automatic
Manual counts are typically used to gather data for determination of vehicle classification, turning movements, direction of travel, pedestrian movements, or vehicle occupancy. Automatic
Page 17

PERFOMANCE ANALYSIS OF EASTERN BYPASS 2015
counts are typically used to gather data for determination of vehicle hourly patterns, daily or seasonal variations and growth trends, or annual traffic estimates.
The selection of study method should be determined using the count period. The count period should be representative of the time of day, day of month, and month of year for the study area. For example, counts at a summer resort would not be taken in January. The count period should avoid special event such as weekends and public holidays or compromising weather conditions such as heavy rain or snow conditions. Count periods may range from 5 minutes to 1 year. Typical count periods are 15 minutes or 2 hours for peak periods, 4 hours for morning and afternoon peaks, 6 hours for morning, midday, and afternoon peaks, and 12 hours for daytime periods. For example, if you were conducting a 2 -hour peak period count, eight 15-minute counts would be required. For this study, the Manual Count Method will be adopted.
2.10.1 Manual Count MethodThis is the more common method of conducting traffic counts. It is mostly used where one requires small samples of data at any given location. Manual counts are sometimes used when the effort and expense of automated equipment are not justified. Manual counts are necessary when automatic equipment is not available. Manual counts are typically used for periods of less than a day. Normal intervals for a manual count are 5, 10, or 15 minutes. Traffic counts during a Monday morning rush hour and a Friday evening rush hour may show exceptionally high volumes and are not normally used in analysis; therefore, counts are usually conducted on a Tuesday, Wednesday, or Thursday.
2.10.1.1 Manual Count Recording MethodsManual counts are recorded using one of three methods: tally sheets, mechanical counting boards, or electronic counting boards. For this study, only data sheets and counting boards will be used.
2.10.1.1.1 Tally SheetsRecording data onto tally sheets is the simplest means of conducting manual counts. The data can be recorded with a tick mark on a pre-prepared field form. A watch or stopwatch is necessary to measure the desired count interval.
2.10.1.1.2 Mechanical Counting BoardsMechanical count boards consist of counters mounted on a board that record each direction of travel. Common counts include pedestrian, bicycle, vehicle classification, and traffic volume counts. Typical counters are push button devices with three to five registers. Each button represents a different stratification of type of vehicle or pedestrian being counted. The limited number of buttons on the counter can restrict the number of classifications that can be counted on a given board. A watch or a stopwatch is also necessary with this method to measure the desired count interval.
Page 18
PERFOMANCE ANALYSIS OF EASTERN BYPASS 2015
2.10.1.2 Personnel Involved in a Manual Count StudyThe size of the data collection team depends on the length of the counting period, the type of count being performed, the number of lanes or crosswalks being observed, and the volume level of traffic. The number of personnel needed also depends on the study data needed. For example, one observer can record certain types of vehicles while another counts total volumes. Observers conducting manual traffic counts must be trained on the study purpose. To avoid fatigue, observers must be relieved periodically. Every 2 hours observers should take a 10 to 15 minute break.
2.10.1.3 Key Steps to a Manual Count StudyA manual count study includes three key steps:
Perform necessary office preparations.
Select proper observer location.
Label data sheets and record observations.
Perform Necessary Office Preparations
Office preparations start with a review of the purpose of the manual count. This type of information will help determine the type of equipment to use, the field procedures to follow, and the number of observers required. For example, an intersection with multiple approach lanes may require electronic counting boards and multiple observers.
Select Proper Observer Location
Observers must be positioned where they have a clear view of the traffic. Observers should be positioned away from the edge of the roadway. If observers are positioned above ground level and clear of obstructions they usually have the best vantage point. Visual contact must be maintained if there are multiple observers at a site. If views are unobstructed, observers may count from inside a vehicle.
Label Data Forms and Record Observations
Manual counts may produce a large number of data forms; therefore, the data forms should be carefully labeled and organized. On each tally sheet, the observer should record the location, time and date of observation, and weather conditions24.
2.11 DETERMINATION OF LEVEL OF SERVICE FOR A TWO LANE TWO WAY HIGHWAYHCM 2000 outlines the following discussion presenting estimates of two-lane highway capacity, defining the LOS for two-lane highways, and documenting the methodology for operational and
Page 19

PERFOMANCE ANALYSIS OF EASTERN BYPASS 2015
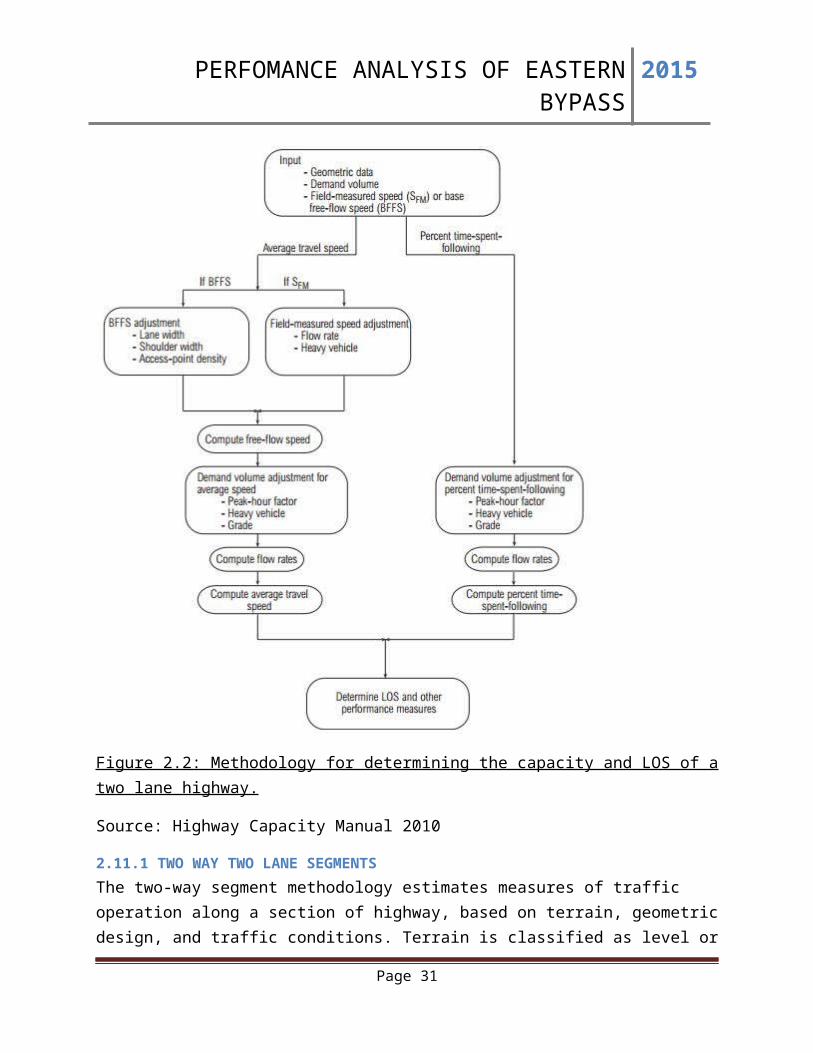
for planning applications. Figure 7 summarizes the methodology for determining the Capacity and the Level of service of a Two Lane highway.
Figure 2.2: Methodology for determining the capacity and LOS of a two lane highway.
Source: Highway Capacity Manual 2010
2.11.1 TWO WAY TWO LANE SEGMENTSThe two-way segment methodology estimates measures of traffic operation along a section of highway, based on terrain, geometric design, and traffic conditions. Terrain is classified as level or rolling, as described below. Mountainous terrain is addressed in the operational analysis of specific upgrades and downgrades, presented below. This methodology typically is applied to highway sections of at least 2.0 mi. Traffic data needed to apply the two-way segment
Page 20
PERFOMANCE ANALYSIS OF EASTERN BYPASS 2015
methodology include the two-way hourly volume, a peak-hour factor (PHF), and the directional distribution of traffic flow. The PHF may be computed from field data, or appropriate default values may be selected from the tabulated values presented in Chapter 12 of HCM2000. Traffic data also includes the proportion of trucks and recreational vehicles (RVs) in the traffic stream. The operational analysis of extended two-way segments for a two-lane highway involves several steps, described in the following sections.
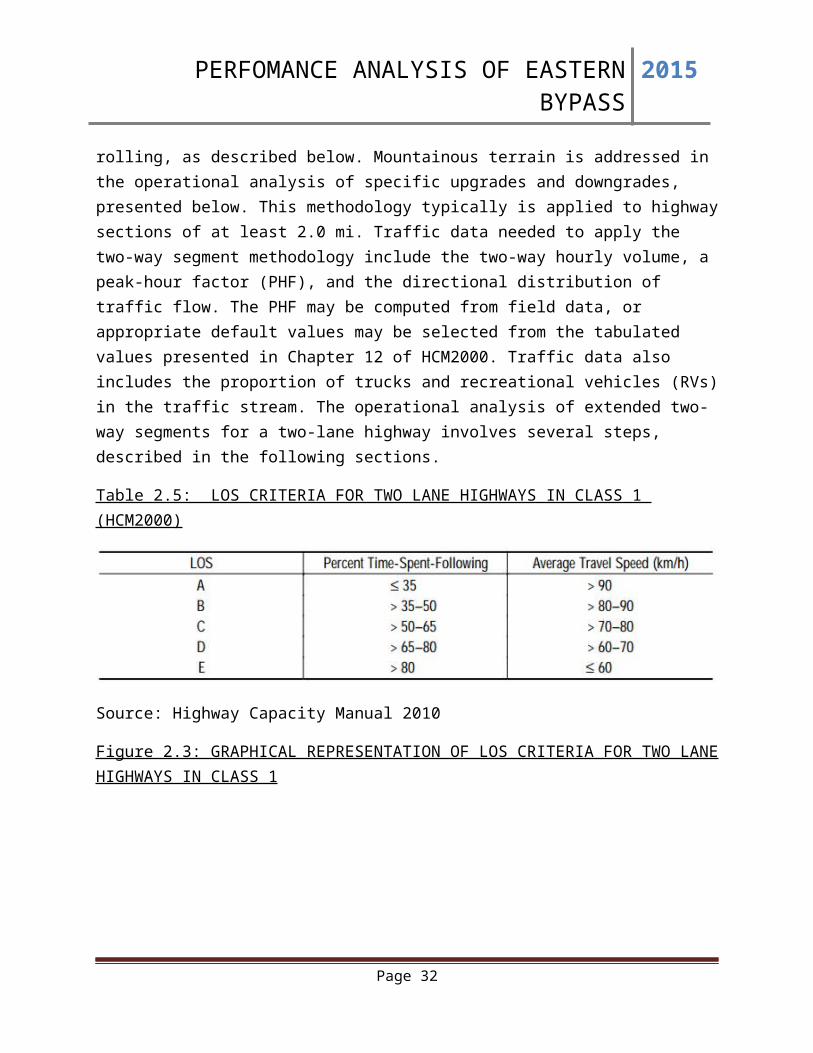
Table 2.5: LOS CRITERIA FOR TWO LANE HIGHWAYS IN CLASS 1 (HCM2000)
Source: Highway Capacity Manual 2010
Figure 2.3: GRAPHICAL REPRESENTATION OF LOS CRITERIA FOR TWO LANE HIGHWAYS IN CLASS 1
Source: Highway Capacity Manual 2010
Page 21
PERFOMANCE ANALYSIS OF EASTERN BYPASS 2015
2.11.1.1 Determining Free-Flow Speed (HCM2000)A key step in the assessment of the LOS of a two-lane highway is to determine the free-flow speed (FFS). The FFS is measured using the mean speed of traffic under low flow conditions (up to two-way flows of 200 pc/h). If field measurements must be made with two-way flow rates of more than 200 pc/h, a volume adjustment must be made in determining FFS. This volume adjustment is discussed below.
The FFS of a highway can be determined directly from a speed study conducted in the field. No adjustments are made to the field-measured data. The speed study should be conducted at a representative location within the highway segment being evaluated; for example, a site on a short upgrade should not be selected within a segment that is generally level. Any speed measurement technique acceptable for other types of traffic engineering speed studies may be used. The field study should be conducted in periods of low traffic flow (up to a two-way flow of 200 pc/h) and should measure the speeds of all vehicles or of a systematic sampling (e.g., of every 10th vehicle). A representative sample of the speeds of at least 100 vehicles, impeded or unimpeded, should be obtained.
If the speed study must be conducted at a two-way flow rate of more than 200 pc/h, the FFS can be found by using the speed-flow relationships shown in Chapter 12(HCM2000), assuming that data on traffic volumes are recorded at the same time. The FFS can be computed based on field data as shown in Equation 2:
(Equation 2)
Source: Highway Capacity Manual 2010
where
FFS = estimated free-flow speed (km/h),
SFM = mean speed of traffic measured in the field (km/h),
Vf = observed flow rate for the period when field data were obtained (veh/h), and
fHV = heavy-vehicle adjustment factor, determined as shown in Equation 5
2.11.1.2 Determining Demand Flow RateThree adjustments must be made to hourly demand volumes, whether based on traffic counts or estimates, to arrive at the equivalent passenger-car flow rate used in LOS analysis. These adjustments are the PHF, the grade adjustment factor, and the heavy vehicle adjustment factor. These adjustments are applied according to Equation 3.
Page 22

PERFOMANCE ANALYSIS OF EASTERN BYPASS 2015
(Equation 3)
Source: Highway Capacity Manual 2010
where
vp = passenger-car equivalent flow rate for peak 15-min period (pc/h),
V = demand volume for the full peak hour (veh/h),
PHF = peak-hour factor,
fG = grade adjustment factor, and
fHV = heavy-vehicle adjustment factor determined as shown in Equation 5
2.11.1.3 PHFPHF represents the variation in traffic flow within an hour. Two-lane highway analysis is based on demand volumes for a peak 15-min period within the hour of interest—usually the peak hour. For operational analysis, the full-hour demand volumes must be converted to flow rates for the peak 15 min, as shown in Equation 3. The peak hour factor is then calculated using Equation 4.
PHF= VV 15 X 4 (Equation 4)
Source: Highway Capacity Manual 2010
Where:
PHF = Peak Hour Factor
V = Hourly volume (veh/h)
V15 = Maximum 15 minute rate of flow
Default PHF values of 0.88 for rural areas and 0.92 for urban areas may be used in the absence of local data.
2.11.1.4 Grade Adjustment FactorThe grade adjustment factor, fG, accounts for the effect of the terrain on travel speeds and percent time-spent-following, even if no heavy vehicles are present. The values of the grade adjustment
Page 23
PERFOMANCE ANALYSIS OF EASTERN BYPASS 2015
factor are listed in Table 5 for estimating average travel speeds and in Table 6 for estimating percent time-spent-following.
Table 2.6: GRADE ADJUSTMENT FACTOR (fG) TO DETERMINE SPEEDS ON TWO-WAY AND DIRECTIONAL SEGMENTS
Source: Highway Capacity Manual 2010
Table 2.7: GRADE ADJUSTMENT FACTOR (fG) TO DETERMINE PERCENT TIME-SPENT-FOLLOWING ON TWO-WAY AND DIRECTIONAL SEGMENTS
Source: Highway Capacity Manual 2010
2.11.1.5 Adjustment for Heavy VehiclesThe presence of heavy vehicles in the traffic stream decreases the FFS, because at base conditions the traffic stream is assumed to consist only of passenger cars—a rare occurrence. Therefore, traffic volumes must be adjusted to an equivalent flow rate expressed in passenger cars per hour. This adjustment is accomplished by using the factor fHV.
Adjustment for the presence of heavy vehicles in the traffic stream applies to two types of vehicles: trucks and RVs. Buses should not be treated as a separate type of heavy vehicle but should be included with trucks. The heavy-vehicle adjustment factor requires two steps. First, the passenger-car equivalency factors for trucks (ET) and RVs(ER) for the prevailing operating conditions must be found. Then, using these values, an adjustment factor must be computed to correct for all heavy vehicles in the traffic stream. Passenger-car equivalents for extended two-way segments are determined from Table 7 for estimating speeds and from Table 8 for
Page 24
PERFOMANCE ANALYSIS OF EASTERN BYPASS 2015
estimating percent time spent-following. The terrain of extended two-way segments should be categorized as level or rolling.
Table 2.8: PASSENGER-CAR EQUIVALENTS FOR TRUCKS AND RVS TO DETERMINE SPEEDS OF TWO-WAY AND DIRECTIONAL SEGMENTS
Source: Highway Capacity Manual 2010
Table 2.9: PASSENGER-CAR EQUIVALENTS FOR TRUCKS AND RVS TO DETERMINE PERCENT TIME-SPENT-FOLLOWING ON TWO-WAY AND DIRECTIONAL SEGMENTS
Source: Highway Capacity Manual 2010
2.11.1.6 Level TerrainLevel terrain is any combination of horizontal and vertical alignment permitting heavy vehicles to maintain approximately the same speed as passenger cars; this generally includes short grades of no more than 1 or 2 percent.
Page 25
PERFOMANCE ANALYSIS OF EASTERN BYPASS 2015
2.11.1.7 Rolling TerrainRolling terrain is any combination of horizontal and vertical alignment causing heavy vehicles to reduce their speeds substantially below those of passenger cars, but not to operate at crawl speeds for any significant length of time or at frequent intervals; generally, this includes short- and medium-length grades of no more than 4 percent. Segments with substantial lengths of more than a 4 percent grade should be analyzed with the specific grade procedure for directional segments. Heavy-Vehicle Adjustment Factor Once values for ET and ER have been determined, the adjustment factor for heavy vehicles is computed using Equation 5.
(Equation 5)
Source: Highway Capacity Manual 2010
where
PT= proportion of trucks in the traffic stream, expressed as a decimal;
PR= proportion of RVs in the traffic stream, expressed as a decimal
ET= passenger-car equivalent for trucks, obtained from Table 7 or Table 8; and
ER= passenger-car equivalent for RVs, obtained from Table 7 or Table 8
2.11.1.8 Iterative ComputationsTables 5 through 8 - the grade adjustment factor fG and the passenger-car equivalents for trucks (ET) and RVs (ER)—are stratified by flow rates expressed in passenger cars per hour. However, until Equation 3 is applied, the flow rate in passenger cars per hour is not known. Therefore, an iterative approach must be applied to determine the passenger-car equivalent flow rate vp, and from that, either average travel speed or percent time-spent-following.
First, determine the flow rate, in vehicles per hour, as V/PHF. Second, select values of fG, ET, and ER appropriate for that flow rate from the tables. Then, determine the vp from those values using Equations 3 and 5. If the computed value of vp is less than the upper limit of the selected flow-rate range for which fG, ET, and ER were determined, then the computed value of vp should be used. If the vp is higher than the upper limit of the selected flow-rate range, repeat the process for successively higher ranges until an acceptable value of vp is found. Because the highest range includes all flow rates greater than 1,200 pc/h in both directions of travel combined, it can be used if a computed value exceeds the upper limit of both lower flow-rate ranges.
Page 26

PERFOMANCE ANALYSIS OF EASTERN BYPASS 2015
2.11.1.9 Determining Average Travel SpeedThe average travel speed is estimated from the FFS, the demand flow rate, and an adjustment factor for the percentage of no-passing zones. The demand flow rate for estimating average travel speed is determined with Equation 3 using the value of f HV computed with the passenger-car equivalents in Table 7. Average travel speed is then estimated using Equation 6.
(Equation 6)
Source: Highway Capacity Manual 2010
where
ATS = average travel speed for both directions of travel combined (km/h),
fnp = adjustment for percentage of no-passing zones (see Table 9), and
vp = passenger-car equivalent flow rate for peak 15-min period (pc/h).
The FFS used in Equation 6 is the value estimated with Equation 2. The adjustment for the effect of the percentage of no-passing zones on average travel speed (fnp) is listed in Table 9. The table shows that the effect of no-passing zones on average travel speed increases to a maximum at a two-way flow rate of 400 pc/h and then decreases at higher volumes. The maximum value of fnp is 7.3 km/h.
Page 27
PERFOMANCE ANALYSIS OF EASTERN BYPASS 2015
Table 2.10: ADJUSTMENT (fnp) FOR EFFECT OF NO-PASSING ZONES ON AVERAGE TRAVEL SPEED ON TWO-WAY SEGMENTS
Source: Highway Capacity Manual 2010
2.11.1.10 Determining Percent Time-Spent-FollowingThe percent time-spent-following is estimated from the demand flow rate, the directional distribution of traffic, and the percentage of no-passing zones. The demand flow rate (vp) for estimating percent time-spent-following is determined with Equation 3 using the value of fHV computed with passenger-car equivalents from Table 8. Percent time-spent-following is then estimated using Equation 7. Appropriate values of base percent time-spent-following can be determined from Equation 8.
(Equation 7)
Source: Highway Capacity Manual 2010
where
PTSF = percent time-spent-following,
Page 28
PERFOMANCE ANALYSIS OF EASTERN BYPASS 2015
BPTSF = base percent time-spent-following for both directions of travel combined (use Equation……..), and
fd/np = adjustment for the combined effect of the directional distribution of traffic and of the percentage of no-passing zones on percent time-spent following
(Equation 8)
Source: Highway Capacity Manual 2010
An adjustment representing the combined effect of directional distribution of traffic and percentage of no-passing zones (fd/np) is presented in Table 10
Table 2.11: ADJUSTMENT (fd/np) FOR COMBINED EFFECT OF DIRECTIONAL DISTRIBUTION OF TRAFFIC AND PERCENTAGE OF NO-PASSING ZONES ON
PERCENT TIME-SPENT-FOLLOWING ON TWO-WAYSEGMENTS
Source: Highway Capacity Manual 2010
Page 29
PERFOMANCE ANALYSIS OF EASTERN BYPASS 2015
Source: Highway Capacity Manual 2010
2.11.2 Determining LOSThe first step in determining LOS is to compare the passenger-car equivalent flow rate (vp) to the two-way capacity of 3,200 pc/h. If vp is greater than the capacity, then the roadway is oversaturated and the LOS is F. Similarly, if the demand flow rate in either direction of travel—as determined from the two-way flow rate and the directional split— is greater than 1,700 pc/h, then the roadway is oversaturated and the LOS is F. In LOS F, percent time-spent-following is nearly 100 percent and speeds are highly variable and difficult to estimate.
When a segment of a Class I facility has a demand less than its capacity, the LOS is determined by locating a point on Table 4 that corresponds to the estimated percent time-spent-following and average travel speed.
Page 30

PERFOMANCE ANALYSIS OF EASTERN BYPASS 2015
3. DATA COLLECTION
3.1 TRAFFIC VOLUME COUNTFor this study, the manual method of traffic volume counting was chosen as opposed to the automatic method due to lack of access to automatic gadgets. The tally sheets were prepared and the counters were acquired. For stopwatches, the data collectors used their mobile phones due to lack of proper stopwatches. The phones were however synchronized to read the exact same time. A total of six data collectors were engaged. All the data collectors were familiar with the purpose of the data collection.
Each of the data collectors were provided with counters and instructed to record a certain class of vehicles. Three data collectors were allocated for each direction of the road. The data collection started at 7.00 am and ended at 7.00 pm. The seventh data collector was the relief person in the case of bathroom breaks and lunch breaks. He also facilitated the recording of the data during the 15 minute intervals.
The data was collected at the point shown on the map below.
Page 31

PERFOMANCE ANALYSIS OF EASTERN BYPASS 2015
Map Showing data collection point. Source: Google Earth
3.2 SPEED COUNTThe speed count was done by the moving observer method. This method involves the observer driving along the desired length to be studied and measuring the time it takes to cover the distance. From this time measurement, the average travelling speed can be obtained.
For this study, a total of five runs were made along the whole distance of the Eastern bypass. A run in this case indicates a to and fro drive, from the Thika Road junction all the way to the
Page 32
PERFOMANCE ANALYSIS OF EASTERN BYPASS 2015
Kangundo Road junction, and then driving back. The time taken to drive one direction was recorded as well as the time taken to drive back.
The speed count was carried out during different times of the day. The times were selected to coincide with the expected peak and off peak periods. This was chosen to be able to assess the different conditions of the road at different times of the day. This would therefore provide a good measure of the average travel speed.
Page 33
PERFOMANCE ANALYSIS OF EASTERN BYPASS 2015
4. RESULTS AND ANALYSIS
4.1 RESULTS
4.1.1 TRAFFIC COUNT RESULTSThe following were the results obtained from the field data collection.
Table 4.1: Traffic volume counts headed to Kangundo Road
Traffic Volume Count SheetApproaching From: THIKA ROAD Exiting to: KANGUNDO ROAD
Vehicle Type/ Hour Starting Motorcycles Cars
Pickups, Jeeps, Vans, SUVs
Matatus & Minibuses
Buses
Light Trucks
Medium Trucks
Heavy Trucks
6 Axle and Drawback
Trucks
7:00 AM
2 97 37 12 1 21 42 20 81 110 37 12 0 10 21 14 71 97 30 8 1 10 14 20 92 89 27 6 2 6 20 12 8
8:00 AM
3 99 20 7 0 8 17 16 62 112 21 4 0 3 23 18 121 68 23 11 0 1 41 21 70 57 28 7 1 4 21 23 6
9:00 AM
0 58 19 8 1 7 33 21 92 43 23 7 0 1 19 19 73 71 21 12 1 1 27 12 61 49 35 4 0 2 14 8 7
10:00 AM
1 39 30 6 0 0 27 19 131 37 23 7 0 3 36 14 142 29 16 8 2 2 47 16 31 33 22 7 1 4 30 12 1
11:00 AM
3 41 31 7 0 1 26 13 70 30 33 6 0 0 14 12 61 30 16 4 0 2 17 6 42 33 12 2 0 0 23 12 2
12:00 PM
1 37 21 15 0 1 27 21 91 21 19 9 0 3 31 13 70 20 23 10 1 2 30 21 81 22 27 12 0 1 30 14 6
1:00 PM
3 20 42 20 0 4 27 16 71 39 23 12 0 3 16 12 125 57 24 6 2 2 29 27 41 60 28 8 2 0 35 19 3
Page 34

PERFOMANCE ANALYSIS OF EASTERN BYPASS 2015
2:00 PM
3 43 21 7 0 1 42 20 71 33 20 12 0 0 47 21 92 41 31 14 0 1 31 14 61 29 14 8 0 3 37 12 4
3:00 PM
3 27 23 7 1 4 26 6 34 28 21 6 0 7 20 14 32 27 14 12 0 12 16 12 70 29 28 7 0 10 22 13 4
4:00 PM
1 33 23 8 0 4 37 6 23 37 23 10 0 7 31 12 01 42 25 7 1 13 20 14 71 41 19 12 1 6 14 6 3
5:00 PM
2 49 27 10 0 4 13 7 60 63 29 12 1 8 12 12 51 70 33 18 0 6 16 13 41 97 35 12 2 10 20 12 3
6:00 PM
3 103 61 13 2 13 21 10 14 102 42 16 0 12 20 23 71 113 39 10 1 13 33 22 63 97 30 14 1 10 37 16 7
Table 4.2: Traffic Volume Counts headed to Thika Road
Traffic Volume Count SheetApproaching From: KANGUNDO ROAD Exiting to: THIKA ROAD
Vehicle Type/ Hour Starting Motorcycles Cars
Pickups, Jeeps, Vans, SUVs
Matatus & Minibuses
Buses
Light Trucks
Medium Trucks
Heavy Trucks
6 Axle and Drawback
Trucks
7:00 AM
3 154 69 22 2 23 27 21 100 127 53 16 3 11 33 20 31 136 59 18 1 12 21 14 42 113 48 12 0 10 30 22 8
8:00 AM
2 110 57 19 1 11 24 12 73 121 96 12 2 17 22 16 65 97 41 8 3 14 29 22 82 101 41 10 0 12 20 24 3
9:00 AM
4 86 46 6 1 9 22 13 12 54 49 12 0 10 17 27 71 91 39 10 0 6 29 14 42 84 40 8 0 3 30 18 3
10:00 AM 0 61 39 7 1 5 33 26 1
Page 35
PERFOMANCE ANALYSIS OF EASTERN BYPASS 2015
1 41 37 7 0 2 41 21 20 48 41 4 0 1 26 12 12 36 35 6 0 4 13 14 1
11:00 AM
1 41 34 1 0 3 27 16 41 37 39 3 0 1 40 21 32 39 29 5 1 0 31 14 92 53 30 4 0 0 33 12 7
12:00 PM
1 54 37 5 0 1 42 20 83 46 31 1 0 3 53 21 61 44 24 6 0 2 41 16 42 48 38 4 1 1 40 12 6
1:00 PM
1 63 42 7 0 1 30 22 71 54 51 1 0 6 29 31 83 68 48 3 0 3 48 12 121 57 60 5 1 4 44 23 6
2:00 PM
4 49 47 2 1 3 31 27 71 51 33 1 0 1 27 14 72 53 40 1 0 1 20 28 112 47 31 0 1 2 22 28 3
3:00 PM
0 57 27 3 0 1 22 27 21 48 31 5 1 0 19 23 51 50 20 1 0 0 20 20 53 60 14 1 0 5 24 27 6
4:00 PM
3 58 16 0 0 6 39 30 53 56 20 2 0 1 44 19 42 61 12 3 0 4 37 16 01 73 21 3 0 0 41 12 1
5:00 PM
3 77 22 5 0 3 40 14 24 82 46 7 0 4 39 16 14 107 51 9 1 3 41 21 35 100 39 13 2 1 32 21 4
6:00 PM
1 110 57 6 0 1 27 20 45 137 52 7 2 4 31 18 63 126 41 9 1 2 29 30 81 112 60 10 1 1 19 20 8
The following are the corrected values of the traffic counts in Passenger Car Units. The correction factors used are as outlined in the literature review.
Table 4.3: Corrected PCU Values for the traffic count headed to Kangundo Road
Traffic Volume Count Sheet
Page 36
PERFOMANCE ANALYSIS OF EASTERN BYPASS 2015
Approaching From: THIKA ROAD Exiting to: KANGUNDO ROAD
Corrected PCU Values for
Motorcycles
Corrected PCU Values for SUVs /pickups, matatus
/minibusesCorrected PCU
Values for buses
Corrected PCU Values for Trucks
7:00 AM - 7:15 AM 0.66 98 2.5 2737:15 AM - 7:30 AM 0.33 98 0 1567:30 AM - 7:45 AM 0.33 76 2.5 1597:45 AM - 8:00 AM 0.66 66 5 1388:00 AM - 8:15 AM 0.99 54 0 1418:15 AM - 8:30 AM 0.66 50 0 1688:30AM - 8:45 AM 0.33 68 0 2108:45 AM - 9:00 AM 0 70 2.5 1629:00 AM - 9:15 AM 0 54 2.5 2109:15 AM - 9:30 AM 0.66 60 0 1389:30AM - 9:45 AM 0.99 66 2.5 138
9:45 AM - 10:00 AM 0.33 78 0 9310:00 AM - 10:15 AM 0.33 72 0 17710:15 AM - 10:30 AM 0.33 60 0 20110:30 AM - 10:45 AM 0.66 48 5 20410:45 AM - 11:00 AM 0.33 58 2.5 14111:00 AM - 11:15 AM 0.99 76 0 14111:15 AM - 11:30 AM 0 78 0 9611:30 AM - 11:45 AM 0.33 40 0 8711:45 AM - 12:00 PM 0.66 28 0 11112:00 PM - 12:15 PM 0.33 72 0 17412:15 PM - 12:30 PM 0.33 56 0 16212:30 PM - 12:45 PM 0 66 2.5 18312:45 PM - 1:00 PM 0.33 78 0 1531:00 PM - 1:15 PM 0.99 124 0 1621:15 PM - 1:30 PM 0.33 70 0 1291:30 PM - 1:45 PM 1.65 60 5 1861:45 PM - 2:00 PM 0.33 72 5 1712:00 PM - 2:15 PM 0.99 56 0 2102:15 PM - 2:30 PM 0.33 64 0 2312:30 PM - 2:45 PM 0.66 90 0 1562:45 PM - 3:00 PM 0.33 44 0 1683:00 PM - 3:15 PM 0.99 60 2.5 1173:15 PM - 3:30 PM 1.32 54 0 1323:30 PM - 3:45 PM 0.66 52 0 1413:45 PM - 4:00 PM 0 70 0 1474:00 PM - 4:15 PM 0.33 62 0 1474:15 PM - 4:30 PM 0.99 66 0 1504:30 PM - 4:45 PM 0.33 64 2.5 1624:45 PM - 5:00 PM 0.33 62 2.5 875:00 PM - 5:15 PM 0.66 74 0 905:15 PM - 5:30 PM 0 82 2.5 1115:30 PM - 5:45 PM 0.33 102 0 1175:45 PM - 6:00 PM 0.33 94 5 135
Page 37

PERFOMANCE ANALYSIS OF EASTERN BYPASS 2015
6:00 PM - 6:15 PM 0.99 148 5 1356:15 PM - 6:30 PM 1.32 116 0 1866:30 PM - 6:45 PM 0.33 98 2.5 2226:45 PM - 7:00 PM 0.99 88 2.5 210
Table 4.4: Corrected PCU Values for the traffic count headed to Thika Road
Traffic Volume Count SheetApproaching From: KANGUNDO ROAD Exiting to: THIKA ROAD
Corrected PCU Values for
Motorcycles
Corrected PCU Values for SUVs /pickups, matatus
/minibuses
Corrected PCU Values for
buses
Corrected PCU Values for Trucks
7:00 AM - 7:15 AM 0.99 182 5 2437:15 AM - 7:30 AM 0 138 7.5 2017:30 AM - 7:45 AM 0.33 154 2.5 1537:45 AM - 8:00 AM 0.66 120 0 2108:00 AM - 8:15 AM 0.66 152 2.5 1628:15 AM - 8:30 AM 0.99 216 5 1838:30AM - 8:45 AM 1.65 98 7.5 2198:45 AM - 9:00 AM 0.66 102 0 1779:00 AM - 9:15 AM 1.32 104 2.5 1359:15 AM - 9:30 AM 0.66 122 0 1839:30AM - 9:45 AM 0.33 98 0 159
9:45 AM - 10:00 AM 0.66 96 0 16210:00 AM - 10:15 AM 0 92 2.5 19510:15 AM - 10:30 AM 0.33 88 0 19810:30 AM - 10:45 AM 0 90 0 12010:45 AM - 11:00 AM 0.66 82 0 9611:00 AM - 11:15 AM 0.33 70 0 15011:15 AM - 11:30 AM 0.33 84 0 19511:30 AM - 11:45 AM 0.66 68 2.5 16211:45 AM - 12:00 PM 0.66 68 0 15612:00 PM - 12:15 PM 0.33 84 0 21312:15 PM - 12:30 PM 0.99 64 0 24912:30 PM - 12:45 PM 0.33 60 0 18912:45 PM - 1:00 PM 0.66 84 2.5 1771:00 PM - 1:15 PM 0.33 98 0 1801:15 PM - 1:30 PM 0.33 104 0 2221:30 PM - 1:45 PM 0.99 102 0 2251:45 PM - 2:00 PM 0.33 130 2.5 2312:00 PM - 2:15 PM 1.32 98 2.5 2042:15 PM - 2:30 PM 0.33 68 0 1472:30 PM - 2:45 PM 0.66 82 0 1802:45 PM - 3:00 PM 0.66 62 2.5 1653:00 PM - 3:15 PM 0 60 0 1563:15 PM - 3:30 PM 0.33 72 2.5 141
Page 38

PERFOMANCE ANALYSIS OF EASTERN BYPASS 2015
3:30 PM - 3:45 PM 0.33 42 0 1353:45 PM - 4:00 PM 0.99 30 0 1864:00 PM - 4:15 PM 0.99 32 0 2404:15 PM - 4:30 PM 0.99 44 0 2044:30 PM - 4:45 PM 0.66 30 0 1714:45 PM - 5:00 PM 0.33 48 0 1625:00 PM - 5:15 PM 0.99 54 0 1775:15 PM - 5:30 PM 1.32 106 0 1805:30 PM - 5:45 PM 1.32 120 2.5 2045:45 PM - 6:00 PM 1.65 104 5 1746:00 PM - 6:15 PM 0.33 126 0 1566:15 PM - 6:30 PM 1.65 118 5 1776:30 PM - 6:45 PM 0.99 100 2.5 2076:45 PM - 7:00 PM 0.33 140 2.5 144
The average 15 minute traffic was as depicted below:
Table 4.5: Average 15 minute traffic headed to Kangundo Road
Approaching From: THIKA ROADExiting to: KANGUNDO ROAD
Time Average 15 min Traffic7:00 AM - 7:15 AM 471.167:15 AM - 7:30 AM 364.337:30 AM - 7:45 AM 334.837:45 AM - 8:00 AM 298.668:00 AM - 8:15 AM 294.998:15 AM - 8:30 AM 330.668:30AM - 8:45 AM 346.338:45 AM - 9:00 AM 291.59:00 AM - 9:15 AM 324.59:15 AM - 9:30 AM 241.669:30AM - 9:45 AM 278.49
9:45 AM - 10:00 AM 220.3310:00 AM - 10:15 AM 288.3310:15 AM - 10:30 AM 298.3310:30 AM - 10:45 AM 286.6610:45 AM - 11:00 AM 234.8311:00 AM - 11:15 AM 258.9911:15 AM - 11:30 AM 20411:30 AM - 11:45 AM 157.3311:45 AM - 12:00 PM 172.6612:00 PM - 12:15 PM 283.33
Page 39
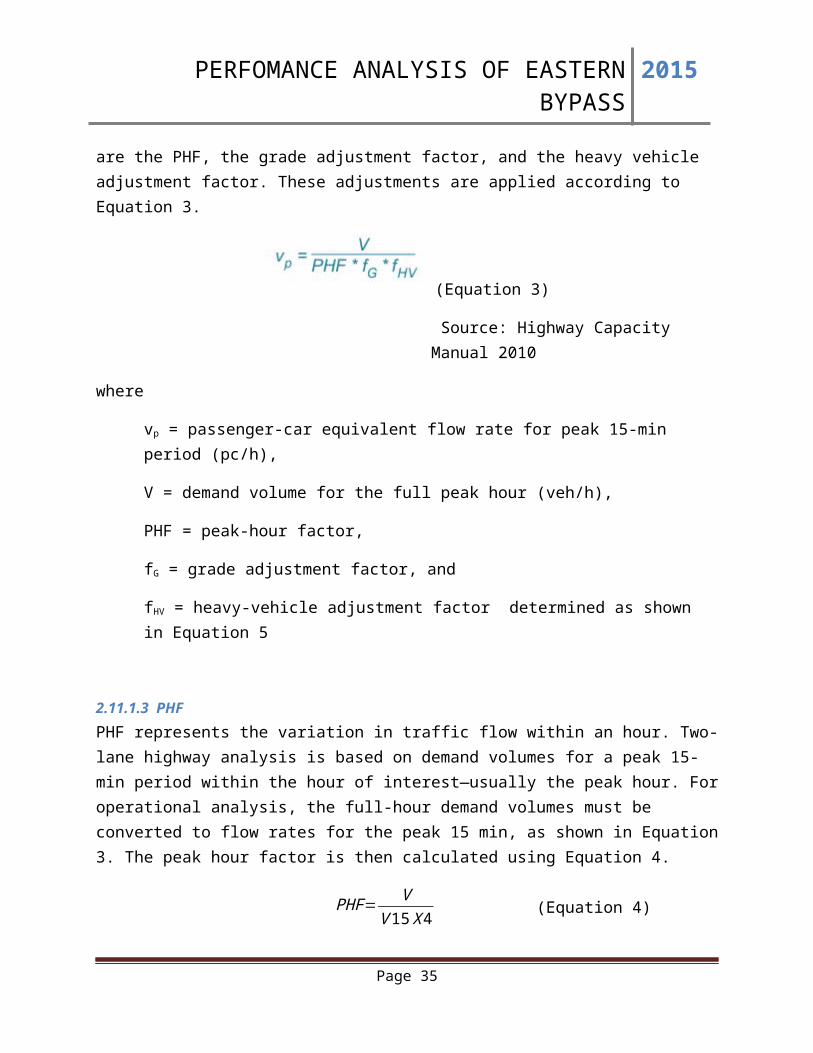
PERFOMANCE ANALYSIS OF EASTERN BYPASS 2015
12:15 PM - 12:30 PM 239.3312:30 PM - 12:45 PM 271.512:45 PM - 1:00 PM 253.331:00 PM - 1:15 PM 306.991:15 PM - 1:30 PM 238.331:30 PM - 1:45 PM 309.651:45 PM - 2:00 PM 308.332:00 PM - 2:15 PM 309.992:15 PM - 2:30 PM 328.332:30 PM - 2:45 PM 287.662:45 PM - 3:00 PM 241.333:00 PM - 3:15 PM 207.493:15 PM - 3:30 PM 215.323:30 PM - 3:45 PM 220.663:45 PM - 4:00 PM 2464:00 PM - 4:15 PM 242.334:15 PM - 4:30 PM 253.994:30 PM - 4:45 PM 270.834:45 PM - 5:00 PM 192.835:00 PM - 5:15 PM 213.665:15 PM - 5:30 PM 258.55:30 PM - 5:45 PM 289.335:45 PM - 6:00 PM 331.336:00 PM - 6:15 PM 391.996:15 PM - 6:30 PM 405.326:30 PM - 6:45 PM 435.836:45 PM - 7:00 PM 398.49
Table 4.6: Average 15 minute traffic headed to Thika Road
Approaching from: KANGUNDO ROAD Exiting to: THIKA ROAD
Time Average 15 min Traffic7:00 AM - 7:15 AM 584.997:15 AM - 7:30 AM 473.57:30 AM - 7:45 AM 445.837:45 AM - 8:00 AM 443.668:00 AM - 8:15 AM 427.168:15 AM - 8:30 AM 525.998:30AM - 8:45 AM 423.158:45 AM - 9:00 AM 380.669:00 AM - 9:15 AM 328.829:15 AM - 9:30 AM 359.66
Page 40
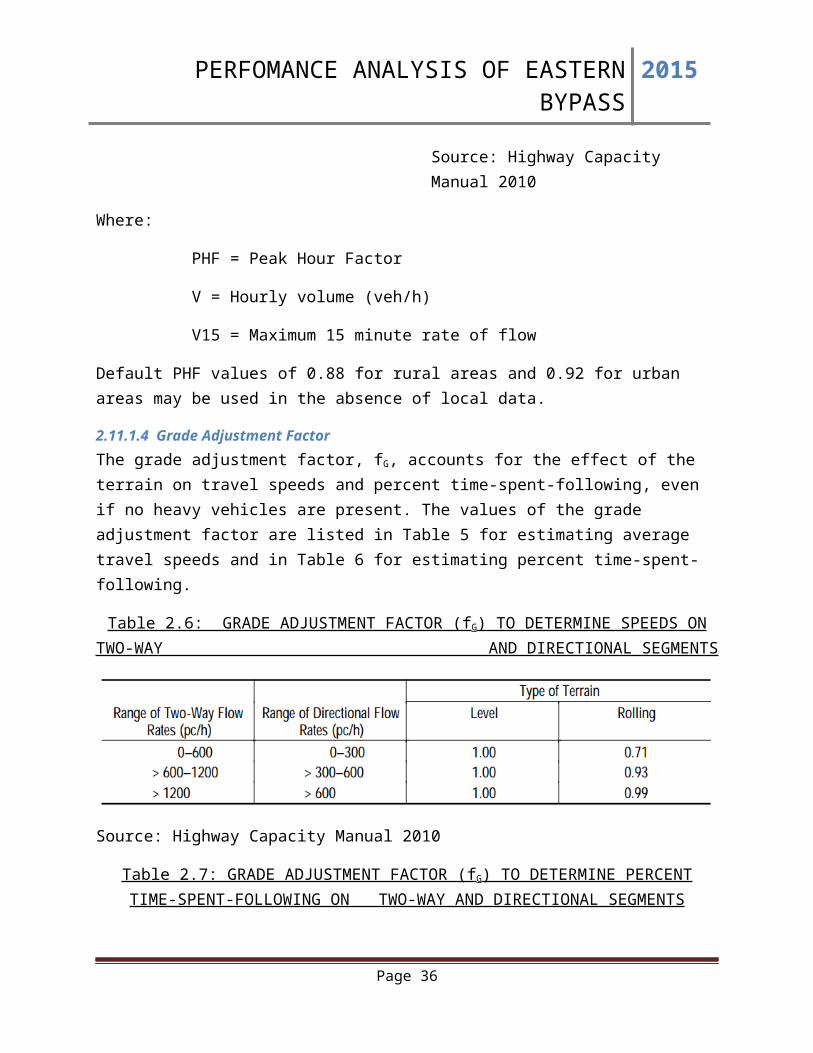
PERFOMANCE ANALYSIS OF EASTERN BYPASS 2015
9:30AM - 9:45 AM 348.339:45 AM - 10:00 AM 342.6610:00 AM - 10:15 AM 350.510:15 AM - 10:30 AM 327.3310:30 AM - 10:45 AM 25810:45 AM - 11:00 AM 214.6611:00 AM - 11:15 AM 261.3311:15 AM - 11:30 AM 316.3311:30 AM - 11:45 AM 272.1611:45 AM - 12:00 PM 277.6612:00 PM - 12:15 PM 351.3312:15 PM - 12:30 PM 359.9912:30 PM - 12:45 PM 293.3312:45 PM - 1:00 PM 312.161:00 PM - 1:15 PM 341.331:15 PM - 1:30 PM 380.331:30 PM - 1:45 PM 395.991:45 PM - 2:00 PM 420.832:00 PM - 2:15 PM 354.822:15 PM - 2:30 PM 266.332:30 PM - 2:45 PM 315.662:45 PM - 3:00 PM 277.163:00 PM - 3:15 PM 2733:15 PM - 3:30 PM 263.833:30 PM - 3:45 PM 227.333:45 PM - 4:00 PM 276.994:00 PM - 4:15 PM 330.994:15 PM - 4:30 PM 304.994:30 PM - 4:45 PM 262.664:45 PM - 5:00 PM 283.335:00 PM - 5:15 PM 308.995:15 PM - 5:30 PM 369.325:30 PM - 5:45 PM 434.825:45 PM - 6:00 PM 384.656:00 PM - 6:15 PM 392.336:15 PM - 6:30 PM 438.656:30 PM - 6:45 PM 436.496:45 PM - 7:00 PM 398.83
The average hourly traffic was as depicted below.
Table 4.7: Average Hourly Traffic Headed to Kangundo Road
Page 41
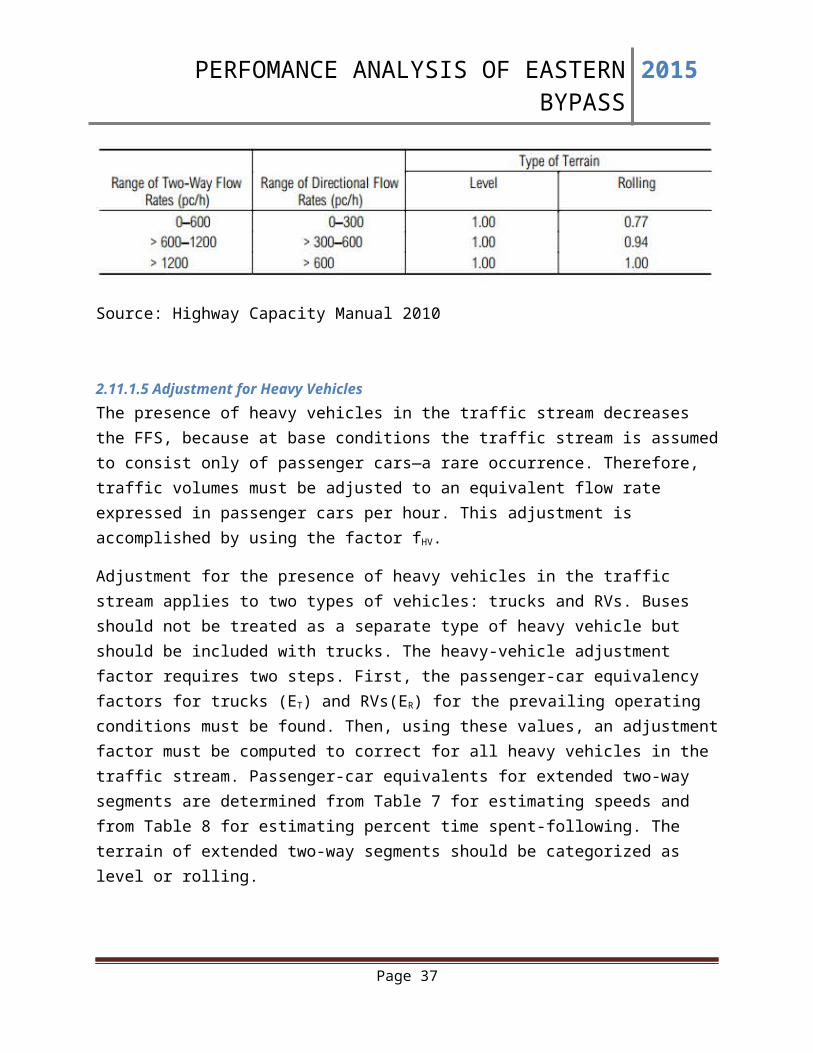
PERFOMANCE ANALYSIS OF EASTERN BYPASS 2015
Approaching from: THIKA ROAD Exiting To: KANGUNDO ROAD
Time Hourly Traffic7:00 AM 1468.988:00 AM 1263.489:00 AM 1064.98
10:00 AM 1108.1511:00 AM 792.9812:00 PM 1047.491:00 PM 1163.32:00 PM 1167.313:00 PM 889.474:00 PM 959.985:00 PM 1092.826:00 PM 1631.63
TOTAL TRAFFIC 13,651Table 4.8: Hourly Traffic counts headed to Thika Road
Approaching From: KANGUNDO ROAD Exiting To: THIKA ROAD
Time Hourly Traffic7:00 AM 1947.988:00 AM 1756.969:00 AM 1379.47
10:00 AM 1150.4911:00 AM 1127.4812:00 PM 1316.811:00 PM 1538.482:00 PM 1213.973:00 PM 1041.154:00 PM 1181.975:00 PM 1497.786:00 PM 1666.3
TOTAL TRAFFIC 16,819
The Directional Split was as depicted below.
Table 4.9: Directional Split
TO KANGUNDO ROAD TO THIKA ROAD
Page 42
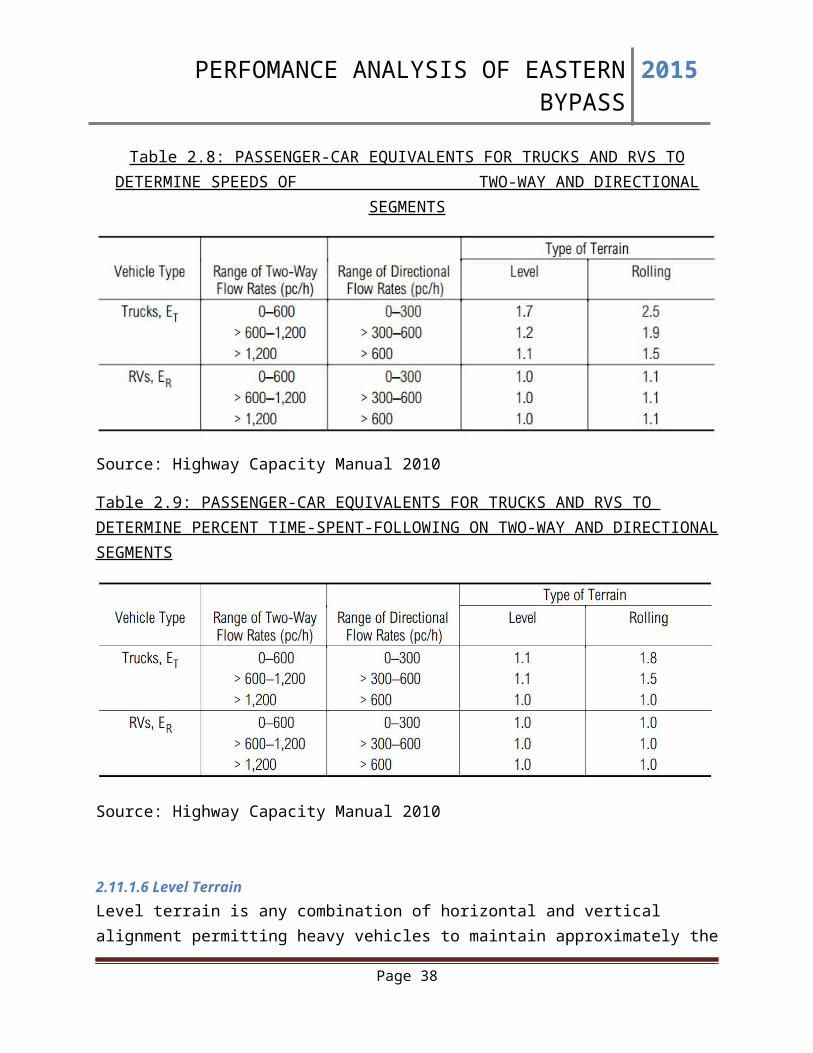
PERFOMANCE ANALYSIS OF EASTERN BYPASS 2015
13650.57 16818.8444.80% 55.20%
4.1.2 SPEED COUNT RESULTSTable 4.10: Speed Counts for both directions
Speed Count Sheet
Run No.
Distance (KM)
Time of Run
Time Taken To (Mins &
Secs)
Time Taken Fro (Mins &
Secs)
Time Taken
To (Hrs)
Time Taken
Fro (Hrs)
Average Speed To
Average Speed Fro
Average Run
Speed1 13.75 7:10 AM 14 min 44s 16 min 30s 0.246 0.275 55.89431 50 52.947152 13.75 10:30 AM 9 min 10s 10 min 02s 0.153 0.167 89.86928 82.335329 86.102313 13.75 1:20 PM 13 min 5s 12 min 41s 0.218 0.211 63.07339 65.165877 64.119644 13.75 3:30 PM 10 min 43s 11 min 56s 0.179 0.199 76.81564 69.095477 72.955565 13.75 5:30 PM 13 min 58s 15 min 44s 0.233 0.262 59.01288 52.480916 55.7469
TOTAL AVERAGE SPEED 66.37431
4.2 ANALYSISFigure 4.1 : Graph of Number of Different Classes of Vehicles headed to Kangundo Road
Page 43

PERFOMANCE ANALYSIS OF EASTERN BYPASS 2015
Motor-cycles
Cars Pick ups, Jeeps,
Vans, SUVs
Matatus & Minibuses
Buses Light Trucks
Medium Trucks
Heavy Trucks
6 Axle and Drawback
Trucks
0
500
1000
1500
2000
2500
3000
Number of Different Vehicle ClassesN
umbe
r
Figure 4.2: Graph of Numbers of Different Classes of Vehicles Headed to Thika Road
Page 44
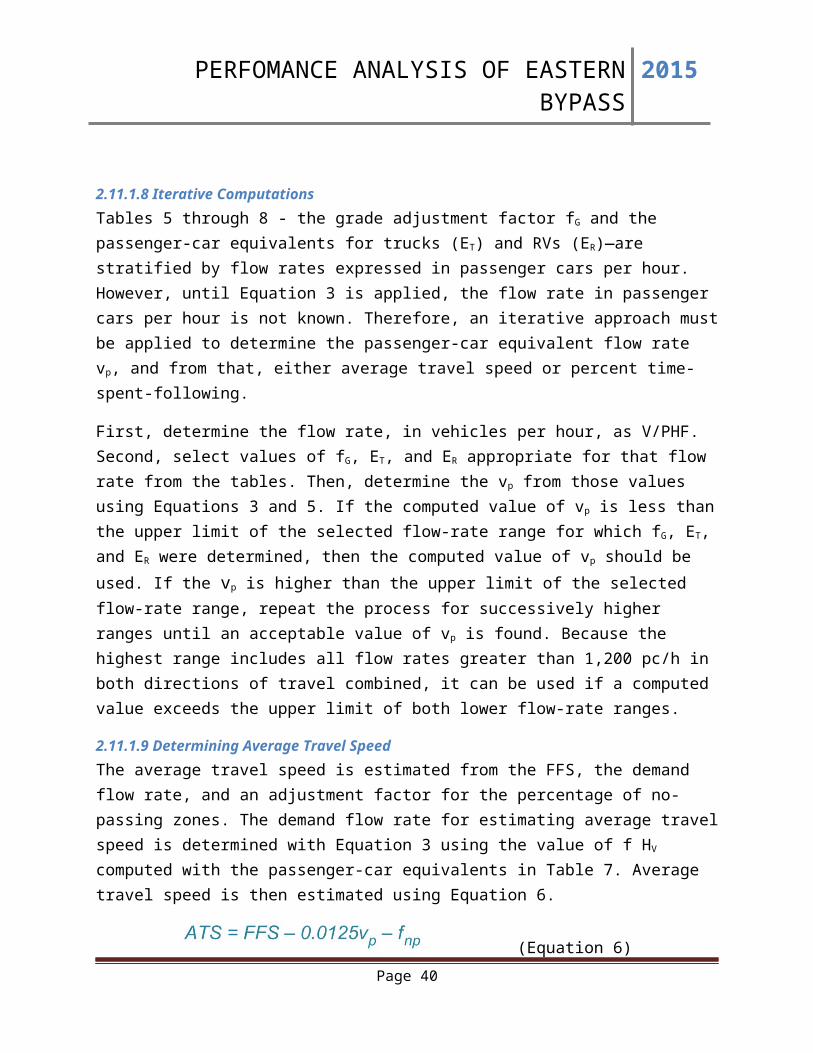
PERFOMANCE ANALYSIS OF EASTERN BYPASS 2015
Motor-cycles
Cars Pick ups, Jeeps,
Vans, SUVs
Matatus & Minibuses
Buses Light Trucks
Medium Trucks
Heavy Trucks
6 Axle and Drawback
Trucks
0
500
1000
1500
2000
2500
3000
3500
4000
Number of Different Vehicle Classes
Series1 Number
Num
ber
Figure 4.3: Graph Of Average 15 Min Traffic Approaching from Thika Road and Exiting to Kangundo Road
Page 45
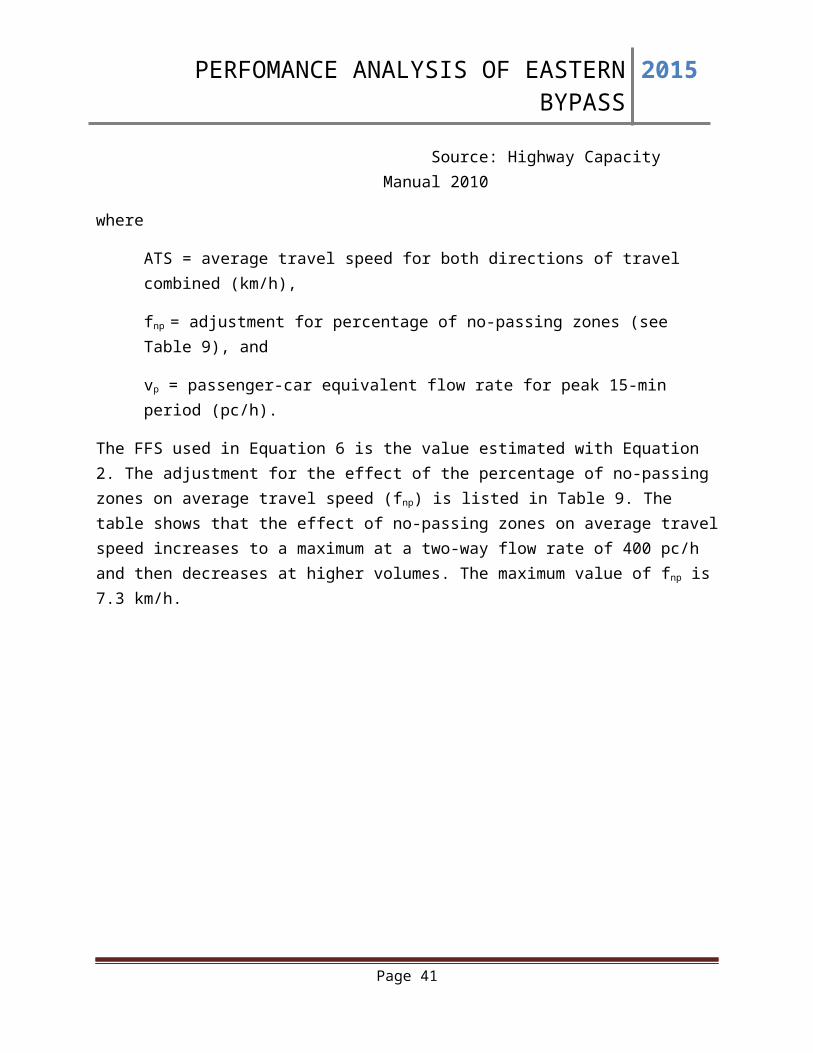
PERFOMANCE ANALYSIS OF EASTERN BYPASS 2015
7:15 AM - 7:30 AM
7:45 AM - 8:00 AM
8:15 AM - 8:30 AM
8:45 AM - 9:00 AM
9:15 AM - 9:30 AM
9:45 AM - 10:00 AM
10:15 AM - 10:30 AM
10:45 AM - 11:00 AM
11:15 AM - 11:30 AM
11:45 AM - 12:00 PM
12:15 PM - 12:30 PM
12:45 PM - 1:00 PM
1:15 PM - 1:30 PM
1:45 PM - 2:00 PM
2:15 PM - 2:30 PM
2:45 PM - 3:00 PM
3:15 PM - 3:30 PM
3:45 PM - 4:00 PM
4:15 PM - 4:30 PM
4:45 PM - 5:00 PM
5:15 PM - 5:30 PM
5:45 PM - 6:00 PM
6:15 PM - 6:30 PM
6:45 PM - 7:00 PM
0
50
100
150
200
250
300
350
400
450
500
Average 15 min Traffic
Observation: The graph depicts the different shifts in the 15 minutes traffic. It shows the rise in the traffic counts during the expected peak hours of the day. The highest 15 minute traffic is that between 7:00 AM and 7:15 AM. This represents the main period when most people are headed to their places of work. It is higher because most people leave their houses early in order to beat the traffic pile ups.
Figure 4.4: Graph Of Average 15 Min Traffic Approaching from Kangundo Road and Exiting to Thika Road
Page 46

PERFOMANCE ANALYSIS OF EASTERN BYPASS 2015
7:00 AM - 7:15 AM
7:30 AM - 7:45 AM
8:00 AM - 8:15 AM
8:30AM - 8:45 AM
9:00 AM - 9:15 AM
9:30AM - 9:45 AM
10:00 AM - 10:15 AM
10:30 AM - 10:45 AM
11:00 AM - 11:15 AM
11:30 AM - 11:45 AM
12:00 PM - 12:15 PM
12:30 PM - 12:45 PM
1:00 PM - 1:15 PM
1:30 PM - 1:45 PM
2:00 PM - 2:15 PM
2:30 PM - 2:45 PM
3:00 PM - 3:15 PM
3:30 PM - 3:45 PM
4:00 PM - 4:15 PM
4:30 PM - 4:45 PM
5:00 PM - 5:15 PM
5:30 PM - 5:45 PM
6:00 PM - 6:15 PM
6:30 PM - 6:45 PM
0
100
200
300
400
500
600
700
Average 15 min Traffic
Observation: This shows a similar trend on the way towards Thika Superhighway, only that this time the traffic numbers are higher. This is because most people work within the city and the quickest way to get there is by use of the Thika Superhighway. The high number of motor vehicles is also contributed to by the high number of trucks bypassing the busy Mombasa Road. Most are travelling at these morning hours after having spent the night at a place known as Mlolongo along Mombasa Road.
Figure 4.5: Graph Of Average Hourly Traffic Approaching from Thika Road and Exiting to Kangundo Road
Page 47
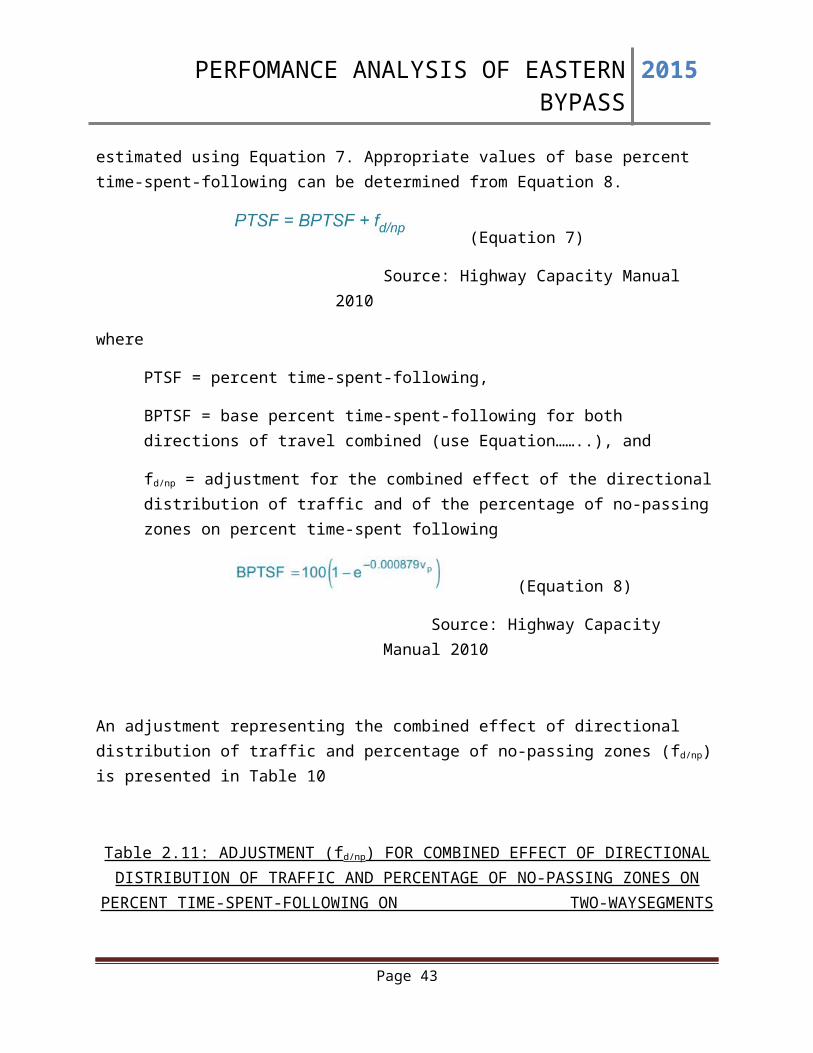
PERFOMANCE ANALYSIS OF EASTERN BYPASS 2015
7:00 AM
8:00 AM
9:00 AM
10:00 AM
11:00 AM
12:00 PM
1:00 PM
2:00 PM
3:00 PM
4:00 PM
5:00 PM
6:00 PM
0
200
400
600
800
1000
1200
1400
1600
1800
2000
2200
Hourly Traffic
Hourly Traffic
Observation: The graph clearly shows the peak hours for the day. From the results, there are mainly three peak periods where the peak hour is. These are 7:00 AM - 8:00 AM, 12:30 PM – 1:30 PM, and 6:00 PM – 7:00 PM. It also shows the off-peak periods, which are 10:00 AM to 11:00 AM and 2:30 PM - 3:30 PM.
Figure 4.6: Graph Of Average Hourly Traffic Approaching from Kangundo Road and Exiting to Thika Road
Page 48

PERFOMANCE ANALYSIS OF EASTERN BYPASS 2015
7:00 AM
8:00 AM
9:00 AM
10:00 AM
11:00 AM
12:00 PM
1:00 PM
2:00 PM
3:00 PM
4:00 PM
5:00 PM
6:00 PM
0
200
400
600
800
1000
1200
1400
1600
1800
Hourly Traffic
Hourly Traffic
Observation: Similarly, this graph shows the peak hours for the day which are also three in number. These are 7:00 AM - 8:00 AM, 1:00 PM – 2:00 PM, and 5:30 PM – 6:30 PM. It also shows the off-peak periods, which are 10:30 AM to 11:30 AM and 2:30 PM - 3:30 PM.
Figure 4.7: Pie Chart Showing Directional Split Between The Two Directions
Page 49

PERFOMANCE ANALYSIS OF EASTERN BYPASS 2015
TO KANGUNDO ROAD TO THIKA ROAD
4.3 DETERMINING LEVEL OF SERVICE OF THE ROAD.
4.3.1 Determining free flow speed.The free flow speed was determined for a capacity of more than 200pc/h. Therefore the FFS is determined as thus.
FFS = estimated free-flow speed (km/h),
SFM = mean speed of traffic measured in the field (km/h) = 66.37
Vf = observed flow rate for the period when field data were obtained (veh/h)
= 1948 veh/h
fHV = heavy-vehicle adjustment factor, determined as shown below
Page 50

PERFOMANCE ANALYSIS OF EASTERN BYPASS 2015
where
PT= proportion of trucks in the traffic stream, expressed as a decimal;
PR= proportion of RVs in the traffic stream, expressed as a decimal
ET= passenger-car equivalent for trucks, obtained from Table 7 or Table 8; and
ER= passenger-car equivalent for RVs, obtained from Table 7 or Table 8
From: THIKA ROAD To: KANGUNDO ROAD
Table 4.11: Proportion of Trucks and RVs headed to Kangundo Road
Total Unfactored Vehicles 6933
Total Unfactored RVs 1721
Total Unfactored Trucks 2506
From: THIKA ROAD To: KANNGUNDO ROAD
Table 4.12: Proportion of Trucks and RVs headed to Thika Road
Total Unfactored Vehicles 8831
Total Unfactored RVs 2243
Total Unfactored Trucks 2885
PT = 2506+28856933+8831 = 0.342
PR = 1721+22436933+8831 = 0.251
ET = 1.0 (Table 8)
ER = 1.0 (Table 8)
fHV = 1
1+0.342 (1.0−1 )+0.251(1.0−1)
Page 51
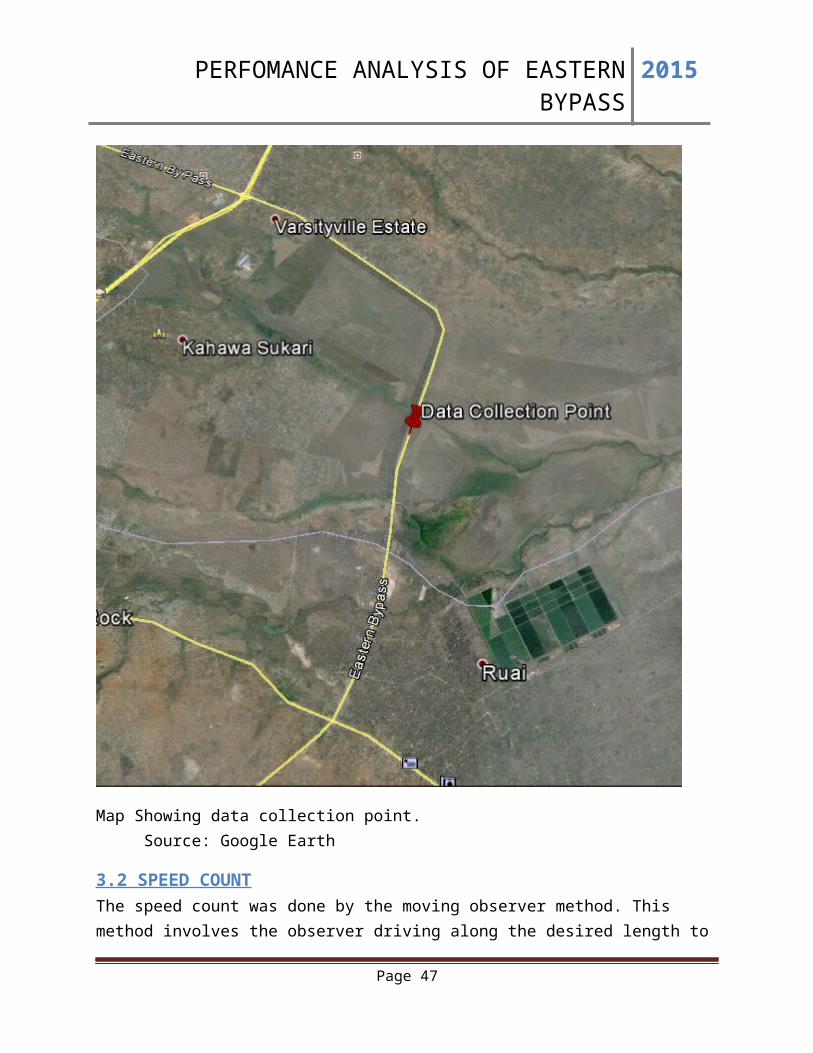
PERFOMANCE ANALYSIS OF EASTERN BYPASS 2015
fHV = 1
Therefore, FFS = 66.37 + 0.01251948
1
= 66.37 + 24.35
= 90.72 km/h
4.3.2 Determining Demand Flow Rate The demand flow rate is determined using the formula below.
where
vp = passenger-car equivalent flow rate for peak 15-min period (pc/h),
V = demand volume for the full peak hour (veh/h) = 1948 veh/h
PHF = peak-hour factor,
fG = grade adjustment factor, and
fHV = heavy-vehicle adjustment factor determined as shown in Equation 5
PHF= VV 15 X 4
Where:
PHF = Peak Hour Factor
V = Hourly volume (veh/h) = 1948 veh/h
V15 = Maximum 15 minute rate of flow = 585 veh
PHF = 1948
585 X 4
= 0.8325
Page 52
PERFOMANCE ANALYSIS OF EASTERN BYPASS 2015
fG = 1 (Table 5)
fHV = 1
Vp = 1948
0.8325 X 1 X 1
vp = 2339.93
= 2340 pc/h
4.3.3 Determining The Average Travel Speed
where
ATS = average travel speed for both directions of travel combined (km/h),
FFS = Free Flow Speed (km/h) = 90.72 km/h
fnp = adjustment for percentage of no-passing zones (see Table 9), and
vp = passenger-car equivalent flow rate for peak 15-min period (pc/h) = 2340
fnp
Total distance = 13.75km
No passing zone Distance = 1.4 km
Percentage no passing zone = 1.4
13.75X 100=10.18 %
fnp = 0.4 (Interpolated from Table 9)
ATS = 90.72 – 0.0125(2340) – 0.4
= 61.07 km/h
4.3.4 Determining Percent Time Spent FollowingThe percent time spent following is determined by the equation below:
Page 53

PERFOMANCE ANALYSIS OF EASTERN BYPASS 2015
where
PTSF = percent time-spent-following,
BPTSF = base percent time-spent-following for both directions of travel combined
fd/np = adjustment for the combined effect of the directional distribution of traffic and of the percentage of no-passing zones on percent time-spent following
BPTSF = 100 (1 - e−0.000879 (2340)¿
= 87.185
fd/np = 0.8 (Interpolated from Table 10)
PTSF = 87.185+0.8 = 87.98%
4.3.5 Determining Level Of Service With the Average speed at 61.07 km/h and the Percentage Time Spent Following at 87.98
%, the level of service of Nairobi Eastern Bypass can now be determined from the diagram below.
Figure 4.8: Figure Showing The level of service of the Road
Page 54
PERFOMANCE ANALYSIS OF EASTERN BYPASS 2015
Source: Highway Capacity Manual 2010
The study indicates that in general, the road is operating at level of service E.
Page 55

PERFOMANCE ANALYSIS OF EASTERN BYPASS 2015
5. DISCUSSION
5.1 DISCUSSION ON TRAFFIC FLOW RESULTS
5.1.1 MORNING TRAFFIC
5.1.1.1 Thika Road bound trafficIt was observed that this was the highest number traffic that was recorded. This can be attributed to the high number of people trying to access the Central Business District. In spite of the road being over 20km (Google maps) from the CBD, the accessibility of the area after the construction of Thika Superhighway and the Eastern Bypass led to a high increase in the population. People who owned some land along the road have developed the land into their own homes or into establishments for entertainment. Thus the number of people dependent on the road drastically shot up after its construction. Most of these trips are therefore Home-Based Work trips.
The high number of vehicles can also be attributed to the high number of trucks using the road at this time. Most of these trucks trips originated from the port of Mombasa and will terminate somewhere in the interior of the country or into the neighboring countries. These trucks normally make overnight stops at a center known as Mlolongo. (Appending 2) The center is only a few kilometers from the junction of the bypass with Mombasa road. Thus the truck drivers rise early to try and beat the morning traffic. Interviews conducted with a few truck drivers indicate that their days start as early as 5:00 AM. This increases greatly the number of vehicles between 5 AM and 7:30 AM.
The highest recorded number of passenger car units was 585 passenger car units for the 15 minute interval. For a two way rural highway which is designated a maximum of 1700pc/h (HCM2010), this number has overshot its design capacity. The road ought to be operating at a maximum of 425pcu for every 15 minutes for it to be economically sound. This is however not the case as it operated at 38% higher than the design capacity for this particular 15 minute period. This therefore indicates a level of service of F.
5.1.1.2 Kangundo Road Bound TrafficIt was observed that the morning traffic heading to Kangundo Road was equally high. The numbers may have been a little lower than those of the opposing traffic, but they were still significant. These high numbers of traffic can be attributed to the high number of people headed towards Mombasa road from Thika Road and The Nakuru – Nairobi Highway. These are mainly people headed to work in the industries along Mombasa Road, or to the airport. This also comprises of people heading to the airport to catch their morning flights.
The high numbers can also be attributed to the high number of trucks in the traffic stream. These are trucks on their return journey from the interior of the country and from the neighboring land locked countries towards the Port of Mombasa. Most of these truck drivers spent the night along
Page 56

PERFOMANCE ANALYSIS OF EASTERN BYPASS 2015
the various stops along the Mai-Mahiu – Narok Road or in Thika Town. They are also trying to beat the morning traffic and hence the early hours on the road.
In this case, the highest recorded number of pcu was 471 for a 15 minute interval. Compared with the design average of 425pcu for every 15 minute interval, the operational capacity is still high than the design capacity. The operational capacity is at 11% higher than the design capacity. This indicates that the road is operating at level of service F at this particular peak period.
For both cases of the morning traffic then, the road seems to have overshot its design capacity. The operational capacity for this particular peak morning period needs to be lowered for the road to be economically valuable as well as operate at its design level of service.
5.1.2 EVENING TRAFFIC
5.1.2.1 Thika Road Bound TrafficIt was observed that there were high numbers of vehicles during this peak hour. This can be attributed to people heading back to their homes after work. Most of the people headed back are those that work along Mombasa Road industries as well as those that work at the airport. The high number of vehicles can also be attributed to the increase in the number of trucks trying to get to their night stop at Mlolongo before it gets dark. This greatly increases the traffic on the road.
The highest number of vehicles recorded for a 15 minute period was 438 vehicles. Comparing this number with the accepted average of 425pcu indicates that the road at this hour was also operating at a greater capacity than the design capacity. It is however only 3% greater than the design capacity. This therefore indicates a level of service F.
5.1.2.2 Kangundo Road Bound TrafficThe situation is the same for Kangundo Road traffic. There is an increase in the number of motor vehicles on the road during this peak period as well. This is attributed mostly to the same case of the Thika road bound traffic. The traffic flow mainly comprises of small cars and SUVs as people head back to their homes from work. The numbers of trucks were noticeably lower than that of the reverse traffic. Most of the truck drivers had taken their rest for the day at Mlolongo.
The highest number of motor vehicles recorded during a 15 minute period was 435 vehicles. This was a little higher than the design values of 425pcu, but not as high as that of the morning traffic. It was at 3% greater, thus indicating a level of service F.
Page 57

PERFOMANCE ANALYSIS OF EASTERN BYPASS 2015
5.1.3 MID DAY TRAFFIC
5.1.3.1 Thika Road Bound TrafficA rise in the traffic counts was also witnessed somewhere in the middle of the day. For Thika road bound traffic, this was between 1:00 PM and 2:00 PM. This came as a result of the number of motorists heading for lunch along the many establishments increased. The road boasts a good number of lunch and entertainment joints. These have become a favorite among the people who live or work around and along the road. Some of the customers came from as far as the city center to enjoy the delicacies at the joints. The increased number of vehicles accessing the turn-offs and accesses to these establishment not only increased the traffic numbers, but also caused long shockwaves behind them.
In spite of an increase in the number of vehicles at this hour, the count could not match of morning or evening hours. The highest number of vehicles recorded in this direction was 421pcu as opposed to the design value of 425pcu for every 15 minutes. This means that the operational capacity has not overshot the design capacity. However, at this point, the traffic is operating at level of service E.
5.1.3.2 Kangundo Road Bound TrafficThe same case was witnessed with the traffic headed to Kangundo Road. The number of vehicles sharply rose between 12:30 PM and 1:30 PM. This too can be attributed to the increased number of people making use of the lunch break to run errands and go get lunch. Slowing down of vehicles to access the joints also led to long shockwaves in the traffic stream.
In this case as well, the number of vehicles could not reach those that were witnessed in the peak morning and evening hours. The highest number recorded was put at 328 vehicles. This compared to the design value of 425pcu, can be said to be fairly efficient. This value however represents a level of service D
5.1.4 OFF PEAK TRAFFIC
5.1.4.1 Thika Road Bound TrafficThe study established two basic off peak hours for the traffic stream. These were periods when the traffic counts went low. These were witnessed at 10:30 AM – 11:00 AM and 2:30 pm – 3:30 PM. These periods can be attributed to the decline in number of passenger cars and SUVs on the roads. Most people have settled in at their place of work. The number of trucks also reduces, but not as significantly as the number of passenger cars.
The lowest number of vehicles recorded was 214pcu for a 15 minute period. This is a pretty good value compared to the 425pcu design capacity of the road.(HCM2000) This represents a level of service C, which unfortunately is still worse than the design level of service B.
Page 58
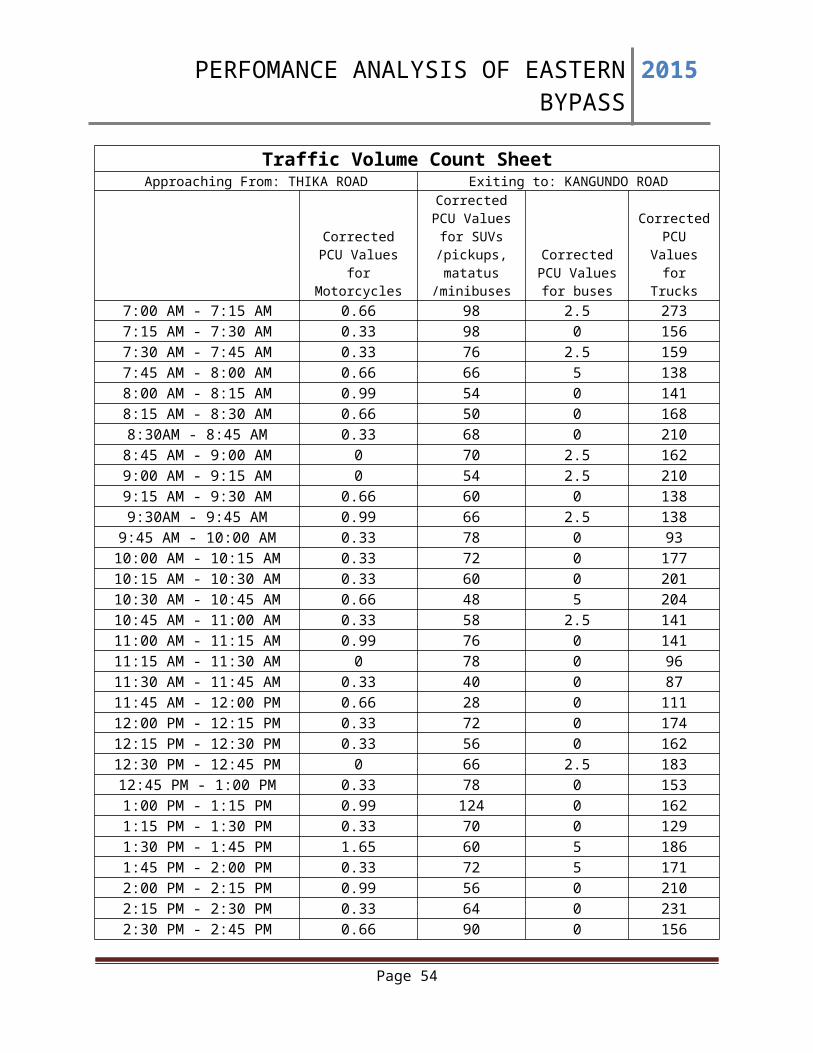
PERFOMANCE ANALYSIS OF EASTERN BYPASS 2015
5.1.4.2 Kangundo Road Bound TrafficThe same decline in the traffic counts was recorded in the vehicles headed to Kangundo Road. There were two off peak periods recorded. In this case they were between 10:30 AM – 11:30 AM and 2:30 PM – 3:30 PM. These two periods can also be attributed to the decline in the number of passenger cars and SUVs from the traffic stream.
The lowest number of vehicles recorded was 158pcu in a 15 minute period. This is a fairly low number. It represents a level of service C. This therefore means that the road was also performing worse than its design value.
5.2 DISCUSSION ON SPEED-FLOW RESULTSThe results on the speed counts indicate a high fluctuation in the travel speeds of vehicles along the Nairobi Eastern Bypass. The speeds mainly vary depending on the number of vehicles on the road. This means that different peak periods experience different travel speeds. The speed count was purposely run on the peak and off peak periods in order to establish a good average run speed.
The morning high capacity on the road indicates the lowest speeds experienced. The lowest speed was recorded at 52.94km/h. This is a very low value compared with the free flow speed of approximately 90.72km/h. This means that some mitigation measures need to be taken to enable traffic operate more efficiently.
The highest speeds were recorded during the off peak period. During the morning peak period, the highest speed was put at 86.10km/h. This speed is fairly close to the free flow speed of 90.72km/h. Thus the road was found to be performing fairly well during the off peak periods.
In spite of determining the average speed for one day, it can be considered fairly accurate to the daily operation speeds. Spot speeds determined earlier indicate a similar value for the travel speed. The average speed value therefore determined was a fairly correct value
Page 59

PERFOMANCE ANALYSIS OF EASTERN BYPASS 2015
6. CONCLUSION
6.1 CAPACITY AND LEVEL OF SERVICEThe highway capacity manual(HCM2010) puts the design capacity of a two way, two lane rural highway at 3400pcu/h, or 1700pcu/h in each direction. The study established the operational capacity for the peak 15 minute period in passenger-car equivalents to be 2340pcu/h. Therefore it can be established that the Nairobi Eastern Bypass has overshot its design capacity by more than 37%.
The Kenya Roads Board(KRB) website indicates that the Eastern Bypass was designed to operate at level of service B. This study however established that the road is operating at Level of Service E. The road therefore is underperforming.
From the above two parameters determined from the Eastern Bypass, it can be concluded that a lot needs to be done on the road to alleviate the poor performance. Some changes have to be effected on the road to increase the efficiency of the road. Such poor driving conditions also increase the drivers discomfort on the road and may lead to frustrations. This may cause an increase in the rate of accidents as drivers to overtake vehicles.
In the beginning, this study set out to determine the operational capacity as well as the level of service of the Nairobi Eastern Bypass. The necessary measures required to conduct this study were adhered to and the data collected enabled the study to determine the capacity of the road and hence its operational level of service. Therefore the objectives of the study were achieved.
Page 60
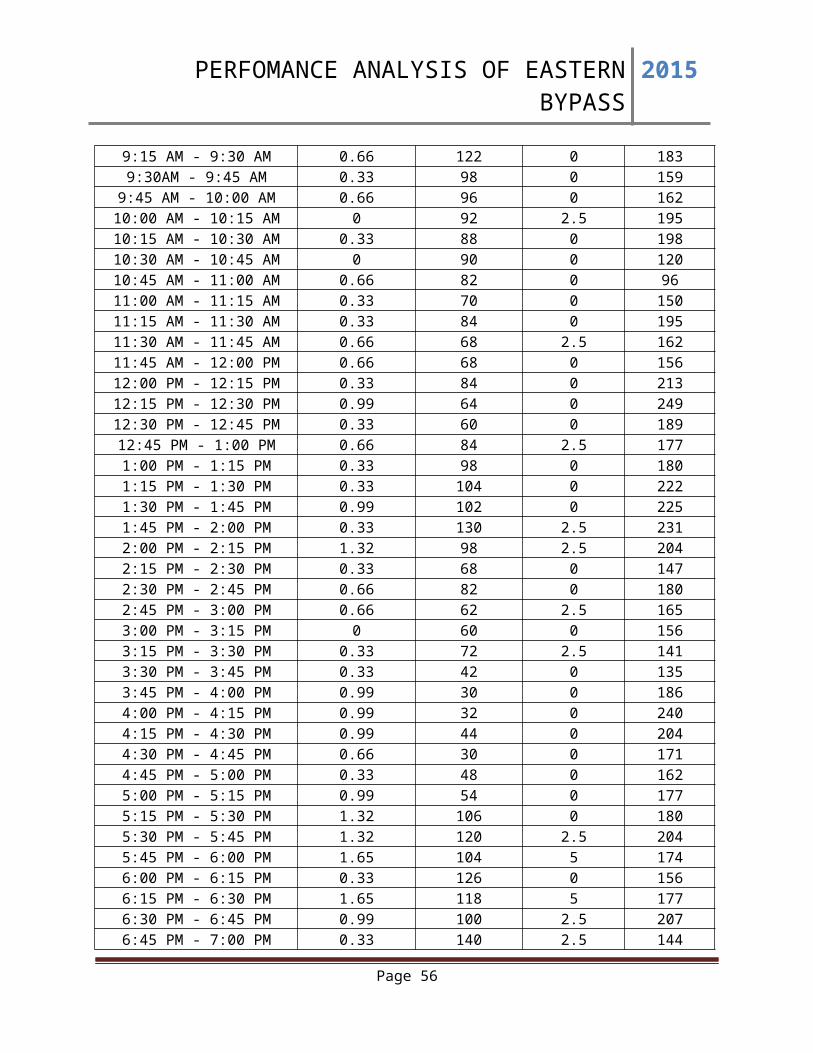
PERFOMANCE ANALYSIS OF EASTERN BYPASS 2015
7. RECOMMENDATIONSImprovement of the operational characteristics of transportation facilities is important for the following benefits:
Reduction in Vehicle Operational Costs,Saving on the time spent on the roads.Reduction in the frequency of accidents
With a high growth rate not only in the population but also in the number of motor vehicles accessing our roads, it is important that an effort be made to improve the efficiency of the existing facilities.
The main challenge along the Nairobi Eastern Bypass was determined to be the high number of vehicles using the road. This is a major challenge especially considering that the road was designed to reduce the traffic in the city center. In terms of redirecting traffic that does not need to access the city center away from it, the road may be considered to have achieved its purpose, since a great number of trucks use the road now. It terms of efficiently performing its mandate, the road may be considered to have failed in this. Therefore a number of mitigative measures need to be undertaken to alleviate this problem.
In this case, there are mainly two mitigative measures that can be taken. These are:
Improving the infrastructureTraffic Management
7.1 IMPROVING THE INFRASTRUCTUREThis basically entails making changes to the road to ensure efficiency of movement of the vehicles. There are several ways of doing this:
Converting the Eastern Bypass into a four lane two way dual carriageway
This would increase the carrying capacity of the road and enable more traffic efficiently use the road. This would also provide the capacity for conversion of one of the lanes into a trucks only lane. It would also give provision for overtaking of the slow trucks.
Provision of passing lanes at regular intervals
Passing lanes could be introduced on the road to facilitate the ability of small vehicles to overtake slow moving trucks. The passing lanes can be introduced at regular intervals on both directions of the road, for example after every three kilometers, 500 meters of passing lane is provided. This would lead to a higher efficiency of the road.
Page 61
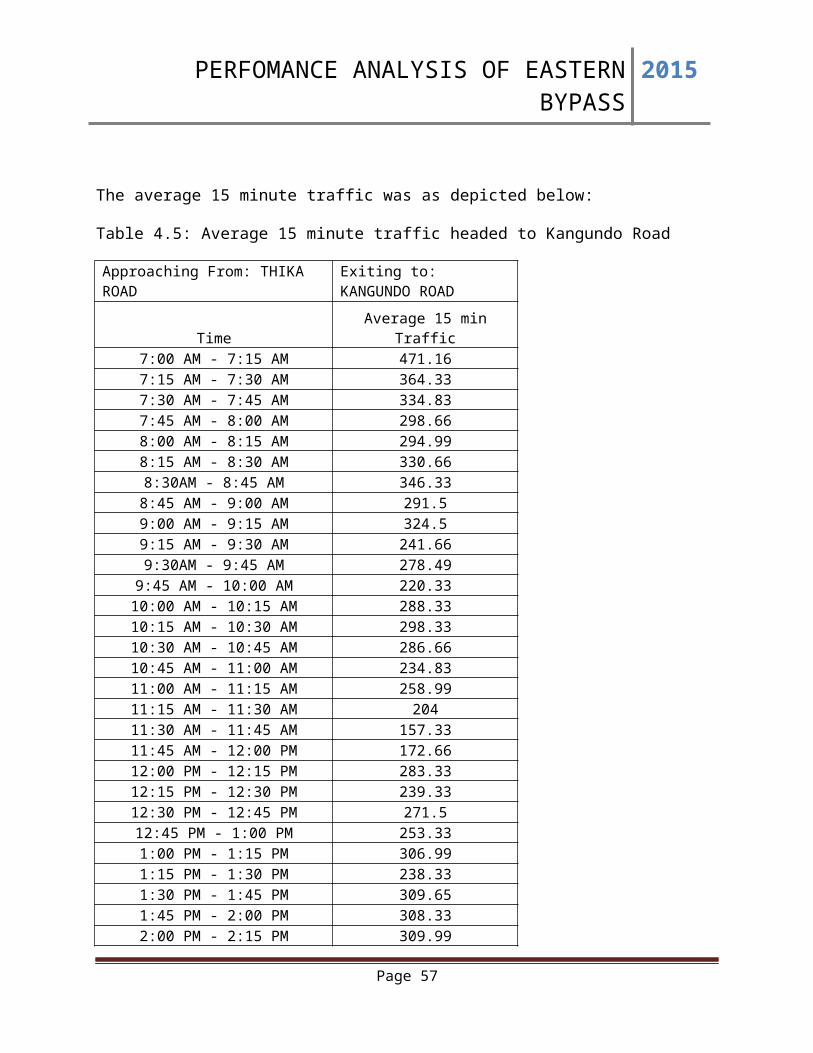
PERFOMANCE ANALYSIS OF EASTERN BYPASS 2015
7.2 TRAFFIC MANAGEMENTThis entails systematically controlling traffic by imposing regulatory measures and enforcing management techniques that make most economic use of the road. Some of the traffic management measures include:
Discouraging use of private vehicles and encouraging use of public transport amenities
This may be a very helpful measure in reducing the number of private vehicles on the road, which comprise the greatest percentage of vehicles on the road. These measures may be enforced by:
Road Pricing This means charging private vehicles a fee for using the road. This would make the number of vehicles accessing the road reduce. The modal shift would change and more people would opt for public means of travel.
Improvement of public transport.The modes of public transport should be improved and made more efficient and timely, so as to entice their use by the public. The public transport vehicles should be made more habitable and timely. They should also be made more affordable to attract their use by the public.
Carpooling This is the sharing of private cars by people living in the same area to and from work to reduce the number of cars on the roads. People using the road to get to the city center in the morning to work and leave in the evening should be encouraged to share their vehicles.
Page 62
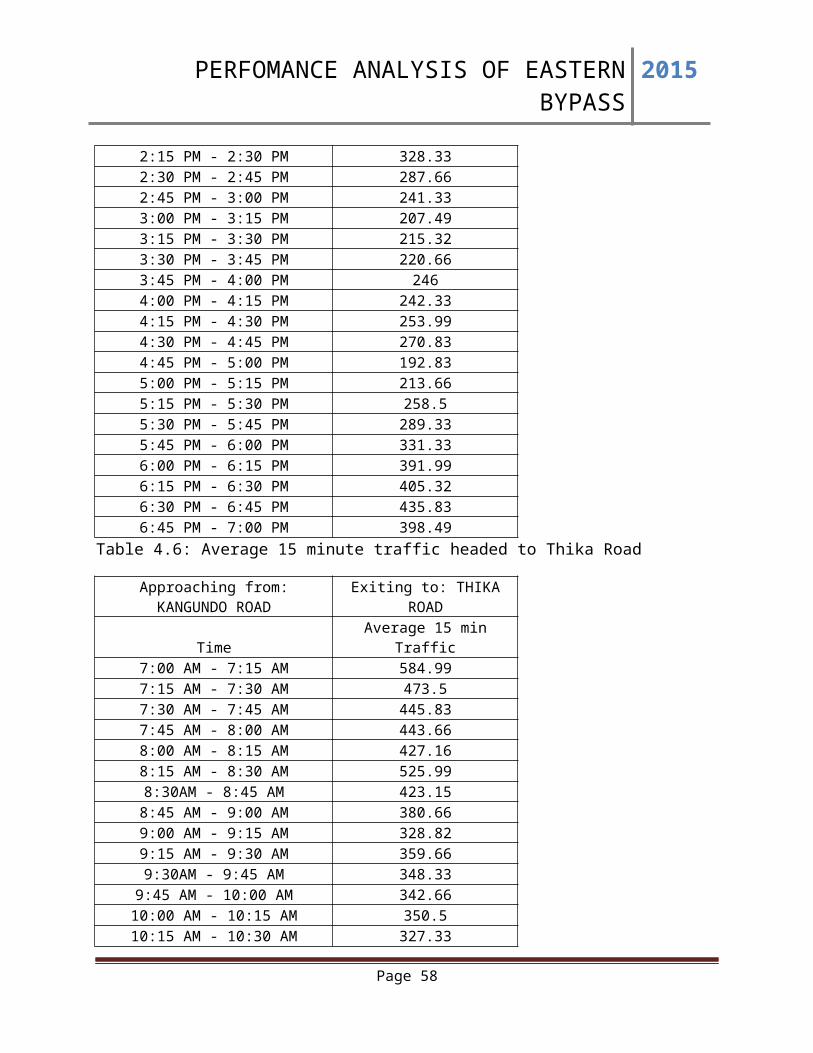
PERFOMANCE ANALYSIS OF EASTERN BYPASS 2015
8. LIST OF REFERENCES1. Kane, Tony. “Opening Session Welcome” in Performance Measures to Improve Transportation Systems: Summary of the Second National Conference. National Academy Press, Washington, D.C., 2005.
2. Federal Highway Administration. Transportation Performance Measures in Australia, Canada, Japan, and New Zealand.US Department of Transportation, Washington, D.C., 2004.
3. Garber, N., & Hoel, L. (2009). The Profession of Transportation. In Traffic And Highway Engineering (4th ed., p. 3). Virginia: Cengage Learning.
4. Traffic Management Guidelines 2003. (2003, January 1). Retrieved October 30, 2014, from http://www.nationaltransport.ie/downloads/archive/traffic_management_guidelines_2003.pdf
5. Highway Capacity Manual 2000
6. Kutz, M. (2004). Handbook of transportation engineering. New York: McGraw-Hill.
7. P.H.Ashford and N.J.Wright, Transportation Engineering (Planning and Design), 3rd Edition, 1985
8. L.R.Kadiyali, Traffic Engineering and Transportation Planning, 1997
9. Factors affecting level of service. (n.d.). Retrieved November 11, 2014.
10. Source: Forbes, G. (n.d.). Urban Roadway Classification. Retrieved January 29, 2015, from http://contextsensitivesolutions.org/content/reading/urban-roadway-2/resources/3961-tg-forbes-urban-road-classes.pdf/
11. Kenya Roads Board - Road Network Classification. (n.d.). Retrieved February 3, 2015, from http://www.krb.go.ke/road-network/classification.html
12. http://www.standardmedia.co.ke/lifestyle/article/2000097080/investors-cash-in-on-bypasses
13. http://www.standardmedia.co.ke/lifestyle/article/2000097080/investors-cash-in-on-bypasses?pageNo=2
14. Currin, T. R. 2001. Turning Movement Counts. In Introduction to Traffic Engineering: A Manual for Data Collection and Analysis, ed. B.Stenquist. Stamford, Conn.: Wadsworth Group, pp. 13–23
Page 63
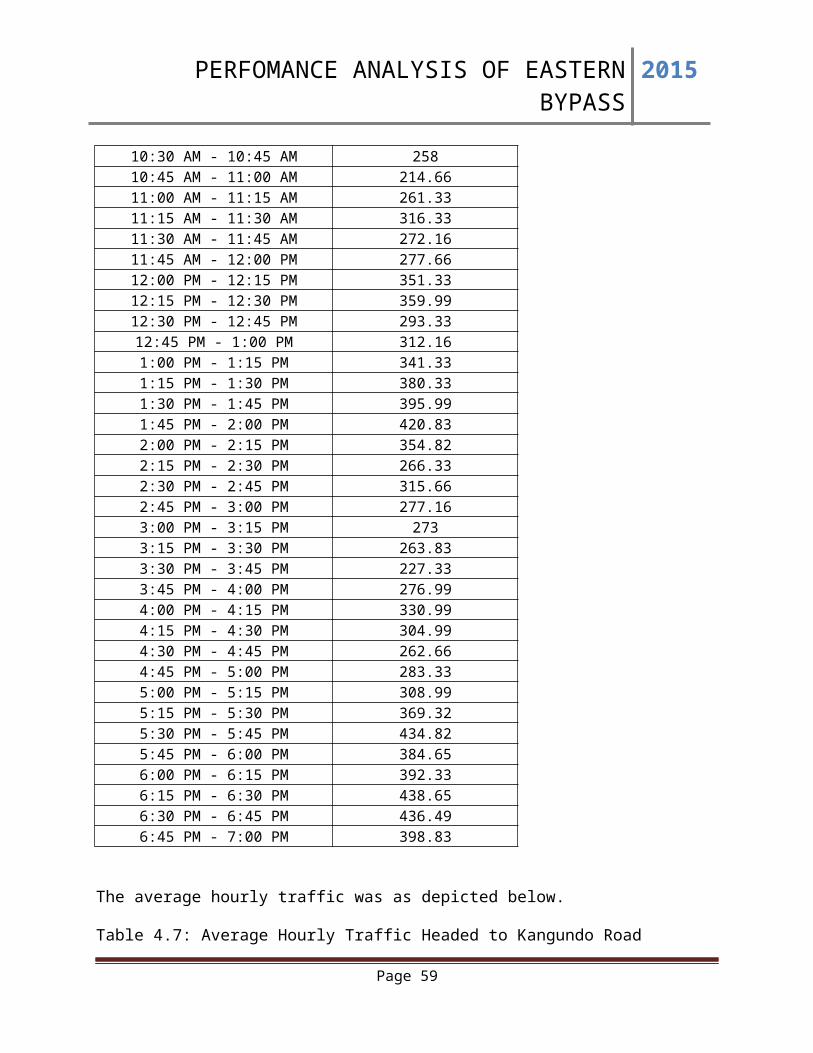
PERFOMANCE ANALYSIS OF EASTERN BYPASS 2015
9. APPENDICES
1. Map showing Mlolongo Truck Overnight Stop.
Page 64

PERFOMANCE ANALYSIS OF EASTERN BYPASS 2015
2. Photo showing some of the data collectors
Page 65

PERFOMANCE ANALYSIS OF EASTERN BYPASS 2015
3. Photo showing a shockwave caused by a slow moving truck
Page 66