Embed Size (px)
Citation preview
Performance Analysis and Tuning in Windows HPC Server 2008
Xavier Pillons Program Manager
Microsoft Corp. [email protected]
Introduction
• How to monitor performance on Windows ?
• What to look for ?
• How to tune the system ?
• How to trace MS-MPI ?

MEASURING PERFORMANCES
Performance Analysis
• Cluster wide
– Built in Diagnostics
– The Heatmap
• Local
– Perfmon
– xperf
Built-in Network Diagnostics
• MPI Ping-Pong (mpipingpong.exe) – Launchable via HPC Admin Console Diagnostics
• Pro’s: Easy, Data is auto-stored for historical comparison • Con’s: No choice of network, no intermediate results
– Launchable via command line
• Command Line Features – Tournament mode, ring mode, serial mode – Output progress to xml, stderr, stdout – Histogram, per-node, and per-cluster data – Test throughput / latency or both
• Remember: Usually you want only1 rank per node
• Additional diagnostics and extensibility in v3
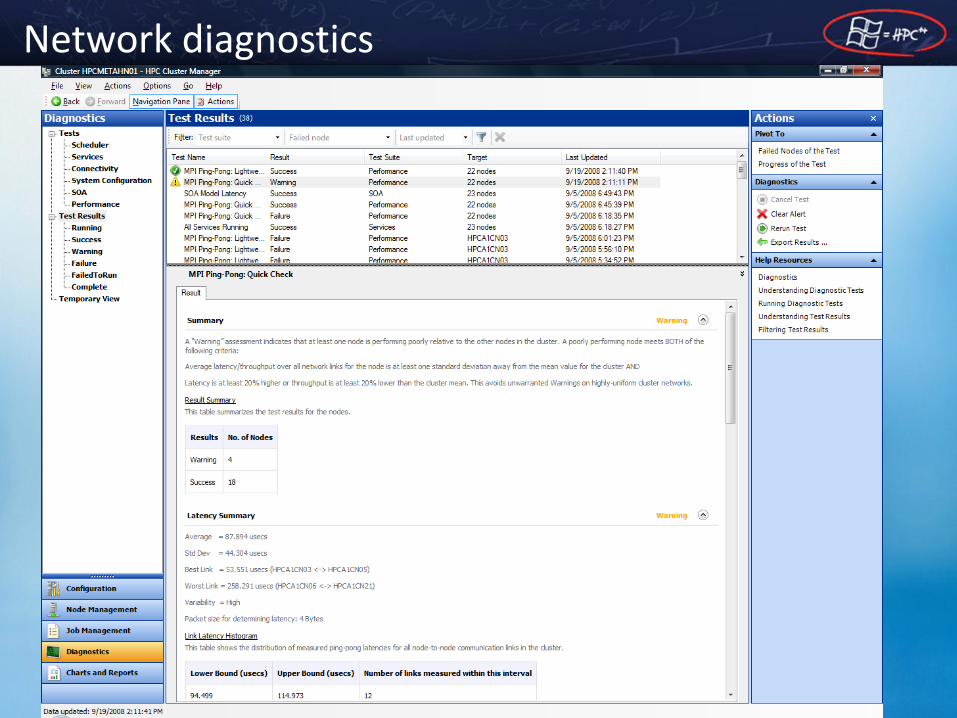
Network diagnostics

Basic Network Troubleshooting
• Know Expected Bandwidths and Latencies
• Make sure drivers and firmware are up to date
• Use the product diagnostics to confirm – Or Pallas Pingpong, etc.
Network Bandwidth Latency
IB QDR (ConnectX PCI-E 2.0) 2400MB/s 2µs
IB DDR (ConnectX PCI-E 2.0) 1500MB/s 2µs
IB DDR (ConnectX PCI-E 1.0) 1400MB/s 2.8µs
IB DDR / ND 1400MB/s 5µs
IB SDR /ND 950MB/s 6µs
IB / IPoIB 200-400MB/s 30µs
Gige 105MB/s 40-70µs
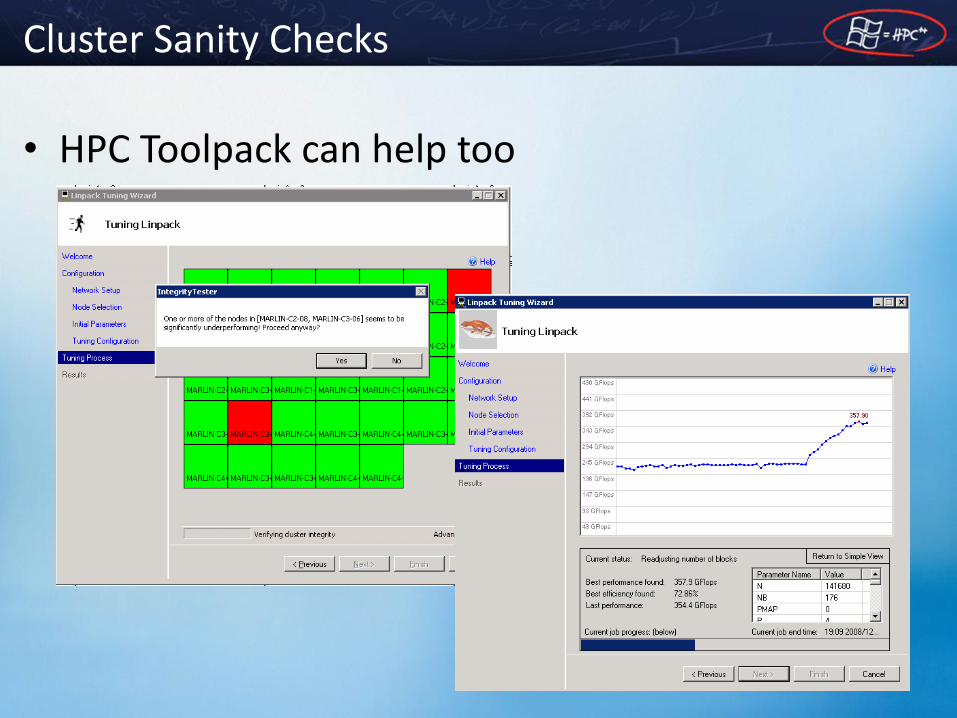
Cluster Sanity Checks
• HPC Toolpack can help too
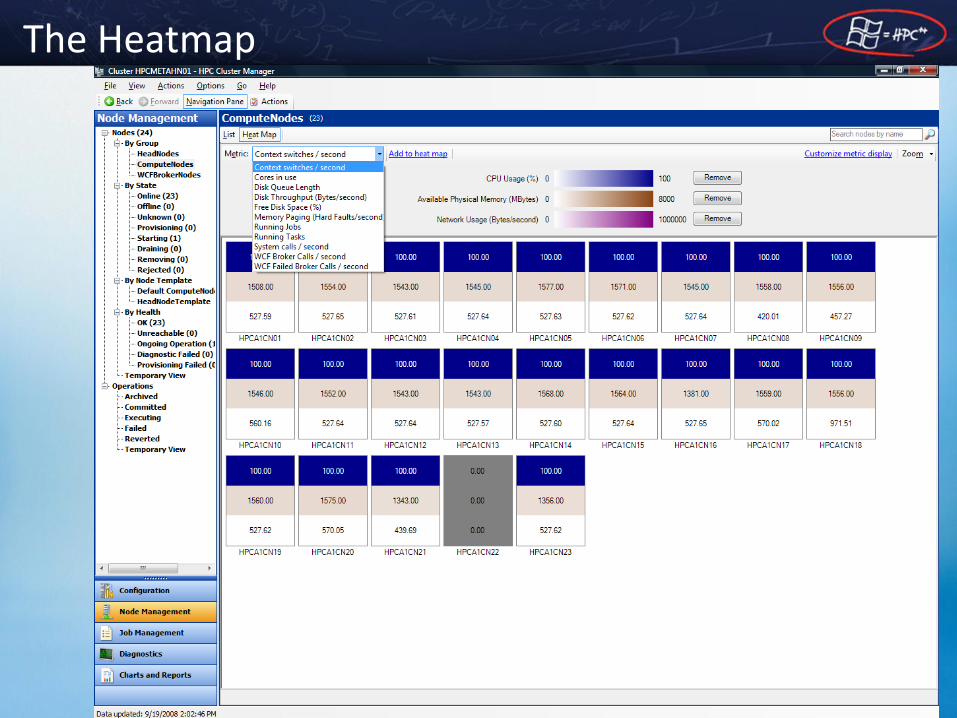
The Heatmap

Basic Tools - Perfmon
Counter Tolerance Used For
Processor /%CPU time 95% User mode bottleneck
Processor / %Kernel Time 10% Kernel issues
Processor / %DPC time 5% RSS, Affinity
Processor / %Interrupt Time 5% Misbehaving drivers
Network / Output Queue Length 1 Network bottleneck
Disk / Average Queue Length 1 / platter Disk bottleneck
Memory / Pages Per Sec 1 Hard Faults
System/ Context Switches per sec 20,000 Locks, wasting processing
System / system calls per sec 100,000 Excessive transitions
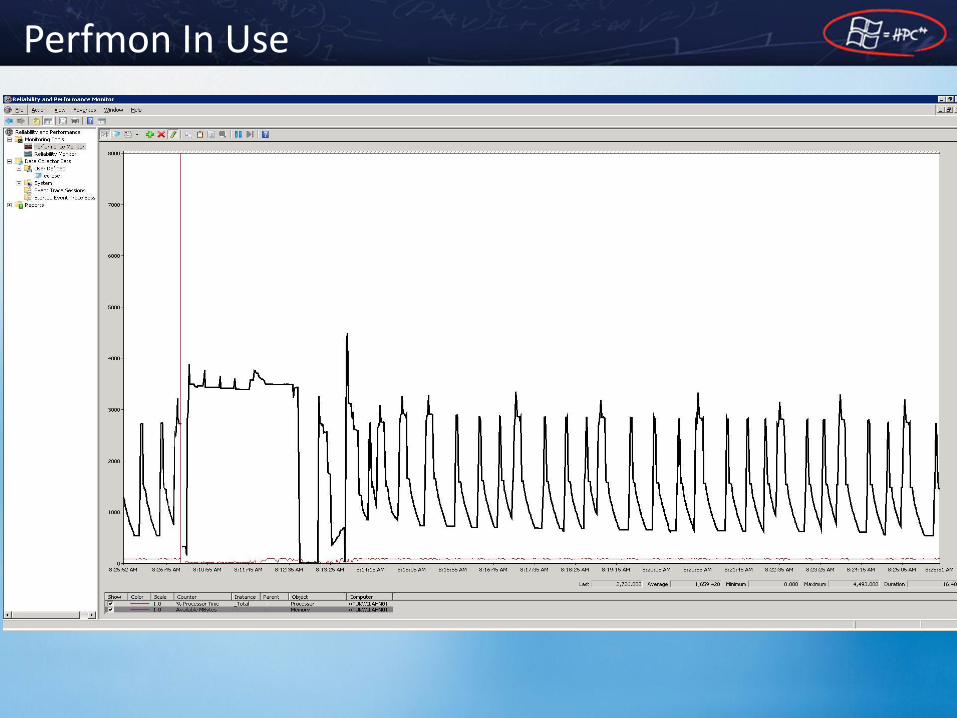
Perfmon In Use
Windows Performance Toolkit
• Official performance analysis tools from Windows – Used to optimize Windows itself
• Wide support range – Cross platform: Vista, Server 2008/R2, Win7
– Cross architecture: x86, x64, ia64
• Very low overhead – live capture on production systems – Less than 2 % processor overhead for a sustained rate of 10,000
events/second on a 2GHz processor
• The only tool that lets you correlate most of the fundamental system activity – All processes and threads, both user and kernel mode
– DPCs and ISRs, thread scheduling, disk and file I/O, memory usage, graphics subsystem, etc.
• Available externally: part of Windows 7 SDK – http://www.microsoft.com/whdc/system/sysperf/perftools.mspx

Performance Analysis

TUNING
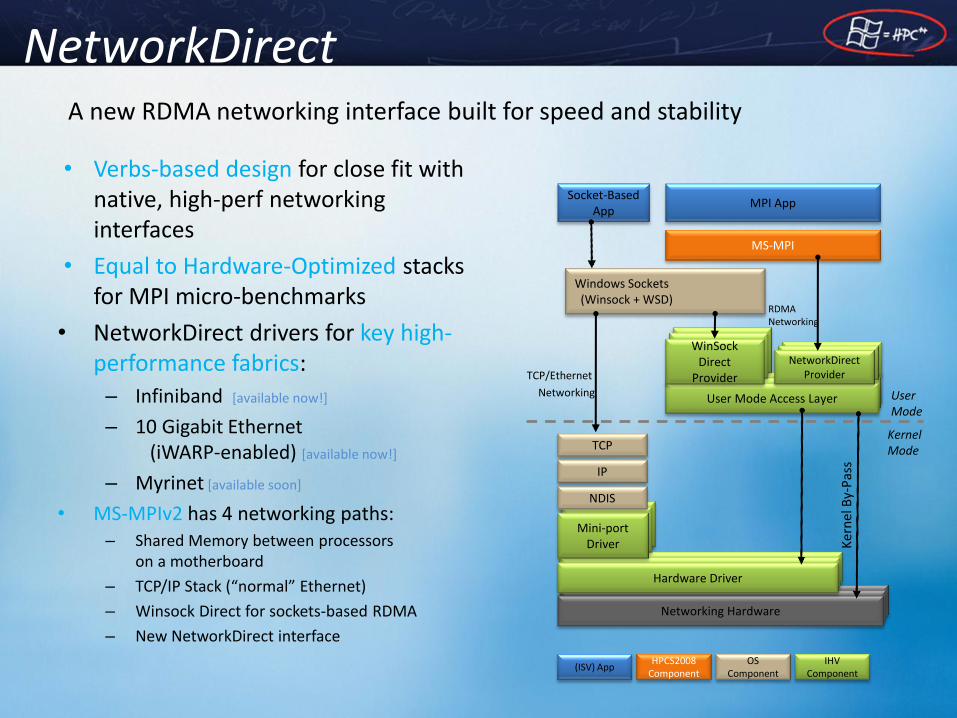
NetworkDirect
• Verbs-based design for close fit with native, high-perf networking interfaces
• Equal to Hardware-Optimized stacks for MPI micro-benchmarks
• NetworkDirect drivers for key high-performance fabrics:
– Infiniband [available now!]
– 10 Gigabit Ethernet (iWARP-enabled) [available now!]
– Myrinet [available soon]
• MS-MPIv2 has 4 networking paths: – Shared Memory between processors
on a motherboard
– TCP/IP Stack (“normal” Ethernet)
– Winsock Direct for sockets-based RDMA
– New NetworkDirect interface
User Mode
Kernel Mode
TCP/Ethernet
Networking
Ke
rnel
By-
Pas
s
MPI App Socket-Based
App
MS-MPI
Windows Sockets (Winsock + WSD)
Networking Hardware Networking Hardware Networking Hardware
Networking Hardware Networking Hardware Hardware Driver
Networking Hardware
Networking Hardware Mini-port
Driver
TCP
NDIS
IP
Networking Hardware Networking Hardware User Mode Access Layer
Networking Hardware
Networking Hardware
WinSock Direct
Provider
Networking Hardware
Networking Hardware
NetworkDirect Provider
RDMA Networking
OS Component
HPCS2008 Component
IHV Component
(ISV) App
A new RDMA networking interface built for speed and stability

MS-MPI Fine tuning
• Lots of MPI parameters (mpiexec –help3) :
– MPICH_PROGRESS_SPIN_LIMIT
• 0 is adaptive, otherwise 1-64K
– SHM / SOCK / ND eager limit
• Switchover point for eager / rendezvous behaviour
– ND ZCOPY threshold
• Sets the switchover point between bcopy and zcopy
– Buffer-reuse and registration cost affect this ( registration ~= 32K bcopy )
– Affinity
• Definitely used for NUMA systems

Reducing OS Jitter
• Track Hard Fault with xperf
– Disable non used services (up to 42+)
– Delete Windows scheduled tasks
– Change GP update interval (90mn by default)

Tuning Memory Access
• Effective memory use is rule #1
• Processor Affinity is key here
• Need to know the Processor architecture
• Use STREAM to measure memory bandwidth
GigE
Blade Chassis
8-core
servers
InfiniBand
16-core
servers32-core
servers
InfiniBandInfiniBand
GigE
10 GigE
10 GigE
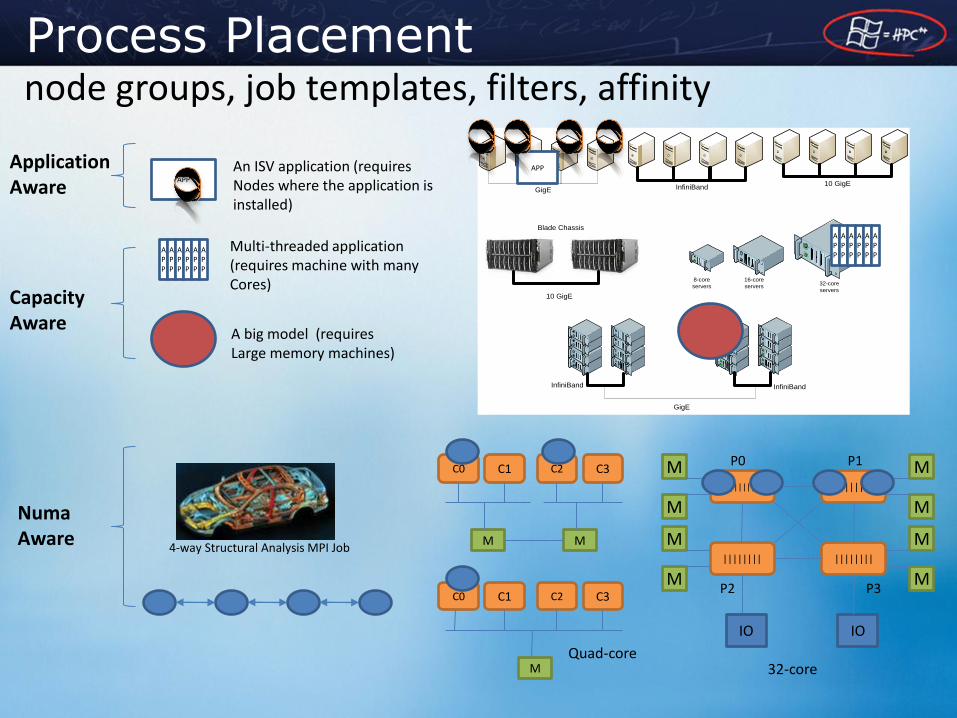
A big model (requires Large memory machines)
An ISV application (requires Nodes where the application is installed)
APP
C0 C1
M
C2 C3
M
Quad-core
C0 C1
M
C2 C3
|||||||| ||||||||
|||||||| ||||||||
M
M
M
M
M
M
M
M
P0 P1
P2 P3
32-core
IO IO
4-way Structural Analysis MPI Job
APP
APP
APP
APP
APP
APP
Multi-threaded application (requires machine with many Cores)
APP
Numa Aware
Capacity Aware
Application Aware
node groups, job templates, filters, affinity Process Placement
APP
APP
APP
APP
APP
APP
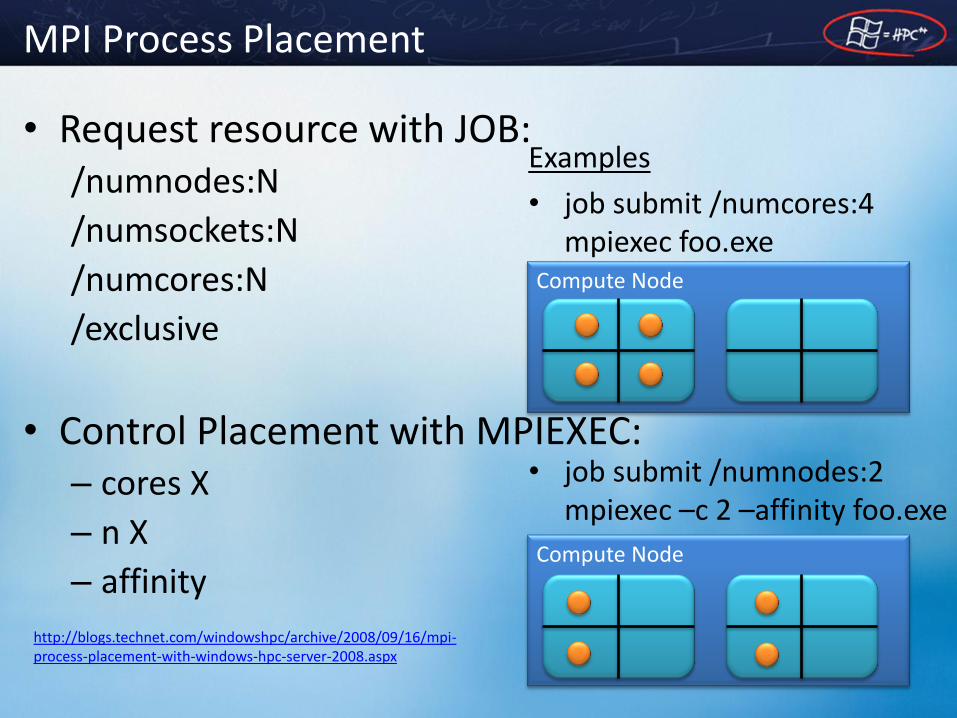
MPI Process Placement
• Request resource with JOB: /numnodes:N
/numsockets:N
/numcores:N
/exclusive
• Control Placement with MPIEXEC: – cores X
– n X
– affinity
Examples
• job submit /numcores:4 mpiexec foo.exe
• job submit /numnodes:2 mpiexec –c 2 –affinity foo.exe
Compute Node
Compute Node
http://blogs.technet.com/windowshpc/archive/2008/09/16/mpi-process-placement-with-windows-hpc-server-2008.aspx
Force Affinity
• mpiexec -affinity
• start /wait /b /affinity <mask> app.exe
• Windows API
– SetProcessAffinityMask
– SetThreadAffinityMask
• With task manager or procexp.exe
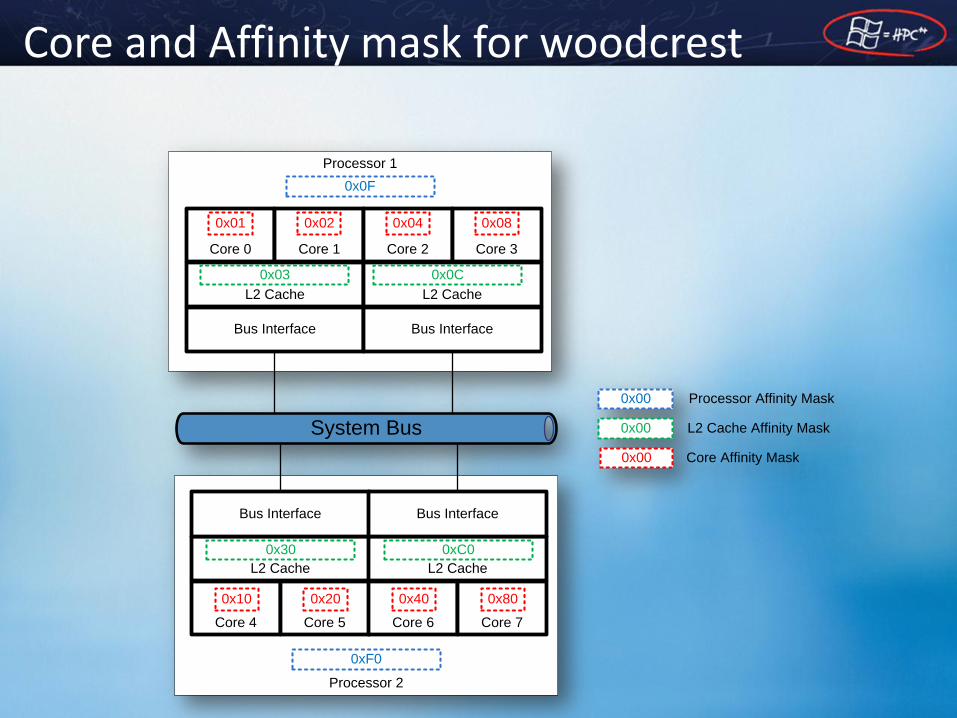
Core and Affinity mask for woodcrest
Processor 2
Processor 1
Core 0 Core 1
L2 Cache
Core 2 Core 3
L2 Cache
System Bus
Bus Interface Bus Interface
0x01 0x02 0x04 0x08
0x03 0x0C
0x0F
0x00
0x00
0x00
Processor Affinity Mask
L2 Cache Affinity Mask
Core Affinity Mask
Core 4 Core 5
L2 Cache
Core 6 Core 7
L2 Cache
Bus Interface Bus Interface
0x10 0x20 0x40 0x80
0x30 0xC0
0xF0
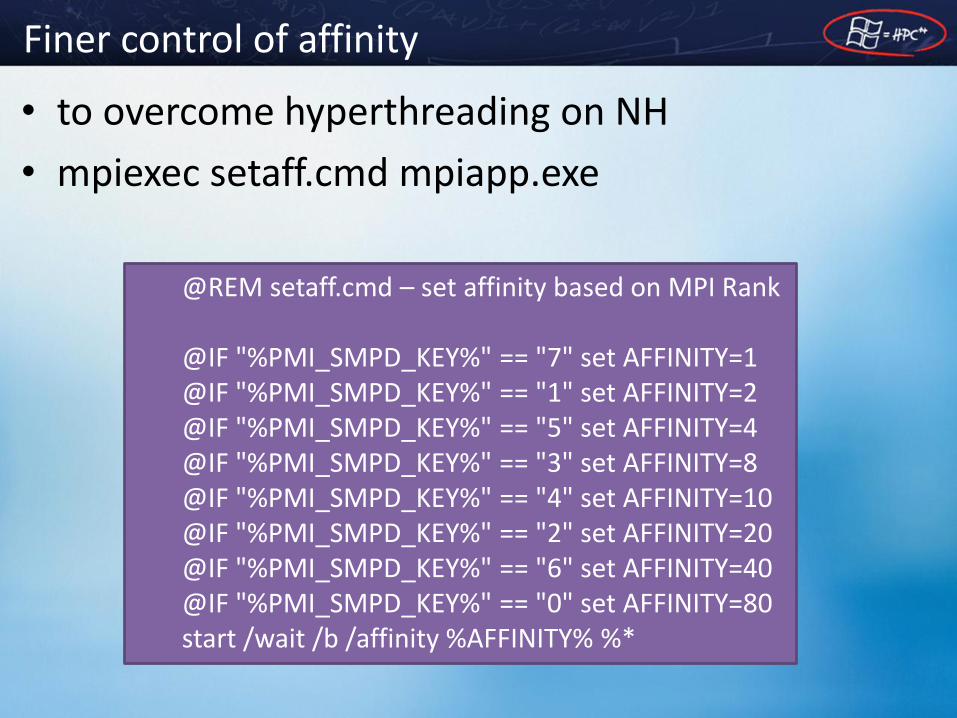
Finer control of affinity
• to overcome hyperthreading on NH
• mpiexec setaff.cmd mpiapp.exe
@REM setaff.cmd – set affinity based on MPI Rank @IF "%PMI_SMPD_KEY%" == "7" set AFFINITY=1 @IF "%PMI_SMPD_KEY%" == "1" set AFFINITY=2 @IF "%PMI_SMPD_KEY%" == "5" set AFFINITY=4 @IF "%PMI_SMPD_KEY%" == "3" set AFFINITY=8 @IF "%PMI_SMPD_KEY%" == "4" set AFFINITY=10 @IF "%PMI_SMPD_KEY%" == "2" set AFFINITY=20 @IF "%PMI_SMPD_KEY%" == "6" set AFFINITY=40 @IF "%PMI_SMPD_KEY%" == "0" set AFFINITY=80 start /wait /b /affinity %AFFINITY% %*

MS-MPI TRACING

Devs can't tune what they can't see
• MS-MPI Tracing: Single, time-correlated log of MPI Events on All Nodes
• Dual purpose:
– Performance Analysis
– Application Trouble-Shooting
• Trace Data Display
– VAMPIR (TU Dresden)
– Intel Trace Analyzer
– MPICH Jumpshot (Argonne NL)
– Windows ETW tools
– Text

MS-MPI Tracing Overview
• MS-MPI includes “Built-In” Tracing – Low Overhead – Based on Event Tracing for Windows (ETW) – No need to recompile your application
• Three Step Process – Trace: mpiexec –trace [event category] MyApp.exe – Sync: clocks across nodes (mpicsync.exe) – Convert: to Viewing format
• Explained in excruciating detail in: “Tracing MPI Apps with Windows HPC Server 2008”
• Traces can also be triggered via any ETW mechanism (Xperf, etc.)
Step 1 – Tracing and filtering
• mpiexec -trace MyApp.exe
• mpiexec -trace (PT2PT,ICND) MyApp.exe
– PT2PT : Point to point communication
– ICND : Network Direct Interconnect Communication
– These event groups are defined in the file mpitrace.mof which resides in the %CCP_HOME%\bin\ folder
• log files written on each node in %userprofile%
– mpi_trace_{JobID}.{TaskID}.{TaskInstanceID}.etl
• Trace filename can be overriden with –tracefile argument
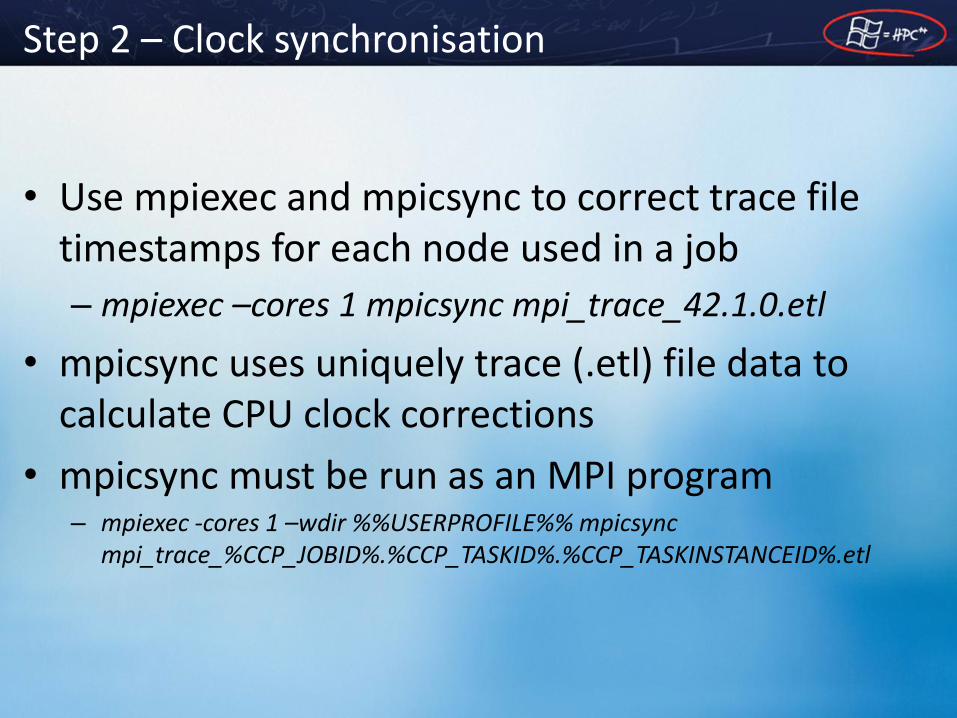
Step 2 – Clock synchronisation
• Use mpiexec and mpicsync to correct trace file timestamps for each node used in a job
– mpiexec –cores 1 mpicsync mpi_trace_42.1.0.etl
• mpicsync uses uniquely trace (.etl) file data to calculate CPU clock corrections
• mpicsync must be run as an MPI program – mpiexec -cores 1 –wdir %%USERPROFILE%% mpicsync
mpi_trace_%CCP_JOBID%.%CCP_TASKID%.%CCP_TASKINSTANCEID%.etl
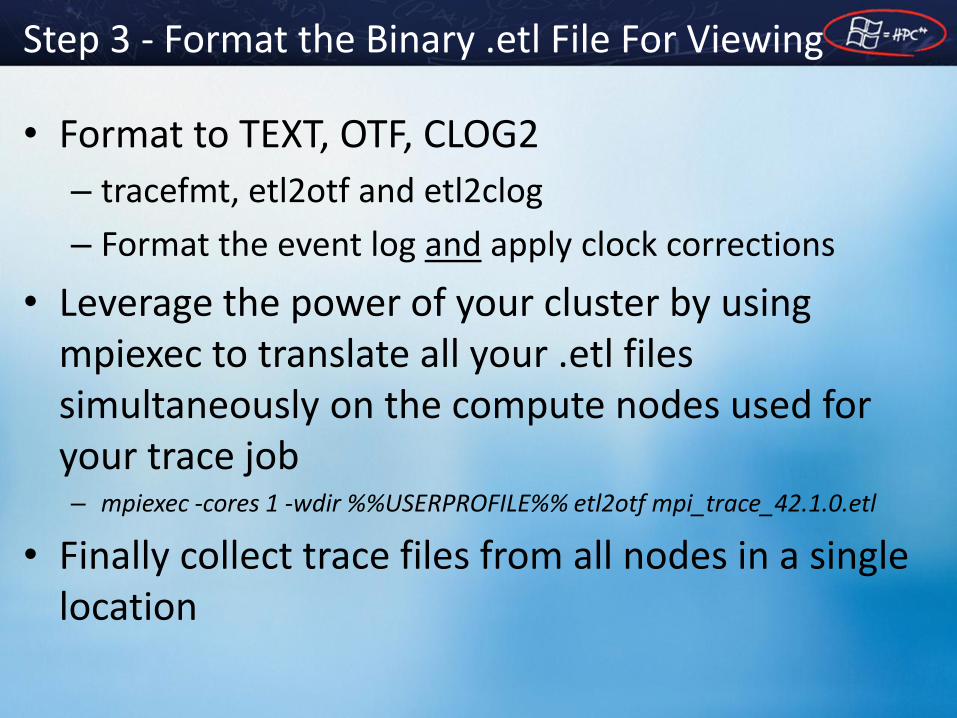
Step 3 - Format the Binary .etl File For Viewing
• Format to TEXT, OTF, CLOG2
– tracefmt, etl2otf and etl2clog
– Format the event log and apply clock corrections
• Leverage the power of your cluster by using mpiexec to translate all your .etl files simultaneously on the compute nodes used for your trace job – mpiexec -cores 1 -wdir %%USERPROFILE%% etl2otf mpi_trace_42.1.0.etl
• Finally collect trace files from all nodes in a single location
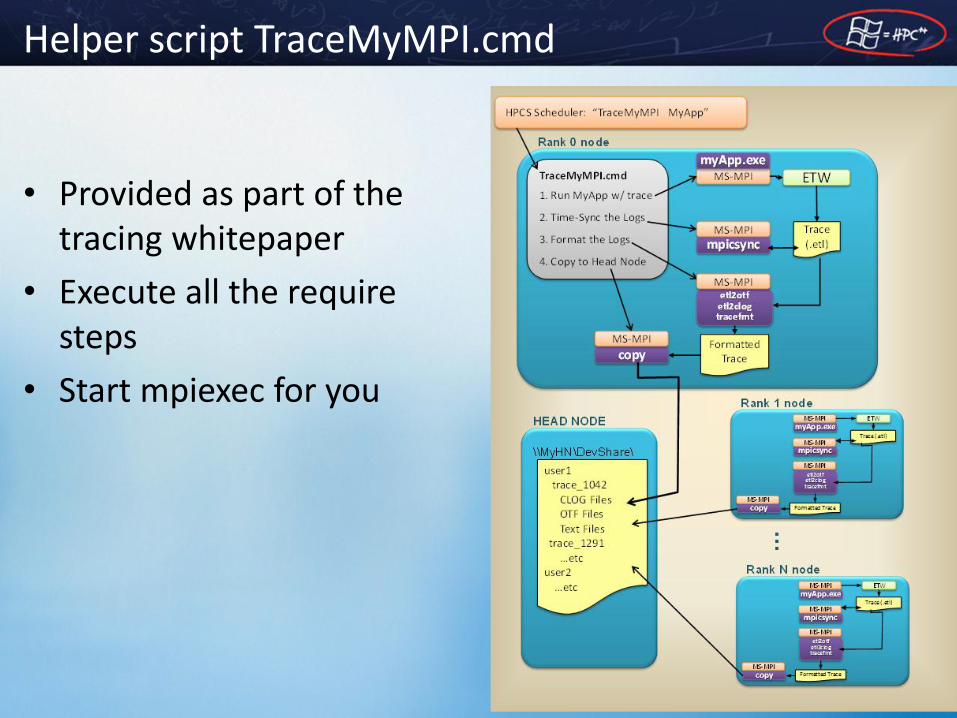
Helper script TraceMyMPI.cmd
• Provided as part of the tracing whitepaper
• Execute all the require steps
• Start mpiexec for you

MS-MPI Tracing and viewing

QUESTIONS ?
Resources
• The windows performance toolkit is here
– http://www.microsoft.com/whdc/system/sysperf/perftools.mspx
• Windows Internals series is very good
• Basic windows server tuning is here
– http://www.microsoft.com/whdc/system/sysperf/Perf_tun_srv.mspx
• Process Affinity in HPC Server 2008 SP1
– http://blogs.technet.com/windowshpc/archive/2009/10/01/process-affinity-and-windows-hpc-server-2008-sp1.aspx


![Microsoft SQL Server Query Tuning - Meetupfiles.meetup.com/1381968/Microsoft SQL Server Query...Microsoft PowerPoint - Microsoft SQL Server Query Tuning [Compatibility Mode] Author](https://img.pdfslide.net/doc/110x75/5ad9c9447f8b9afc0f8b9e56/microsoft-sql-server-query-tuning-sql-server-querymicrosoft-powerpoint-microsoft.jpg)