Embed Size (px)
Citation preview

Performance Analysis and Tuning – Part 1
D. John Shakshober (Shak) - Sr Consulting Eng / Director Performance Engineering
Larry Woodman - Senior Consulting Engineer / Kernel VM
Jeremy Eder – Senior Principal Performance Engineer / Network/Atomic
Joe Mario - Senior Principal Performance Engineer / RHEL / NUMA

Agenda: Performance Analysis Tuning Part I
• Part I
• RHEL Evolution 5->6->7 – Hybrid Clouds Atomic / OSE / RHOP
• NonUniform Memory Access (NUMA)
• What is NUMA, RHEL Architecture, Auto-NUMA-Balance• Cgroups cpuset, memory, network and IO
• Use to prevent IO from consuming 95% of memory• Used by RHEV w/ KVM and OSE w/ Atomic
• System Performance/Tools
• Tuned, Perf, and Tuna
•“Meet The Experts” - 5:45-7 PM Free - Soda/Beer/Wine
RHEL6Transparent HugePage
Tuned – choose profile
CPU Affinity (ts/numactl)
NUMAD – uerspace tool
Cgroups -
irqbalance – NUMA enhanced
RHEL5Static Hugepages
Ktune – on/off
CPU Affinity (taskset)
NUMA Pinning (numactl)
Irqbalance
RH Cloud Suites
RHEV – out-of-the-box
virt-host/guest
RHEL OSP – blueprints
Tuned, Numa pining NIC – jumbo sriov
RHEL Atomic Host/Atomic Enterprise
RH OpenShift v3
Cloud Forms
Red Hat Enterprise Linux Performance Evolution
RHEL7Transparent Hugepages
Tuned – throughput-performance (default)
CPU Affinity (ts/numactl)
Autonuma-Balance
LXC – Container/Docker
irqbalance – NUMA enhanced
Red Hat Confidential
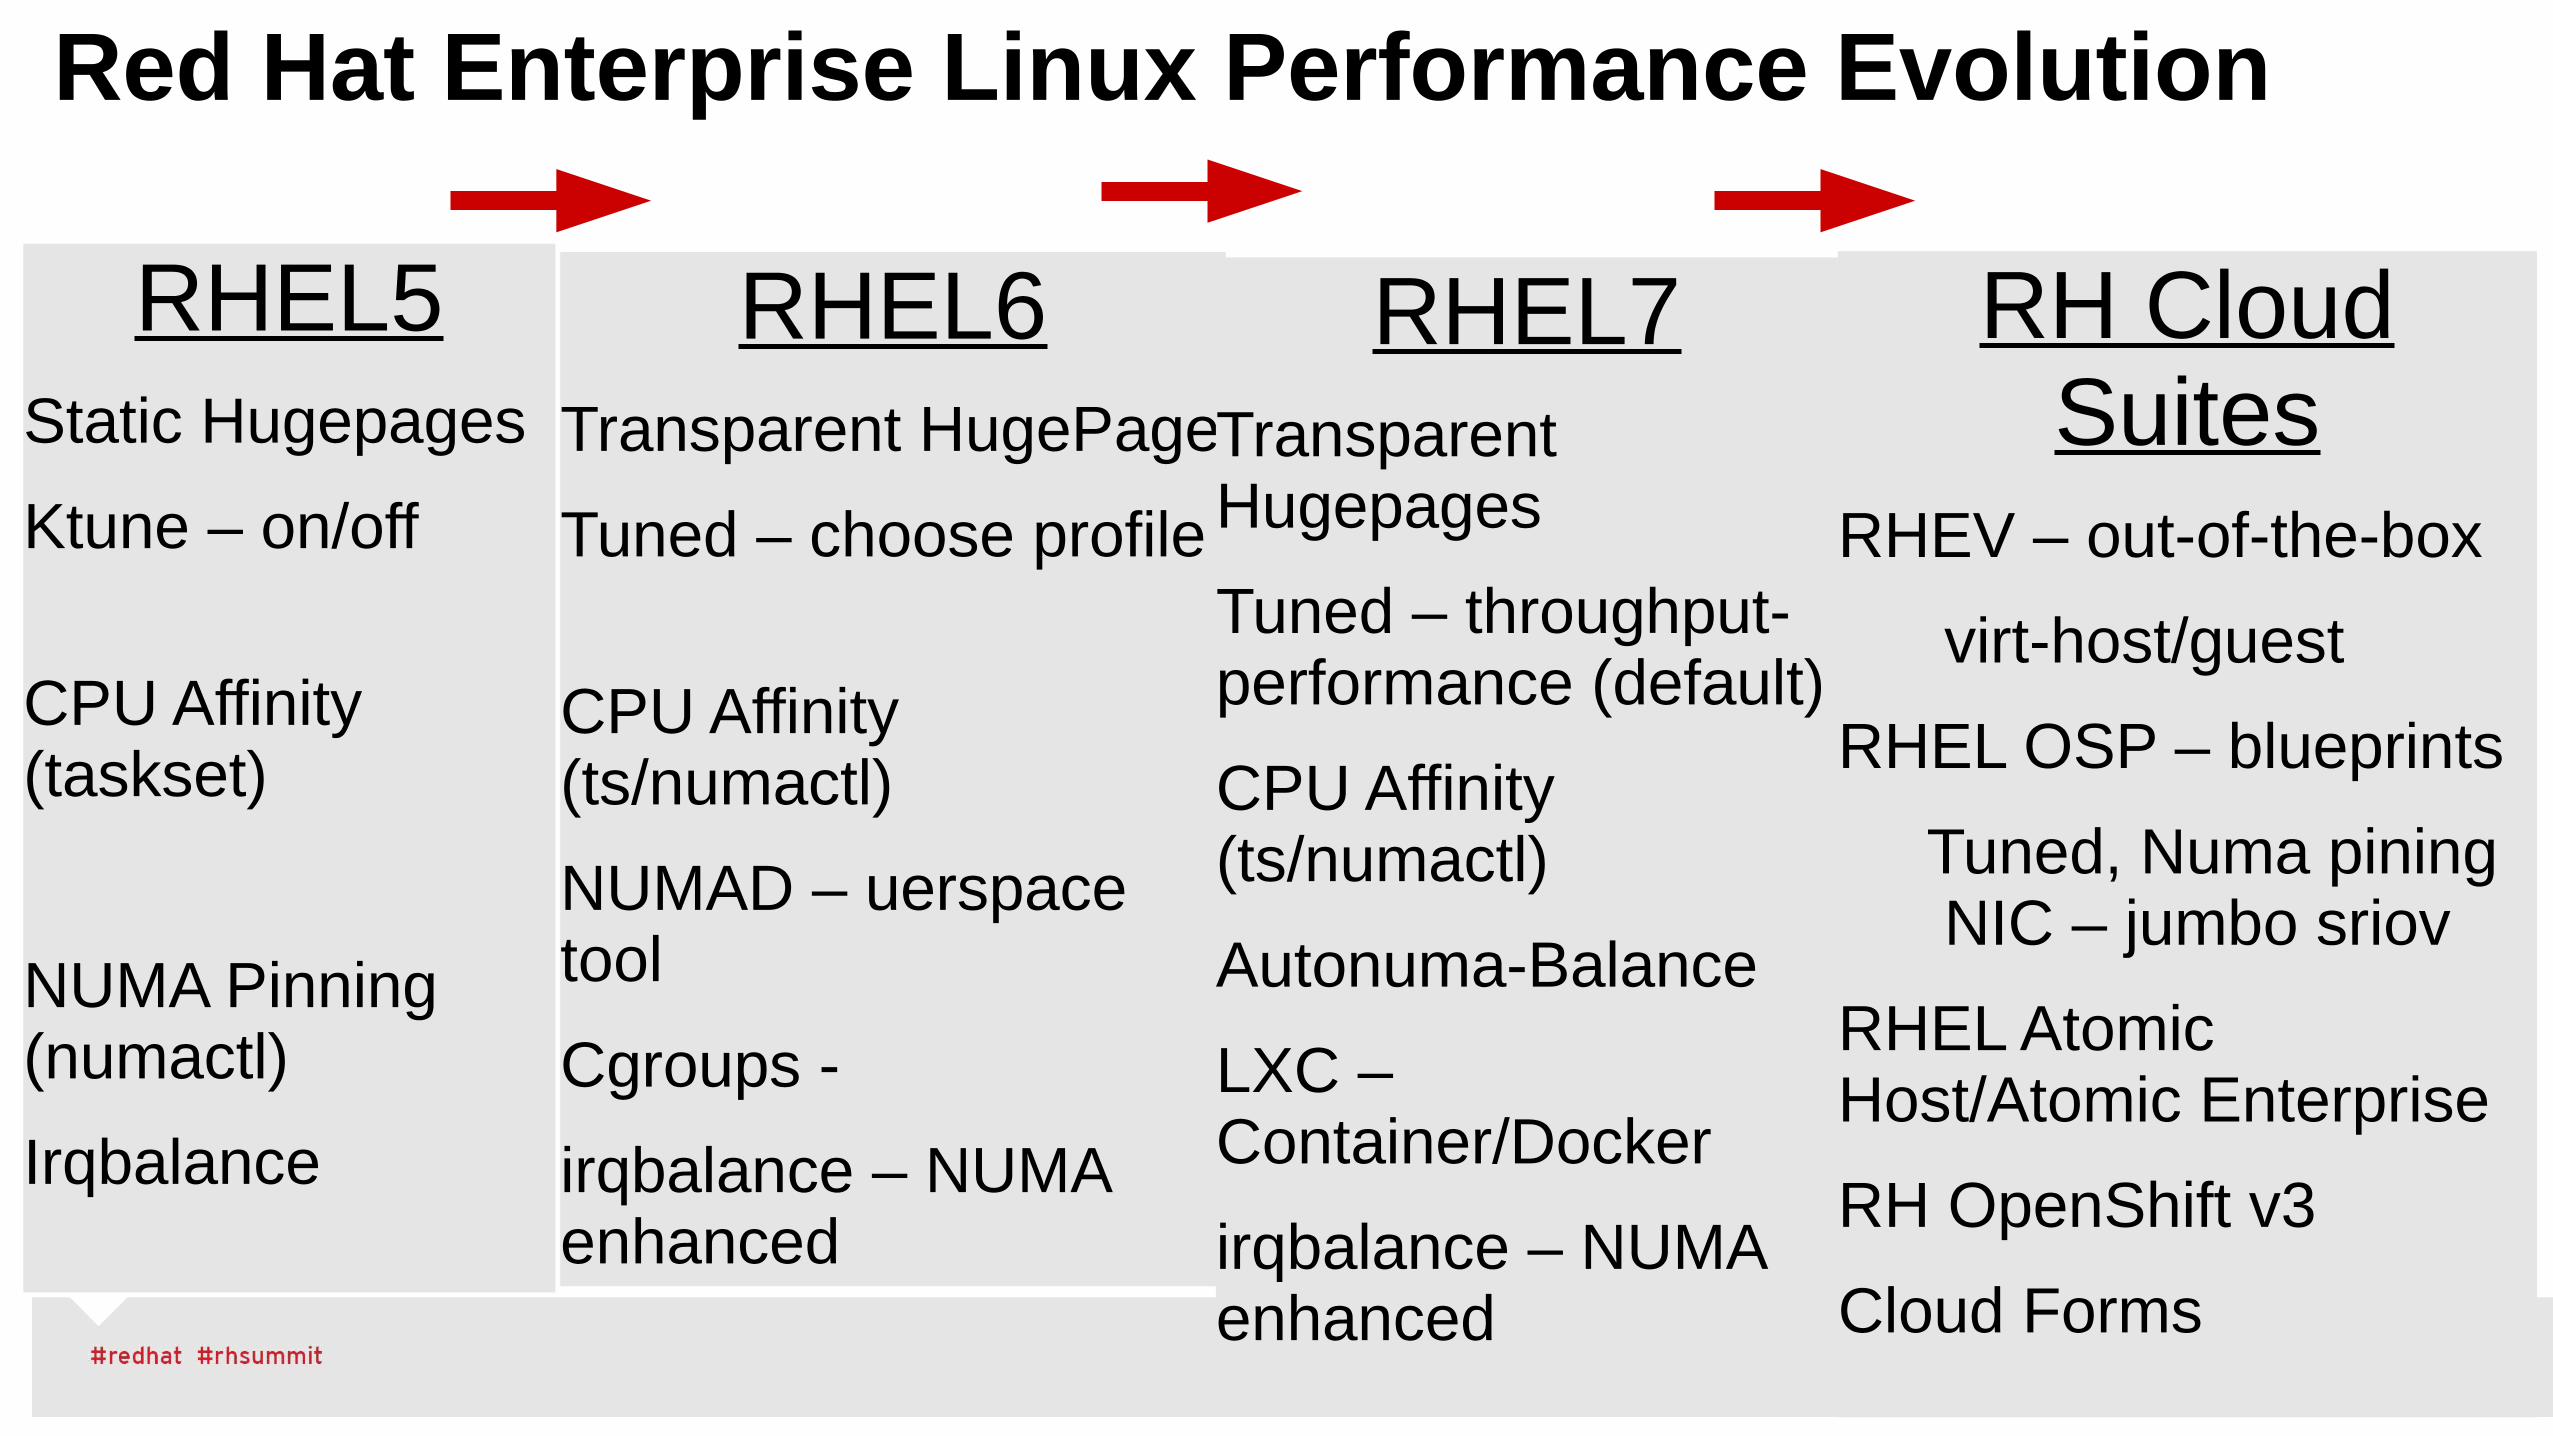
Benchmarks – code path coverage
● CPU – linpack, lmbench
● Memory – lmbench, McCalpin STREAM
● Disk IO – iozone, fio – SCSI, FC, iSCSI
● Filesystems – iozone, ext3/4, xfs, gfs2, gluster
● Networks – netperf – 10/40Gbit, Infiniband/RoCE, Bypass
● Bare Metal, RHEL6/7 KVM, Atomic Containers
● White box AMD/Intel, with our OEM partners
Application Performance
● Linpack MPI, HPC workloads
● AIM 7 – shared, filesystem, db, compute
● Database: DB2, Oracle 11/12, Sybase 15.x , MySQL, MariaDB, Postgrs, MongoDB
● OLTP – TPC-C, TPC-VMS
● DSS – TPC-H/xDS
● Big Data – TPCx-HS, Bigbench
● SPEC cpu, jbb, sfs, virt, cloud
● SAP – SLCS, SD
● STAC = FSI (STAC-N)
● SAS mixed Analytic, SAS grid (gfs2)
RHEL Performance Workload Coverage (bare metal, KVM virt w/ RHEV and/or OSP, LXC Kube/OSEand Industry Standard Benchmarks)
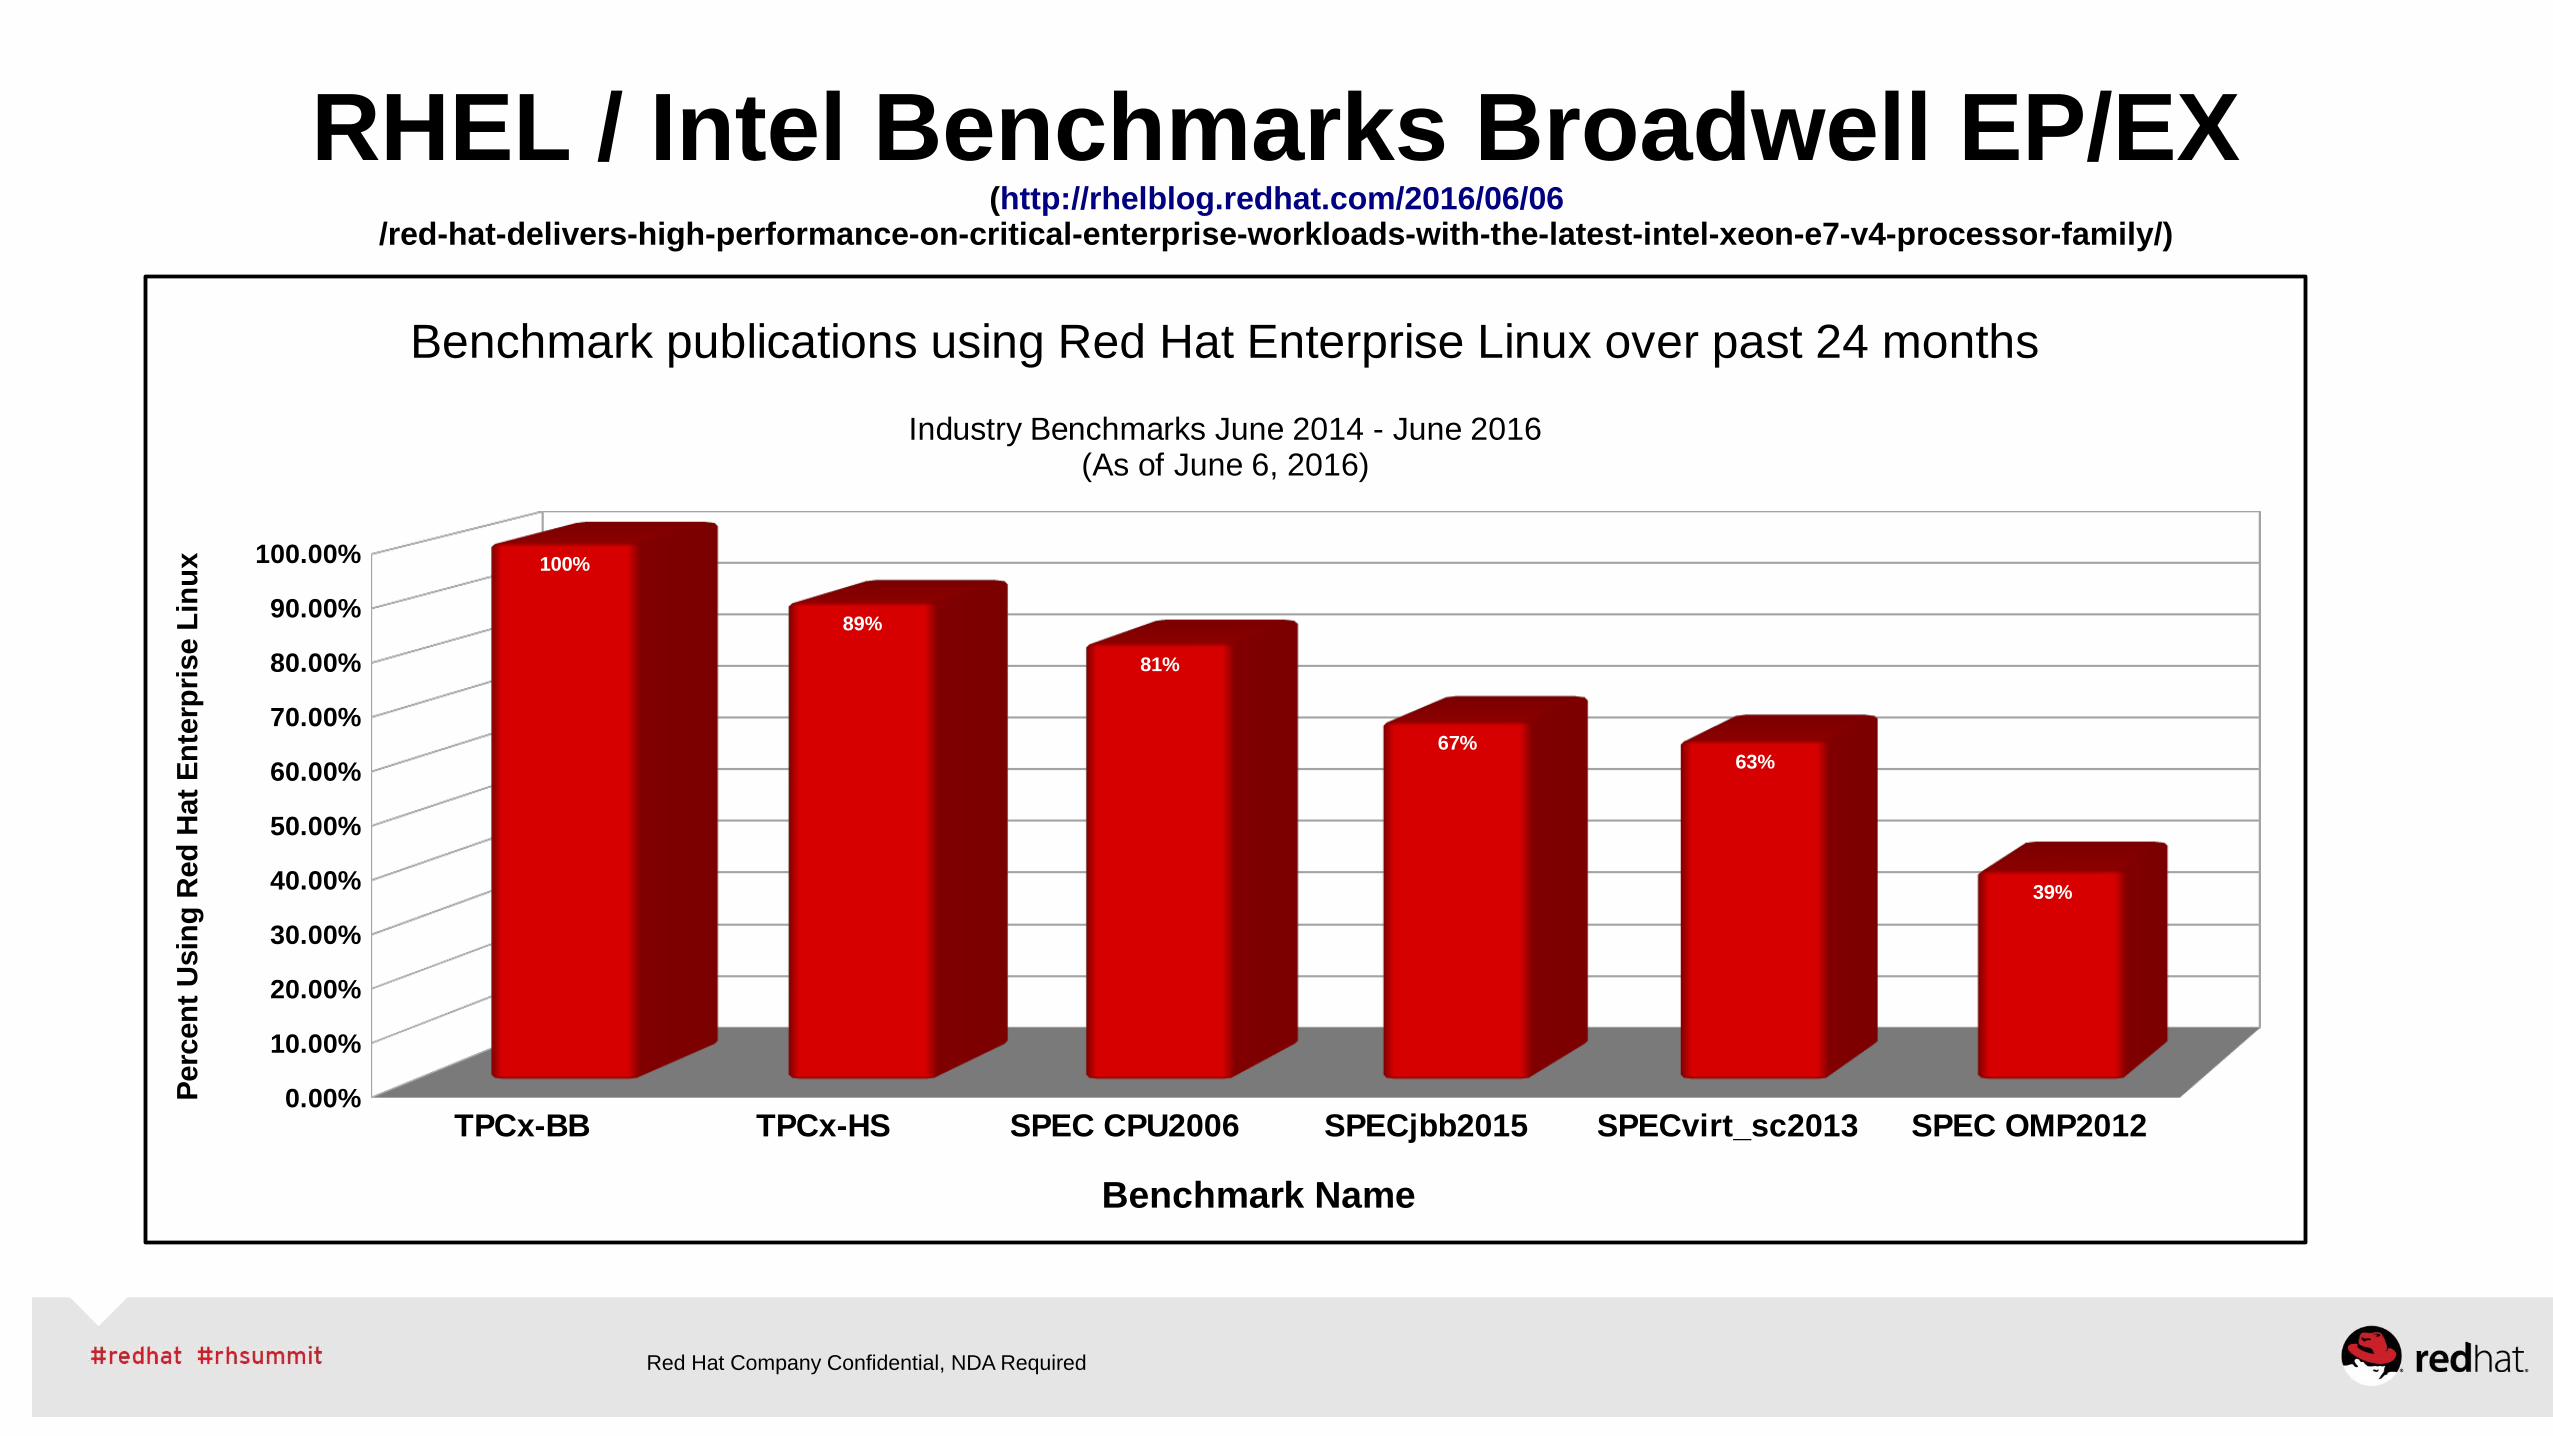
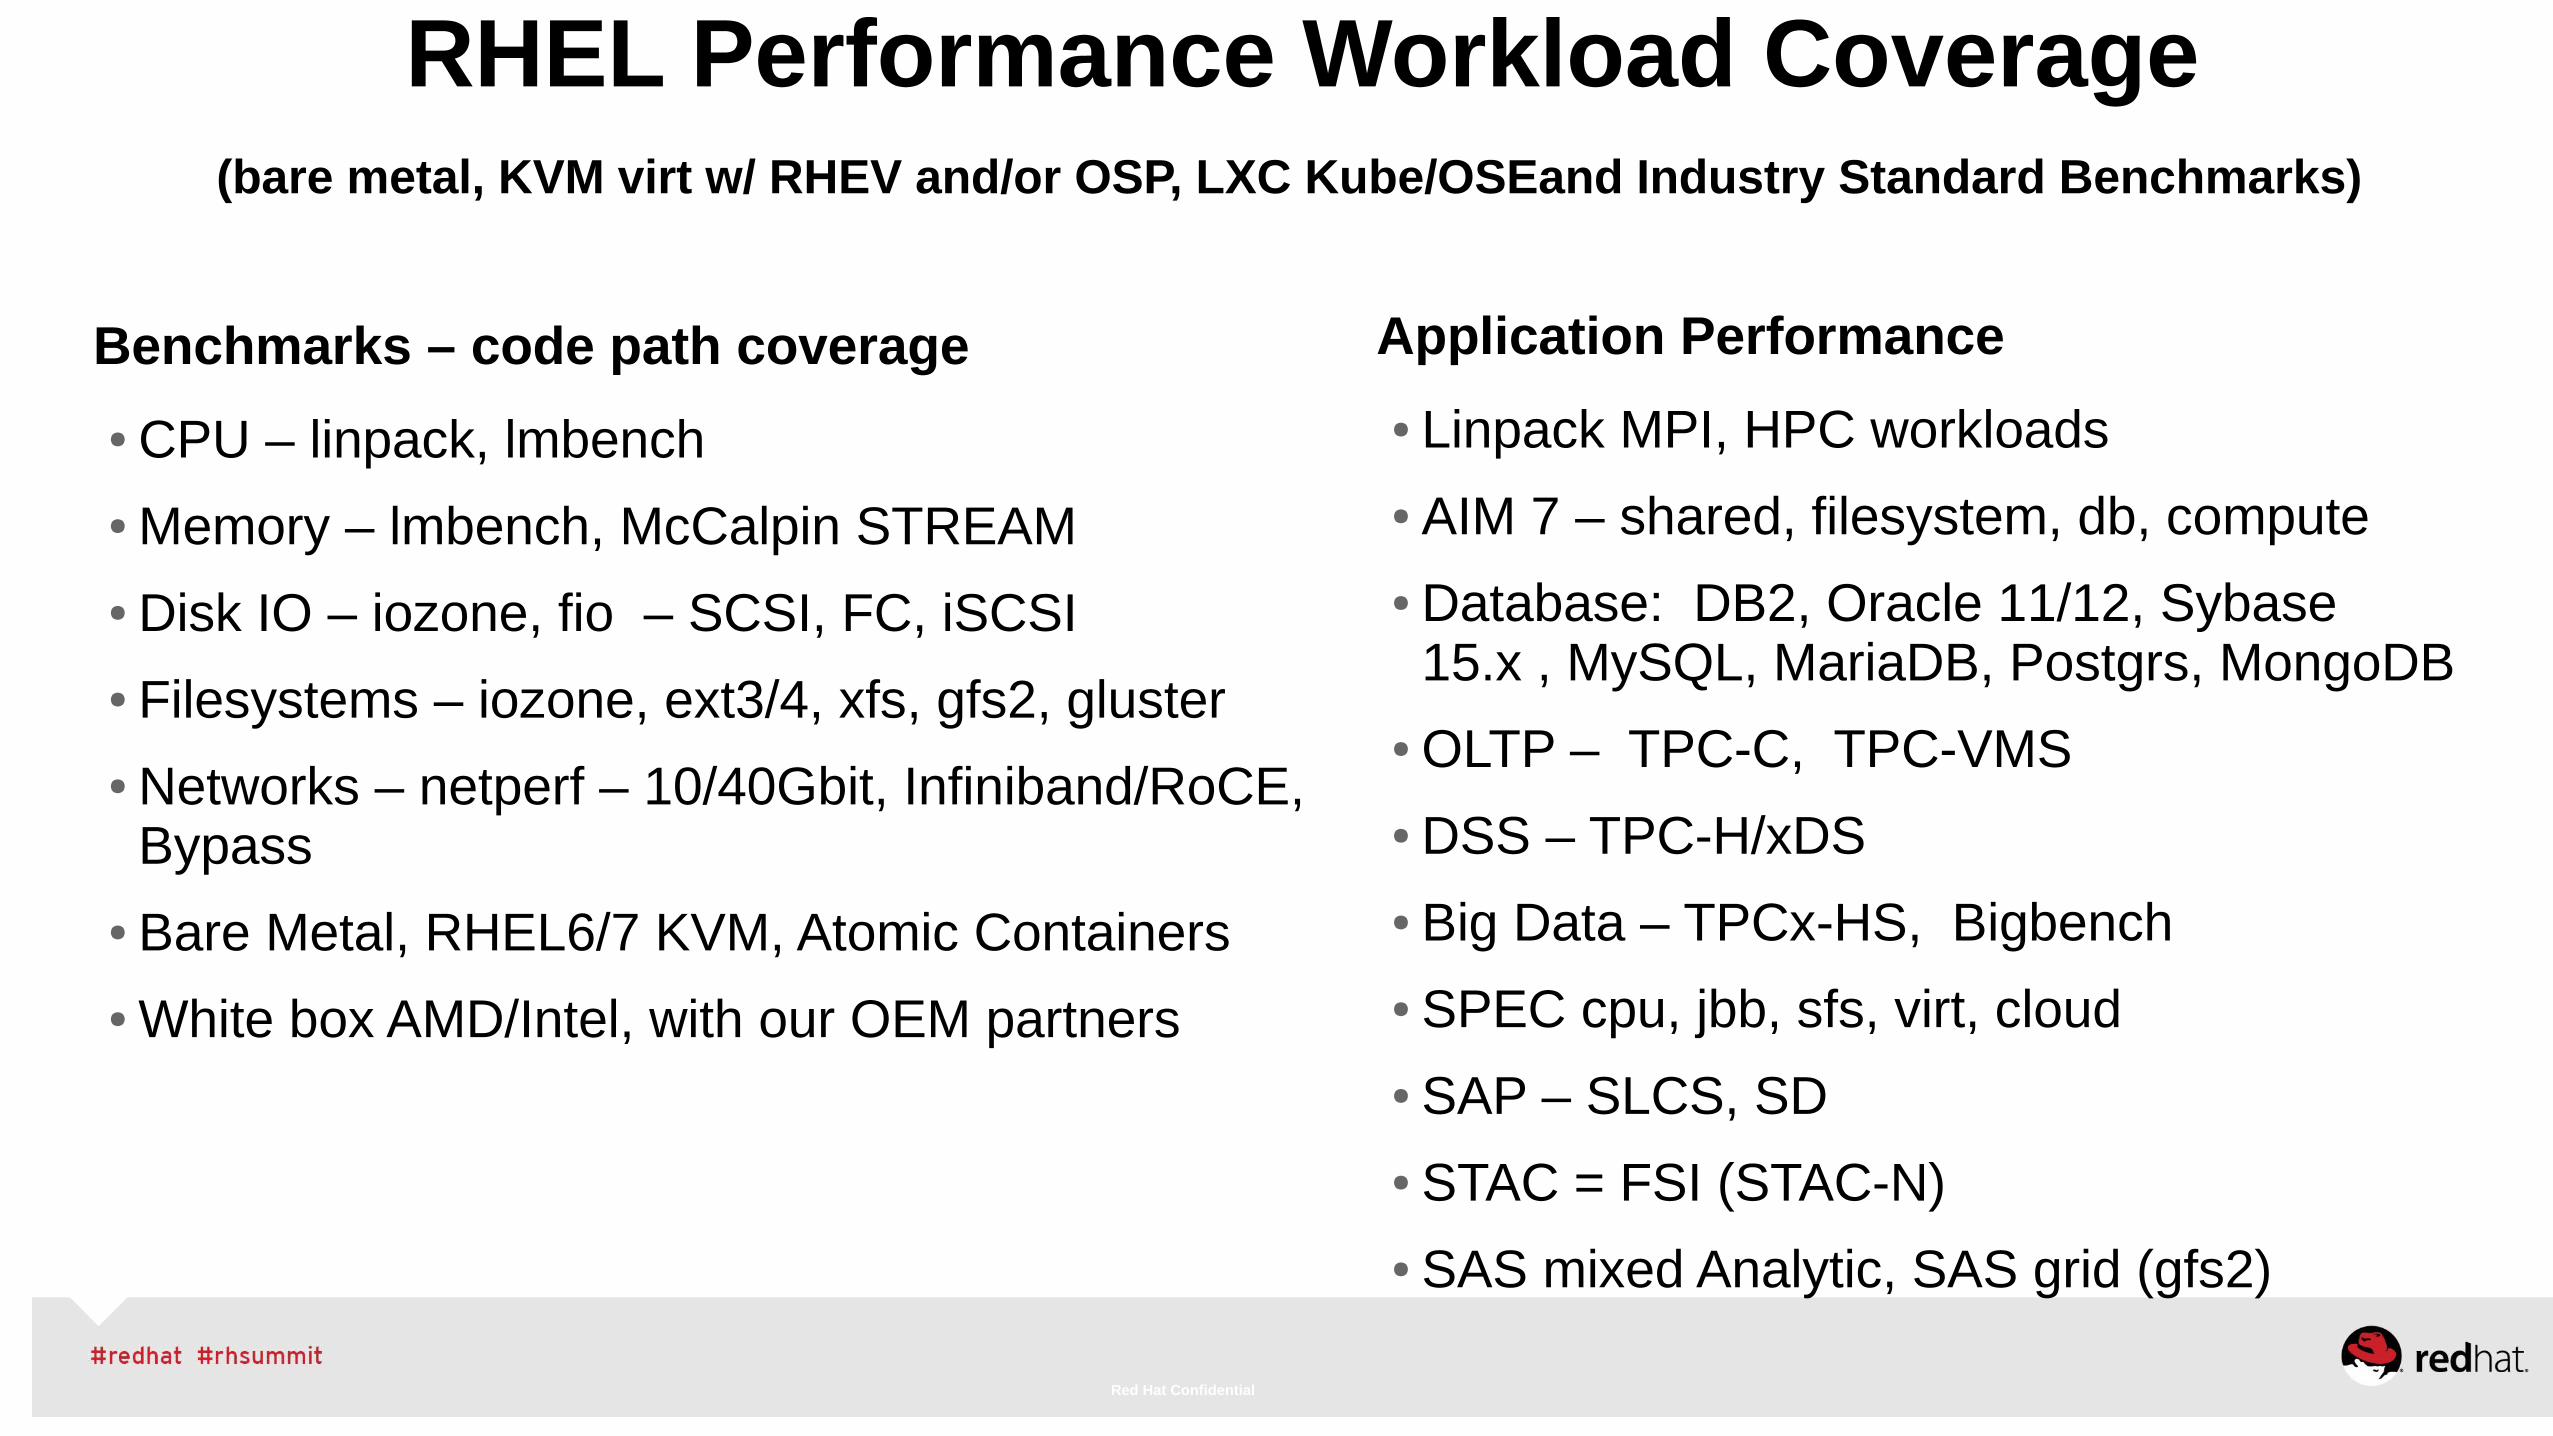
RHEL / Intel Benchmarks Broadwell EP/EX(http://rhelblog.redhat.com/2016/06/06
/red-hat-delivers-high-performance-on-critical-enterprise-workloads-with-the-latest-intel-xeon-e7-v4-processor-family/)
Red Hat Company Confidential, NDA Required
TPCx-BB TPCx-HS SPEC CPU2006 SPECjbb2015 SPECvirt_sc2013 SPEC OMP20120.00%
10.00%
20.00%
30.00%
40.00%
50.00%
60.00%
70.00%
80.00%
90.00%
100.00% 100%
89%
81%
67%63%
39%
Benchmark publications using Red Hat Enterprise Linux over past 24 months
Industry Benchmarks June 2014 - June 2016(As of June 6, 2016)
Benchmark Name
Per
cen
t U
sin
g R
ed H
at E
nte
rpri
se L
inu
x
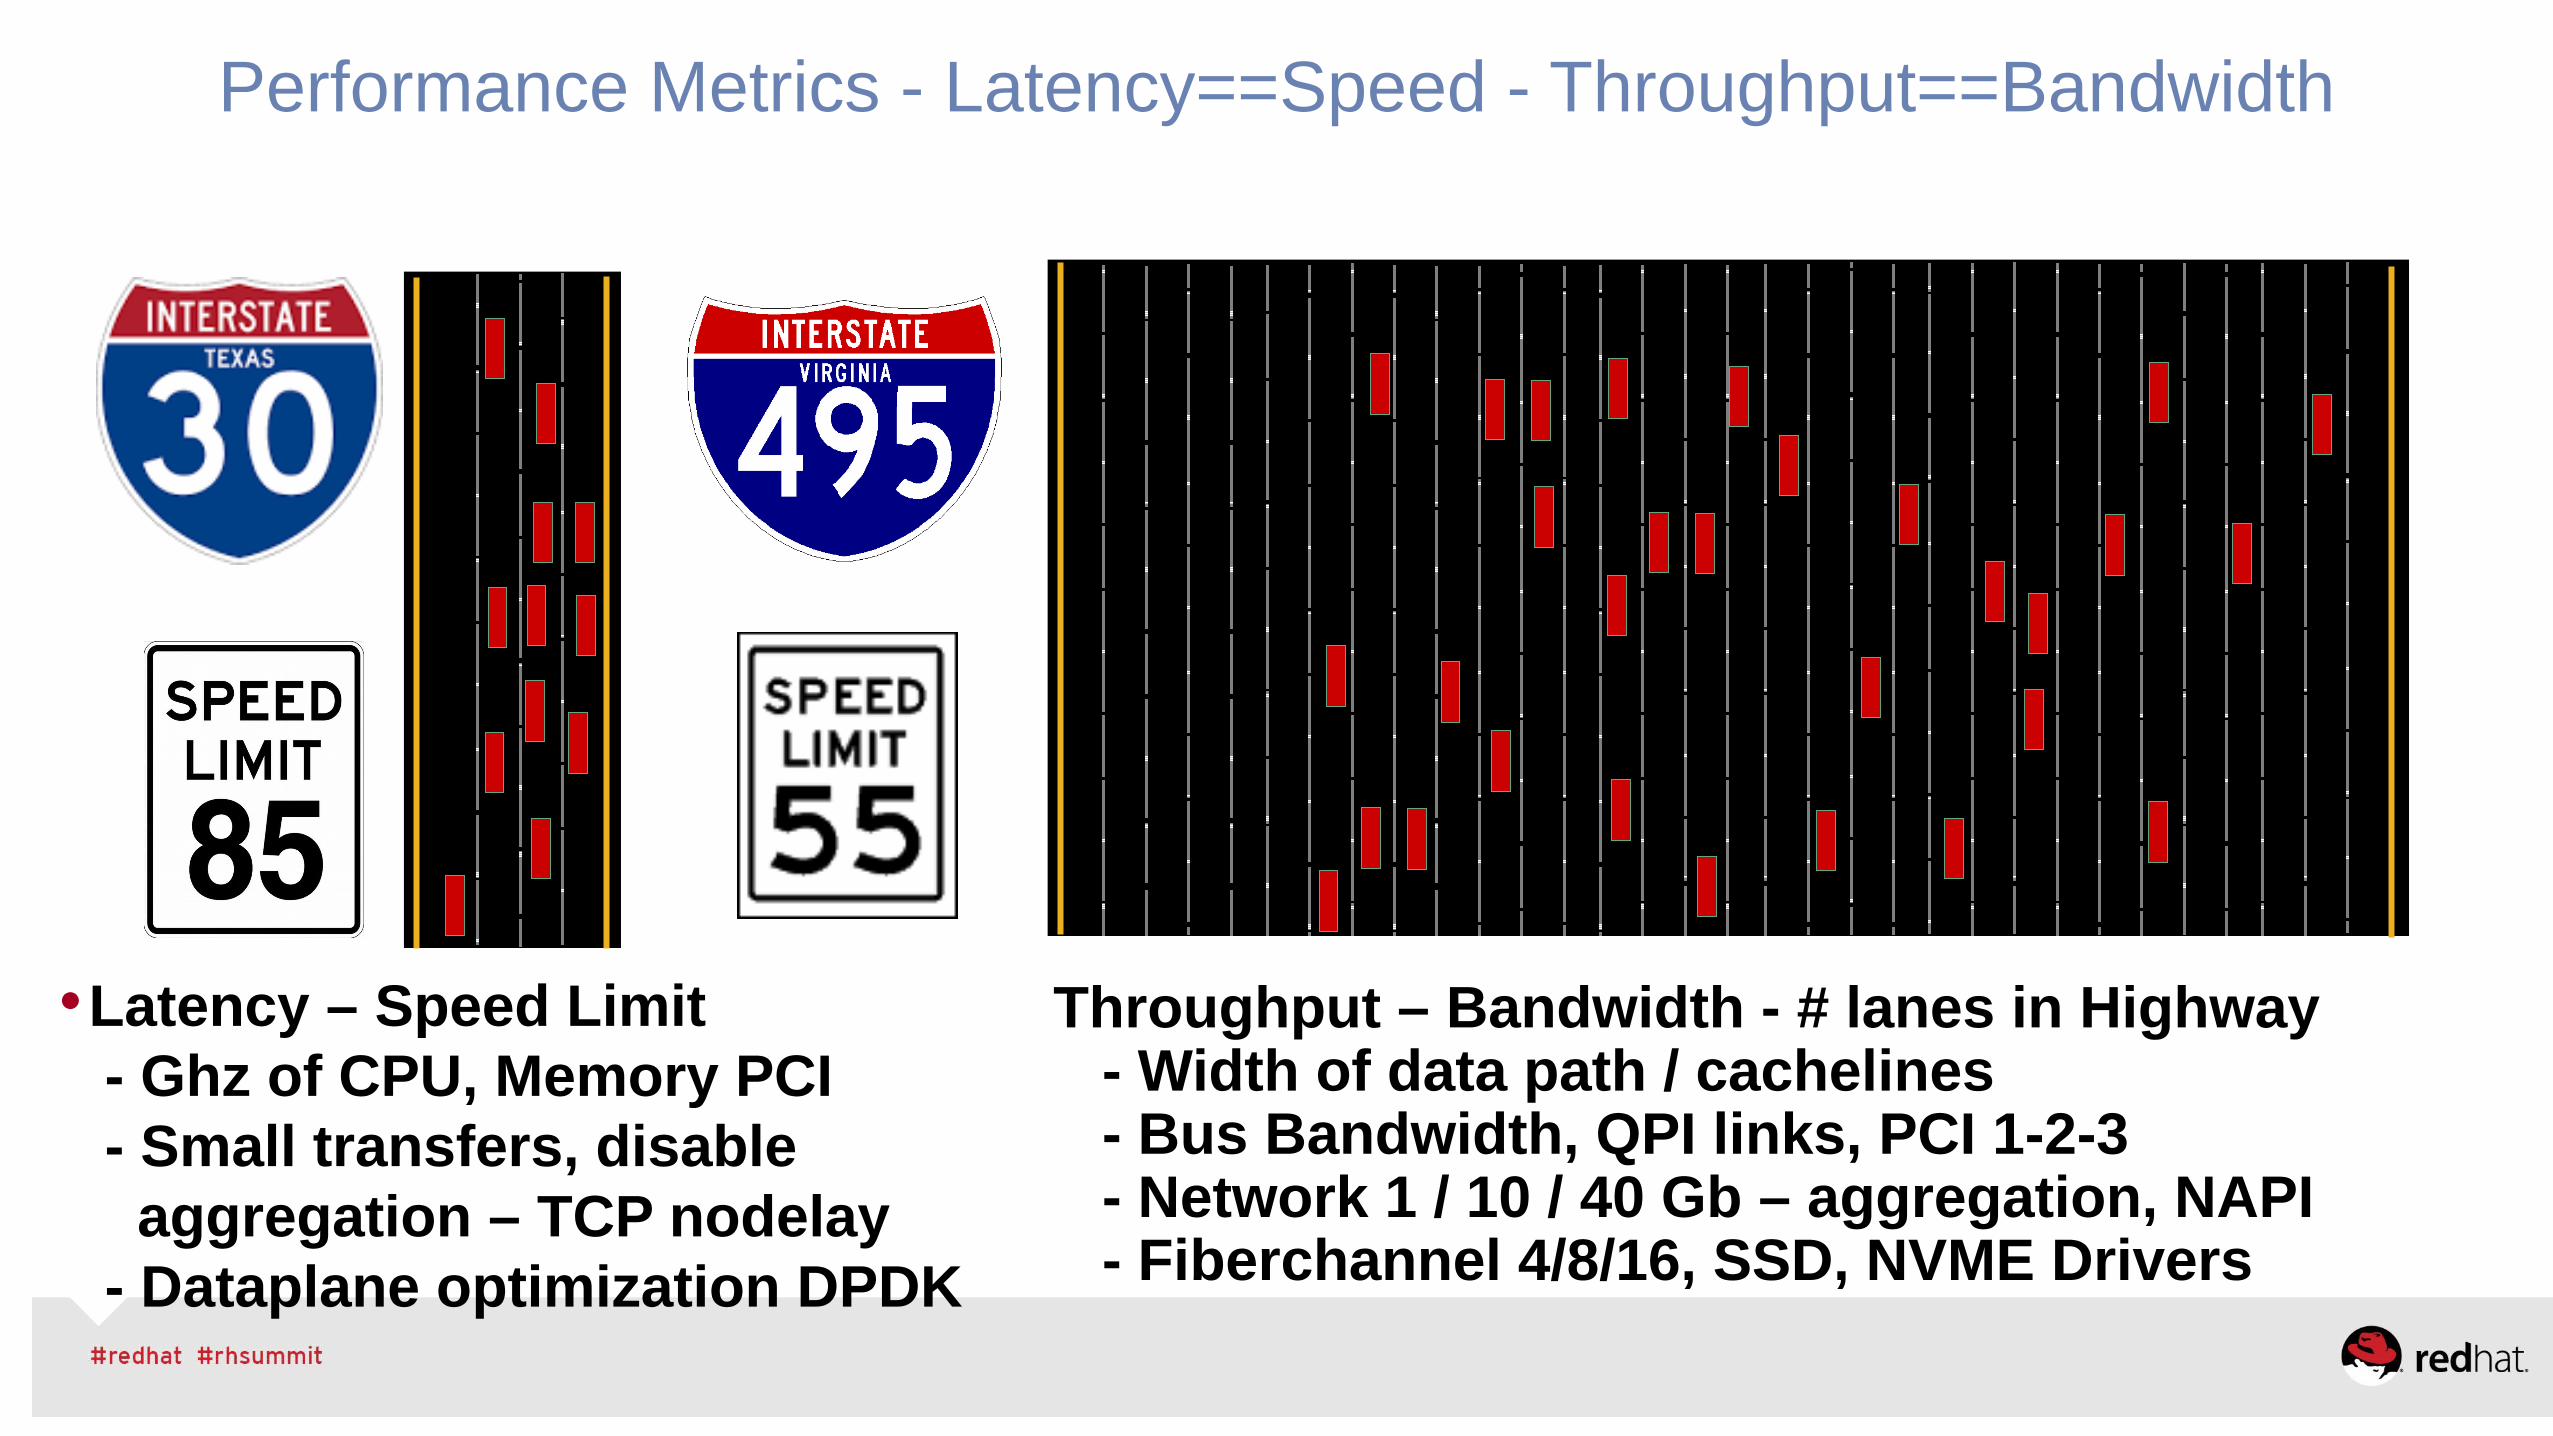
Performance Metrics - Latency==Speed - Throughput==Bandwidth
Throughput – Bandwidth - # lanes in Highway - Width of data path / cachelines - Bus Bandwidth, QPI links, PCI 1-2-3 - Network 1 / 10 / 40 Gb – aggregation, NAPI - Fiberchannel 4/8/16, SSD, NVME Drivers
Latency – Speed Limit- Ghz of CPU, Memory PCI- Small transfers, disable aggregation – TCP nodelay- Dataplane optimization DPDK
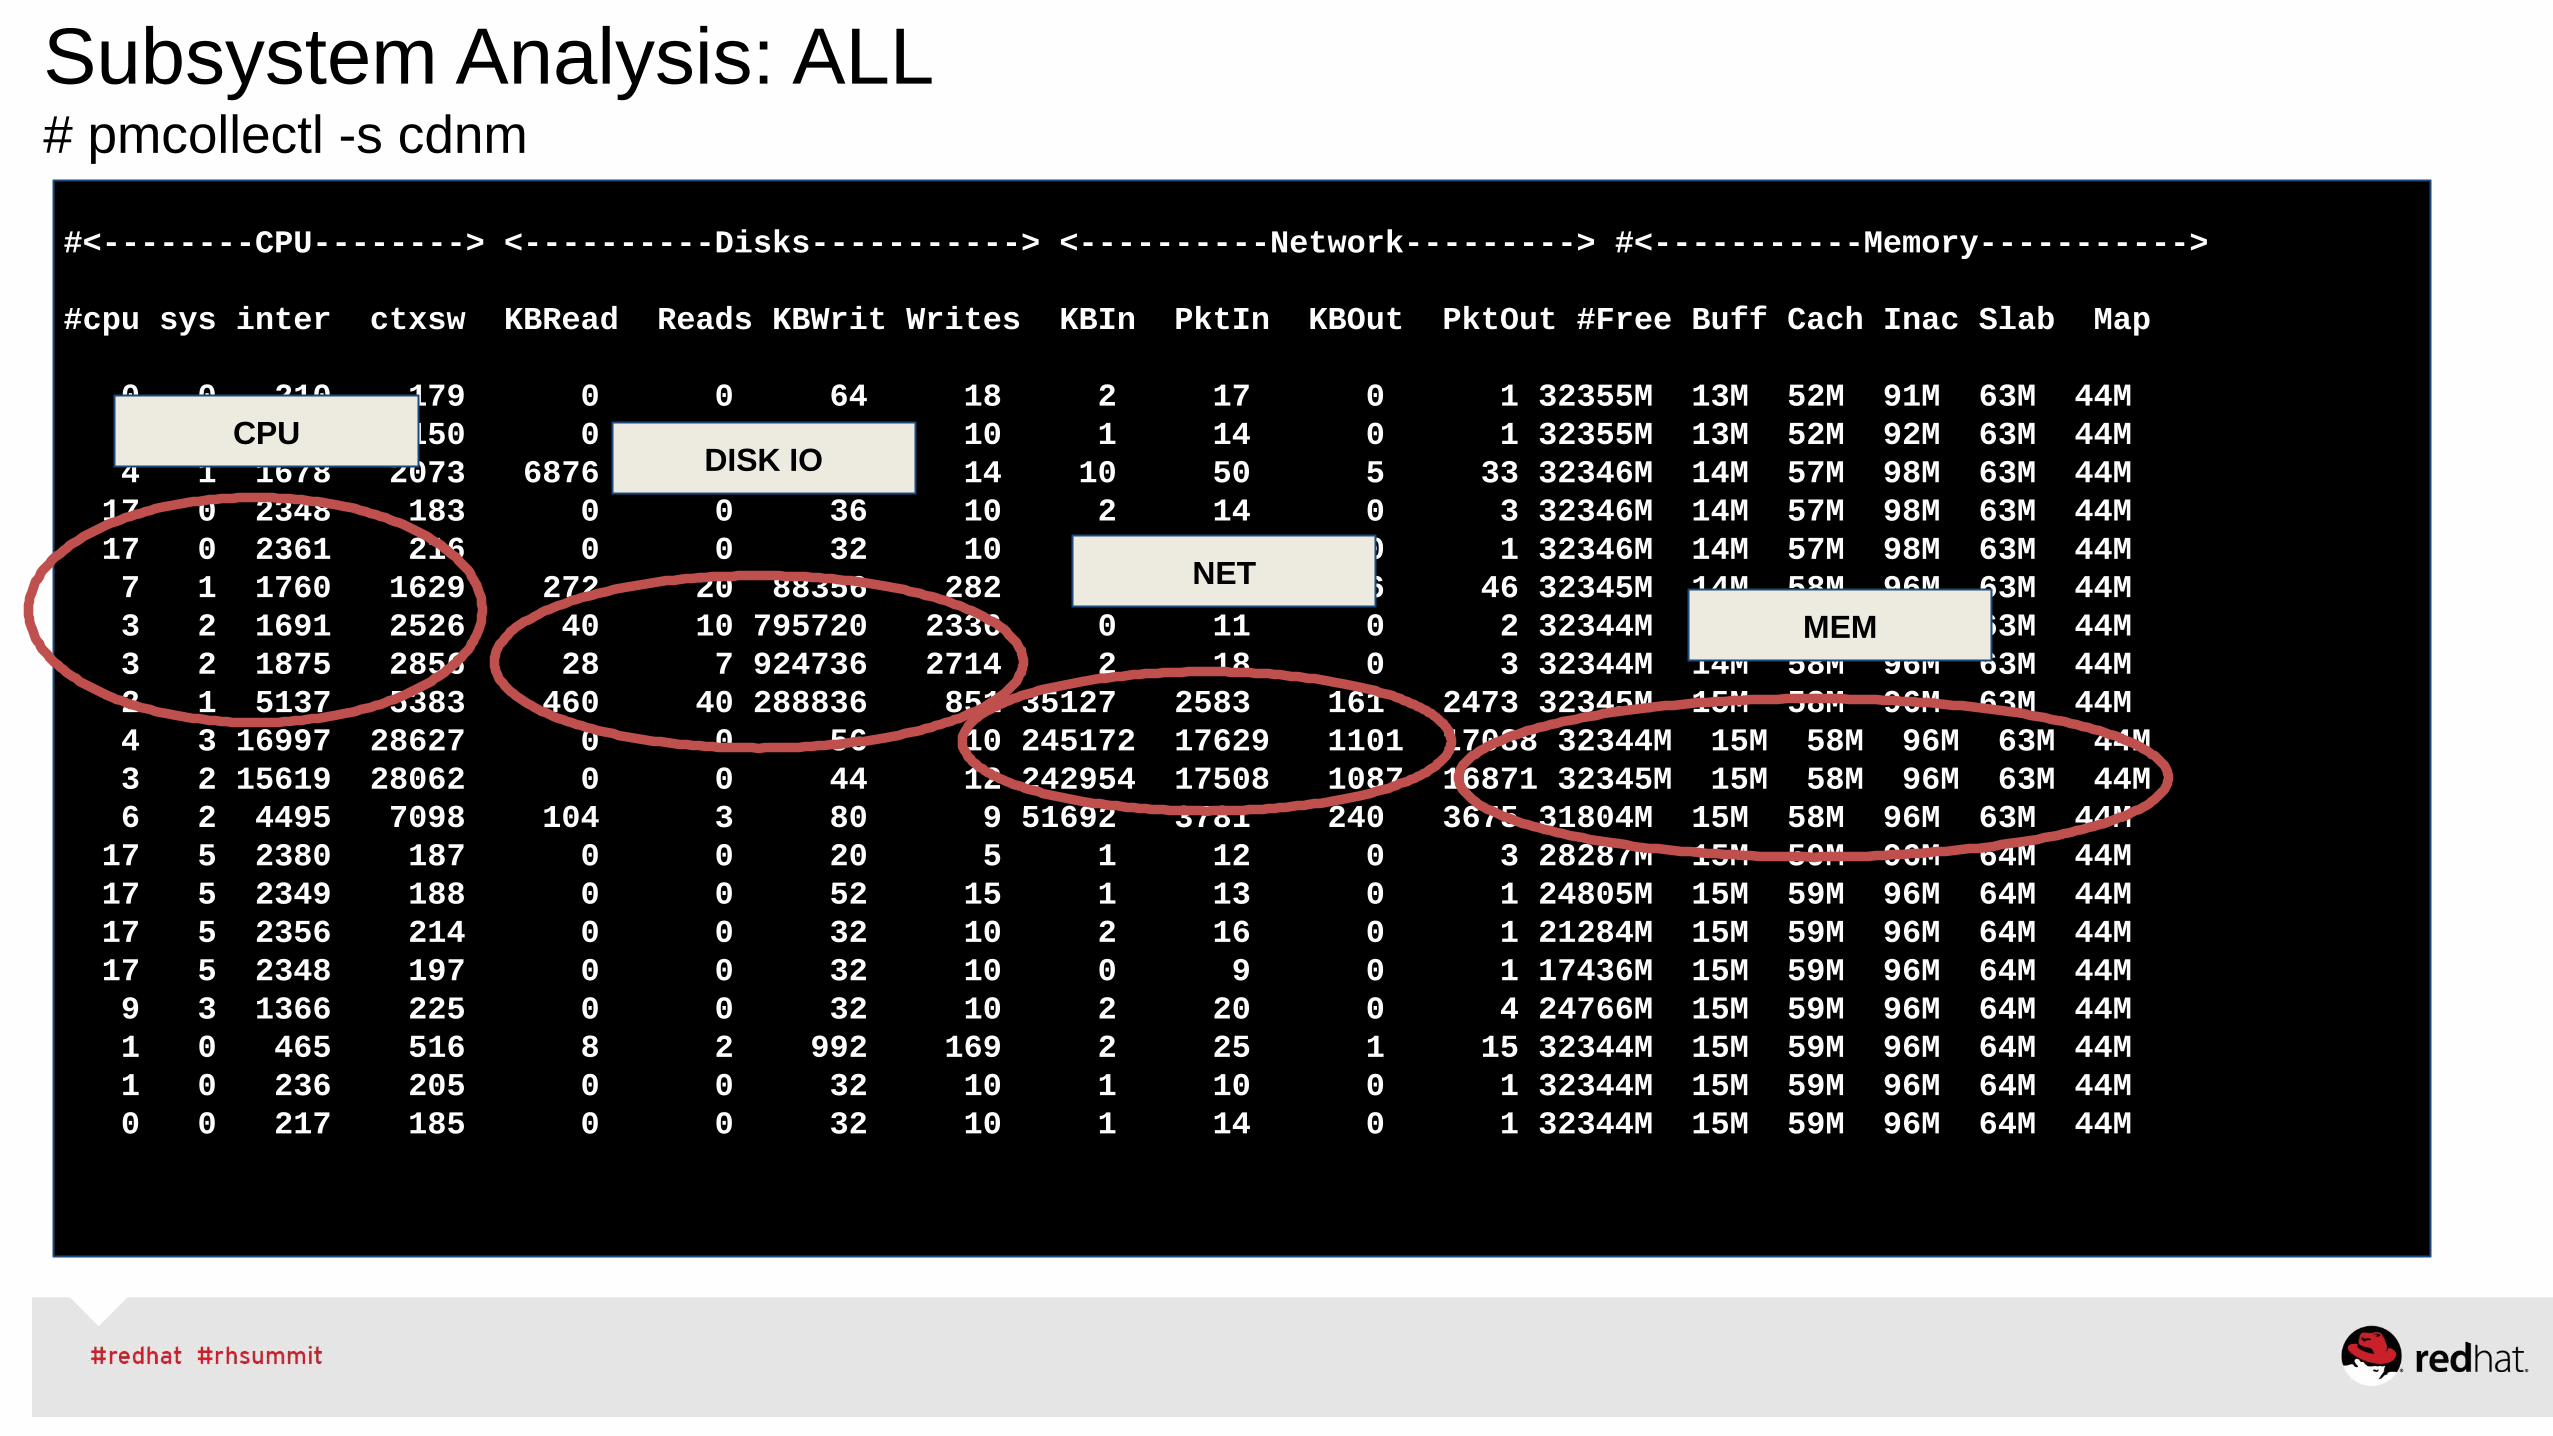
Subsystem Analysis: ALL# pmcollectl -s cdnm
#<--------CPU--------> <----------Disks-----------> <----------Network---------> #<-----------Memory----------->
#cpu sys inter ctxsw KBRead Reads KBWrit Writes KBIn PktIn KBOut PktOut #Free Buff Cach Inac Slab Map
0 0 210 179 0 0 64 18 2 17 0 1 32355M 13M 52M 91M 63M 44M 0 0 202 150 0 0 32 10 1 14 0 1 32355M 13M 52M 92M 63M 44M 4 1 1678 2073 6876 650 108 14 10 50 5 33 32346M 14M 57M 98M 63M 44M 17 0 2348 183 0 0 36 10 2 14 0 3 32346M 14M 57M 98M 63M 44M 17 0 2361 216 0 0 32 10 1 17 0 1 32346M 14M 57M 98M 63M 44M 7 1 1760 1629 272 20 88356 282 11 63 6 46 32345M 14M 58M 96M 63M 44M 3 2 1691 2526 40 10 795720 2336 0 11 0 2 32344M 14M 58M 96M 63M 44M 3 2 1875 2856 28 7 924736 2714 2 18 0 3 32344M 14M 58M 96M 63M 44M 2 1 5137 5383 460 40 288836 851 35127 2583 161 2473 32345M 15M 58M 96M 63M 44M 4 3 16997 28627 0 0 56 10 245172 17629 1101 17088 32344M 15M 58M 96M 63M 44M 3 2 15619 28062 0 0 44 12 242954 17508 1087 16871 32345M 15M 58M 96M 63M 44M 6 2 4495 7098 104 3 80 9 51692 3781 240 3675 31804M 15M 58M 96M 63M 44M 17 5 2380 187 0 0 20 5 1 12 0 3 28287M 15M 59M 96M 64M 44M 17 5 2349 188 0 0 52 15 1 13 0 1 24805M 15M 59M 96M 64M 44M 17 5 2356 214 0 0 32 10 2 16 0 1 21284M 15M 59M 96M 64M 44M 17 5 2348 197 0 0 32 10 0 9 0 1 17436M 15M 59M 96M 64M 44M 9 3 1366 225 0 0 32 10 2 20 0 4 24766M 15M 59M 96M 64M 44M 1 0 465 516 8 2 992 169 2 25 1 15 32344M 15M 59M 96M 64M 44M 1 0 236 205 0 0 32 10 1 10 0 1 32344M 15M 59M 96M 64M 44M 0 0 217 185 0 0 32 10 1 14 0 1 32344M 15M 59M 96M 64M 44M
CPUDISK IO
NET
MEM

Performance Tools - Tuned

tuned is a tool to dynamically tuneRed Hat Enterprise Linux.
You could improve workload performance by applying one of the predefined profiles or
use those that you’ve written yourself
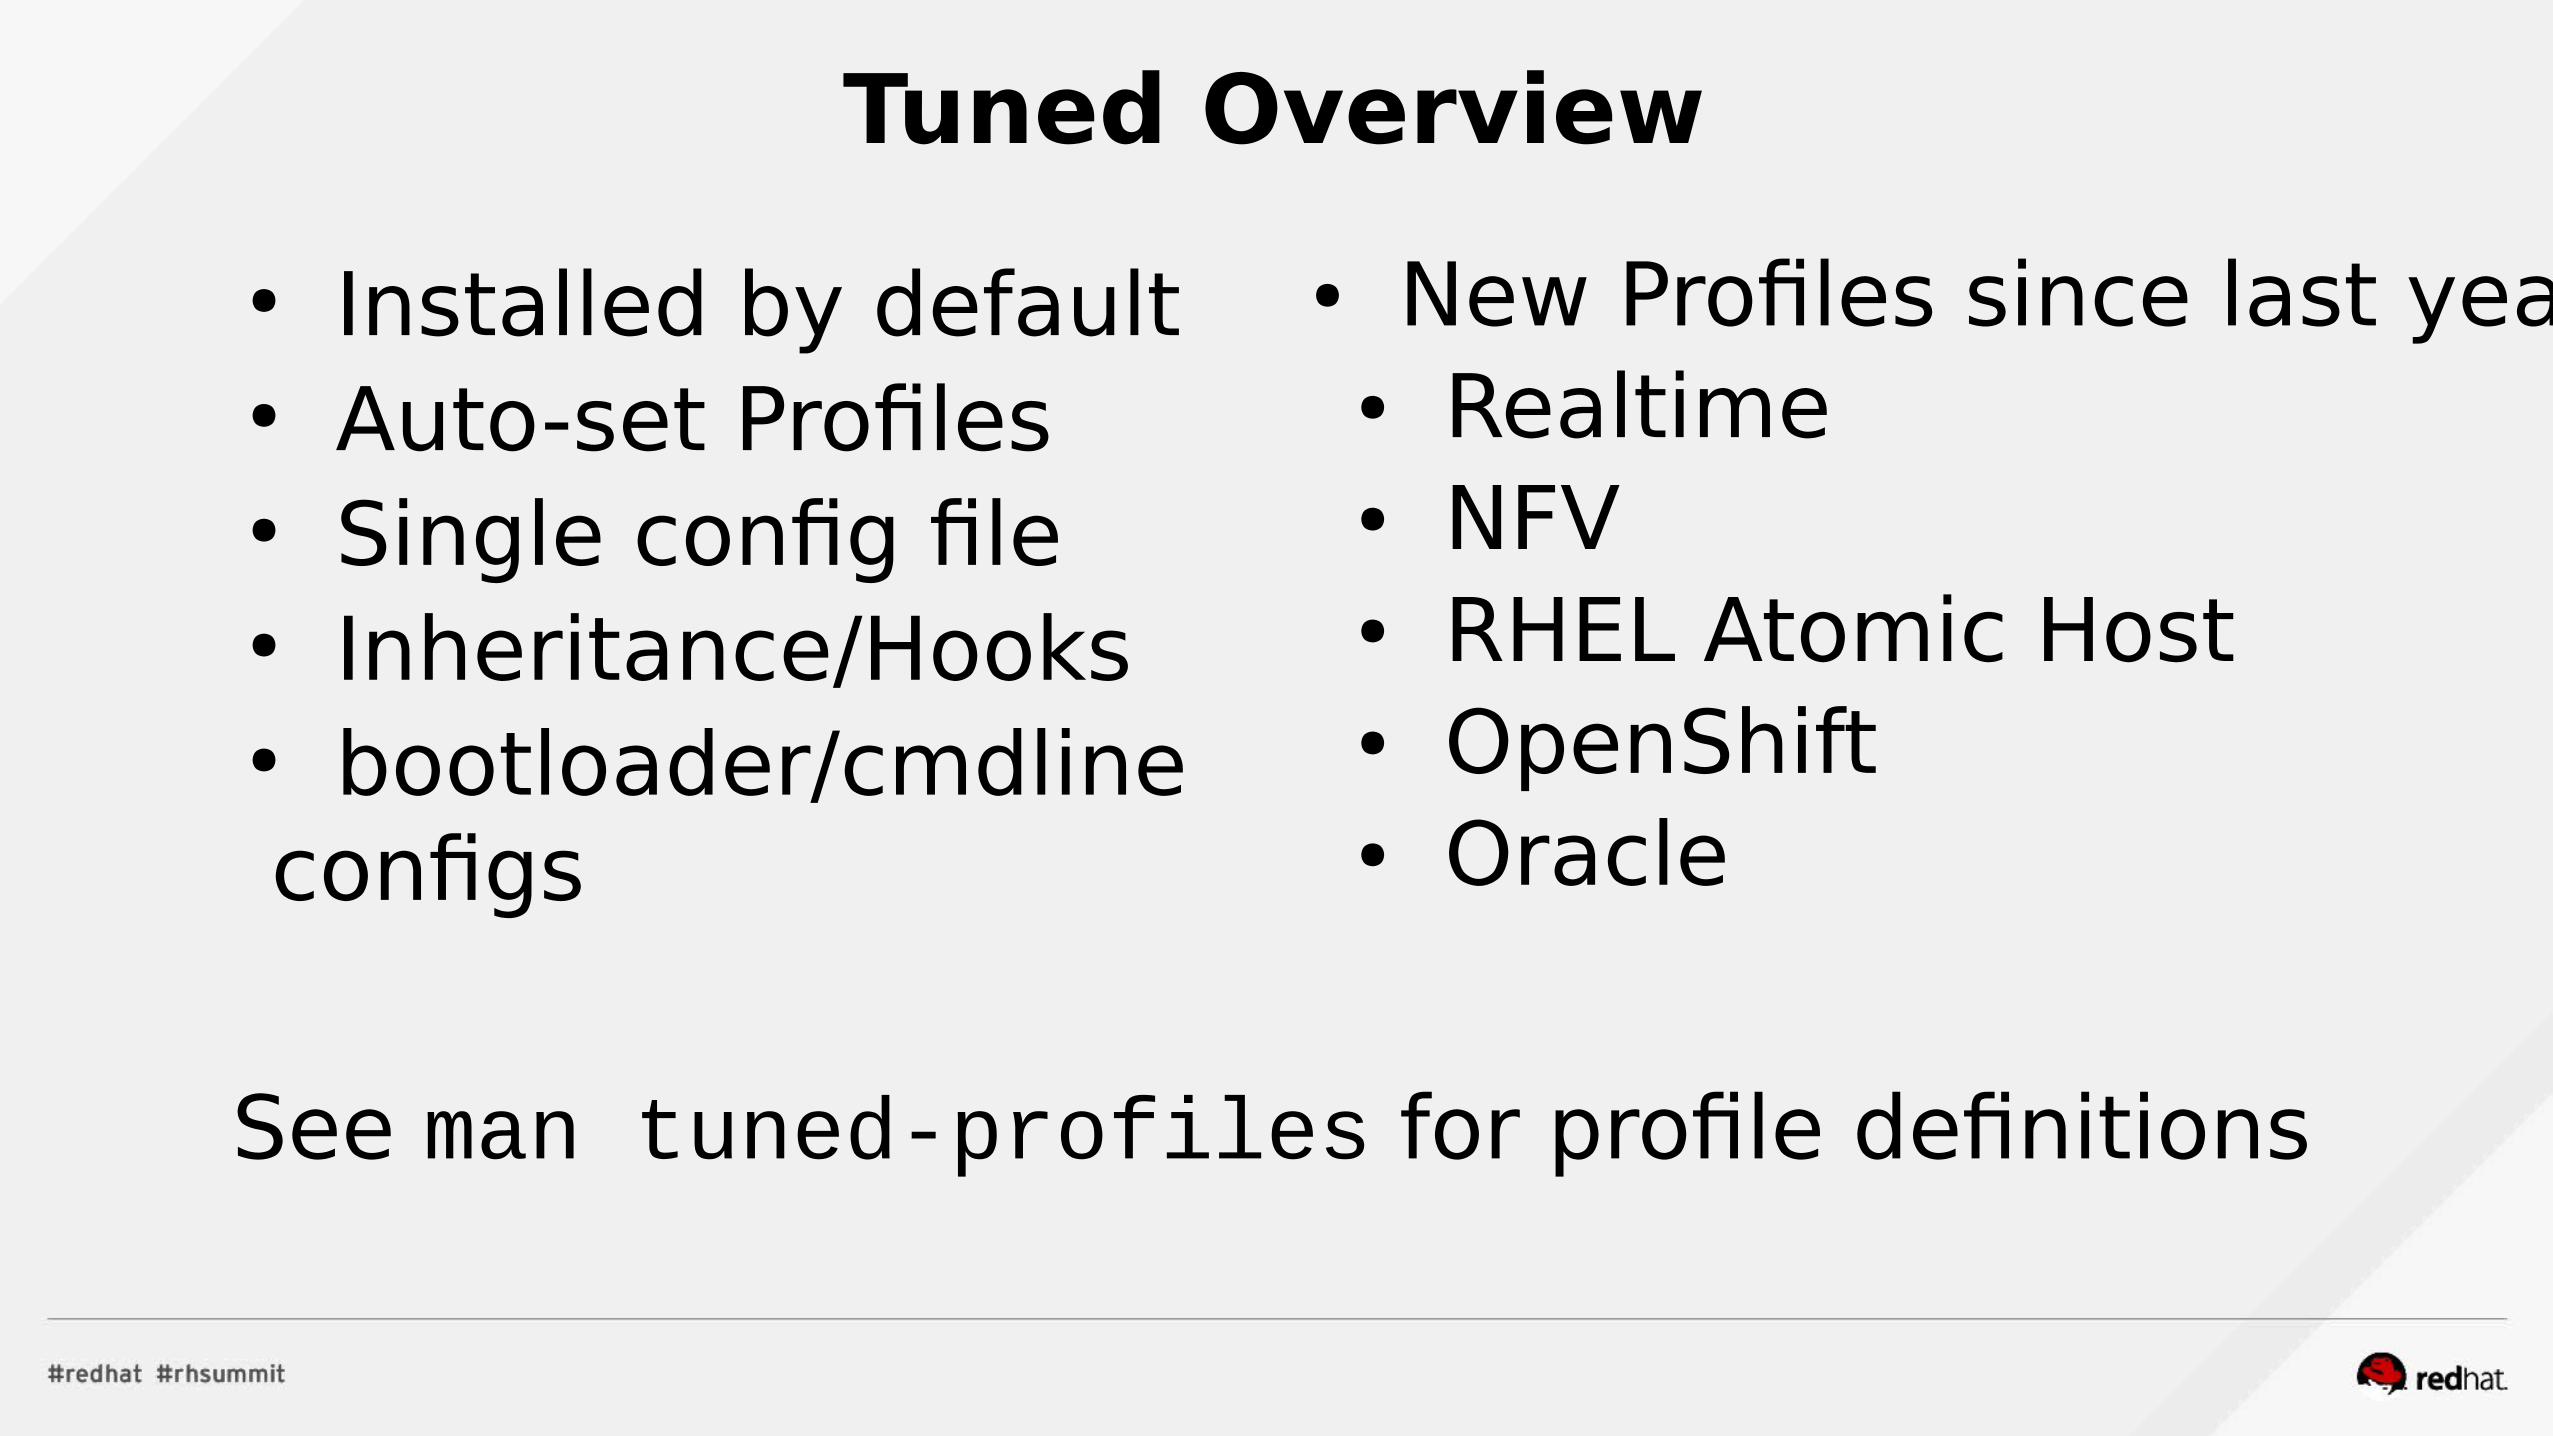
● Installed by default● Auto-set Profiles● Single config file● Inheritance/Hooks● bootloader/cmdline configs
Tuned Overview
● New Profiles since last year● Realtime● NFV● RHEL Atomic Host● OpenShift● Oracle
See man tuned-profiles for profile definitions
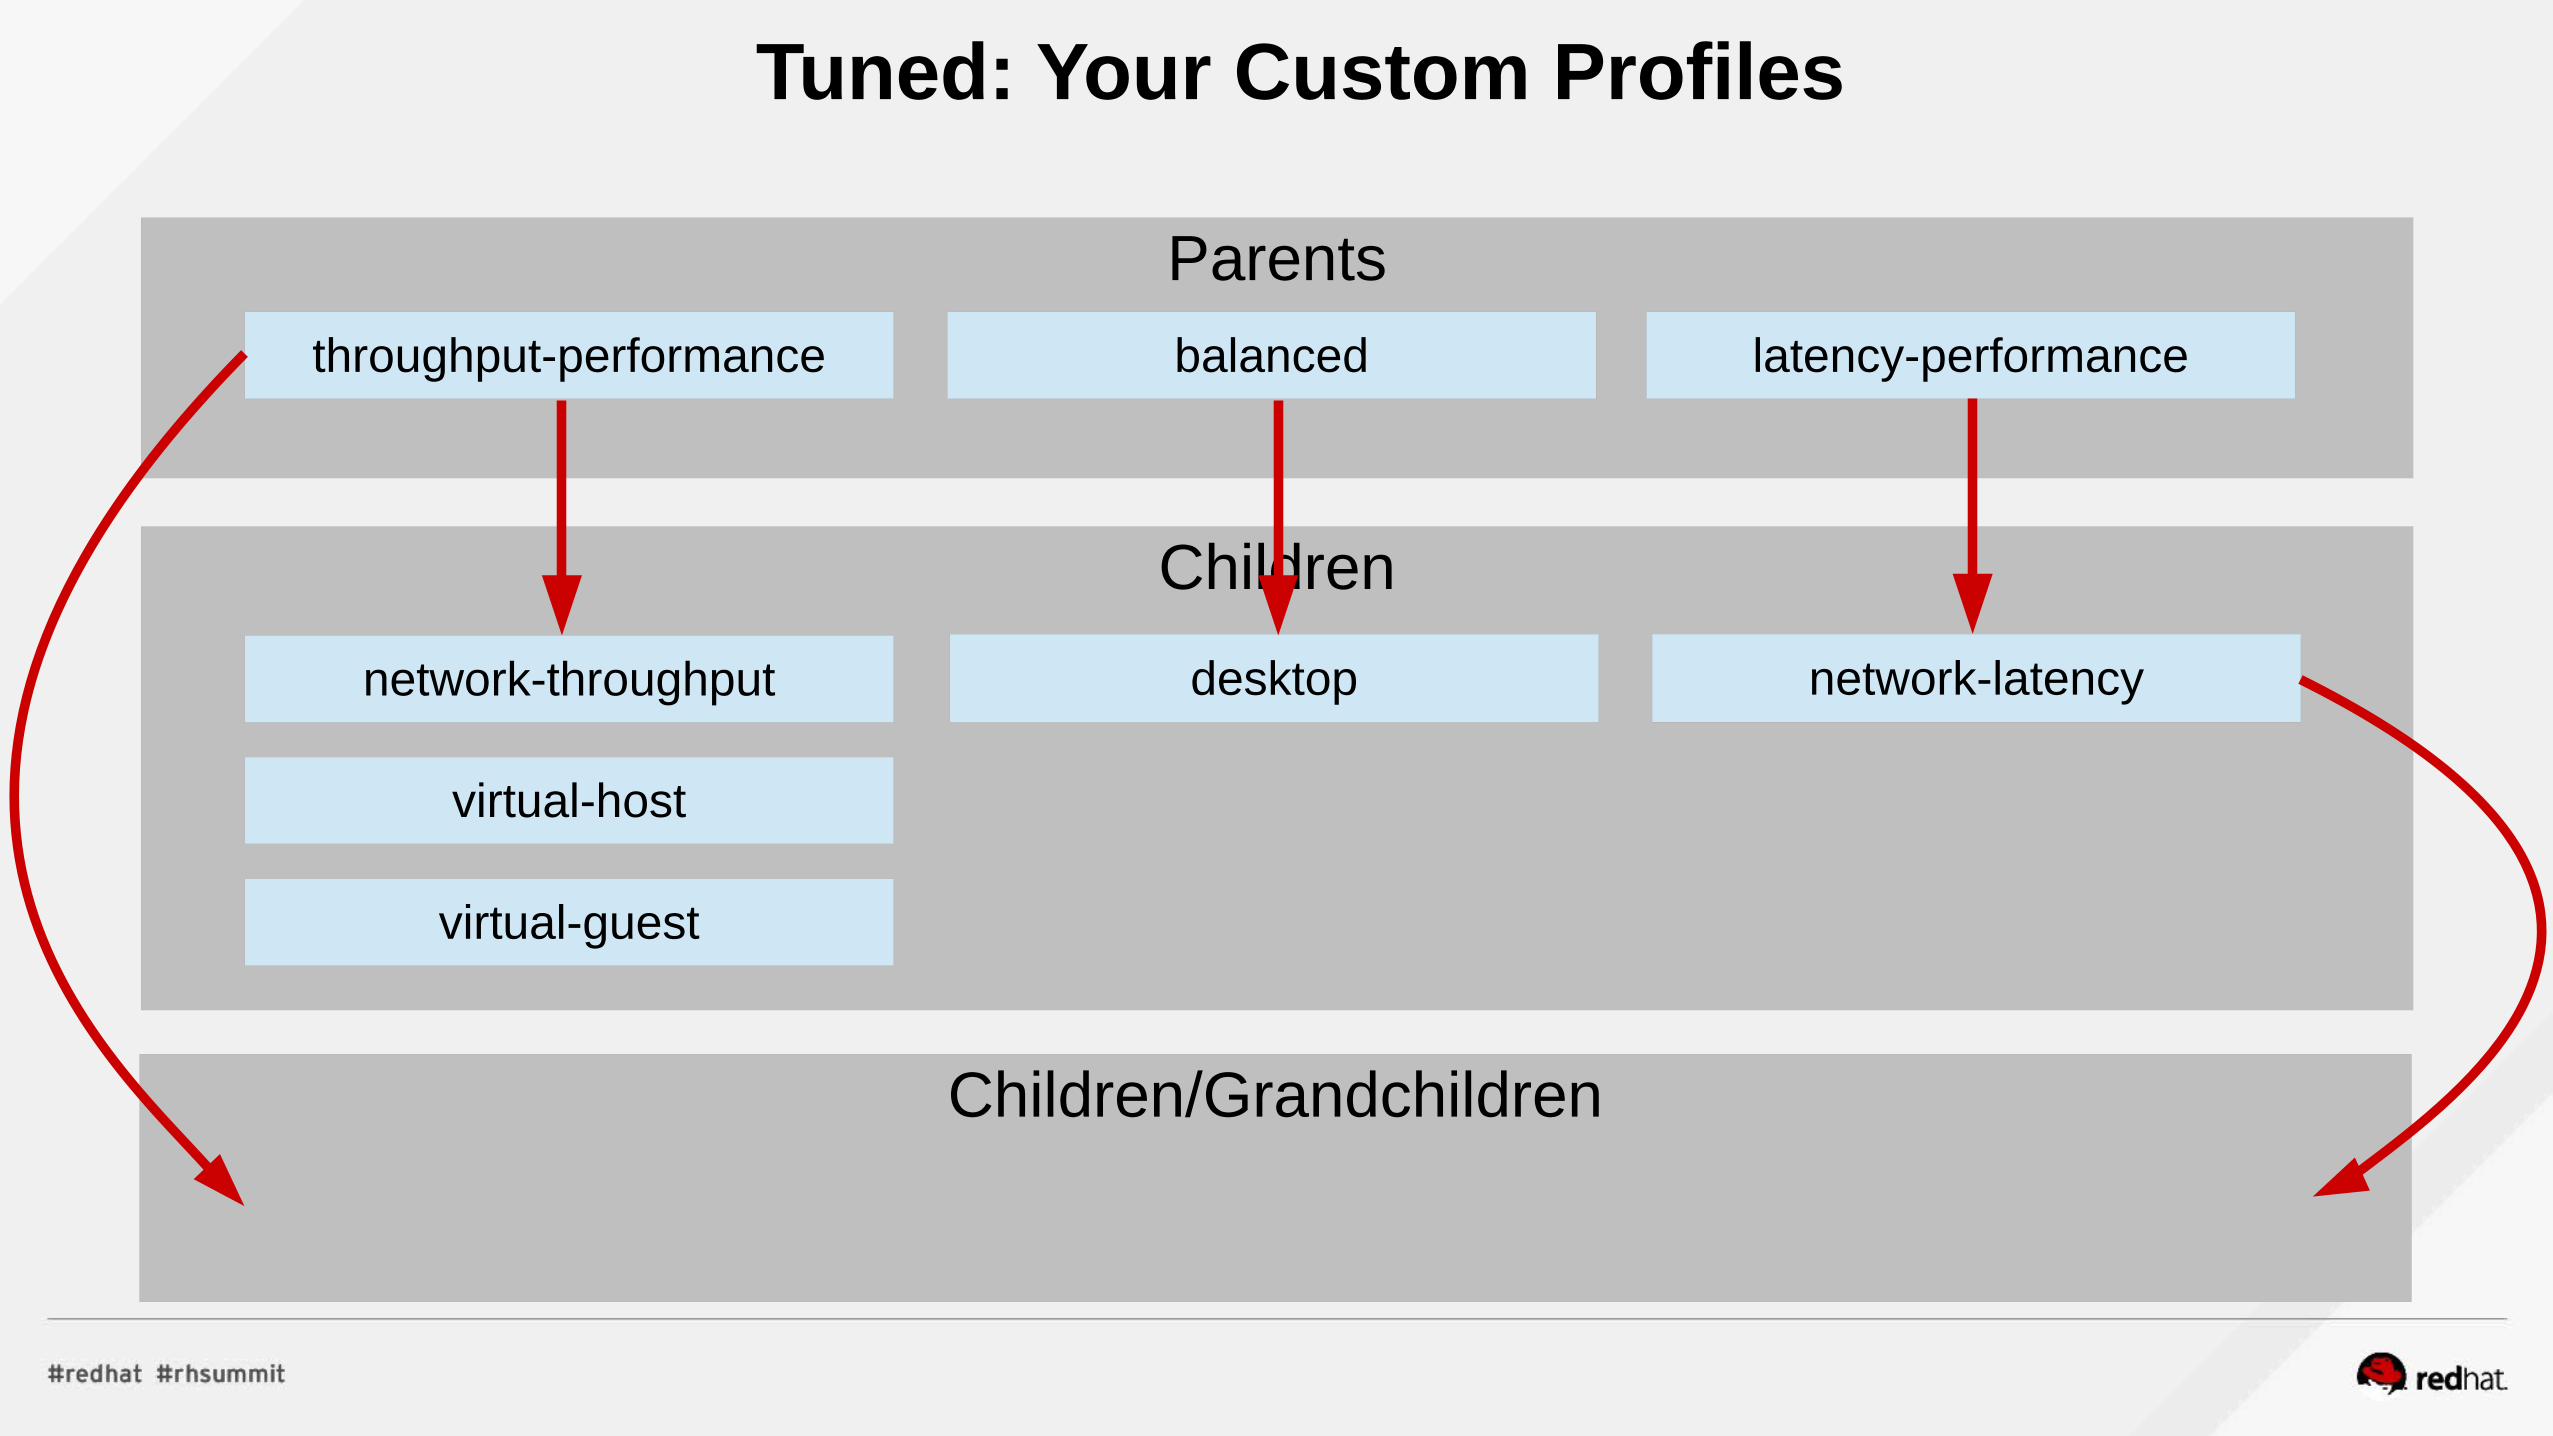
Children
Parents
Tuned: Your Custom Profiles
latency-performancethroughput-performance
network-latencynetwork-throughput
virtual-host
virtual-guest
balanced
desktop
Your Database ProfileYour Web Profile Your Middleware Profile
Children/Grandchildren
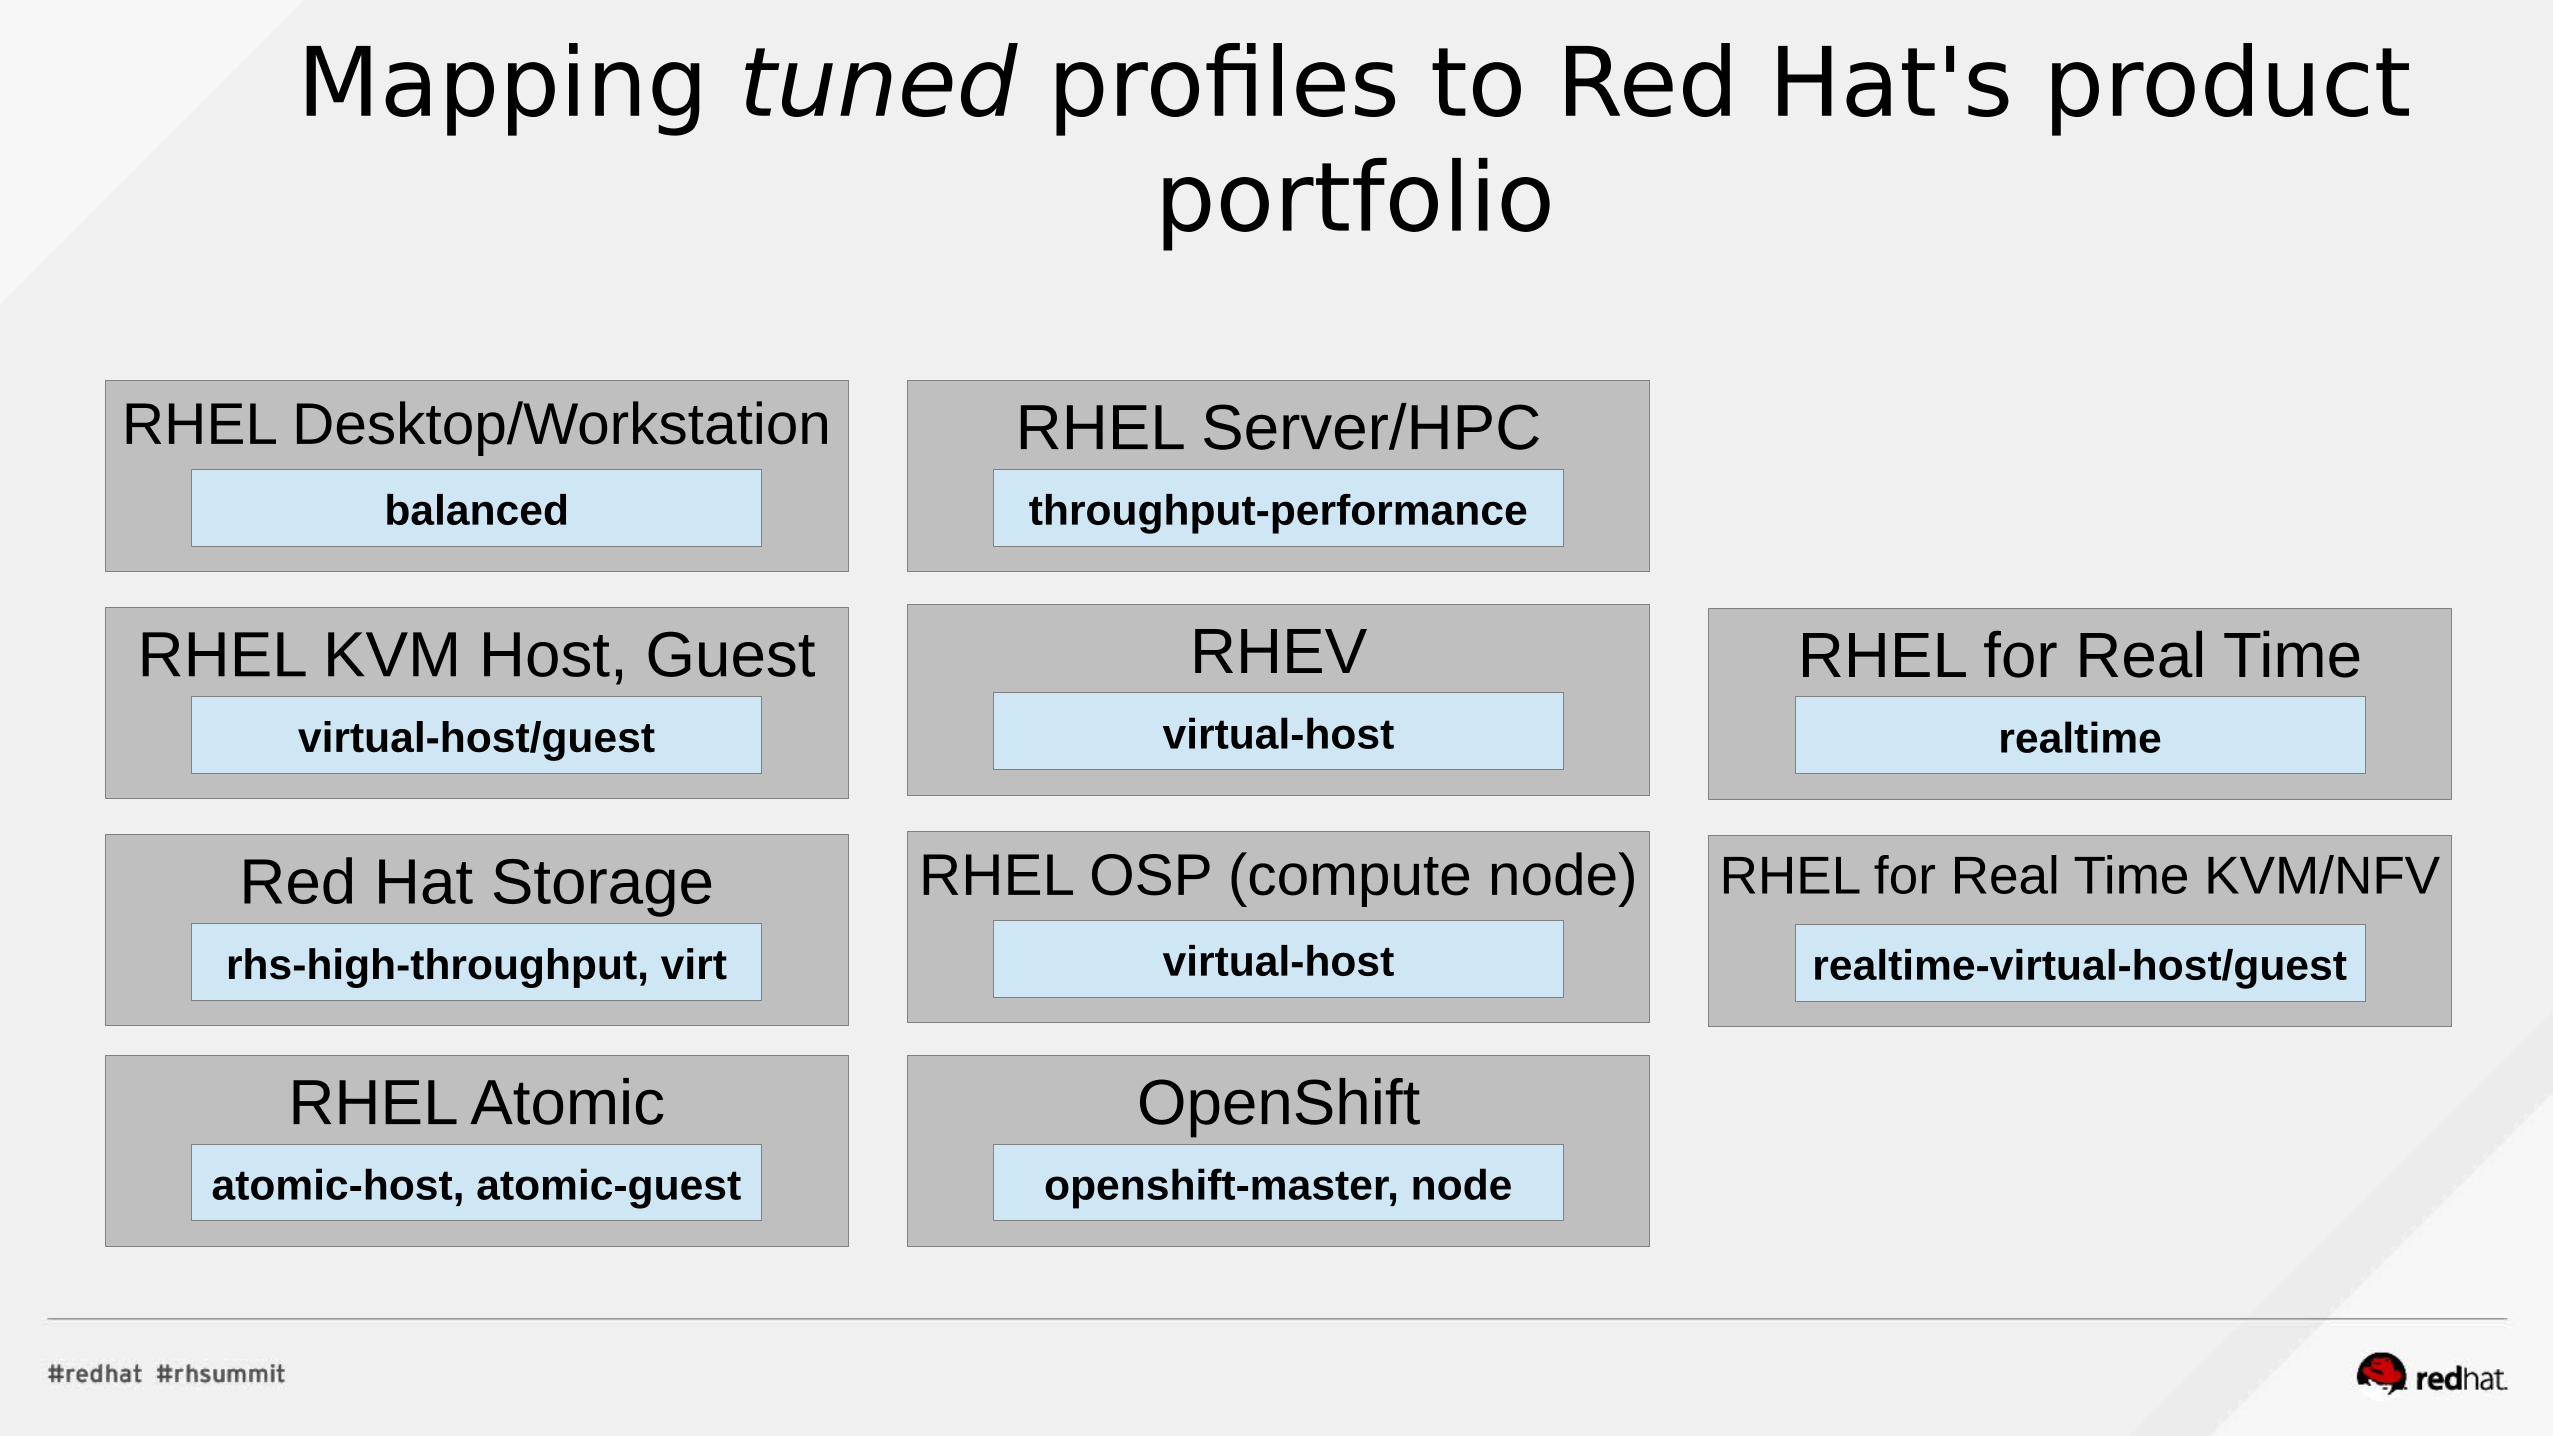
Mapping tuned profiles to Red Hat's product portfolio
RHEL Desktop/Workstationbalanced
RHEL KVM Host, Guestvirtual-host/guest
Red Hat Storagerhs-high-throughput, virt
RHEL Atomicatomic-host, atomic-guest
RHEL Server/HPCthroughput-performance
RHEVvirtual-host
RHEL OSP (compute node)virtual-host
OpenShiftopenshift-master, node
RHEL for Real Timerealtime
RHEL for Real Time KVM/NFV
realtime-virtual-host/guest
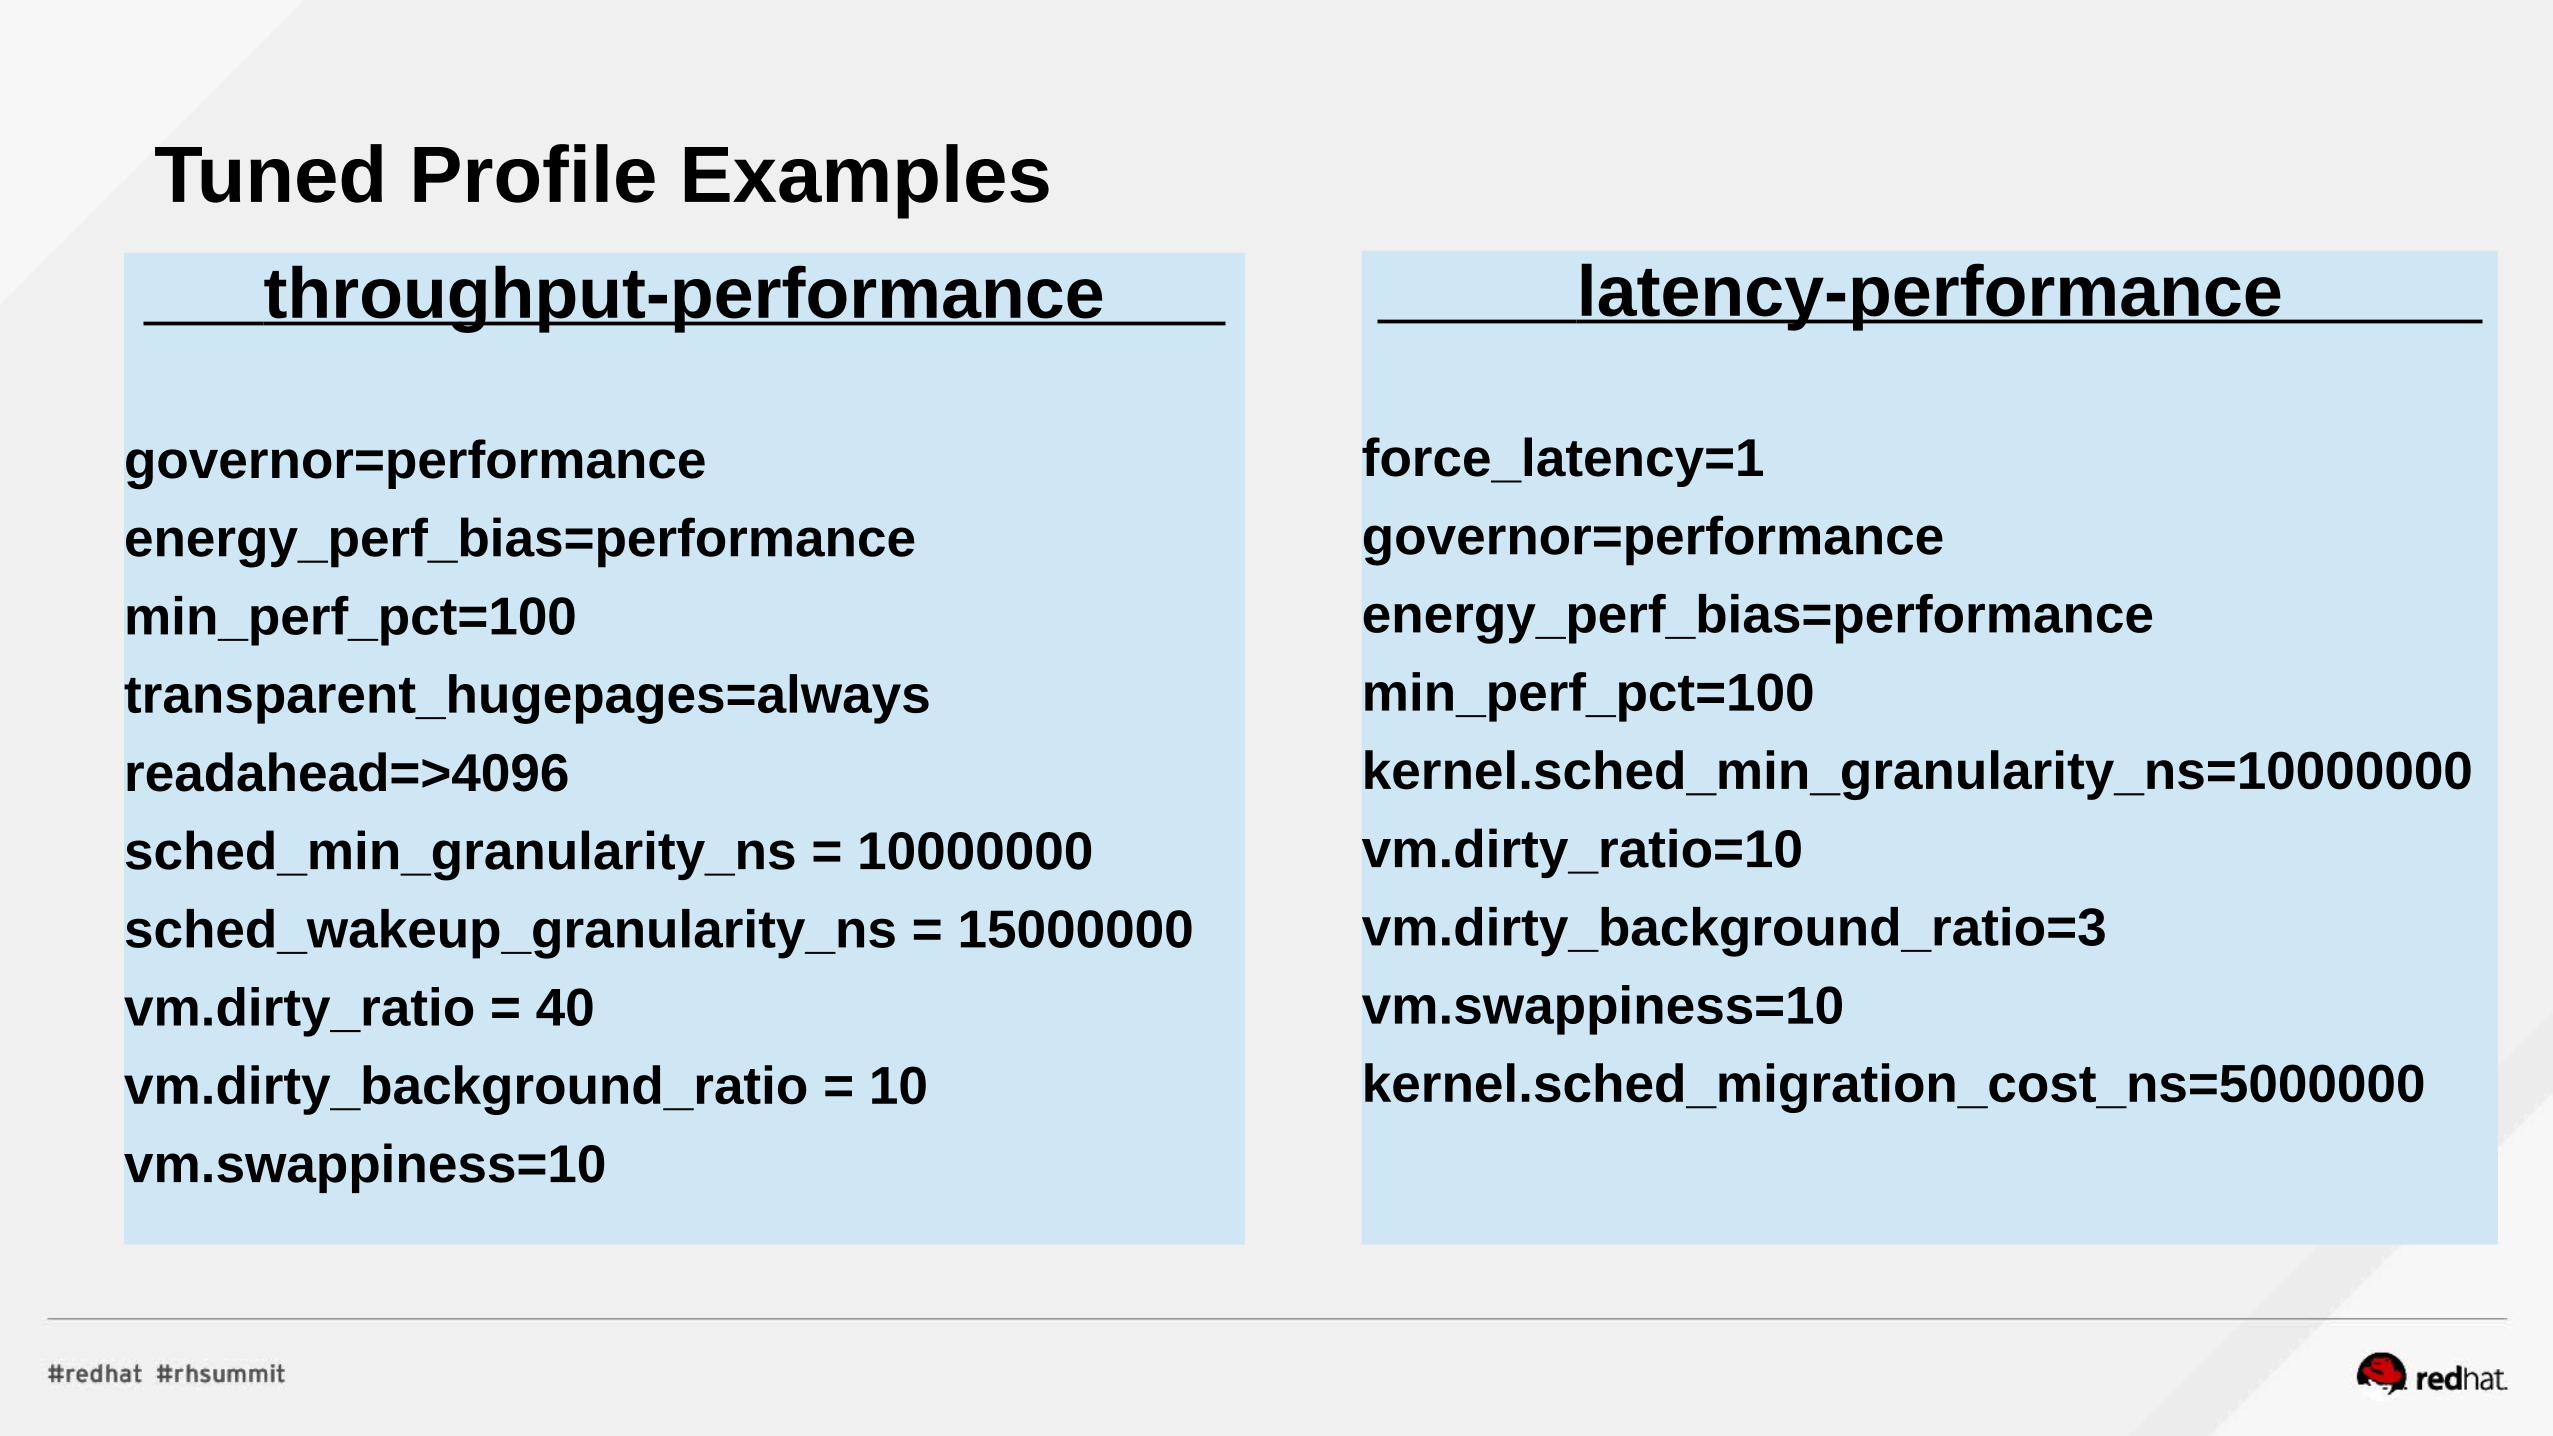
throughput-performance
governor=performance
energy_perf_bias=performance
min_perf_pct=100
transparent_hugepages=always
readahead=>4096
sched_min_granularity_ns = 10000000
sched_wakeup_granularity_ns = 15000000
vm.dirty_ratio = 40
vm.dirty_background_ratio = 10
vm.swappiness=10
latency-performance
force_latency=1
governor=performance
energy_perf_bias=performance
min_perf_pct=100
kernel.sched_min_granularity_ns=10000000
vm.dirty_ratio=10
vm.dirty_background_ratio=3
vm.swappiness=10
kernel.sched_migration_cost_ns=5000000
Tuned Profile Examples
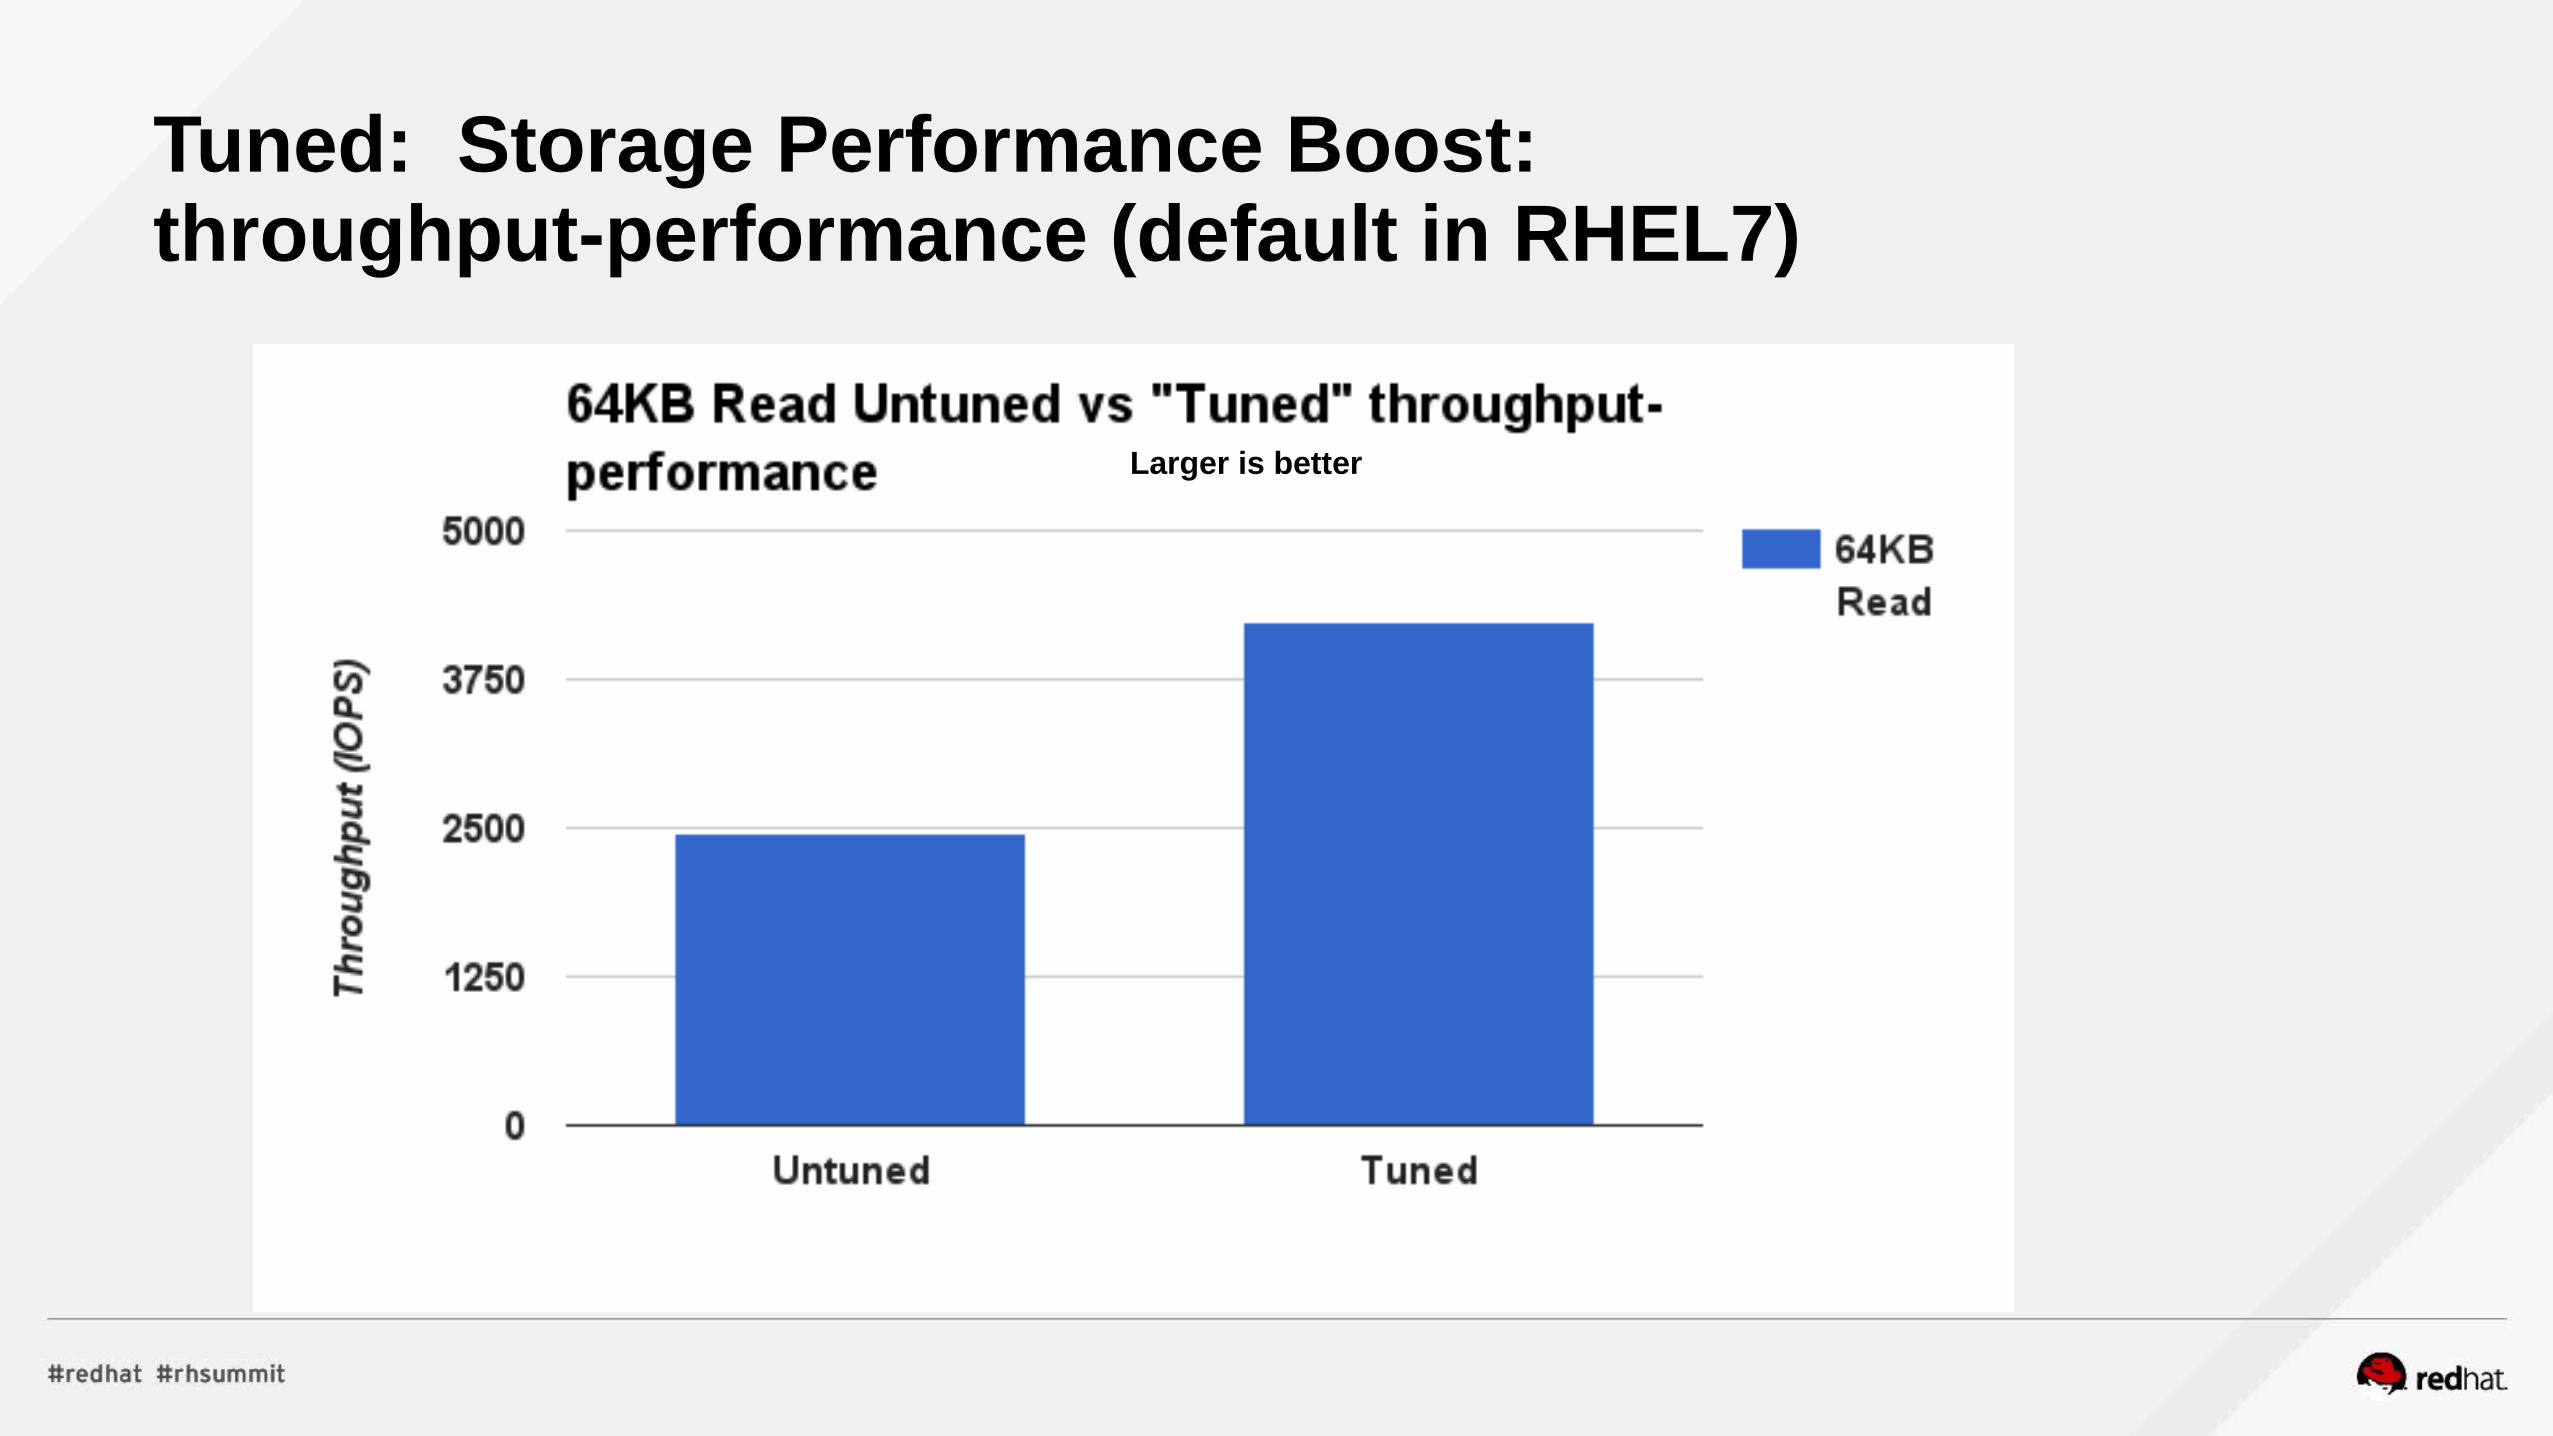
Tuned: Storage Performance Boost:throughput-performance (default in RHEL7)
Larger is better

RHEL 6/7 Non-Uniform Memory (NUMA)
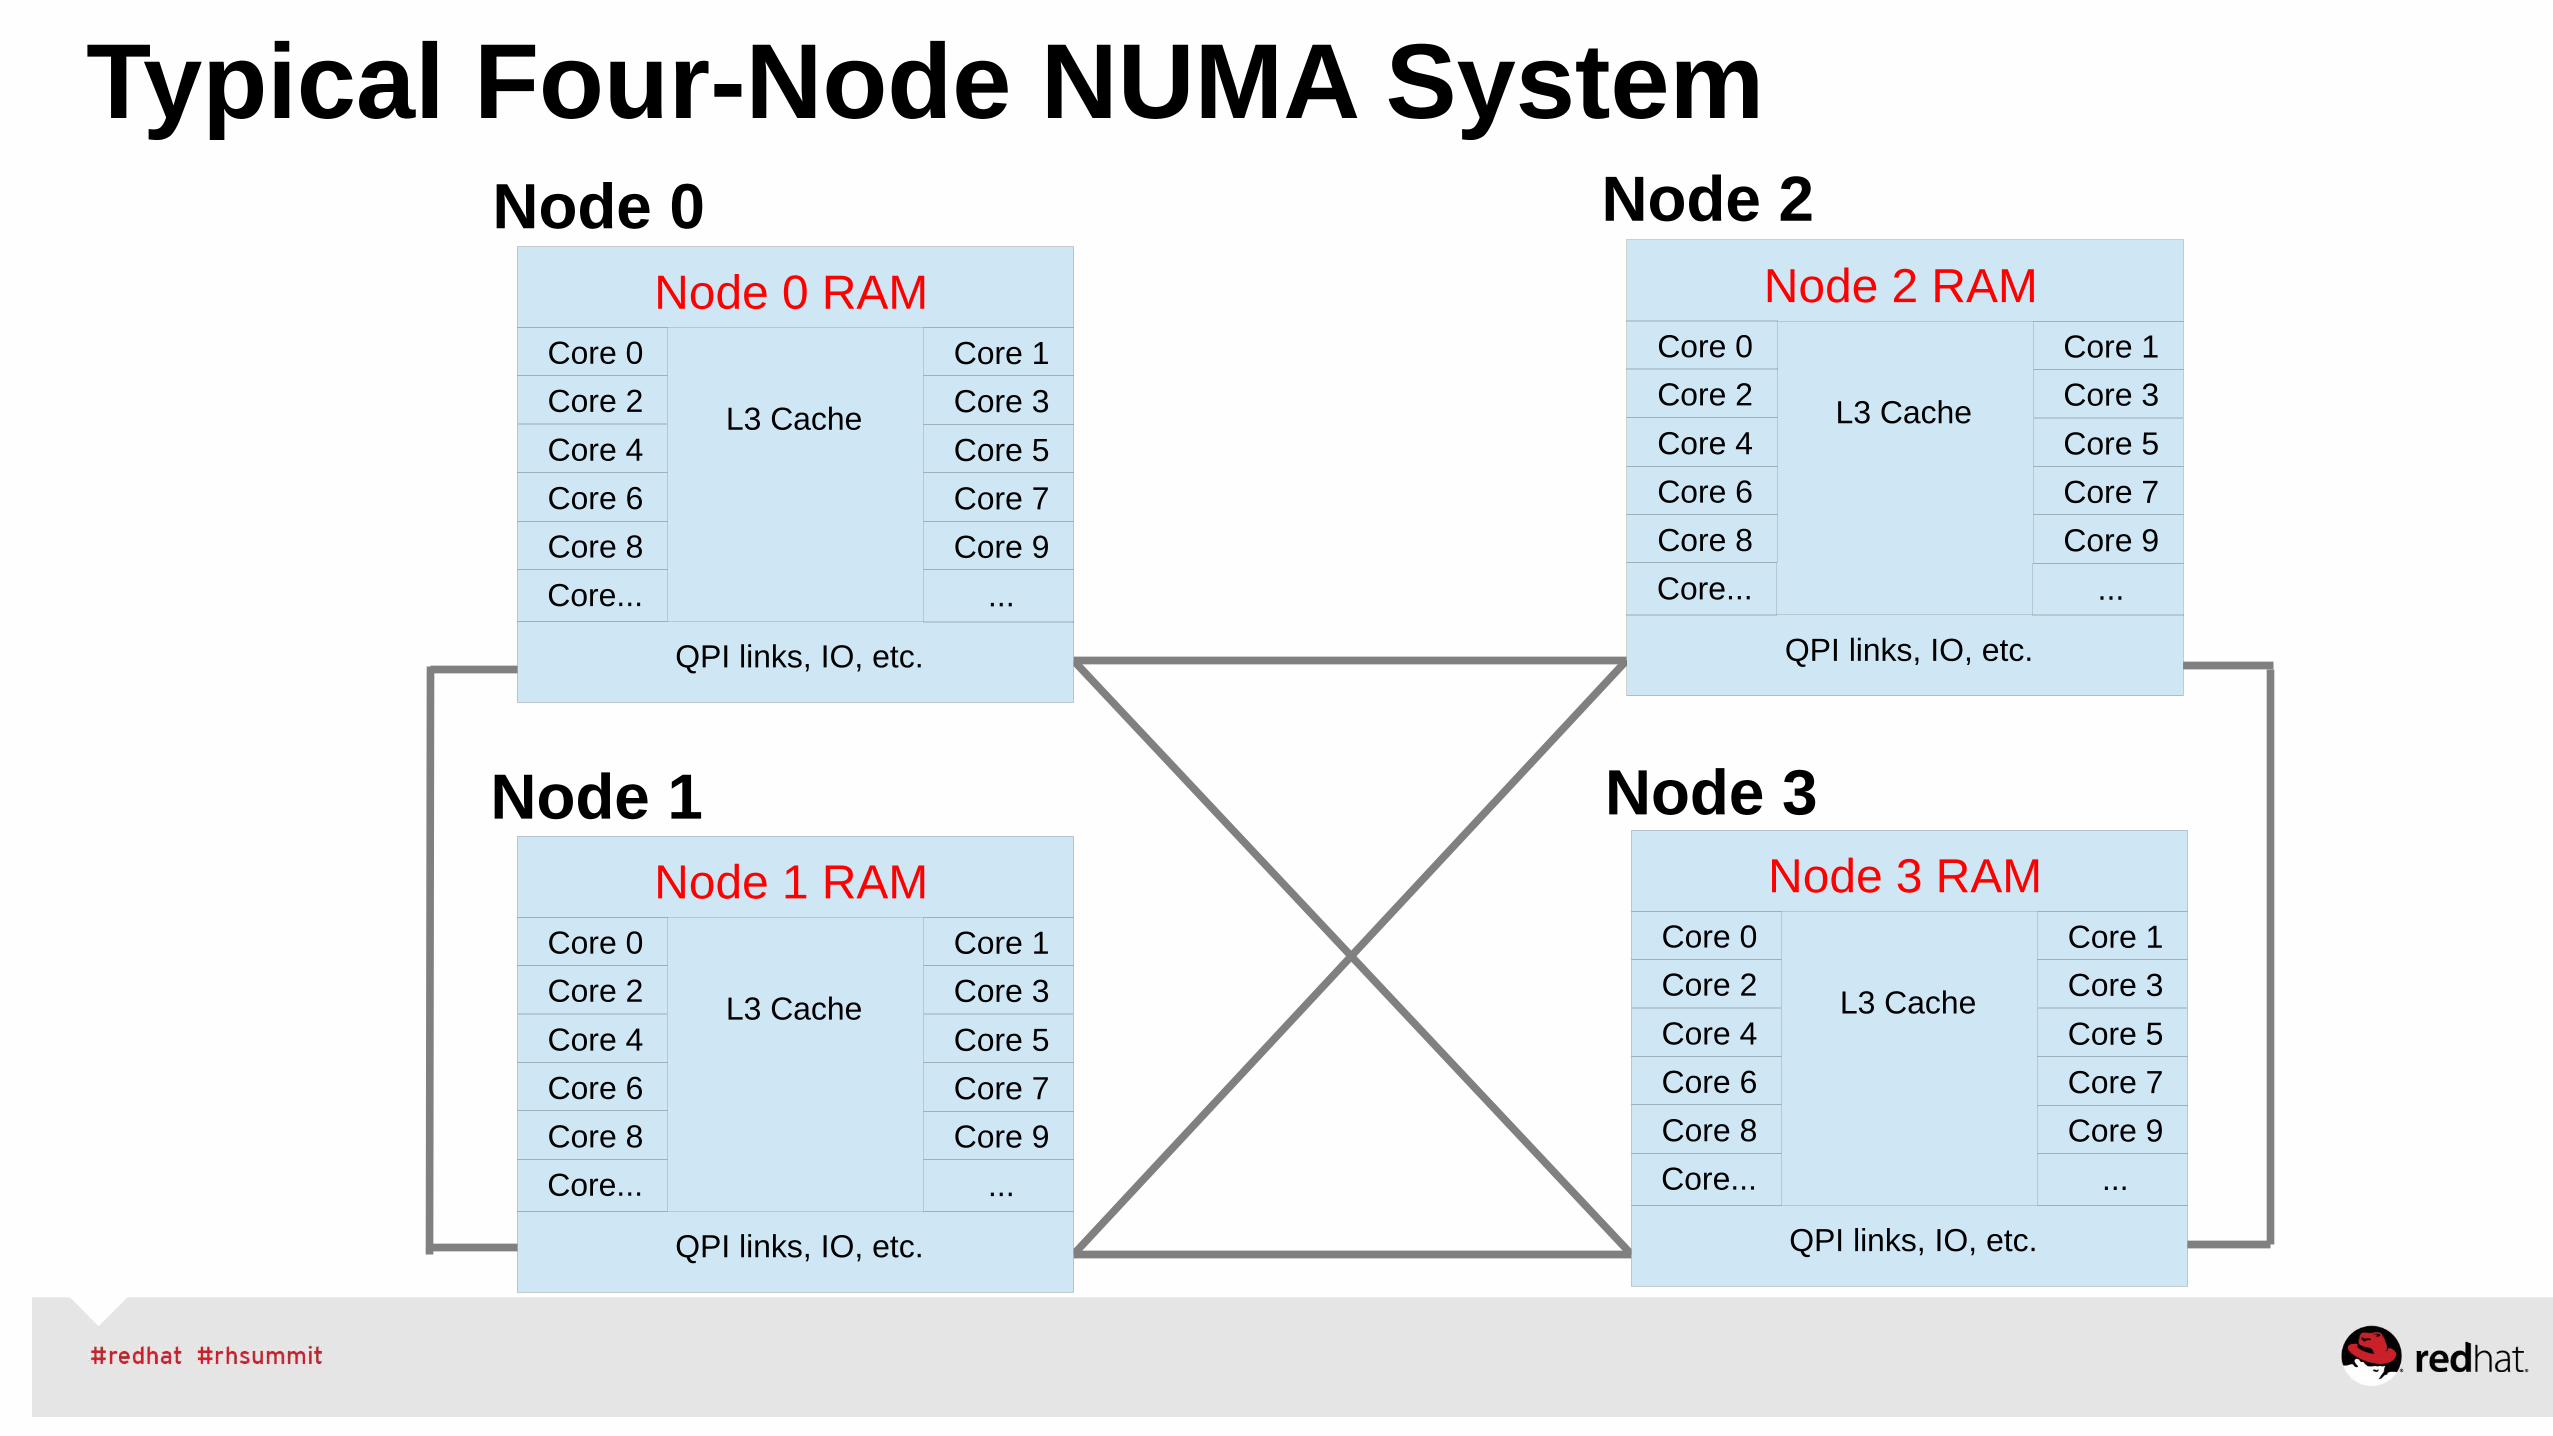
Typical Four-Node NUMA System
Node 0 RAM
QPI links, IO, etc.
L3 Cache
Node 3Node 1
Node 0 Node 2
Core 4
Core 2
Core 0
Core 6
Core 8
Core...
Core 5
Core 3
Core 1
Core 7
Core 9
...
Node 2 RAM
QPI links, IO, etc.
L3 CacheCore 4
Core 2
Core 0
Core 6
Core 8
Core...
Core 5
Core 3
Core 1
Core 7
Core 9
...
Node 3 RAM
QPI links, IO, etc.
L3 CacheCore 4
Core 2
Core 0
Core 6
Core 8
Core...
Core 5
Core 3
Core 1
Core 7
Core 9
...
Node 1 RAM
QPI links, IO, etc.
L3 CacheCore 4
Core 2
Core 0
Core 6
Core 8
Core...
Core 5
Core 3
Core 1
Core 7
Core 9
...
RED HAT CONFIDENTIAL | Joe Mario#rhconvergence
17
CPU CPUCPU CPU
Memory
Numa node 0
CPU CPUCPU CPU
Memory
Numa node 1
CPU CPUCPU CPU
CPU CPUCPU CPU
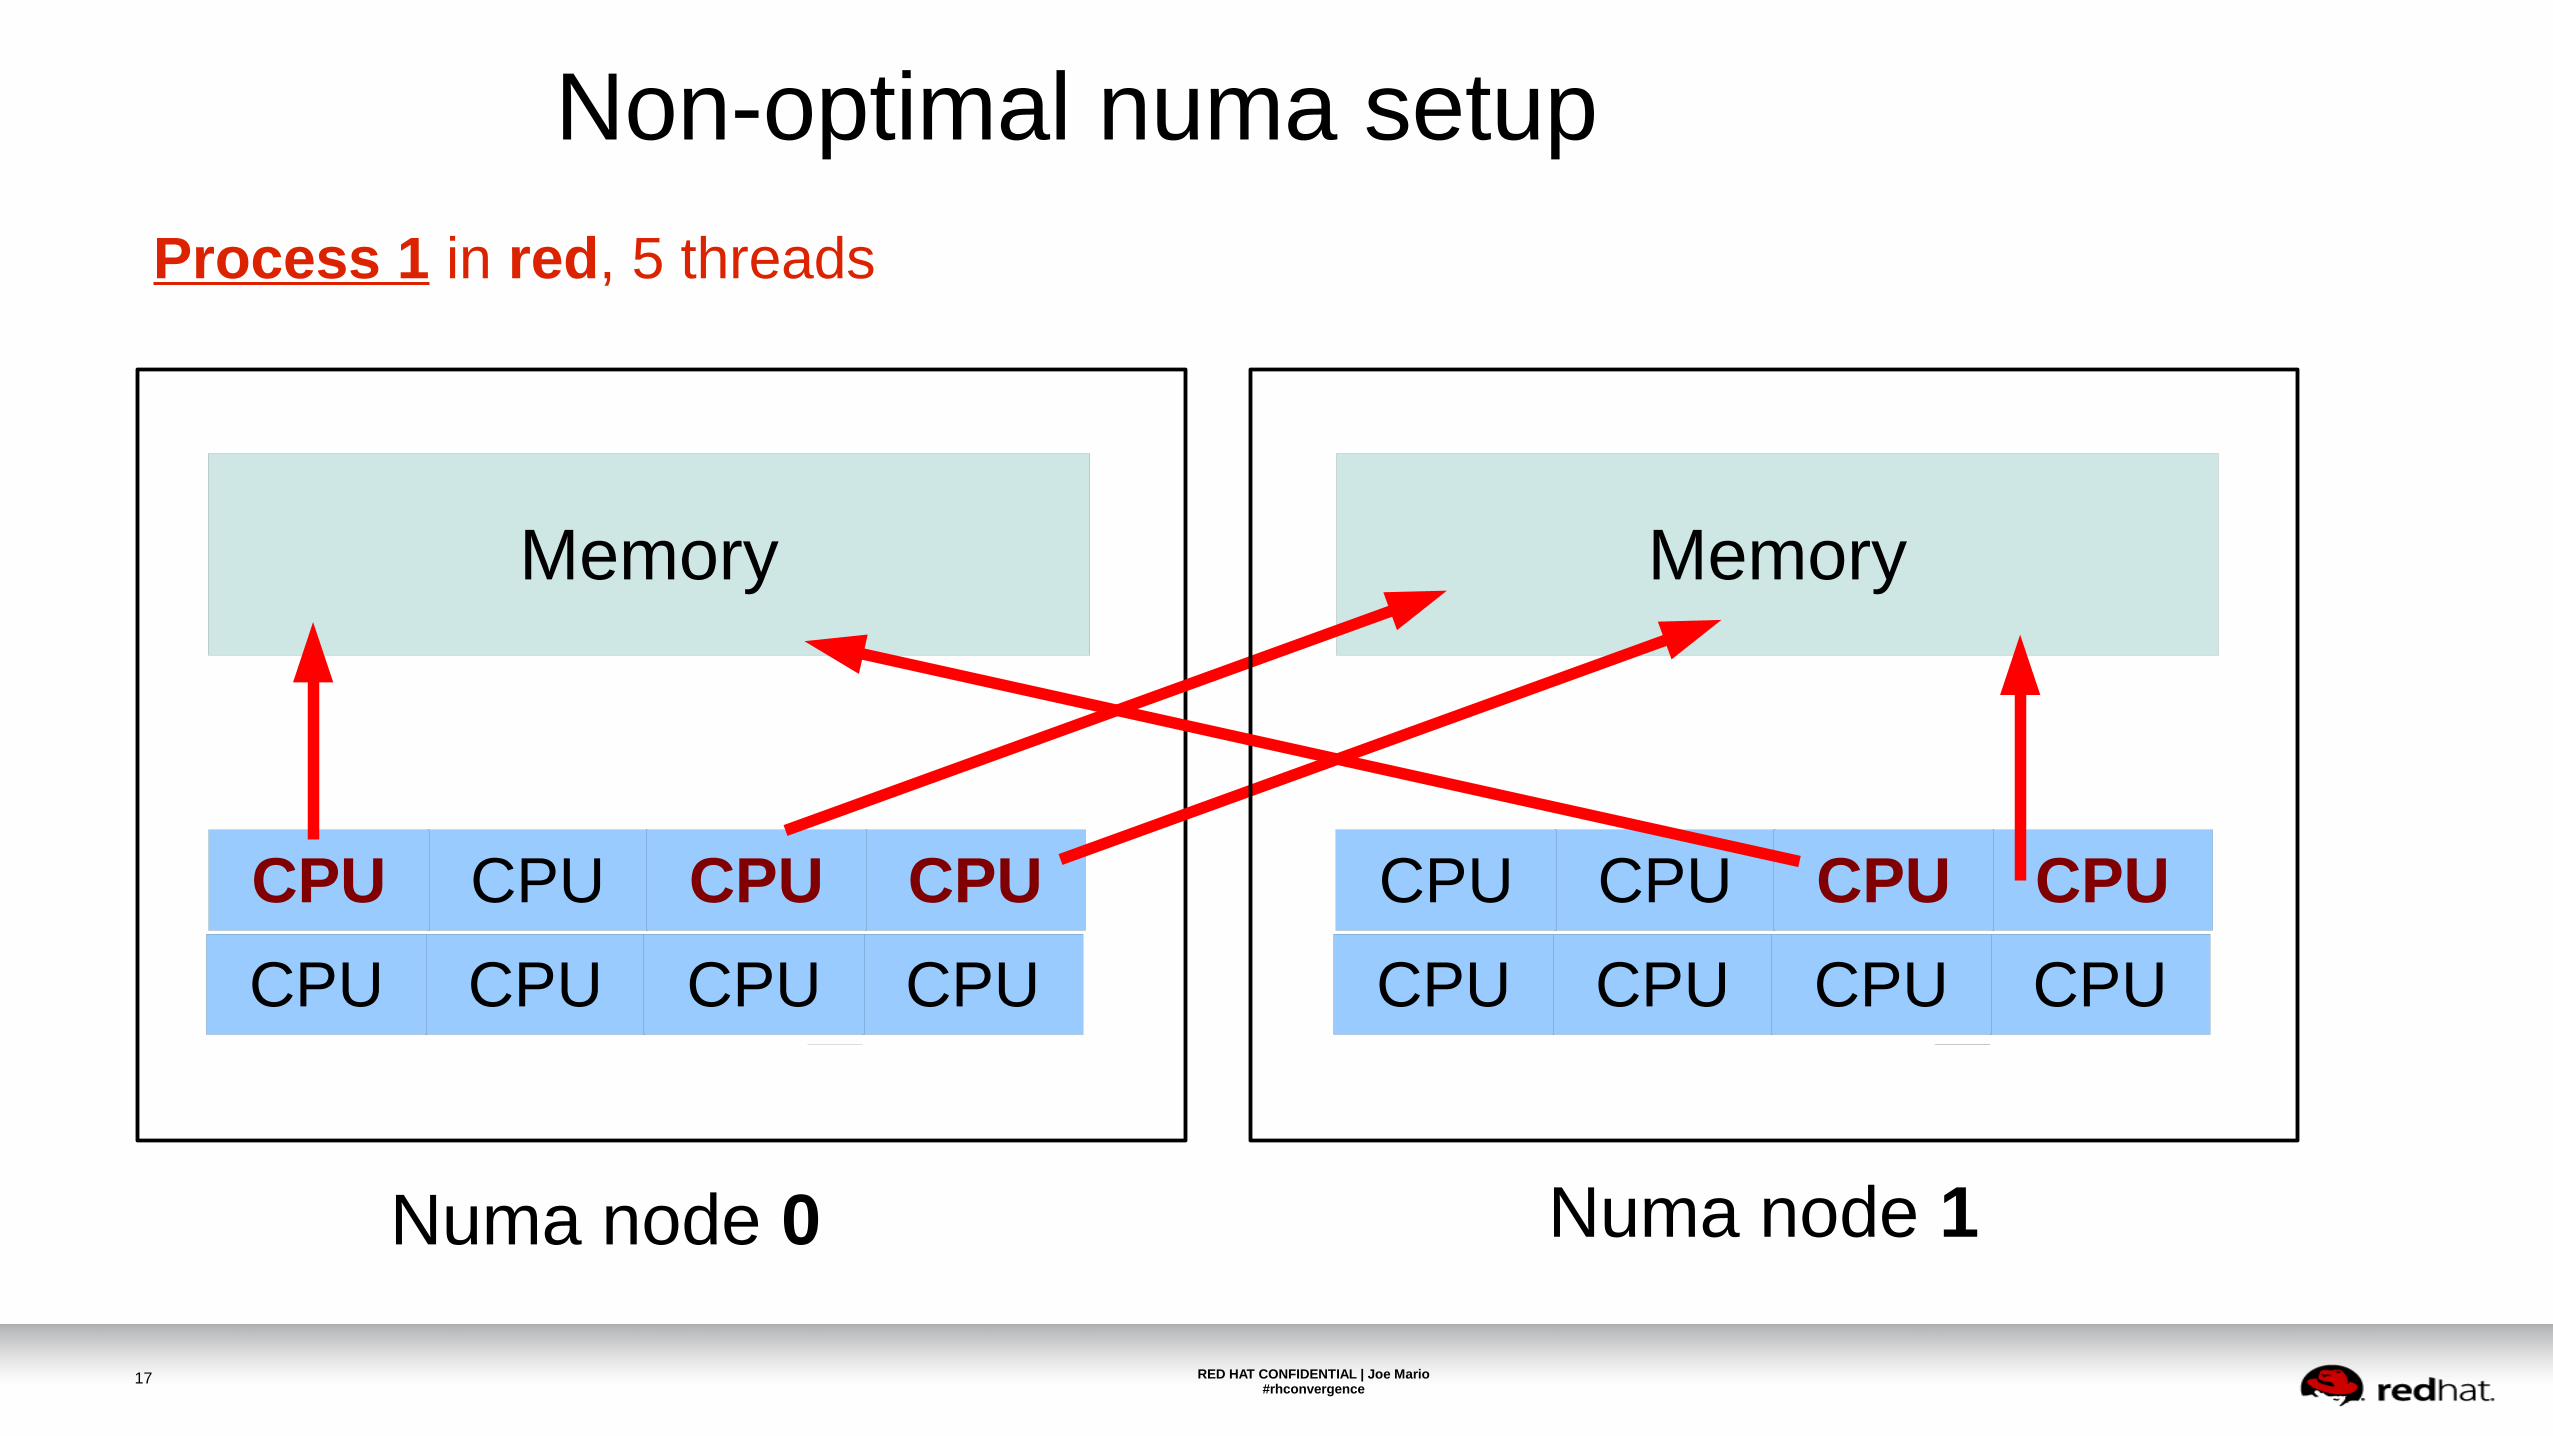
Non-optimal numa setup
Process 1 in red, 5 threads
RED HAT CONFIDENTIAL | Joe Mario#rhconvergence
18
CPU CPUCPU CPU
Memory
Numa node 0
CPU CPUCPU CPU
Memory
Numa node 1
CPU CPUCPU CPU
CPU CPUCPU CPU
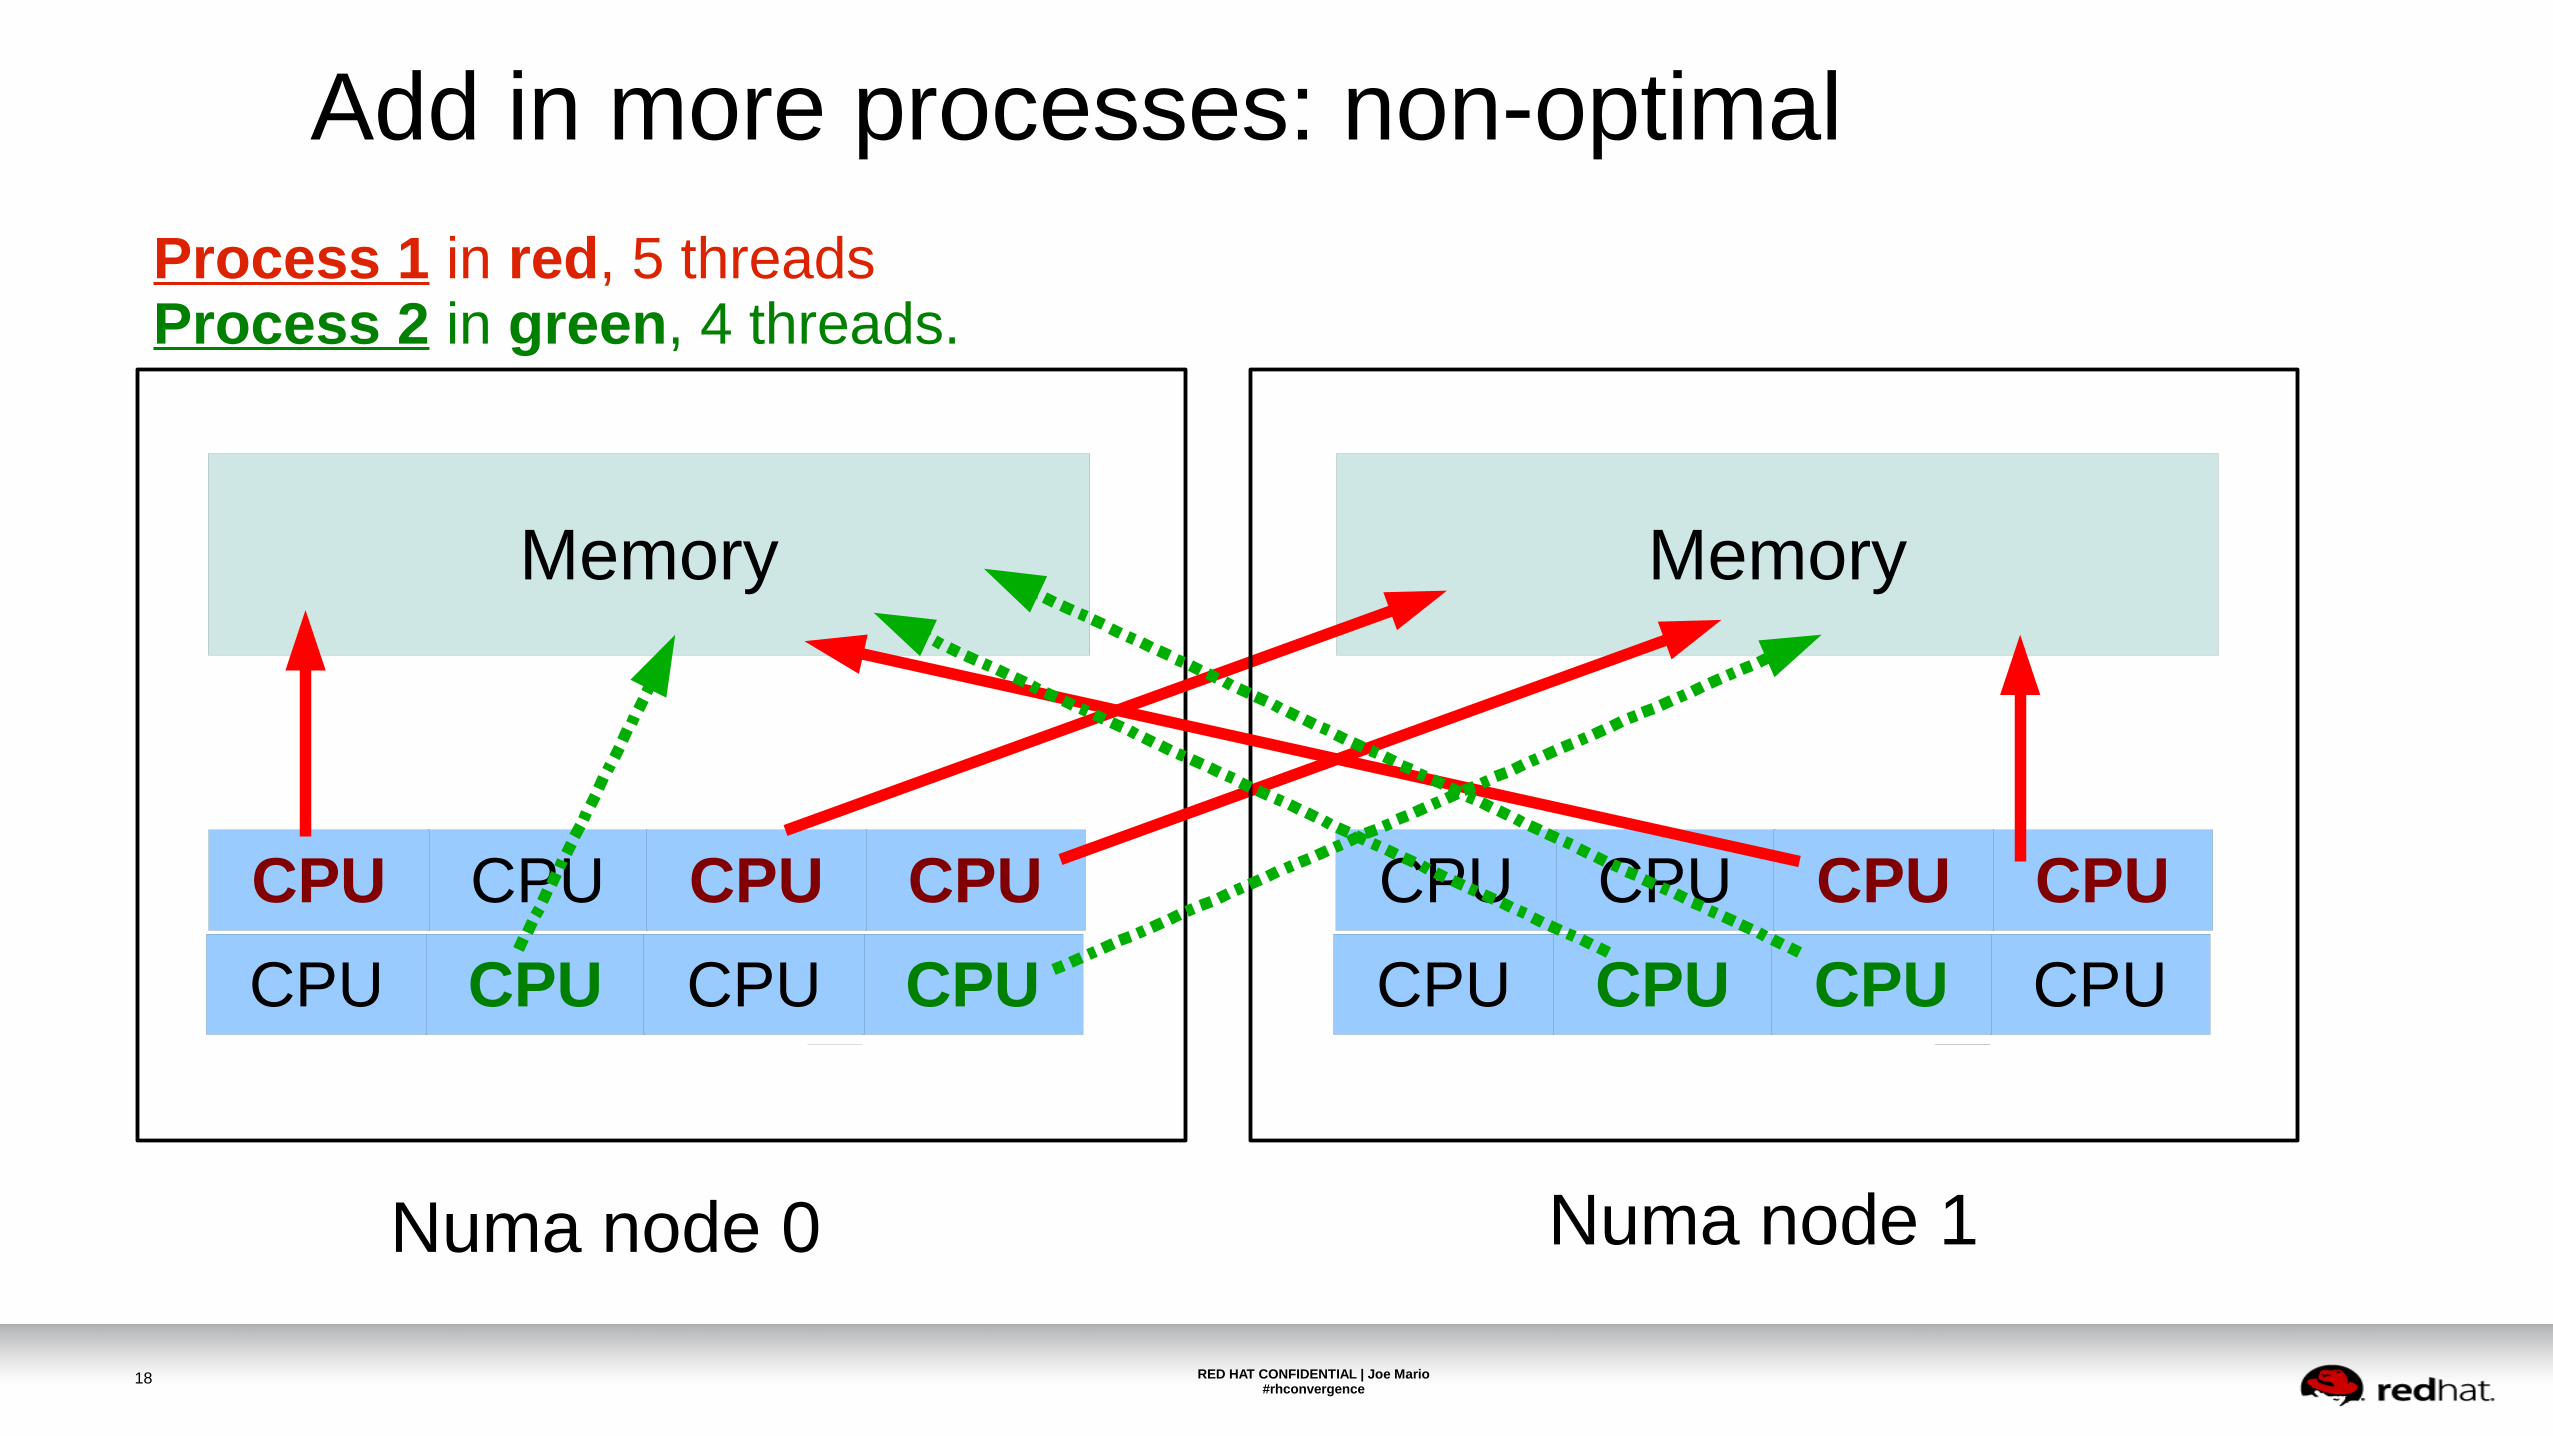
Add in more processes: non-optimal
Process 1 in red, 5 threadsProcess 2 in green, 4 threads.
RED HAT CONFIDENTIAL | Joe Mario#rhconvergence
19
CPU CPUCPU CPU
Memory
Numa node 0
CPU CPUCPU CPU
Memory
Numa node 1
CPU CPUCPU CPU
CPU CPUCPU CPU
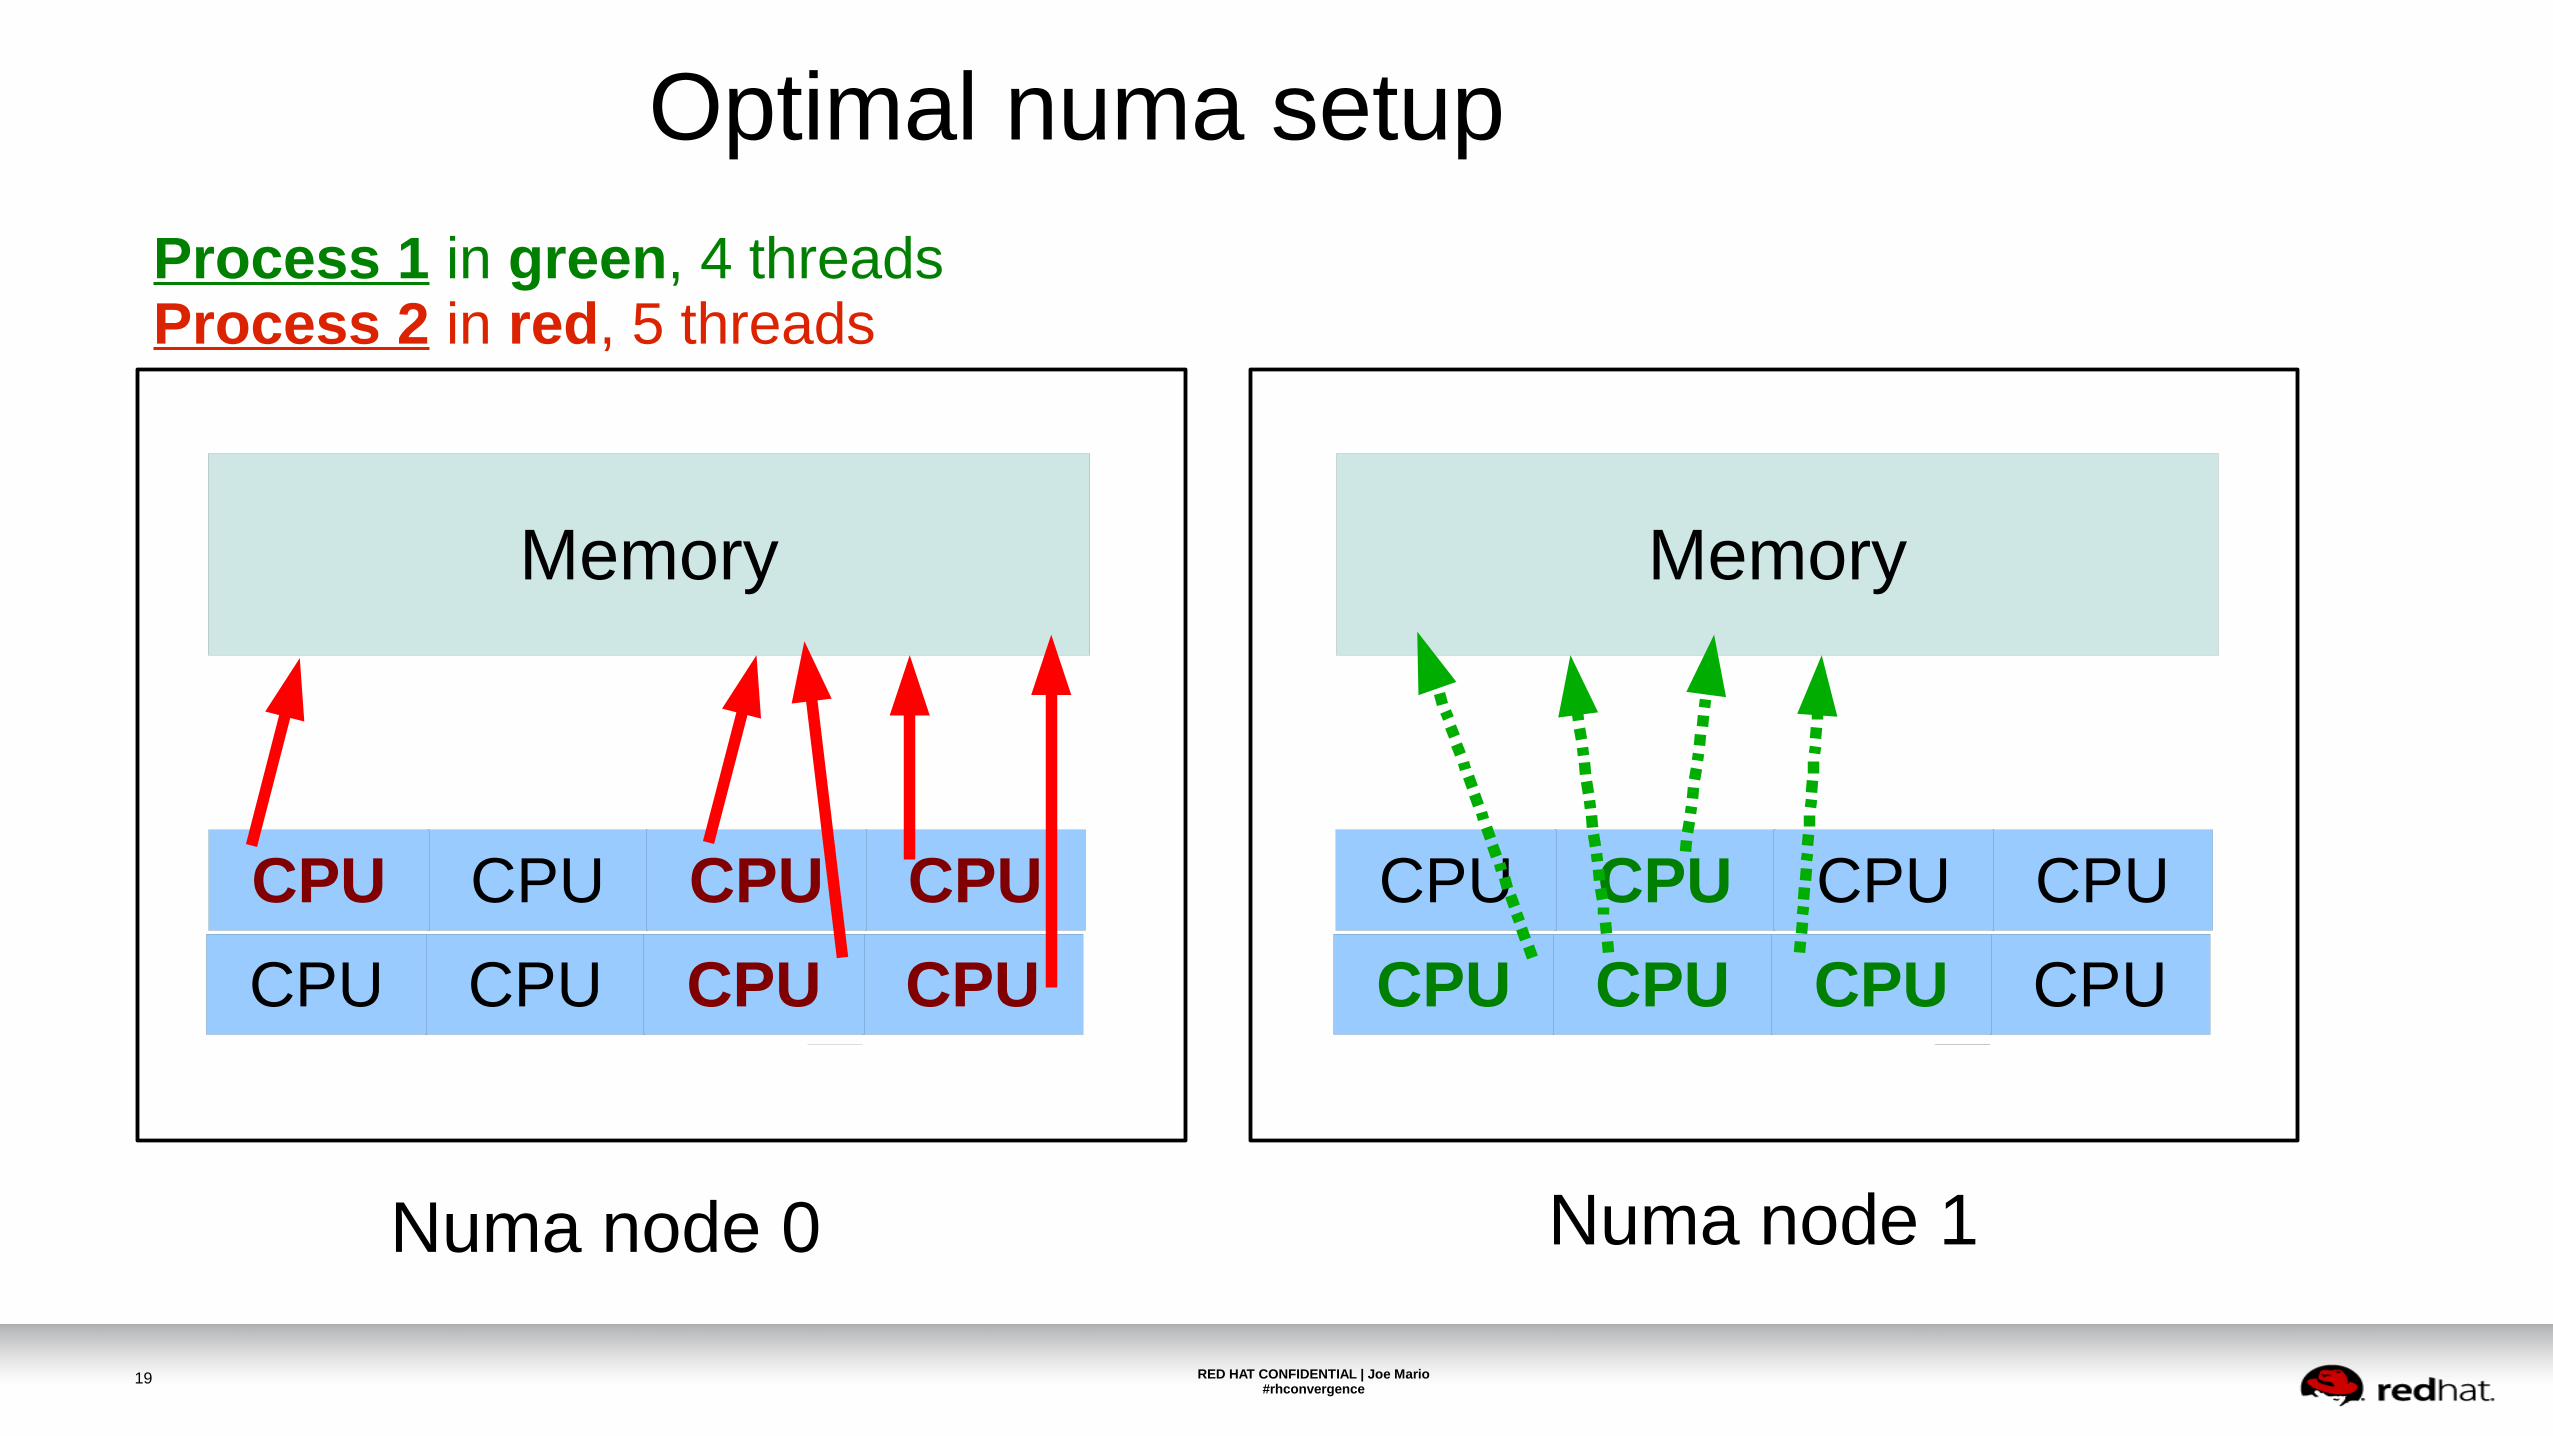
Optimal numa setup
Process 1 in green, 4 threadsProcess 2 in red, 5 threads
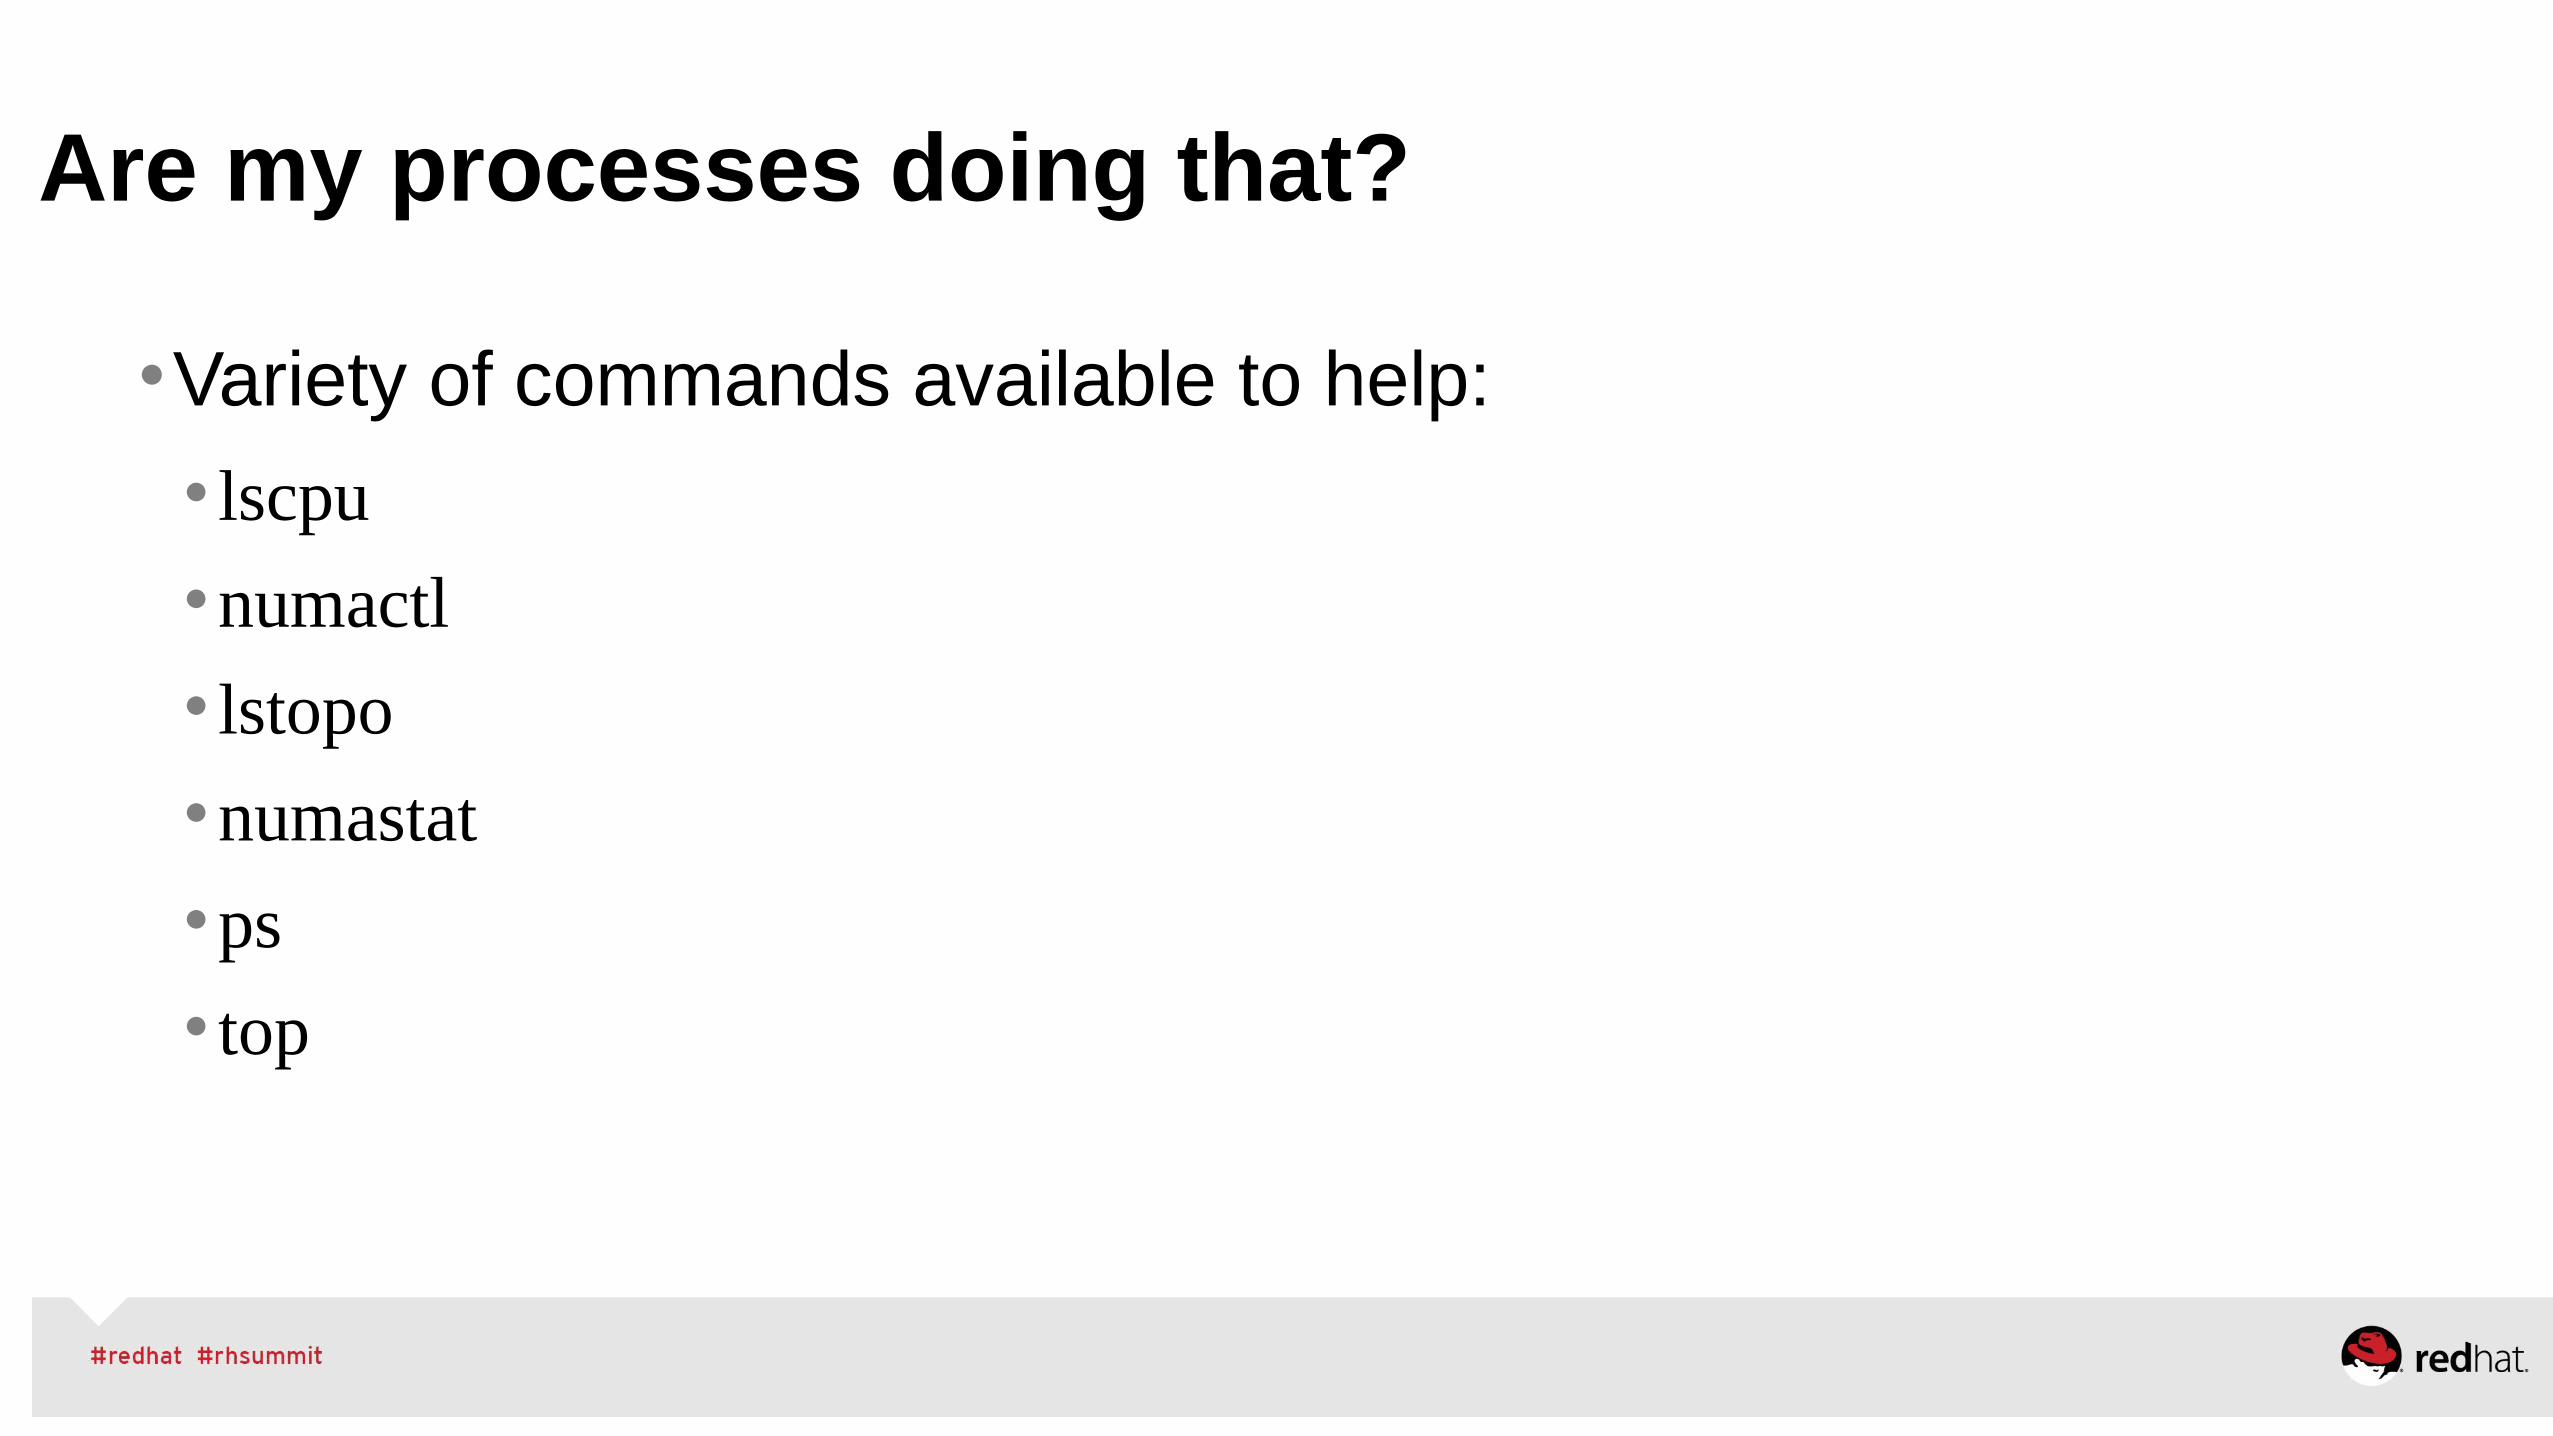
Are my processes doing that?
•Variety of commands available to help:
• lscpu
•numactl
• lstopo
•numastat
•ps
• top
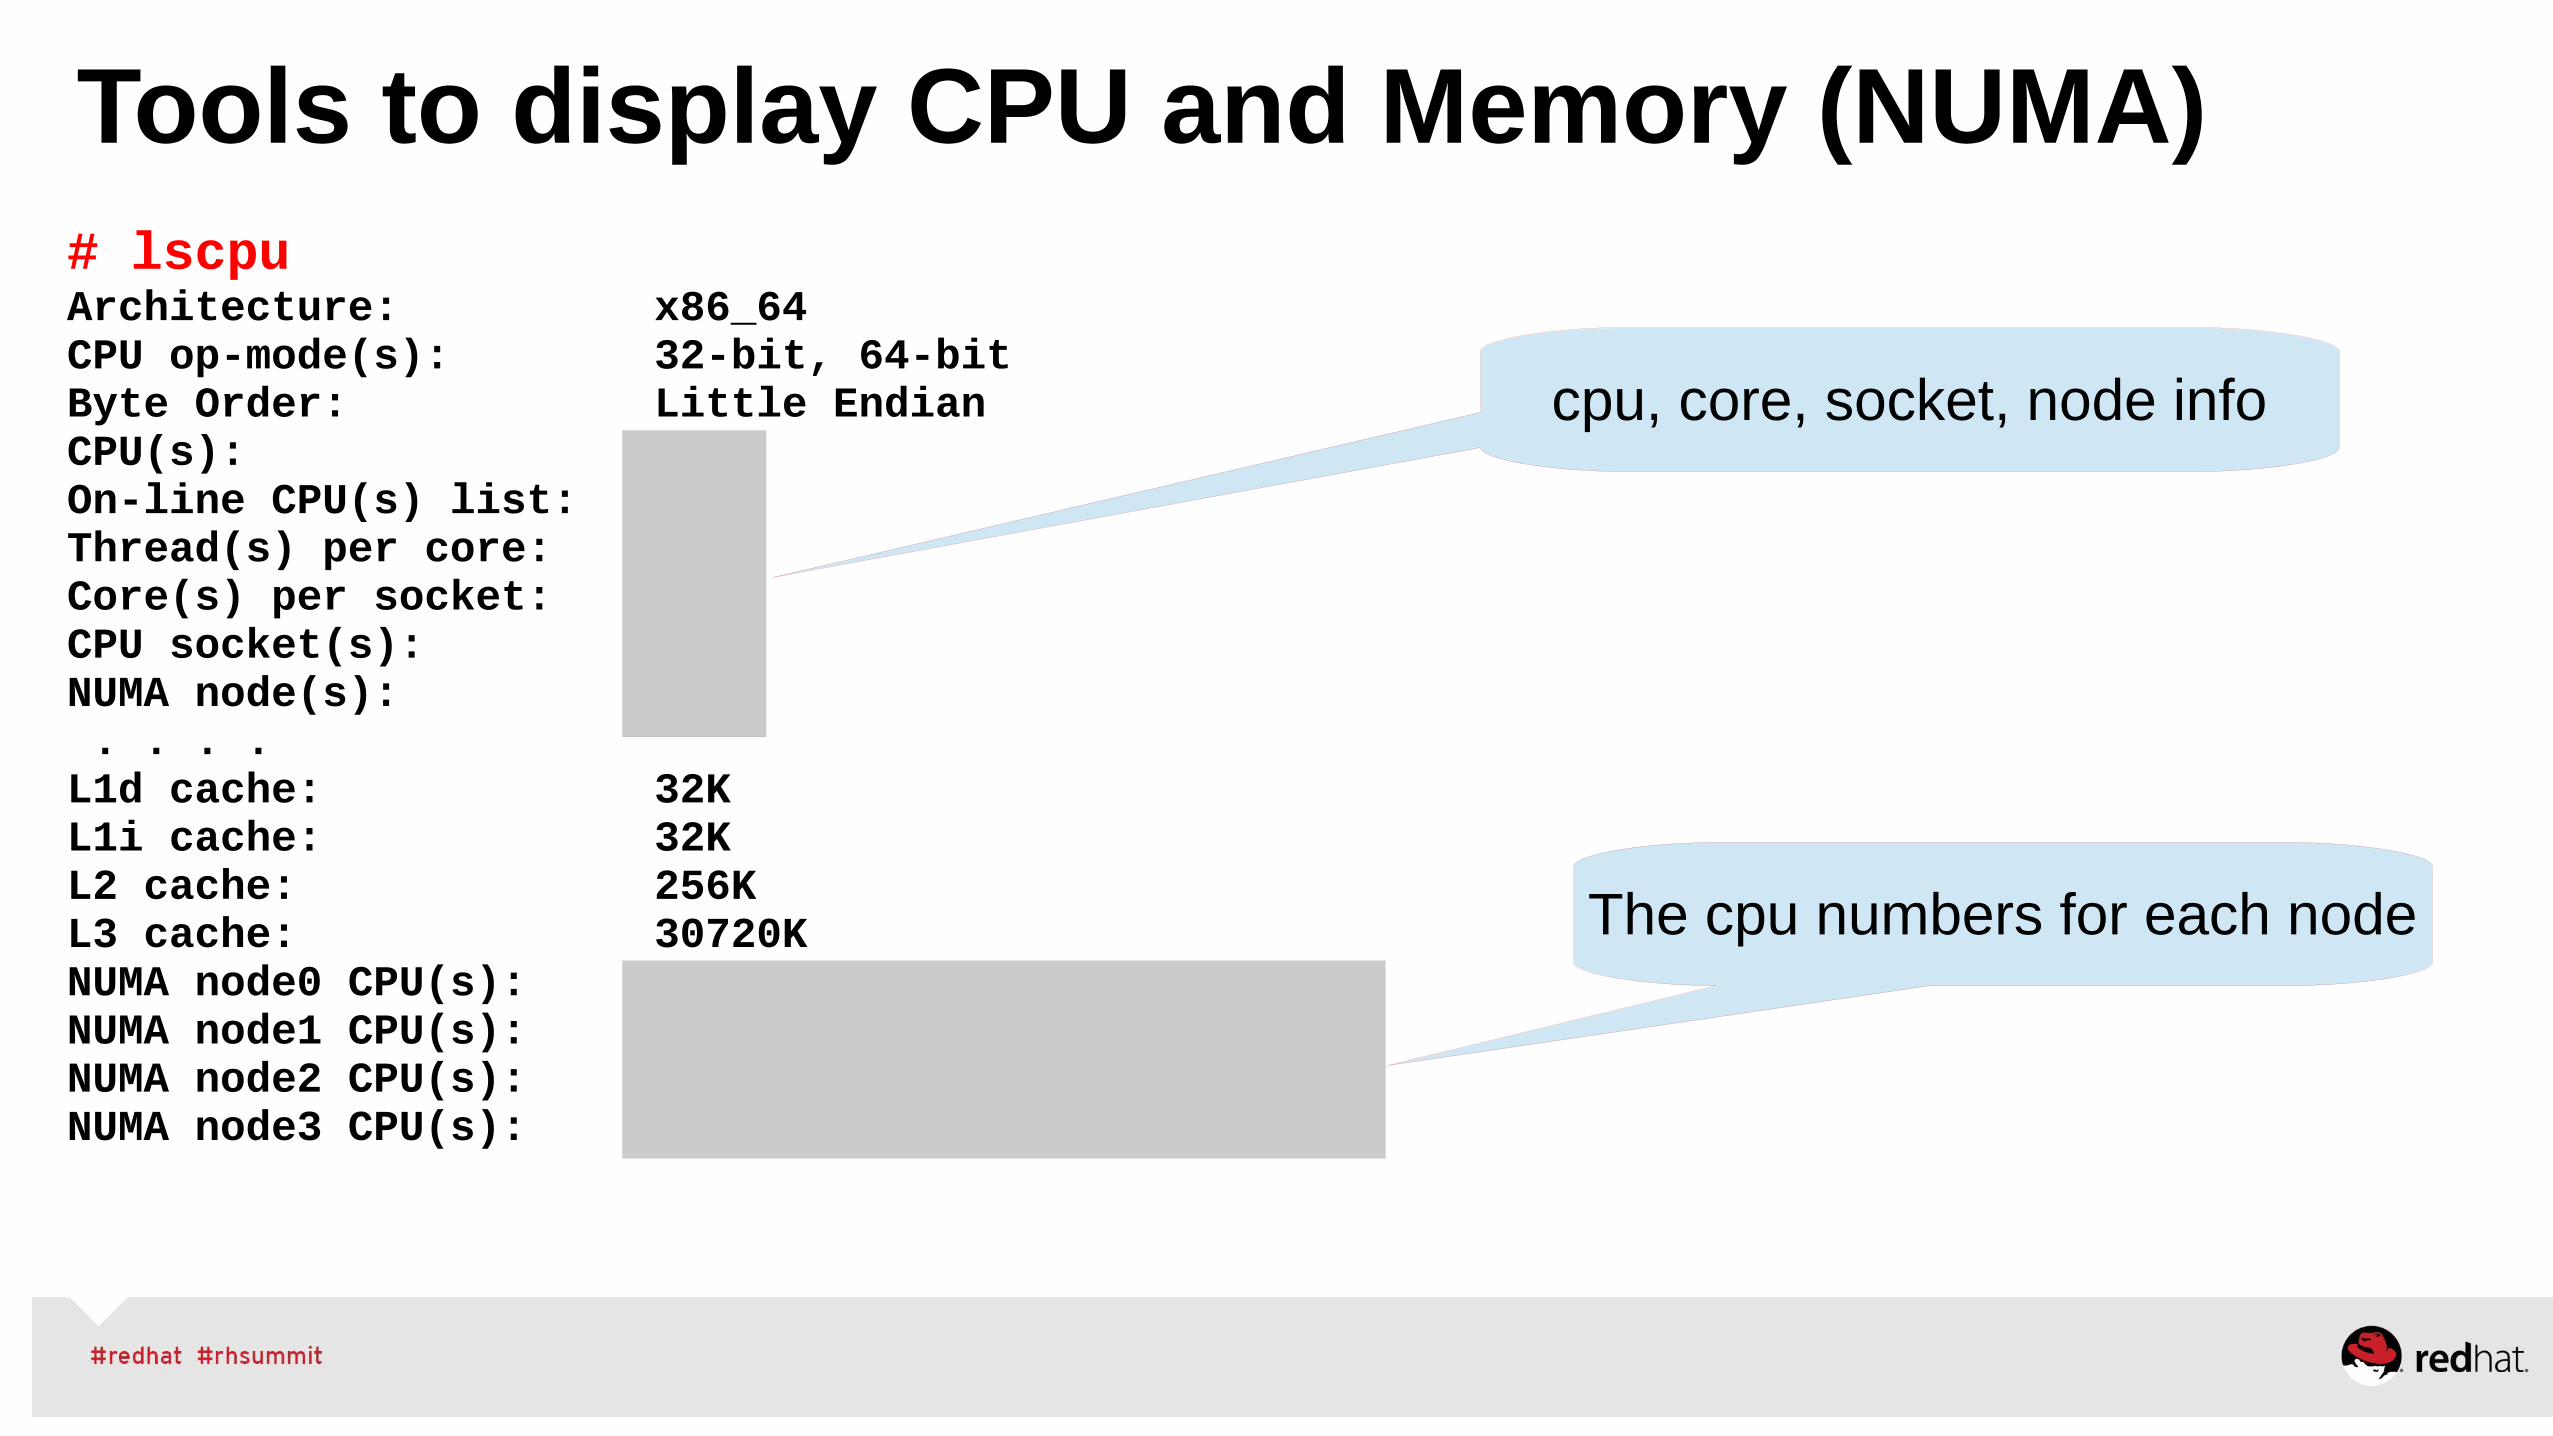
Tools to display CPU and Memory (NUMA) # lscpuArchitecture: x86_64CPU op-mode(s): 32-bit, 64-bitByte Order: Little EndianCPU(s): 40On-line CPU(s) list: 0-39Thread(s) per core: 1Core(s) per socket: 10CPU socket(s): 4NUMA node(s): 4 . . . .L1d cache: 32KL1i cache: 32KL2 cache: 256KL3 cache: 30720KNUMA node0 CPU(s): 0,4,8,12,16,20,24,28,32,36NUMA node1 CPU(s): 2,6,10,14,18,22,26,30,34,38NUMA node2 CPU(s): 1,5,9,13,17,21,25,29,33,37NUMA node3 CPU(s): 3,7,11,15,19,23,27,31,35,39
The cpu numbers for each node
cpu, core, socket, node info
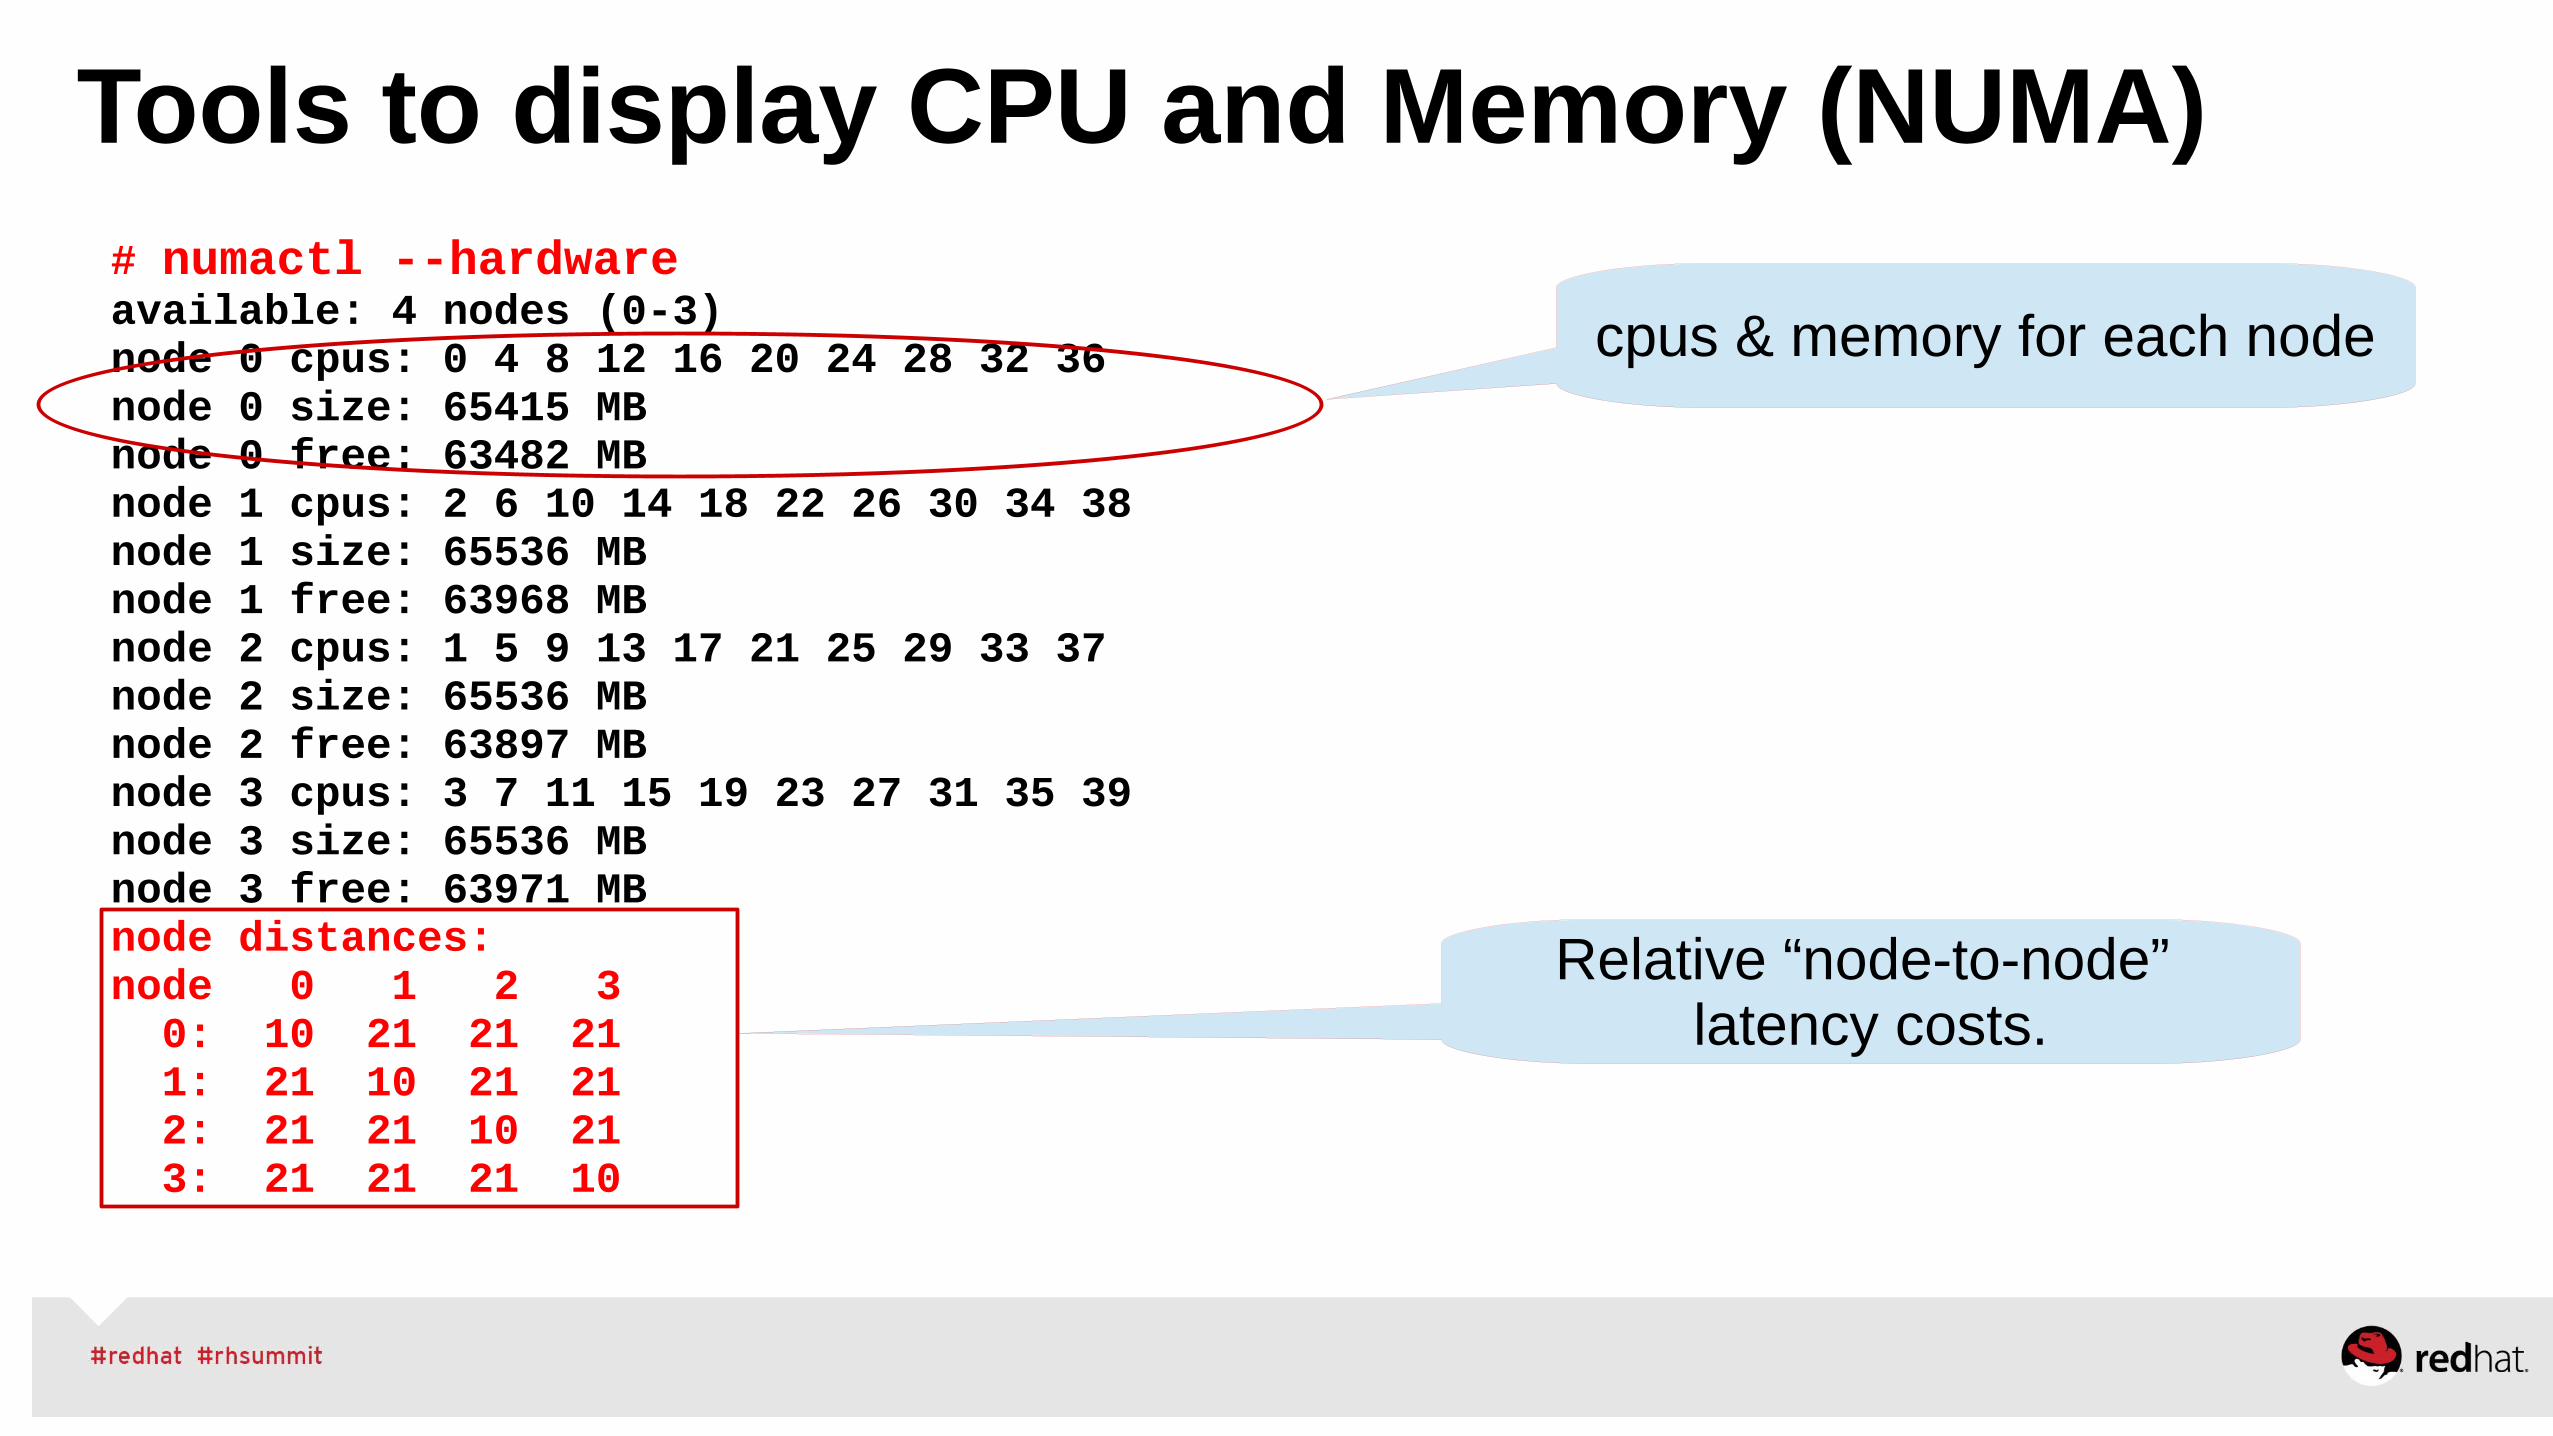
Tools to display CPU and Memory (NUMA) # numactl --hardwareavailable: 4 nodes (0-3)node 0 cpus: 0 4 8 12 16 20 24 28 32 36node 0 size: 65415 MBnode 0 free: 63482 MBnode 1 cpus: 2 6 10 14 18 22 26 30 34 38node 1 size: 65536 MBnode 1 free: 63968 MBnode 2 cpus: 1 5 9 13 17 21 25 29 33 37node 2 size: 65536 MBnode 2 free: 63897 MBnode 3 cpus: 3 7 11 15 19 23 27 31 35 39node 3 size: 65536 MBnode 3 free: 63971 MBnode distances:node 0 1 2 3 0: 10 21 21 21 1: 21 10 21 21 2: 21 21 10 21 3: 21 21 21 10
cpus & memory for each node
Relative “node-to-node” latency costs.
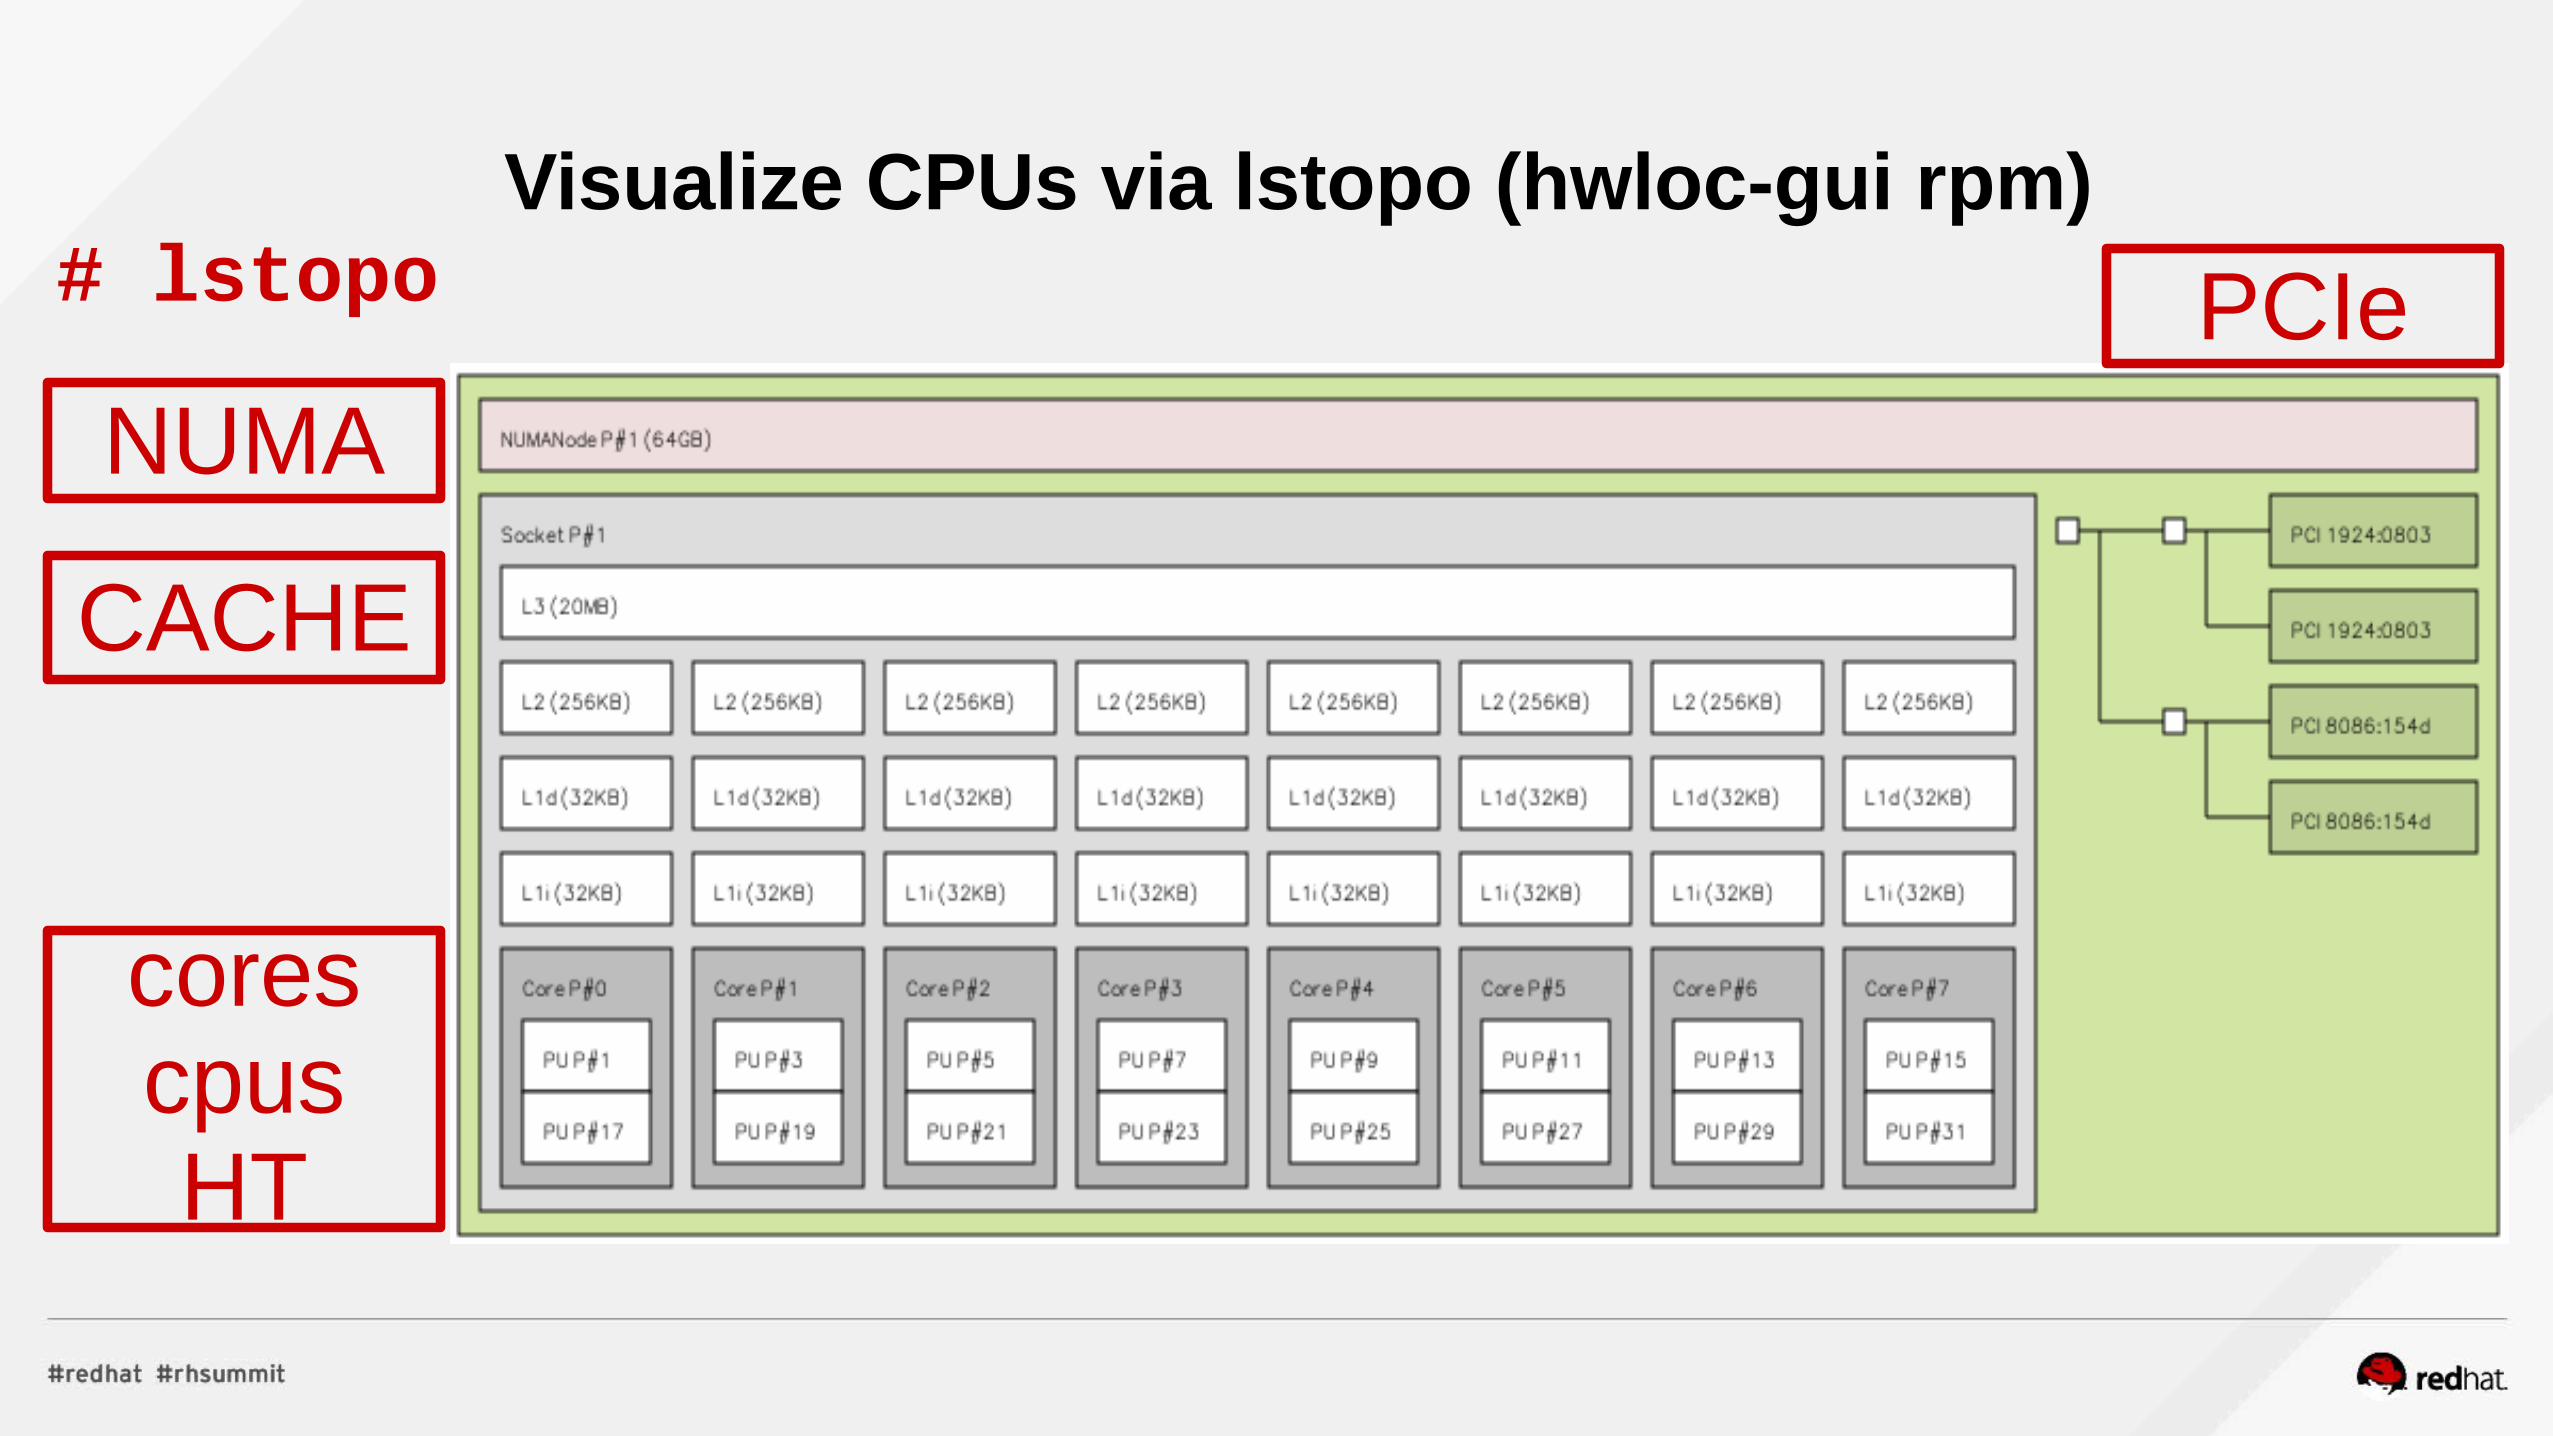
Visualize CPUs via lstopo (hwloc-gui rpm)# lstopo
NUMA
CACHE
PCIe
corescpusHT
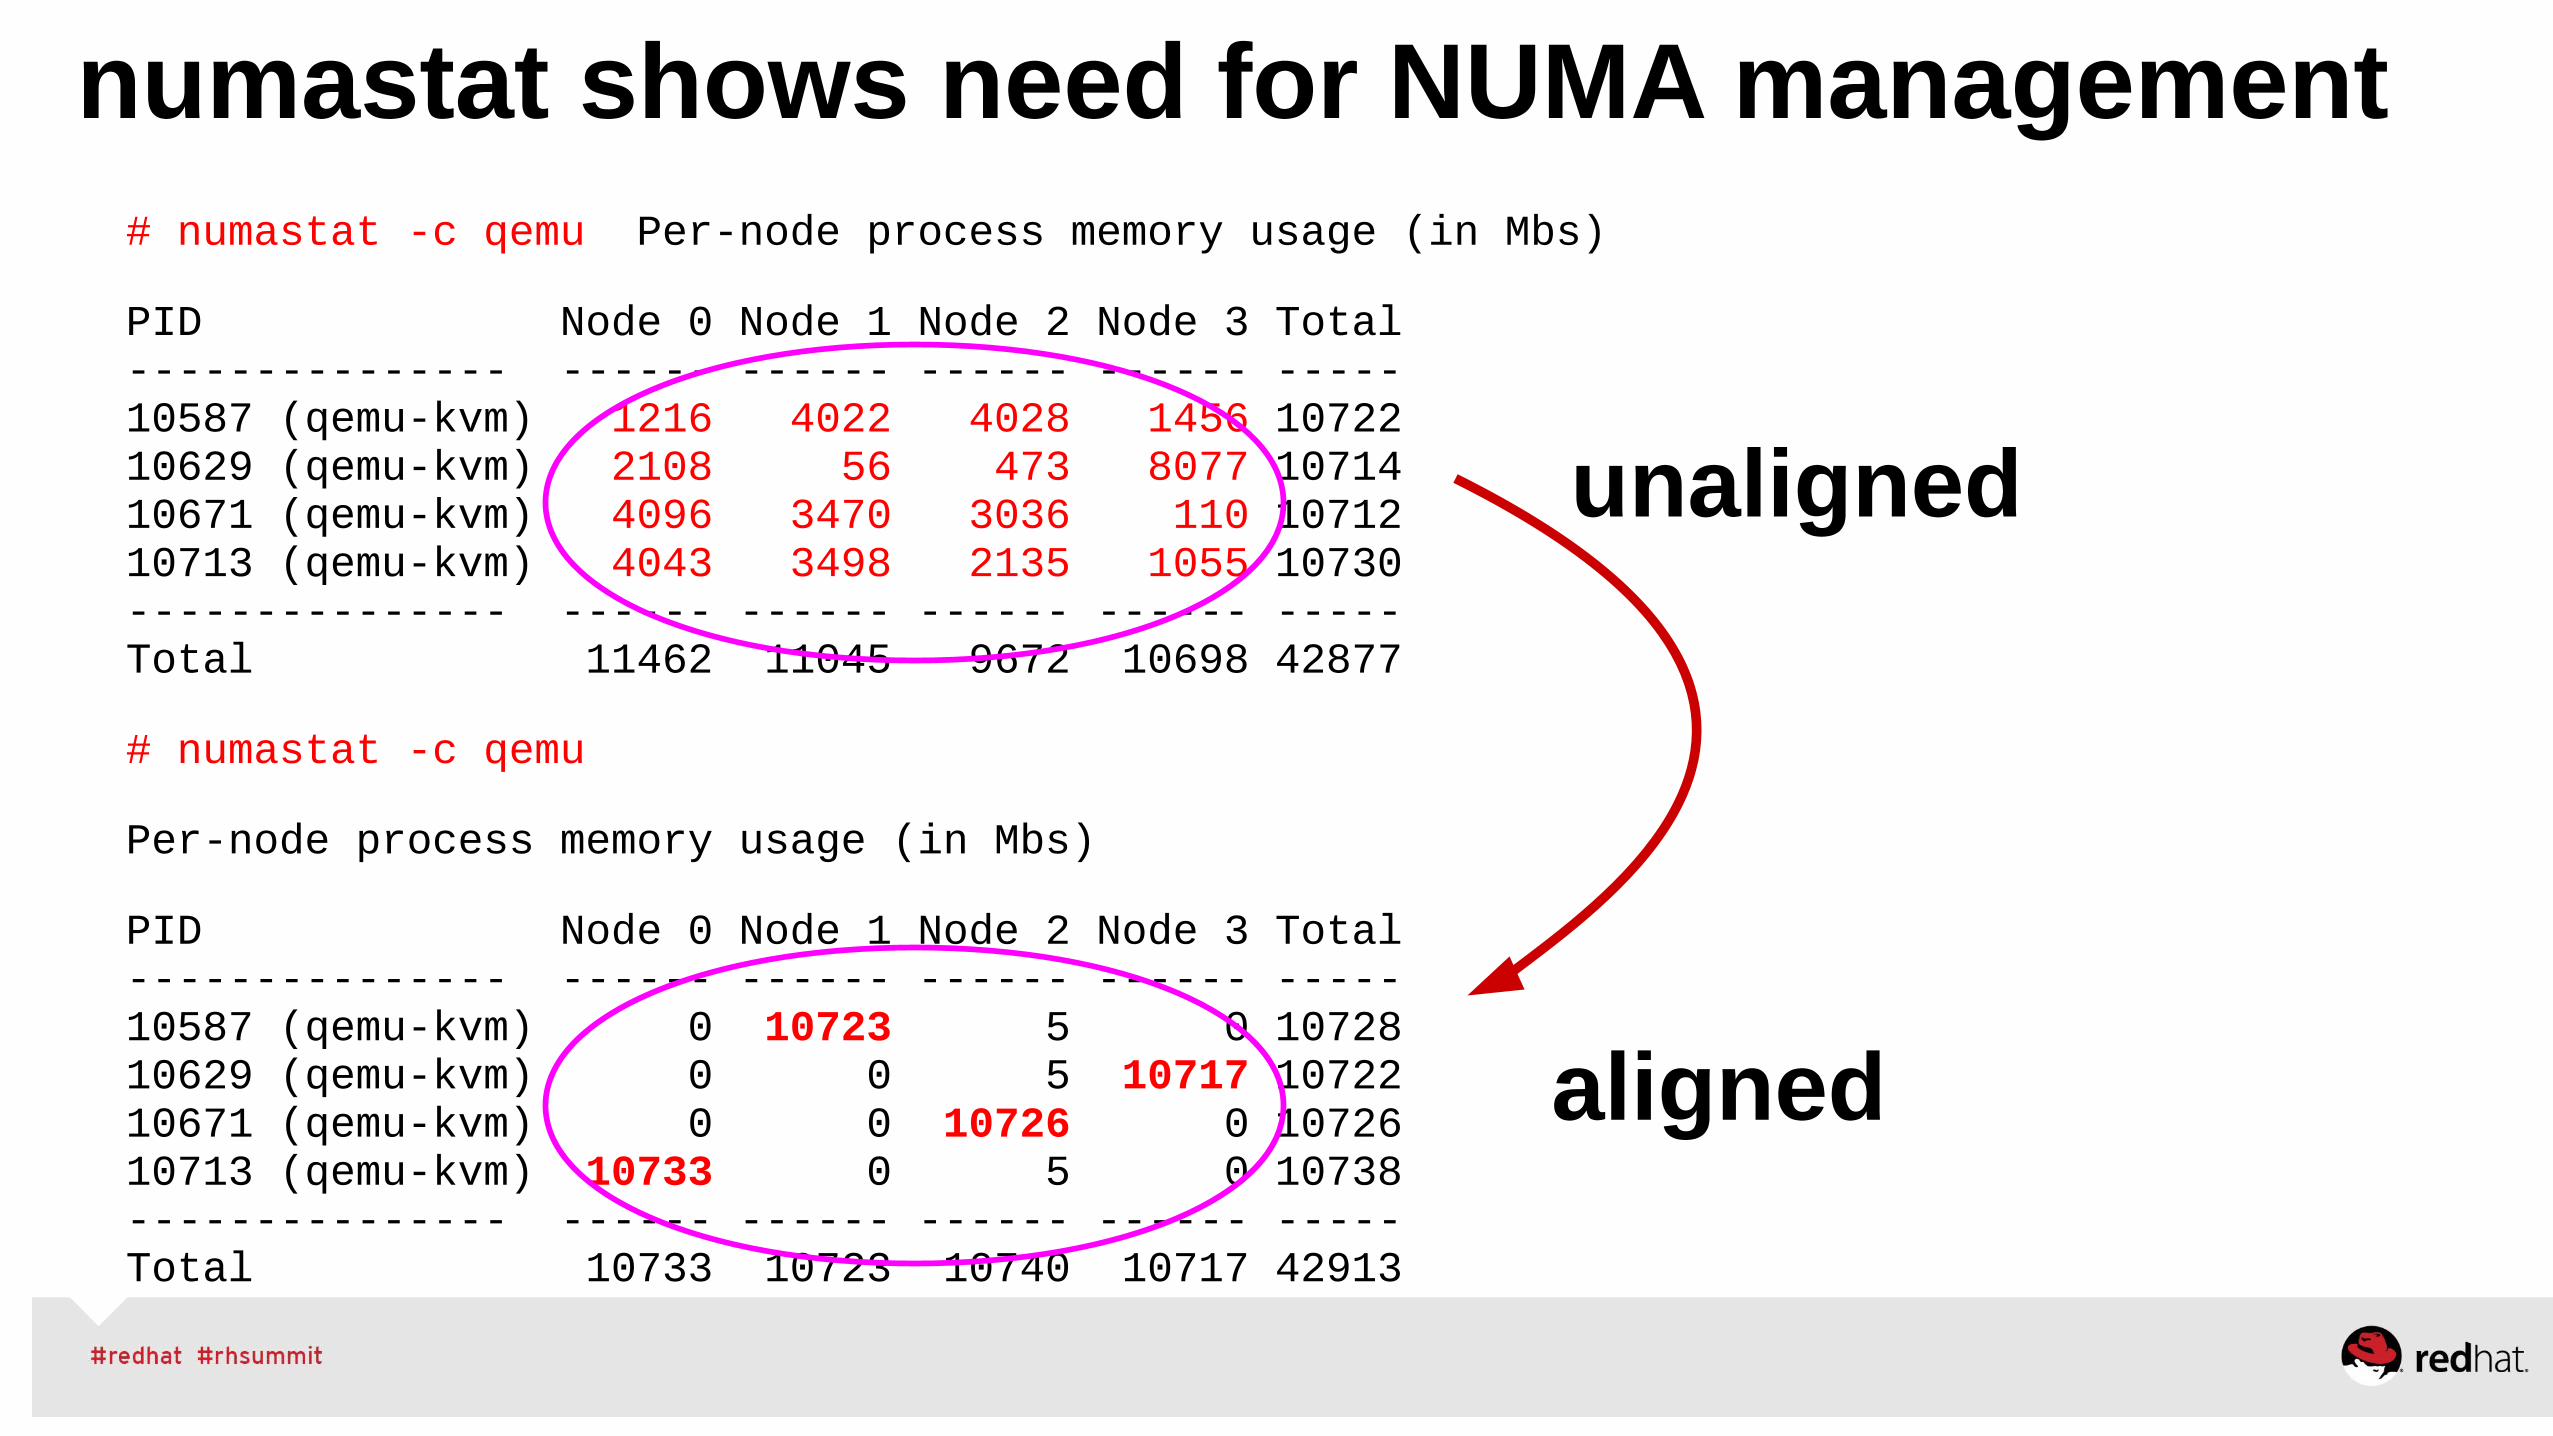
numastat shows need for NUMA management# numastat -c qemu Per-node process memory usage (in Mbs)
PID Node 0 Node 1 Node 2 Node 3 Total--------------- ------ ------ ------ ------ -----10587 (qemu-kvm) 1216 4022 4028 1456 1072210629 (qemu-kvm) 2108 56 473 8077 1071410671 (qemu-kvm) 4096 3470 3036 110 1071210713 (qemu-kvm) 4043 3498 2135 1055 10730--------------- ------ ------ ------ ------ -----Total 11462 11045 9672 10698 42877
# numastat -c qemu
Per-node process memory usage (in Mbs)
PID Node 0 Node 1 Node 2 Node 3 Total--------------- ------ ------ ------ ------ -----10587 (qemu-kvm) 0 10723 5 0 1072810629 (qemu-kvm) 0 0 5 10717 1072210671 (qemu-kvm) 0 0 10726 0 1072610713 (qemu-kvm) 10733 0 5 0 10738--------------- ------ ------ ------ ------ -----Total 10733 10723 10740 10717 42913
aligned
unaligned
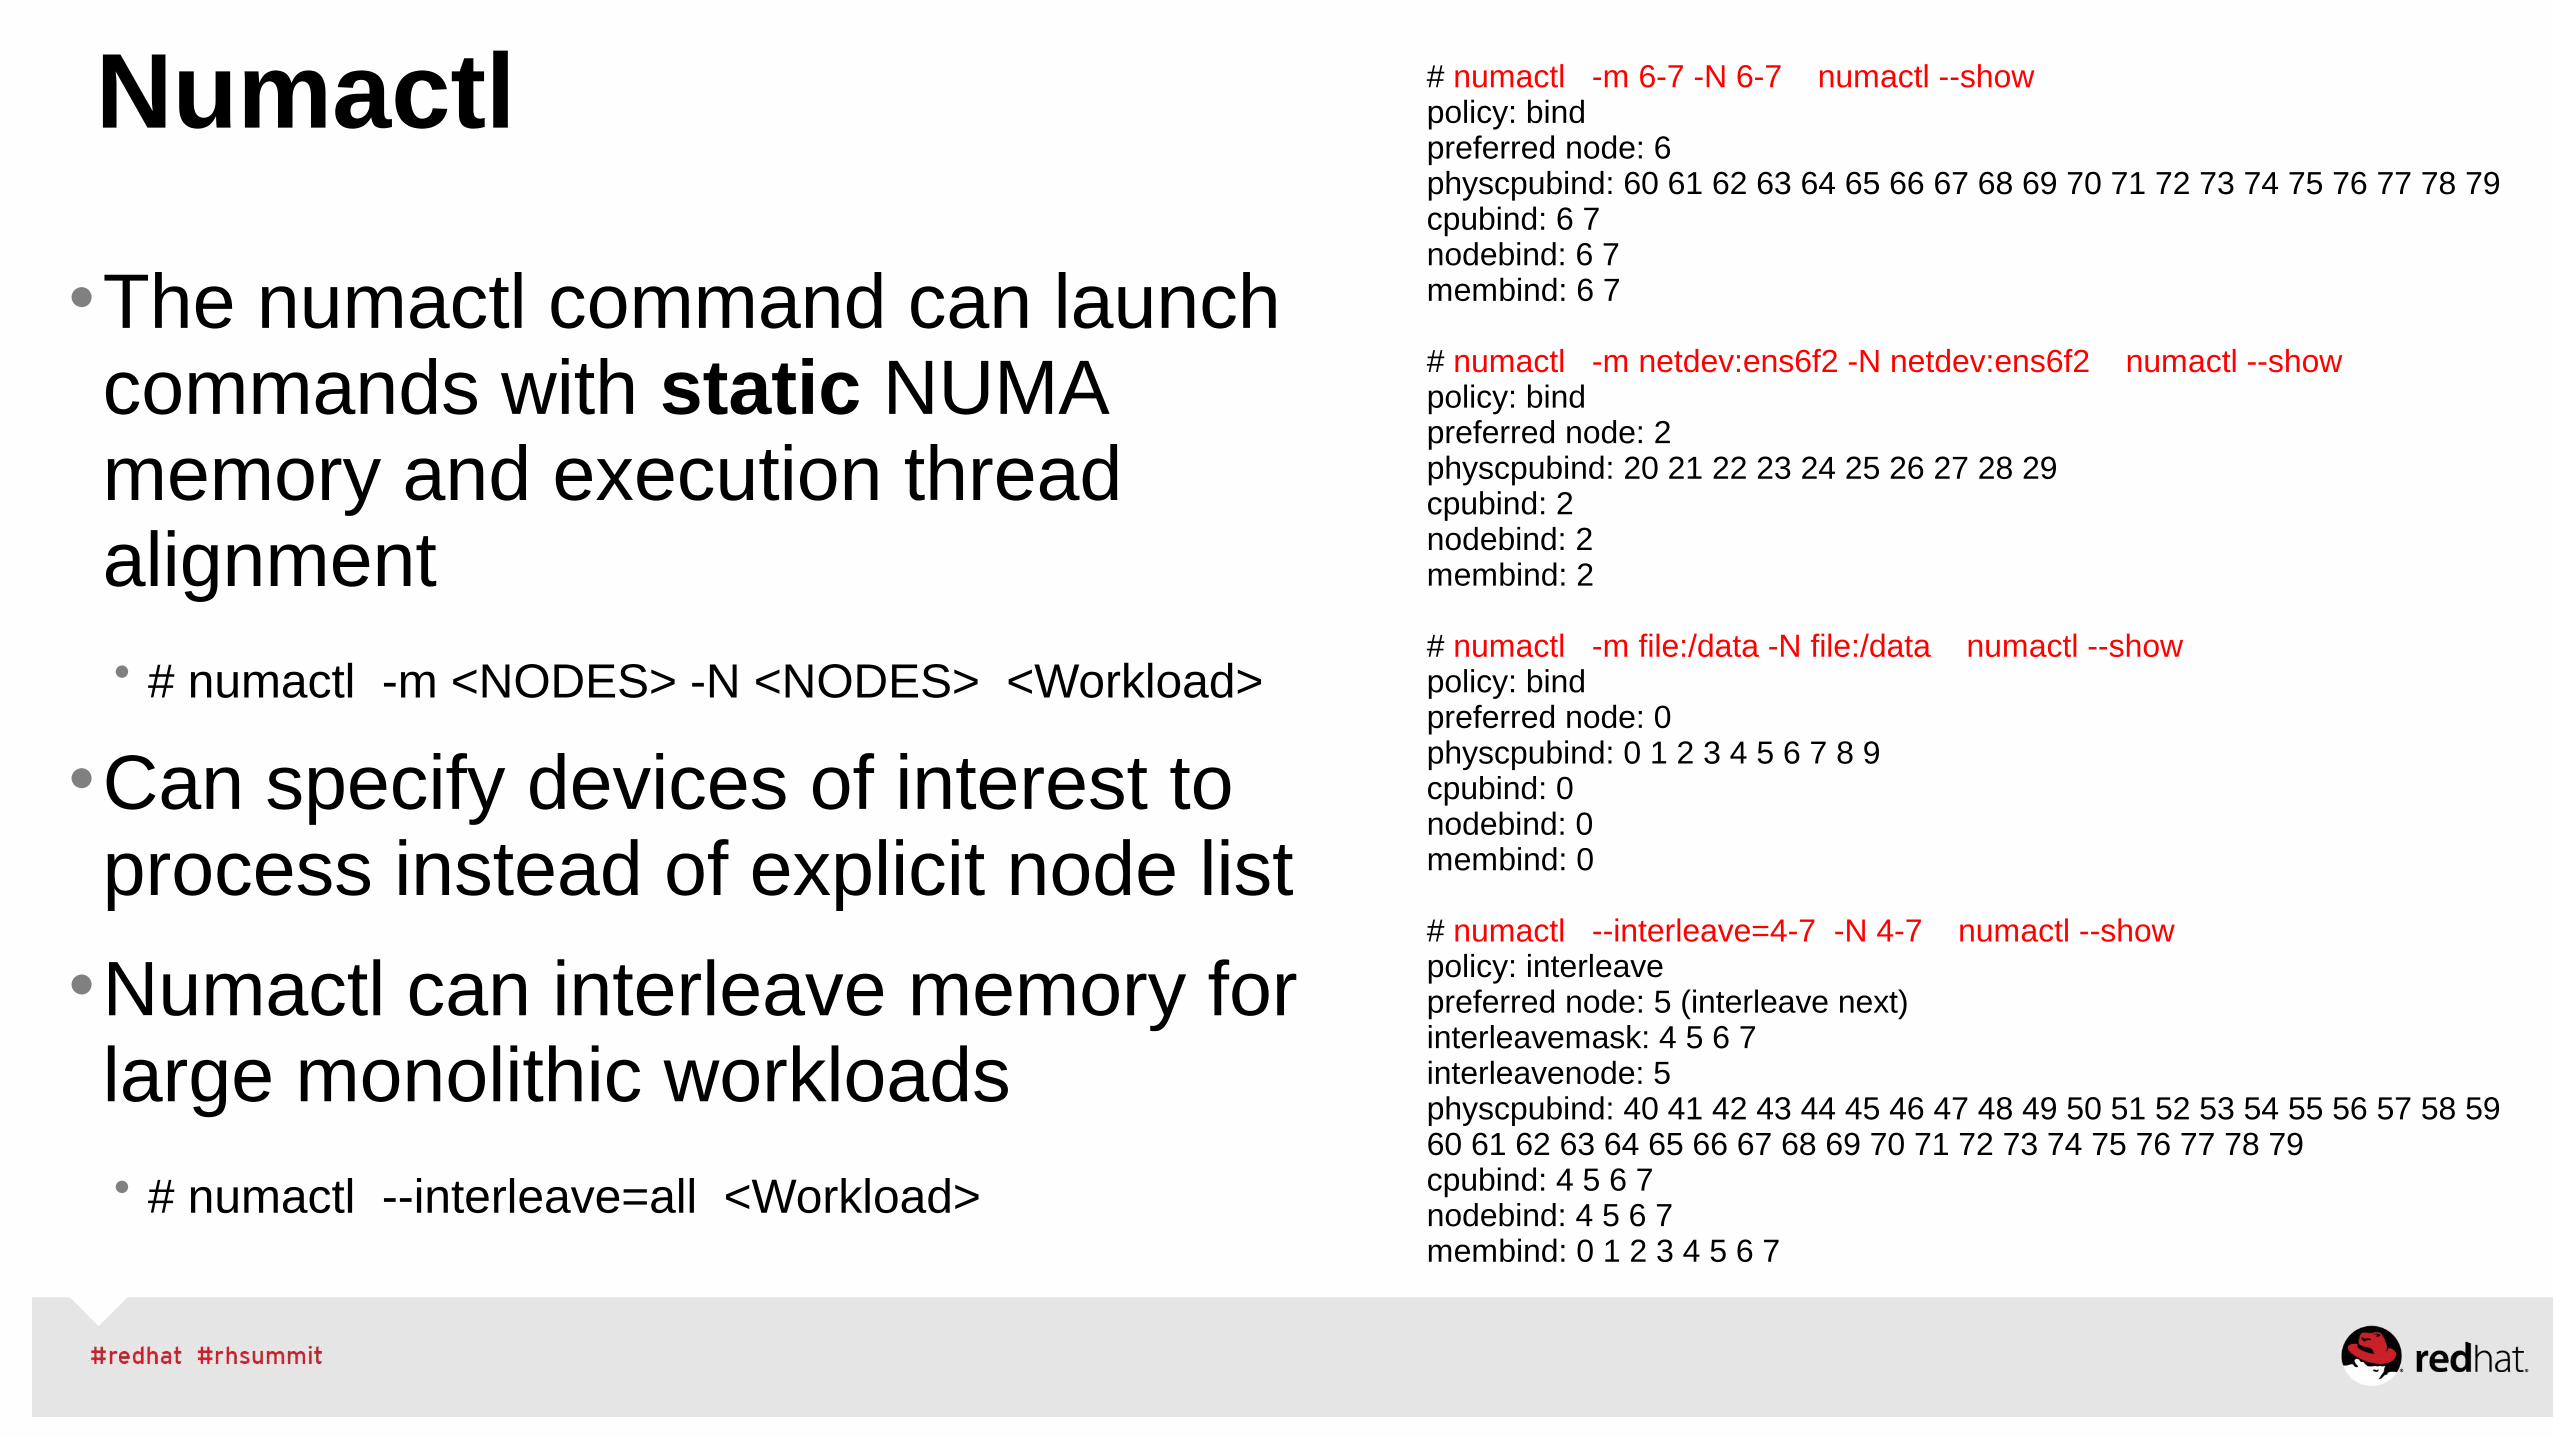
Numactl
•The numactl command can launch commands with static NUMA memory and execution thread alignment • # numactl -m <NODES> -N <NODES> <Workload>
•Can specify devices of interest to process instead of explicit node list
•Numactl can interleave memory for large monolithic workloads• # numactl --interleave=all <Workload>
# numactl -m 6-7 -N 6-7 numactl --showpolicy: bindpreferred node: 6physcpubind: 60 61 62 63 64 65 66 67 68 69 70 71 72 73 74 75 76 77 78 79 cpubind: 6 7 nodebind: 6 7 membind: 6 7
# numactl -m netdev:ens6f2 -N netdev:ens6f2 numactl --showpolicy: bindpreferred node: 2physcpubind: 20 21 22 23 24 25 26 27 28 29 cpubind: 2 nodebind: 2 membind: 2
# numactl -m file:/data -N file:/data numactl --showpolicy: bindpreferred node: 0physcpubind: 0 1 2 3 4 5 6 7 8 9 cpubind: 0 nodebind: 0 membind: 0
# numactl --interleave=4-7 -N 4-7 numactl --showpolicy: interleavepreferred node: 5 (interleave next)interleavemask: 4 5 6 7 interleavenode: 5physcpubind: 40 41 42 43 44 45 46 47 48 49 50 51 52 53 54 55 56 57 58 59 60 61 62 63 64 65 66 67 68 69 70 71 72 73 74 75 76 77 78 79 cpubind: 4 5 6 7 nodebind: 4 5 6 7 membind: 0 1 2 3 4 5 6 7
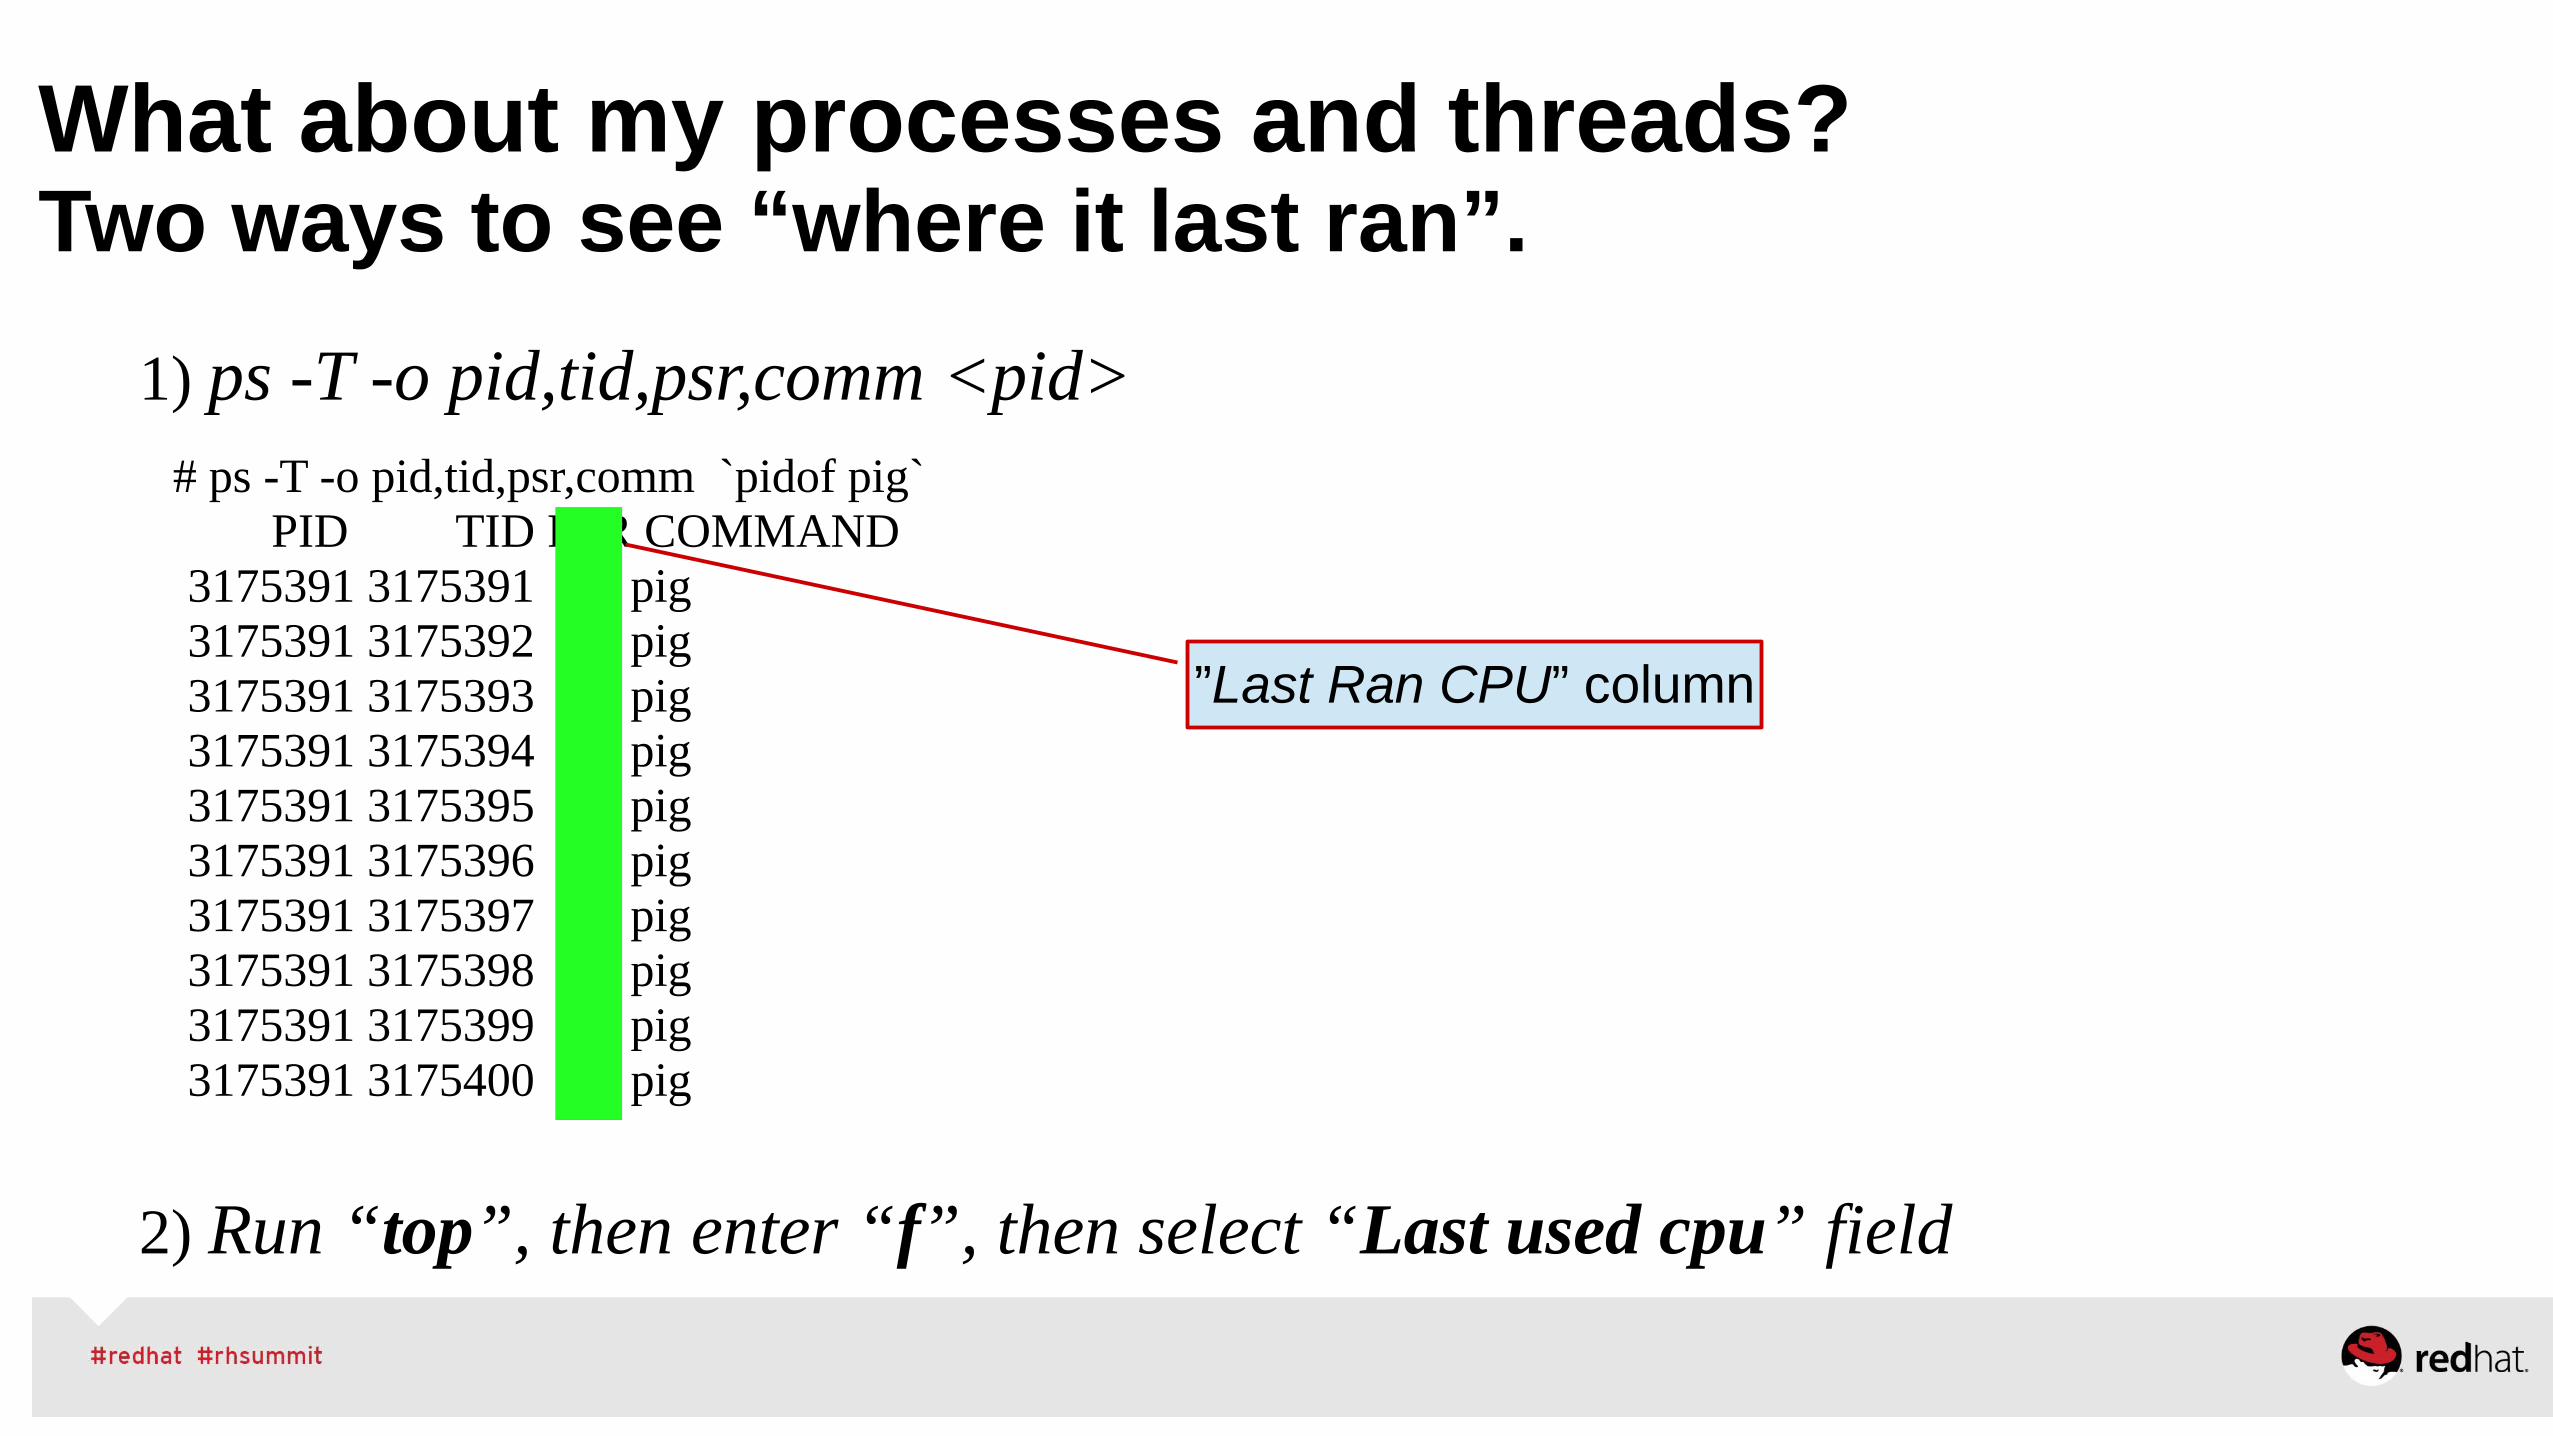
What about my processes and threads?Two ways to see “where it last ran”.
1) ps -T -o pid,tid,psr,comm <pid># ps -T -o pid,tid,psr,comm `pidof pig`
PID TID PSR COMMAND 3175391 3175391 73 pig 3175391 3175392 1 pig 3175391 3175393 25 pig 3175391 3175394 49 pig 3175391 3175395 74 pig 3175391 3175396 2 pig 3175391 3175397 26 pig 3175391 3175398 50 pig 3175391 3175399 75 pig 3175391 3175400 3 pig
2) Run “top”, then enter “f”, then select “Last used cpu” field
”Last Ran CPU” column
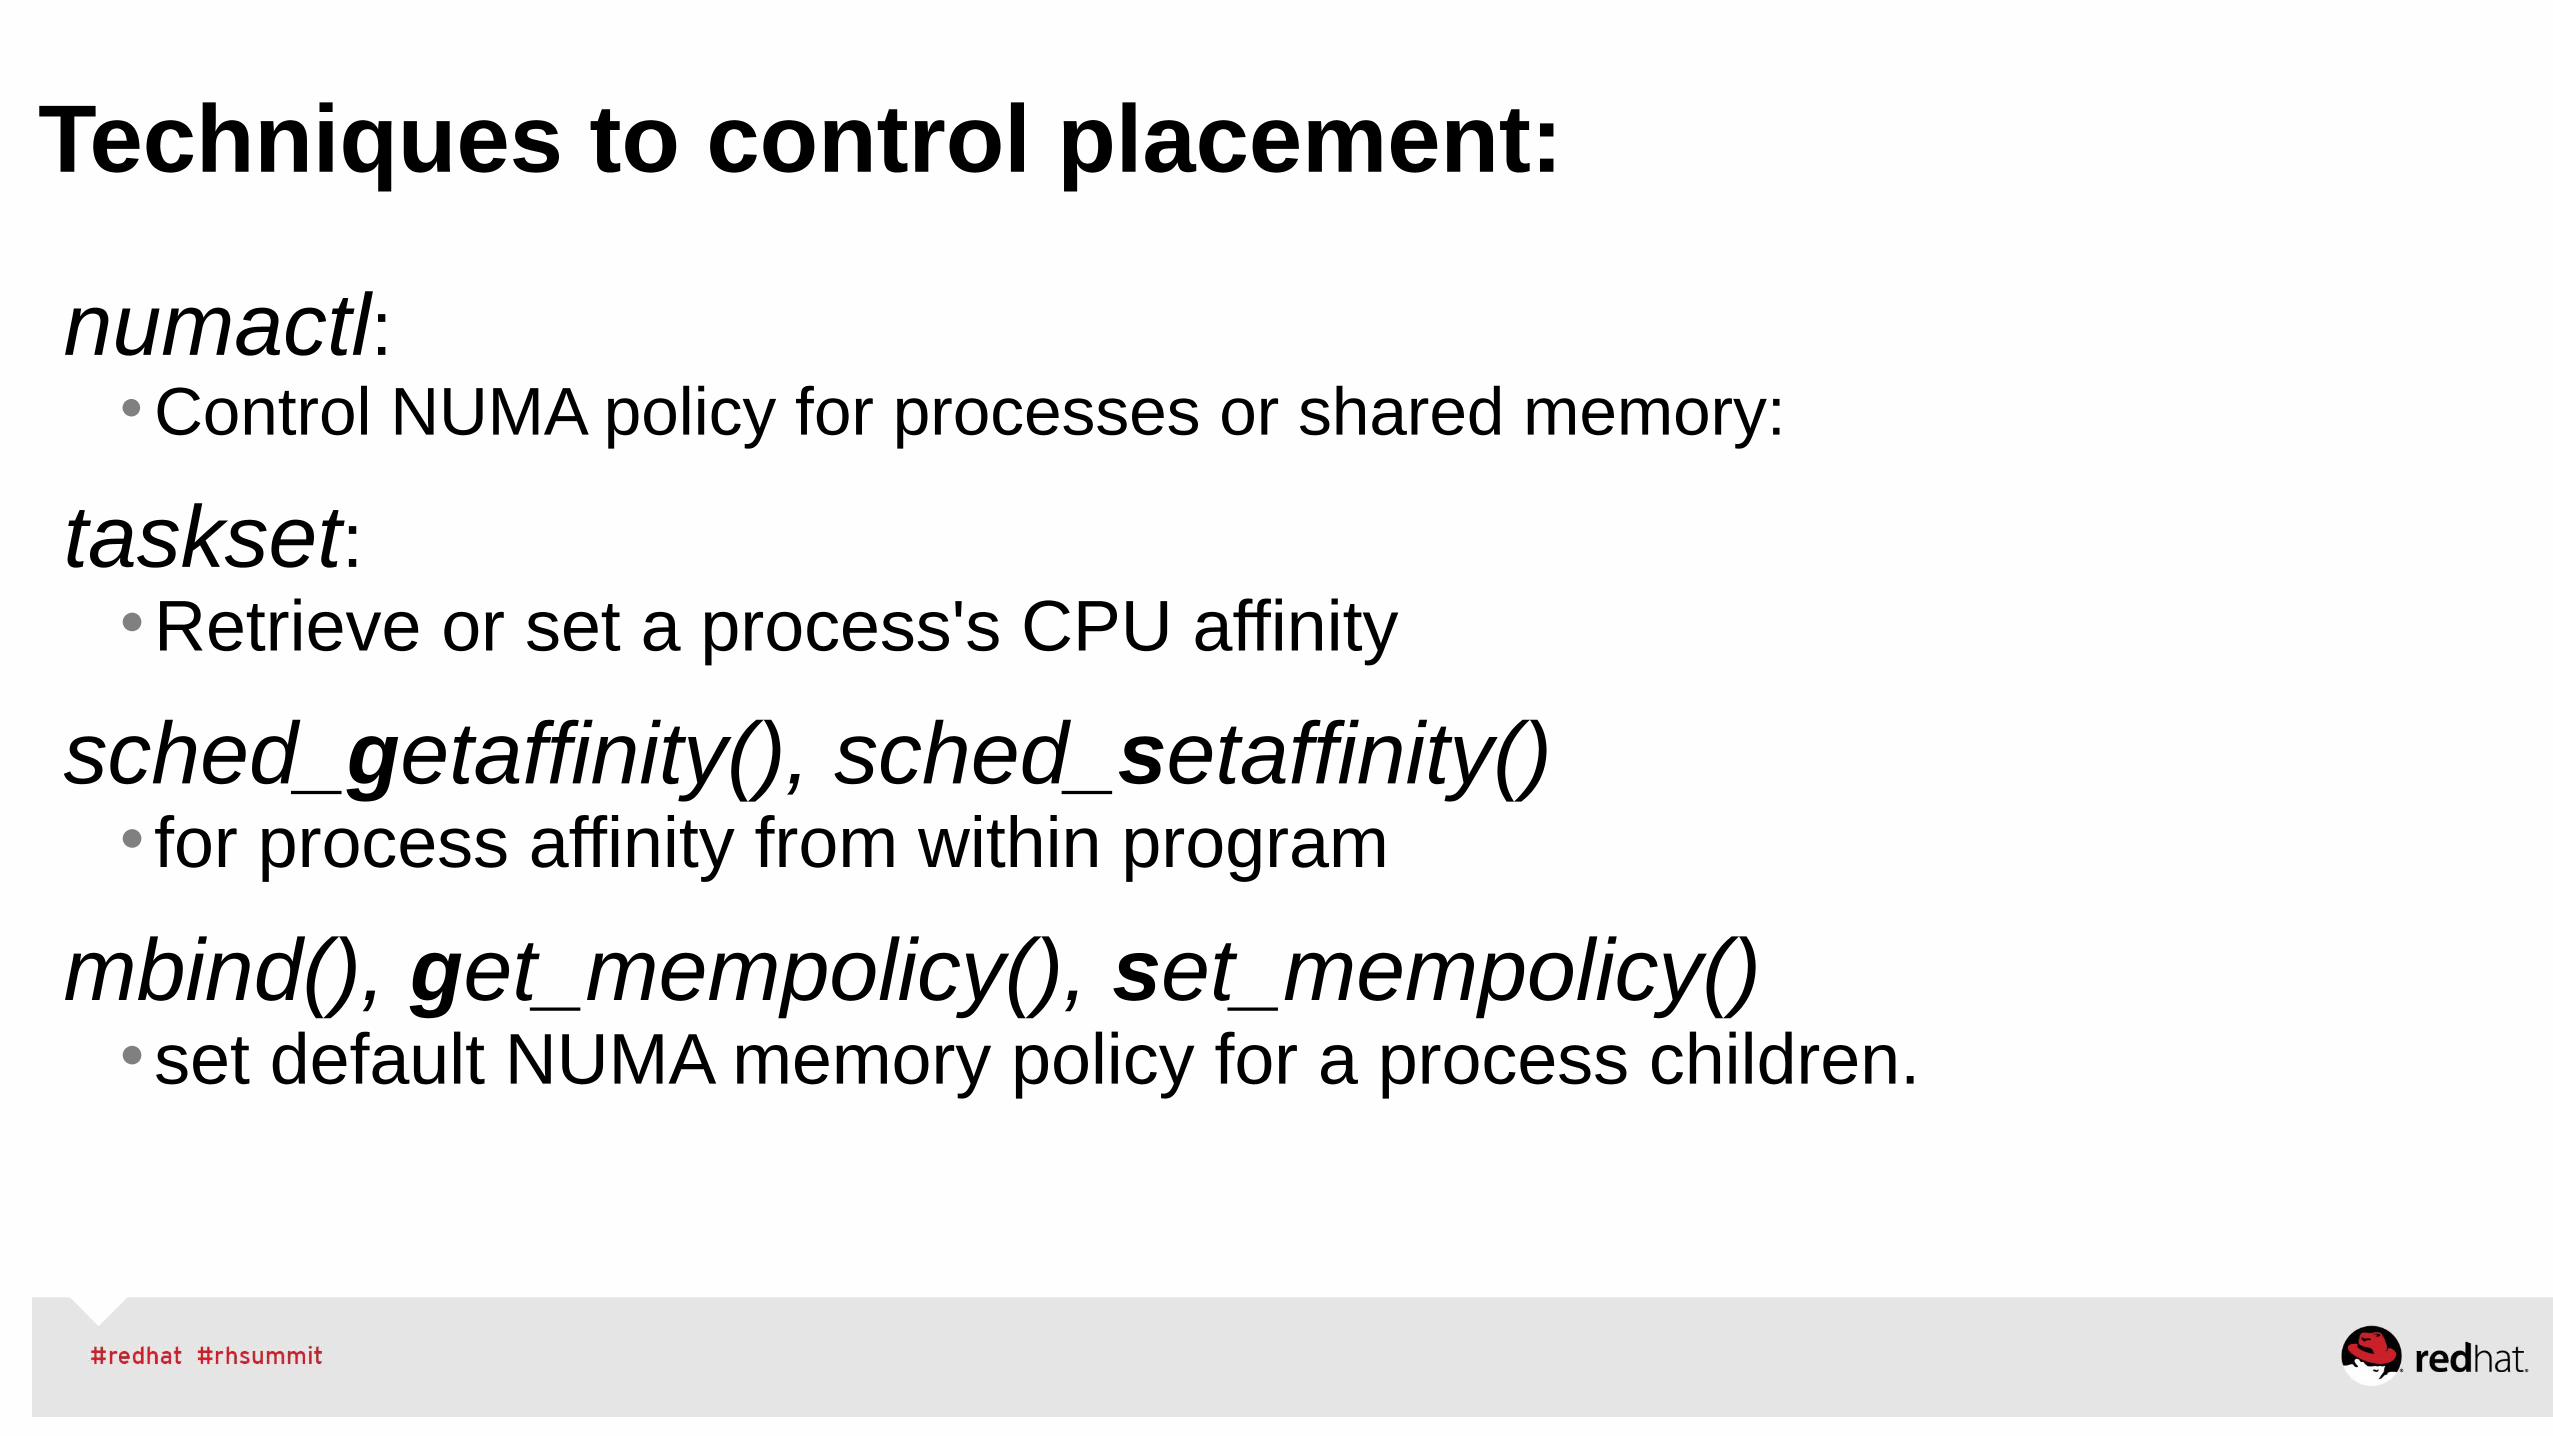
Techniques to control placement:
numactl: •Control NUMA policy for processes or shared memory:
taskset: •Retrieve or set a process's CPU affinity
sched_getaffinity(), sched_setaffinity() • for process affinity from within program
mbind(), get_mempolicy(), set_mempolicy()•set default NUMA memory policy for a process children.

Techniques to control placement (cont):
numad:•User-mode daemon. •Attempts to locate processes for efficient NUMA locality and affinity.•Dynamically adjusting to changing system conditions.•Available in RHEL 6 & 7.
Auto-Numa-Balance kernel scheduler:•Automatically run programs near their memory, and moves memory near the programs using it.
•Default enabled. Available in RHEL 7+•Great video on how it works:
• https://www.youtube.com/watch?v=mjVw_oe1hEA
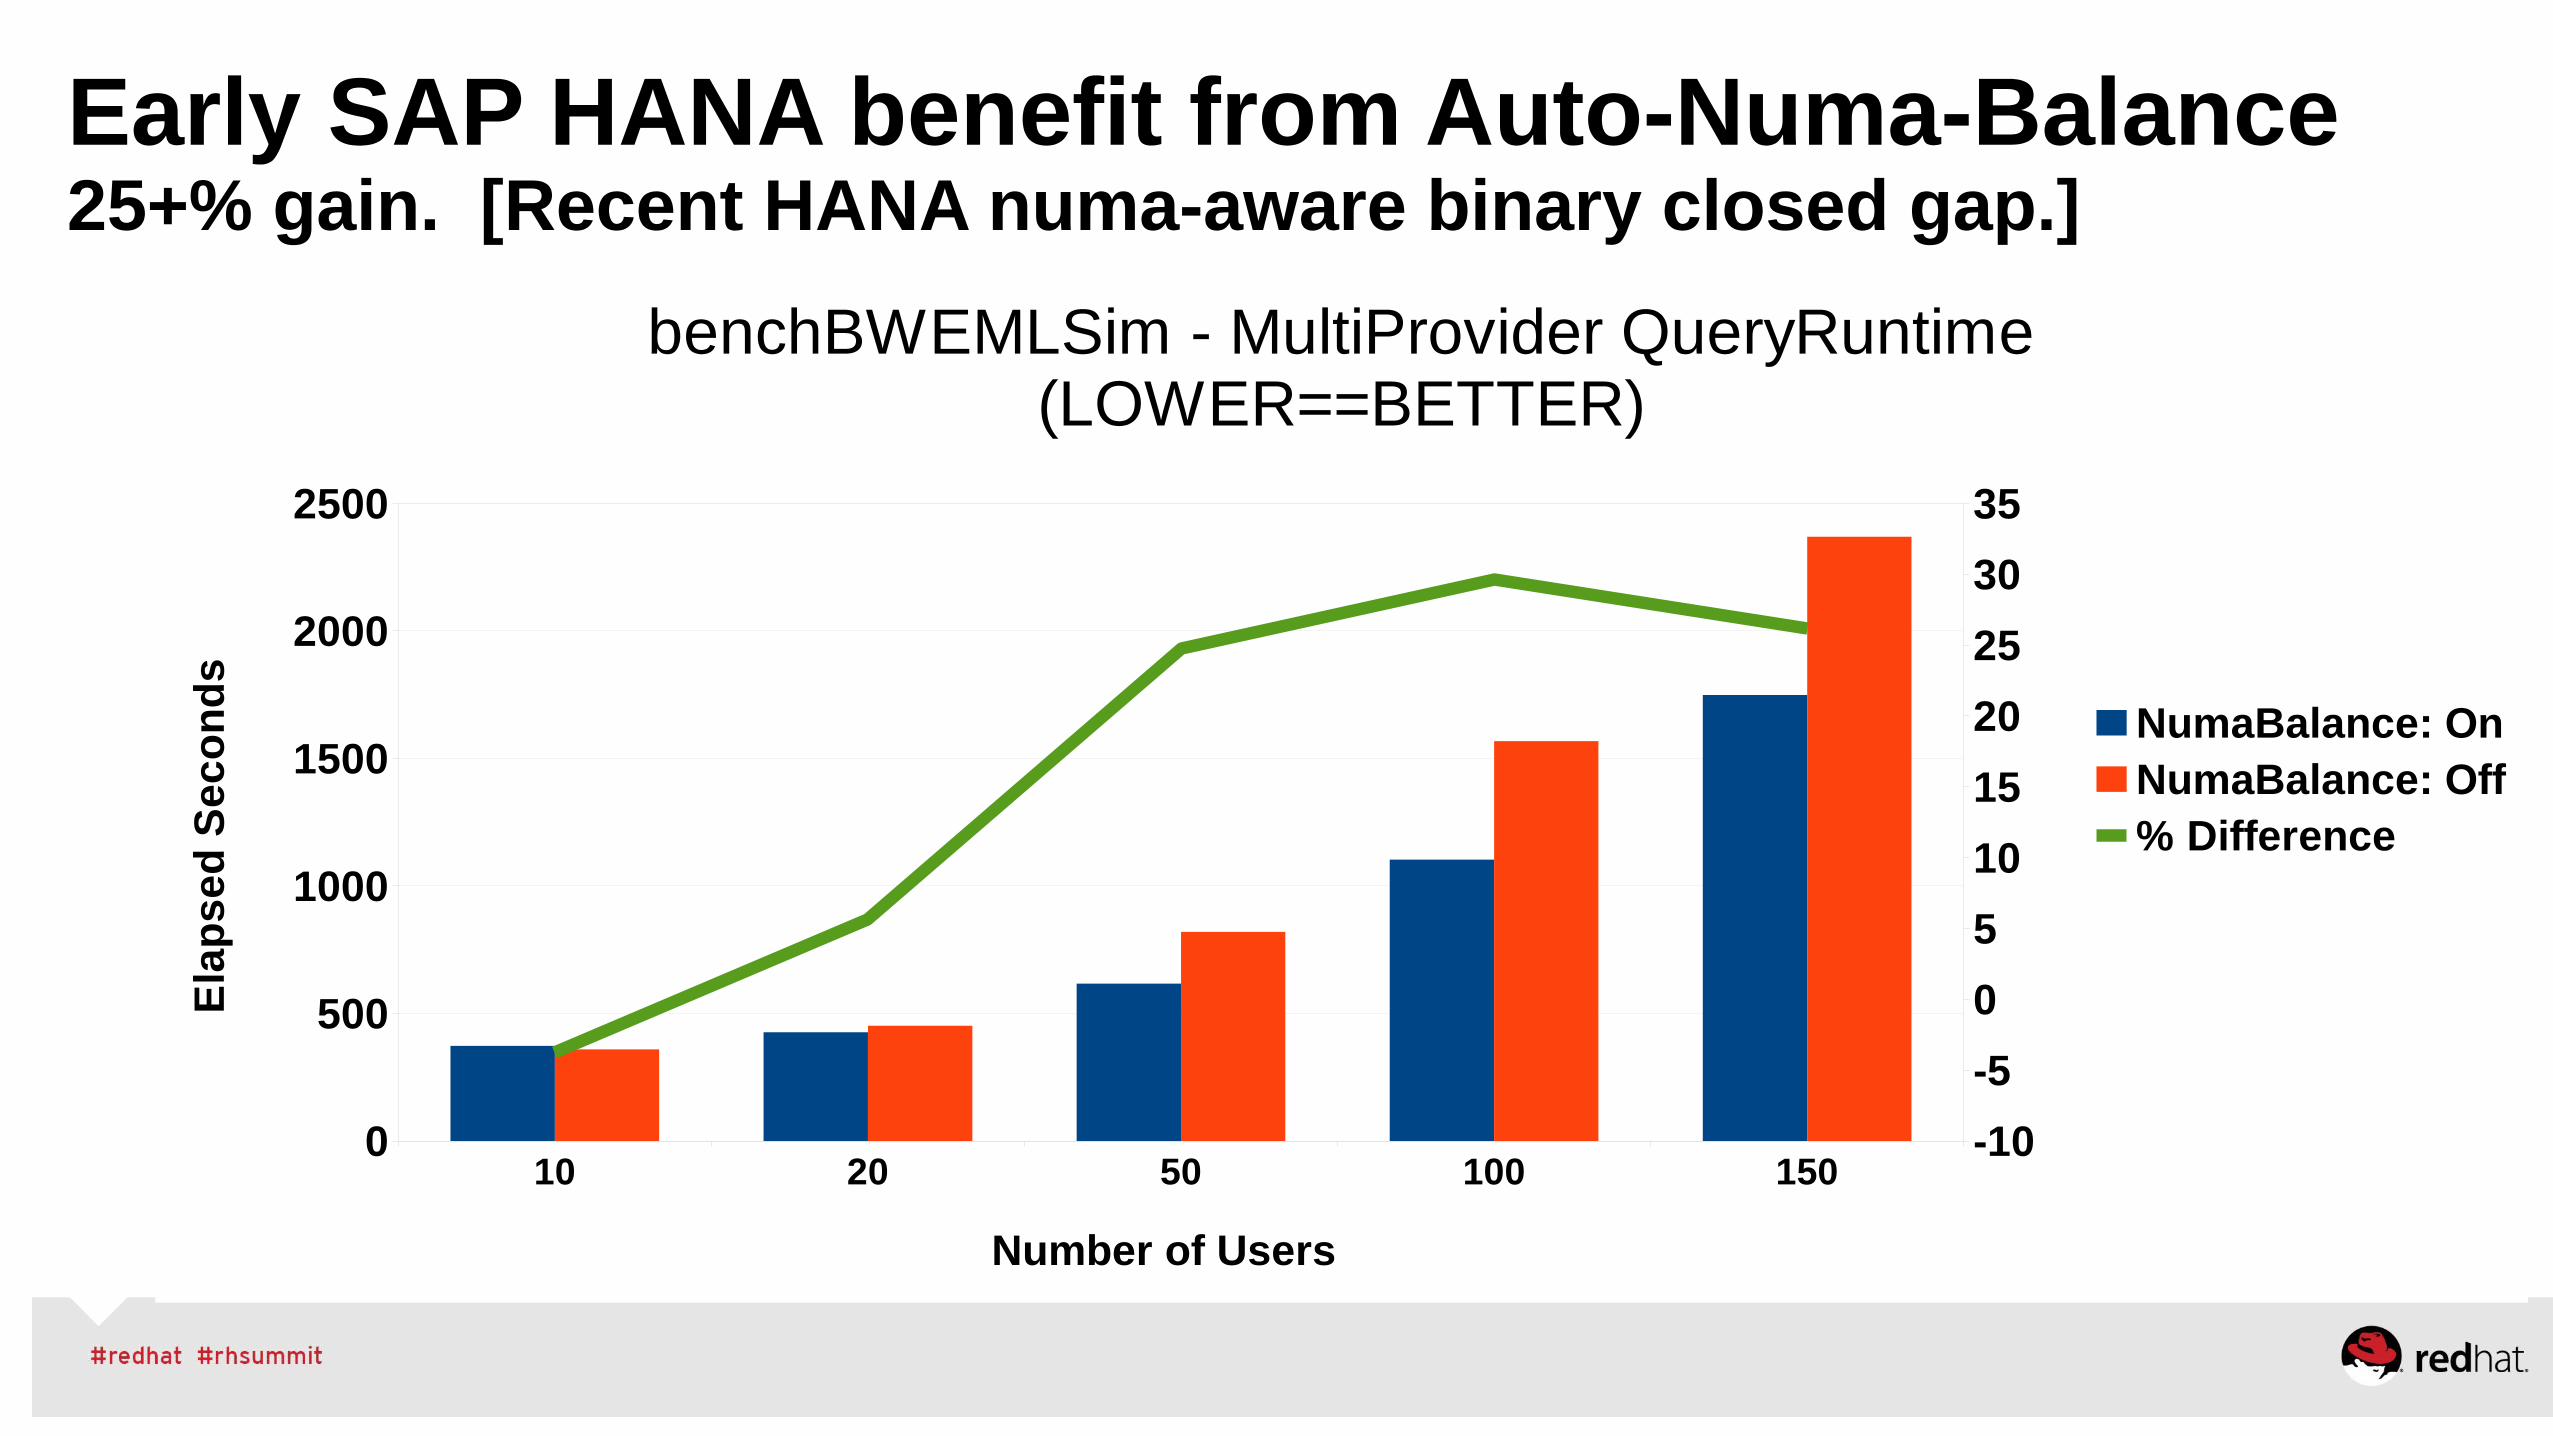
Early SAP HANA benefit from Auto-Numa-Balance25+% gain. [Recent HANA numa-aware binary closed gap.]
10 20 50 100 1500
500
1000
1500
2000
2500
-10
-5
0
5
10
15
20
25
30
35
benchBWEMLSim - MultiProvider QueryRuntime(LOWER==BETTER)
NumaBalance: OnNumaBalance: Off% Difference
Number of Users
Ela
ps
ed
Se
co
nd
s
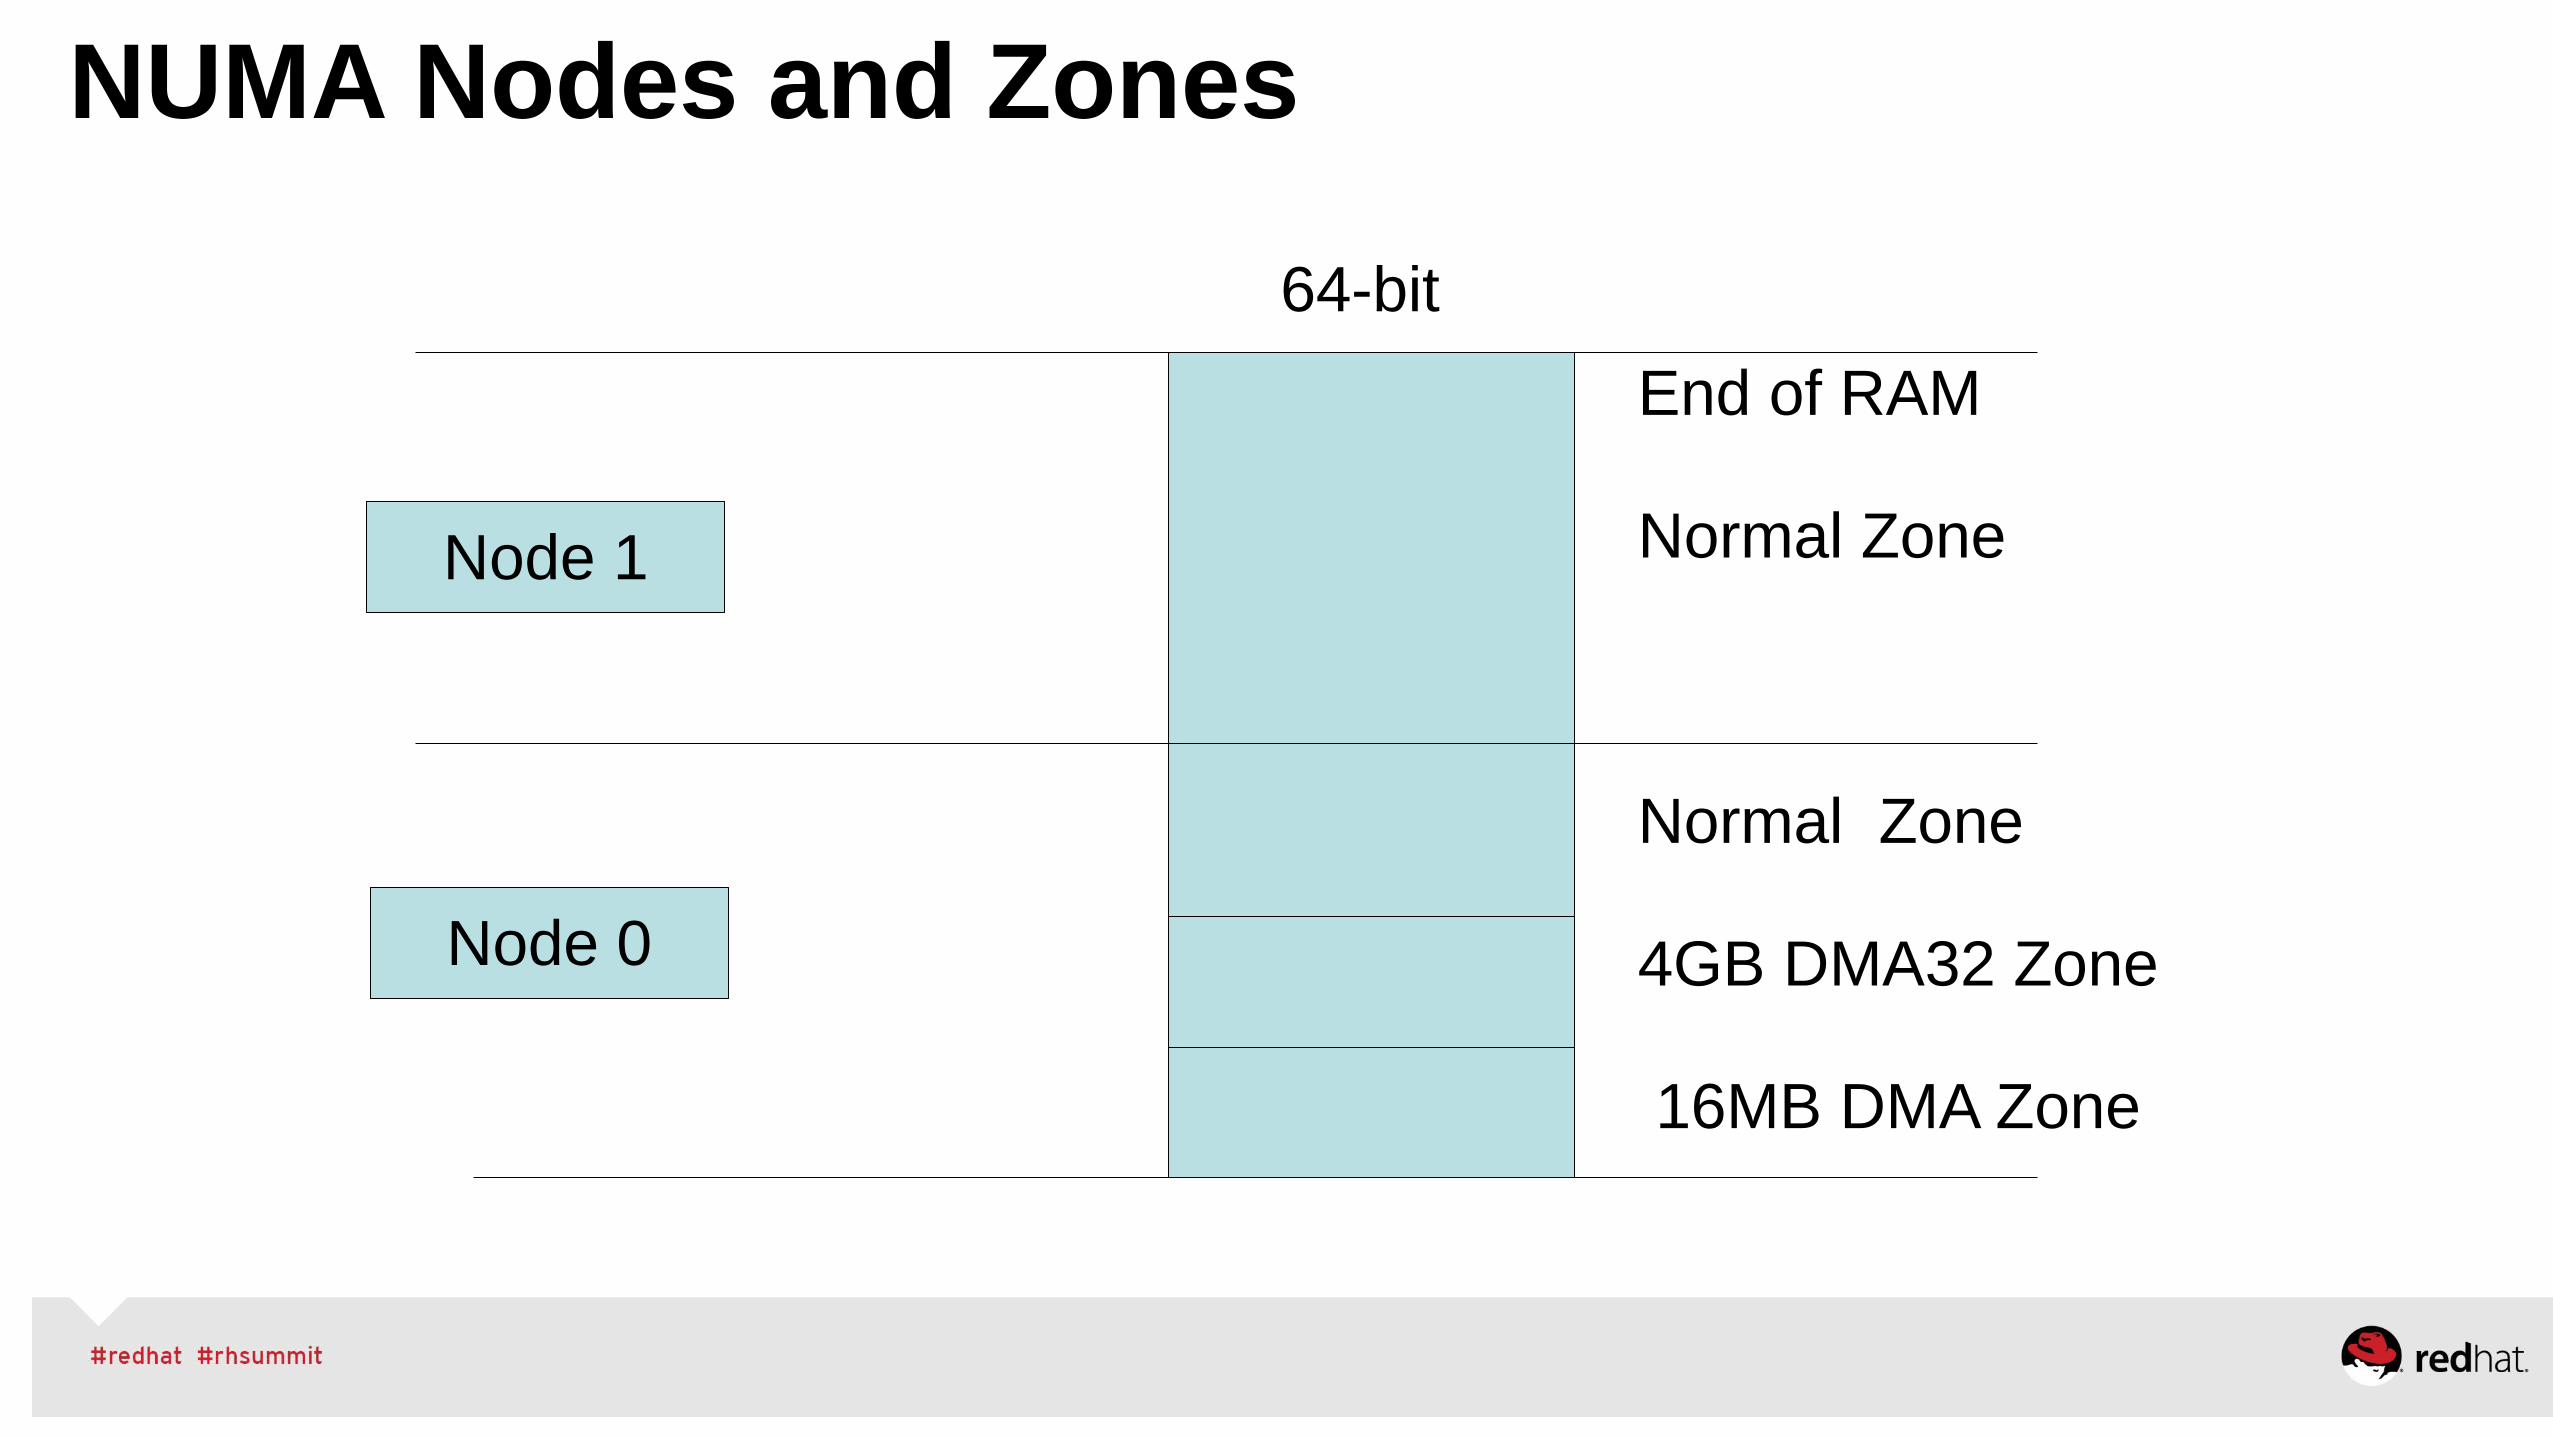
NUMA Nodes and Zones
End of RAM
Normal Zone
Normal Zone
4GB DMA32 Zone
16MB DMA Zone
64-bit
Node 0
Node 1
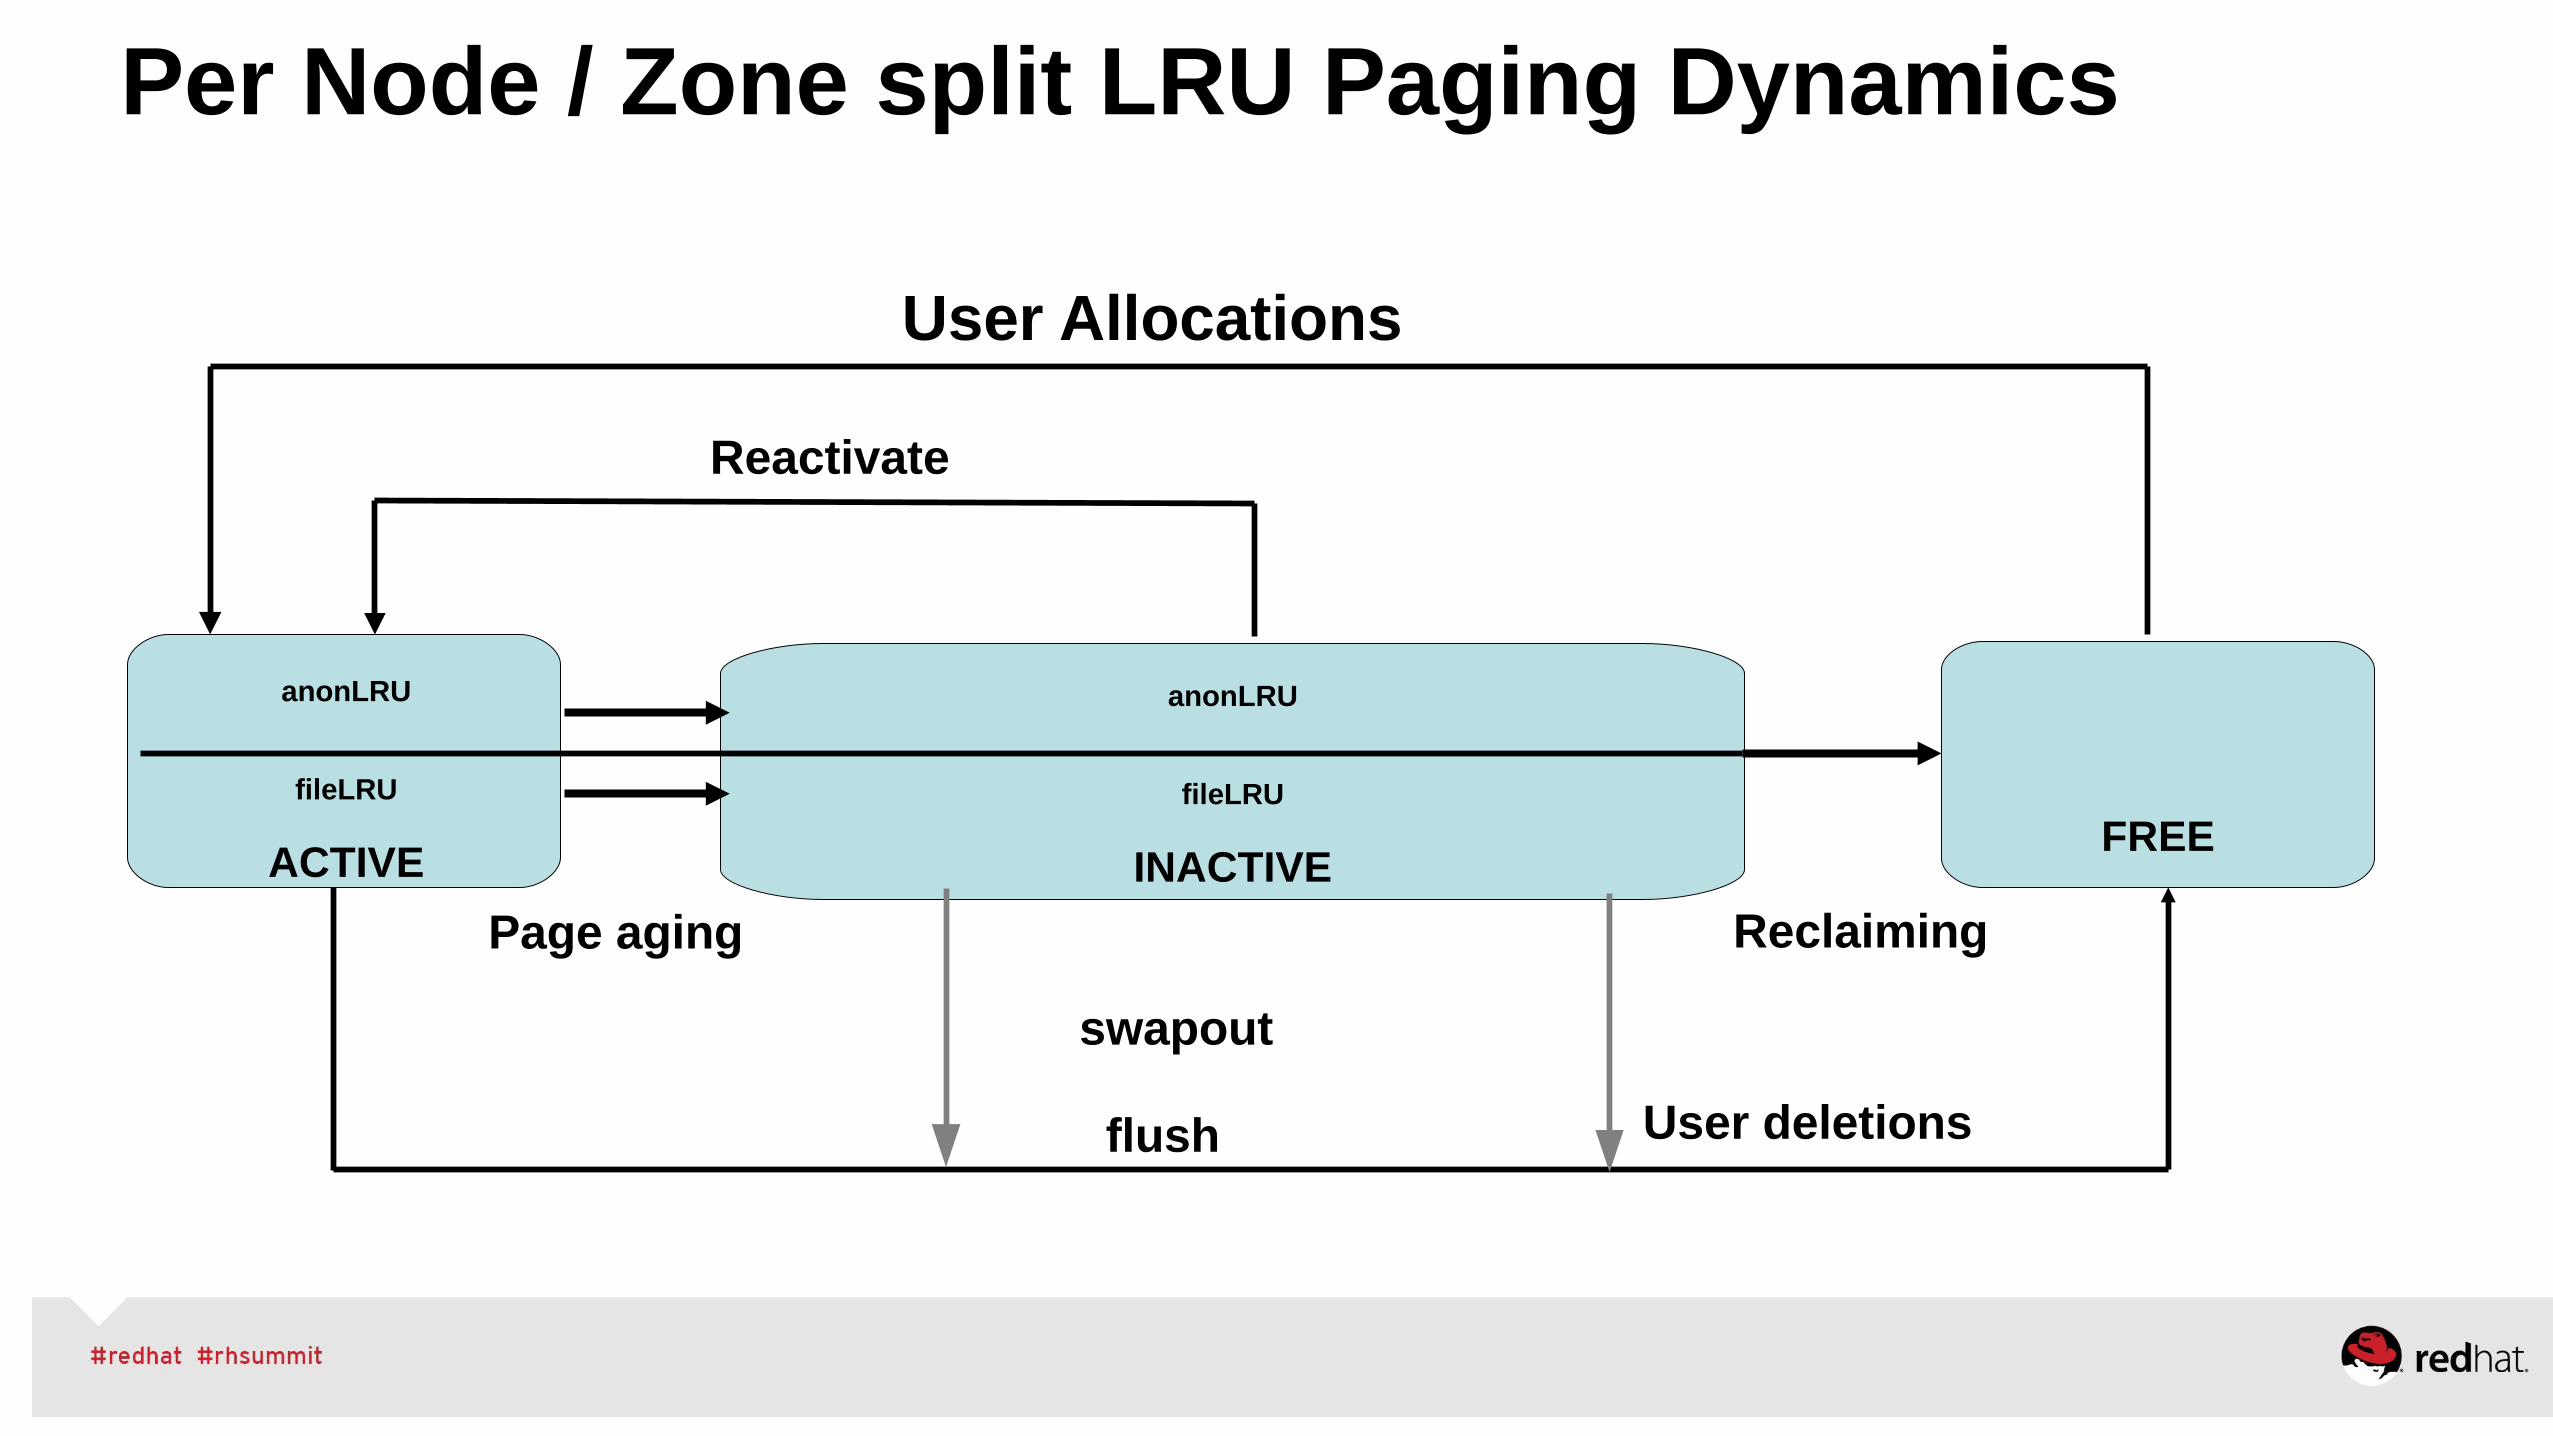
Per Node / Zone split LRU Paging Dynamics
anonLRU
fileLRU
INACTIVEFREE
User Allocations
Reactivate
Page aging
swapout
flush
Reclaiming
User deletions
anonLRU
fileLRU
ACTIVE
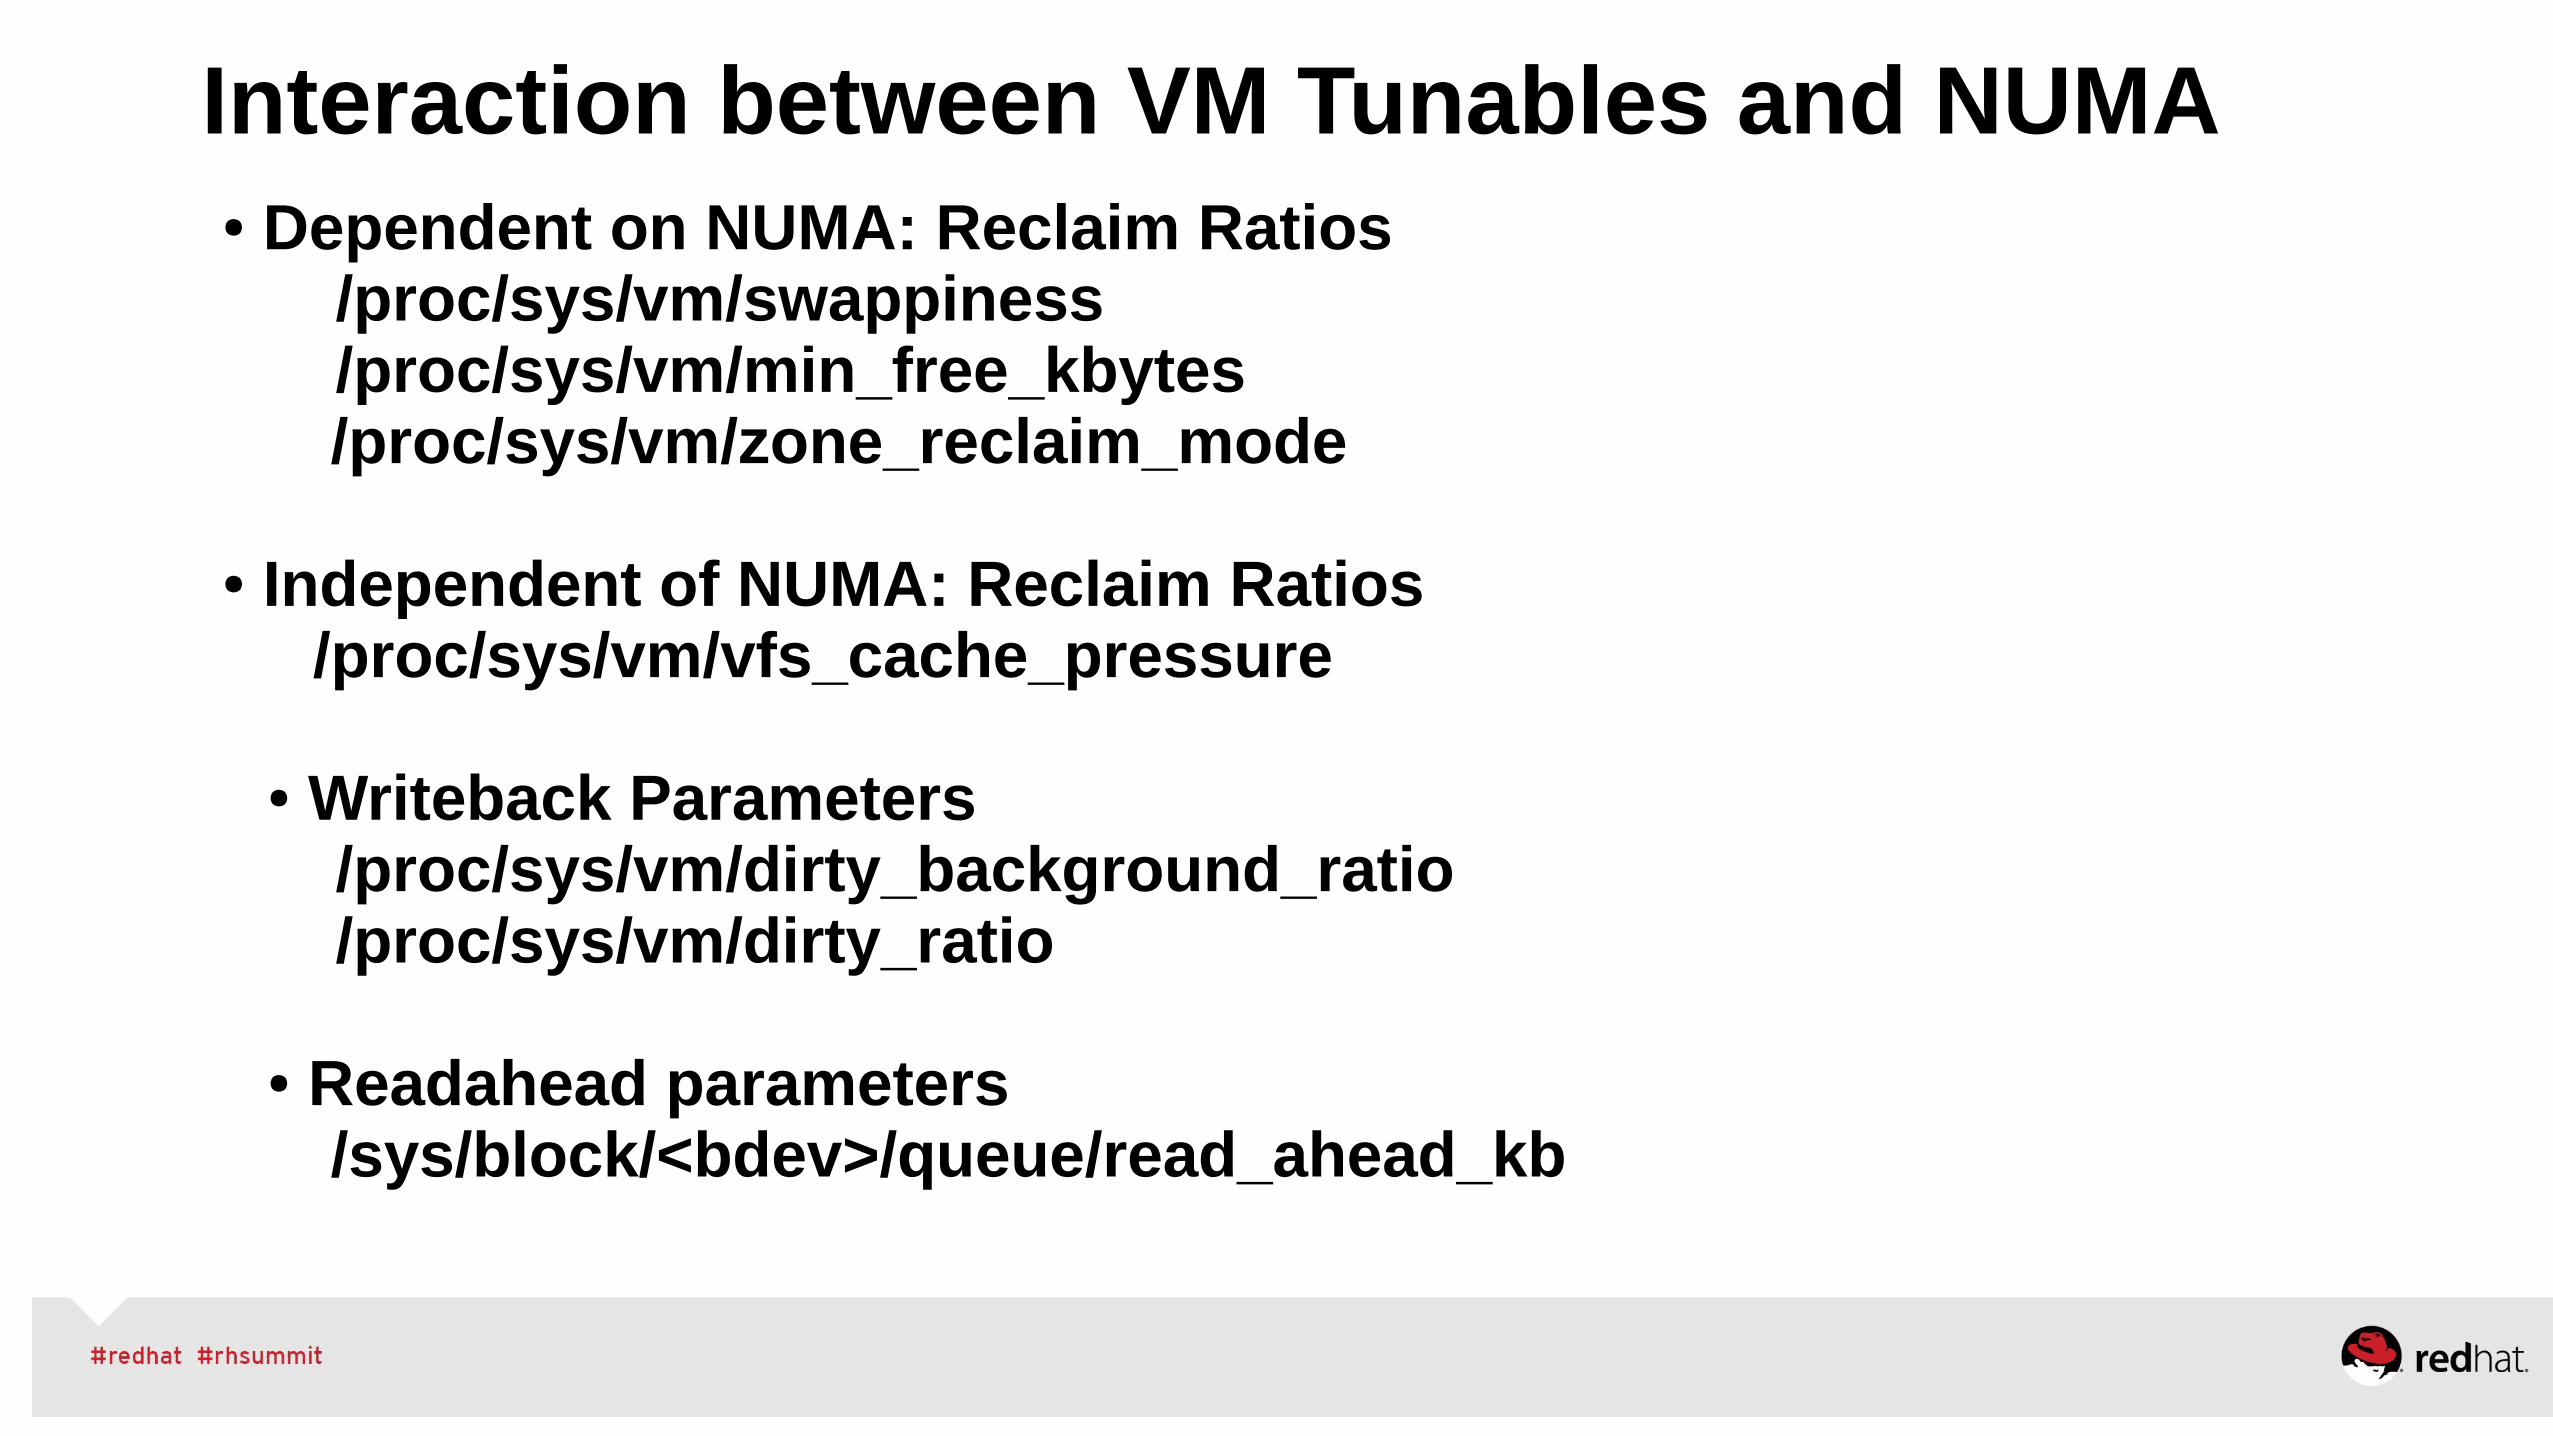
Interaction between VM Tunables and NUMA● Dependent on NUMA: Reclaim Ratios
/proc/sys/vm/swappiness/proc/sys/vm/min_free_kbytes
/proc/sys/vm/zone_reclaim_mode
● Independent of NUMA: Reclaim Ratios/proc/sys/vm/vfs_cache_pressure
● Writeback Parameters/proc/sys/vm/dirty_background_ratio/proc/sys/vm/dirty_ratio
● Readahead parameters /sys/block/<bdev>/queue/read_ahead_kb
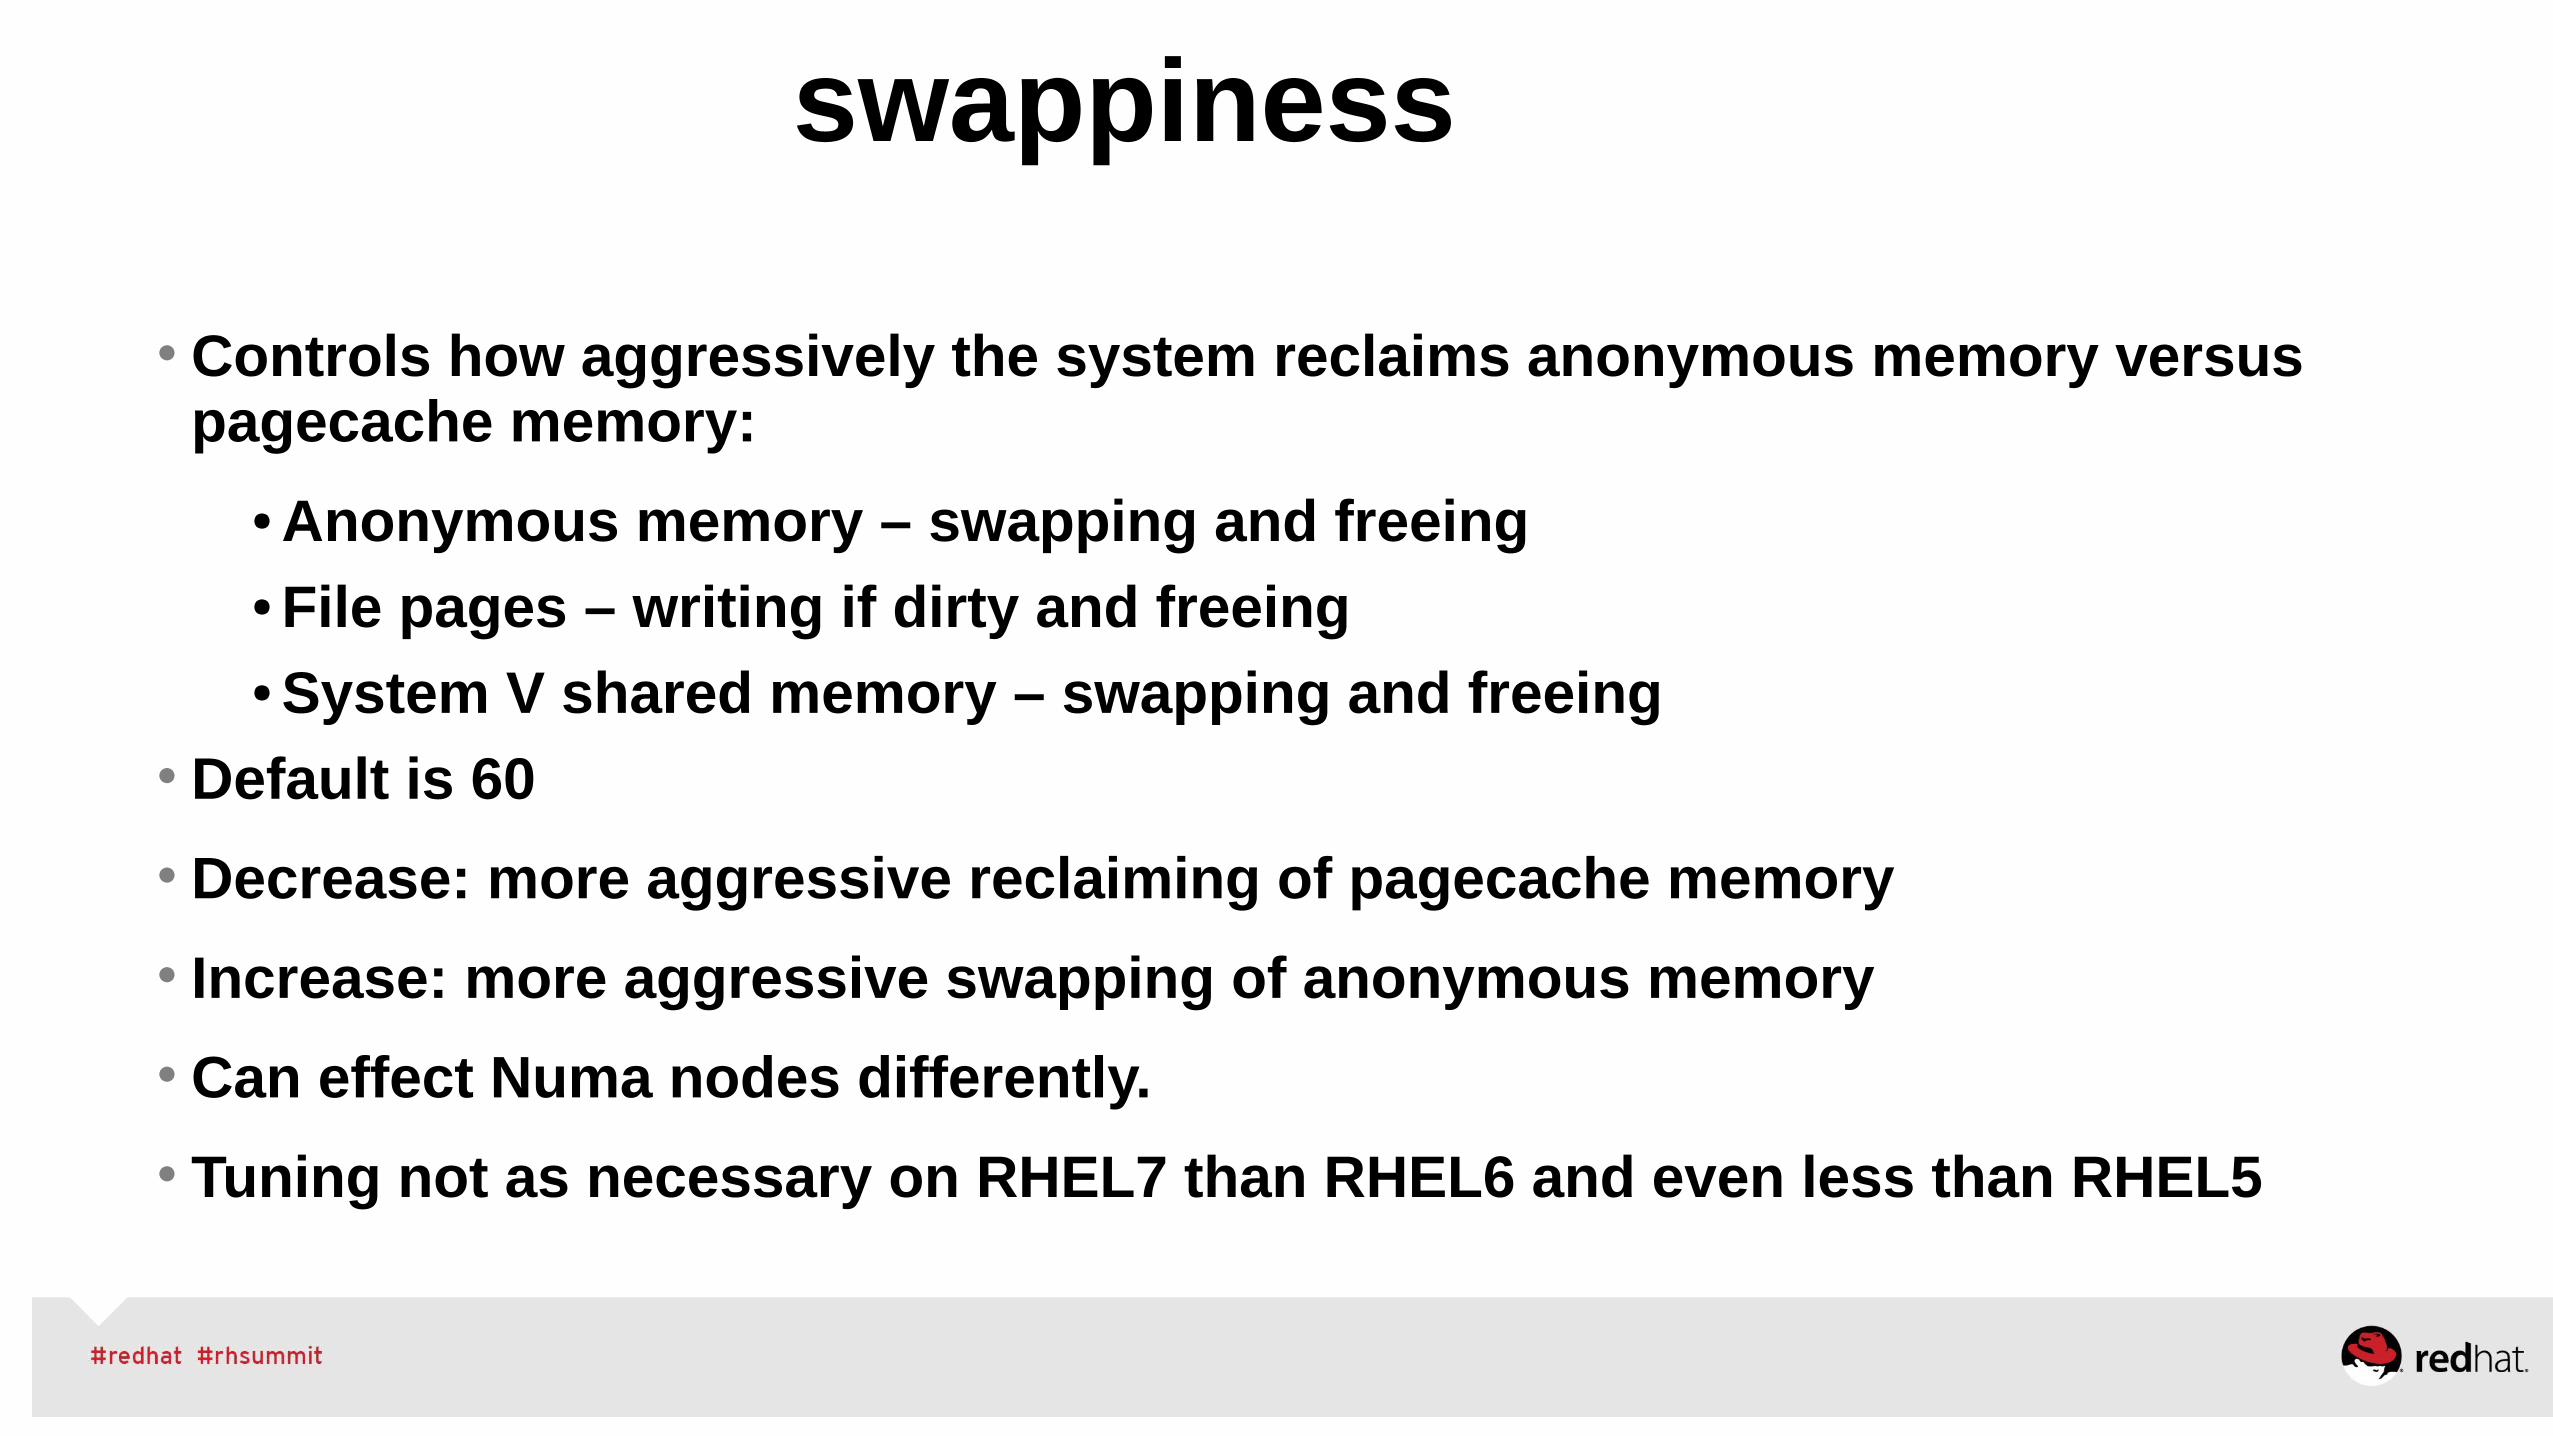
• Controls how aggressively the system reclaims anonymous memory versus pagecache memory:
● Anonymous memory – swapping and freeing● File pages – writing if dirty and freeing● System V shared memory – swapping and freeing
• Default is 60
• Decrease: more aggressive reclaiming of pagecache memory
• Increase: more aggressive swapping of anonymous memory
• Can effect Numa nodes differently.
• Tuning not as necessary on RHEL7 than RHEL6 and even less than RHEL5
swappiness
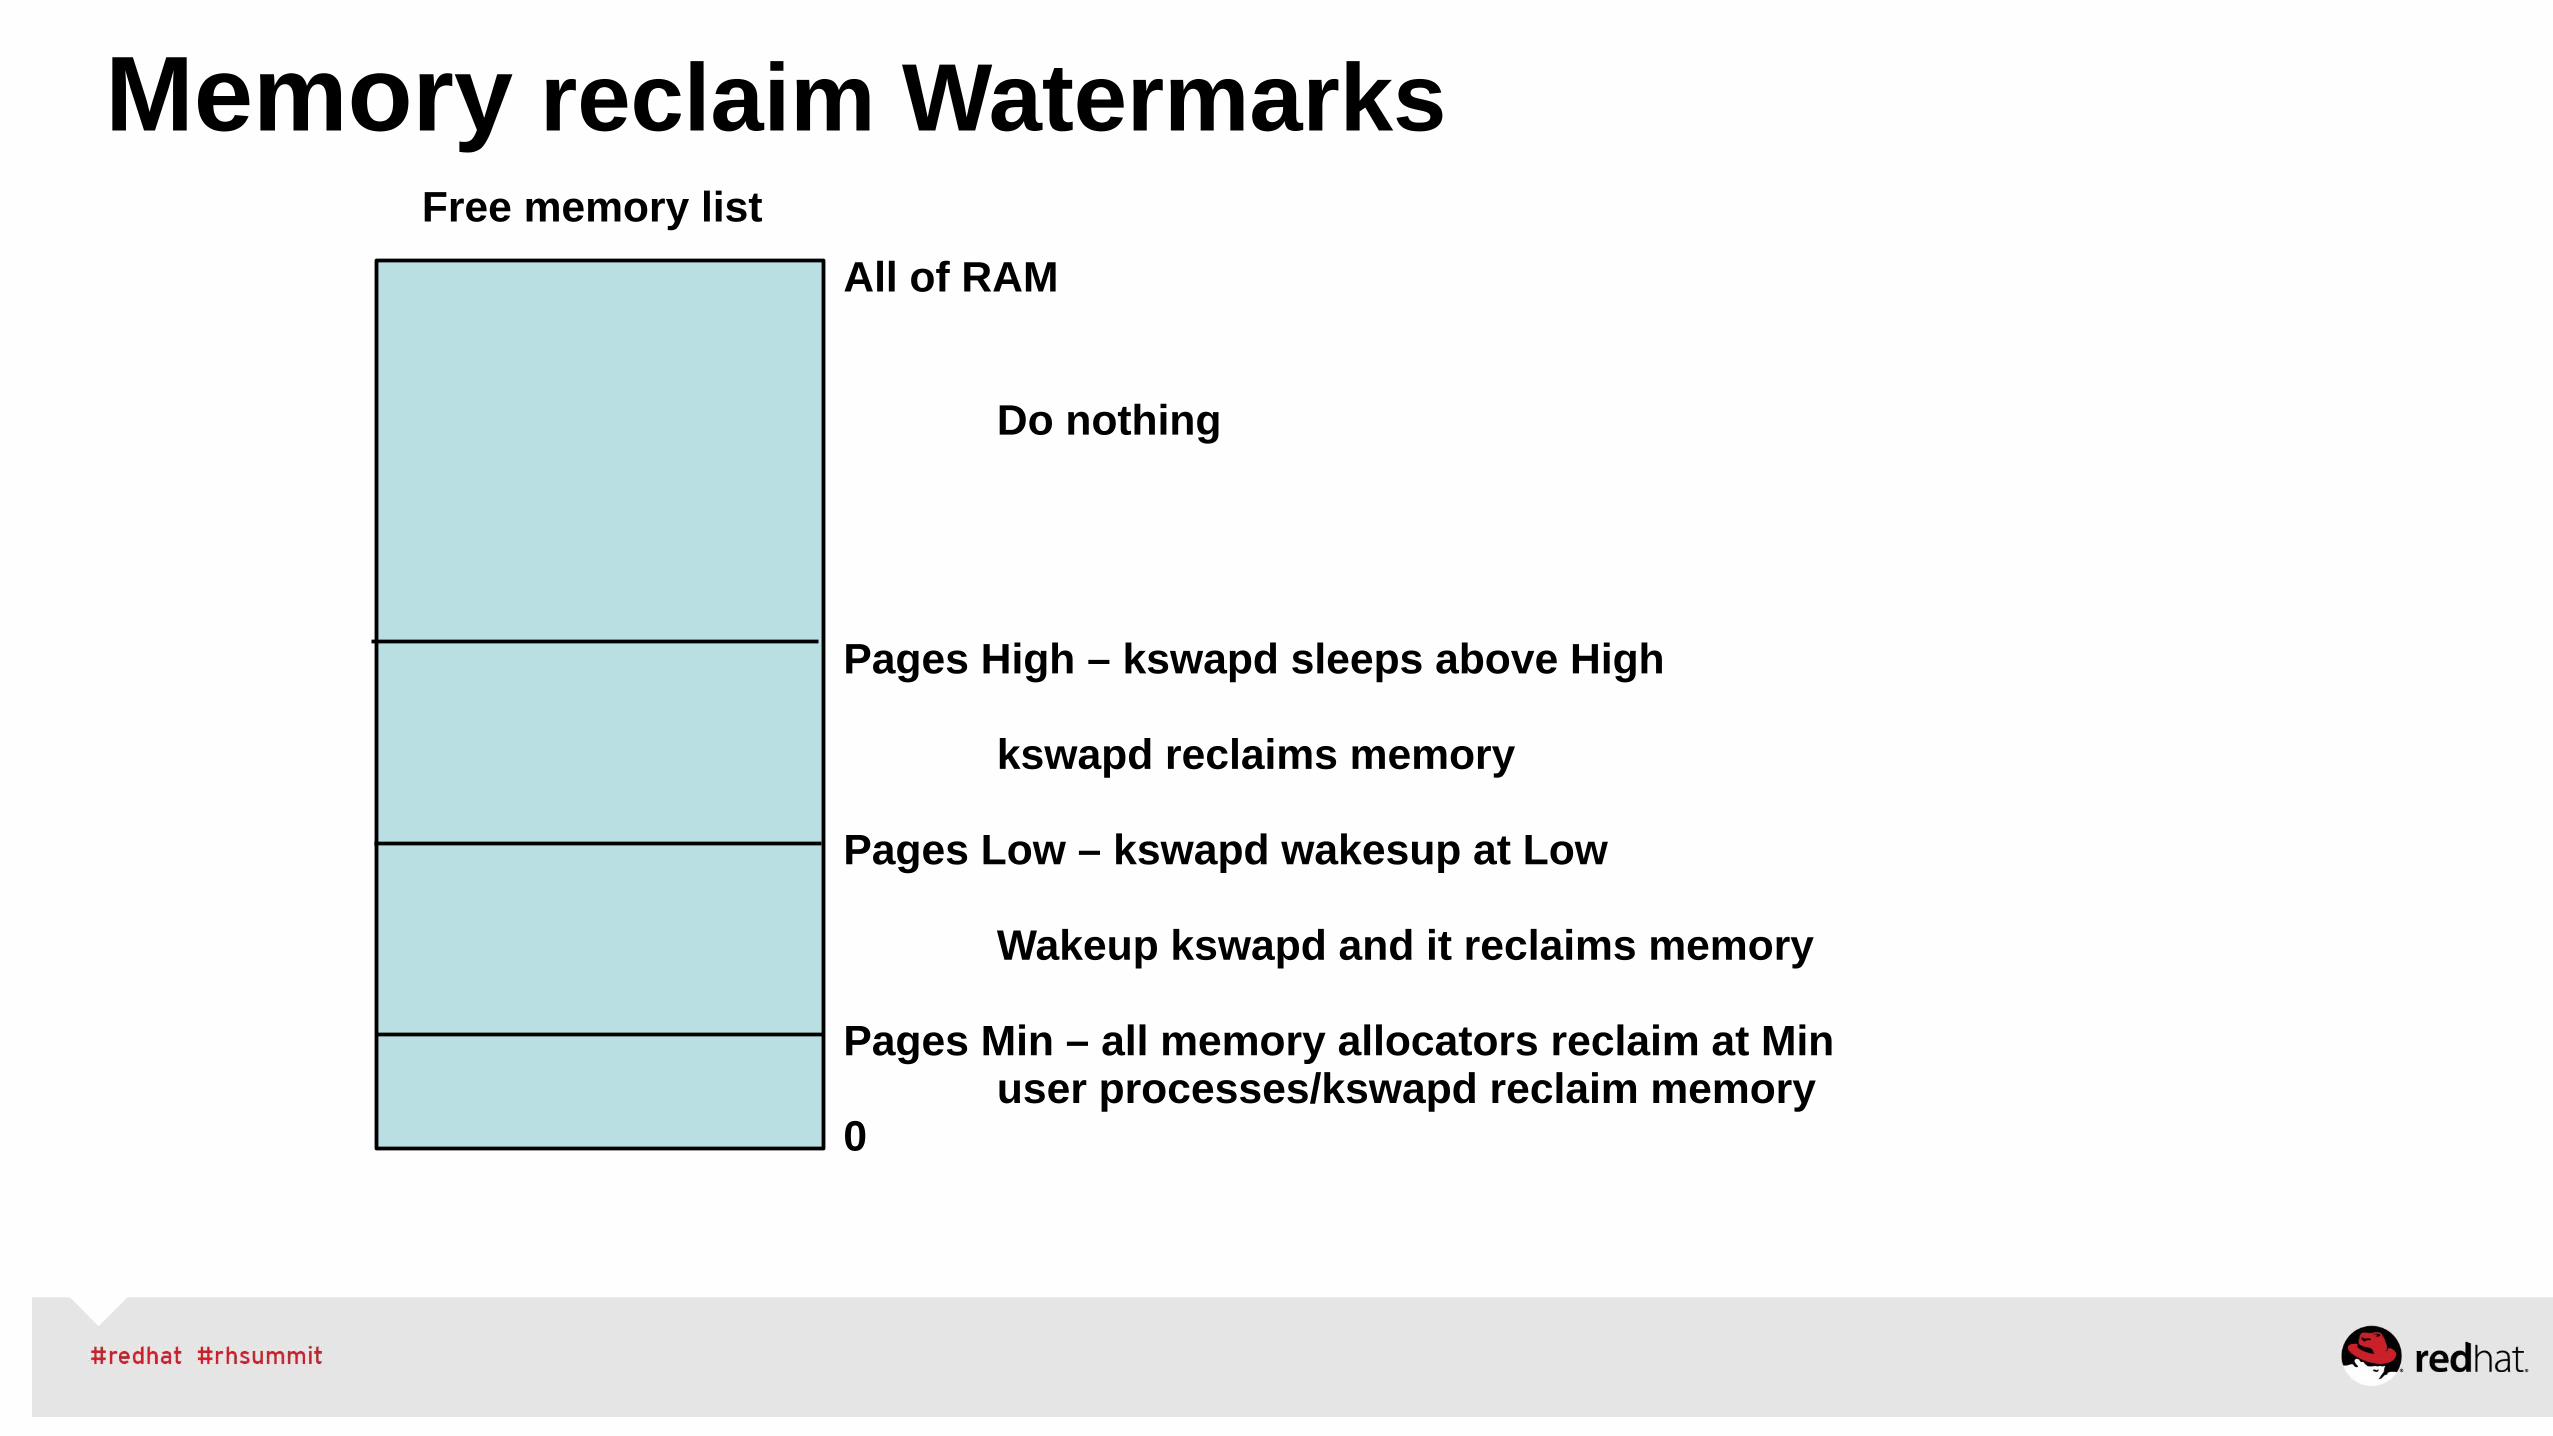
Memory reclaim Watermarks
All of RAM
Do nothing
Pages High – kswapd sleeps above High
kswapd reclaims memory
Pages Low – kswapd wakesup at Low
Wakeup kswapd and it reclaims memory
Pages Min – all memory allocators reclaim at Min user processes/kswapd reclaim memory0
Free memory list
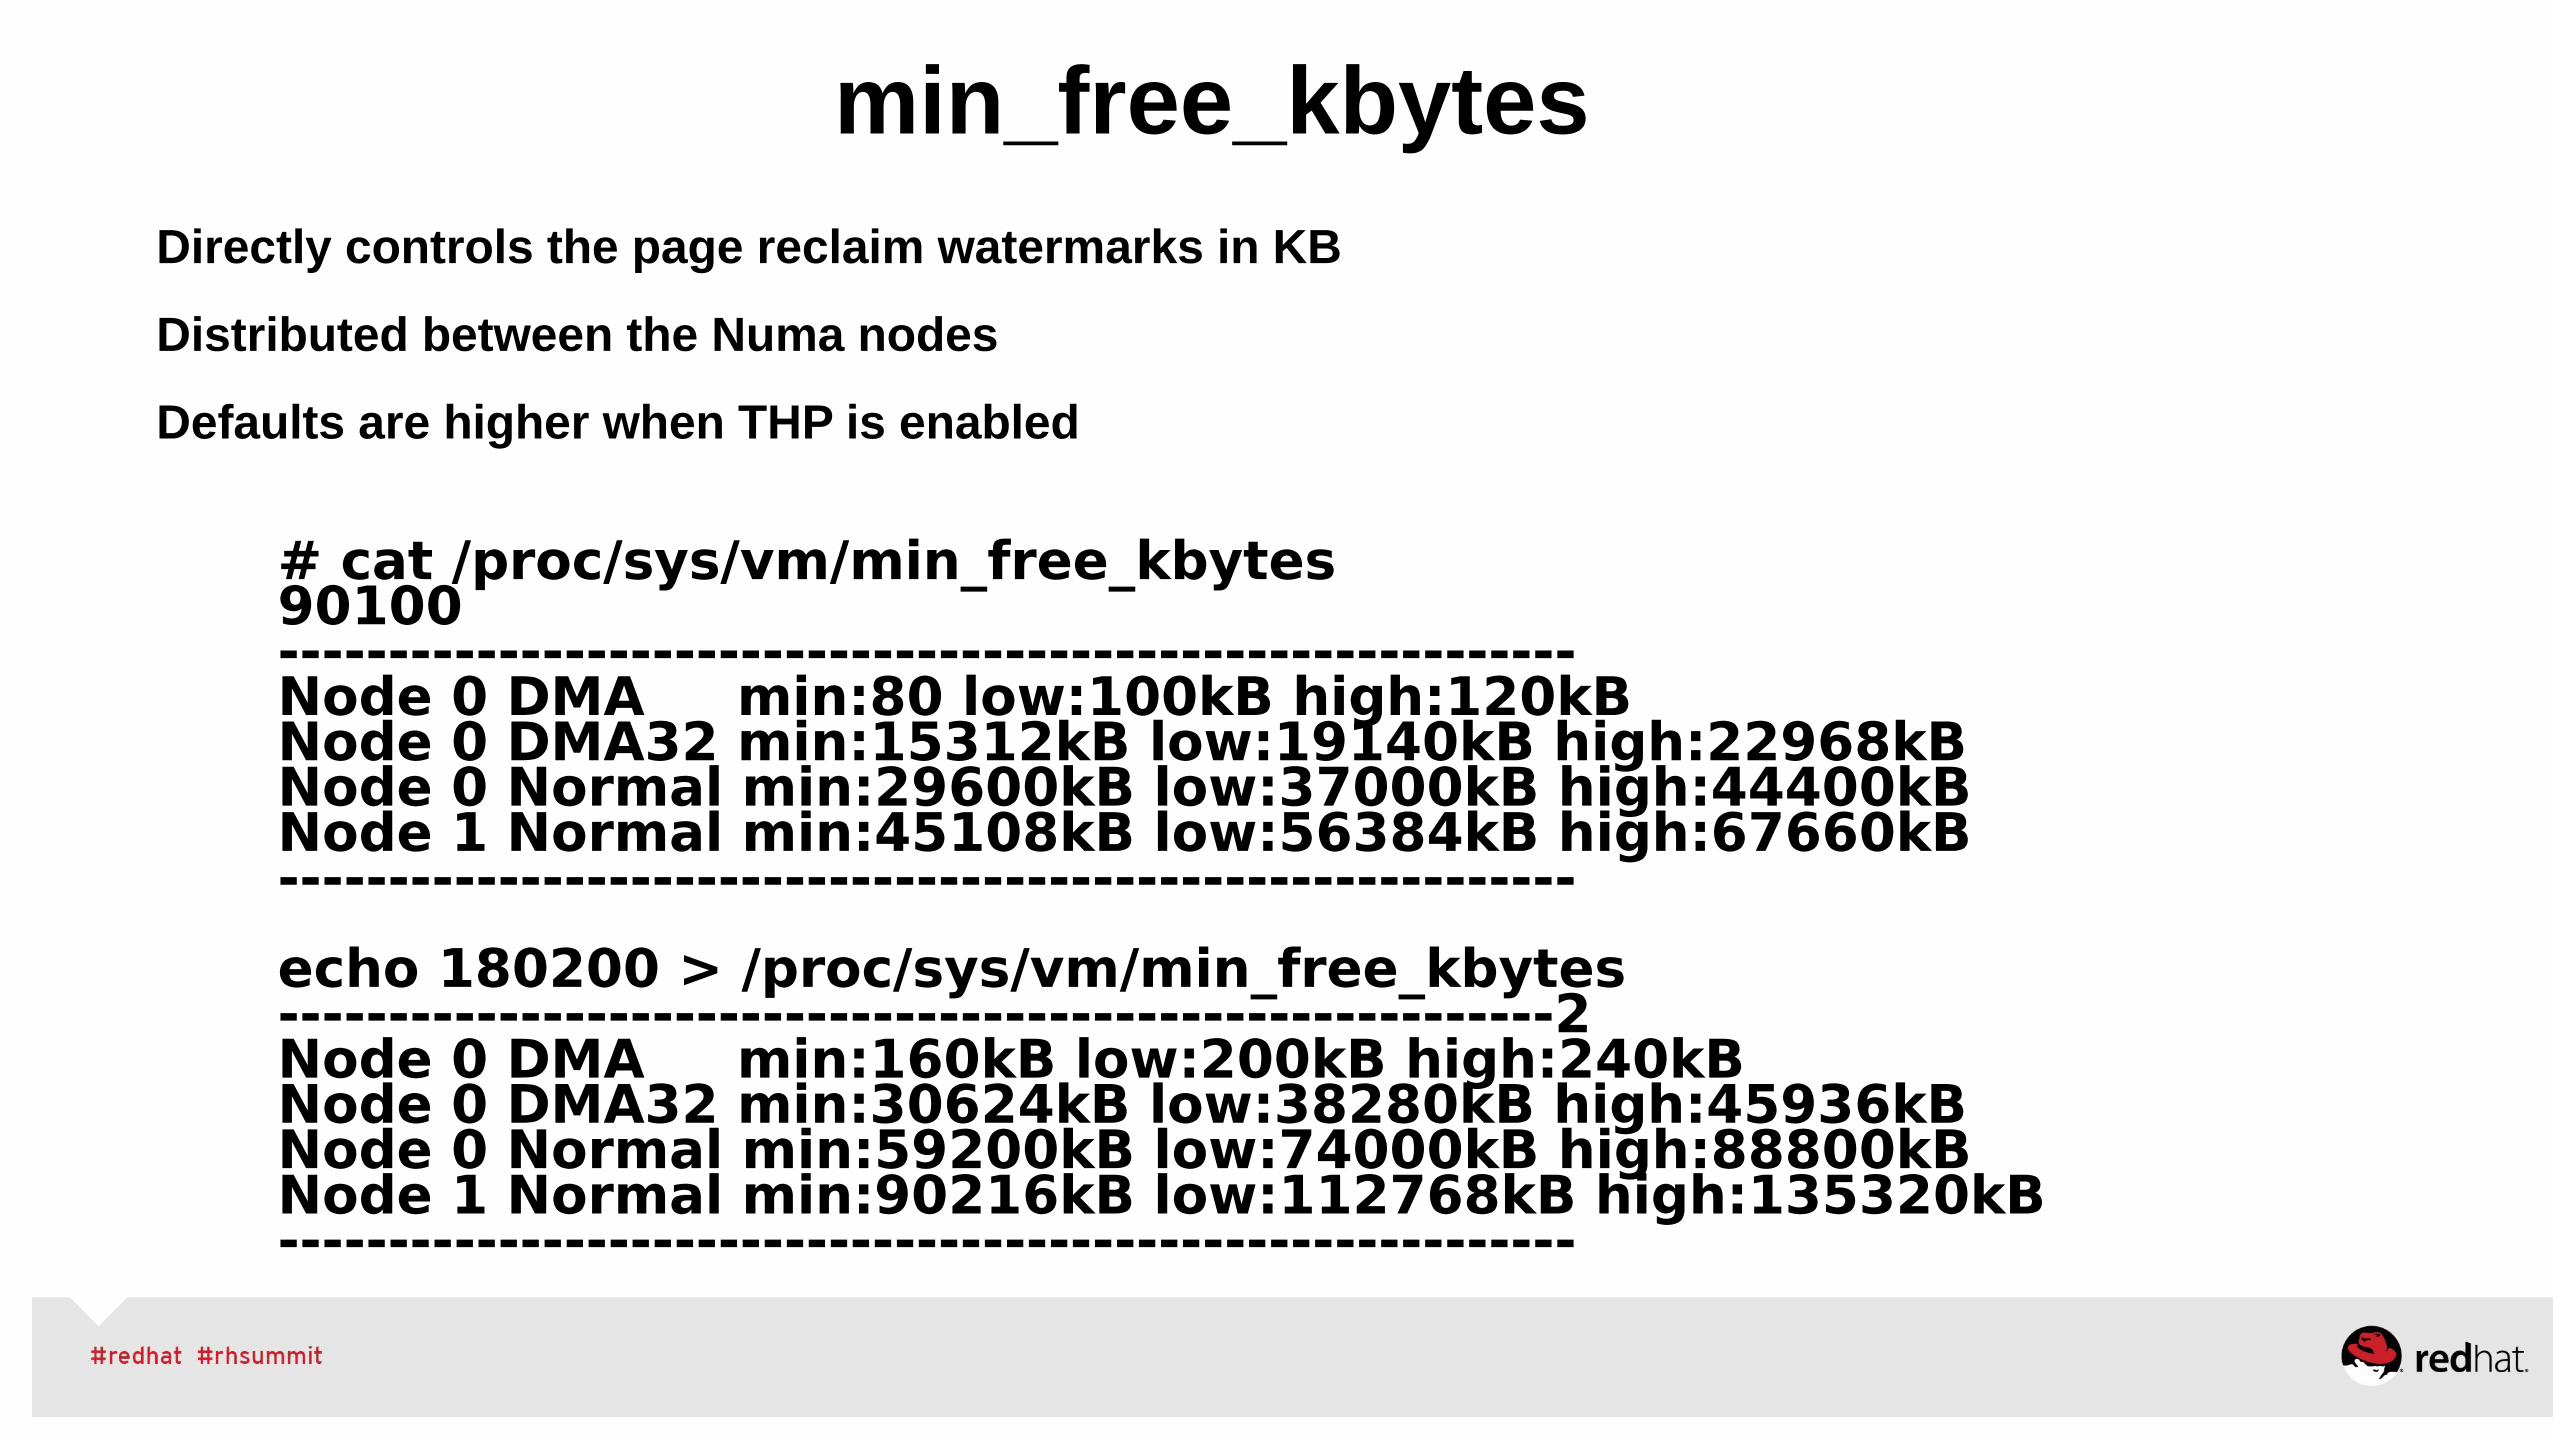
Directly controls the page reclaim watermarks in KB
Distributed between the Numa nodes
Defaults are higher when THP is enabled
min_free_kbytes
# cat /proc/sys/vm/min_free_kbytes90100-----------------------------------------------------------Node 0 DMA min:80 low:100kB high:120kBNode 0 DMA32 min:15312kB low:19140kB high:22968kBNode 0 Normal min:29600kB low:37000kB high:44400kBNode 1 Normal min:45108kB low:56384kB high:67660kB----------------------------------------------------------- echo 180200 > /proc/sys/vm/min_free_kbytes----------------------------------------------------------2Node 0 DMA min:160kB low:200kB high:240kBNode 0 DMA32 min:30624kB low:38280kB high:45936kBNode 0 Normal min:59200kB low:74000kB high:88800kBNode 1 Normal min:90216kB low:112768kB high:135320kB-----------------------------------------------------------
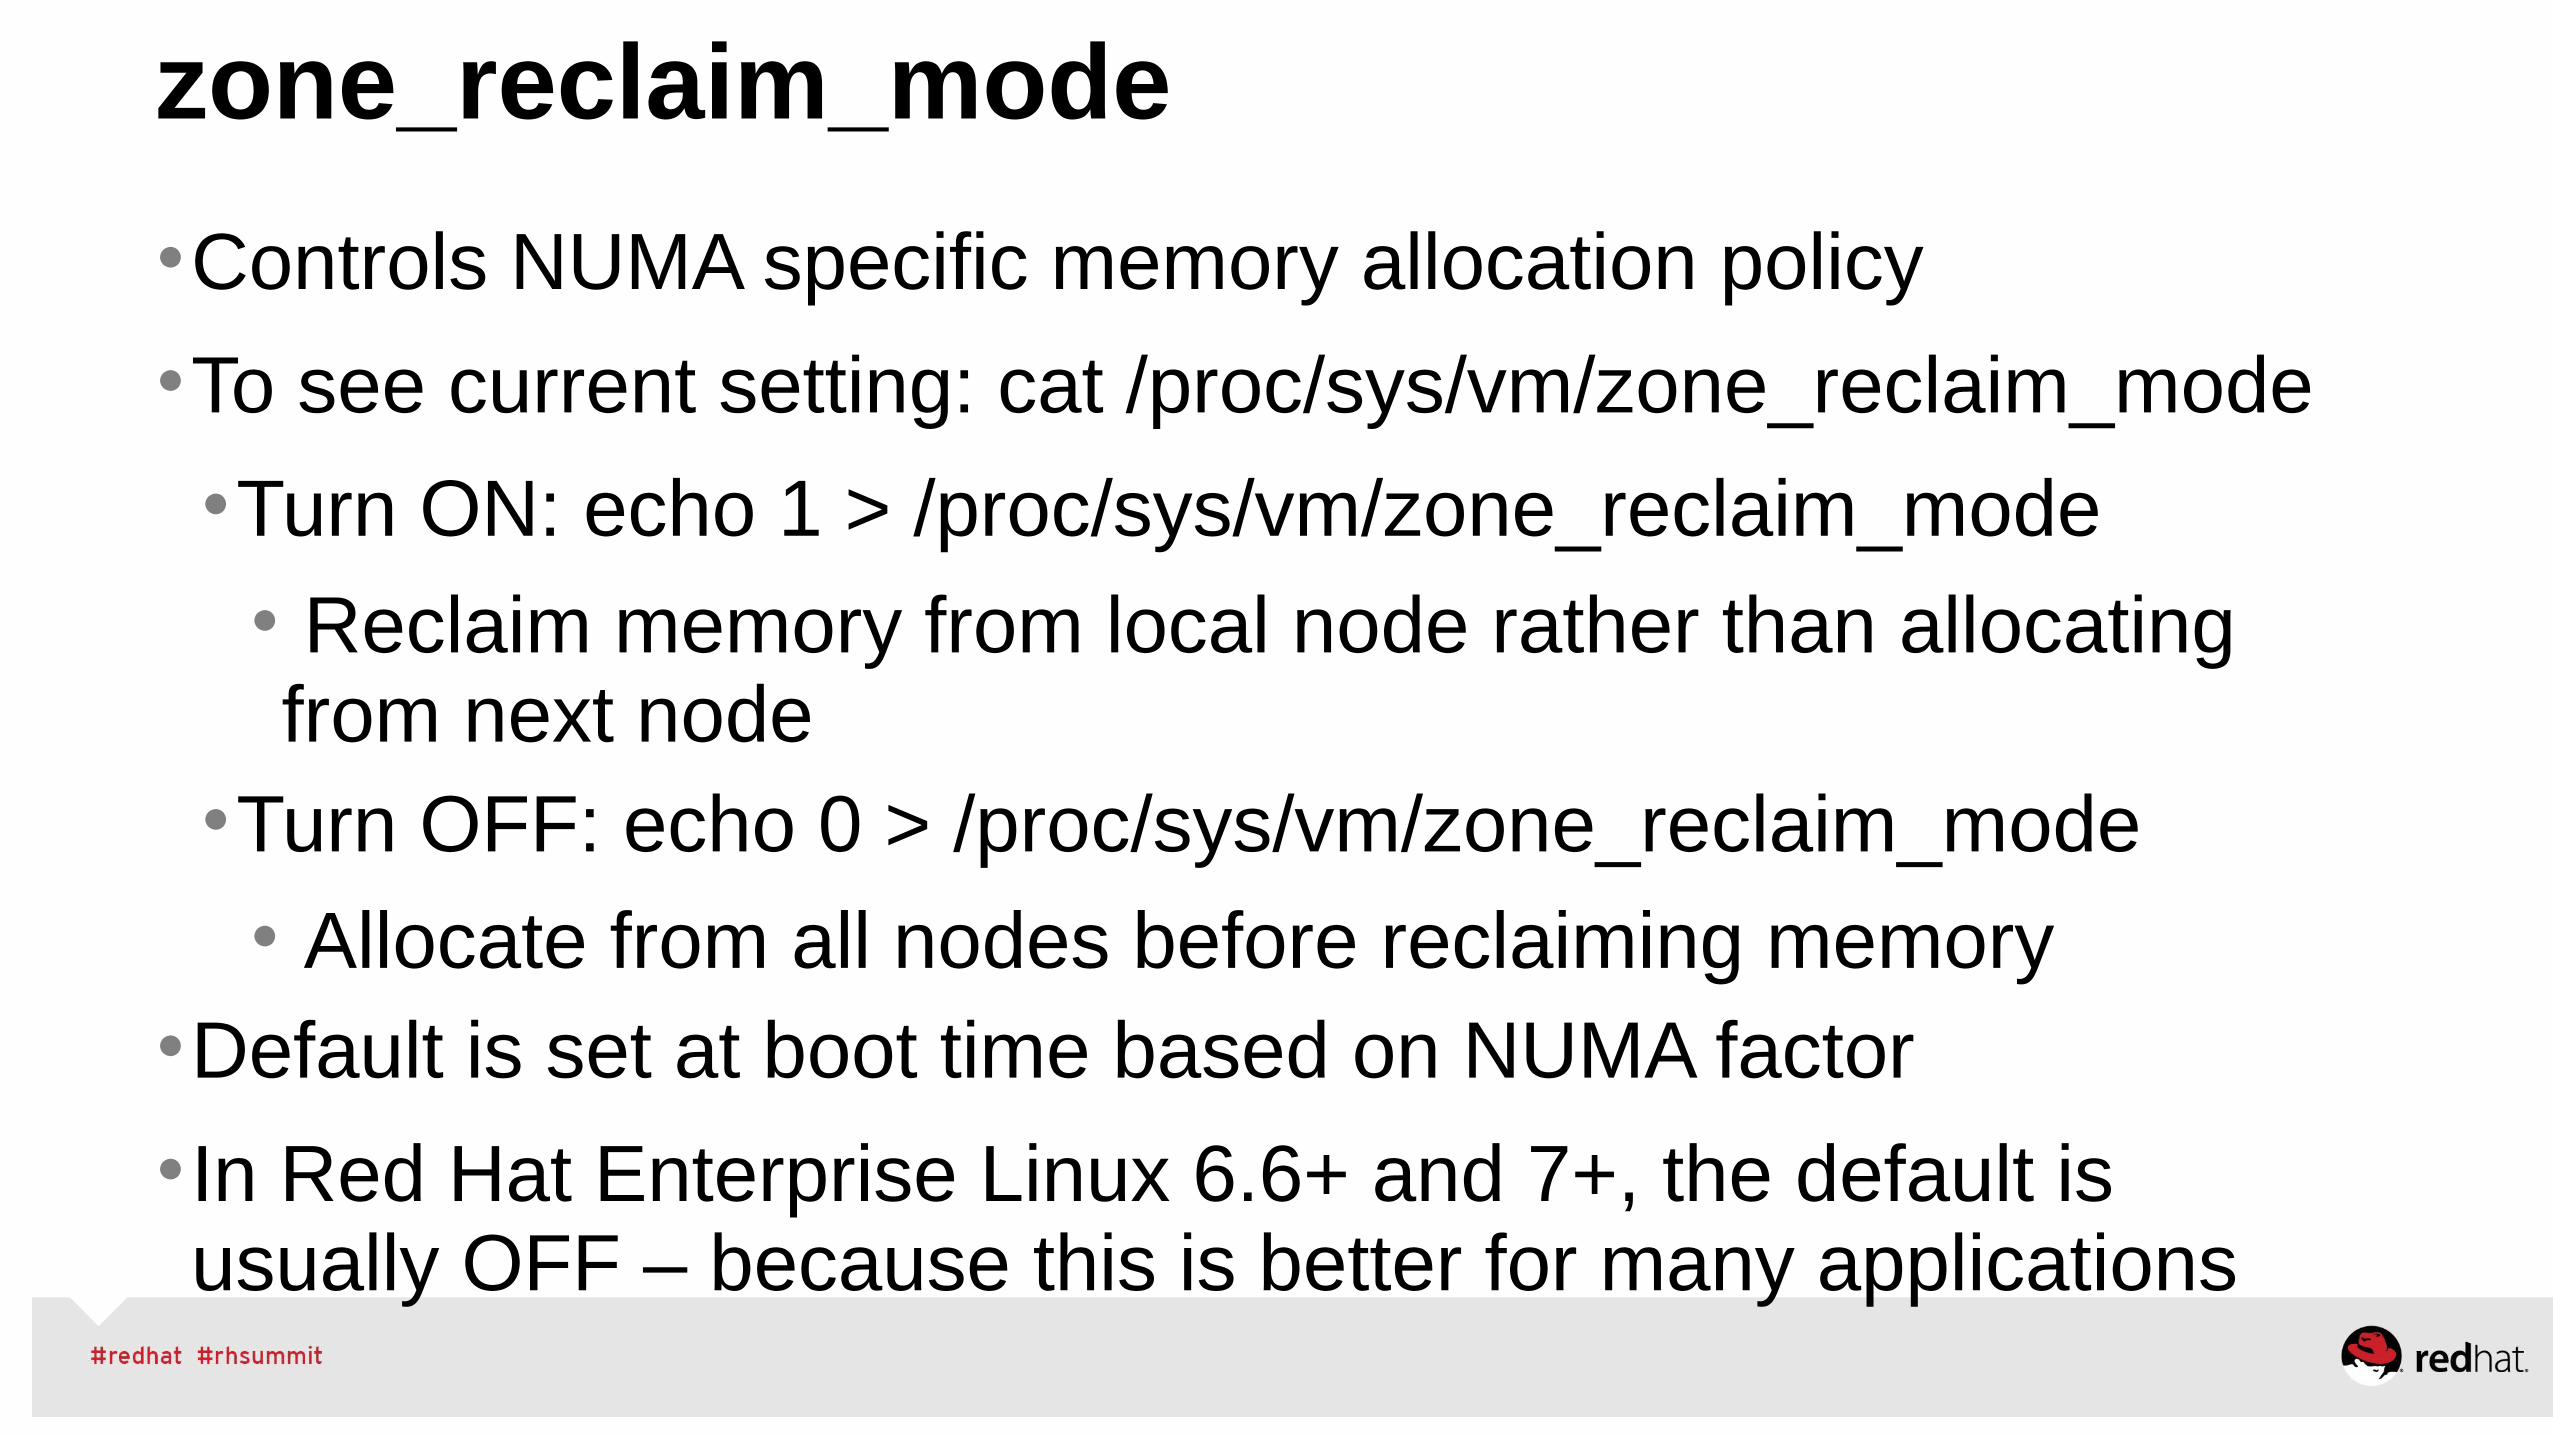
•Controls NUMA specific memory allocation policy
•To see current setting: cat /proc/sys/vm/zone_reclaim_mode
•Turn ON: echo 1 > /proc/sys/vm/zone_reclaim_mode
• Reclaim memory from local node rather than allocating from next node
•Turn OFF: echo 0 > /proc/sys/vm/zone_reclaim_mode
• Allocate from all nodes before reclaiming memory•Default is set at boot time based on NUMA factor
•In Red Hat Enterprise Linux 6.6+ and 7+, the default is usually OFF – because this is better for many applications
zone_reclaim_mode
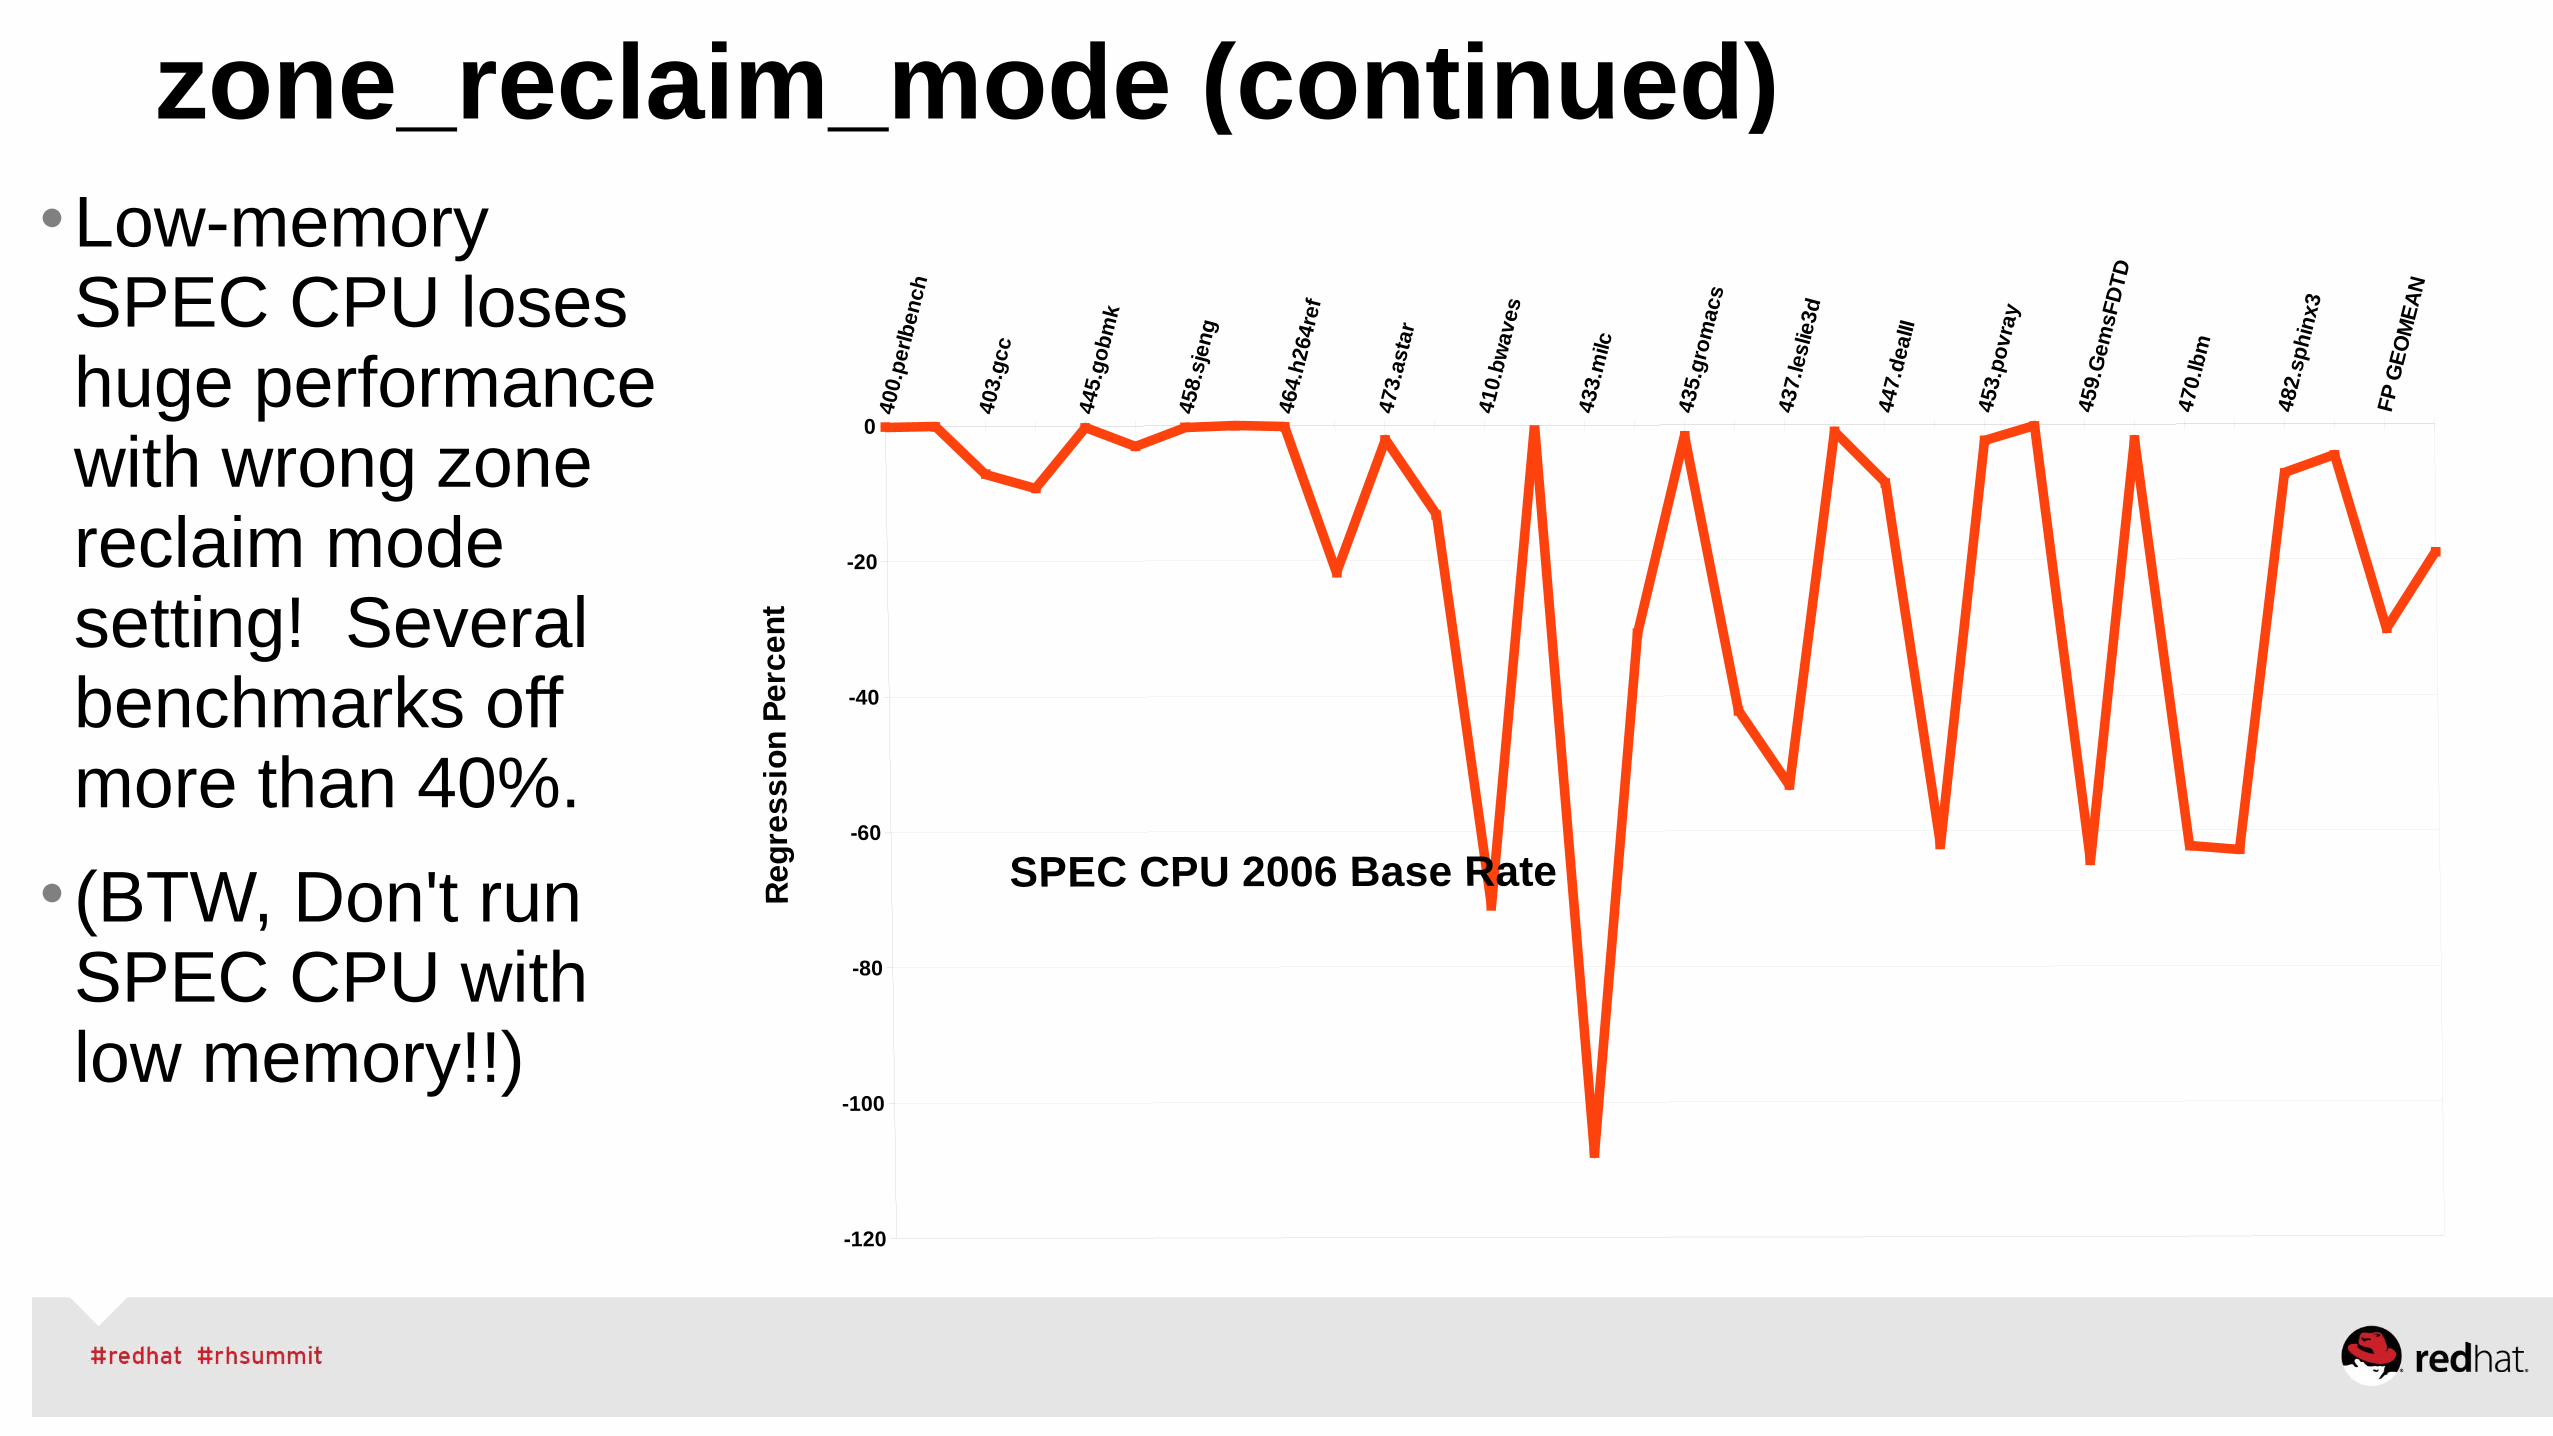
•Low-memory SPEC CPU loses huge performance with wrong zone reclaim mode setting! Several benchmarks off more than 40%.
• (BTW, Don't run SPEC CPU with low memory!!)
zone_reclaim_mode (continued)
NUMA tuning for KVM / Atomic is the same!
•Best performance is achieved if the size of the guest/container can fit into a single NUMA node.
•In RHEL7, auto-numa kernel scheduler will try to move guest to one node.
•Great doc with numerous examples: See the NUMA chapter in:
Red Hat Virtualization Tuning and Optimization Guide
RED HAT CONFIDENTIAL | Joe Mario#rhconvergence
39
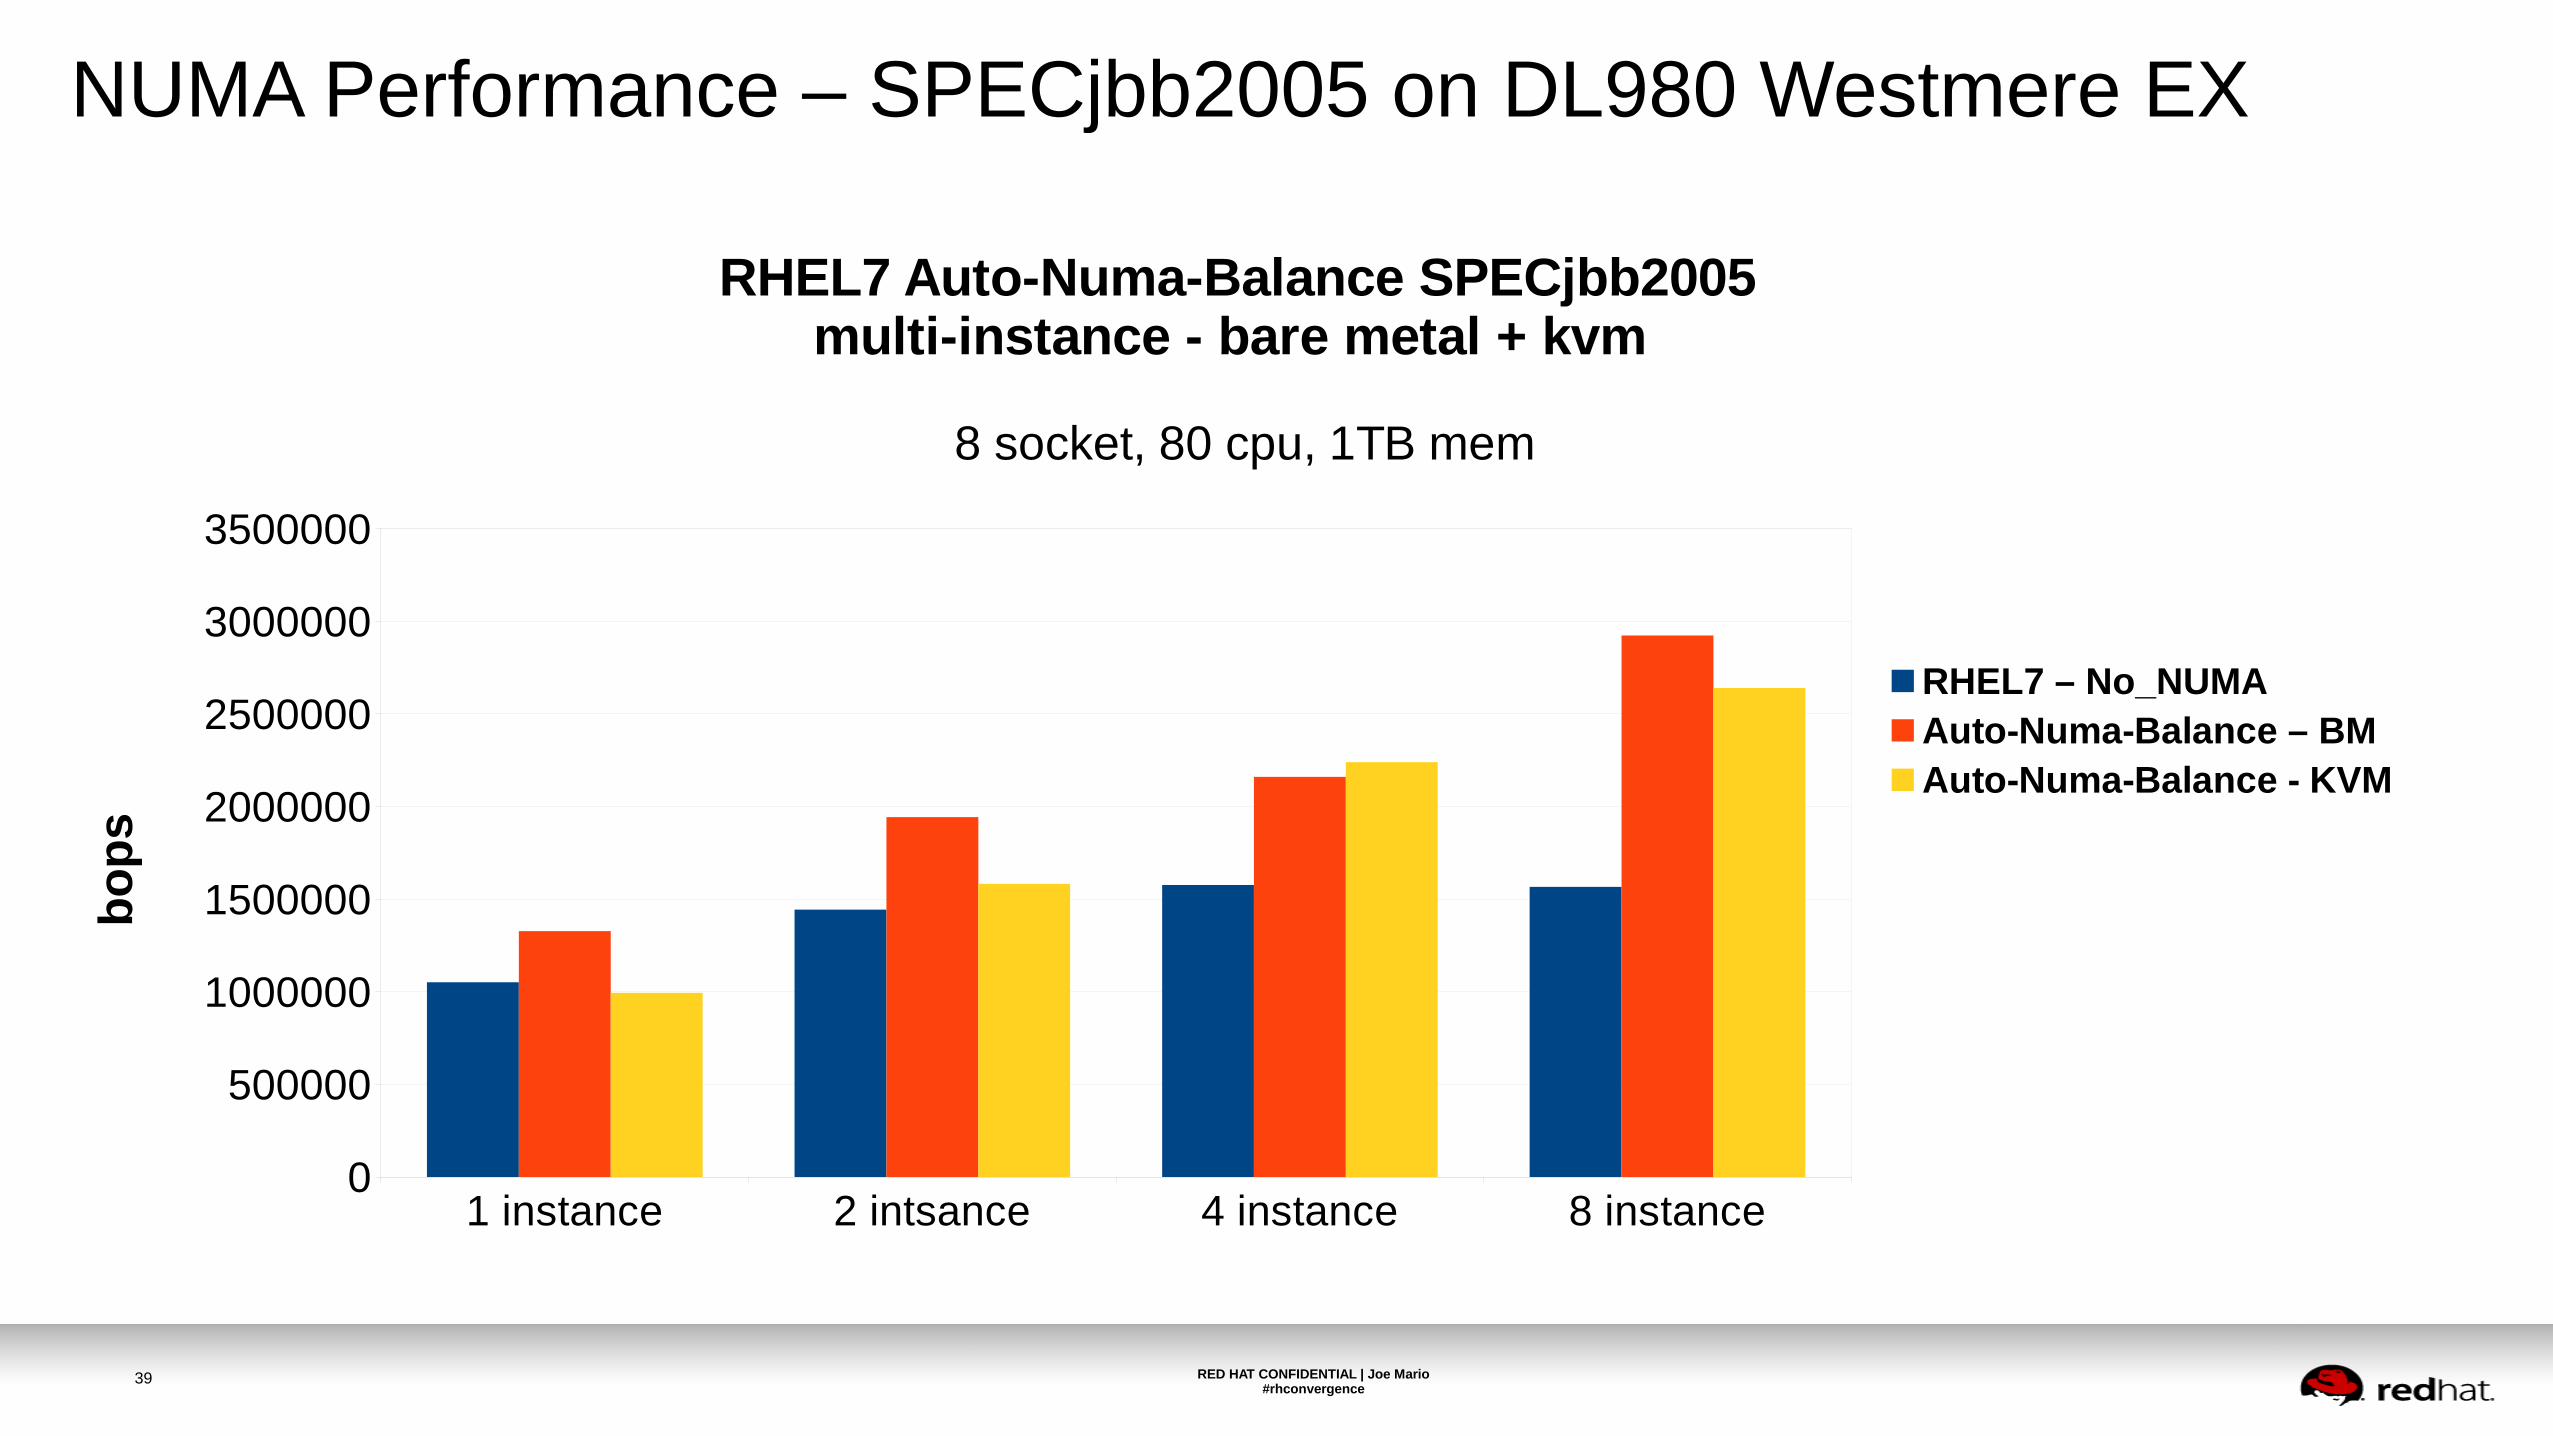
NUMA Performance – SPECjbb2005 on DL980 Westmere EX
1 instance 2 intsance 4 instance 8 instance0
500000
1000000
1500000
2000000
2500000
3000000
3500000
RHEL7 Auto-Numa-Balance SPECjbb2005 multi-instance - bare metal + kvm
8 socket, 80 cpu, 1TB mem
RHEL7 – No_NUMAAuto-Numa-Balance – BMAuto-Numa-Balance - KVM
bo
ps

Red Hat Enterprise Linux Cgroups
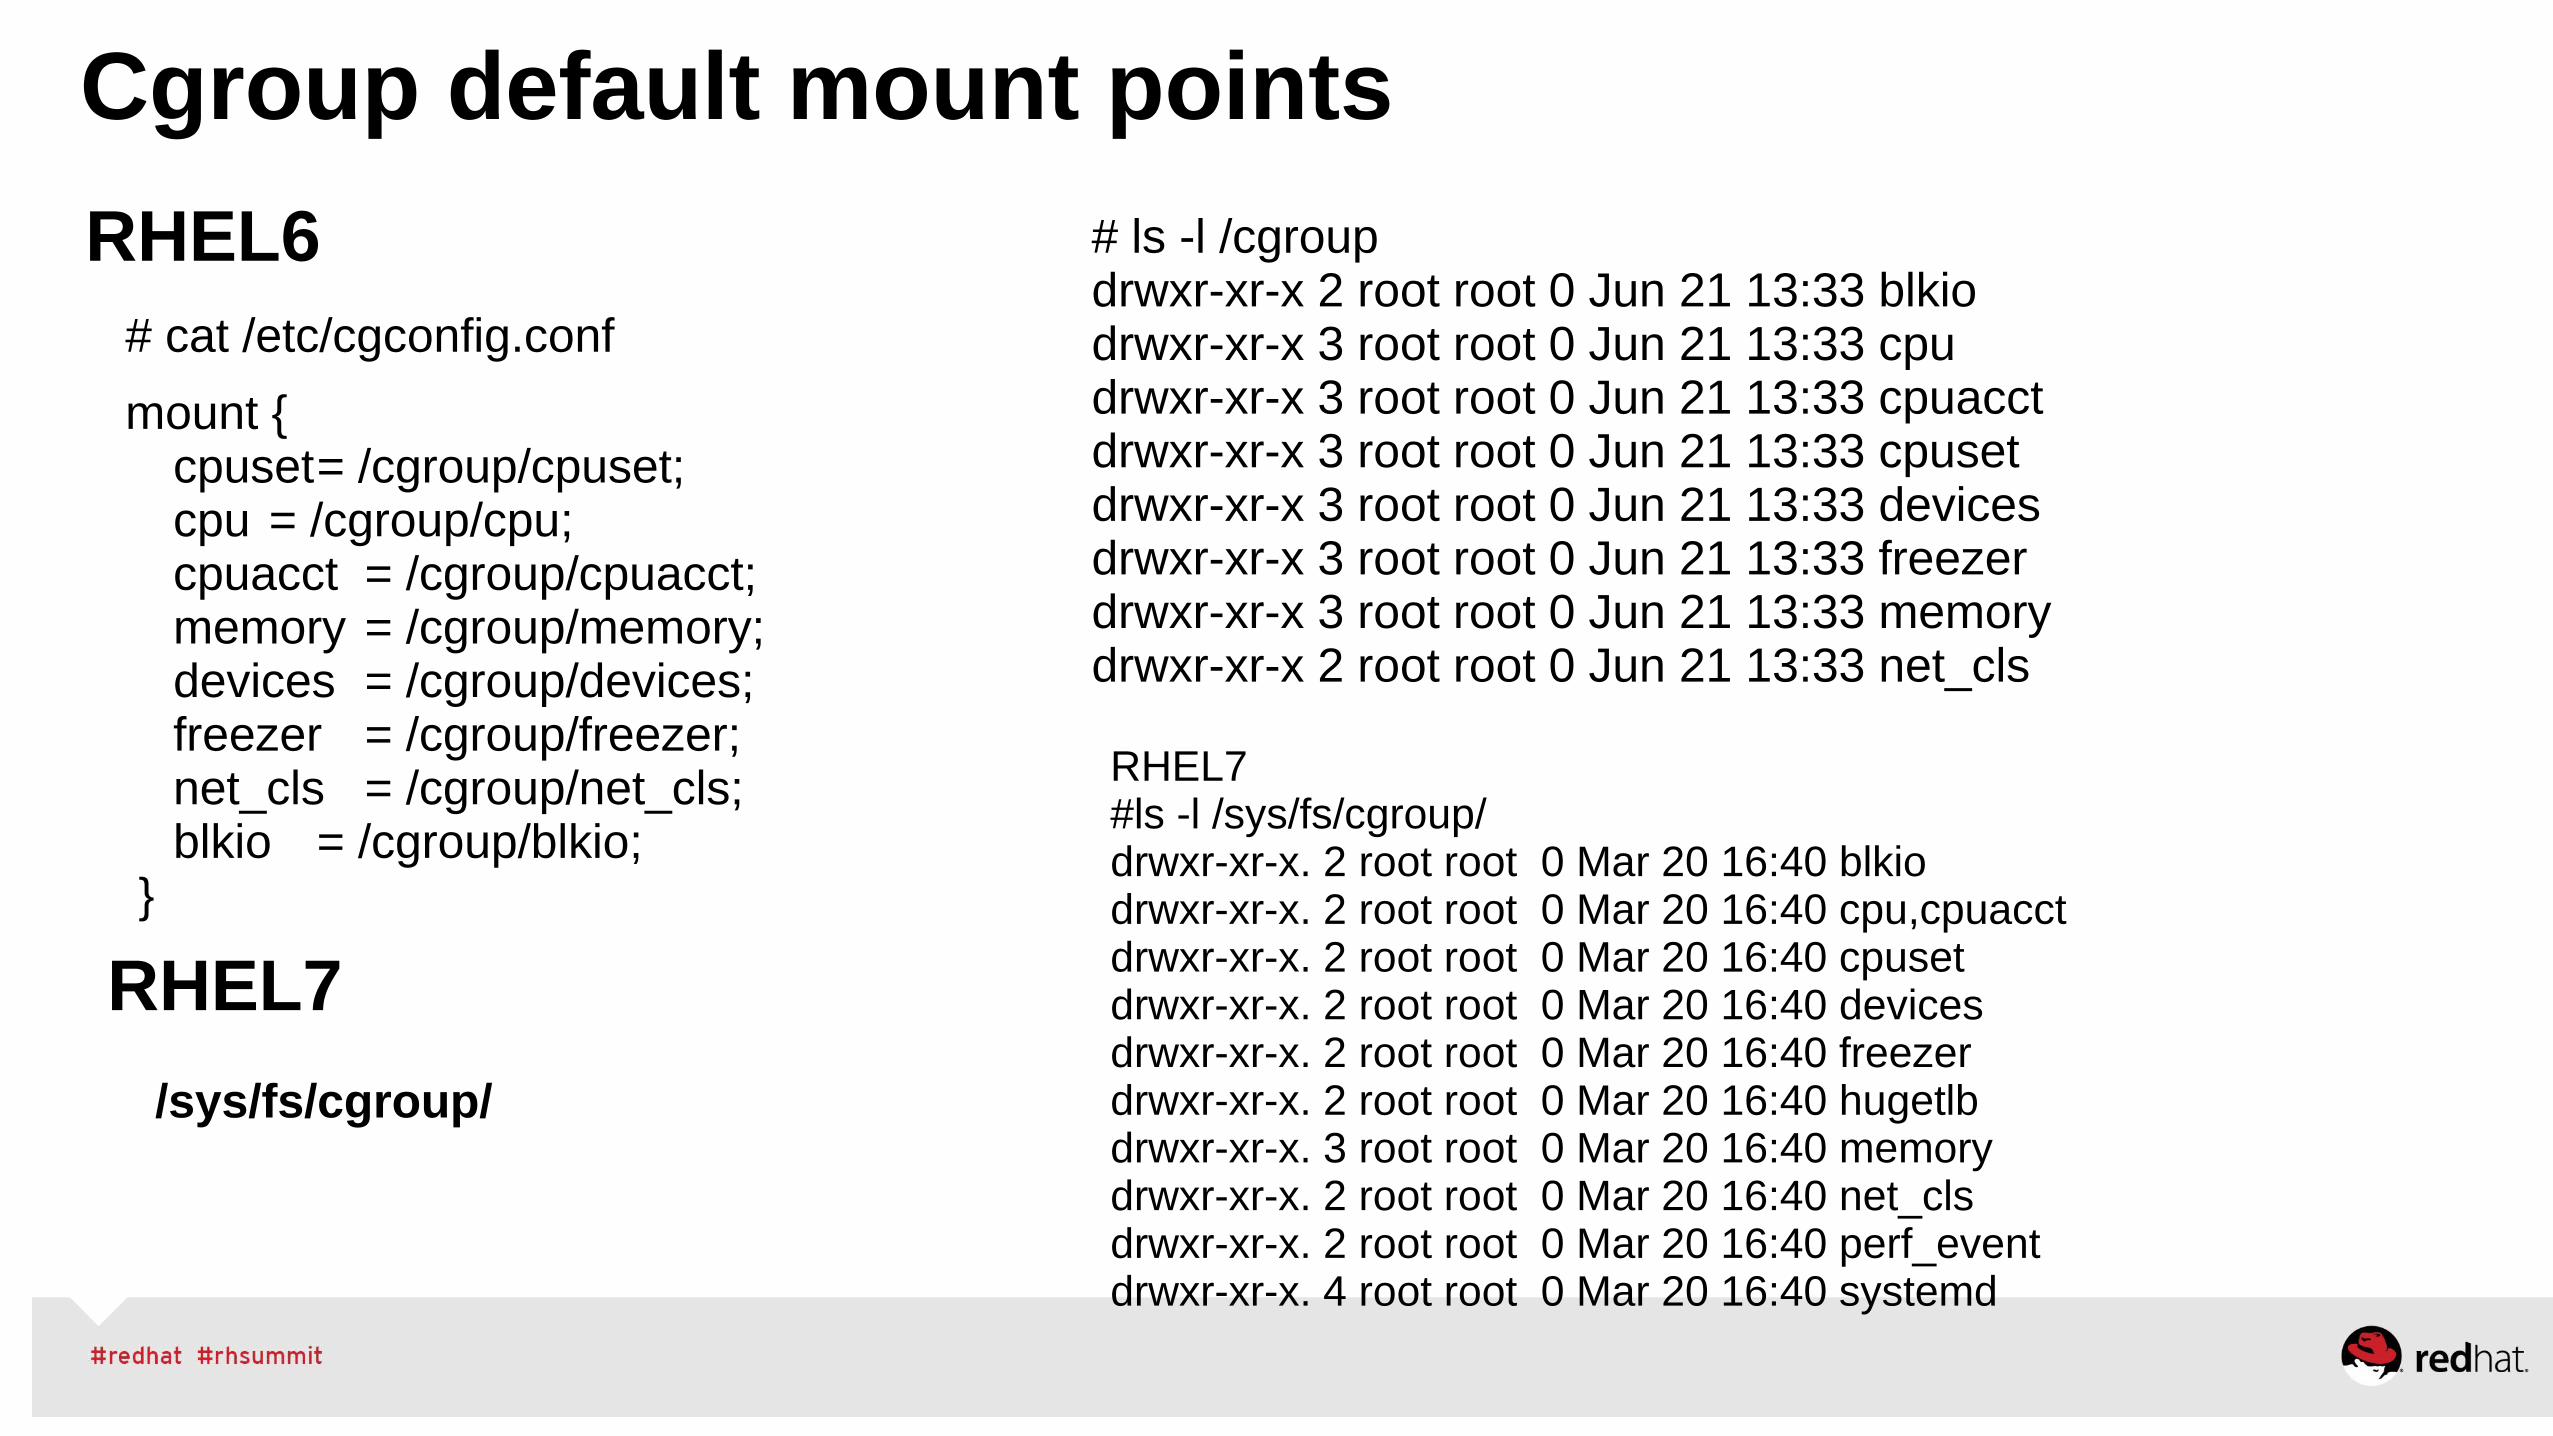
Cgroup default mount points
# cat /etc/cgconfig.conf
mount {cpuset= /cgroup/cpuset;cpu = /cgroup/cpu;cpuacct = /cgroup/cpuacct;memory = /cgroup/memory;devices = /cgroup/devices;freezer = /cgroup/freezer;net_cls = /cgroup/net_cls;blkio = /cgroup/blkio;
}
# ls -l /cgroupdrwxr-xr-x 2 root root 0 Jun 21 13:33 blkiodrwxr-xr-x 3 root root 0 Jun 21 13:33 cpudrwxr-xr-x 3 root root 0 Jun 21 13:33 cpuacctdrwxr-xr-x 3 root root 0 Jun 21 13:33 cpusetdrwxr-xr-x 3 root root 0 Jun 21 13:33 devicesdrwxr-xr-x 3 root root 0 Jun 21 13:33 freezerdrwxr-xr-x 3 root root 0 Jun 21 13:33 memorydrwxr-xr-x 2 root root 0 Jun 21 13:33 net_cls
RHEL6
RHEL7
/sys/fs/cgroup/
RHEL7#ls -l /sys/fs/cgroup/drwxr-xr-x. 2 root root 0 Mar 20 16:40 blkiodrwxr-xr-x. 2 root root 0 Mar 20 16:40 cpu,cpuacctdrwxr-xr-x. 2 root root 0 Mar 20 16:40 cpusetdrwxr-xr-x. 2 root root 0 Mar 20 16:40 devicesdrwxr-xr-x. 2 root root 0 Mar 20 16:40 freezerdrwxr-xr-x. 2 root root 0 Mar 20 16:40 hugetlbdrwxr-xr-x. 3 root root 0 Mar 20 16:40 memorydrwxr-xr-x. 2 root root 0 Mar 20 16:40 net_clsdrwxr-xr-x. 2 root root 0 Mar 20 16:40 perf_eventdrwxr-xr-x. 4 root root 0 Mar 20 16:40 systemd
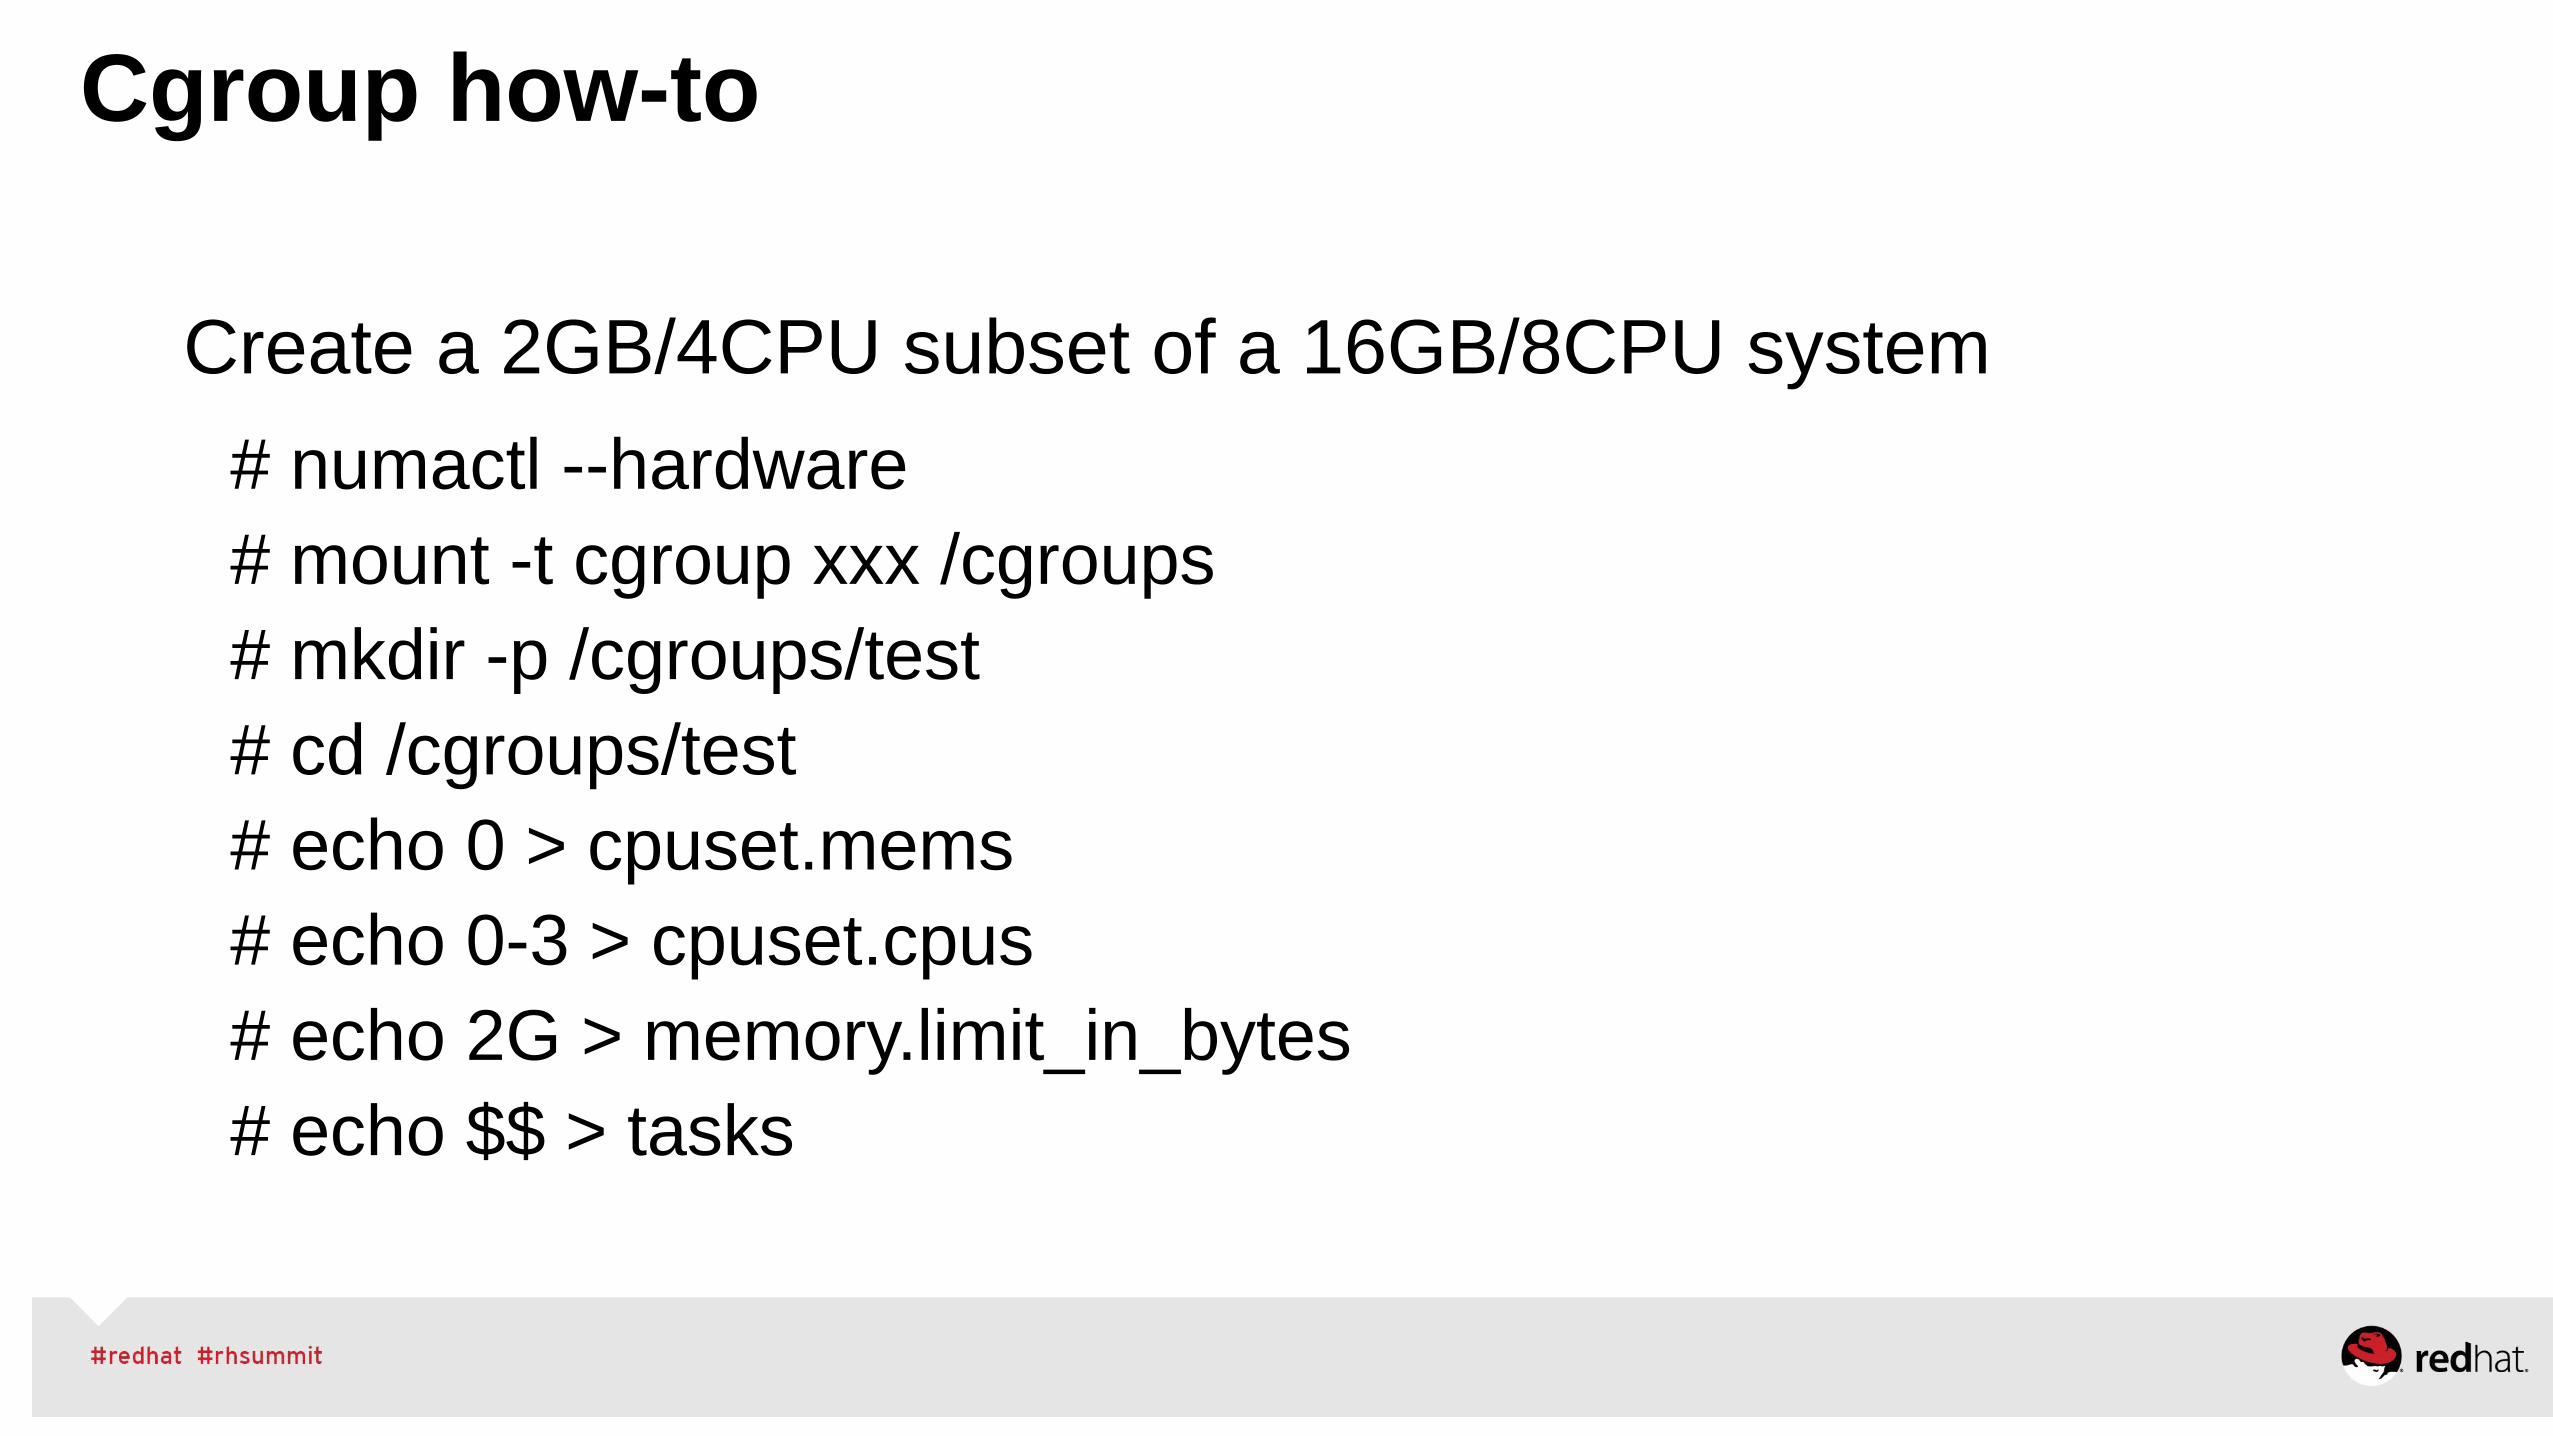
Create a 2GB/4CPU subset of a 16GB/8CPU system
# numactl --hardware# mount -t cgroup xxx /cgroups# mkdir -p /cgroups/test# cd /cgroups/test# echo 0 > cpuset.mems# echo 0-3 > cpuset.cpus# echo 2G > memory.limit_in_bytes# echo $$ > tasks
Cgroup how-to

# echo 0-3 > cpuset.cpus
# runmany 20MB 110procs &
# top -d 5
top - 12:24:13 up 1:36, 4 users, load average: 22.70, 5.32, 1.79
Tasks: 315 total, 93 running, 222 sleeping, 0 stopped, 0 zombie
Cpu0 : 100.0%us, 0.0%sy, 0.0%ni, 0.0%id, 0.0%wa, 0.0%hi, 0.0%si, 0.0%st
Cpu1 : 100.0%us, 0.0%sy, 0.0%ni, 0.0%id, 0.0%wa, 0.0%hi, 0.0%si, 0.0%st
Cpu2 : 100.0%us, 0.0%sy, 0.0%ni, 0.0%id, 0.0%wa, 0.0%hi, 0.0%si, 0.0%st
Cpu3 : 100.0%us, 0.0%sy, 0.0%ni, 0.0%id, 0.0%wa, 0.0%hi, 0.0%si, 0.0%st
Cpu4 : 0.4%us, 0.6%sy, 0.0%ni, 98.8%id, 0.0%wa, 0.0%hi, 0.2%si, 0.0%st
Cpu5 : 0.4%us, 0.0%sy, 0.0%ni, 99.2%id, 0.0%wa, 0.0%hi, 0.4%si, 0.0%st
Cpu6 : 0.0%us, 0.0%sy, 0.0%ni,100.0%id, 0.0%wa, 0.0%hi, 0.0%si, 0.0%st
Cpu7 : 0.0%us, 0.0%sy, 0.0%ni, 99.8%id, 0.0%wa, 0.0%hi, 0.2%si, 0.0%st
cgroups
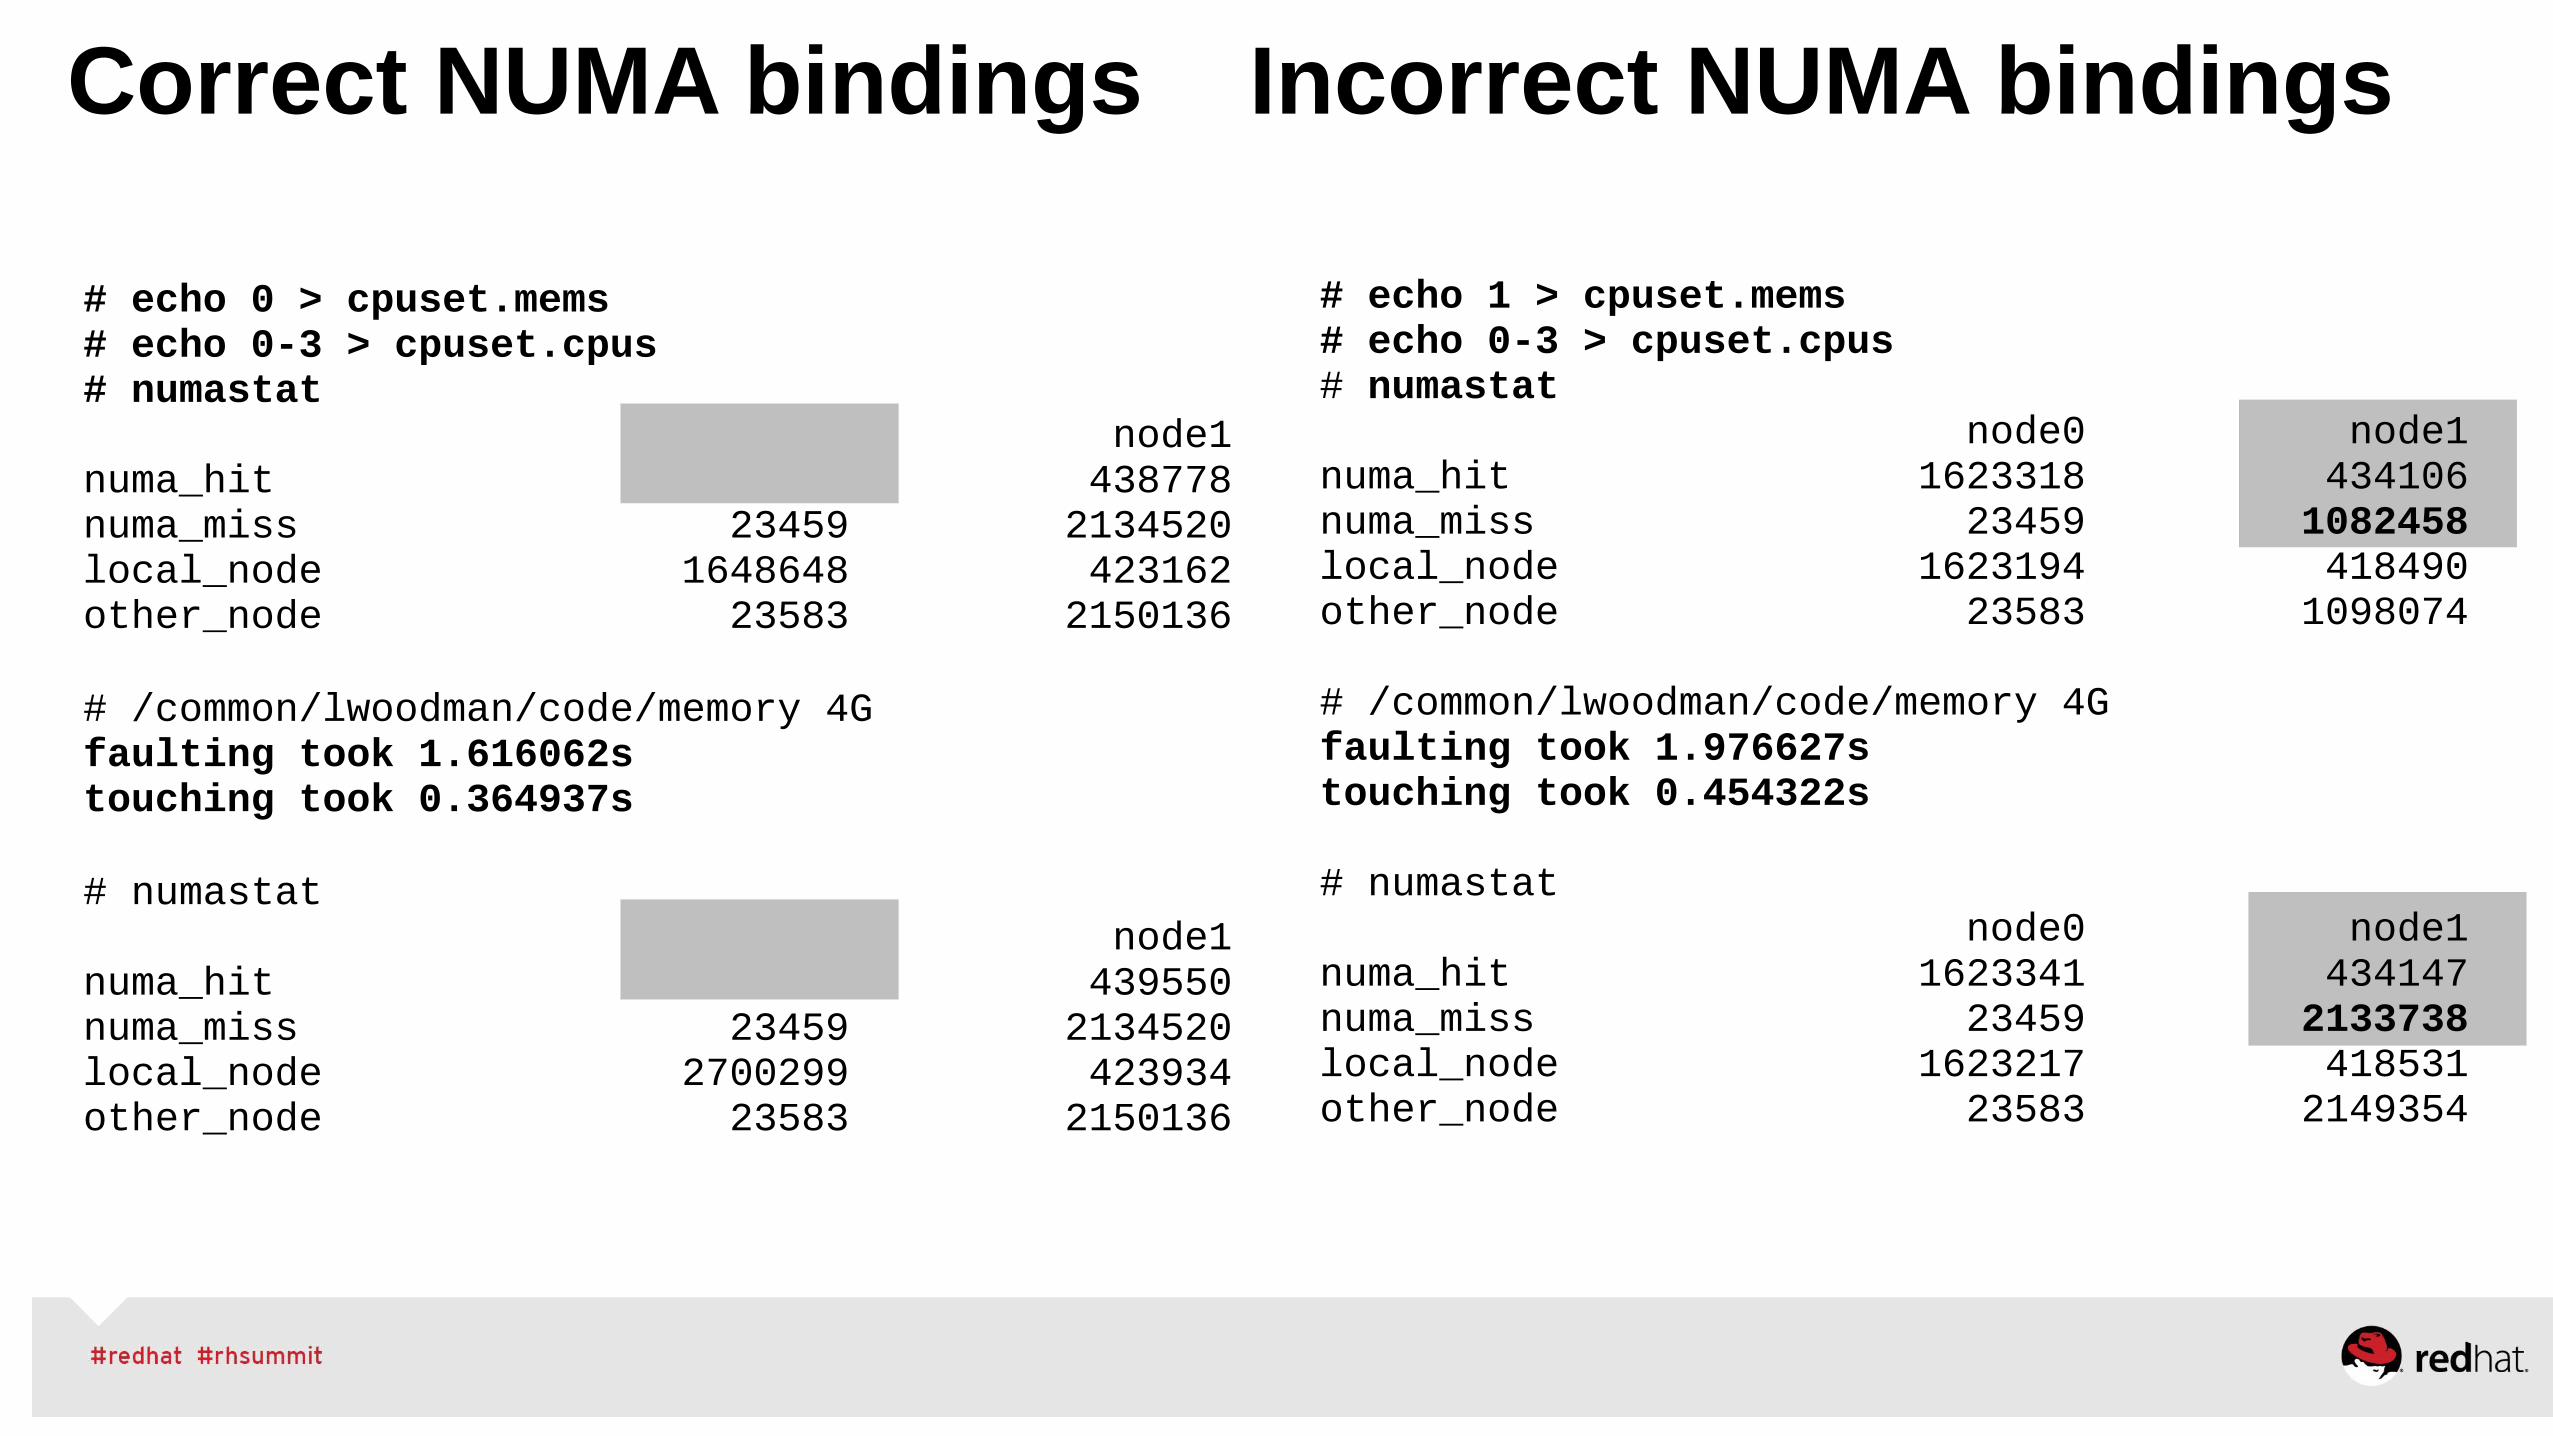
Correct NUMA bindings Incorrect NUMA bindings
# echo 0 > cpuset.mems# echo 0-3 > cpuset.cpus# numastat node0 node1numa_hit 1648772 438778numa_miss 23459 2134520local_node 1648648 423162other_node 23583 2150136
# /common/lwoodman/code/memory 4Gfaulting took 1.616062s touching took 0.364937s
# numastat node0 node1numa_hit 2700423 439550numa_miss 23459 2134520local_node 2700299 423934other_node 23583 2150136
# echo 1 > cpuset.mems# echo 0-3 > cpuset.cpus# numastat node0 node1numa_hit 1623318 434106numa_miss 23459 1082458local_node 1623194 418490other_node 23583 1098074
# /common/lwoodman/code/memory 4Gfaulting took 1.976627s touching took 0.454322s
# numastat node0 node1numa_hit 1623341 434147numa_miss 23459 2133738local_node 1623217 418531other_node 23583 2149354
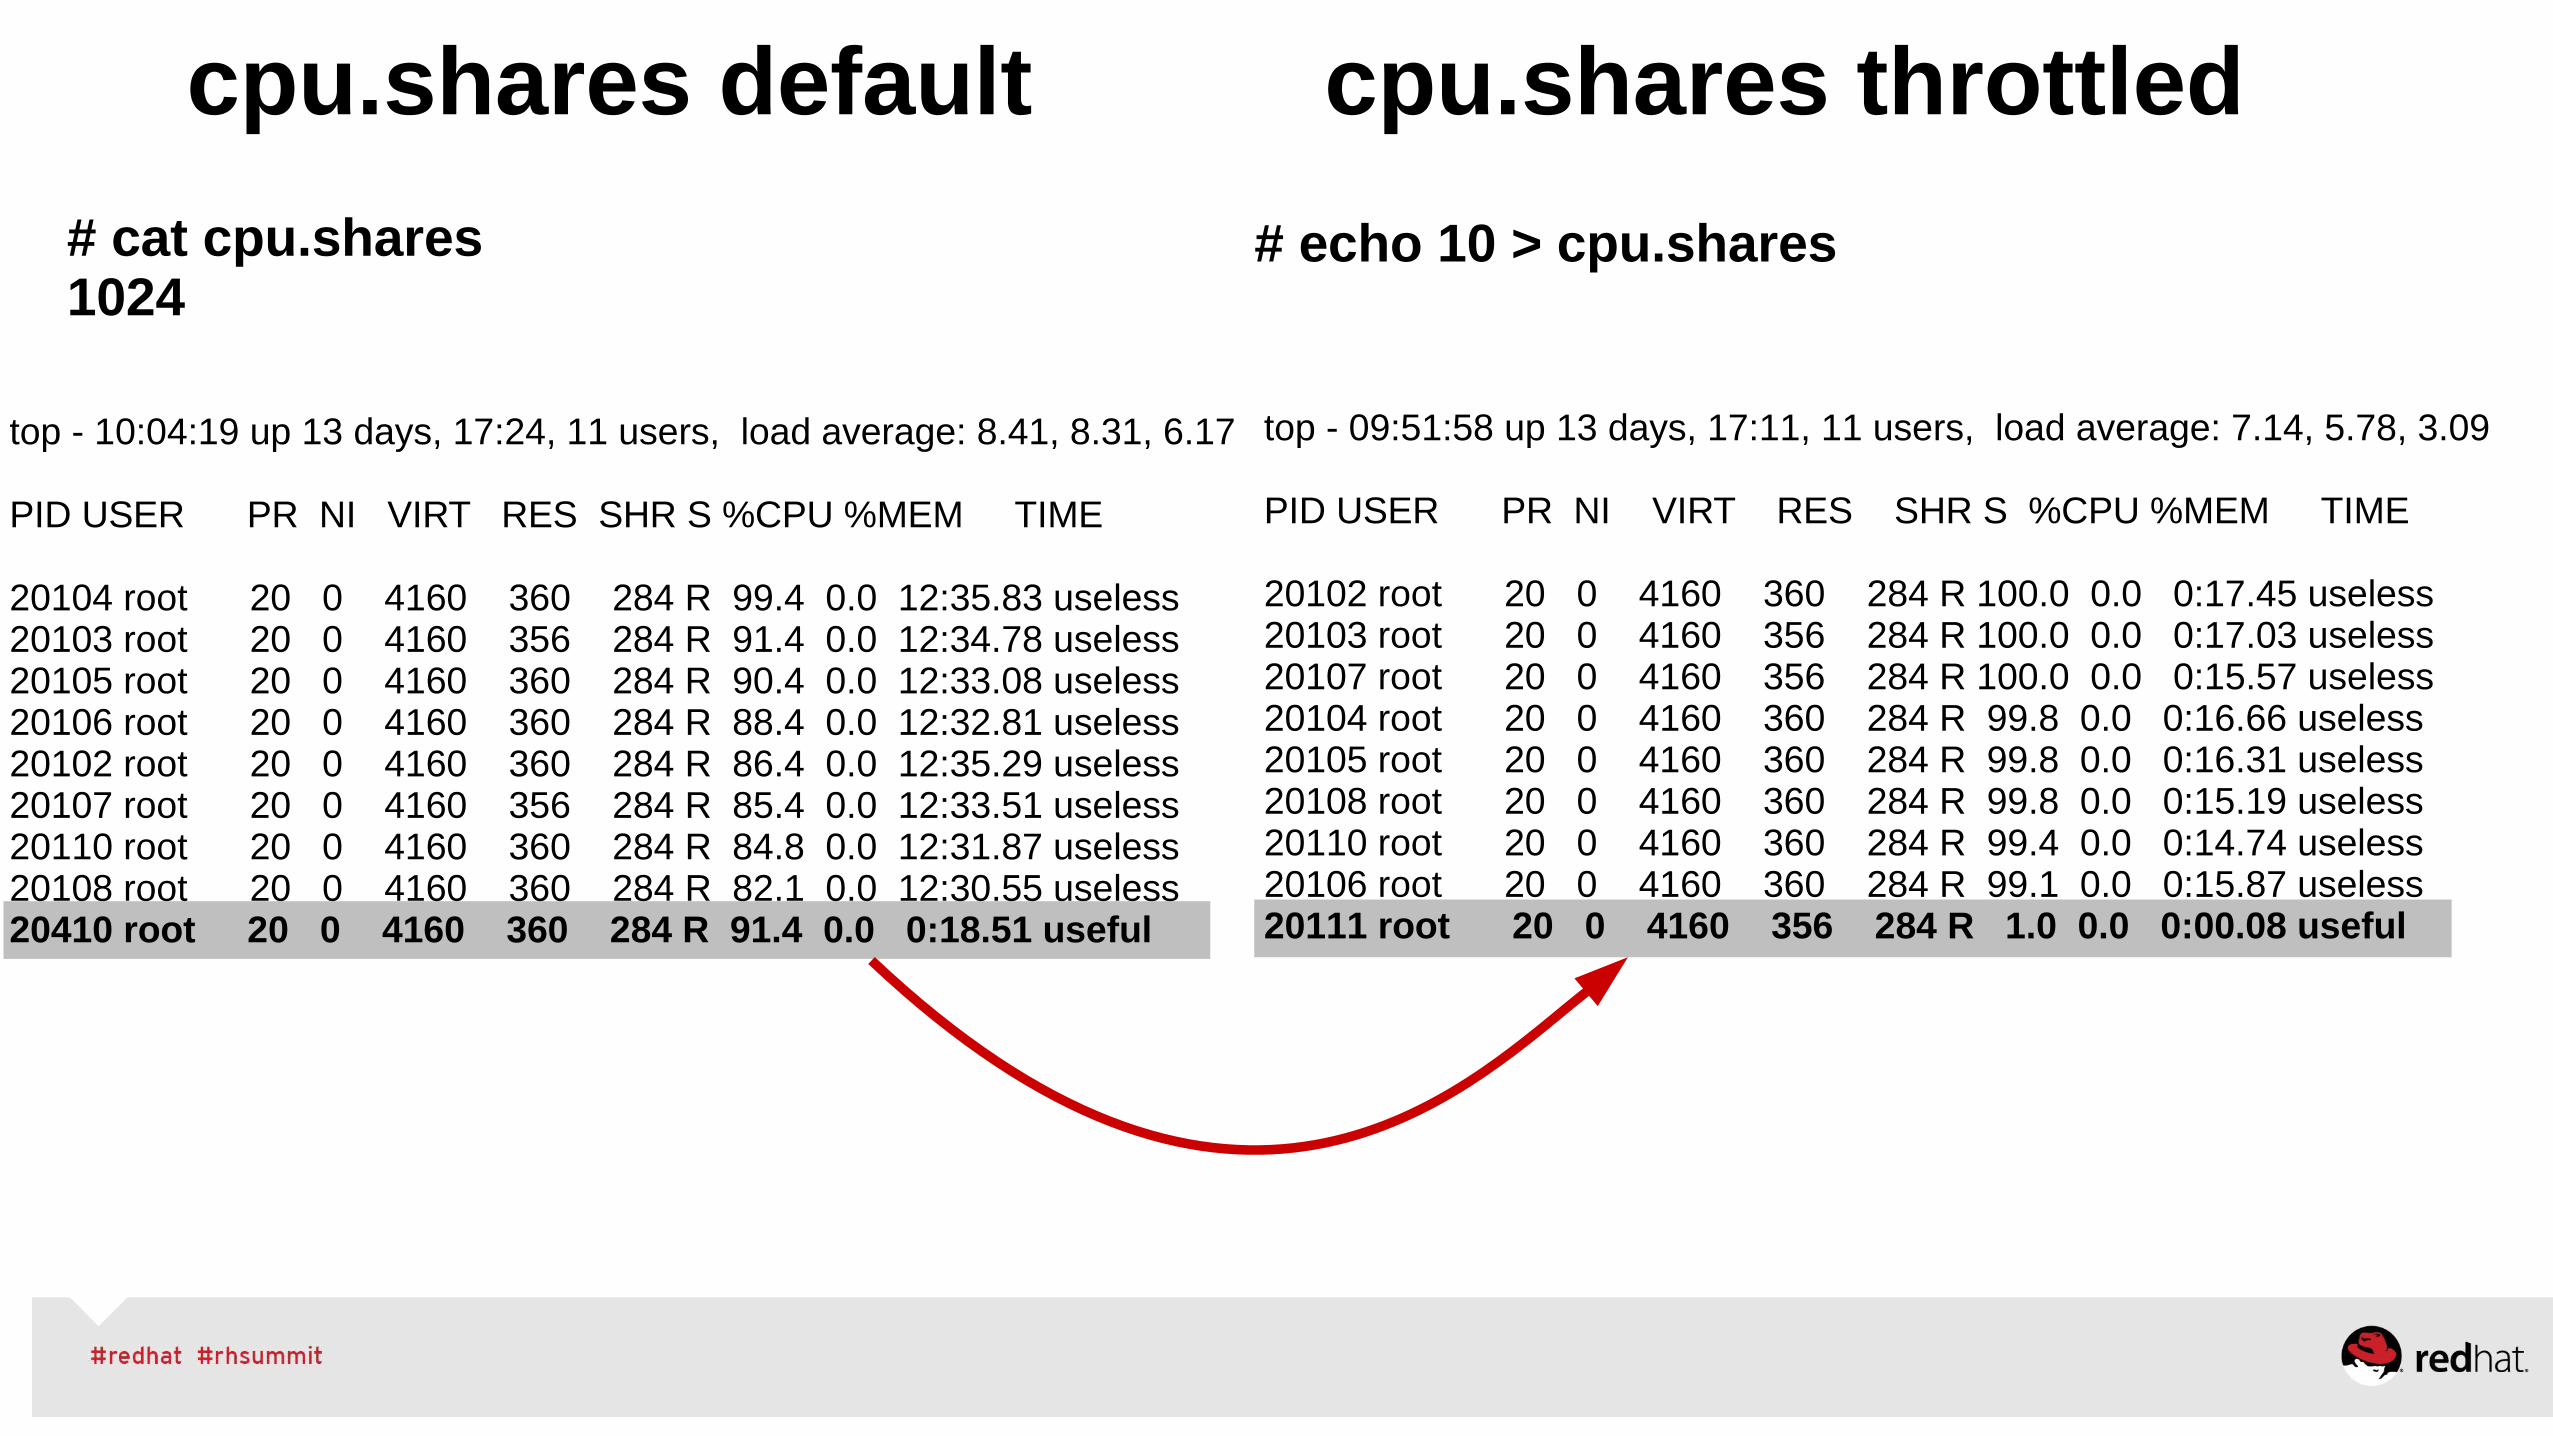
top - 09:51:58 up 13 days, 17:11, 11 users, load average: 7.14, 5.78, 3.09
PID USER PR NI VIRT RES SHR S %CPU %MEM TIME 20102 root 20 0 4160 360 284 R 100.0 0.0 0:17.45 useless 20103 root 20 0 4160 356 284 R 100.0 0.0 0:17.03 useless 20107 root 20 0 4160 356 284 R 100.0 0.0 0:15.57 useless 20104 root 20 0 4160 360 284 R 99.8 0.0 0:16.66 useless 20105 root 20 0 4160 360 284 R 99.8 0.0 0:16.31 useless 20108 root 20 0 4160 360 284 R 99.8 0.0 0:15.19 useless 20110 root 20 0 4160 360 284 R 99.4 0.0 0:14.74 useless 20106 root 20 0 4160 360 284 R 99.1 0.0 0:15.87 useless 20111 root 20 0 4160 356 284 R 1.0 0.0 0:00.08 useful
# echo 10 > cpu.shares
cpu.shares default cpu.shares throttled
top - 10:04:19 up 13 days, 17:24, 11 users, load average: 8.41, 8.31, 6.17
PID USER PR NI VIRT RES SHR S %CPU %MEM TIME 20104 root 20 0 4160 360 284 R 99.4 0.0 12:35.83 useless 20103 root 20 0 4160 356 284 R 91.4 0.0 12:34.78 useless 20105 root 20 0 4160 360 284 R 90.4 0.0 12:33.08 useless 20106 root 20 0 4160 360 284 R 88.4 0.0 12:32.81 useless 20102 root 20 0 4160 360 284 R 86.4 0.0 12:35.29 useless20107 root 20 0 4160 356 284 R 85.4 0.0 12:33.51 useless 20110 root 20 0 4160 360 284 R 84.8 0.0 12:31.87 useless 20108 root 20 0 4160 360 284 R 82.1 0.0 12:30.55 useless20410 root 20 0 4160 360 284 R 91.4 0.0 0:18.51 useful
# cat cpu.shares 1024
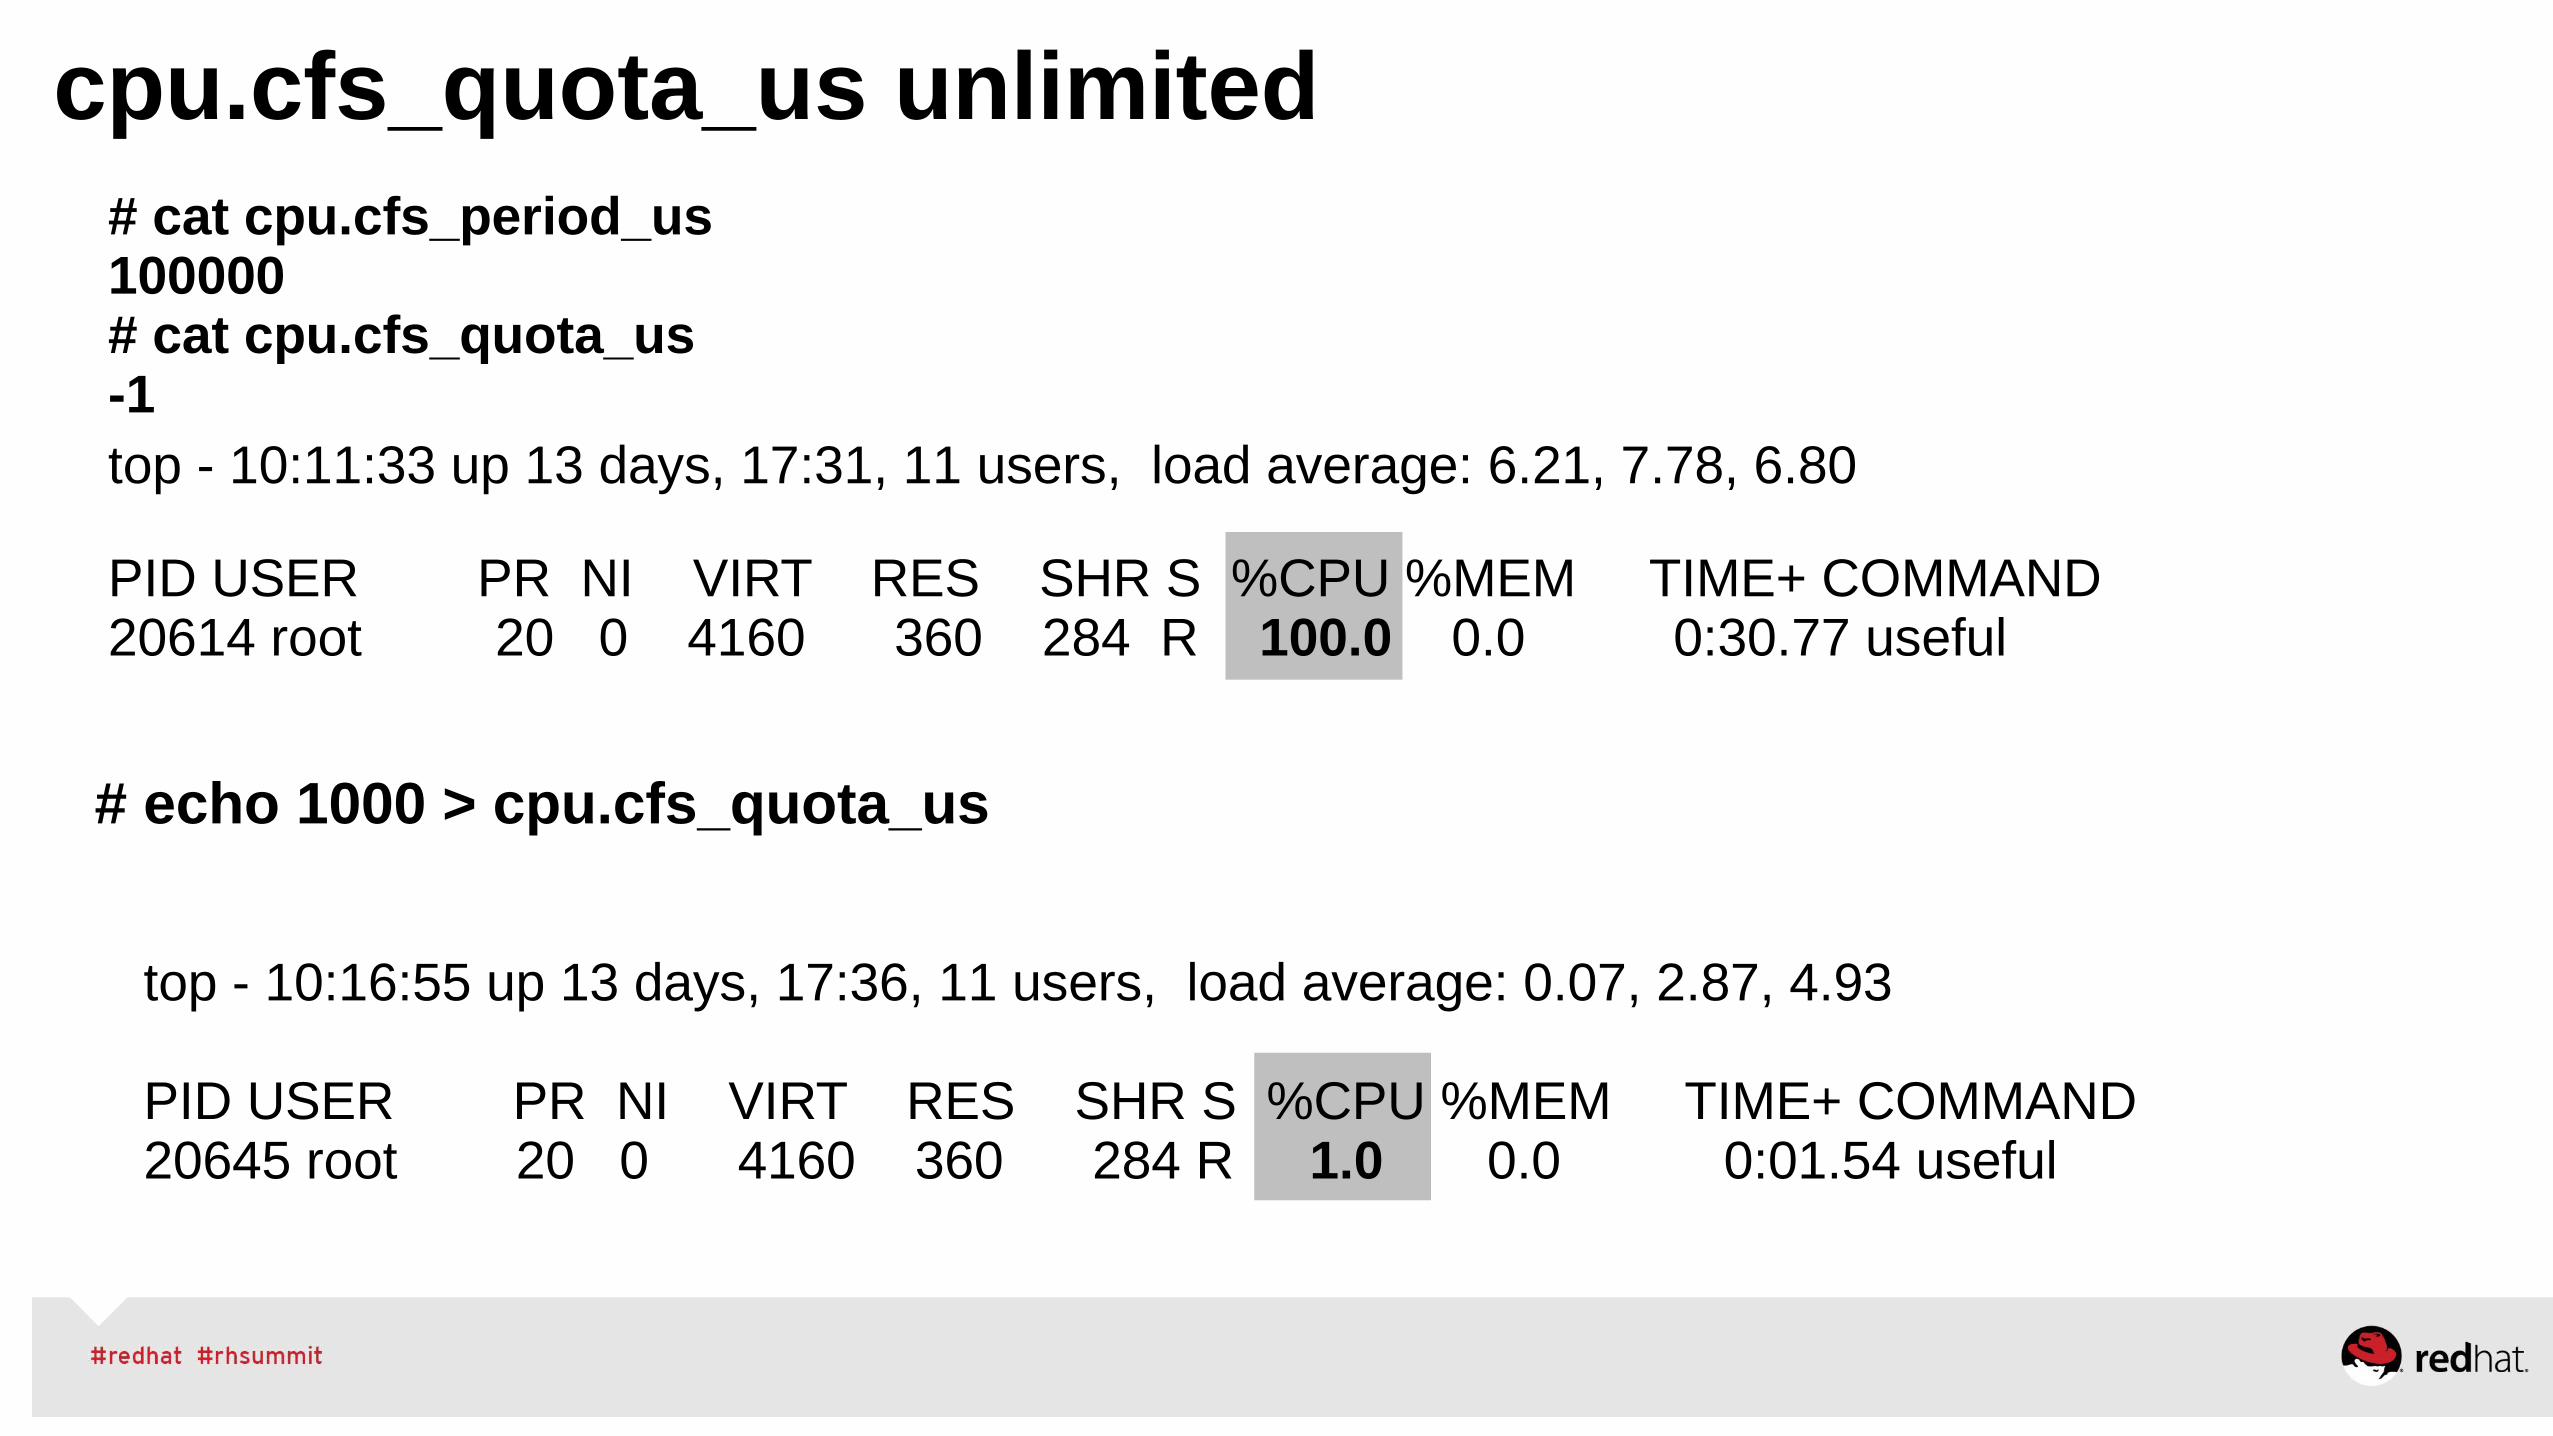
# cat cpu.cfs_period_us100000# cat cpu.cfs_quota_us -1
cpu.cfs_quota_us unlimited
top - 10:11:33 up 13 days, 17:31, 11 users, load average: 6.21, 7.78, 6.80
PID USER PR NI VIRT RES SHR S %CPU %MEM TIME+ COMMAND 20614 root 20 0 4160 360 284 R 100.0 0.0 0:30.77 useful
top - 10:16:55 up 13 days, 17:36, 11 users, load average: 0.07, 2.87, 4.93
PID USER PR NI VIRT RES SHR S %CPU %MEM TIME+ COMMAND 20645 root 20 0 4160 360 284 R 1.0 0.0 0:01.54 useful
# echo 1000 > cpu.cfs_quota_us
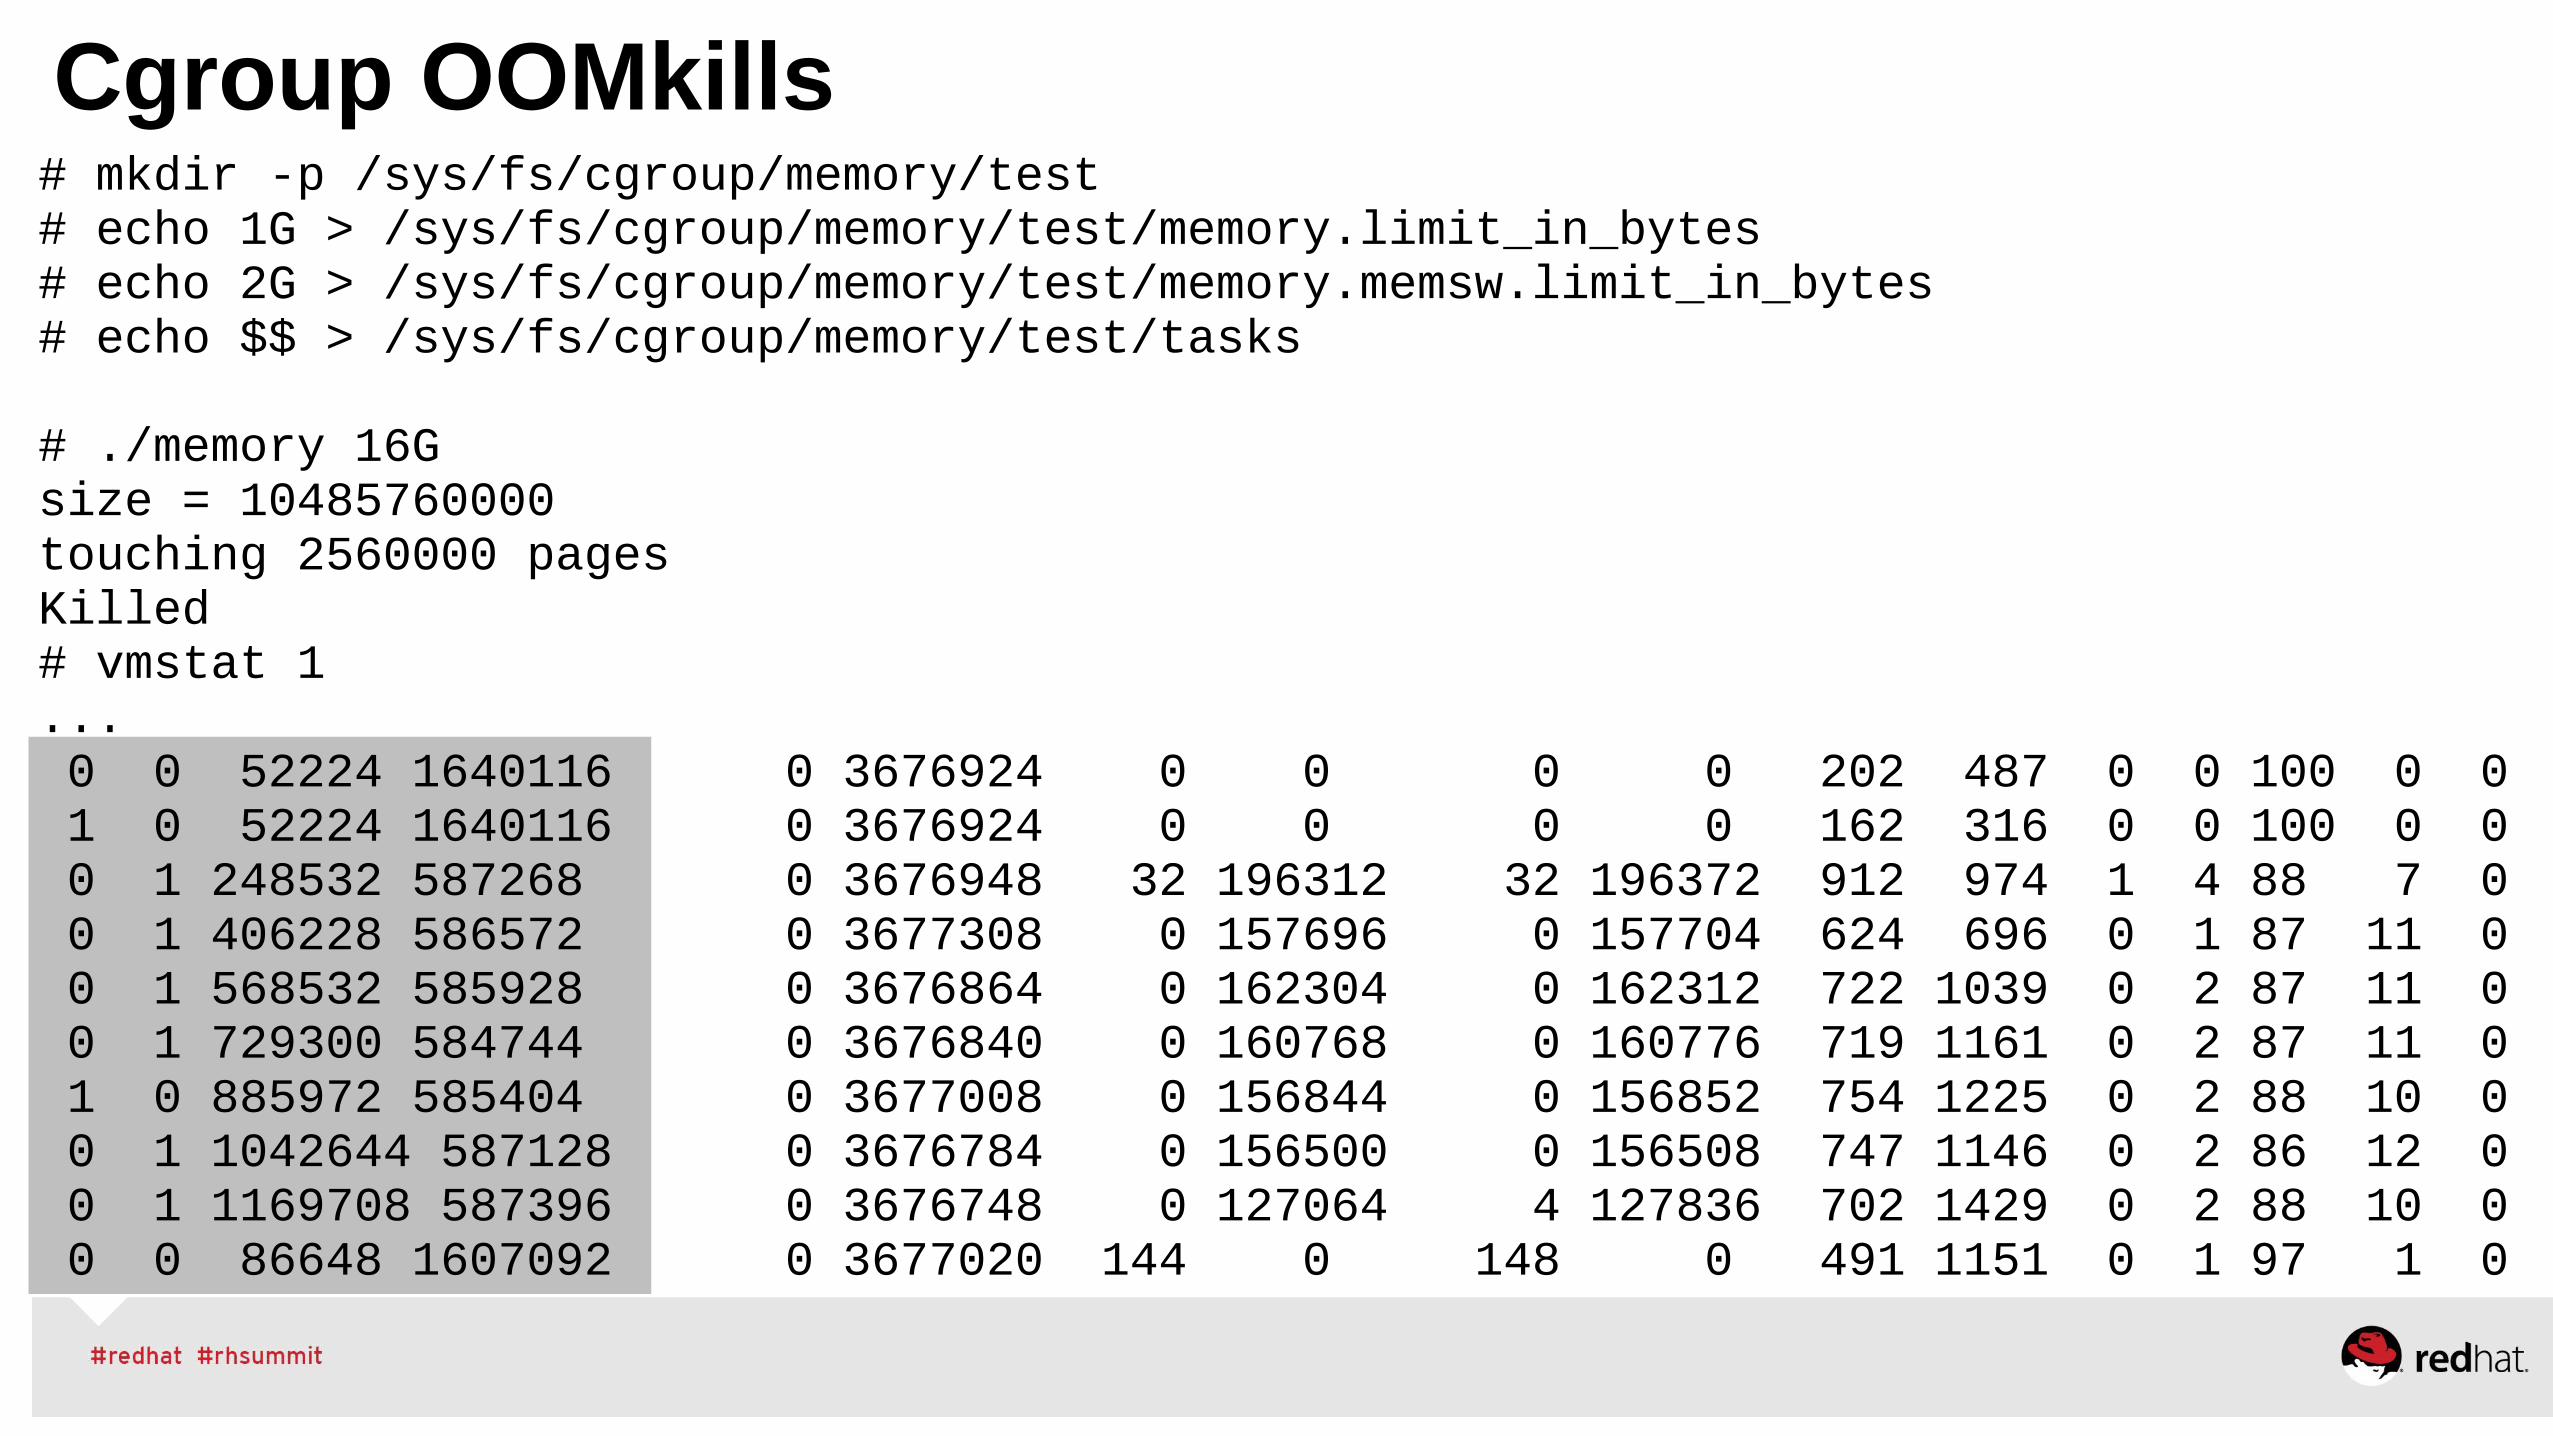
Cgroup OOMkills# mkdir -p /sys/fs/cgroup/memory/test # echo 1G > /sys/fs/cgroup/memory/test/memory.limit_in_bytes # echo 2G > /sys/fs/cgroup/memory/test/memory.memsw.limit_in_bytes # echo $$ > /sys/fs/cgroup/memory/test/tasks
# ./memory 16Gsize = 10485760000touching 2560000 pagesKilled# vmstat 1... 0 0 52224 1640116 0 3676924 0 0 0 0 202 487 0 0 100 0 0 1 0 52224 1640116 0 3676924 0 0 0 0 162 316 0 0 100 0 0 0 1 248532 587268 0 3676948 32 196312 32 196372 912 974 1 4 88 7 0 0 1 406228 586572 0 3677308 0 157696 0 157704 624 696 0 1 87 11 0 0 1 568532 585928 0 3676864 0 162304 0 162312 722 1039 0 2 87 11 0 0 1 729300 584744 0 3676840 0 160768 0 160776 719 1161 0 2 87 11 0 1 0 885972 585404 0 3677008 0 156844 0 156852 754 1225 0 2 88 10 0 0 1 1042644 587128 0 3676784 0 156500 0 156508 747 1146 0 2 86 12 0 0 1 1169708 587396 0 3676748 0 127064 4 127836 702 1429 0 2 88 10 0 0 0 86648 1607092 0 3677020 144 0 148 0 491 1151 0 1 97 1 0
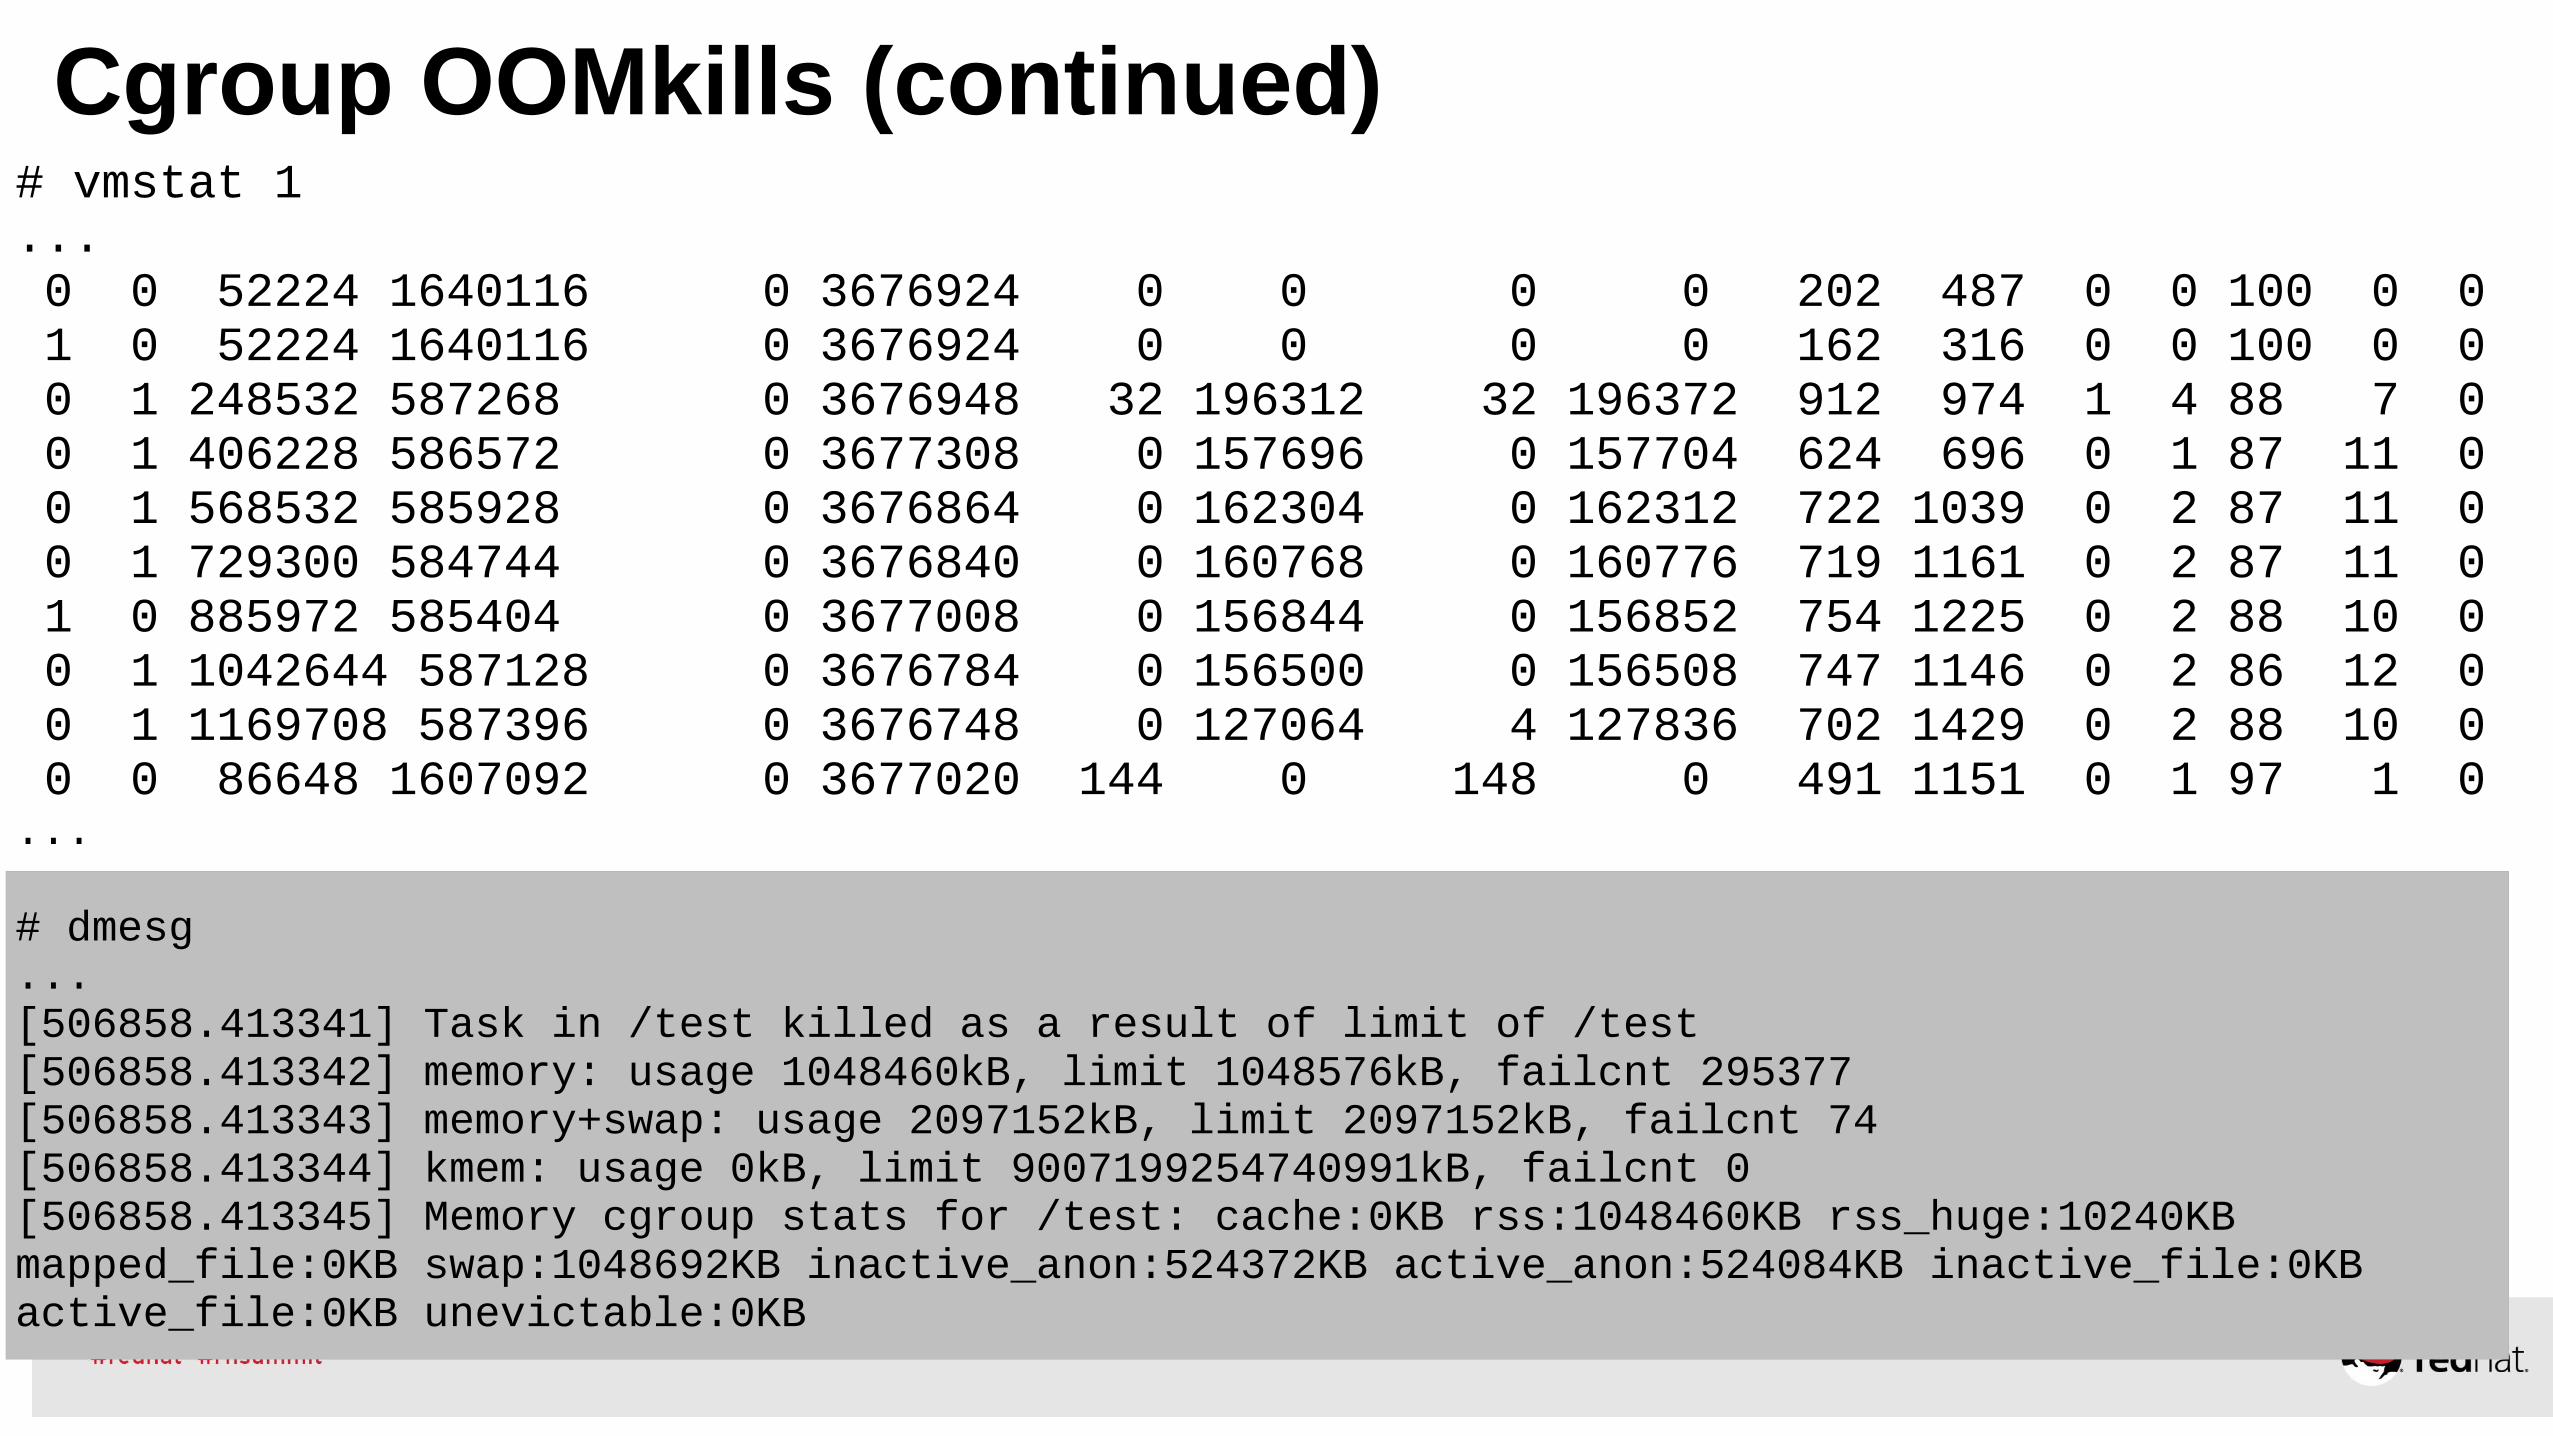
Cgroup OOMkills (continued)# vmstat 1... 0 0 52224 1640116 0 3676924 0 0 0 0 202 487 0 0 100 0 0 1 0 52224 1640116 0 3676924 0 0 0 0 162 316 0 0 100 0 0 0 1 248532 587268 0 3676948 32 196312 32 196372 912 974 1 4 88 7 0 0 1 406228 586572 0 3677308 0 157696 0 157704 624 696 0 1 87 11 0 0 1 568532 585928 0 3676864 0 162304 0 162312 722 1039 0 2 87 11 0 0 1 729300 584744 0 3676840 0 160768 0 160776 719 1161 0 2 87 11 0 1 0 885972 585404 0 3677008 0 156844 0 156852 754 1225 0 2 88 10 0 0 1 1042644 587128 0 3676784 0 156500 0 156508 747 1146 0 2 86 12 0 0 1 1169708 587396 0 3676748 0 127064 4 127836 702 1429 0 2 88 10 0 0 0 86648 1607092 0 3677020 144 0 148 0 491 1151 0 1 97 1 0...
# dmesg...[506858.413341] Task in /test killed as a result of limit of /test[506858.413342] memory: usage 1048460kB, limit 1048576kB, failcnt 295377[506858.413343] memory+swap: usage 2097152kB, limit 2097152kB, failcnt 74[506858.413344] kmem: usage 0kB, limit 9007199254740991kB, failcnt 0[506858.413345] Memory cgroup stats for /test: cache:0KB rss:1048460KB rss_huge:10240KB mapped_file:0KB swap:1048692KB inactive_anon:524372KB active_anon:524084KB inactive_file:0KB active_file:0KB unevictable:0KB
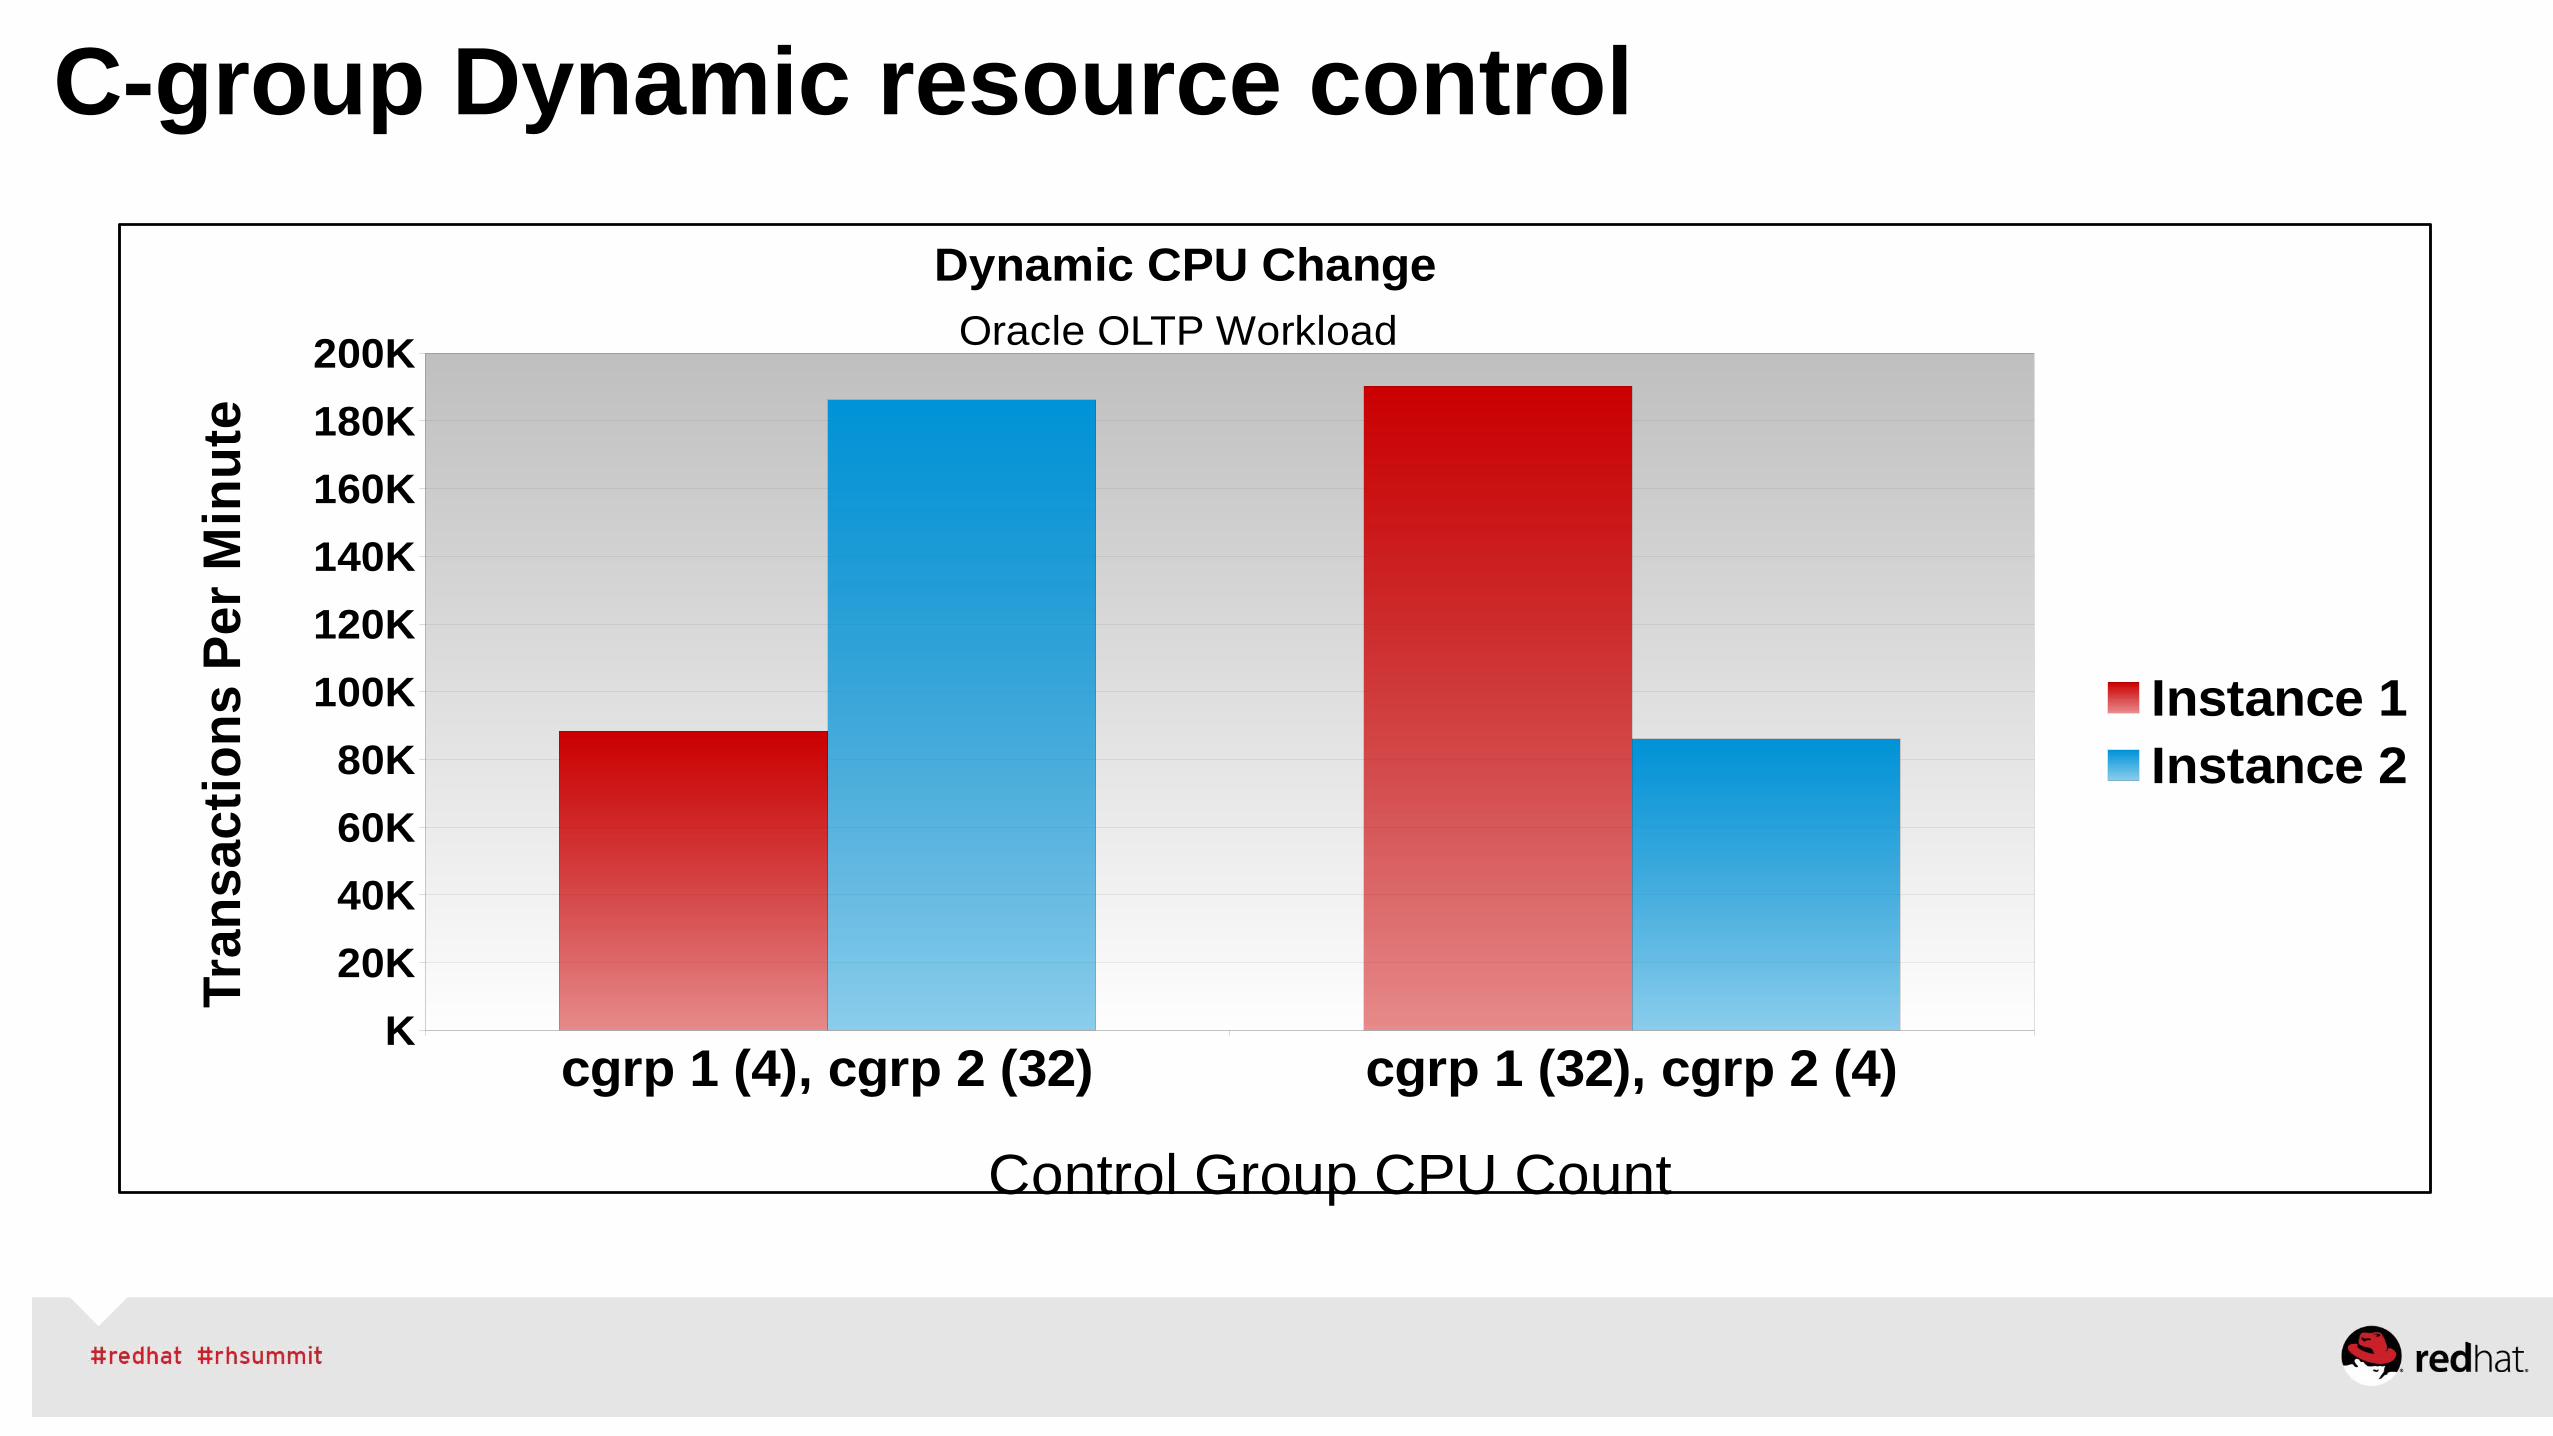
C-group Dynamic resource control
cgrp 1 (4), cgrp 2 (32) cgrp 1 (32), cgrp 2 (4)K
20K
40K
60K
80K
100K
120K
140K
160K
180K
200K
Dynamic CPU ChangeOracle OLTP Workload
Instance 1Instance 2
Control Group CPU Count
Tran
sact
ion
s P
er M
inu
te
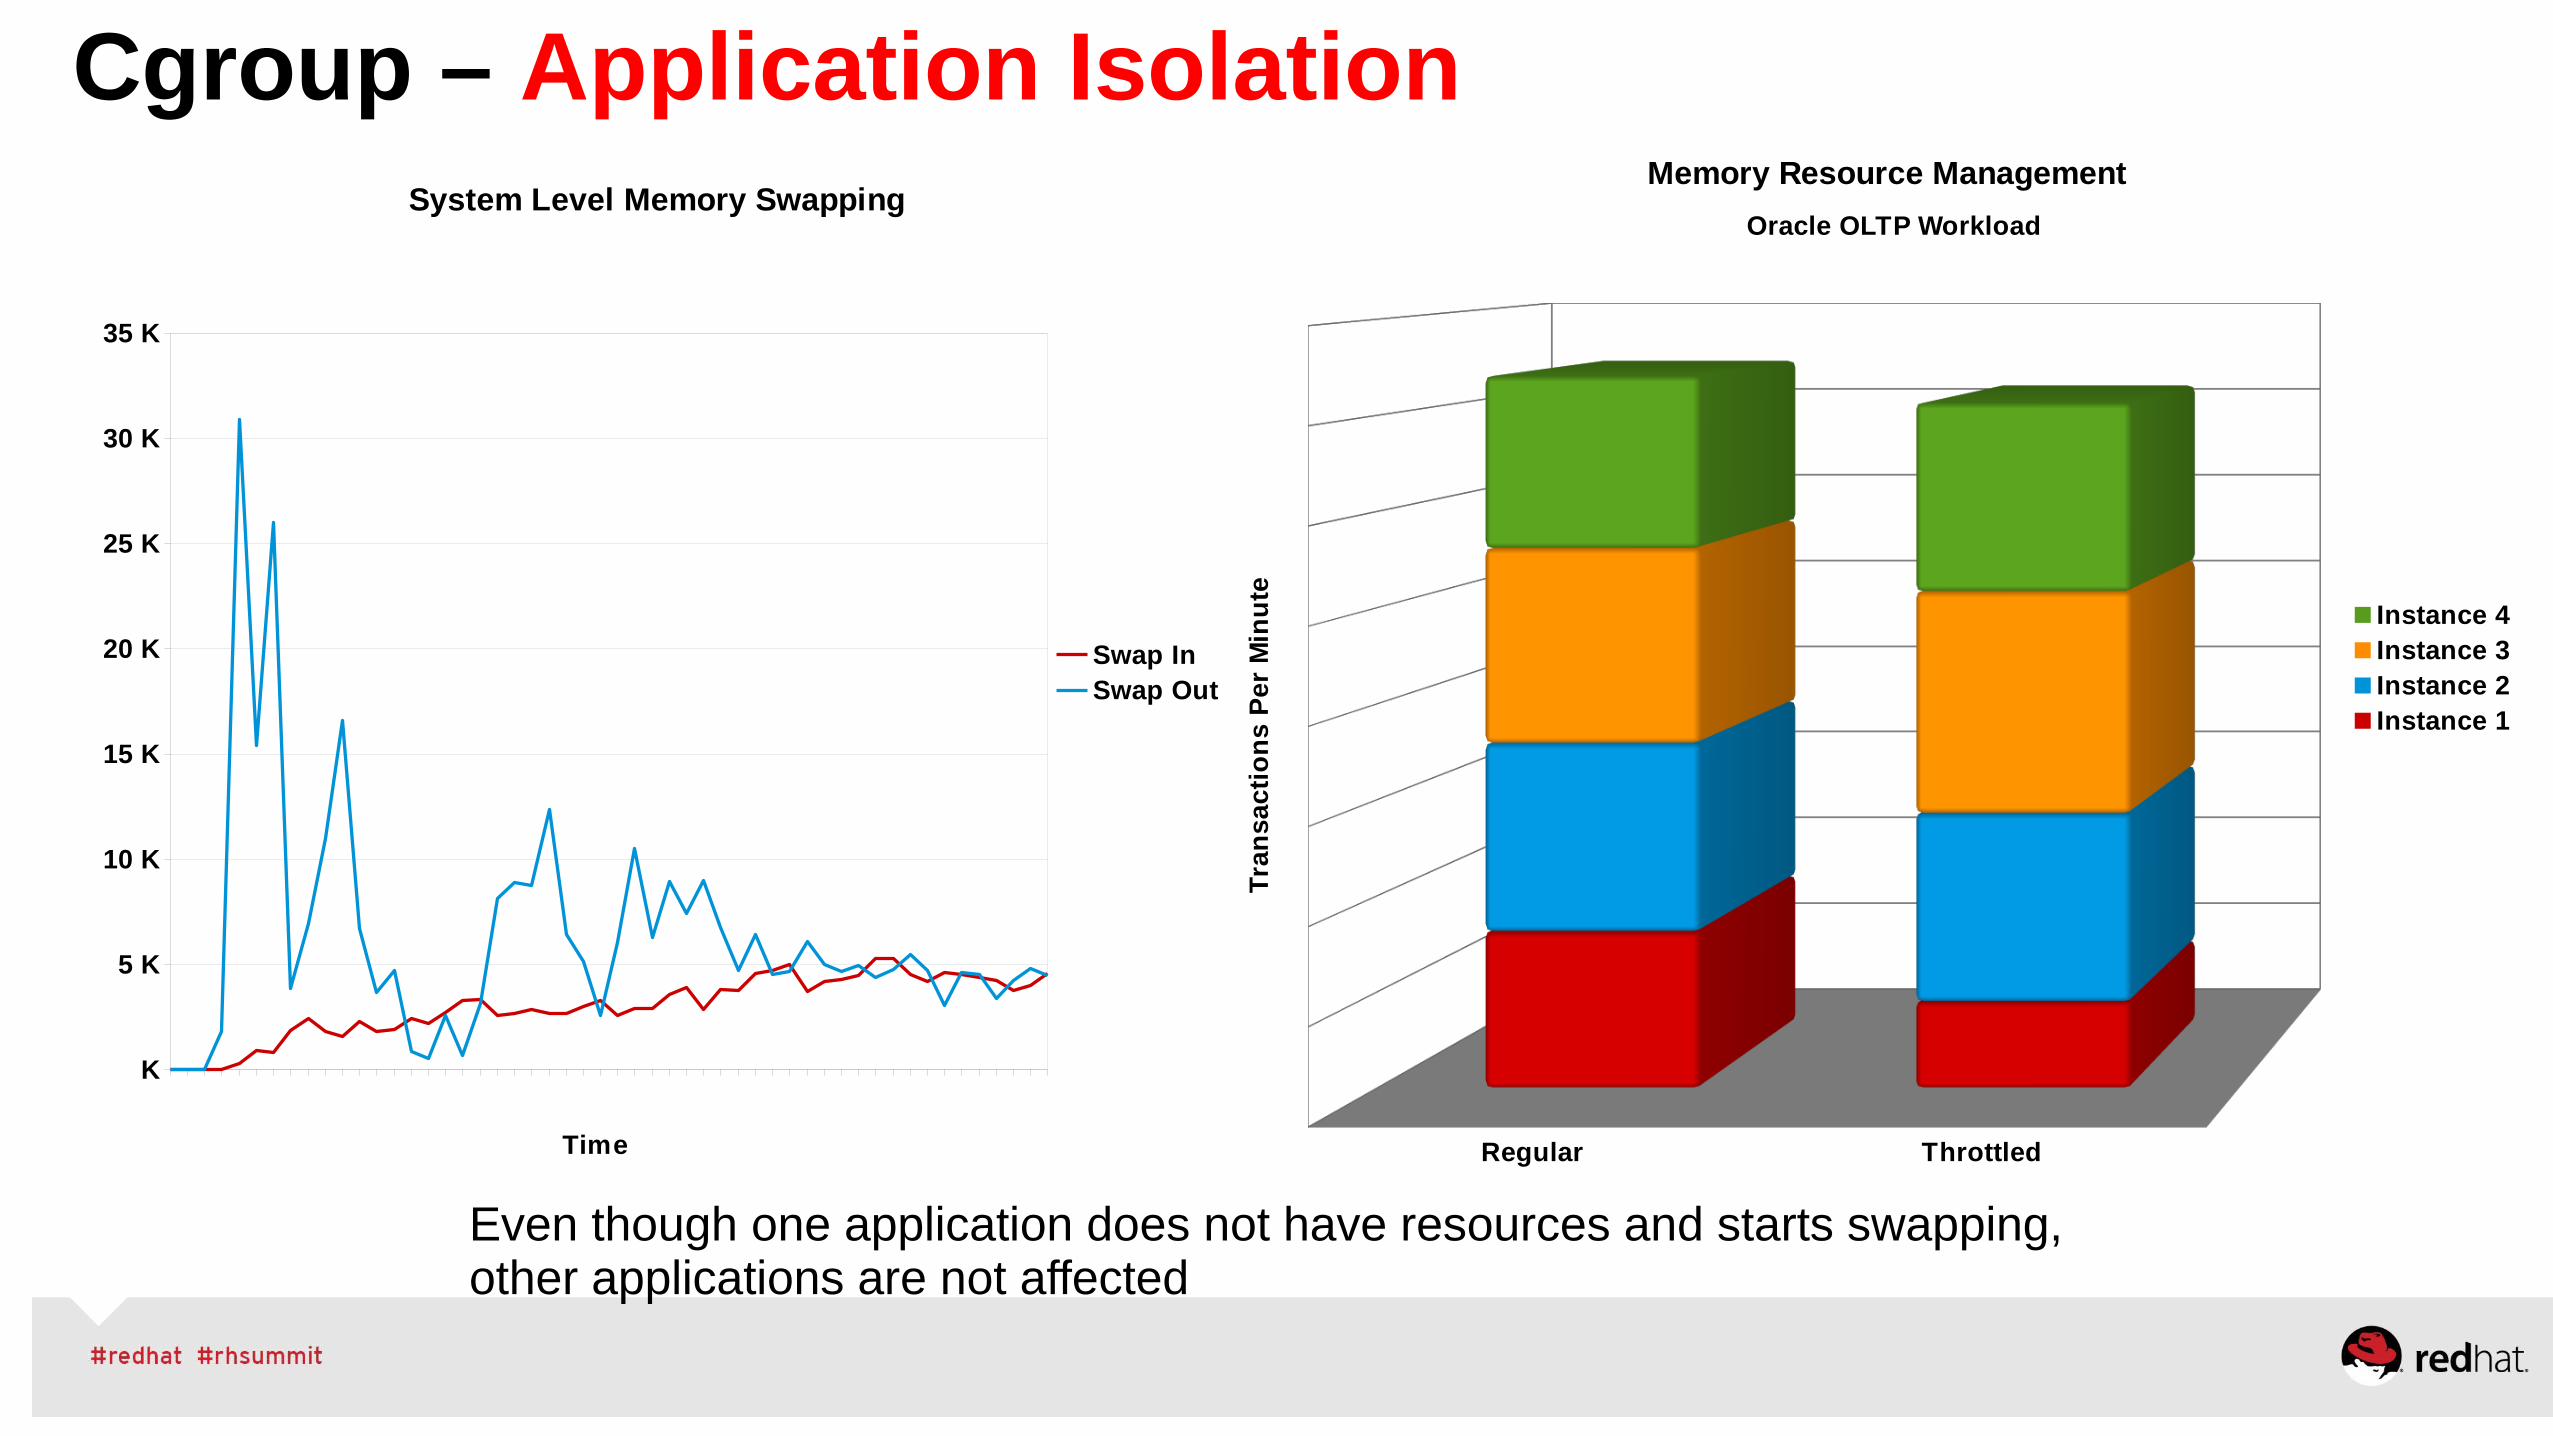
Cgroup – Application Isolation
K
5 K
10 K
15 K
20 K
25 K
30 K
35 K
System Level Memory Swapping
Swap InSwap Out
Time Regular Throttled
Memory Resource Management
Oracle OLTP Workload
Instance 4Instance 3Instance 2Instance 1
Tra
ns
ac
tio
ns
Pe
r M
inu
teEven though one application does not have resources and starts swapping, other applications are not affected

Summary - Red Hat Enterprise Linux NUMA
•RHEL6 – NUMAD - With Red Hat Enterprise Linux 6.5
•NUMAD can significantly improve performance and automate NUMA management on systems with server consolidation or replicated parallel workloads.
•RHEL7, Auto-NUMA-Balance works well for most applications out of the box!
•Use NUMAstat and NUMActl tools to measure and/or fine control your application on RHEL.
•App Developers – use perf to check for false sharing, advise padding
•Q+A at “Meet The Experts” - Free as in Soda/Beer/Wine
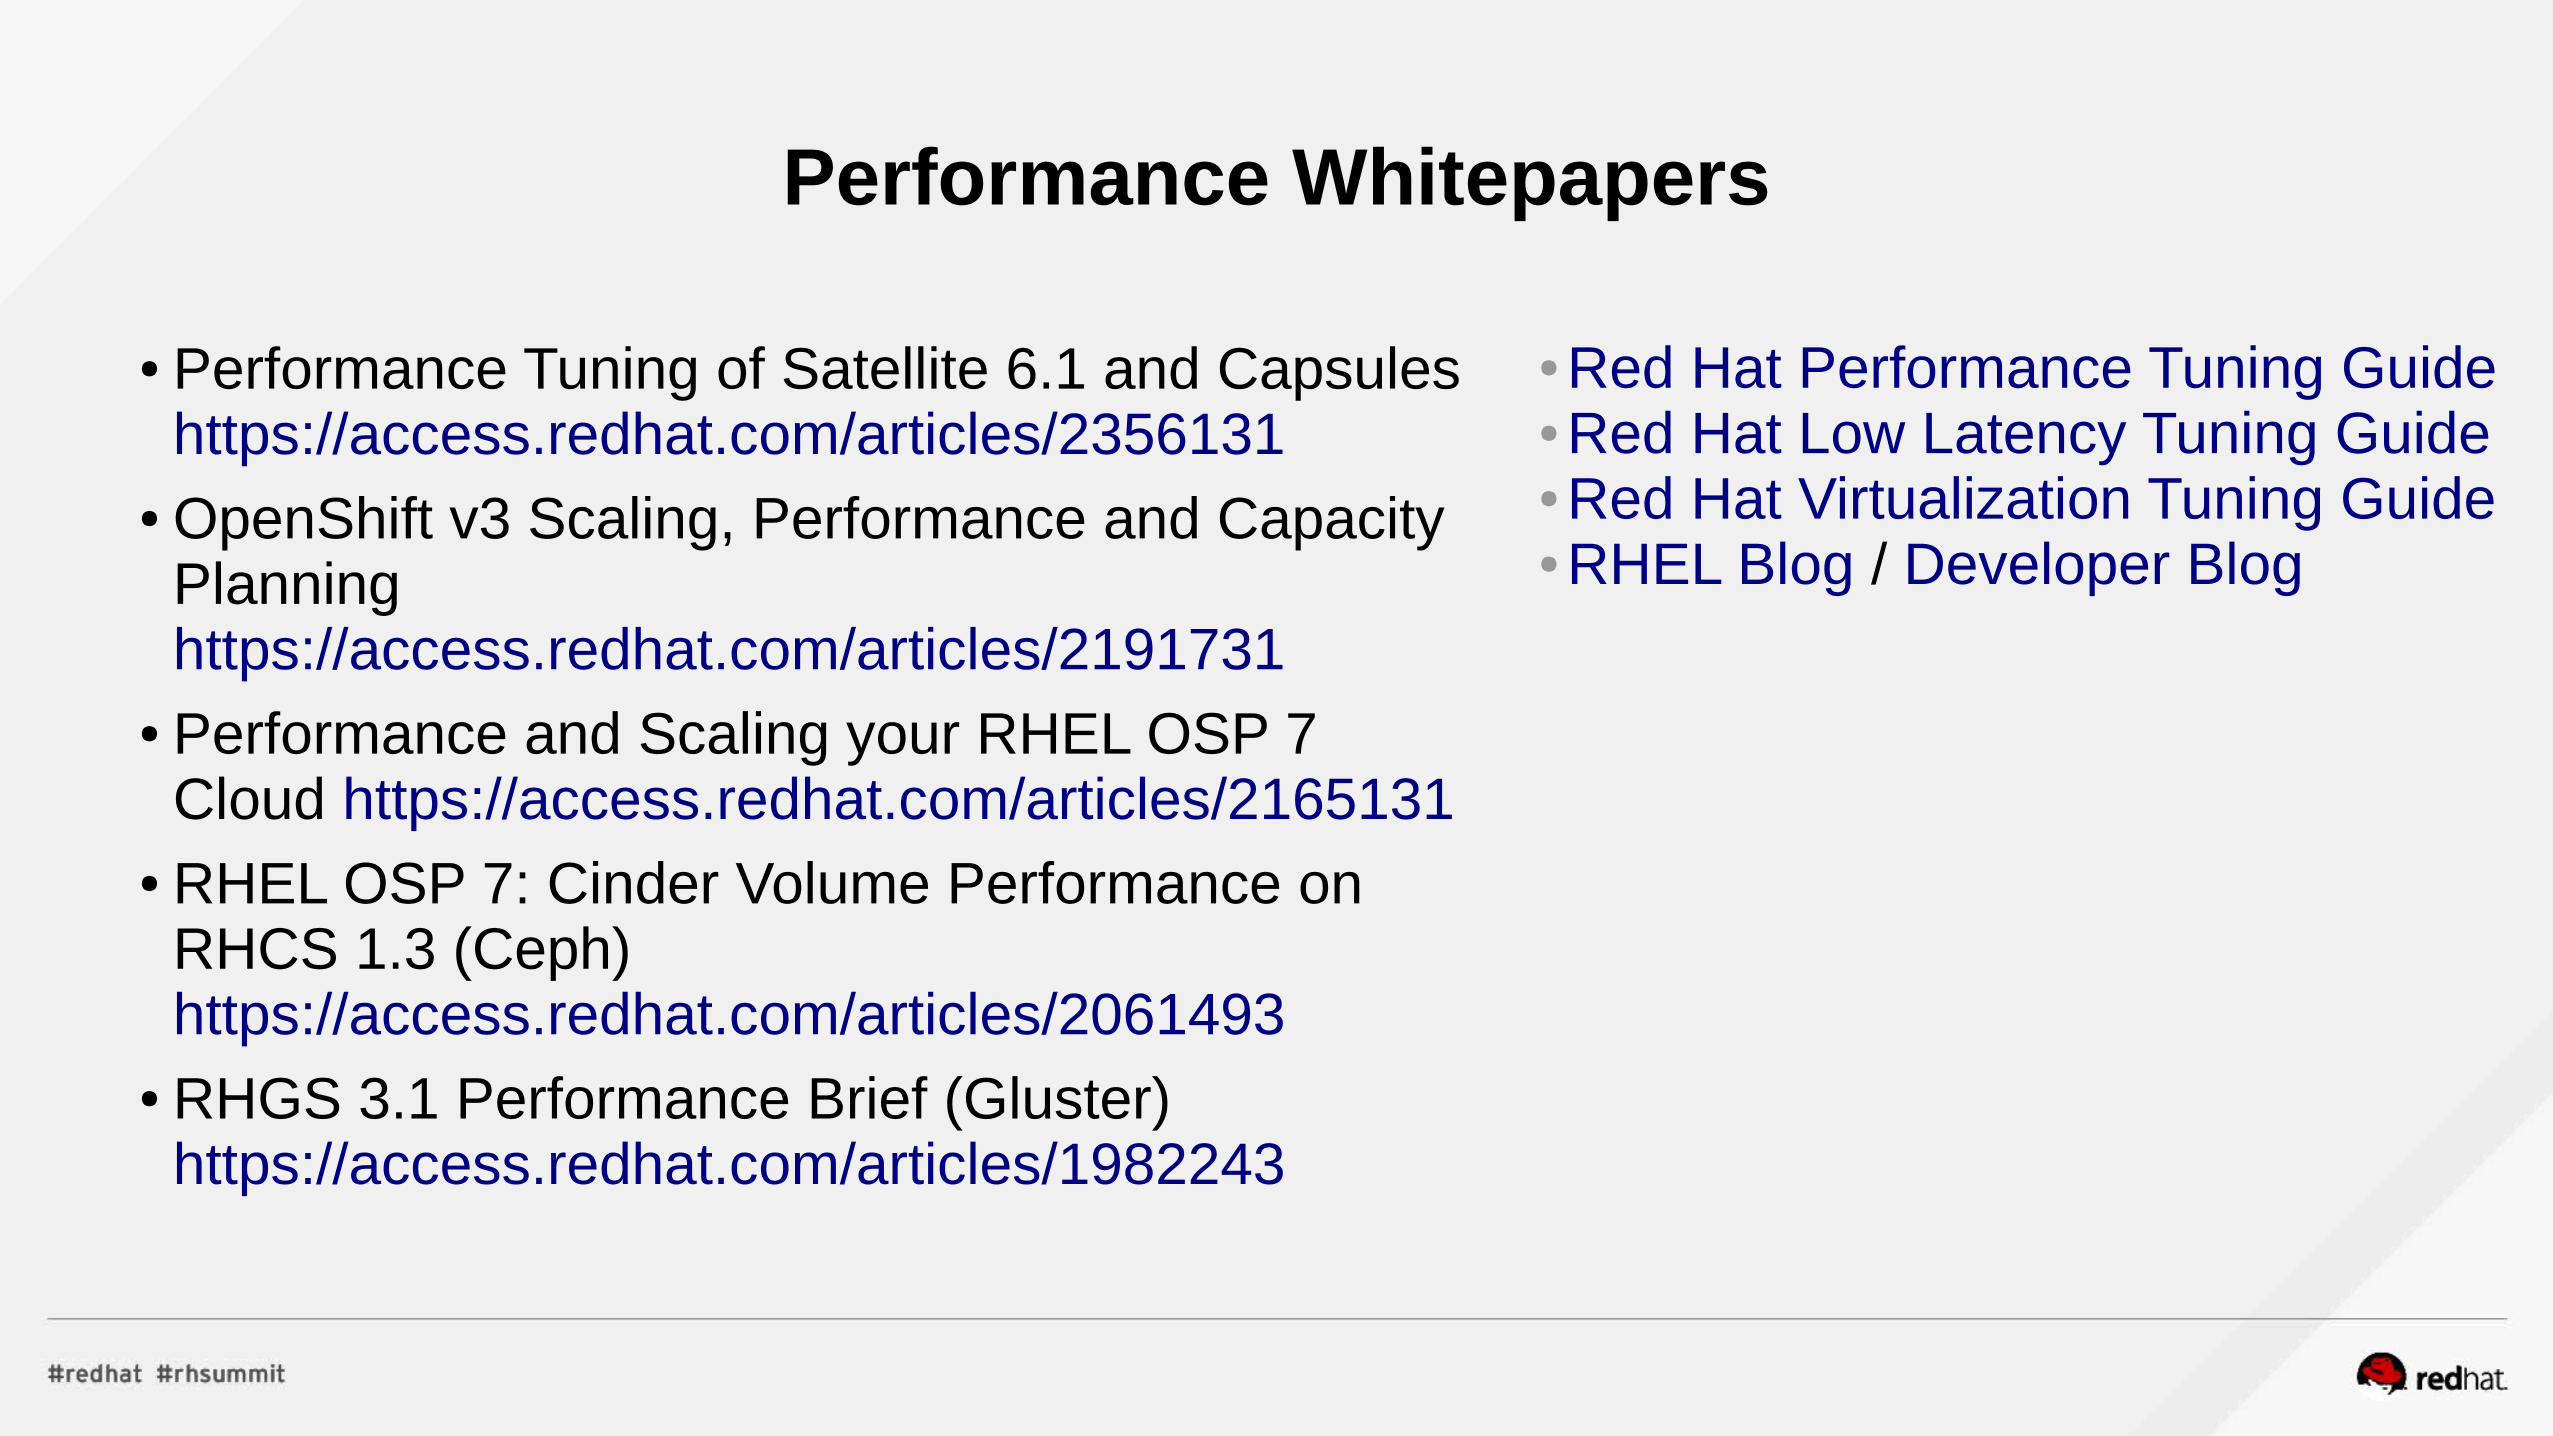
Performance Whitepapers
● Performance Tuning of Satellite 6.1 and Capsules https://access.redhat.com/articles/2356131
● OpenShift v3 Scaling, Performance and Capacity Planning https://access.redhat.com/articles/2191731
● Performance and Scaling your RHEL OSP 7 Cloud https://access.redhat.com/articles/2165131
● RHEL OSP 7: Cinder Volume Performance on RHCS 1.3 (Ceph) https://access.redhat.com/articles/2061493
● RHGS 3.1 Performance Brief (Gluster) https://access.redhat.com/articles/1982243
● Red Hat Performance Tuning Guide● Red Hat Low Latency Tuning Guide● Red Hat Virtualization Tuning Guide● RHEL Blog / Developer Blog
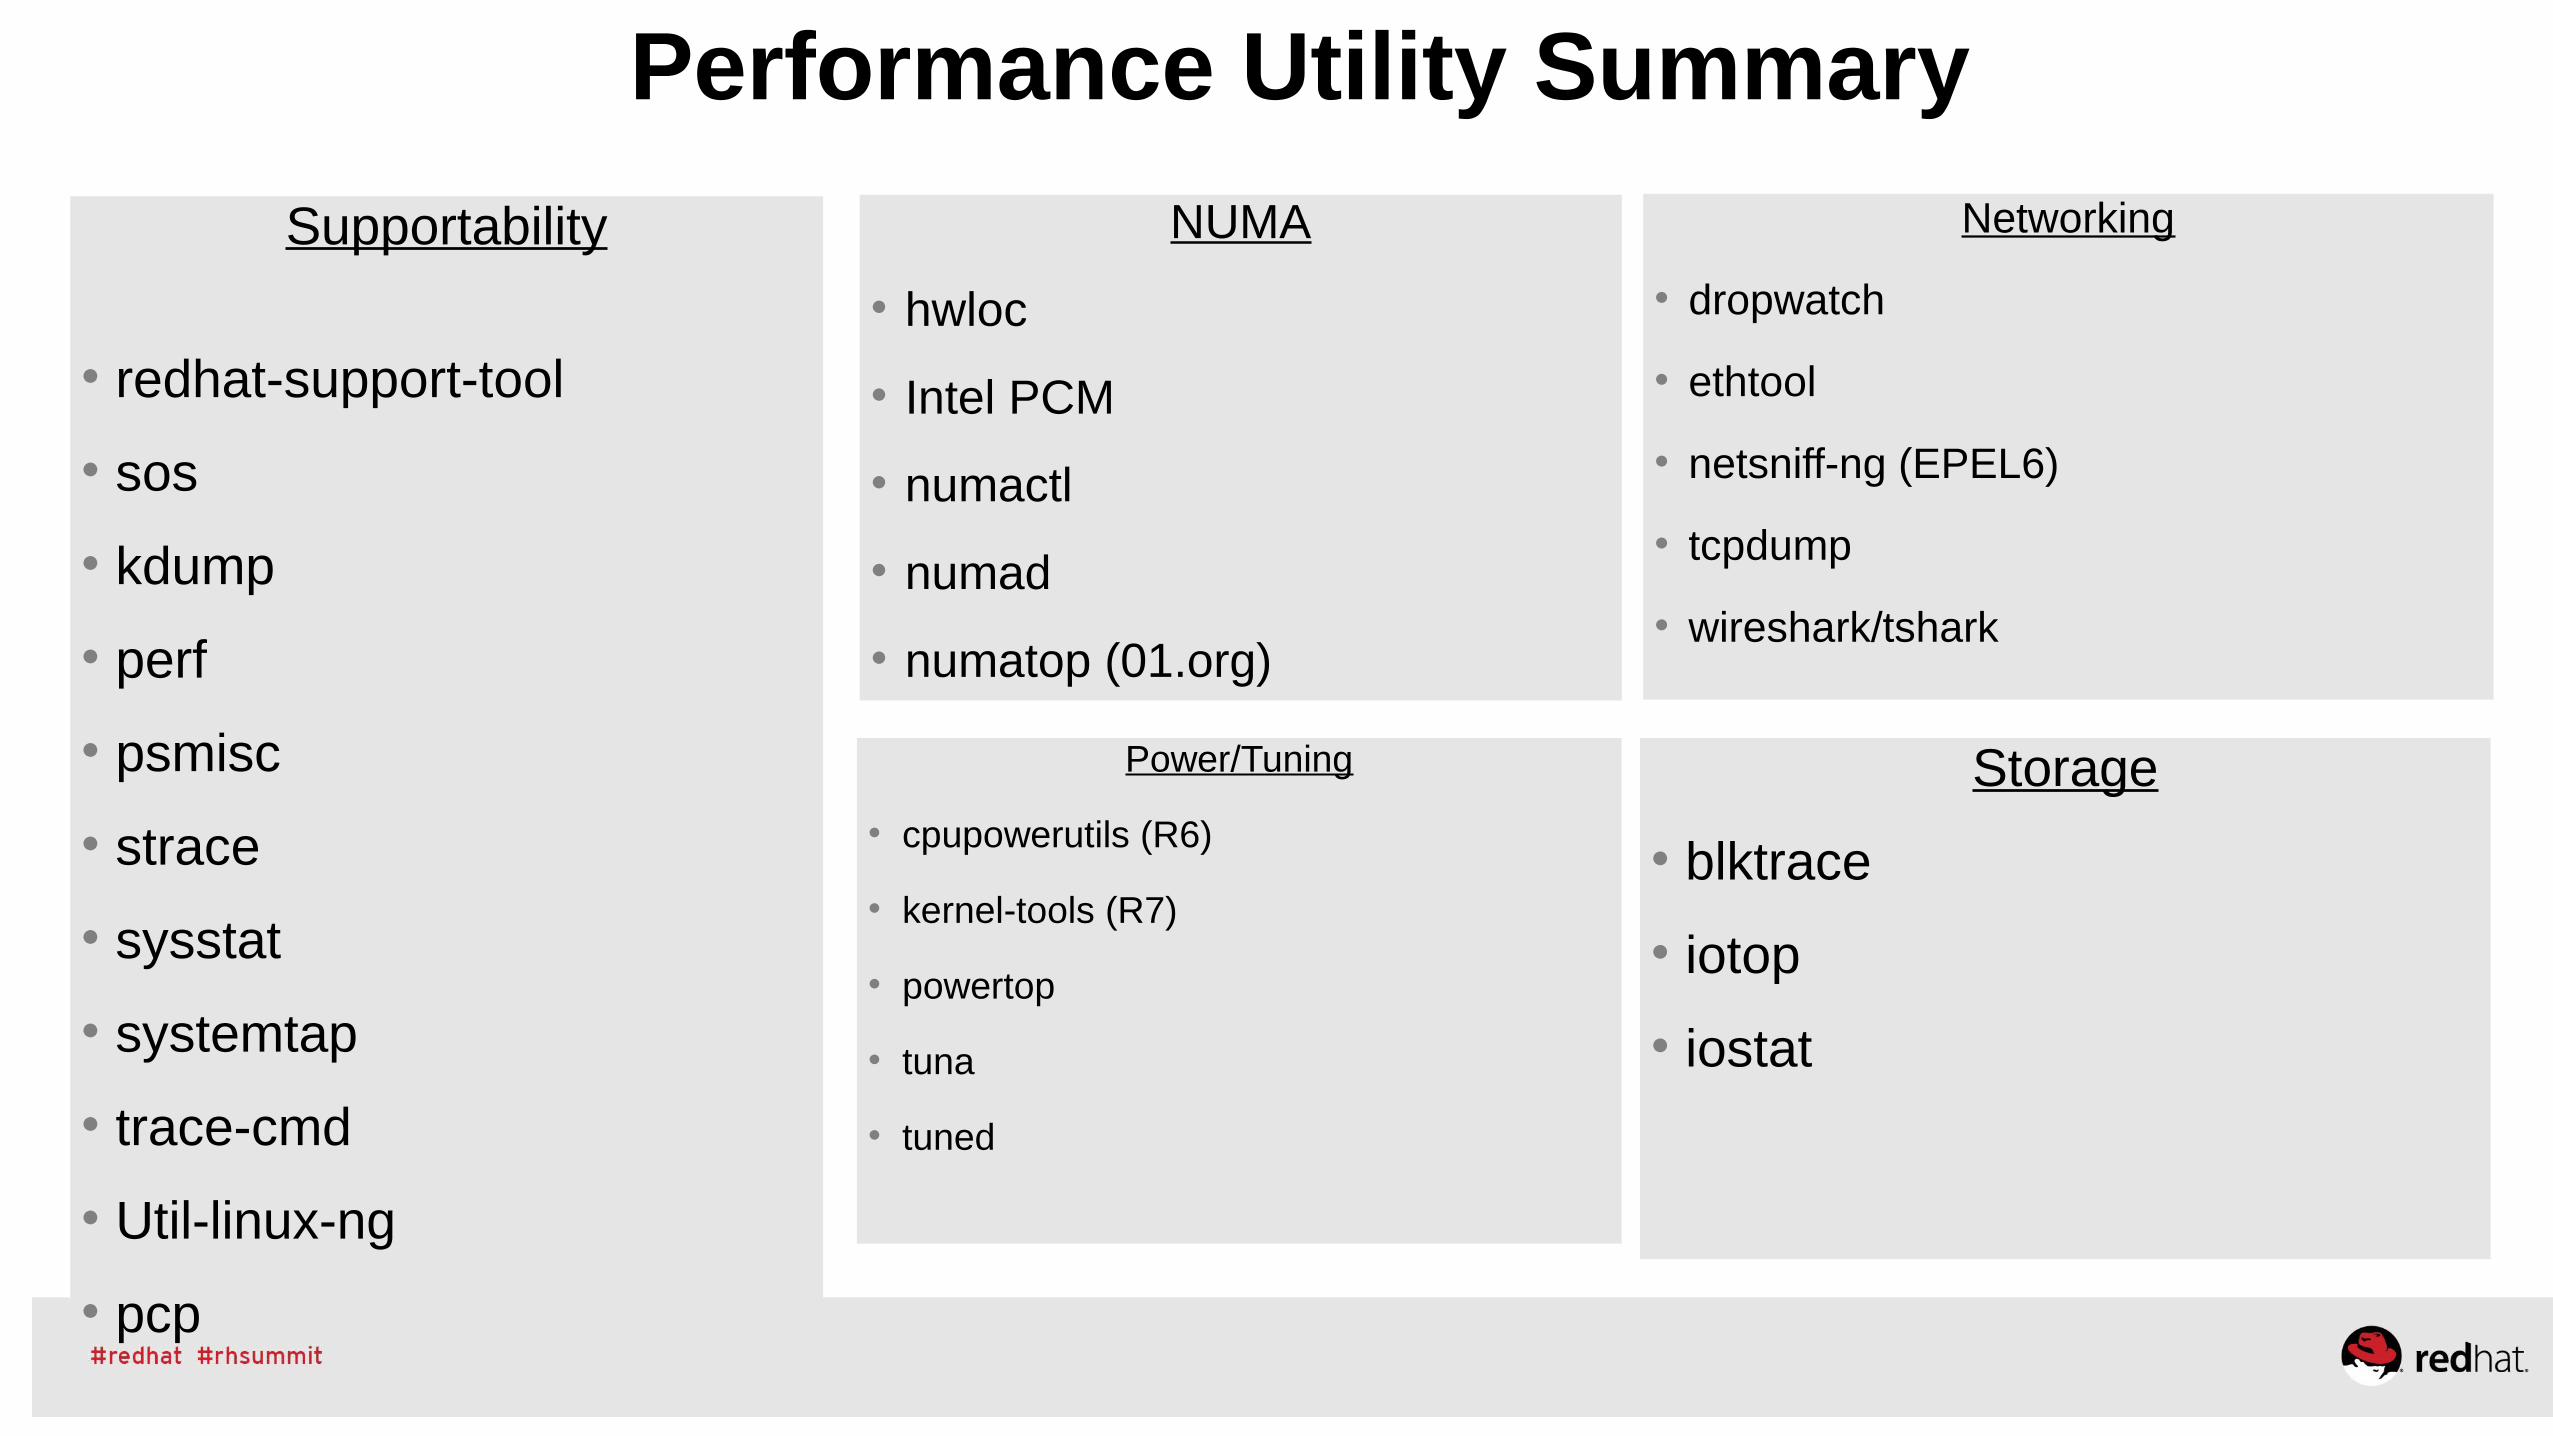
Performance Utility Summary
Supportability
• redhat-support-tool
• sos
• kdump
• perf
• psmisc
• strace
• sysstat
• systemtap
• trace-cmd
• Util-linux-ng
• pcp
NUMA
• hwloc
• Intel PCM
• numactl
• numad
• numatop (01.org)
Power/Tuning
• cpupowerutils (R6)
• kernel-tools (R7)
• powertop
• tuna
• tuned
Networking
• dropwatch
• ethtool
• netsniff-ng (EPEL6)
• tcpdump
• wireshark/tshark
Storage
• blktrace
• iotop
• iostat
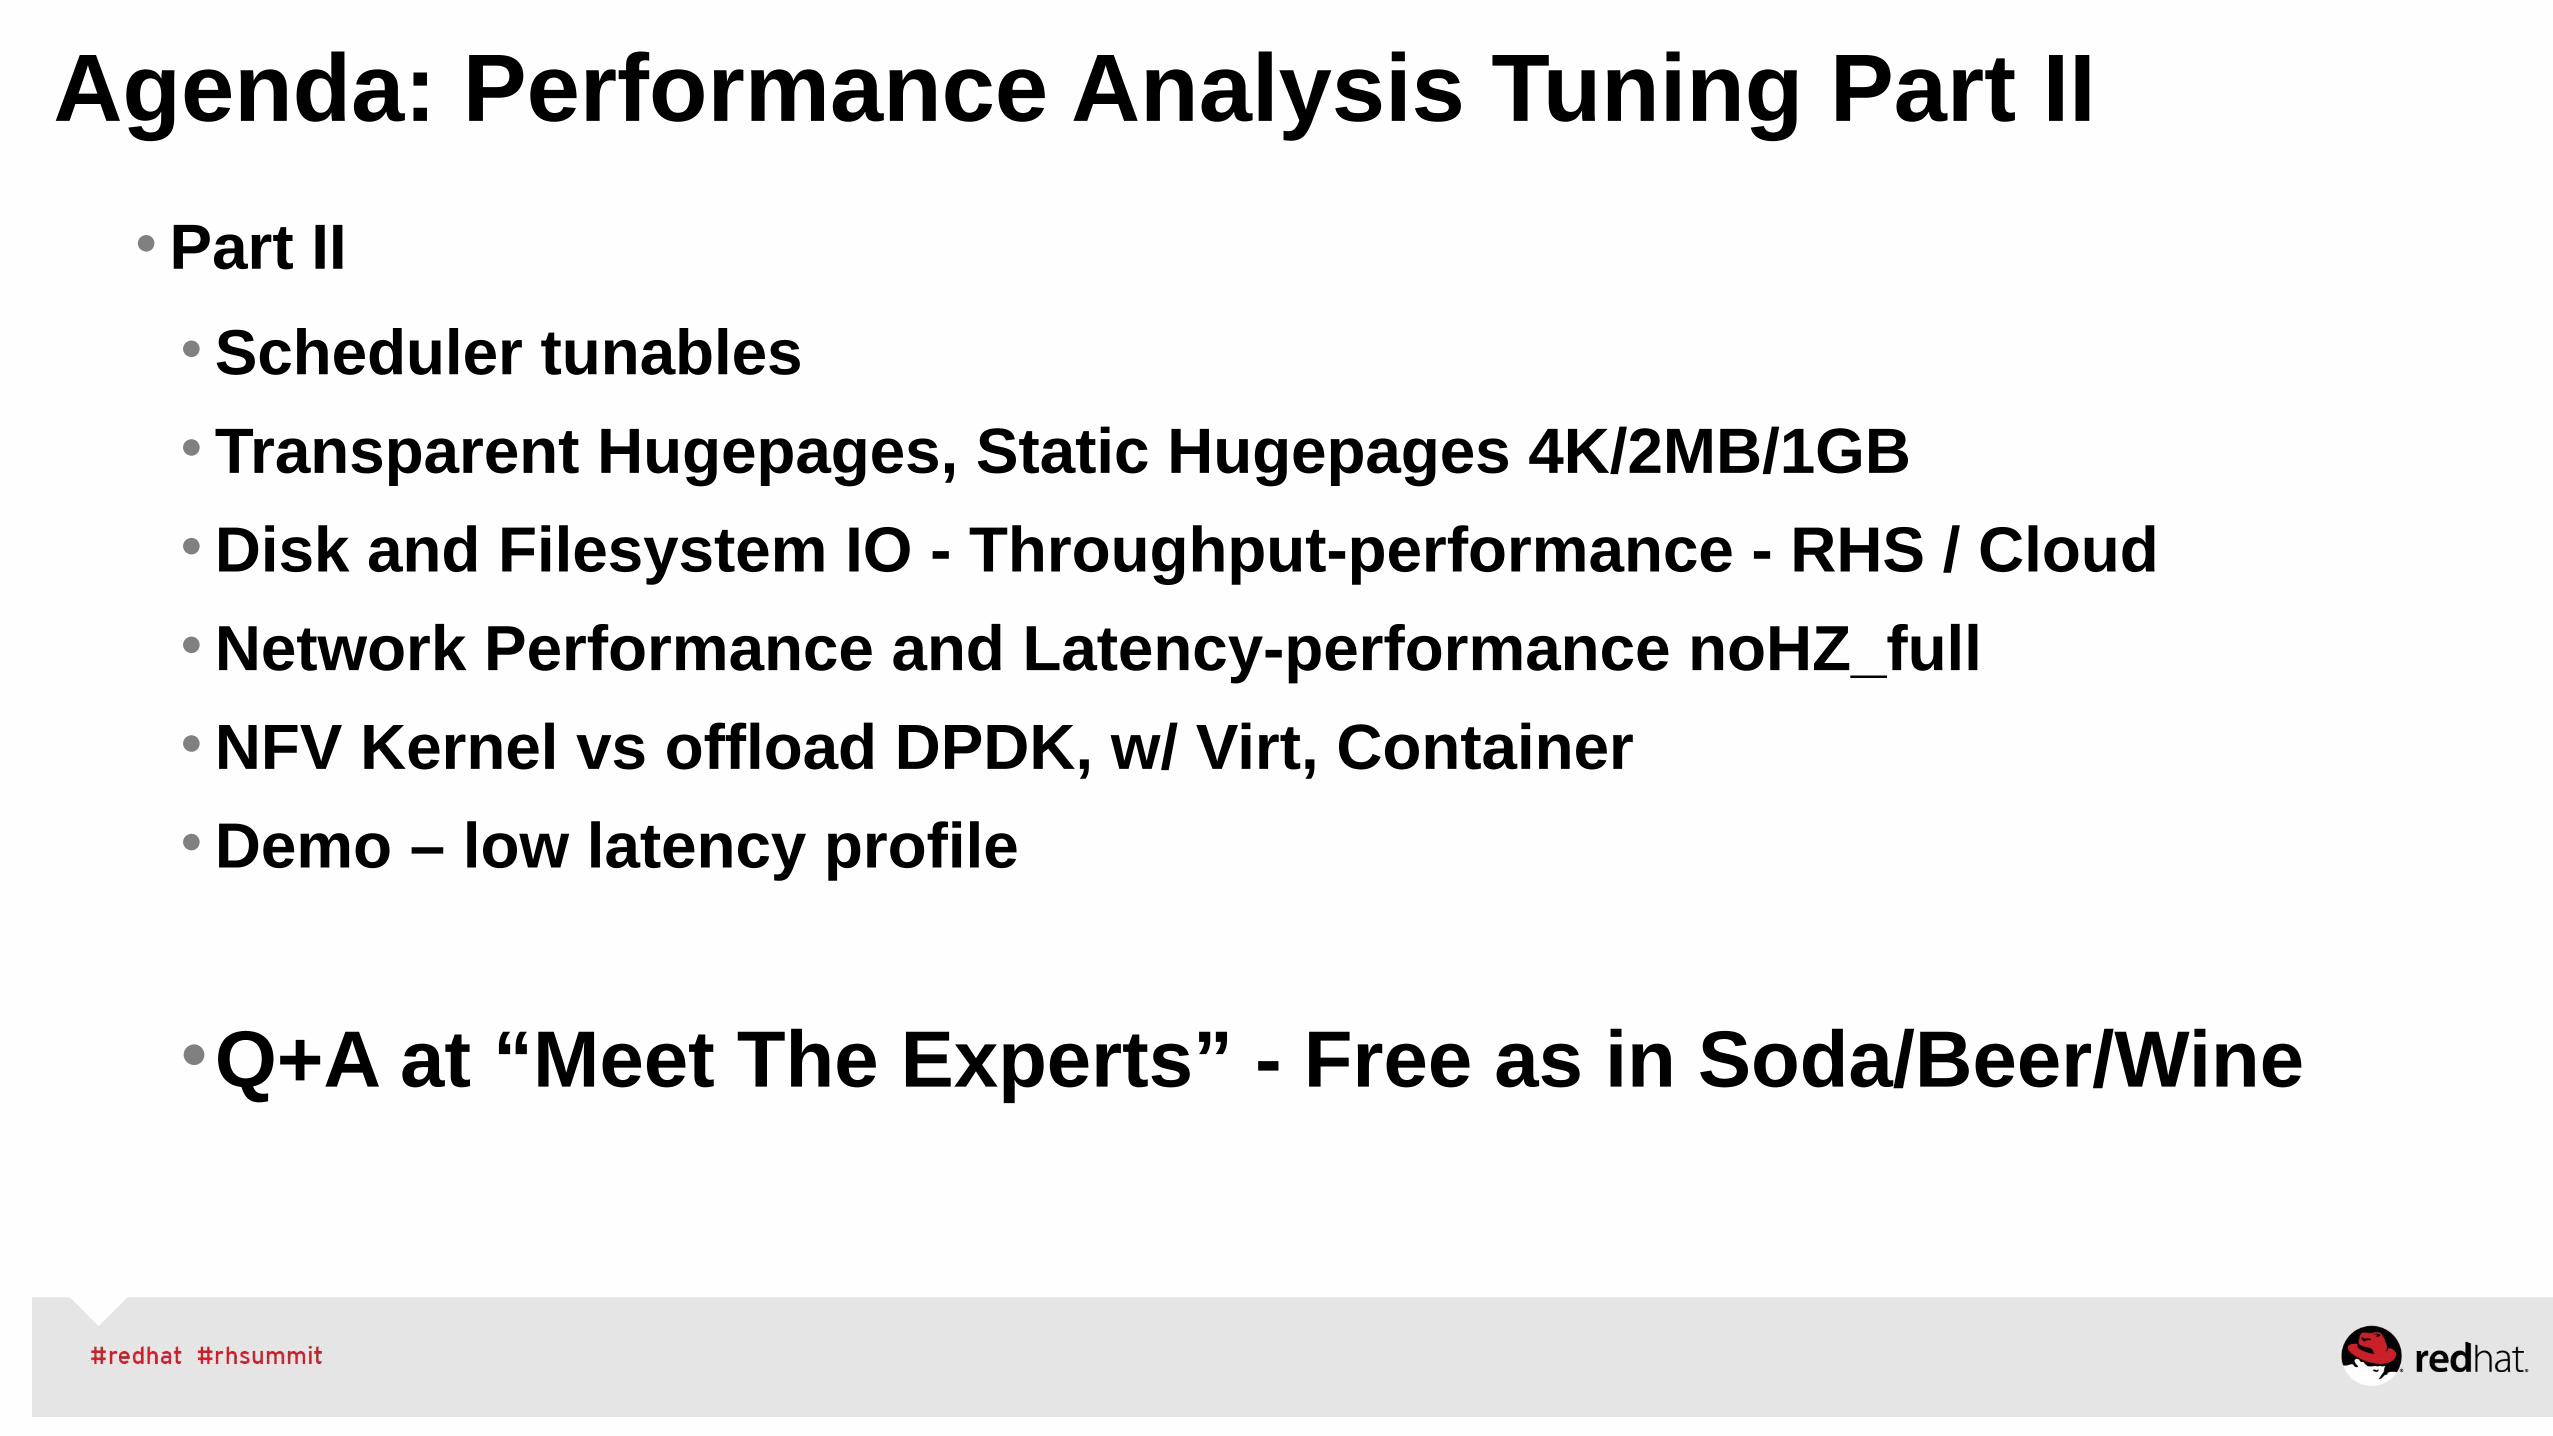
Agenda: Performance Analysis Tuning Part II
• Part II
• Scheduler tunables
• Transparent Hugepages, Static Hugepages 4K/2MB/1GB
• Disk and Filesystem IO - Throughput-performance - RHS / Cloud
• Network Performance and Latency-performance noHZ_full
• NFV Kernel vs offload DPDK, w/ Virt, Container
• Demo – low latency profile
•Q+A at “Meet The Experts” - Free as in Soda/Beer/Wine


Performance Tools - Perf
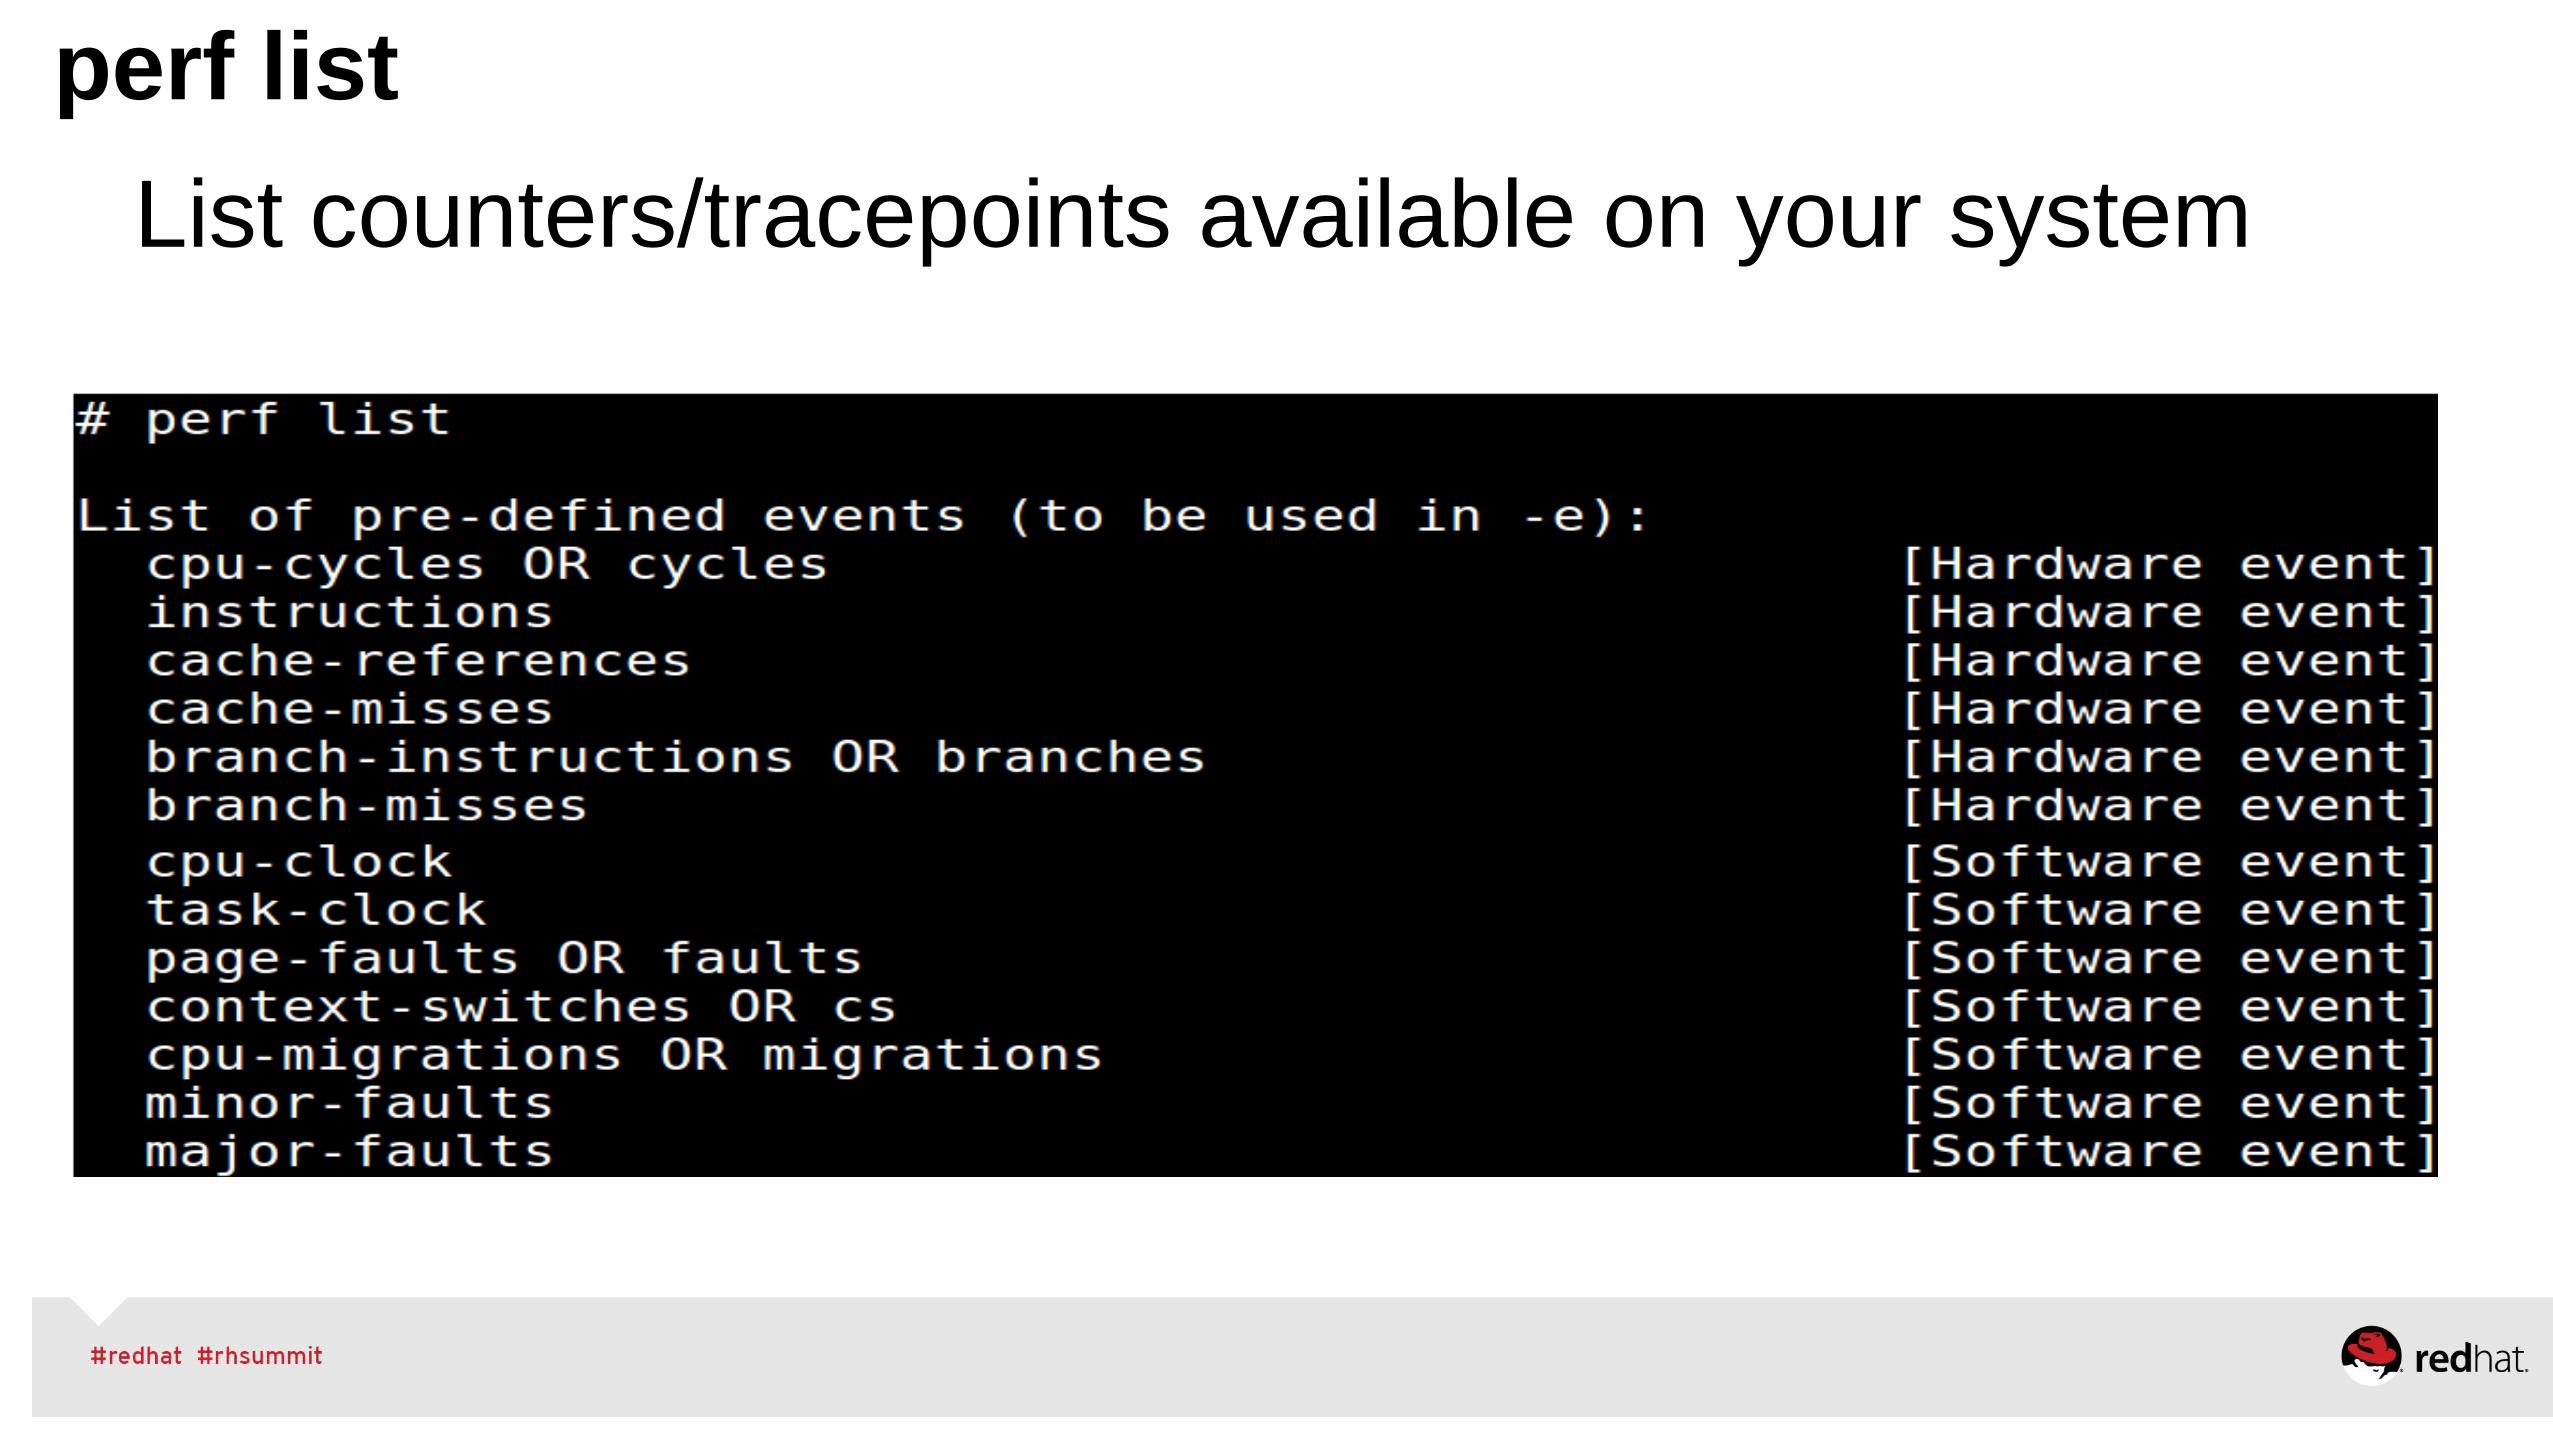
perf list
List counters/tracepoints available on your system
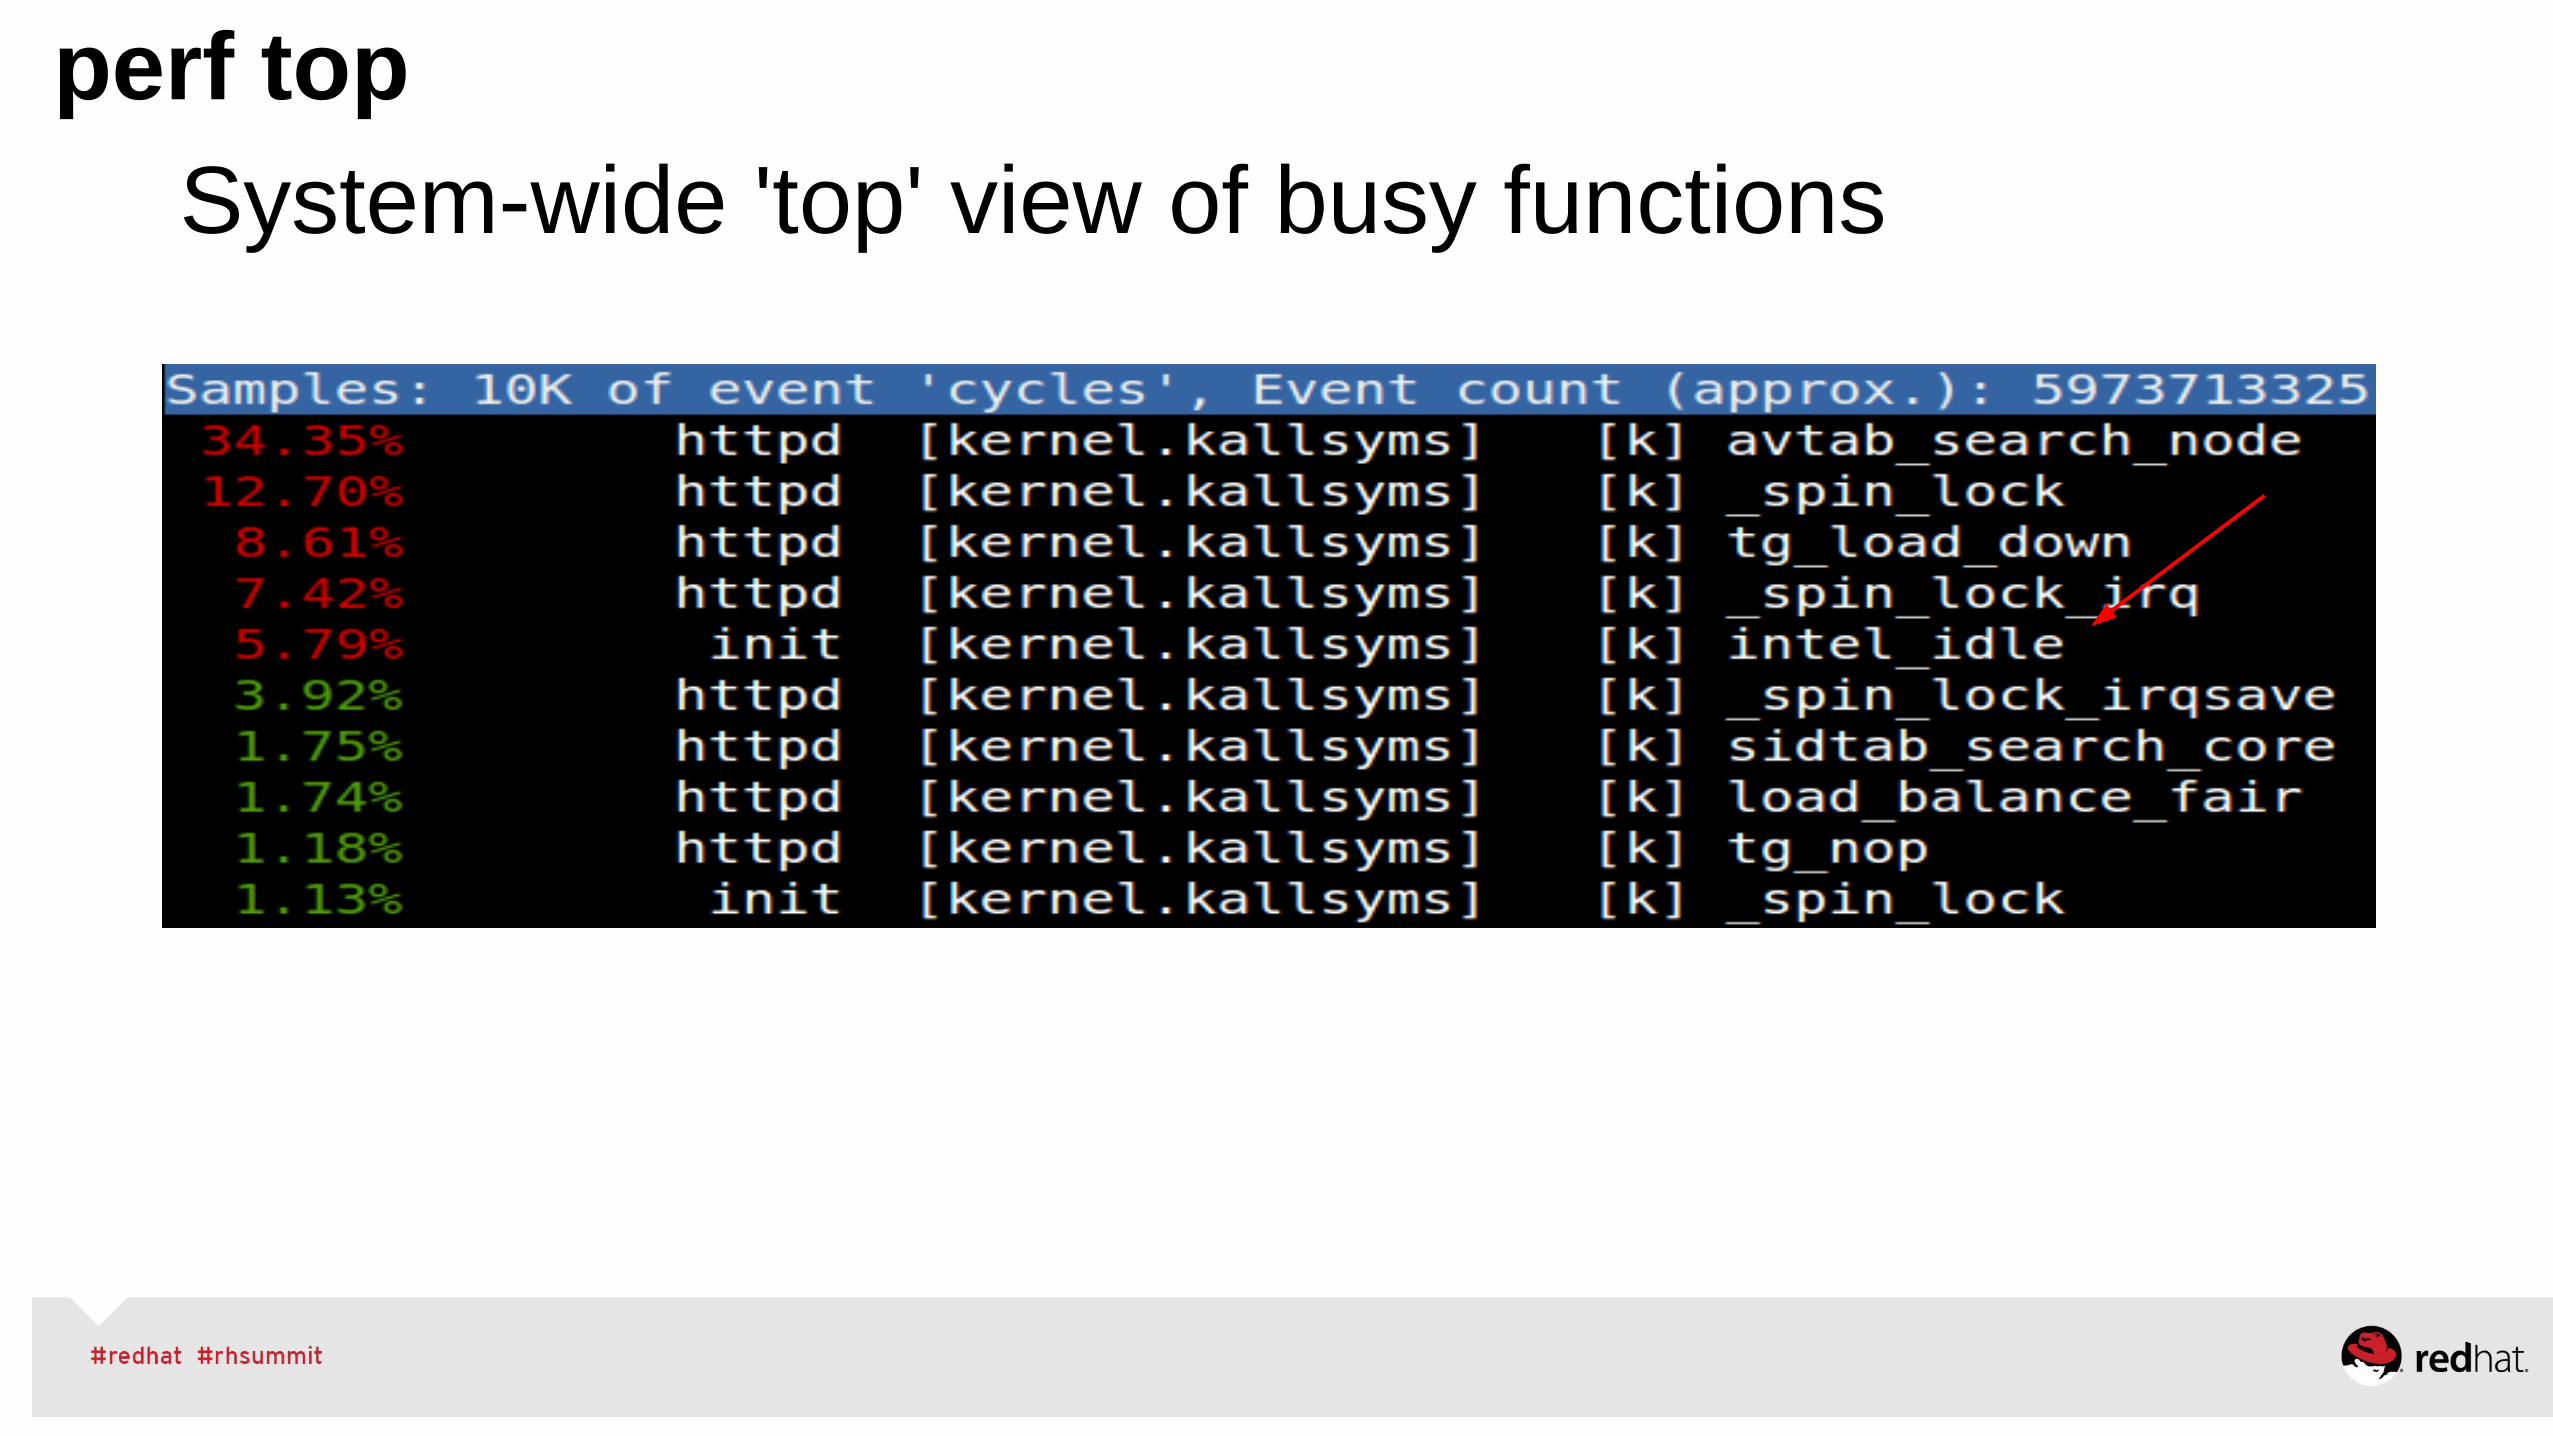
perf top
System-wide 'top' view of busy functions
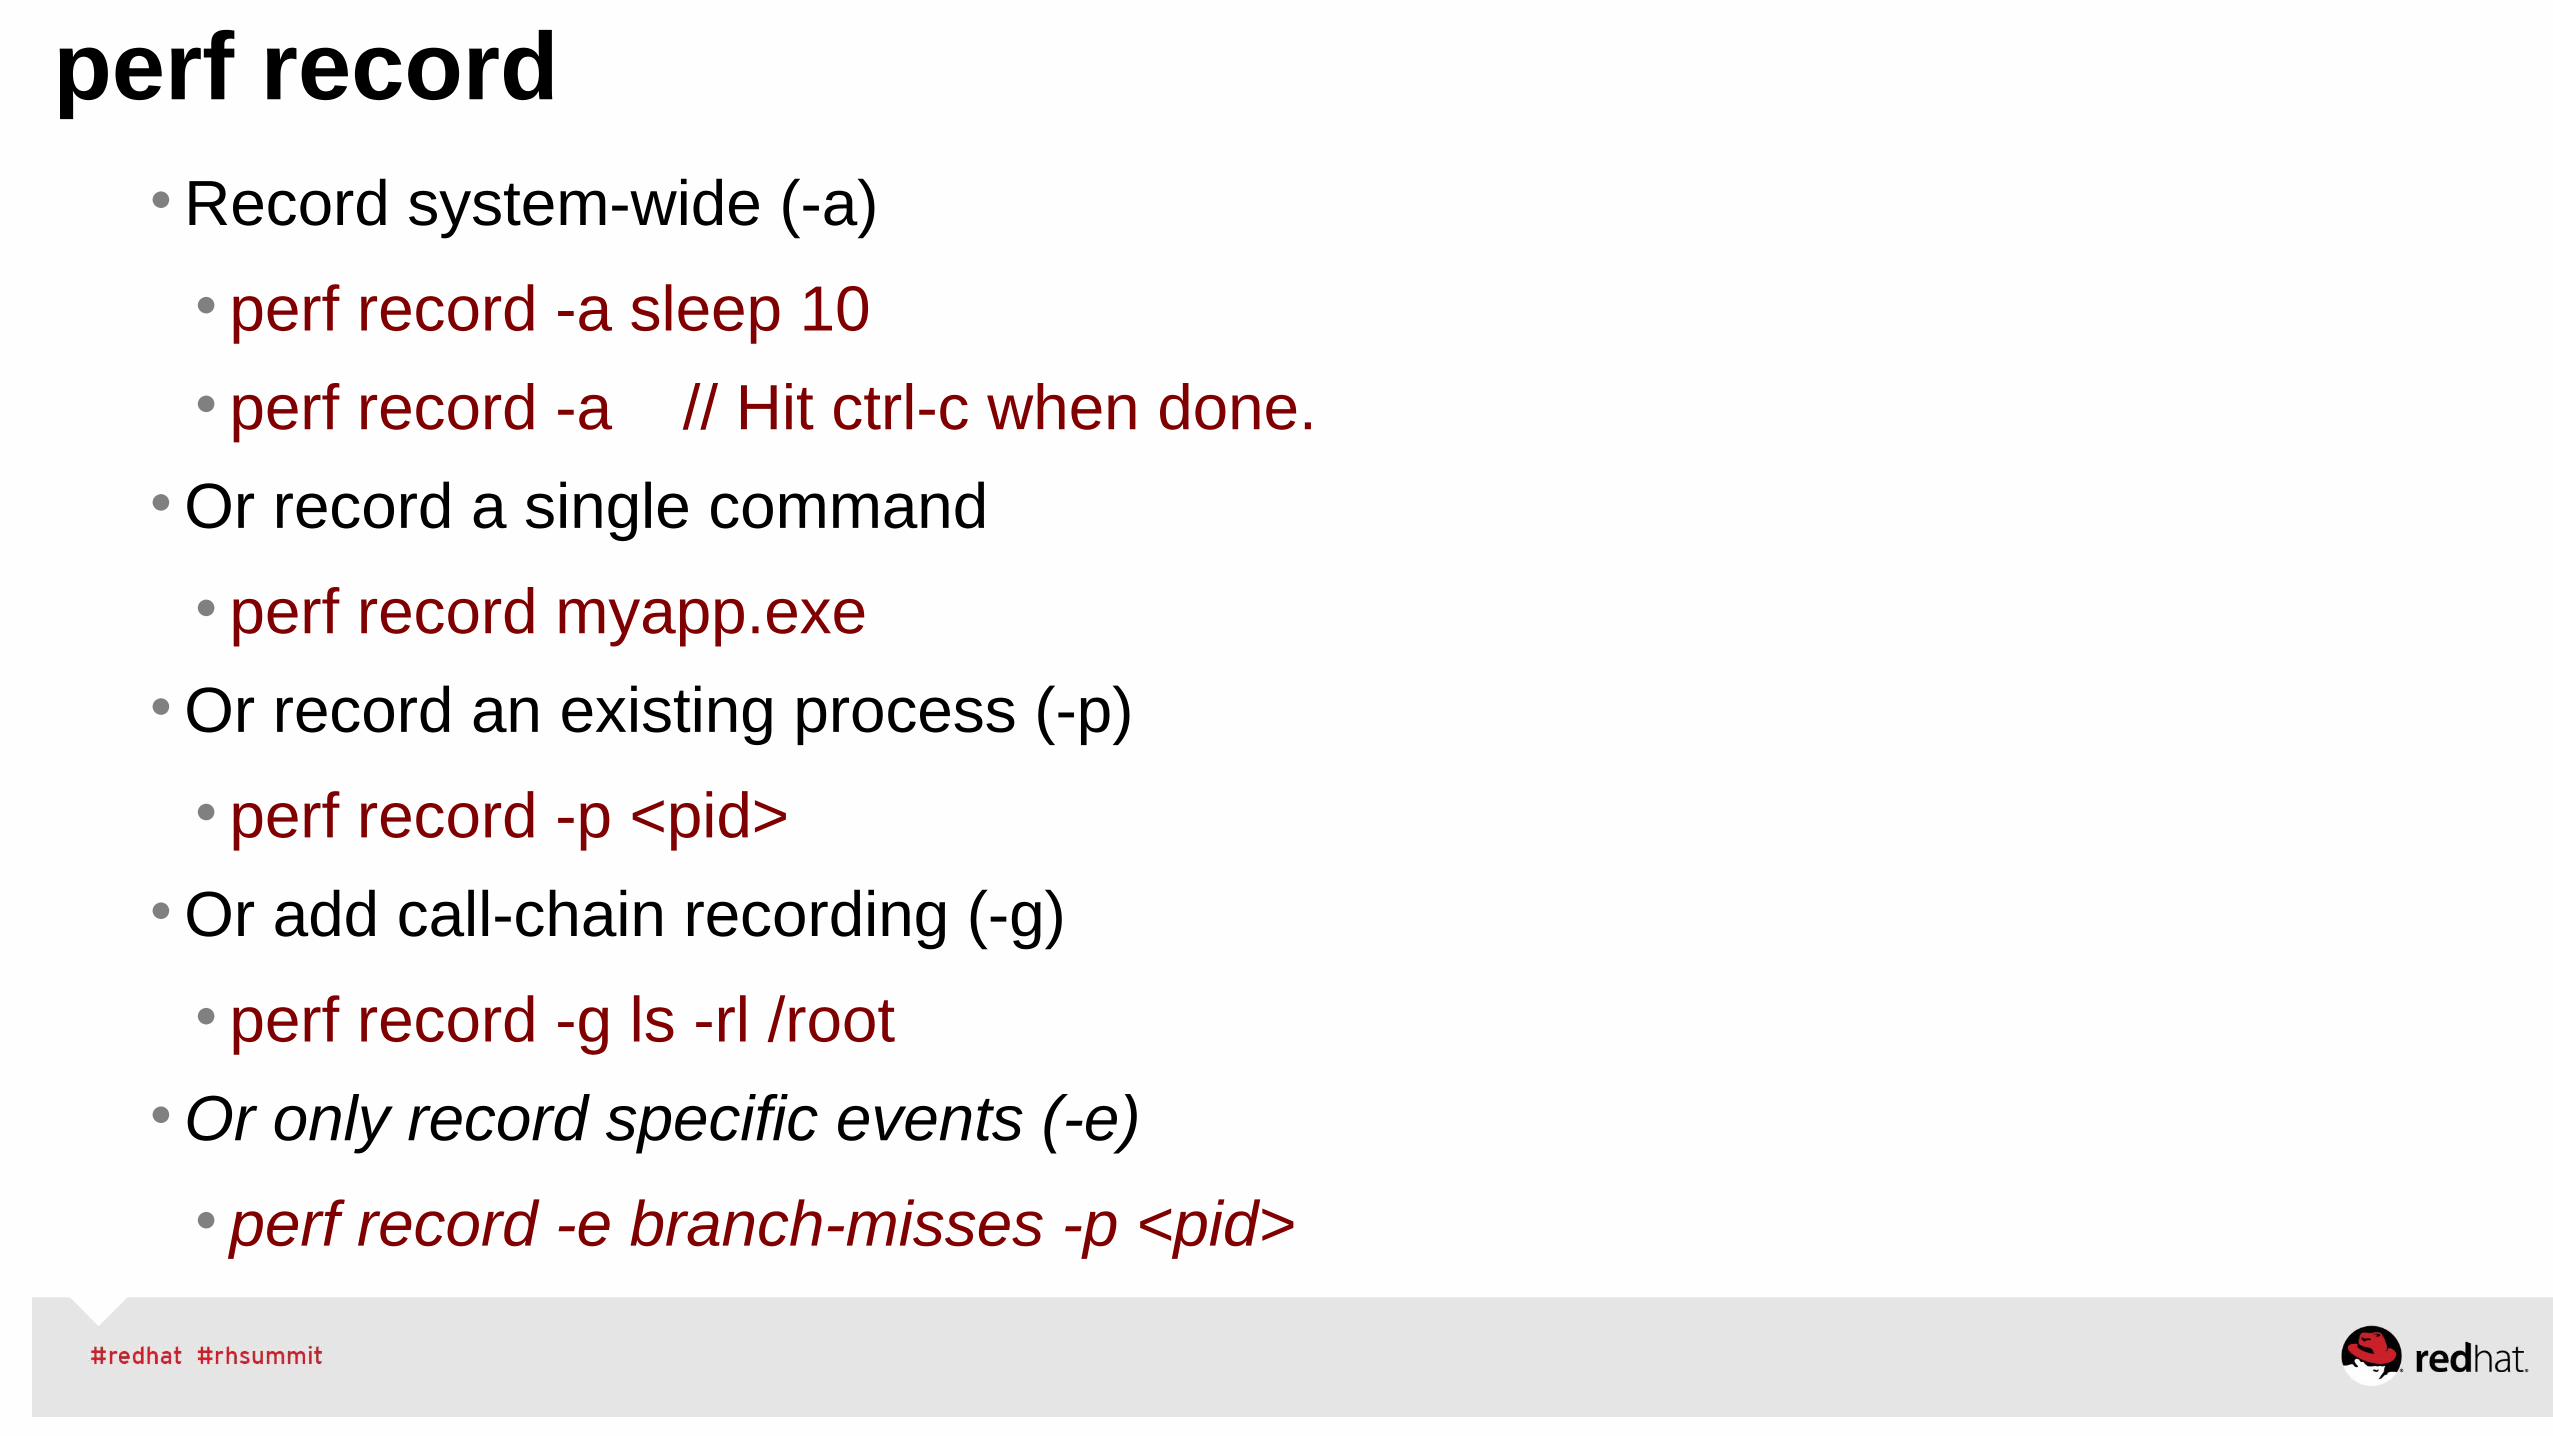
perf record• Record system-wide (-a)
• perf record -a sleep 10
• perf record -a // Hit ctrl-c when done.
• Or record a single command
• perf record myapp.exe
• Or record an existing process (-p)
• perf record -p <pid>
• Or add call-chain recording (-g)
• perf record -g ls -rl /root
• Or only record specific events (-e)
• perf record -e branch-misses -p <pid>
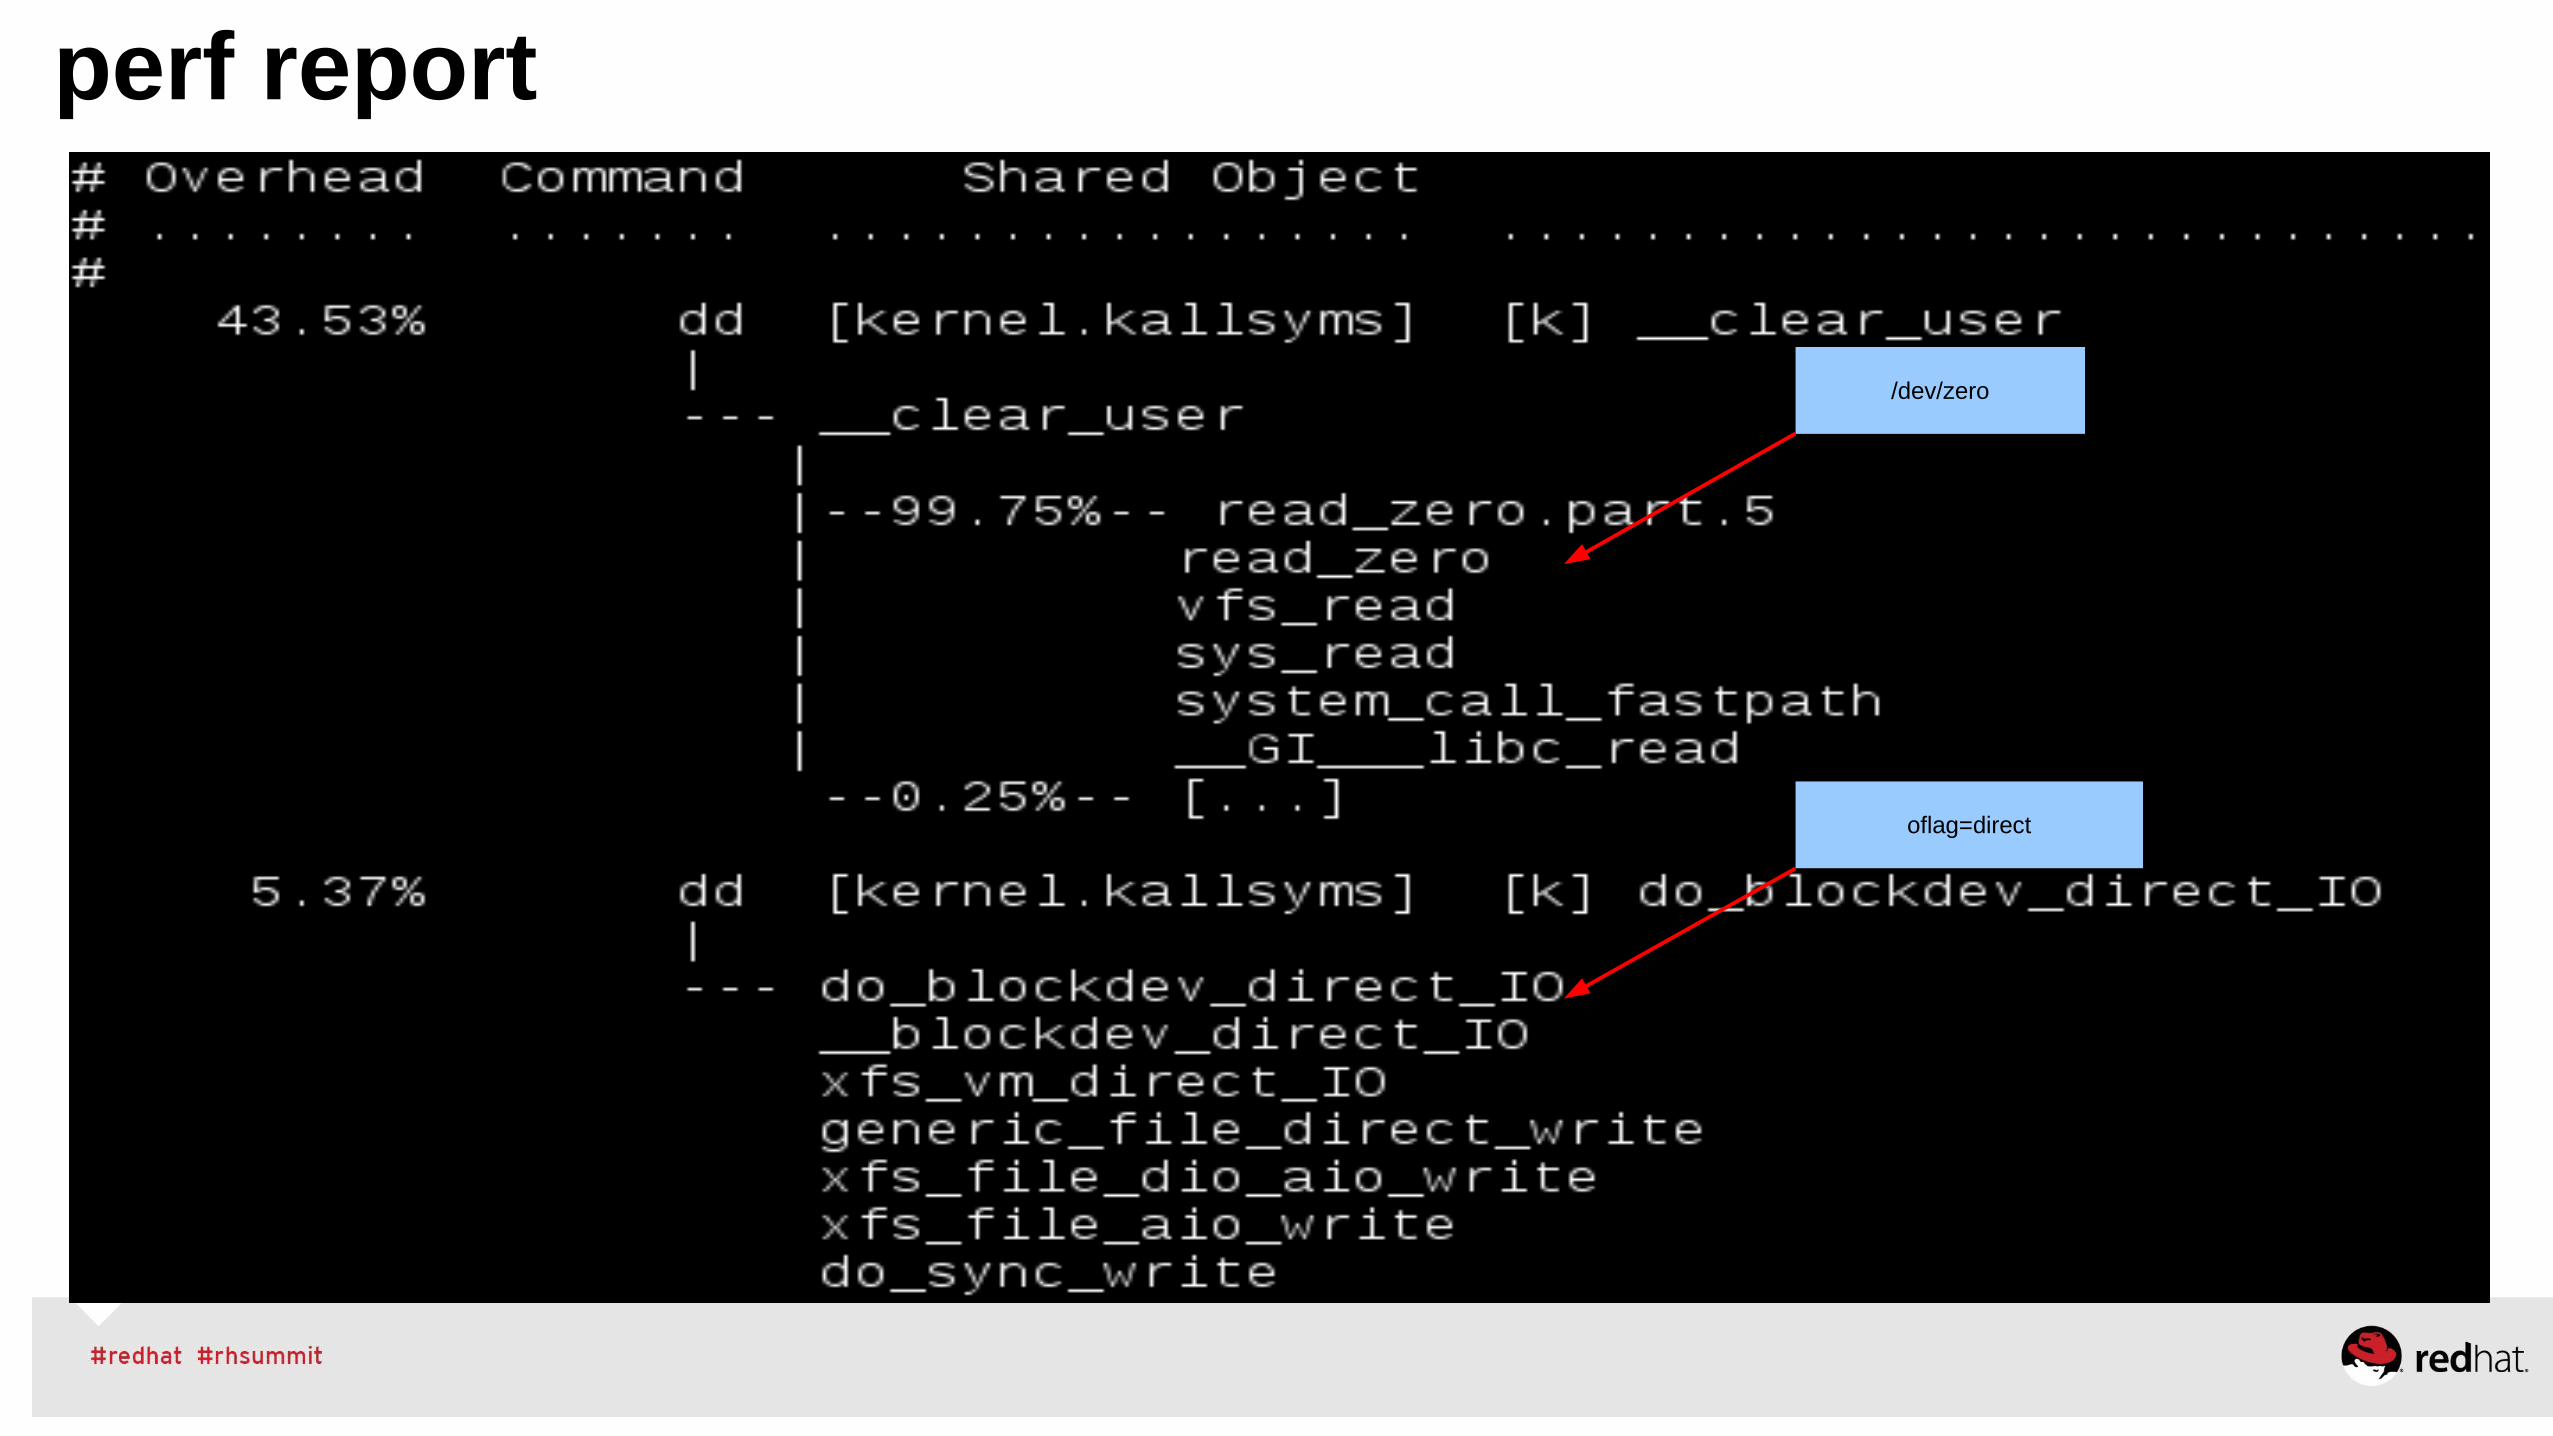
perf report
/dev/zero
oflag=direct
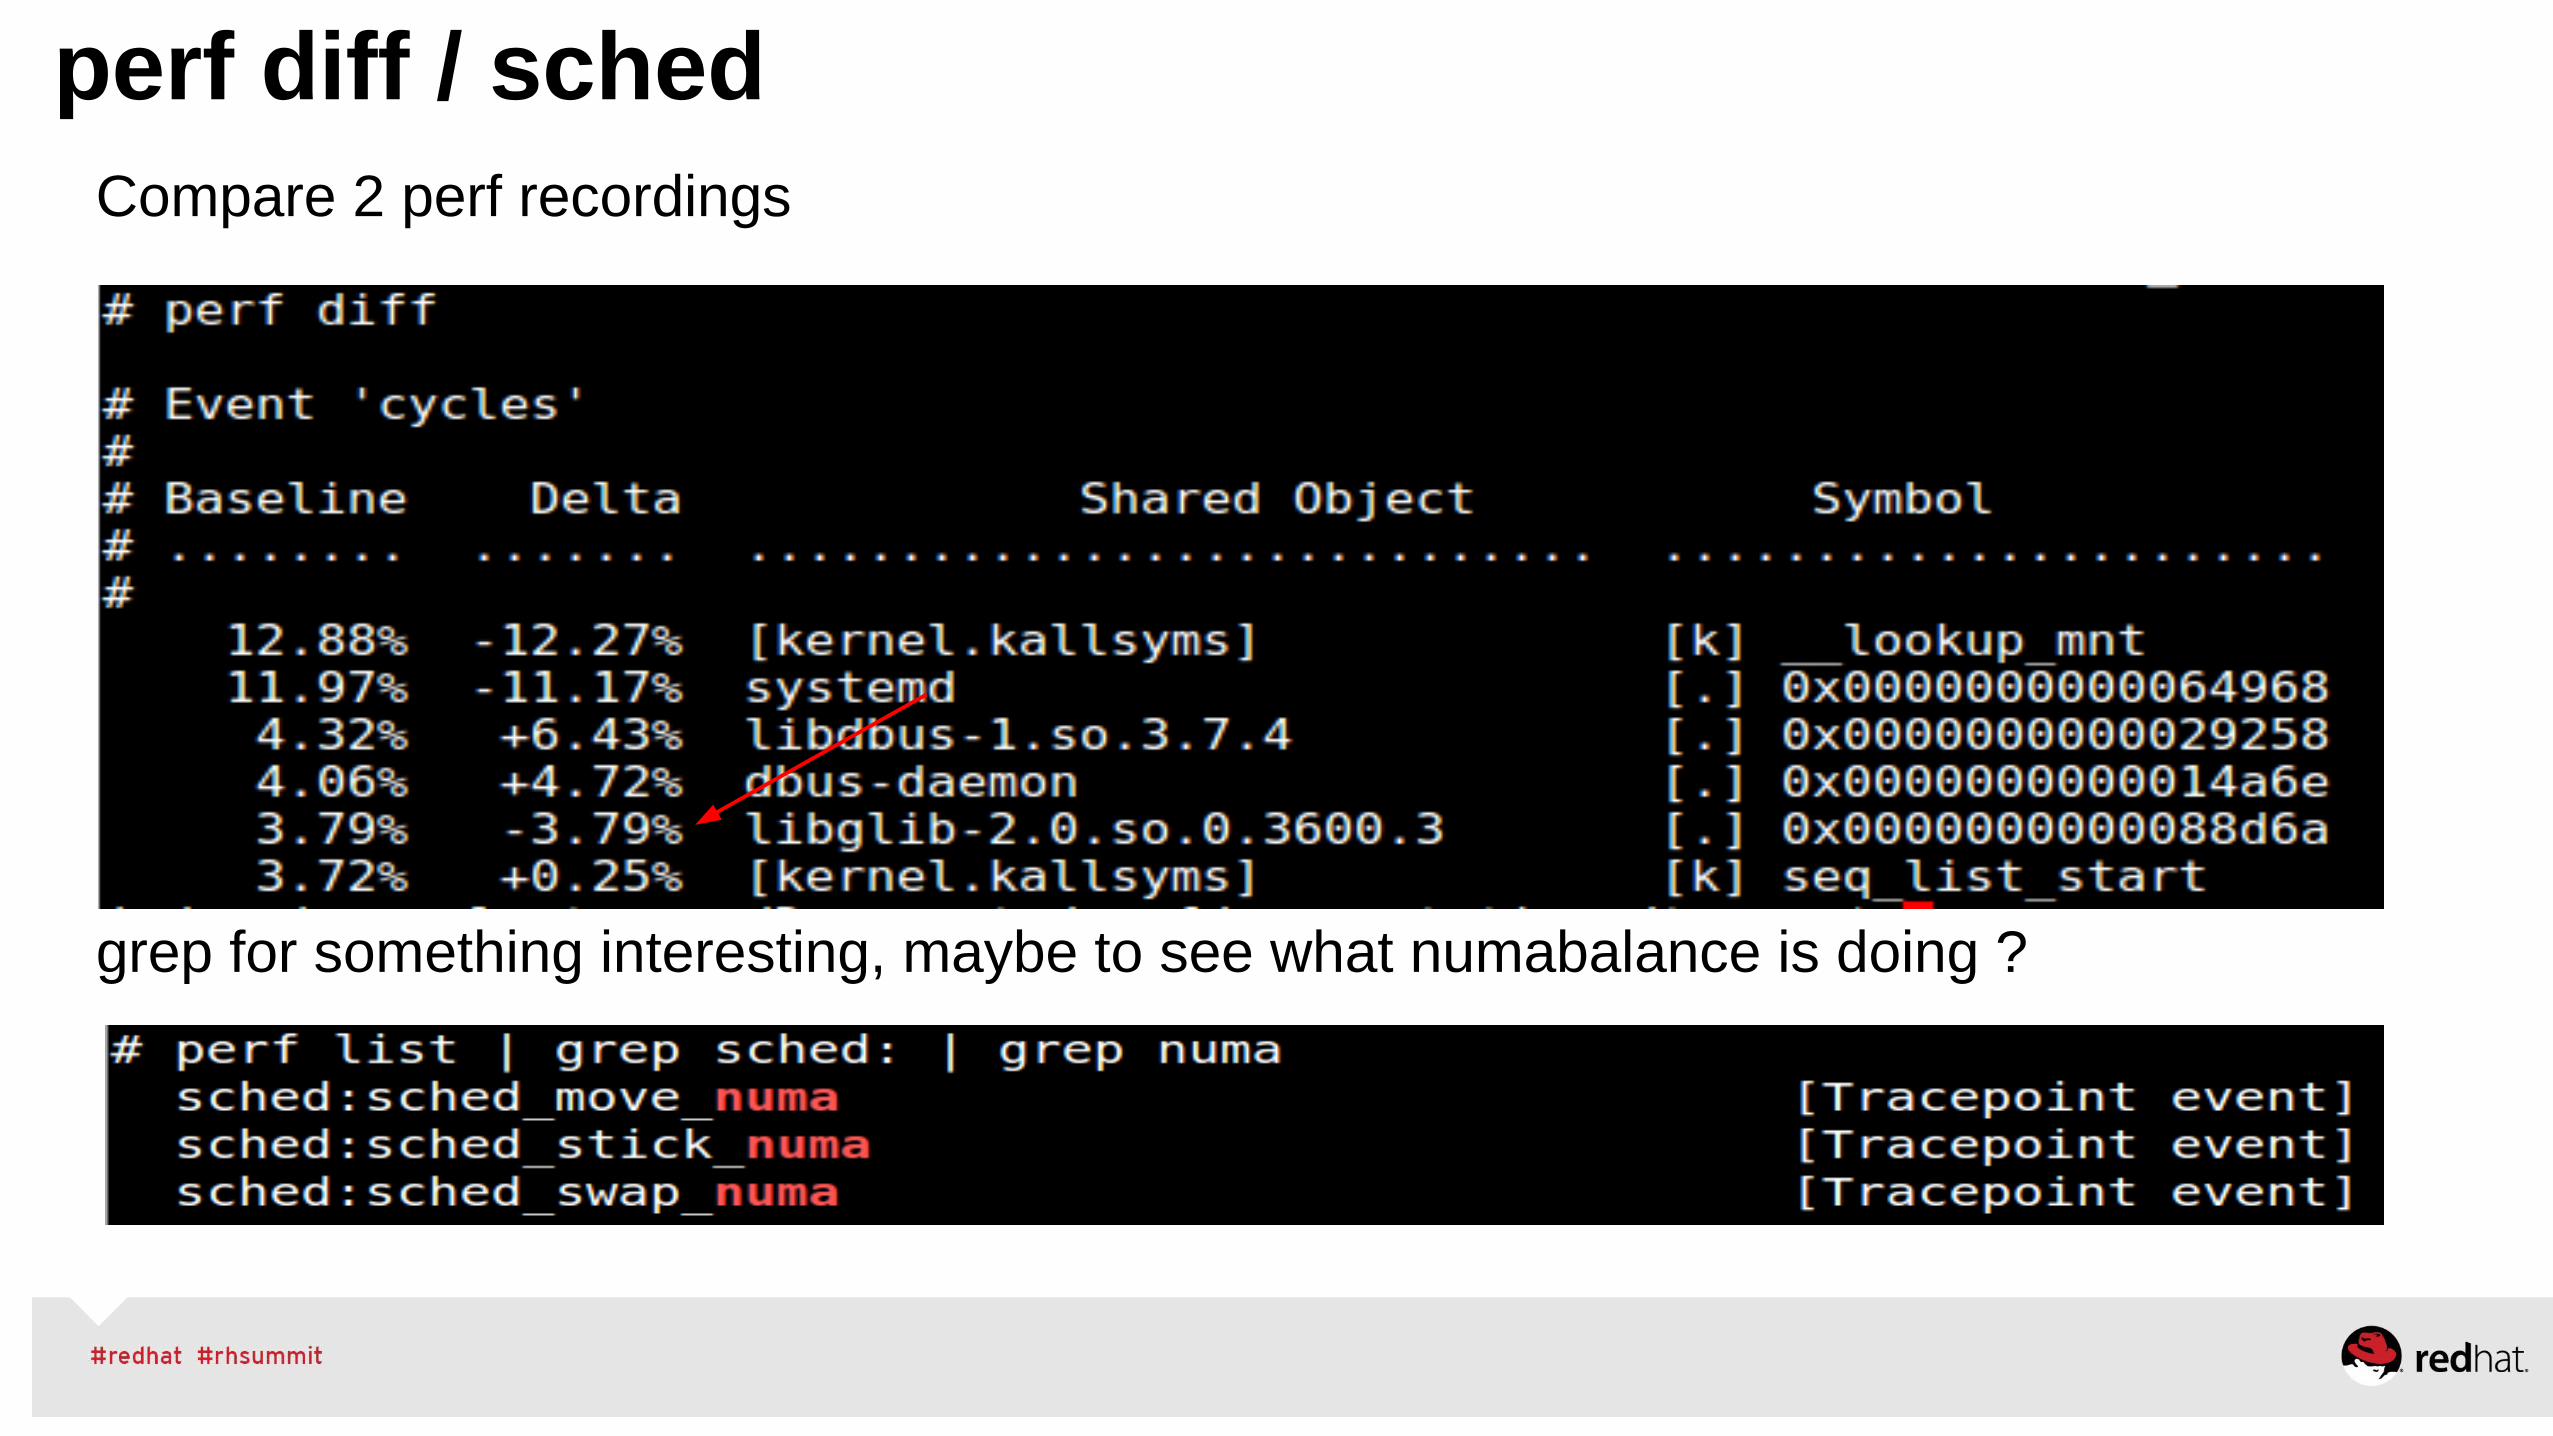
perf diff / schedCompare 2 perf recordings
grep for something interesting, maybe to see what numabalance is doing ?
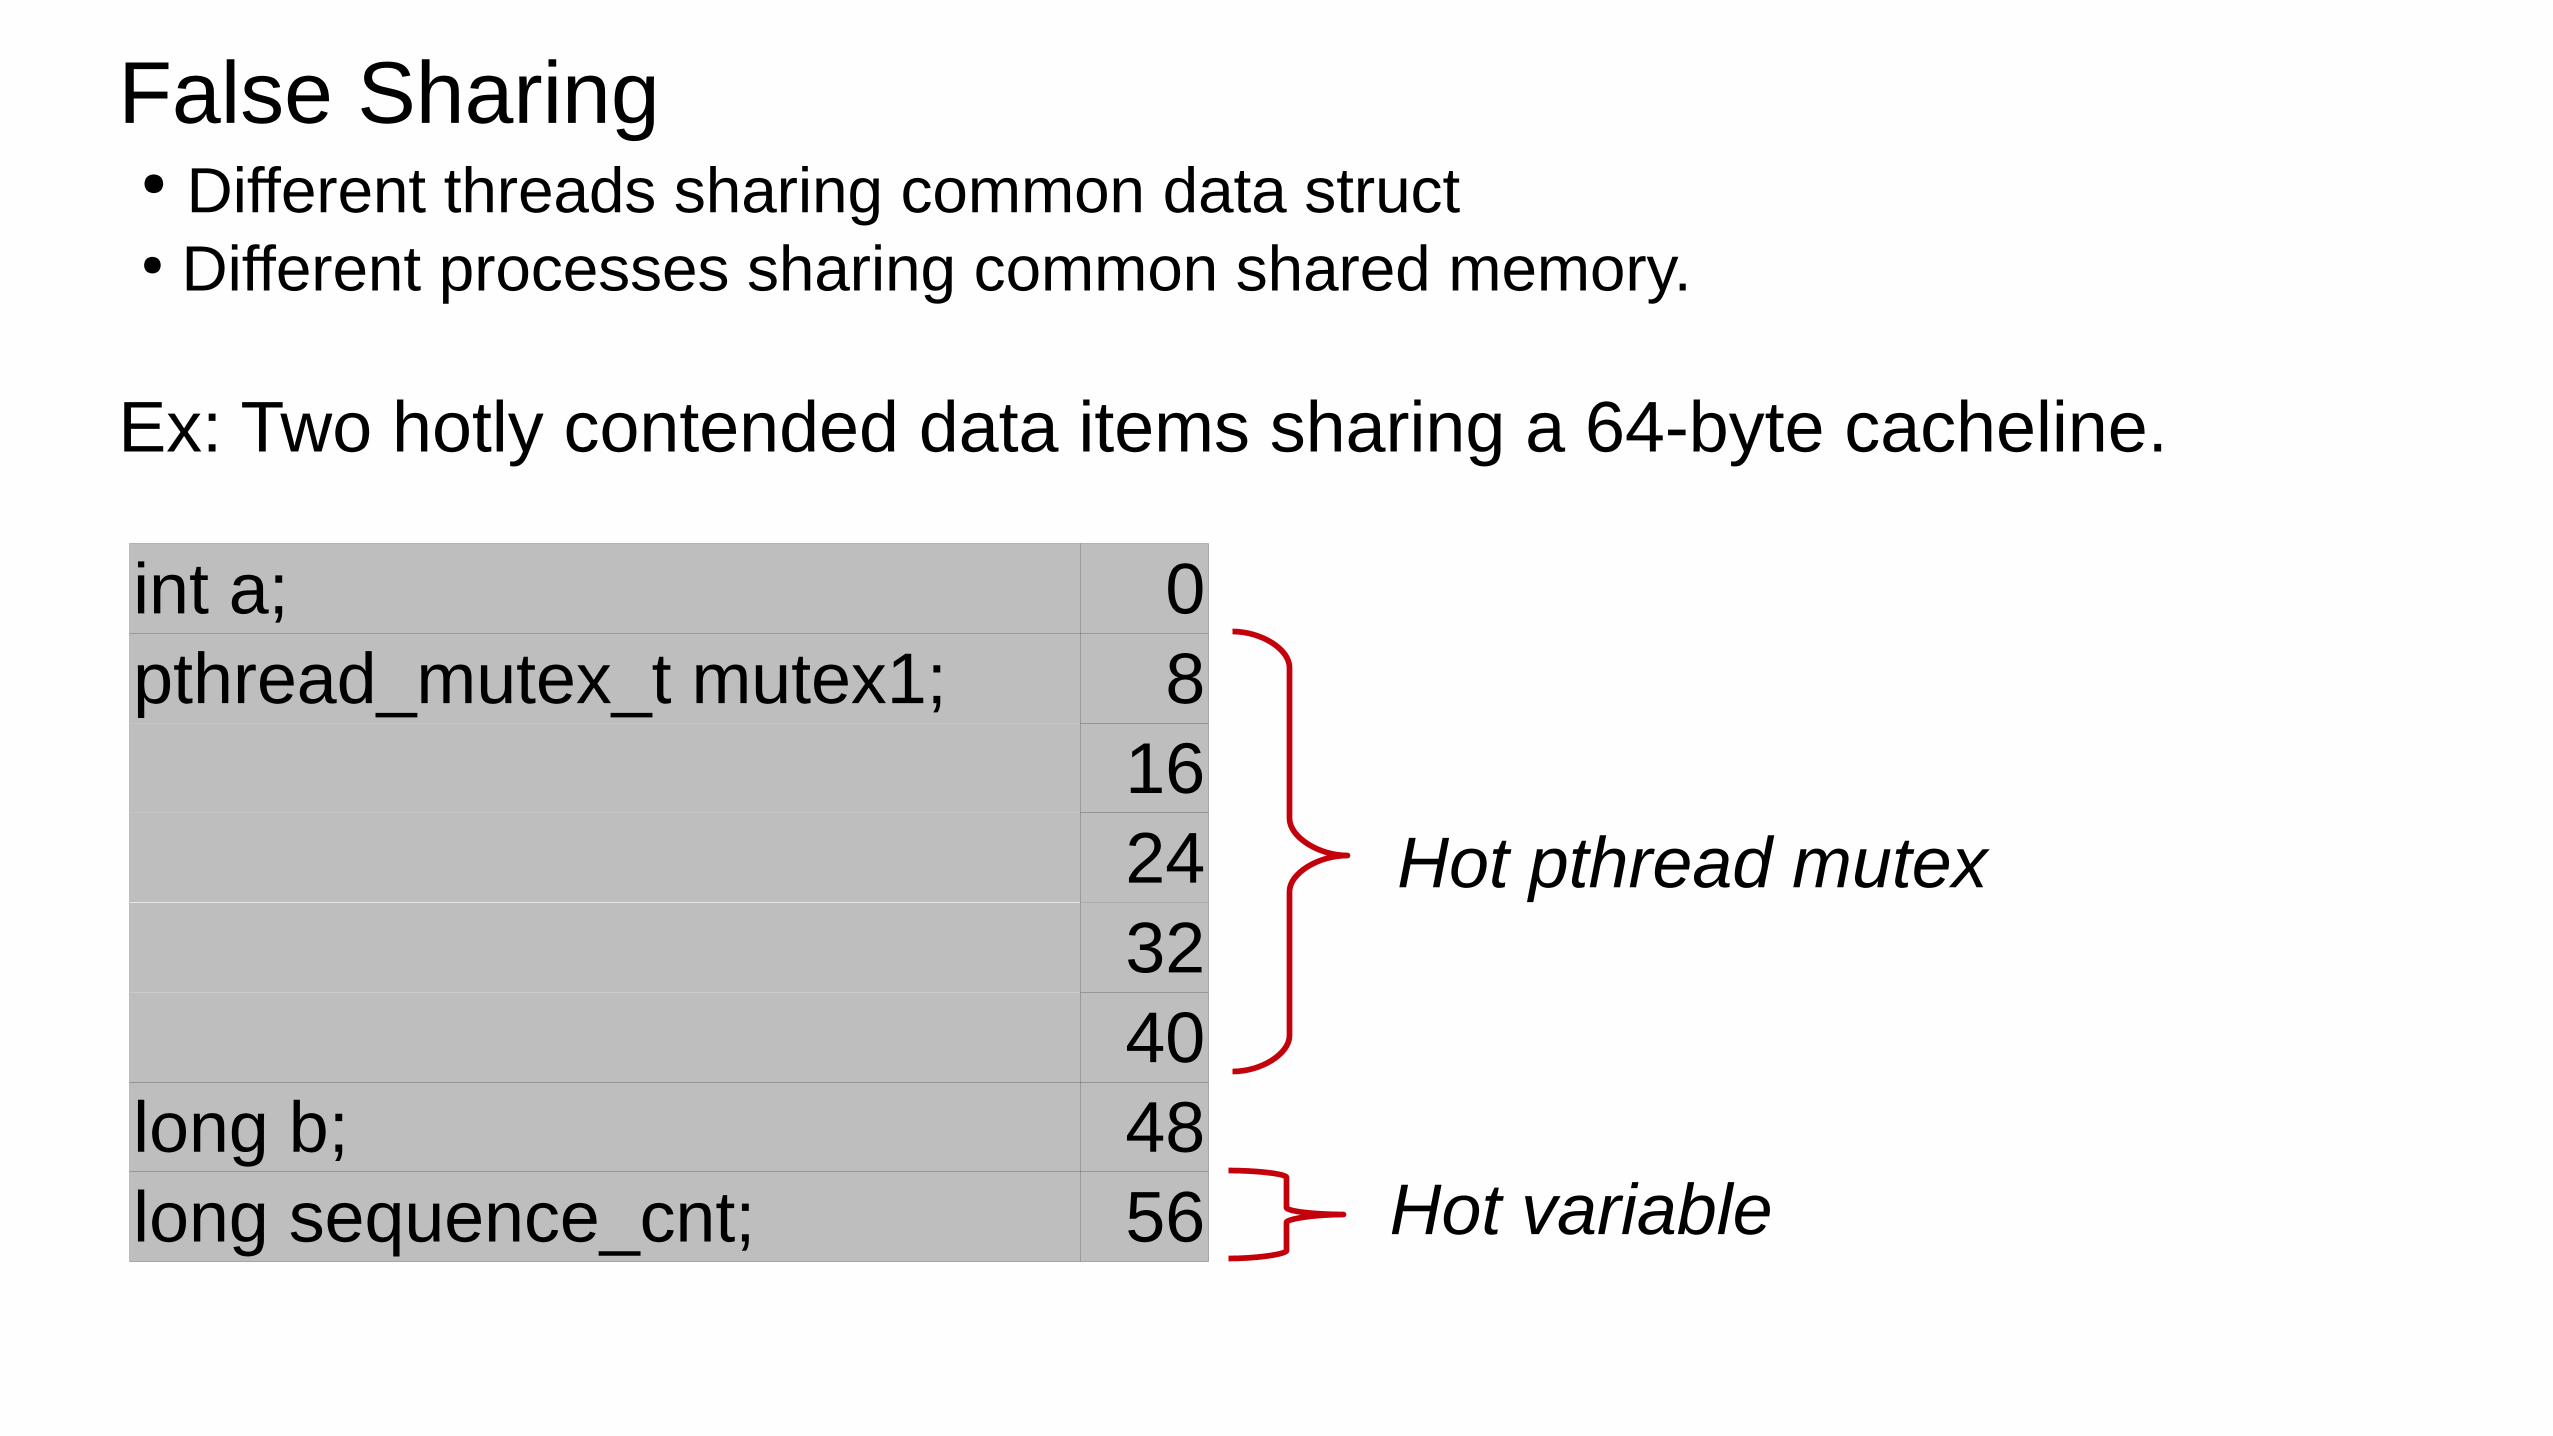
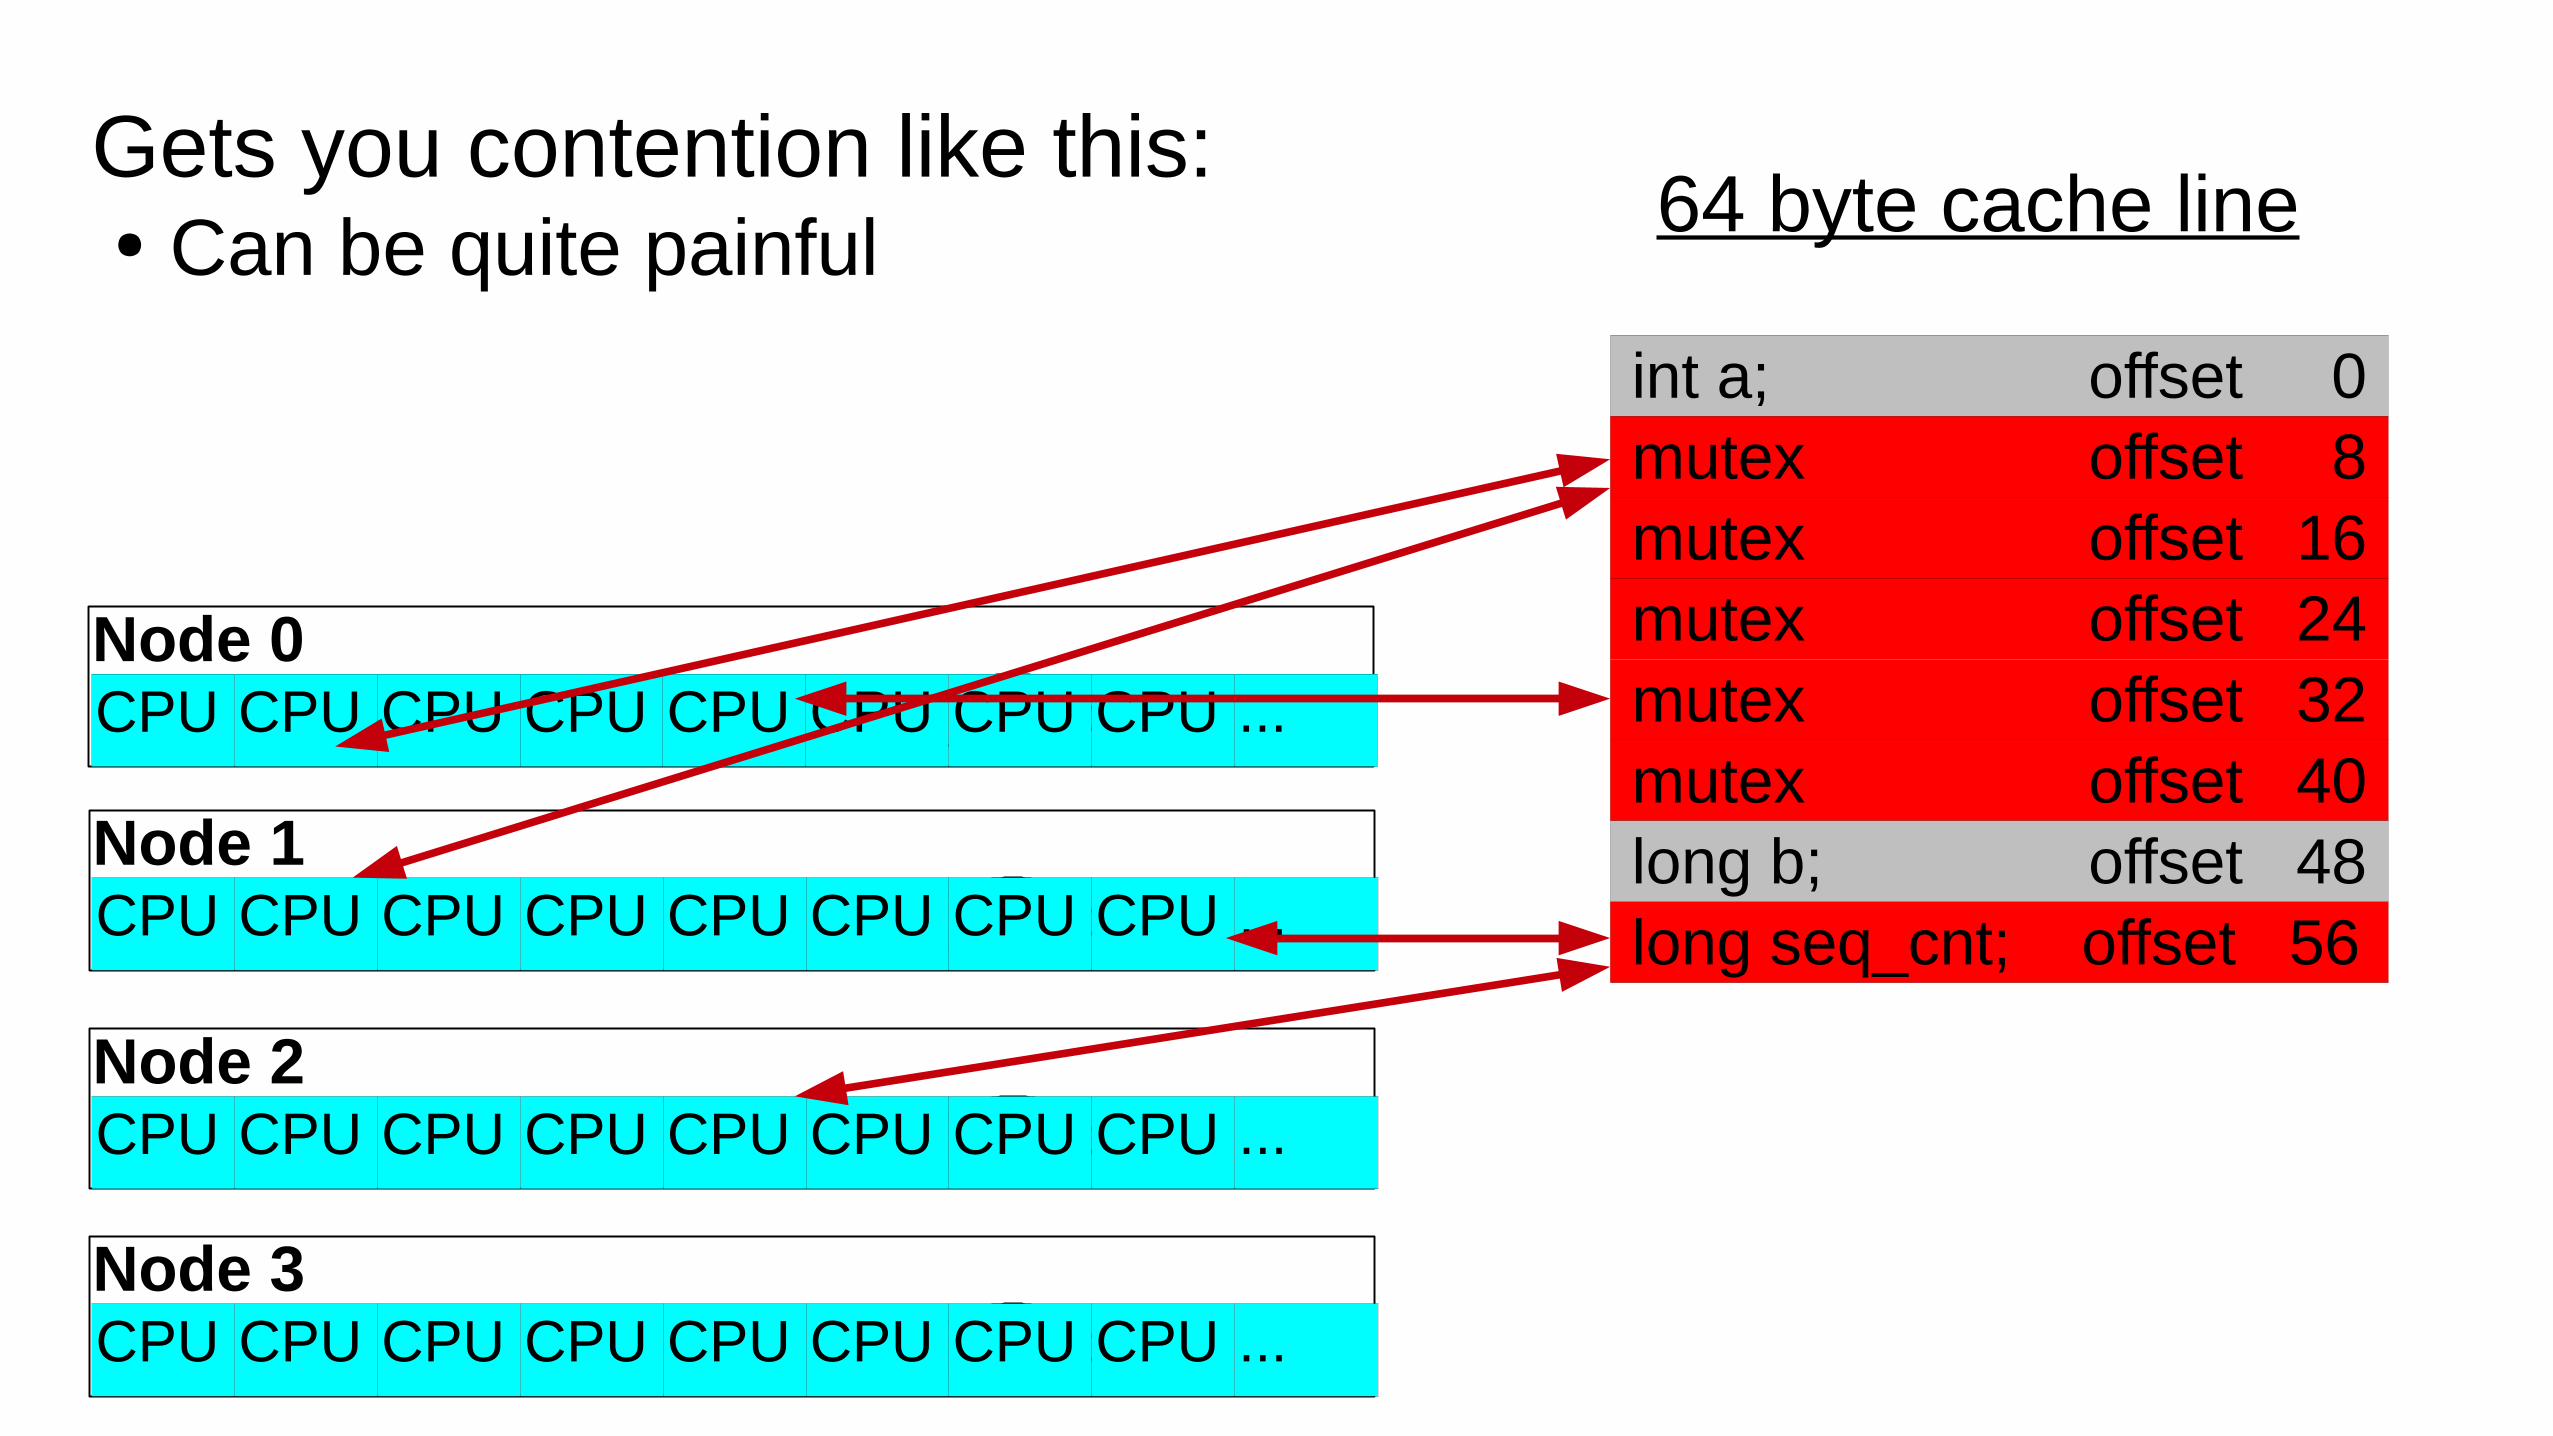
False Sharing● Different threads sharing common data struct● Different processes sharing common shared memory.
Ex: Two hotly contended data items sharing a 64-byte cacheline.
int a; 0pthread_mutex_t mutex1; 8
16243240
long b; 48long sequence_cnt; 56
Hot pthread mutex
Hot variable
64 byte cache line
Node 0
int a; offset 0 mutex offset 8 mutex offset 16 mutex offset 24 mutex offset 32 mutex offset 40 long b; offset 48 long seq_cnt; offset 56
CPU CPU CPU CPU CPU CPU CPU CPU ...
Node 1 CPU CPU CPU CPU CPU CPU CPU CPU ...
Node 2 CPU CPU CPU CPU CPU CPU CPU CPU ...
Node 3 CPU CPU CPU CPU CPU CPU CPU CPU ...
Gets you contention like this:● Can be quite painful
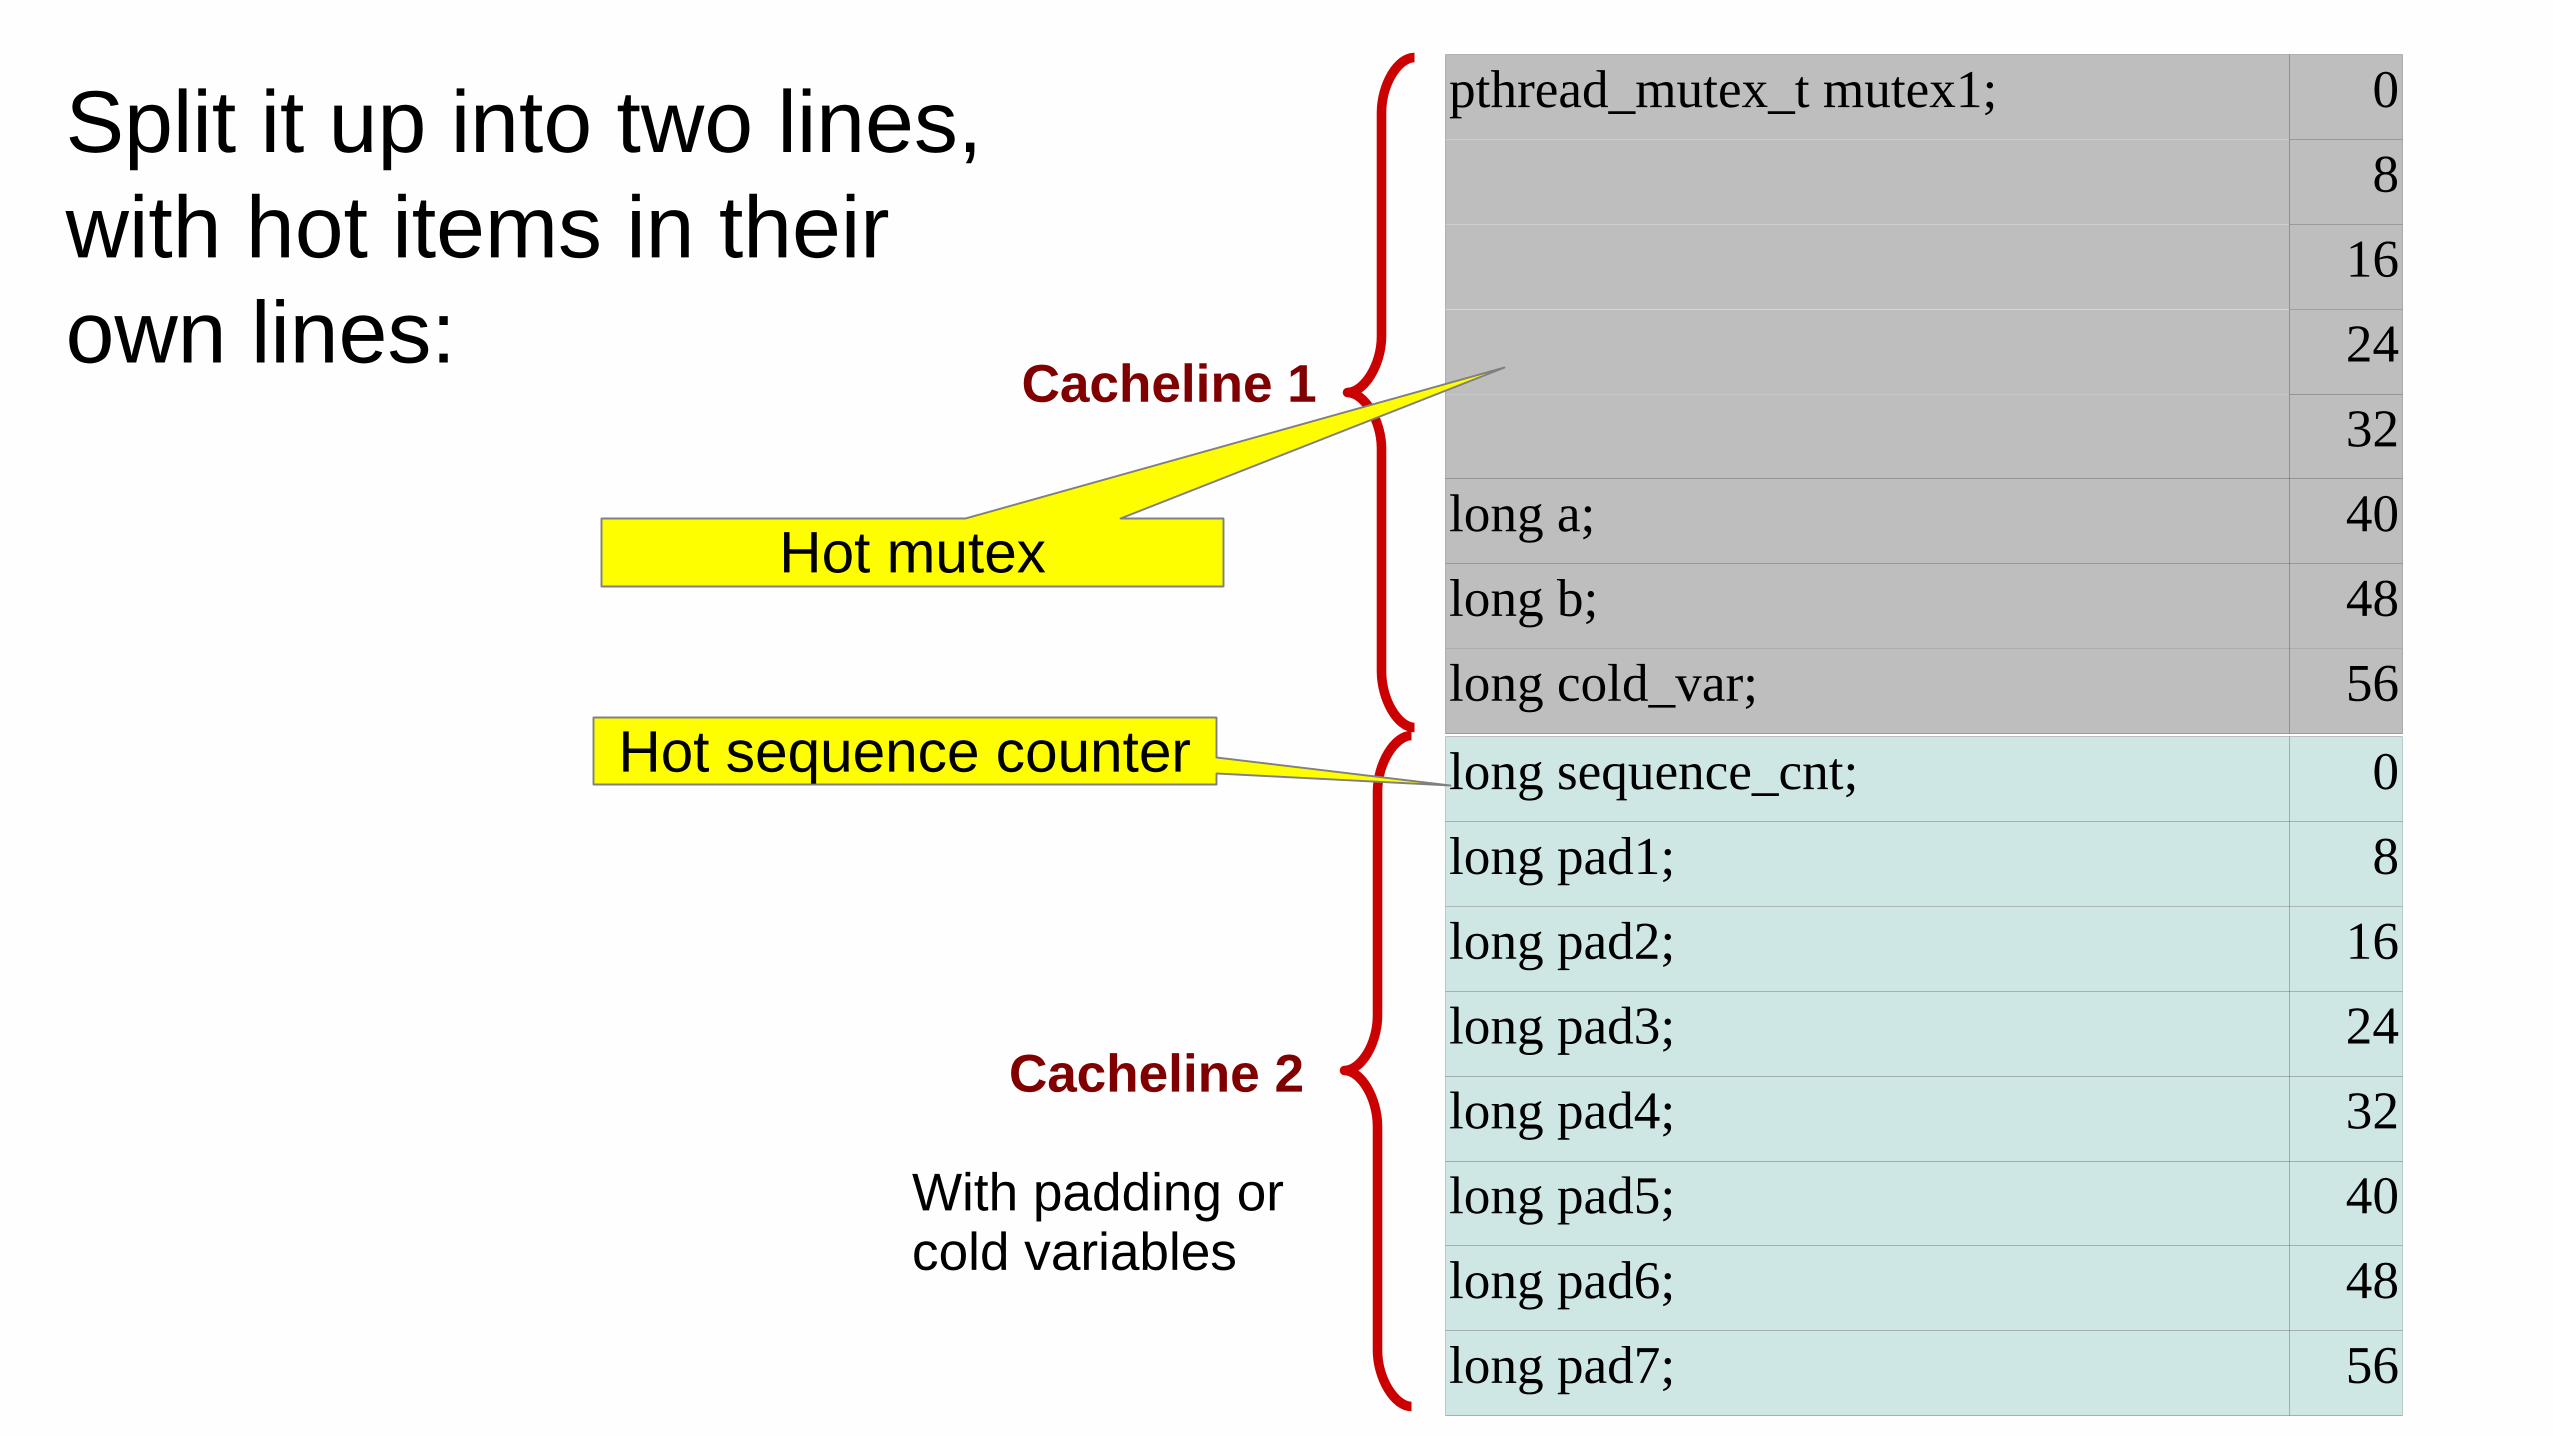
Split it up into two lines, with hot items in their own lines:
long sequence_cnt; 0
long pad1; 8
long pad2; 16
long pad3; 24
long pad4; 32
long pad5; 40
long pad6; 48
long pad7; 56
pthread_mutex_t mutex1; 0
8
16
24
32
long a; 40
long b; 48
long cold_var; 56
Cacheline 1
Cacheline 2
With padding or cold variables
Hot sequence counter
Hot mutex
RED HAT CONFIDENTIAL | Joe Mario#rhconvergence
65
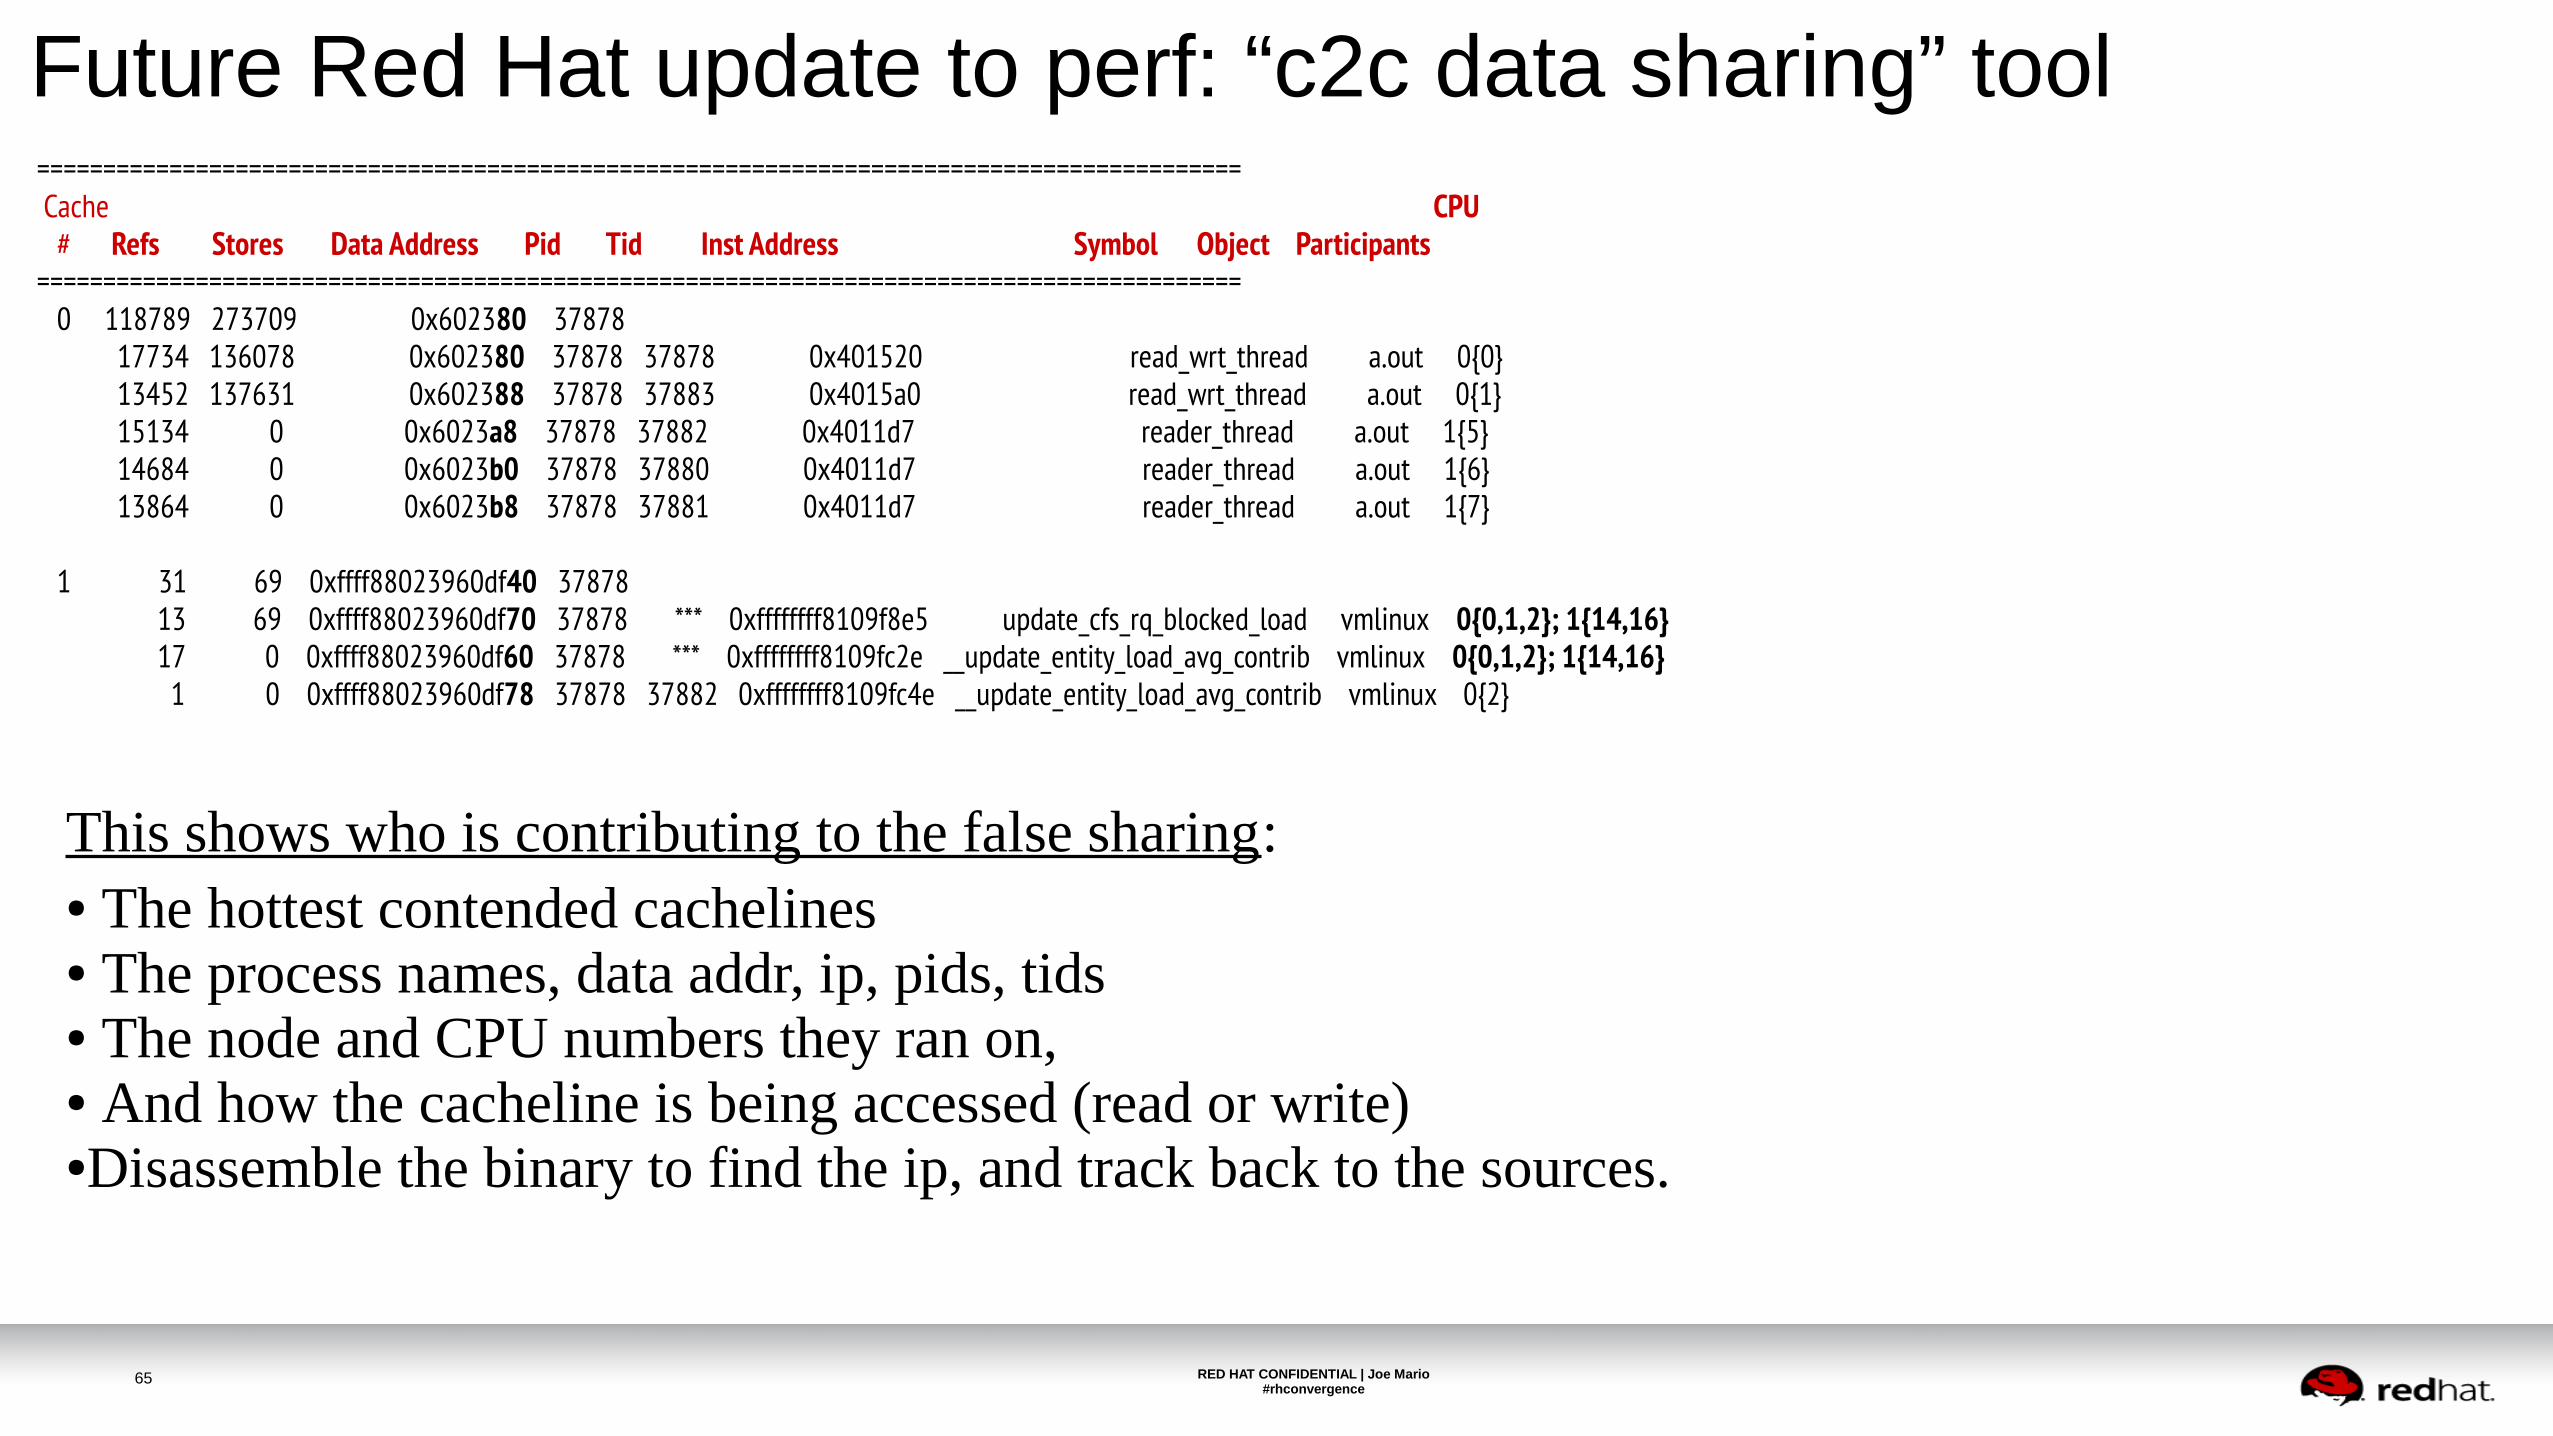
Future Red Hat update to perf: “c2c data sharing” tool
This shows who is contributing to the false sharing:● The hottest contended cachelines ● The process names, data addr, ip, pids, tids● The node and CPU numbers they ran on, ● And how the cacheline is being accessed (read or write)●Disassemble the binary to find the ip, and track back to the sources.
=========================================================================================== Cache CPU # Refs Stores Data Address Pid Tid Inst Address Symbol Object Participants=========================================================================================== 0 118789 273709 0x602380 37878 17734 136078 0x602380 37878 37878 0x401520 read_wrt_thread a.out 0{0} 13452 137631 0x602388 37878 37883 0x4015a0 read_wrt_thread a.out 0{1} 15134 0 0x6023a8 37878 37882 0x4011d7 reader_thread a.out 1{5} 14684 0 0x6023b0 37878 37880 0x4011d7 reader_thread a.out 1{6} 13864 0 0x6023b8 37878 37881 0x4011d7 reader_thread a.out 1{7}
1 31 69 0xffff88023960df40 37878 13 69 0xffff88023960df70 37878 *** 0xffffffff8109f8e5 update_cfs_rq_blocked_load vmlinux 0{0,1,2}; 1{14,16} 17 0 0xffff88023960df60 37878 *** 0xffffffff8109fc2e __update_entity_load_avg_contrib vmlinux 0{0,1,2}; 1{14,16} 1 0 0xffff88023960df78 37878 37882 0xffffffff8109fc4e __update_entity_load_avg_contrib vmlinux 0{2}

Performance Tools - Tuna
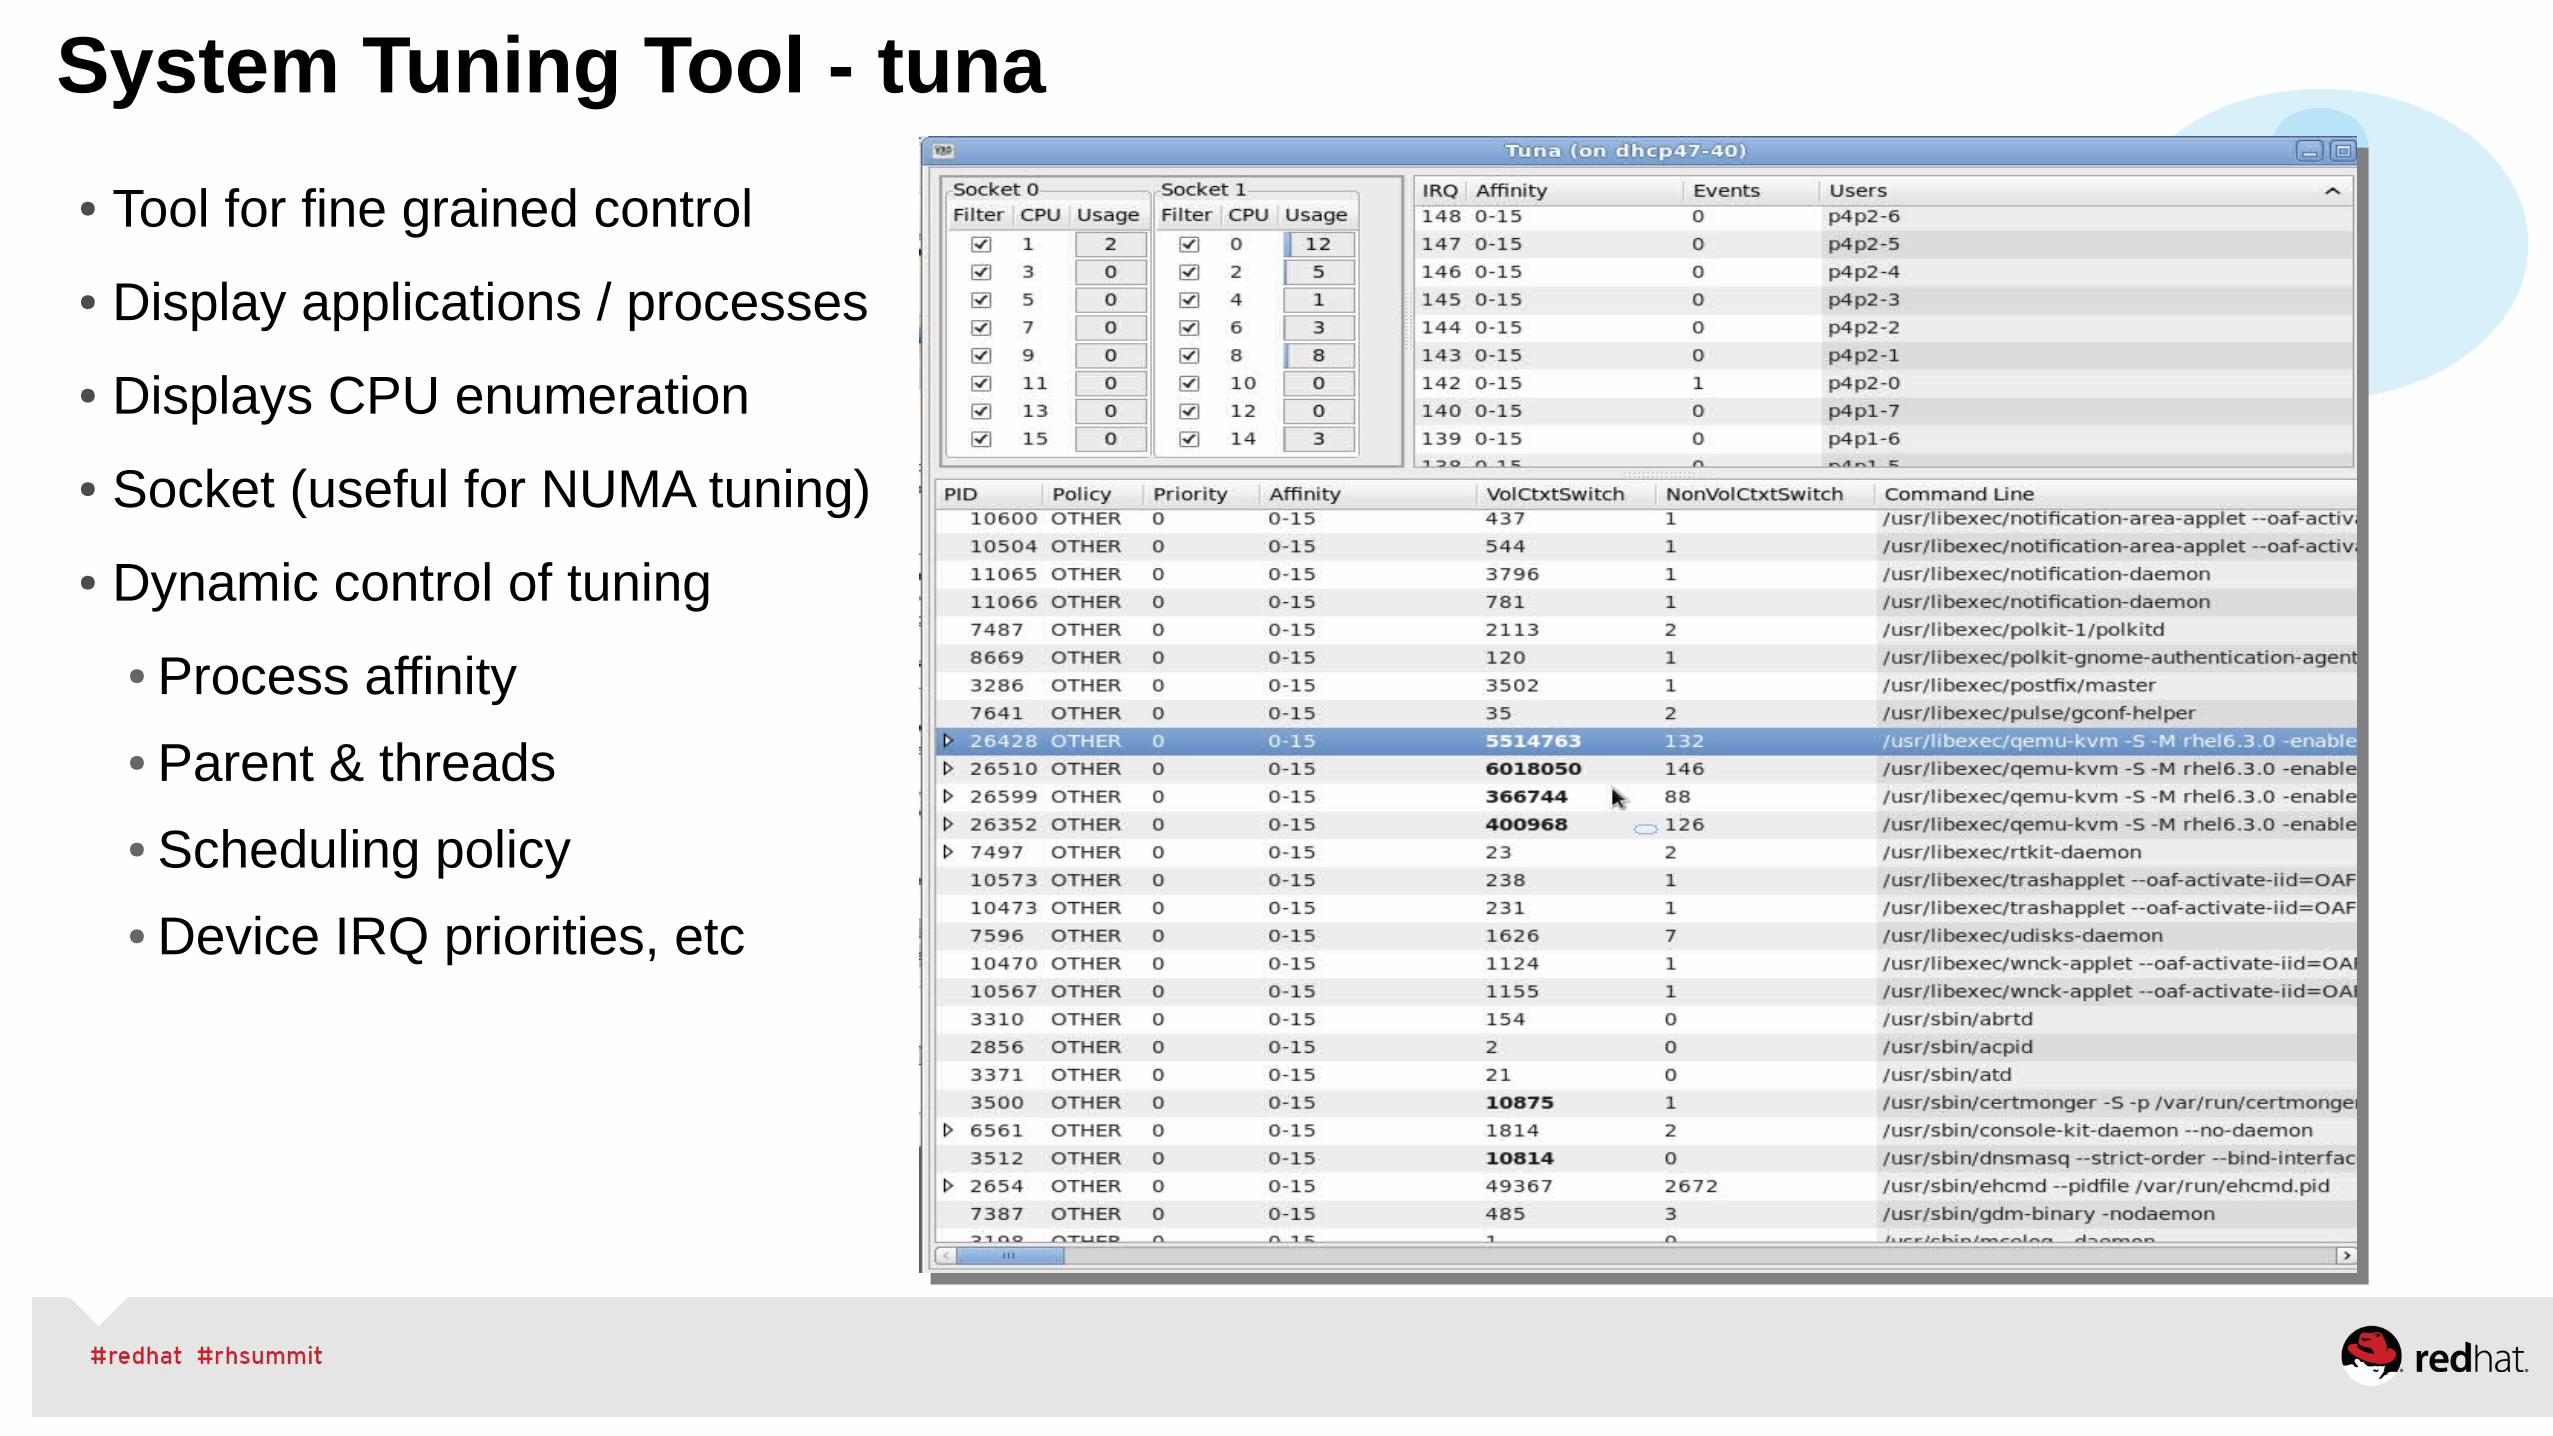
System Tuning Tool - tuna
● Tool for fine grained control
● Display applications / processes
● Displays CPU enumeration
● Socket (useful for NUMA tuning)
● Dynamic control of tuning
● Process affinity
● Parent & threads
● Scheduling policy
● Device IRQ priorities, etc
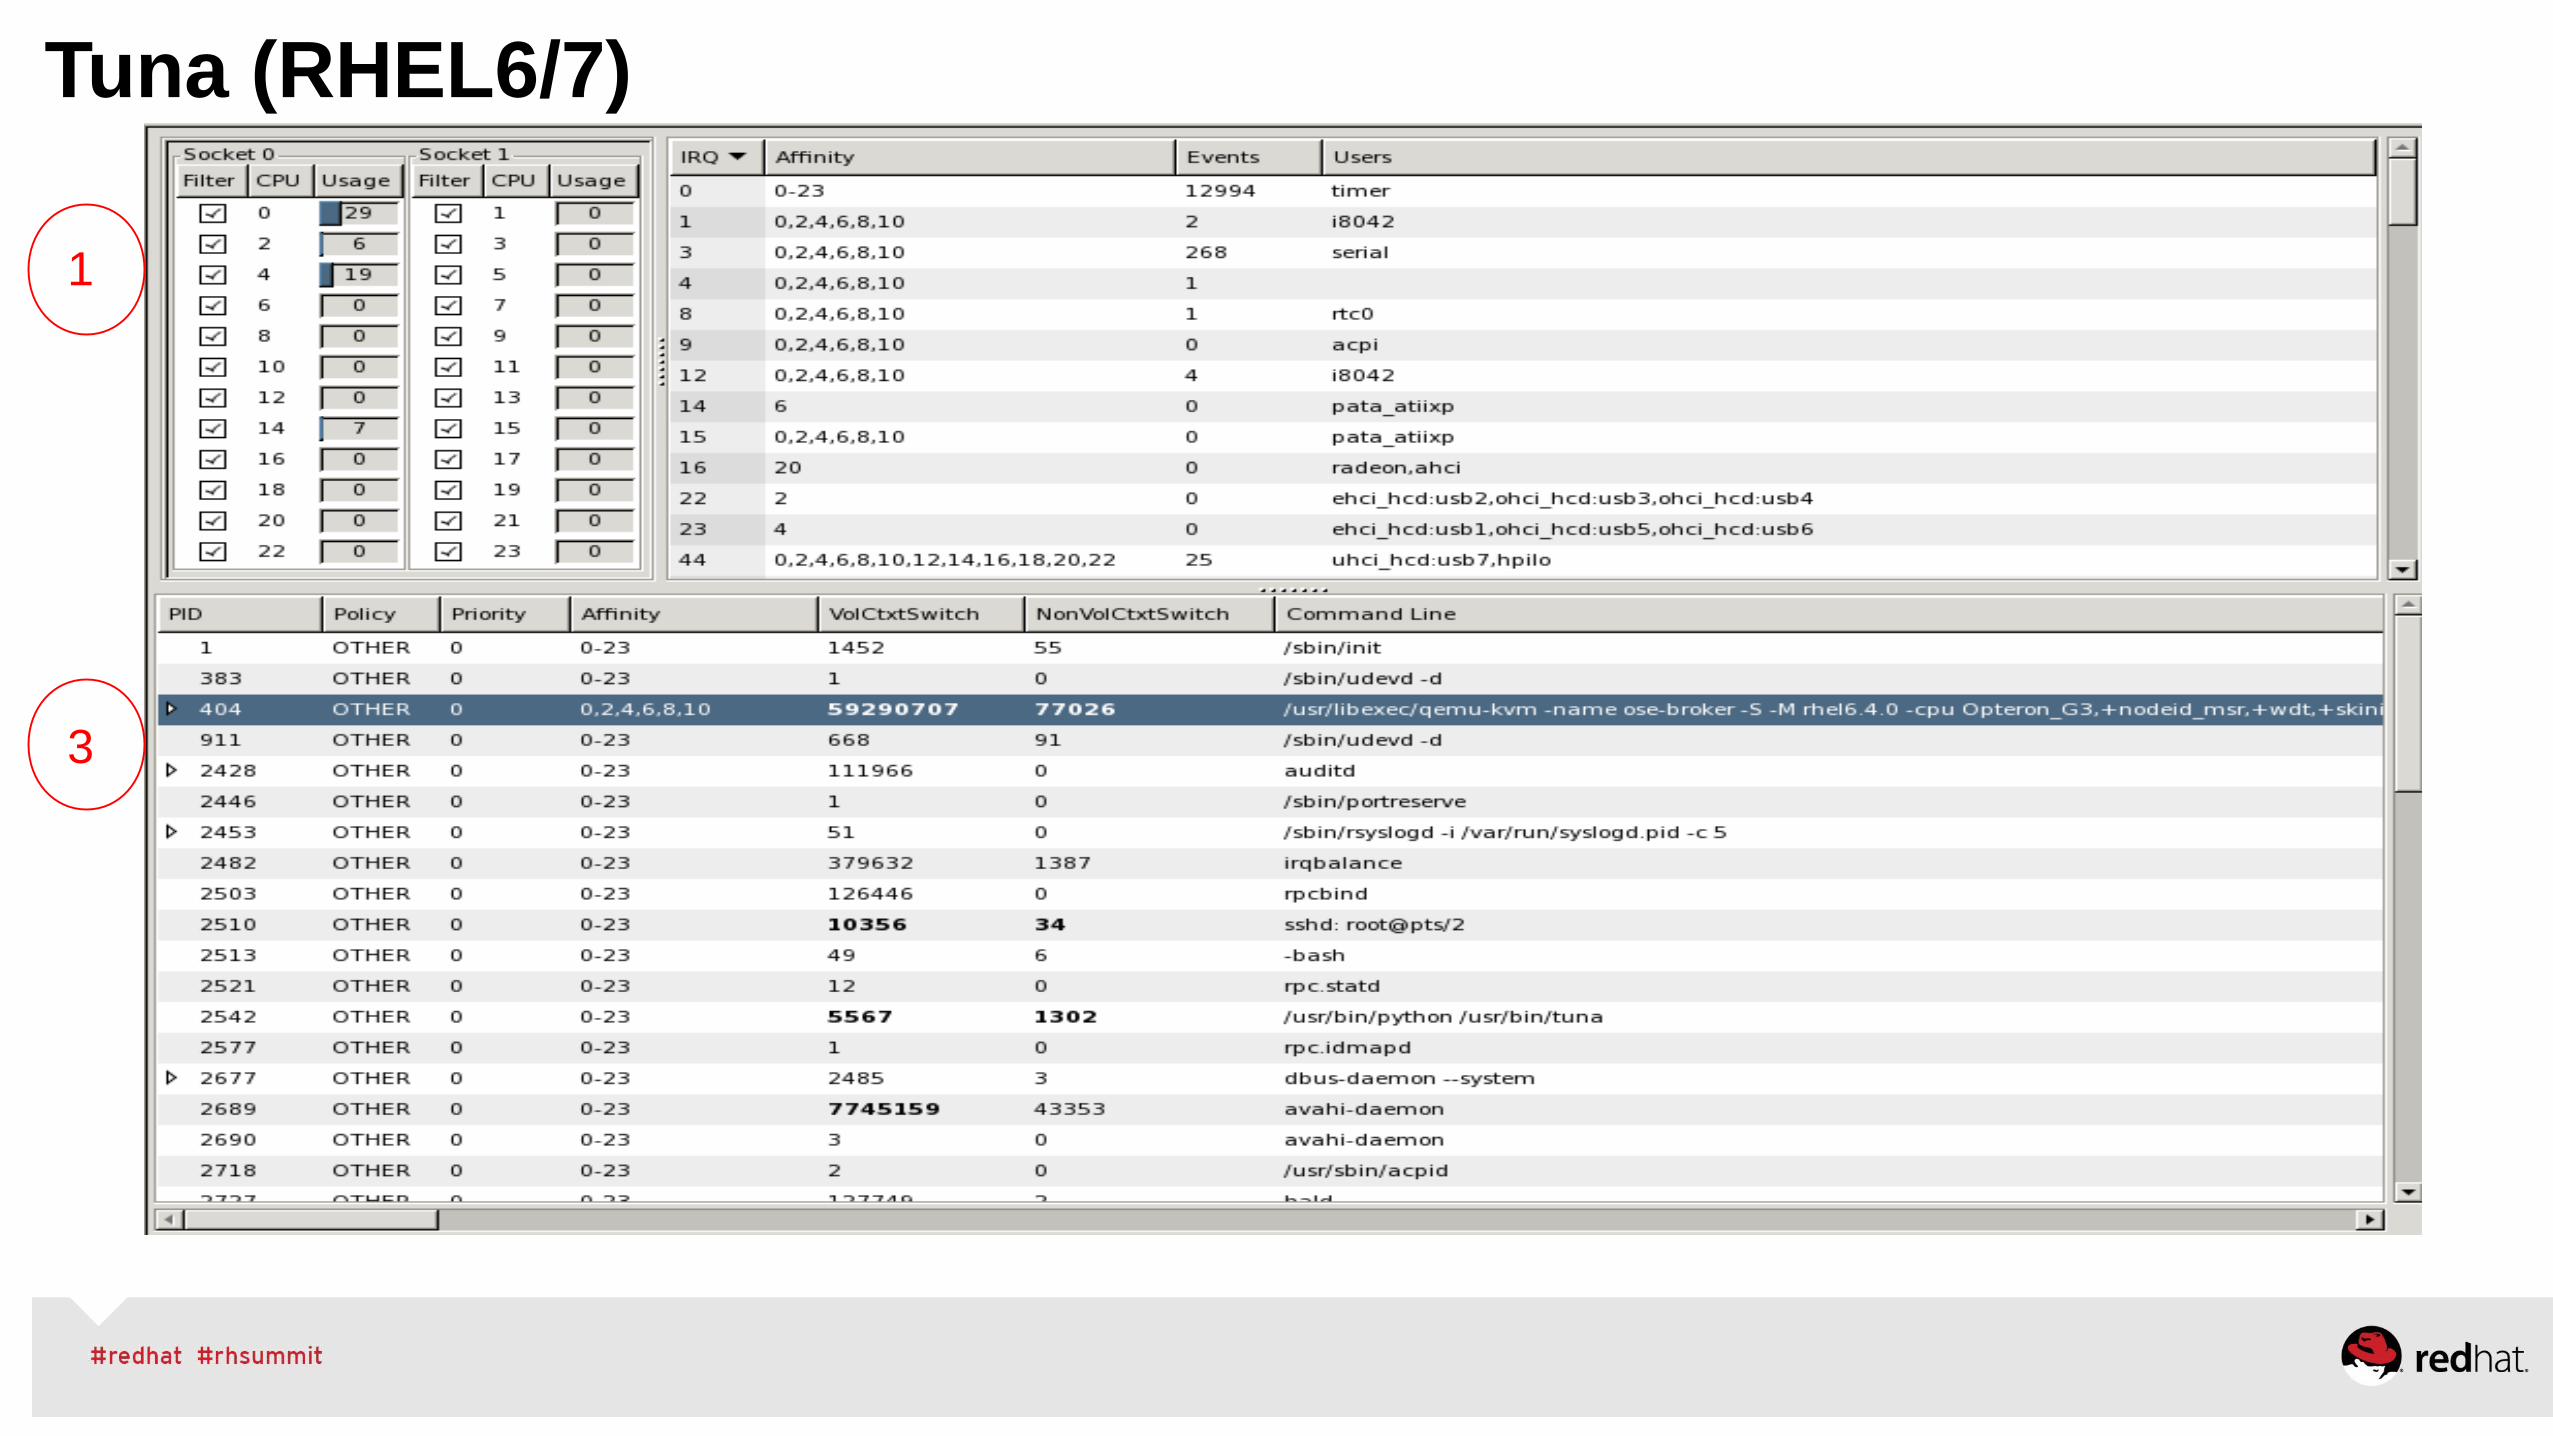
Tuna (RHEL6/7)
1
3
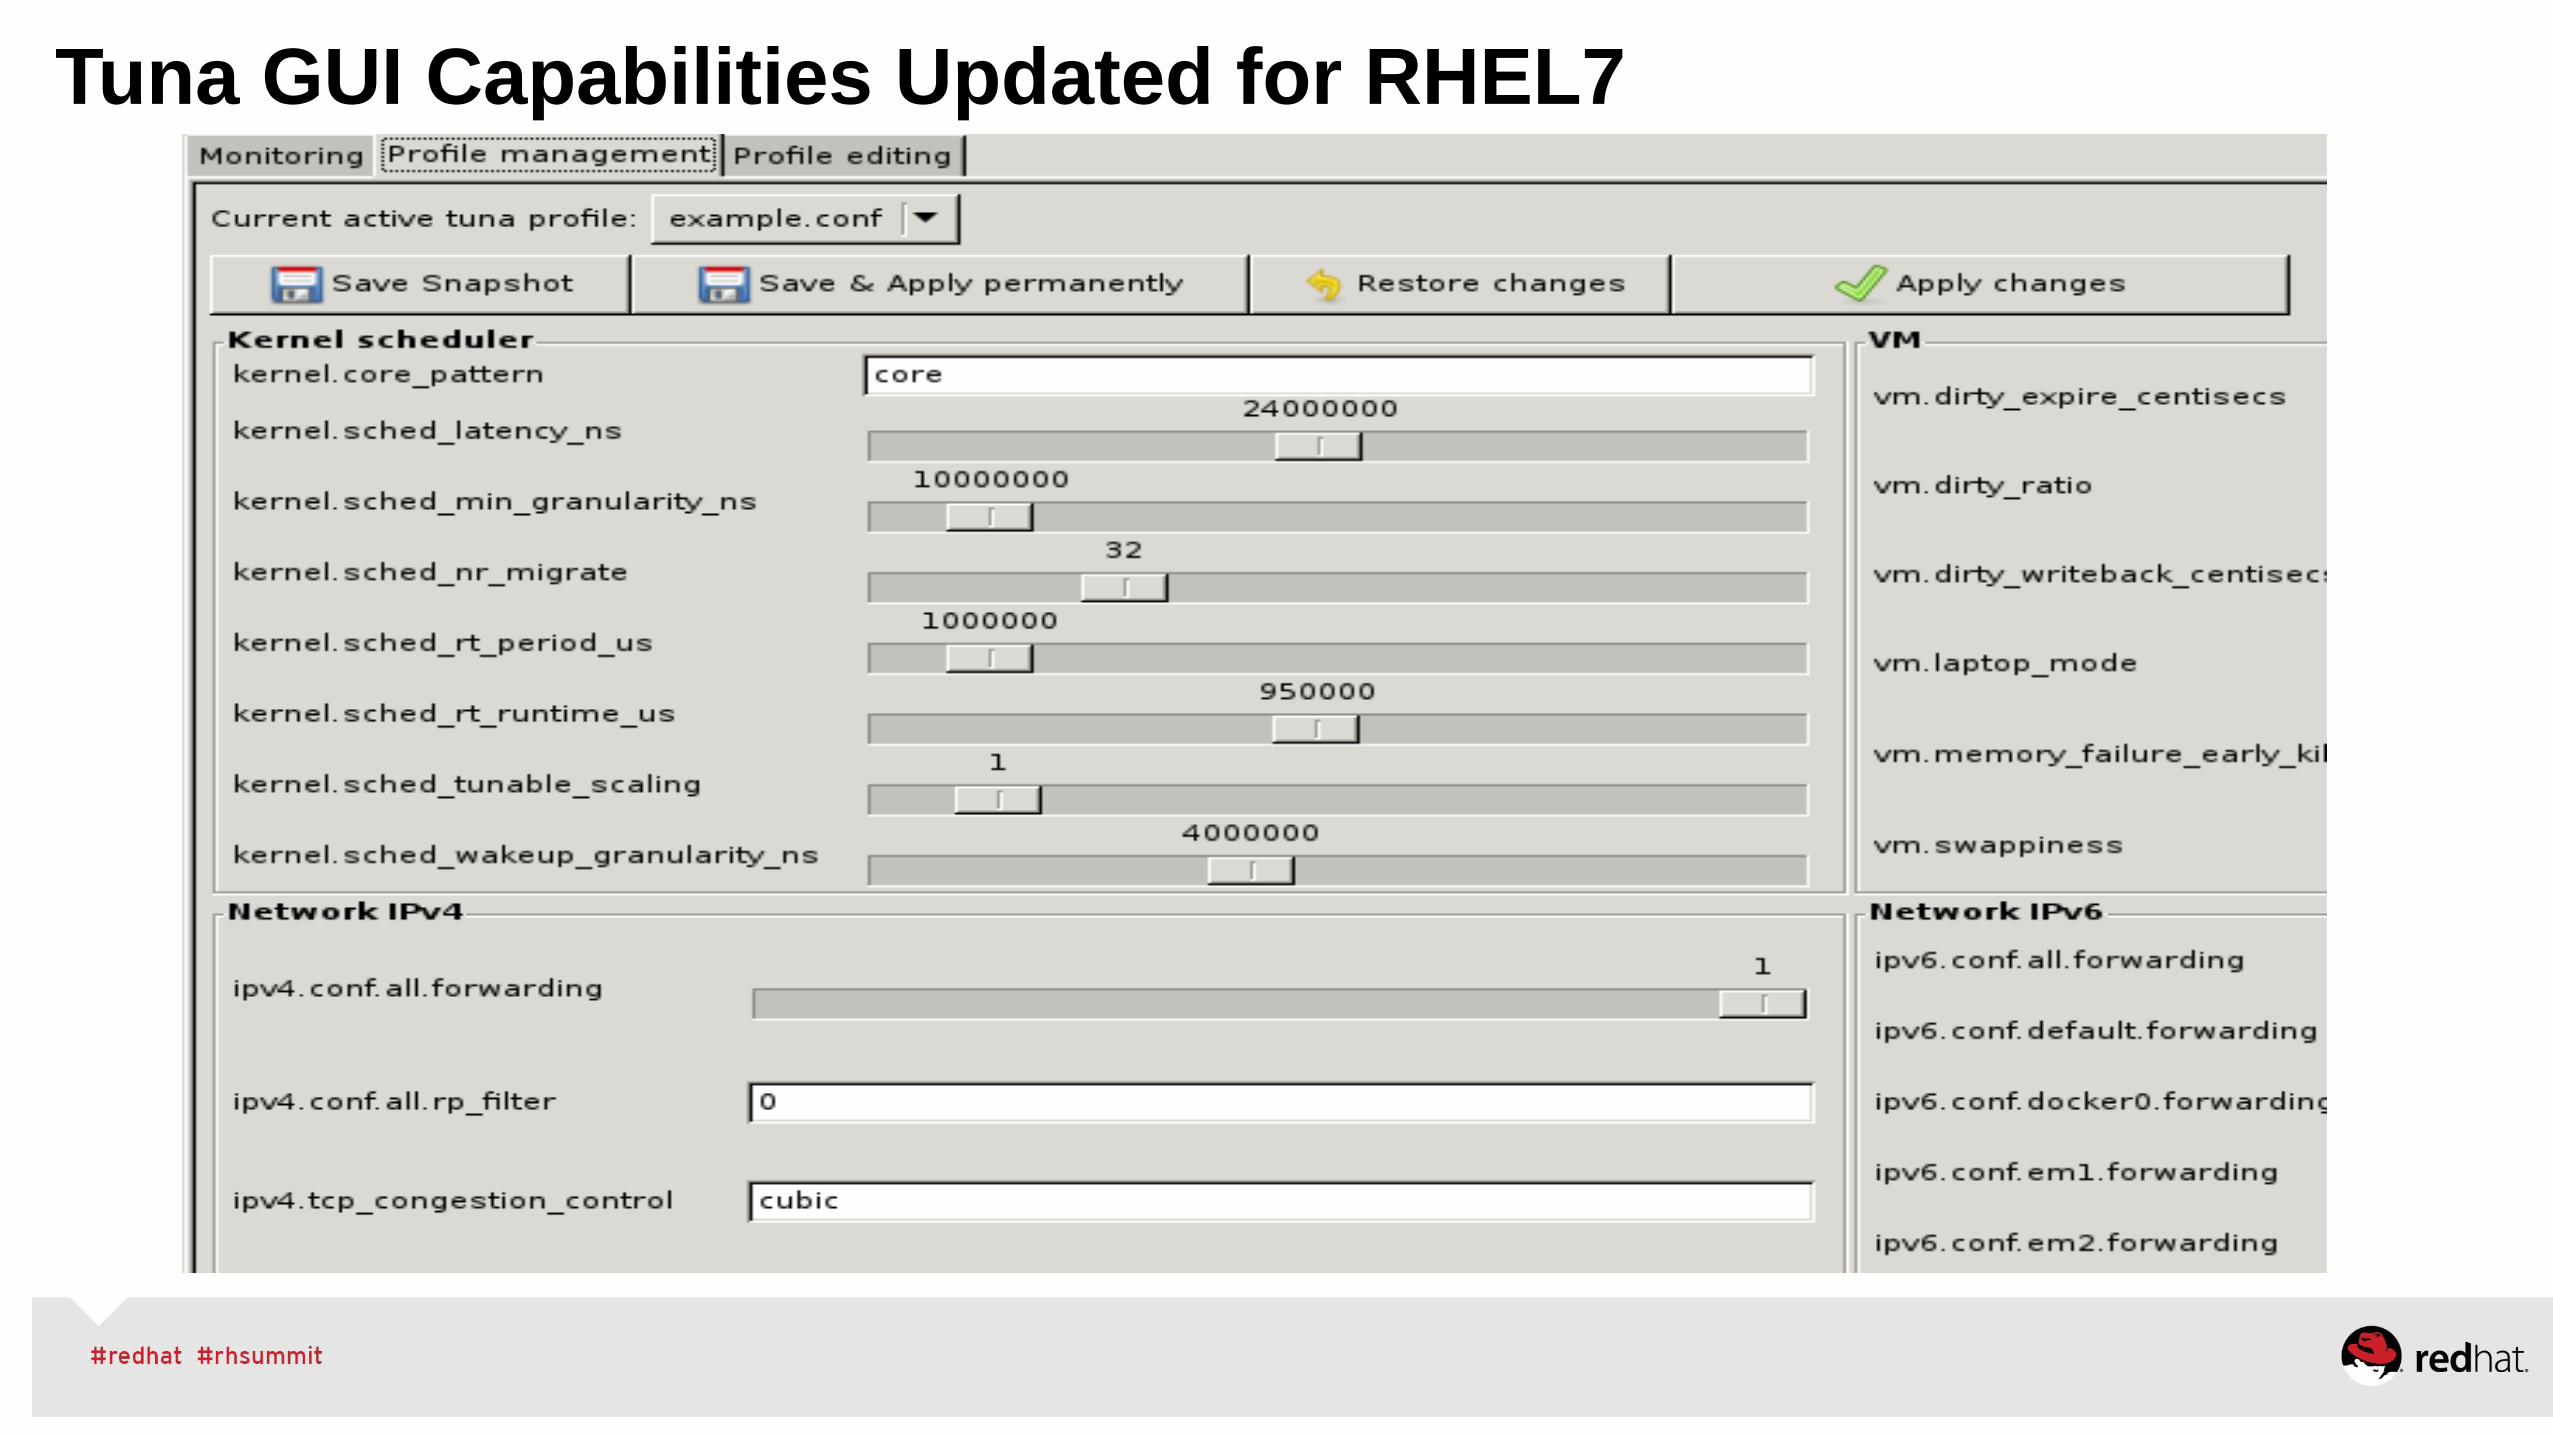
Tuna GUI Capabilities Updated for RHEL7