Embed Size (px)
Citation preview

188
CHAPTER - 6
PERFORMANCE ANALYSIS OF PRIVATE SECTOR BANKS IN INDIA
(In First and Second generation reform period-1991-92 to 2003-04)
We have discussed about the performance of public sector banks in the
chapter five with analysis of all the financial performance indicators and
parameters and found that the public sector banks have made significant
progress in First as well as Second generation reform period from the year
1991-92 to 2003-04. Now we will analyse the performance of private sector
banks in India during the above mentioned period and see the comparative
picture of public sector banks and private sector banks.
6.1 INTRODUCTION
This section is devoted to evaluate the performance of domestic private
sector banks during the period 1992-93 to 2002-03 in which reform measures
are under implementation. The same parameters are used to measure the
efficiency and profitability of private sector banks, which are used for Public
Sector Banks.
This section is also divided in to Three Parts, as was done in the
previous Section. Part -I deals with the evolution of domestic private sector
banks in India. Part-II analyses the performance of private sector banks-old
and new-during the study period 1992-93 to 2002-03.and Part-III is devoted to
period-wise analysis of performance of Private Sector Banks in terms of
efficiency and profitability. Grouping of banks is done on the basis of
composite score arrived at through principle component analysis. The list of
Private Sector Banks is as follows:
189
Old Private Sector Banks
1. Bank of Rajasthan Ltd.
2. Catholic Syrian Bank Ltd. 3. City Union Bank Ltd. 4. Dhanalakshmi Bank Ltd. 5 Federal Bank Ltd. 6. ING Vysya Bank Ltd. 7. Jammu and Kashmir Bank Ltd. 8. Karnataka Bank Ltd. 9. Karur Vysya Bank Ltd. 10. Lakshmi Vilas Bank Ltd.
New Private Sector Banks 1. Bank of Punjab Ltd. (since merged with Centurian Bank) 2. Centurian Bank of Punjab (since merged with HDFC Bank) 3. Development Credit Bank Ltd. 4.HDFC Bank Ltd. 5.ICICI Bank Ltd. 6.IndusInd Bank Ltd. 7.Kotak Mahindra Bank Ltd. 8.Axis Bank (earlier UTI Bank) 9. Yes Bank Ltd.

190
6.2 PRIVATE SECTOR BANKS-EVOLUTION
Historically, the private sector banks played a crucial role in the growth
of joint stock banking in India. The first half of the 20th century witnessed
phenomenal growth of private sector banks. As a result in 1951, there were
566 private banks of which 474 were non-scheduled and 92 scheduled
classified on the basis of their capital size. The role of private sector banking
started declining when the Government of India entered banking business
with the establishment of State Bank of India in 1955 and subsequently two
rounds of bank nationalization one in July 1969 (14 major banks), another in
April 1980 (take over of 6 banks). Consequently, the presence of public sector
banks has increased.
At present, there are 32 private banks comprising of 24 old banks,
which existed prior to 1993-94 and eight new private banks, which were
established during 1993-94 and onwards after the RBI announced guidelines
in January 1993 for establishment of new banks in private sector following the
recommendations of Narasimham Committee-I (1991). Compared to New
private sector banks, the old banks are smaller in size. For example, at end
March 2000, the average net worth of the 24 Old Private Banks (OPBs) was
Rs.179.67 Crore per OPB compared to that of the New Private Bank (NPB) at
Rs. 479.88 Crore per NPB. The OPBs are essentially regional in character
although some of them have scattered presence in areas other than in and
around the areas of their origin. The number of branches of the NPBs was
999 at end March 2003, while those of OPBs 3491. The NPBs are extremely
cautious in expanding their branch network and business because their
managers, mostly drawn from the public sector banks, know very well the ills
of unbridled expansion of branches by public sector banks in the post-
nationalization era.
The Narasimham Committee-I, that advocated competition in the
banking industry, made unequivocal recommendation to allow private and
foreign banks into the industry. Acting on the recommendations of the
committee, the RBI laid down guidelines for the establishment of the private

191
sector banks on January 1993. The guidelines prescribed that the private
banks should be established as public limited companies under the Indian
Companies Act: 1956. The paid-up capital shall not be less than Rs. 100
Crore. The new guidelines issued in 2001 raised the minimum paid-up capital
to Rs. 200 Crore, which shall be enhanced to Rs. 300 Crore within three
years after the commencement of business. The promoters' share shall not
be less than 40 per cent and the voting right of a shareholder shall not exceed
10 per cent. The new banks should avoid shortcomings such as unfair pre-
emption, concentration of credit, cross-holding of industrial groups, etc. Those
banks which intent to establish main office in a center where no banking is
having such office is to be preferred. These banks are required to observe
priority sector lending targets as applicable to other domestic banks. The
guidelines aim at ensuring that the new entrants are ab initio financially viable
and technologically up-to-date. While granting approvals for OPBs, one of the
considerations before the RBI was that the new banks would start functioning
in a professional manner giving clear signals to the effect that would improve
the image of commercial banking system and give confidence to the
depositing public.
Accordingly, nine banks were set-up in private sector including some by
development financial institutions. Prominent among them are ICICI Bank,
GTB, HDFC and IDBI bank. Another interesting development was merger of
some banks. Bareily Corporation Ltd merged with Bank of Baroda in 1999,
Times Bank merged with HDFC Bank in 1996, Bank of Madura Ltd merged
with ICICI bank in 2001 and Nedungadi Bank Ltd merged with Punjab
National Bank in 2003. With regard to branch expansion, banks attaining
capital adequacy norms and prudential accounting standards can set up new
branches without the prior approval of RBI. Banks have the freedom to
rationalize their existing branch network by relocating branches, opening of
specialized branches, spinning off business, setting up of controlling offices,
etc.
In terms of size, there are Goliaths and Davies among the banks. On one
extreme, there is the omnipresent big bank like the SBI (Public Sector Bank)

192
with 9017 branches. On other extreme, there is the small private sector bank;
the Ganesh Bank of Kurundwad Ltd. located in an obscure town in
Maharashtra operating with only 30 branches. The youngest bank is the
United Bank of India established in 1950. It has been struggling to improve its
market share. The Benares State Bank Ltd. is the oldest. bank established in
1871 in the holy city of Varanasi. It remained smaller in size compared to the
youngest NPBs. The Bharat Overseas Bank Ltd, which came into being in
1973 is the only private bank having a branch abroad. Between the two
extremes, there are 21 banks, which are regional in character and operate
with different levels of efficiency.
The New Private Sector Banks started publishing balance sheets since
1995-96. In that year the share of OPBs in total assets was 6.2 per cent while
that ofNPBs was 1.4 per cent. The NPBs had improved their market share to
5.3 per cent by 1999-2000 at the cost of PSBs. The share of private sector
banks in the total number of branches in 1992-93 was only 8.33 percent. In
2002-03, the share of private sector banks in total bank branches is 8.75 per
cent. Table 6.1 shows the trend in the number of branches of PBs , during the
period 1992-93 to 2003.
The Table 6.1 reveals that the number of branches of old private sector
banks which increased up to 1997-98, showed a fluctuating trend since then.
There has been a little more than 10-fold increase in the number of branches
of NPBs representing an average growth rate of 45.46 per cent.
Table 6.1 Trend in Number of Branches of Private Banks: 1992-2003
Year OPBs NPBs PBs 1992-93 3867 - 3867
- - - 1993-94 3993 - 3993
(3.26) - (3.28) 1994-95 4087 - 4087
(2.35) (2.35) 1995-96 4233 82 4315

193
(3.57) (-) (5.58) 1996-97 4336 137 4473
(2.43) (67.07) (3.66) 1997-98 4437,' 227 4684
(2.33)" (65,69) (4.72) 1998-99 4154 345 4499
(-6.38) (51.98) (-3.95) 1999-2000 4237 460 4697
(2.00) (33.33) (4.40) 2000-01 4266 836 510
(0.68) (81.74) (8.62) 2001-02 4323 988 5311
(1.34) (18.18) (4.10) 2002-03 391 990 4481
(-1 .25) (0.20) (-15.63) Average (-1.25) (45.46) (2.50)
Note : Figures in parentheses indicate Growth rate over previous years.
Source: Compiled from various issues of Statistical Tables and Data Base published by IBA, Mumbai.
Table 6.2 shows the number of employees OPBs and NPBs during the study period.
Table 6.2 Trends in Number of Employees in PBs during 1992-2003
Year OPBs NPBs PBs 1992-93 53,705 - 53,705
(-) (-) 1993-94 54,124 - 54,124
(0.78) (0.78) 1994-95 54,849 - 54,849
(1.34) (1.34) 1995-96 57,241 1620 58,861
(4.36) (-) (7.31) 1996-97 57,941 2719 60,660
(1.22) (67.84) (3.06)
1997-98 58,636 3705 62,341 (1.20) (36.26) (2.77)

194
1998-99 55,458 5,232 60,717 (-5.42) (41.21) (-2.61)
1999-2000 55,181 7,344 6,525 (-0.50) (40.34) (2.98)
2000-01 55,083 12,480 67,563 (-0.18) (69.93) (8.06)
2001-02 54,894 18,202 73,096 (-0.34) (45.85) (8.19)
2002-03 47,089 18,766 65,855 (-14.22) (3.10) (-9.91)
Average (-1.18) (39.22) (2.20)
Note : Figures in parentheses indicate Growth rate over previous years.
Source: Compiled from various issues of Statistical Tables and Data Base published by IBA, Mumbai.
The table 6.2 reveals that,there had been year-to-year variation in the number
of employees of OPBs, the highest number was found in 1997-98 and the
lowest in the concluding year of the study period. On the whole it appears that
these banks had not been able to slash down the number of employees. The
employees of NPBs had increased from 1620 in 1995-96 to 18,766 in 2002-03
with an annual average 39.22, growth rate of 38.81 per cent.
Table 6.3 Trends on Net Profit of PBs : 1992-93 to 2002-03
Year OPBs NPBs PBs 1992-93 61 -- 61
(-) (-) 1993-94 130 -- 130
(113.11) (113.11) 1994-95 359 -- 359
(176.15) (176.15) 1995-96 377 165 543
(5.01) (-) (51.25)
1996-97 406 279 685 (7.69) (69.04) (26.15)

195
1997-98 442 397 840 (8.87) (42.29) (22.63)
1998-99 302 369 671 (-31.67) (-7.05) (-20.12)
1999-2000 597 569 1167 (97.68) (54.20) (73.92)
2000-01 516 639 1155 (-13.57) (12.30) (-1.04)
2001-02 1004 707 1711 (94.57) (10.64) (48.13)
2002-03 1233 1726 2959 (22.80) (144.13) (72.94)
Average (48.06)) (46.51) (56.31)
Note : Figures in parentheses indicate Growth rate over previous years.
Source: Compiled from various issues of Statistical Tables and Data Base published by IBA, Mumbai.
Table 6.3 represents the net profits made by OPBs and NPBs in
different years during the period under study. The data relating to profits of
OPBs showed a fluctuating trend. The net profits have started increasing from
the third years till 1997-98. The year 1998-99 was a bad year for OPBs. The
last two years appear to be excellent years as these banks made high level of
profits, which they never earned previously. The profit of OPBs is increasing
at an average annual growth rate of 48.06 percent. In the case of NPBs the
data of net profit show continuous increase with annual average growth rate
of 46.51 per cent.
6.3 FOREIGN INVESTMENTS
The Government has been pursuing an open door policy and opened
the flood gates for the inflow of foreign capital in the form of FOI, investments
by foreign institutional investors and NRI's in the banking sector too. Foreign
investments in private banks from all sources (FOI, FIl, NRI) , which was
limited to 49 per cent of the capital but now raised to 74 percentfacilitating
setting up of subsidiaries of foreign banks and attracting investment in private

196
sector banks. The new private sector banks are allowed to raise capital
contribution from foreign institutional investors up to 20 per cent and from
NRIs up to 40 percent of their share capital. Promoter’s stake in Indian banks
is currently limited to 49 per cent. While issuing licenses the RBI has
instructed those promoters of private banks who held a higher holding than
the prescribed limit to divest their stake and bring it down to 49 per cent.
Indian promoters argue that such discrimination may make Indian private
banks vulnerable to take-over by foreign banks. It is hoped that the limit to
Indian promoters holding will be raised to 74 per cent as is done for FOI. The
guidelines issued by RBI in this regard are:
(a ) At all times a minimum of 26 per cent of the paid up capital of
private banks has to be held by residents,
(b) Holdings of a single entity or a group of related entities is cashed at
10 per cent,
(c) FIIs are at present permitted to invest up to 10% each in a bank
with a cap of 24 per cent for all FIIs put together. This can however be raised
to 49 per cent with the approval of the board general body concerned.
The increase in foreign investments limit in private banks will have
serious repercussions to Indian interests. It will enable foreign partners to
increase their stake and acquire management control over Indian banks. Of
course presently there is a cap on voting rights of any person to 10 per cent in
private sector, irrespective of his shareholdings. It means that even if an entity
holds more than 10 per cent stake in a bank, its voting rights are capped to
just 10 per cent in private sector. But there is a proposal to amend the
Banking Regulation Act to remove this cap. With direct foreign investment up
to 74 per cent, the so-called Indian private sector banks may opt collaboration
or joint venture which will become Joint sector institutions between Indian
investor and foreign investors. If the cap on voting right is removed, the
foreign investors will surely obtain management control over Indian banks.
The Indian Banks with low capital adequacy ratio will have the option to
raise capital from overseas investors. Presently, Indian banks, which can offer
stake to foreign investors, are lnduslnd Bank, Bank of Punjab. Banks like ING
197
Vysya and Centurion Bank may further increase the stake of foreign investors.
6.4 PERFORMANCE EVALUATION OF PRIVATE SECTOR BANKS
The performance of 16 Old Private Banks (OPBs) and 8 New Private
Banks (NPBs) is evaluated during the reform period. The 8 new private banks
as has already been stated, came into existence after 1992-93 and the
financial results of these banks are published from 1995-96. Hence, their
performance analysis rebates to the period 1995-96 to 2002-03. Only 16 old
private sector banks are considered for the analysis, leaving those banks,
which are merged with others, Bank of Mathura Ltd. (2001), Bareily
Corporation Bank Ltd. (1999), The Banaras State Bank Ltd. (2002), The
Nedungadi Bank Ltd. (2003) and those banks whose total assets are less
than Rs. 100 Crore. The New Private Banks which are included for evaluation
are Bank of Punjab Ltd., Centurion Bank Ltd., Global Trust Bank Ltd., HOFC
Bank Ltd., ICICI Bank Ltd., OBI Bank Ltd., Industrial Bank Ltd' and UTI Bank
Ltd.(now AXIS Bank Ltd ).
A. The parameters elected for evaluation of efficiency of PBs are:
1) Business per Branch,
2) Operating expenses per Branch,
3) Profit per Branch,
4) Business per Employee,
5) Establishment expenses per Employee, and
6) Profit per Employee
B. The parameter selected for profitability analysis are:
1) Return on Assets,
2) Return on Equity,
3) Net interest Margin as a percentage of working funds,
4) Non-Interest Income as a percentage of Total Income, and
5) Credit-Deposit Ratio.

198
EFFICIENCY INDICES (A) EFFICIENCY AT BRANCH LEVEL
6.4.1. BUSINESS PER BRANCH
The Business per branch on which normally profitability rests is a
crucial parameter to judge the efficiency of banks. If the business per branch
grows year after year at an increased rate one can assume that the standing
of the bank in the market has been improving. In the Table 6.4 the business
per branch of 24 PBs including eight new private sector banks for the study
period is exhibited. The data for NPBs are available from 1995-96.
When the growth of business per branch of OPBs is taken into
consideration, it is found that the rate of growth was slow in the first two years,
ie. 1992-93 and 1993-94 but picked up in 1994-95 and accelerated from
1997-98. In the last two years of the study period deposit mobilization must be
considered excellent Rs. 2904 lac in 2001-02 and Rs. 4034 lac in 2002-03.
The average business per branch of OPBs for the entire period was Rs.
1794.45 lac and a staggering amount of Rs. 15,579.15 lac for NPBs. The
growth rate of business per branch of OPBs was 15.66 per cent and that of
NPBs was 4.02 per cent.
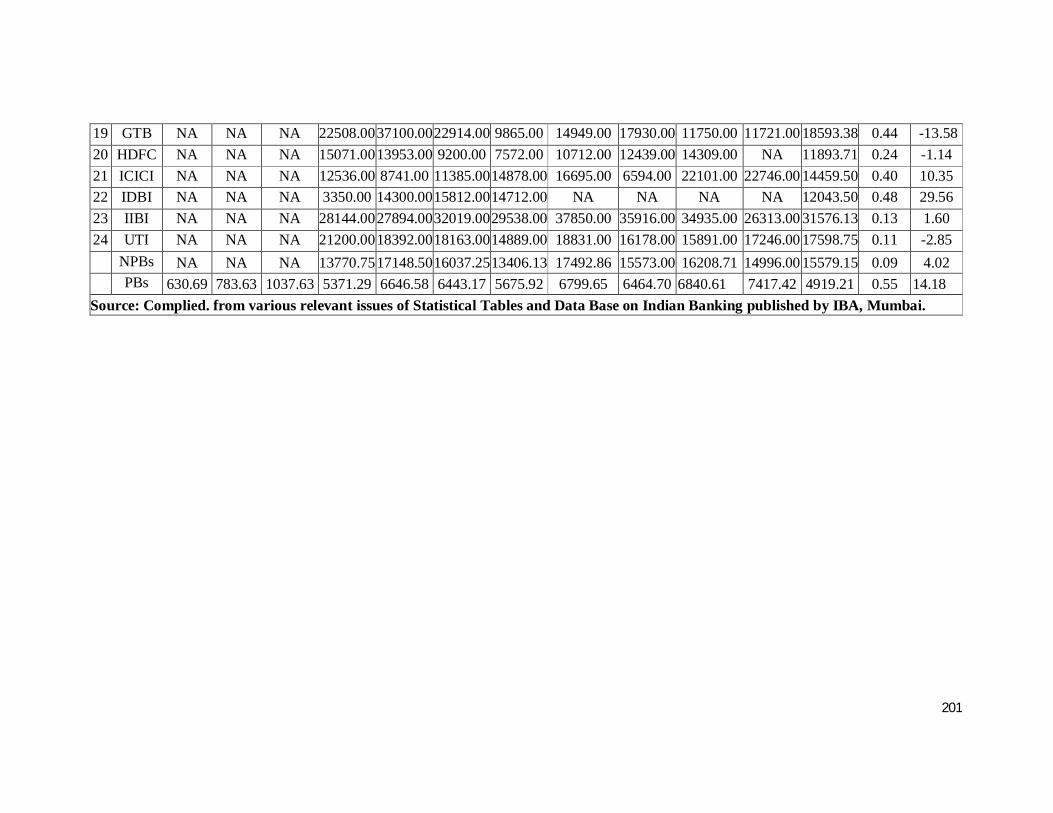
When business per branch of private sector banks is compared with
that of Public Sector Banks, it is found that PBs are head and shoulder above
PSBs. The lead was taken over by NPBs. The average business per branch
of PBs was Rs. 7417.42 lac while that of PSBs was 1961.18 lac. When
compare the mean values of different PBs, it was found that IIBL (Rs.
31,576.13 lac); GTB (Rs. 18,593.38 lac) and UTI(now Axis) (Rs. 17,598.75
lac) obtained first three ranks with highest business per branch while SBL (Rs.
837.36 lac), CSBL (Rs. 971.20 lac) and DBL (Rs. 1091.45 lac) secured the
least three ranks.
Inter-bank analysis reveals that the growth ,rate among PBs with

199
regard to Business per branch is highest in IDBI (29.56) per cent), PBL (28.39
per cent) and LKBL (19.75 per cent) which occupy the top three ranks while
GTB (-13.58 per cent); UTI (-2.85 per cent) and HDFC (-1.14 per cent) were
in the bottom. Variations in CV are not significant among different PBs with
regard to Business per branch.
6.4.2. OPERATING EXPENSES PER BRANCH
The Operating expenses per branch are shown in Table 6.5. The
average operating expenses per branch of OPBs was Rs. 30.08 lac while that
of NPBs Rs. 225.64 lac. The NPBs have drawn their employees from public
sector banks paying them huge salaries because of their rich experience in
credit appraisal and disbursal. Hence, the operating expenses of NPBs were
higher than those of OPBs. The operating expenses per branch of OPBs was
Rs.16.64 lac in 1992-93 which increased to Rs. 56.05 lac in 2002-03, above
3.5 times. The New private sector banks started with operating expenses per
branch of Rs. 262.67 lac in 1995-96 and it decreased to Rs. 243.40 lac in
2002-03.
When the mean value of operating expenses per branch of PBs is
compared with those of PSBs, it is observed that the expenses of PBs are on
the higher side-Rs. 76.56 lac. It means the operating expenses of PBs are
proportionately higher than those of PSBs as they procured a higher amount
of business per branch than the PSBs.
Inter-bank analysis, on an average with regard to this indicator showed
that CSBL (Rs. 20.~ lac), SBL (Rs. 20.18 lac) OBL (Rs. 19.80 lac); are
occupied top three ranks with lowest operating expenses per branch while
IIBL (Rs. 303.90 lac); GTB (Rs. 278.06 lac) and HDFC (Rs. 237.63 lac) were
in the bottom with highest expenses.
IDBI (-13.49 per cent); followed by GTB (-11.60 per cent) and IIBL (-
4.39 percent) have registered lowest growth rate indicating better
performance while KBL (22.90 per cent); DBL (14.80 per cent) and KBL
(14.32 per cent) have registered highest growth rate.
There exist marginal differences in C.V. with regard to this indicator,
indicating high stability among the banks.

200
TABLE 6.4 BUSINESS PER BRANCH OF PBS : 1992-03
(Rs. in Lacs)
No Name 1992-93
1993-94 1994.95 1995.96 1996-97 1997-98 1998-99 19992000 200001 200102 200203 19922003
Mean CV GR (1) (2) (3) (4) (5) (6) (7) (8) (9) (10) (11) (12) (13) (14) (15) 1 BOBL 1376.001488.00 1854.00 1969.00 2172.00 2644.00 2708.00 2758.00 3110.00 3448.00 4180.00 2518.82 0.34 10.01 2 CUBL 478.00 583.00 759.00 977.00 1264.00 1597.00 1803.00 1935.00 2189.00 2530.00 2871.00 1544.18 0.52 15.60 3 IVBL 1322.001662.00 244500 2043.00 2197.00 2874.00 2491.00 3014.00 3304.00 3355.00 3989.00 2608.73 0.30 8.68 4 LKBL 216.00 361.00 565.00 931.00 1383.00 1442.00 1381.00 1824.00 2266.00 2558.00 NA 1292.70 0.61 19.75 5 TMBL 680.00 91800 1207.00 1304.00 1411.00 1711.00 2102.00 2497.00 2991.00 337600 NA 1819.70 0.49 15.96 6 BOAL 635.00 790.00 1079.00 1316.00 1489.00 1426.00 1461. 1603.00 1745.00 1908.00 2238.00 1426.36 0.33 9.58 7 CSBL 465.00 564.00 648.00 808.00 896.00 1028.00 1092.00 1239.00 1422.00 1550.00 NA 971.20 037 12.30 8 DBL 253.00 357.00 564.00 826.00 1130.00 1099.00 1236.00 1451.00 1572.00 1683.00 1835.00 1091.45 0.49 14.65 9 FBL 757.00 104300 1246.00 1646.00 2041.00 2107.00 2746.00 2599.00 3036.00 3411.00 4087.00 2247.18 0.46 13.80
10 JKBL 987.00 1061.00 1146.00 1335.00 1647.00 2120.00 2415.00 3203.00 4306.00 5048.00 4997.00 2569.55 0.61 17.68 11 KBL 483.00 595.00 753.00 1027.00 1294.00 1613.00 1902.00 2197.00 2515.00 2918.00 1311000 2582.55 1.39 28.39 12 KVBL 492.00 712.00 1144.00 1096.00 1311.00 1655.00 1973.00 2389.00 2849.00 3445.00 3956.00 1911.09 0.59 17.42 13 LVBL 344.00 462.00 783.00 736.00 868.00 1089.00 1078.00 1519.00 1798.00 1916.00 2100.00 1153.91 0.52 1530 14 SBI 451.00 506.00 611.00 688.00 761.00 795.00. 869.00 1009.00 1117.00 1183.00 1221.00 837.36 0.32 9.58 15 SIBI 485.00 587.00 679.00 786.00 929.00 1187.00 1326.00 1628.00 1919.00 2408.00 2676.00 1328.18 0.56 16.45 16 UWBI 667.00 848.00 1119.00 1257.00 1537.00 195J.00 2390.00 3077.00 3538.00 3136.00 3695.00 2110.45 0.53 1553
OPBs 630.69 783.63 1037.63 1171.56 1395.63 1646.13 1810.81 2121.38 2479.81 2742.06 3919.62 1794.45 0.54 15.66 17 BPI NA NA NA 3327.00 7973.00 12267.00 5216.00 7107.00 7127.00 5397.00 5035.00 6681.13 0.40 .2.58 18 CBI NA NA NA 4030.00 8835.00 6538.00 10579.00 16306.00 12827.00 9068.00 6915.00 9387.25 0.41 5.83
201
19 GTB NA NA NA 22508.00 37100.0022914.00 9865.00 14949.00 17930.00 11750.00 11721.00 18593.38 0.44 -13.58 20 HDFC NA NA NA 15071.00 13953.00 9200.00 7572.00 10712.00 12439.00 14309.00 NA 11893.71 0.24 -1.14 21 ICICI NA NA NA 12536.00 8741.00 11385.00 14878.00 16695.00 6594.00 22101.00 22746.00 14459.50 0.40 10.35 22 IDBI NA NA NA 3350.00 14300.0015812.00 14712.00 NA NA NA NA 12043.50 0.48 29.56 23 IIBI NA NA NA 28144.00 27894.0032019.00 29538.00 37850.00 35916.00 34935.00 26313.00 31576.13 0.13 1.60 24 UTI NA NA NA 21200.00 18392.0018163.00 14889.00 18831.00 16178.00 15891.00 17246.00 17598.75 0.11 -2.85
NPBs NA NA NA 13770.75 17148.5016037.25 13406.13 17492.86 15573.00 16208.71 14996.00 15579.15 0.09 4.02 PBs 630.69 783.63 1037.63 5371.29 6646.58 6443.17 5675.92 6799.65 6464.70 6840.61 7417.42 4919.21 0.55 14.18
Source: Complied. from various relevant issues of Statistical Tables and Data Base on Indian Banking published by IBA, Mumbai.

202
TABLE 6.5 OPERATING EXPENSES PER BRANCH PBS : 1992-03
(Rs. in Lacs)
No Name 1992-93
1993-94 1994.95 1995.96 1996-97 1997-98 1998-99 19992000 200001 200102 200203 19922003
Mean CV GR (1) (2) (3) (4) (5) (6) (7) (8) (9) (10) (11) (12) (13) (14) (15)
1 BOBL 30.00 34.00 38.46 43.64 39.14 43.61 45.07 44.74 53.25 56.96 59.49 44.40 0.21 5.97 2 CUBL 10.59 13.04 12.50 17.35 Q.60 23.75 28.57 28.44 29.82 31.36 32.52 22.59 0.36 10.67 3 IVBL 18.33 21.84 25.39 30.15 33.24 35.49 38.87 46.68 48.54 69.62 89.76 41.63 0.52 14.32 4 LKBL 59.70 7.46 10.14 14.08 17.51 24.05 24.00 25.33 32.50 41.76 NA 27.67 0.57 2.75 5 TMBL 16.26 18.05 22.30 26.62 30.92 32.27 38.19 42.04 43.75 52.76 NA 32.32 0.37 12.04 6 BOAL 15.71 17.44 22.26 24.83 30.20 32.38 39.22 41.29 42.72 46.77 47.32 32.74 0.35 10.51 7 CSBL 11.26 12.35 14.61 17.52 20.65 21.69 22.91 ?8.17 28.52 31.34 NA 20.91 0.34 11.00 8 DBL 7.03 8.33 10.61 15.00 16.78 18.99 20.13 22.67 27.15 33.33 37.74 19.80 0.50 14.80 9 FBL 12.98 14.94 21.41 29.17 29.91 34.85 37.91 43.81 42,58 46.36 52.86 33.34 0.39 11.61
10 JKBL 13.40 15.06 21.73 21.63 25.93 29.53 34.45 39.60 44.59 61.10 57:05 33.10 0.48 14.14 11 KBL 10.62 11.79 15.79 18.58 23.42 25.94 27.22 30.26 29.94 36.69 151.61 34.71 1.14 22.90 12 KVBL 11.95 14.29 17.24 24.31 26.79 32.79 34.65 41.95 47.57 50.71 48.60 31.90 0.44 13.20 13 LVBL 10.40 11.96 14.74 20.42 23.09 24.33 27.94 31.71 31.10 33.18 33.33 23.84 0.36 10.78 14 SBI 12.72 13.48 14.04 19.34 18.47 19.52 20.65' 22.83 26.09 27.17 27.72 20.18 0.27 7.93 15 SIBI 11.04 12.34 15.02 18.00 18.35 20.73 24.93 30.85 30.91 31.84 36.06 22.73 0.38 11.30 16 UWBI 14.21 16.06 19.80 27.00 31.29 32.18 37.38 42.66 46.67. 44.30 54.55 33.28 0.40 11.81
OPBs 16.64 15.15 18.50 22.98 25.39 28.26 31.38 35.19 37.86 43.45 56.05 30.08 0.41 12.07 17 BPI NA NA NA 80.00 161.67 254.93 84.00 120.00 143.75 120.65 116.82 135.23 0.41 -2.16 18 CBI NA NA NA 110.00 110.20 104.38 339.39 297.14 289.80 280.70 266.67 224.79 0.44 13.04

203
19 GTB NA NA NA 233.33 666.88 323.95 149.21 196.83 248.48 202.38 203.45 278.06 0.59 .11.60 20 HDFC NA NA NA 400.00 281.20 190.03 156.14 154.95 236.64 244.44 NA 237.63 0.36 -8.88 21 ICICI NA NA NA 245.45 184.05 174.58 150.91 188.89 94.37 173.74 451.12 207.89 0.51 6.79 22 IDBI NA NA NA 450.00 309.57 197.35 207.69 161.54 100.98 190.67 212.37 228.77 0.47 .13.49 23 IIBI NA NA NA 311.11 311.94 360.67 334.62 333.33 321.88 235.00 222.64 303.90 0.16 -4.39 24 UTI NA NA NA 271.43 222.50 165.67 145.71 132.65 150.00 186.49 230.71 188.15 0.26 -3.32
NPBs NA NA NA 262.67 281.00 221.45 195.96 198.17 198.24 204.26 243.40 225.64 0.15 -3.09 PBs 16.64 15.15 18.50 102.87 110.60 92.65 86.24 89.52 91.32 97.06 121.62 76.56 0.52 12.42
Source: The same as Table 6.4. NA = NOT AVAILABLE
204
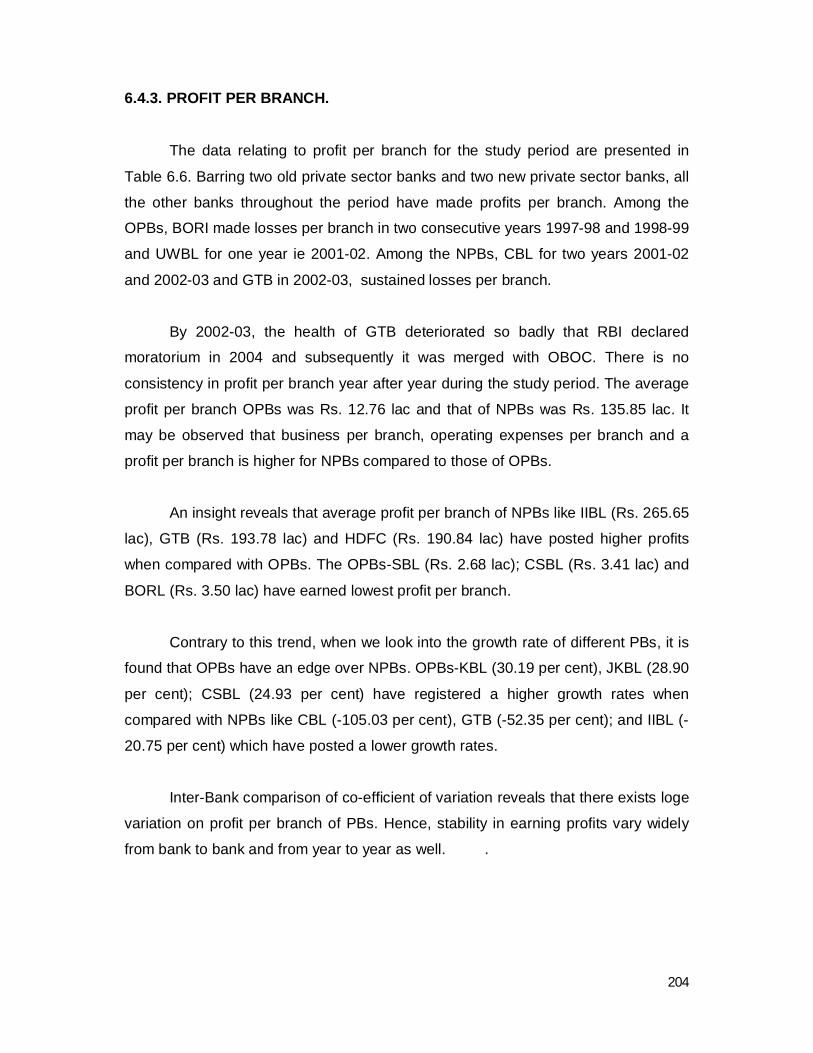
6.4.3. PROFIT PER BRANCH.
The data relating to profit per branch for the study period are presented in
Table 6.6. Barring two old private sector banks and two new private sector banks, all
the other banks throughout the period have made profits per branch. Among the
OPBs, BORI made losses per branch in two consecutive years 1997-98 and 1998-99
and UWBL for one year ie 2001-02. Among the NPBs, CBL for two years 2001-02
and 2002-03 and GTB in 2002-03, sustained losses per branch.
By 2002-03, the health of GTB deteriorated so badly that RBI declared
moratorium in 2004 and subsequently it was merged with OBOC. There is no
consistency in profit per branch year after year during the study period. The average
profit per branch OPBs was Rs. 12.76 lac and that of NPBs was Rs. 135.85 lac. It
may be observed that business per branch, operating expenses per branch and a
profit per branch is higher for NPBs compared to those of OPBs.
An insight reveals that average profit per branch of NPBs like IIBL (Rs. 265.65
lac), GTB (Rs. 193.78 lac) and HDFC (Rs. 190.84 lac) have posted higher profits
when compared with OPBs. The OPBs-SBL (Rs. 2.68 lac); CSBL (Rs. 3.41 lac) and
BORL (Rs. 3.50 lac) have earned lowest profit per branch.
Contrary to this trend, when we look into the growth rate of different PBs, it is
found that OPBs have an edge over NPBs. OPBs-KBL (30.19 per cent), JKBL (28.90
per cent); CSBL (24.93 per cent) have registered a higher growth rates when
compared with NPBs like CBL (-105.03 per cent), GTB (-52.35 per cent); and IIBL (-
20.75 per cent) which have posted a lower growth rates.
Inter-Bank comparison of co-efficient of variation reveals that there exists loge
variation on profit per branch of PBs. Hence, stability in earning profits vary widely
from bank to bank and from year to year as well. .

205
TABLE 6.6 PROFIT PER BRANCH OF PRIVATE BANKS: 1992-03
(Rs. in Lacs)
No Name 1992-93
1993-94 1994.95 1995.96 1996-97 1997-98 1998-99 19992000 200001 200102 200203 19922003
Mean CV GR (1) (2) (3) (4) (5) (6) (7) (8) (9) (10) (11) (12) (13) (14) (15)
1 BOBL 2.00 8.00 11.54 18.18 17.24 18.03 15.49 1.32 23.37 29.11 36.71 16.45 0.65 14.28 2 CUBL 2.35 2.17 6.25 10.20 11.00 11.00 11.43 18.35 18.42 23.73 26.83 12.88 0.63 18.47 3 IVBL 6.67 9.81 31.27 31.64 19.08 21.11" 8.31 11.67 10.34 18.55 23.18 17.42 0.51 0.17 4 LKBL 2.99 2.99 5.80 9.86 8.33 5.41 1.33 8.00 6.25 21.98 NA 7.29 0.80 14.53 5 TMBL 5.69 7.5:9 412.23 17.27 23.94 26.76 24.31 26.11 31.25 33.74 NA 20.88. 0.47 14.89 6 BOAL 2.14 0 5.34 17.67 15.99 1.01 .29.14 .21.90 3.87 10.36 12.90 20.24 3.50 4.51 13.44 7 CSBL 0.87 1.59 1.50 NA 1.44 2.52 NA 2.46 3.87 13.03 NA 3.41 1.17 24.93 8 DBL 0.78 0.76 3.03 3.57 5.52 2.72 2.68 7.33 4.64 6.54 9.43 4.27 0.64 16.15 9 FBL 2.36 5.17 12.11 12.50 12.20 12.66 0.75 11.39 14.84 19.90 25.00 11.72 0.61 12.97
10 JKBL 1.31 4.17 5.11 5.64 7.69 15.06 21.85 29.70 45.41 67.89 74.45 25.30 1.04 28.90 11 KBL 2.56 2.86 4.56 8.45 13.40 19.21 12.43 11.82 12.71 25.49 118.28 21.07 1.56 30.19 12 KVBL 3.14 6.55 13.22 17.68 18.65 22.11 18.32 34.63 34.95 51.66 58.41 25.39 0.70 19.89 13 LVBL 1.73 2.17 9.47 5.24 9.50 1.10 7.35 12.68 12.92 14.22 15.74 8.37 0.63 15.28 14 SBI 0.58 1.12 1.12 1.66 2.73 2.19 2.17 2.72 3.26 5.43 6.52 2.68 0.68 18.64 15 SIBI 0.65 3.48 4.50 1.43 2.29 5.93 1.66 7.16 11.02 16.32 18.41 6.62 0.92 23.40 16 UWBI 1.05 2.07 5.08 7.00 10.84 16.43 17.29 25.69 -7.11 11.40 12.12 9.26 0.97 9.83
OPBs 2.30 4.11 9.03 11.09 10.30 9.57 8.23 0.43 14.78 23.24 34.26 12.76 0.71 18.26 17 BPI NA NA NA 86.67 146.67 213.33 64.00 60.00 54.69 39.13 29.91 86.80 0.72 -19.41 18 CBI NA NA NA 1.00 80.00 62.50 63.64 97.14 14.29 -164.91 -41.67 26.37 3.43 - 105.03

206
19 GTB NA NA NA 333.33 712.50 363.64 112.70 173.02 121.21 47.62 -313.79 193.78 1.52 -52.35 20 HDFC NA NA NA 285.71 273.33 190.91 143.86 108.11 160.31 173.68. NA 190.84 0.35 -12.07 21 ICICI NA NA NA 154.55 181.82 151.52 143.55 129.63 45.35 72.07' 270.40 143.61 O.46 154.55 22 IDBI NA NA NA 50.00 57.14 '117.65 119.23 156.41 35.85 69.33 73.20 84.85 0.49 0.21 23 IIBI NA NA NA 511.11 405.56 433.33 142.31 207.41 128.13 127.50 169.81 265.65 0.59 -20.75 24 UTI NA NA NA 157.14 125.00 70.83 88.57 104.08 100.00 120.72 137.14 112.94 0.24 .0.62
NPBs NA NA NA 209.81 247.75 200.46 109.73 129.48 82.48 60.64 46.43 135.85 0.55 21.01 PBs 2.30 4.11 9.03 80.21 89.45 73.20 43.54 52.11 37.35 35.71 38.52 42.32 0.71 6.40
Source: The same as Table 6.4 NA = NOT AVAILABLE

207
EFFICIENCY AT EMPLOYEE LEVEL 6.4.4 BUSINESS PER EMPLOYEE -
Business per employee in the domestic private sector banks, on an average,
rose from Rs. 43.18 lac per annum in 1992-93 to Rs. 257.15 lac in 2002-03 (Table
6.7). It particularly started ballooning up from the year 1994-95 onwards. It recorded
nearly five-fold increase during the period under study registering 15.50 per cent
growth rate.
The phenomenal growth in business of PBs can be attributed to two factors.
Firstly, due to liberalization, technological explosion and computer revolution, the
turnover of PBs picked up. Secondly, the rate of growth in the number of employees
in these banks registered a fall (Table 4.32) in the era of financial reforms.
Inter-group analysis reveals that NPBs are much ahead of OPBs in the race.
When the mean values of first 11-year period are observed, NPBs registered Rs.
891.78 lac business per employee while OPBs posted only Rs. 133.21 lac. But
growth rate of OPBs (15.50 per cent) was far better than NPBs (1.44 per cent)
during the period under study.
An analysis of the mean values of different banks for the entire period
reveals that IIBL (Rs. 1827.91 lac); UTI (Rs. 1014.73 lac), and GTB (Rs. 873.13 lac)
were at the top while SBL (Rs. 72.6 lac) CSBL (Rs. 85.79 lac) and BORL (Rs. 99.75
lac) were in the bottom. It shows that NPBs are at the top of list when compared to
OPBs. In contrast to that OPBs secured better ranks in growth rates-SIBL (19.14
per cent); KBL (17.42 percent) .and UWBL (17.21 per cent) which secured top three
ranks while BPL (-8.26 per cent) CBL (-4.50 per cent) and IIBL (-1.59 per cent),
which obtained the least, three ranks.
When compared with PSBs, the mean value of business per employee of
PBs is much higher at Rs. 311.14 lac than that of PSBs Rs. 107.03 lac. It is further
observed that the variations in CV are not significant. Hence, business per
employee of different PBs is stable during the period under study.

208
TABLE 6.7 BUSINESS PER EMPLOYEE OF PRIVATE BANKS : 1992-03
(Rs. in Lacs)
No Name 1992-93 1993-94 1994.951995.96 1996-
97 1997-
98 1998-99 19992000 200001 200102 200203 19922003
Mean CV GR (1) (2) (3) (4) (5) (6) (7) (8) (9) (10) (11) (12) (13) (14) (15)
1 BOBL 61.59 74.10 90.43 101.50 119.21 172..15 194.44 211.08 239.74 260.17 320.89 167.75 0.5077 15.08 2 CUBL 37.77 47.64 62.25 79.29 95.04 116.13 138.68 155.99 184.54 219.32 250.78 126.13 0.5606 16.69 3 IVBL 76.12 98.20 147.66 123.65 138.19 133.78 151.06 187.49 220.71 241.35 297.83 165.09 0.3988 11.24 4 LKBL 33.33 54.38 73.58 118.46 143.72 146.36 139.06 188.43 218;4'3 246.35 NA 136.21 0.5092 16.48 5 TMBL 51.76 70.82 87.35 93.12 97.19 118.55 142.05 182.75 217.84 246.99 NA 130.84 0.4988 15.89 6 BOAL 38.99 NA 68.16 84.18 99.22 98.15 102.15 114.41 125.75 138.16 178.75 99.75 0.3853 11.76 7 CSBL 35.09 45.83 54.17 69.05 77.91 88.25 96.83 111.96 132.77 146.05 NA 85.79 0.4285 14.06 8 DBL 29.43 42.09 65.21 101.49 133.71 126.92 134.38 159.14 184.89 200.55 223.60 127.40 0.4990 14.84 9 FBL 47.42 64.90 77.90 102.81 124.75 179.98 201.92 163.82 198.31 225.22 276.10 151.19 0.4837 14.10 10 JKBL 60.05 65.81 71.14 77.44 96.03 123.75 150.22 206.12 246.23 297.69 318.98 164.77 0.5843 16.88 11 KBL 39.44 50.03 61.61 83.47 108.88 133.15 163.63 187.12 218.00 251.42 282.22 143.54 0.5826 17.42 12 KVBL 39.27 56.10 89.85 84.71 103.48 137.38 149.46. 178.89 205.50 253.75 298.84 145.20 0.5673 16.71 13 LVBL 33.46 46.15 78.51 73.50 86.96 121.89 125.19 161.30 194.11 209.11 228.69 123.53 0.5416' 16.11 14 SBI 32.11 36.86 45.35 52.87 60.16 64.02 72.03 86.09 97.26 105.32 110.86 72.61 0.3768 11.29 15 SIBI 36.67 45.41 55.79 70.55 84.64 111.51 126.50 157.83 190.88 247.46 294.76 129.27 0.6597 19.14 16 UWBI 38.34 48.36 65.28 78:91 92.94 119.01 148.84 198.08 237.71 213.59 260.64 136.52 0.5839 17.21
OPBs 43.18 56.45 74.64 87.19 103.88 124.44 139.78 165.66 194.54 218.91 257.15 133.25 0.5202 15.50 17 BPI NA NA NA 441.59 1058.411628.32 493.94 712.02 646.95 533.30 465.20 747.47 0.5463 -8.26 18 CBI NA NA NA 403.00 1104.38 843.55 549.76 803.80 765.53 535.65 439.05 680.59 0.3521 -4.50

209
19 GTB NA NA NA 865.71 691.84 947.56 830.88 1002.98 1008.87 861.20 776.03 873.13 0.1263 0.78 20 HDFC NA NA NA 402.67 407.20 460.00 438.62 593.61 592.33 653.87 NA 506.90 0.2039 8.86 21 ICICI NA NA '.NA 464.31 432.13 623.05 920.47 1006.18 521.24 1024.07 955.52 743.37 0.3459 9.90 22 IDBI NA NA NA 248.15 553.04 812.08 912.89 923.77 737.59 689.82 712.80 698.77 0.3133 6.35 23 IIBI NA NA NA 1848.91 2000.401915.67 1511.81 1992.79 1978.141893.50 1482.04 1827.91 0.1154 -1.59 24 UTI NA NA NA 764.95 814.39 1058.01 1000.19 1248.58 1174.091024.93 1032.72 1014.73 0.1603 4.13
NPBs NA NA NA 679.91 882.72 1036.03 832.32 1035.47 928.09 902.04 837.62 891.78 0.41 1.44 PBs 43.18 56.45 74.64 284.76 363.49 428.30 370.63 455.59 439.06 446.62 460.32 311.19 0.5483 14.89
Source: The same as Table 6.4. NA=NOT AVAILABLE
210
TABLE 6.8 ESTABLISHMENT EXPENSES PER EMPLOYEE OF PBS : 1992-03
(Rs. in Lacs)
No Name 1992-93 1993-94 1994.951995.96 1996-
97 1997-
98 1998-99 19992000 200001 200102 200203 1992-2003
Mean CV GR (1) (2) (3) (4) (5) (6) (7) (8) (9) (10) (11) (12) (13) (14) (15) 1 BOBL 0.63 0.80 0.94 1.22 1.14 1.49 1.65 1.72 1.90 1.91 2.04 1.40 0.35 9.97 2 CUBL 0.56 0.62 0.68 0.91 0.90 1.02 1,22 1.46 1.55 1.69 1.70 1.12 0.38 11.62 3 IVBL 0.63 0.71 0.82 1.12 1.22 1.27 1.41 1.61 1.84 2.71 3.48 1.53 0.57 15.70 4 LKBL 0.69 0.67 0.94 1.08 0.87 1.10 1.27 1.47 1.69 1.69 NA 1.15 0.33 10.46 5 TMBL 0.68 0.70 0.83 1.08 1.16 1.27 1.59 1.89 1.96 2.29 NA 1.35 0.42 13.38 6 BOAL 0.66 0.73 0.94 1.04 1.19 1.41 1.87 2.08 2.03 2.20 2.47 1.51 0.42 12.58 7 CSBL 0.62 0.68 0.81 1.06 1.13 1.22 1.40 1.88 2.07 2.22 NA 1.31 0.44 14.51 8 DBL 0.64 0.71 0.88 1.32 1.22 1.36 1.40 1.64.' 2.18 2.65 2.99 1.54 0.50 14.24 9 FBL 0.63 0.68 0.92 1.16 1.10 1.29 1.44 1.84 1.76 1.94 2.24 1.36 0.39 11.73
10 JKBL 0.56 0.68 0.97 0.85 0.97 1.04 1.36 .1.43 1.48 2.22 2.22 1.25 0.45 12.77 11 KBL 0.66 0.75 0.95 1.15 1.40 1.55 1.64 1.85 1.76 2.15 2.06 1.45 0.35 10.36 12 KVBL 0.65 0.70 0.90 1.11 1.14 1.59 1.54 1.97 1.72 1.85 2.12 1.39 0.37 10.79 13 LVBL 0.67 0.71 0.90 1.20 1.30 1.46 1.62 2.00 1.96 2.07 2.17 1.46 0.38 10.96 14 SBI 0.66 0.70 0.79 1.19 1.12 1.21 1.35 0.00 1.80 1.89 1.92 1.26 0.47 8.71 15 SIBI 0.64 0.69 0.89 1.20 1.22 1.43 1.69 2.31 2.27 2.27 2.65 1.57 0.45 13.38 16 UWBI 0.61 0.65 0.77 1.13 1.22 1.24 1.60 1.96 2.21 2.00 2.63 1.46 0.46 13.73 OPBs 0.64 0.70 0.87 1.11 1.14 1.31 1.50 1.69 1.89 2.11 2.36 1.39 0.41 12.20
17 BPI NA NA NA 1.77 3.30 5.07 1.33 1.46 1.28 1.40 1.47 2.14 0.64 -12.65 18 CBI NA NA NA 1.00 1.49 1.62 1.57 1.55 1.83 2.07 2.65 1.72 0.28 10.45

211
19 GTB NA NA NA 1.28 1.46 1.67 1.74 1.92 2.56 3.14 3.20 2.12 0.35 13.67 20 HDFC NA NA NA 1.91 1.98 2.25 2.24 2.45 2.84 2.91 NA 2.37 0.16 7.60 21 ICICI NA NA NA 1.35 1.39 2.03 2.02 2.68 1.16 1.90 3.80 2.04 0.42 10.29 22 IDBI NA NA NA 3.70 1.85 1.92 2.63 2.56 3.23 3.31 3.79 2.87 0.26 4.87 23 IIBI NA NA NA 1.46 1.69 2.13 2.17 2.34 2.41 2.71 2.98 2.24 0.22 8.94 24 UTI NA NA NA 2.06 1.90 2.01 2.30 2.03 2.45 296 3.64 2.42 0.25 8.27 NPBs NA NA NA 1.82 1.88 2.34 2.00 2.12 2.22 2.55 3.08 2.25 0.18 6.22 PBs 0.64 0.70 0.87 1.35 1.39 1.65 1.67 1.84 2.00 2.26 2.61 1.54 0.41 12.32
Source: The same as Table 6.4. NA = NOT AVAILABLE

212
TABLE 6.9
PROFIT PER EMPLOYEE OF PRIVATE BANKS: 1992-03 (Rs. in Lacs)
No Name 1992-93 1993-94 1994.951995.96 1996-
97 1997-
98 1998-99 19992000 200001 200102 200203 19922003
Mean CV GR (1) (2) (3) (4) (5) (6) (7) (8) (9) (10) (11) (12) (13) (14) (15) 1 BOBL 0.09 040 0.56 0.94 0.95 1.06 1.11 0.10 1.80 2.20 2.82 1.09 0.79 19.20 2 CUBL 0.19 0.18 0.51 0.83 0.82 0.80 0.88 1.48 1.56 2.06 2.34 1.06 0.67 19.83 3 IVBL 0.38 0.57 1.88 1.92 1.19 1.33 0.50 0.73 0.69 1.33 1.73 1.11 0.51 2.69 4 LKBL 0.46 045 0.75 1.25 0.87 0.55 0.13 0.88 0.60 2.12 NA 0.81 0.69 9.93 5 TMBL 0.43 0.58 0.88 1.23 1.65 1.85 1.64 1.91 2.28 2.47 NA 1.49 0.46 14.75 6 BOAL 0.13 033 1.12 1.04 0.07 -2.01 -1.53 0.28 0.75 0.93 1.62 0.25 4.47 20.15 7 CSBL 0.07 0.13 0.13 0-00 .13 0.22 0.00 0.23 0.36 1.23 NA 0.31 1.16 25.60 8 DBL 0.09 0.09 0.35 0.44 0:65 0.32 0.29 0.80 0.55 0.78 1.15 0.50 0.65 15.97 9 FBL 0.15 0.32 0.76 0.78 0.75 0.81 0.05 0.72 0.97 1.31 1.69 0.76 0.63 13.24
10 JKBL 0.08 0.26 0.32 0.33 0.45 0.88 1.36 1.91 2.60 4.00 4.75 1.54 1.05 29.22 11 KBL 0.21 0.24 0.37 0.69 1.13 1.48 1.07 1.01 1.10 2.20 2.55 1.10 0.69 18.26 12 KVBL 0.25 052 1.04 1.37 1.47 1.79 1.39 2.60 2.52 3.80 4.41 1.92 0.68 19.23 Source: The same as Table 6.4.

213
Table 6.10 SUMMARY OF DETAILS OF PRIVATE SECTOR BANKS IN INDIA AS ON MARCH 31, 2009 Particulars Axis Bank of City Develop. Dhanlak- Federal HDFC ICICI IndusInd ING Bank Rajasthan Union Bk. Credit Bk. shmi Bk. Bank Bank Bank Bank Vysya Bk. No. of Offices 786 458 209 81 181 611 1400 1408 182 444 No. of Employees 20624 4075 2452 1942 1402 7570 52687 34596 4251 6086 Business per Employee (in ` Lakh) 1060 532.93 565.18 379 585.88 750 446 1154 836 606.39 Profit per Employee (in ` Lakh) 10.02 2.89 4.98 -4.00 4.10 6.9 4.18 11 3.49 3.03 Interest Income (in ` Crore) 10835 1384 804 645 408 3315 16332 31093 2309 2240 Other Income (in ` Crore) 2897 124 124 120 79 516 3291 7604 456 548 Interest Expended (in ` Crore) 7149 998 562 448 287 2000 8911 22726 1850 1590 Operating Expenses (in ` Crore) 2858 315 140 242 113 571 5533 7045 547 772 Return on Assets 1.44 0.74 1.50 -1.25 1.21 1.48 1.28 0.98 0.58 0.7 CRAR 13.69 11.50 12.69 13.30 15.38 20.22 15.69 13.96 12.33 11.65 Net NPA Ratio 0.40 0.73 1.08 3.88 0.88 0.3 0.63 2.09 1.14 1.23
Particulars J & K Bank
Karnataka Bank
Karur Vyaya Bank
Kotak Mahindra
bank
Lakshmi vilas bank
Nainital bank
Ratnakar bank
Catholic Syrian
bank
South Indian bank Yes bank
No. of Offices 491 452 296 220 247 92 84 360 519 118 No. of Employees 7627 4947 3941 8227 2433 693 566 2676 4523 2671 Business per 500 649 638 347 510 425 373 374 645.14 988.36
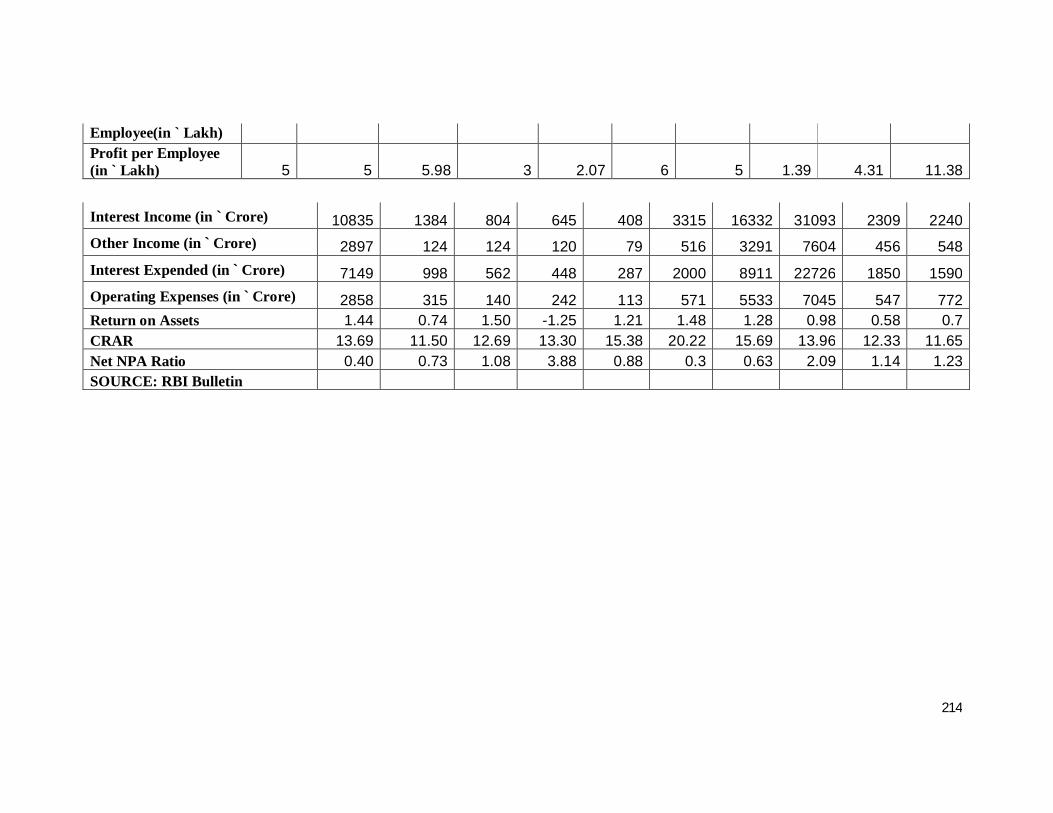
214
Employee(in ` Lakh) Profit per Employee (in ` Lakh) 5 5 5.98 3 2.07 6 5 1.39 4.31 11.38
Interest Income (in ` Crore) 10835 1384 804 645 408 3315 16332 31093 2309 2240 Other Income (in ` Crore) 2897 124 124 120 79 516 3291 7604 456 548 Interest Expended (in ` Crore) 7149 998 562 448 287 2000 8911 22726 1850 1590 Operating Expenses (in ` Crore) 2858 315 140 242 113 571 5533 7045 547 772 Return on Assets 1.44 0.74 1.50 -1.25 1.21 1.48 1.28 0.98 0.58 0.7 CRAR 13.69 11.50 12.69 13.30 15.38 20.22 15.69 13.96 12.33 11.65 Net NPA Ratio 0.40 0.73 1.08 3.88 0.88 0.3 0.63 2.09 1.14 1.23 SOURCE: RBI Bulletin

215
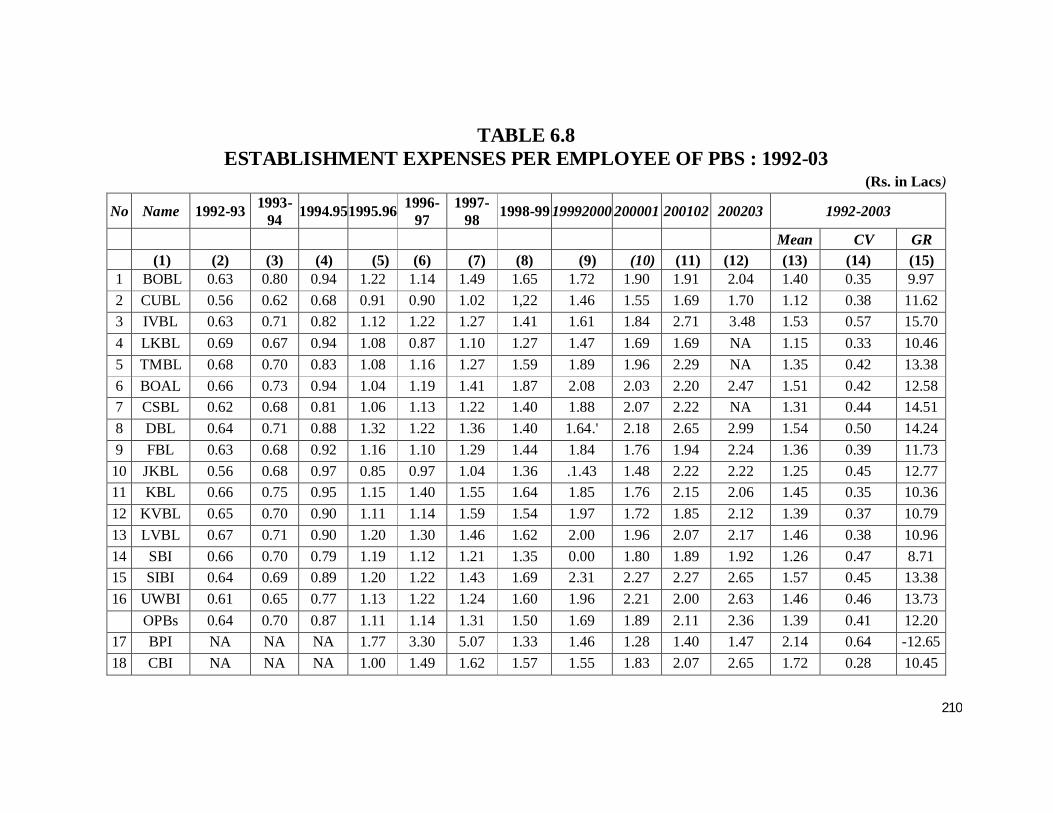
6.4.5. ESTABLISHMENT EXPENSES PER EMPLOYEE
Table 6.8 gives data relating to Establishment expenses per employee.
Establishment expenses per employee of PBs increased from Rs. 0.64 lac in 1992-
93 to Rs. 2.61 lac in 2002-03, an increase of 3 times. There was a gradual increase
in the establishment expenses of different banks during the study period. The
growth rates among these banks are also low because of adoption of latest
technology and higher level of computerization.
An analysis of the growth rates in different private sector banks suggests that
there are wide variations in establishment expenses per employee. In some of the
banks (e.g. CSBL, DBL and GTB) the establishment expenses per employee
registered a higher rate of increase and few other (e.g. BPL, IOBI and HDFC) banks
recorded lower growth rates. CUBL (Rs. 1.12 lac) followed by LKBL (Rs. 1.15 lac),
JKBL (Rs. 1.25 lac) have registered, on an average, the lowest establishment
expenses per annum while IOBI (Rs. 2.87 lac), UTI (Rs. 2.42 lac) and HDFC (Rs.
2.37 lac) posted highest establishment expenses.
A perusal of the data relating to CV reveals that private banks did not show
any significant variations with regard to establishment expenses per employee.
6.4.6.PROFIT PER EMPLOYEE
It is observed from the Table 6.9 that profit per employee of PBs went up on
an average, from Rs. 0.18 lac in 1992-93 to Rs. 2.08 lac in 2002-03. The profit per
employee made a real jump in the year 1994-95, probably because by that time
initial trauma of reforms was almost over and income had started picking up.
Though profit per employee, on an average, increased by more than nine times, yet
it does not exhibit any consistency.
The average profit per employee of NPBs (Rs. 7.67 lac) stood very high than
those of OPBs (Rs. 0.92 lac). In contrast to the mean values, growth rates are much

216
better in OPBs (17.44 per cent) than NPBs (3.13 per cent).
When compared with the nationalized banks, which sustained losses per
employee in a good number of years, the PBs have made profits consistently during
the period. While the average profit per employee of PSBs was Rs. 0.39,lac that of
PBs was Rs. 2.5 lac.
Among the OPBs, only two banks, namely, -BORL and UWBL incurred
losses in some years during the period under
Hypothesis Testing
The performance of public sector banks is not as good as' private sector banks in spite of their age, size and image.
From the above analysis it is proved that the financial reforms have provided the
same space and opportunity to the public sector as well as private sector banks the
private sector banks have shown better performance in terns of all financial
indicators. Thus it can be said that the private sector banks have more positively
responded to the financial reforms process than the public sector banks.
Thus the above hypothesis has been accepted.
The analysis indicates that, the private sector banks in India, have made remarkable
progress after the financial reforms in comparison to the public sector banks. After
making performance analysis of private sector banks in first and second generation
reforms i.e. from 1991-92 to 2003-04, now we will analyse the performance analysis
of both the private sector banks and public sector banks (in third generation reforms
i.e. fro 2004-05 to 2010-11) in next chapter.