Embed Size (px)
Citation preview
CSEIT172371 | Received : 10 May 2017 | Accepted : 20 May 2017 | May-June-2017 [(2)3: 438-445]
International Journal of Scientific Research in Computer Science, Engineering and Information Technology
© 2017 IJSRCSEIT | Volume 2 | Issue 3 | ISSN : 2456-3307
438
Performance Analysis of Scig and DFIG-Based Wind Turbines Kishan V Dave, Nimish R Suchak
A. V. Parekh Technical Institute, Rajkot, Gujarat, India
ABSTRACT
This paper presents a comparative performance analysis of squirrel cage induction generator (SCIG) and doubly fed
induction generator (DFIG) systems driven by wind turbines under different operating conditions. Also, the constant
and variable-speed configurations are compared regarding short-term flicker severity, Pst. The constant speed
configurations are based on SCIG in addition to SCIG equipped with static synchronous compensator (STATCOM)
with the same generation capacity. In this paper, comprehensive models of wind turbine are used to analyze power
and voltage fluctuations. The short-time flicker index is used to assess the emitted voltage fluctuation. The effects of
grid short circuit capacity and impedance angle on flicker emission are investigated. The influences of site mean-
wind-speed and turbulence intensity on voltage fluctuation are also examined. A flickermeter model is implemented
according to the guidelines provided by IEC 61000-4-15 to evaluate the severity of voltage fluctuation emission.
The models of different system components along with their control schemes are simulated using Matlab/Simulink®
package.
Keywords : Wind Turbine, SCIG, DFIG, Maximum Power Point Tracking (MPPT), Voltage Flicker.
I. INTRODUCTION
The growing demand for electric energy all over the
world has highly motivated the use of renewable
sources of energy. Among renewable-based energy
sources that have been intensively studied, wind energy
seems to have a vital role in the near future. Over the
last ten years, the global wind energy capacity has
increased rapidly and became the fastest developing
renewable energy technology. Clean operation and
minimal running cost requirements are some
motivations of using more wind energy within power
grids .
Most of the wind turbines use induction generators
because of their advantageously characteristics; such as
the over speed capability; make them suitable for
integration with wind turbines; especially that are used
squirrel cage induction generators (SCIG) because of its
mechanical simplicity, high efficiency and low
maintenance requirements, but at the present time
doubly fed induction generator (DFIG) are widely used
for large wind power plants .
The SCIG speed changes by only a few percent because
of the generator slip caused by changes in wind speed.
Therefore, this generator is often called the constant-
speed wind generating system.
One of the most important wind power quality
considerations is the effect of voltage fluctuations,
voltage dips and harmonics mitigation. Which disturb
the sensitive electric and electronic equipments. This
may lead to a great reduction in the life span of most
equipment. Flickers have widely been considered as a
serious drawback and may limit the maximum amount
of wind power generation that can be connected to the
grid .There are numerous factors that affect flicker
emission of grid-connected wind turbines during
continuous operation, such as wind characteristics (e.g.
mean wind speed and turbulence intensity) and grid
conditions (e.g. short circuit capacity, grid impedance
angle and load type) .The lighting flicker level is
generally used to measure voltage fluctuation. Voltage
fluctuation disturbs the sensitive electric and electronic
equipment. And, hence, IEC 61400-21 is developed to
provide procedures for determining the power quality
characteristics of wind turbines especially flicker
emissions .
Volume 2 | Issue 3 | May-June-2017 | www.ijsrcseit.com 439
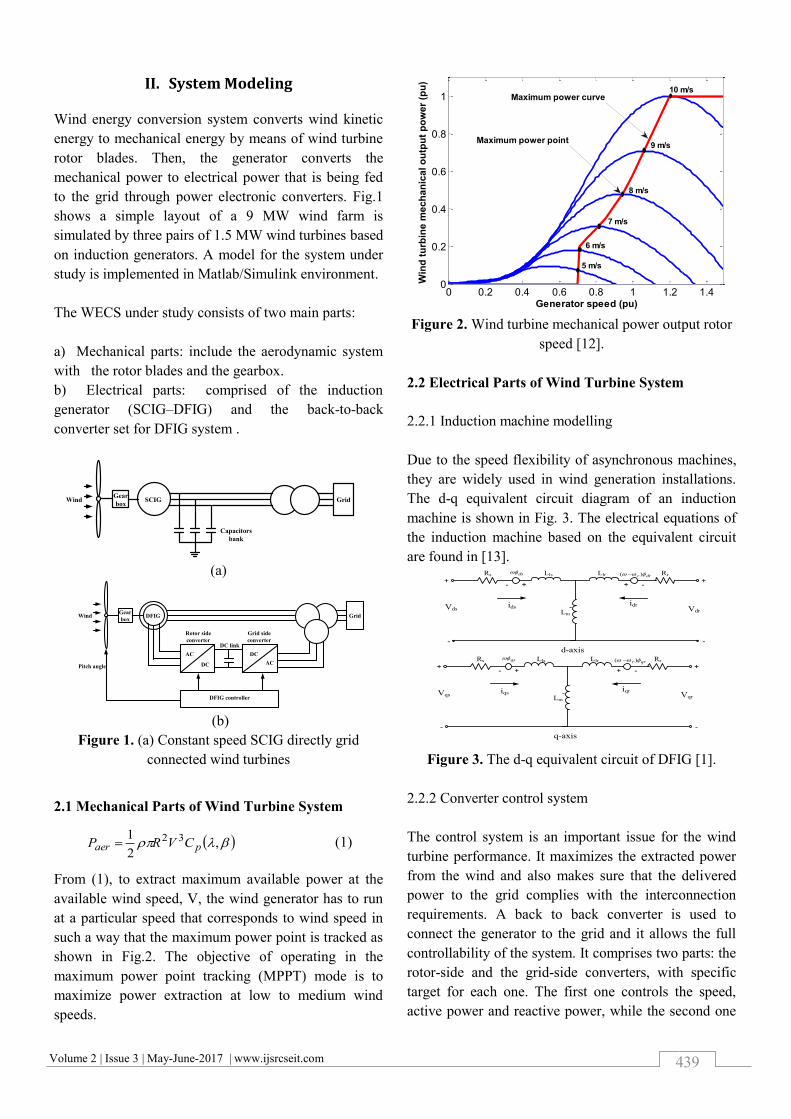
II. System Modeling
Wind energy conversion system converts wind kinetic
energy to mechanical energy by means of wind turbine
rotor blades. Then, the generator converts the
mechanical power to electrical power that is being fed
to the grid through power electronic converters. Fig.1
shows a simple layout of a 9 MW wind farm is
simulated by three pairs of 1.5 MW wind turbines based
on induction generators. A model for the system under
study is implemented in Matlab/Simulink environment.
The WECS under study consists of two main parts:
a) Mechanical parts: include the aerodynamic system
with the rotor blades and the gearbox.
b) Electrical parts: comprised of the induction
generator (SCIG–DFIG) and the back-to-back
converter set for DFIG system .
Gear
boxWind SCIG Grid
Capacitors
bank
(a)
Gear
boxWind DFIG
AC
ACDC
DC
Rotor side
converter
Grid side
converter
DFIG controller
Grid
Pitch angle
DC link
(b)
Figure 1. (a) Constant speed SCIG directly grid
connected wind turbines
2.1 Mechanical Parts of Wind Turbine System
,2
1 32paer CVRP (1)
From (1), to extract maximum available power at the
available wind speed, V, the wind generator has to run
at a particular speed that corresponds to wind speed in
such a way that the maximum power point is tracked as
shown in Fig.2. The objective of operating in the
maximum power point tracking (MPPT) mode is to
maximize power extraction at low to medium wind
speeds.
Figure 2. Wind turbine mechanical power output rotor
speed [12].
2.2 Electrical Parts of Wind Turbine System
2.2.1 Induction machine modelling
Due to the speed flexibility of asynchronous machines,
they are widely used in wind generation installations.
The d-q equivalent circuit diagram of an induction
machine is shown in Fig. 3. The electrical equations of
the induction machine based on the equivalent circuit
are found in [13]. Rs Llsds Llr Rrdrr )(
Lm
ids
+ +++
-
-
-
--
idrVds Vdr
d-axis
Rs Llsqs Llr Rrqrr )(
Lm
iqs
+ +++
-
-
-
--
iqrVqs Vqr
q-axis
Figure 3. The d-q equivalent circuit of DFIG [1].
2.2.2 Converter control system
The control system is an important issue for the wind
turbine performance. It maximizes the extracted power
from the wind and also makes sure that the delivered
power to the grid complies with the interconnection
requirements. A back to back converter is used to
connect the generator to the grid and it allows the full
controllability of the system. It comprises two parts: the
rotor-side and the grid-side converters, with specific
target for each one. The first one controls the speed,
active power and reactive power, while the second one
0 0.2 0.4 0.6 0.8 1 1.2 1.40
0.2
0.4
0.6
0.8
1
5 m/s
6 m/s
7 m/s
8 m/s
9 m/s
10 m/s
Generator speed (pu)
Win
d t
urb
ine
me
ch
an
ica
l o
utp
ut
po
we
r (p
u)
Maximum power point
Maximum power curve
Volume 2 | Issue 3 | May-June-2017 | www.ijsrcseit.com 440
maintains the voltage on the DC-link at a constant value
to transfer all generated power to the grid.
III. Performance Analysis of SCIG and DFIG-
Based Wind Turbine
To examine the performance of the SCIG and the
implemented control schemes of DFIG based wind
turbines, three cases studies considering different wind
speed variations have been conducted.
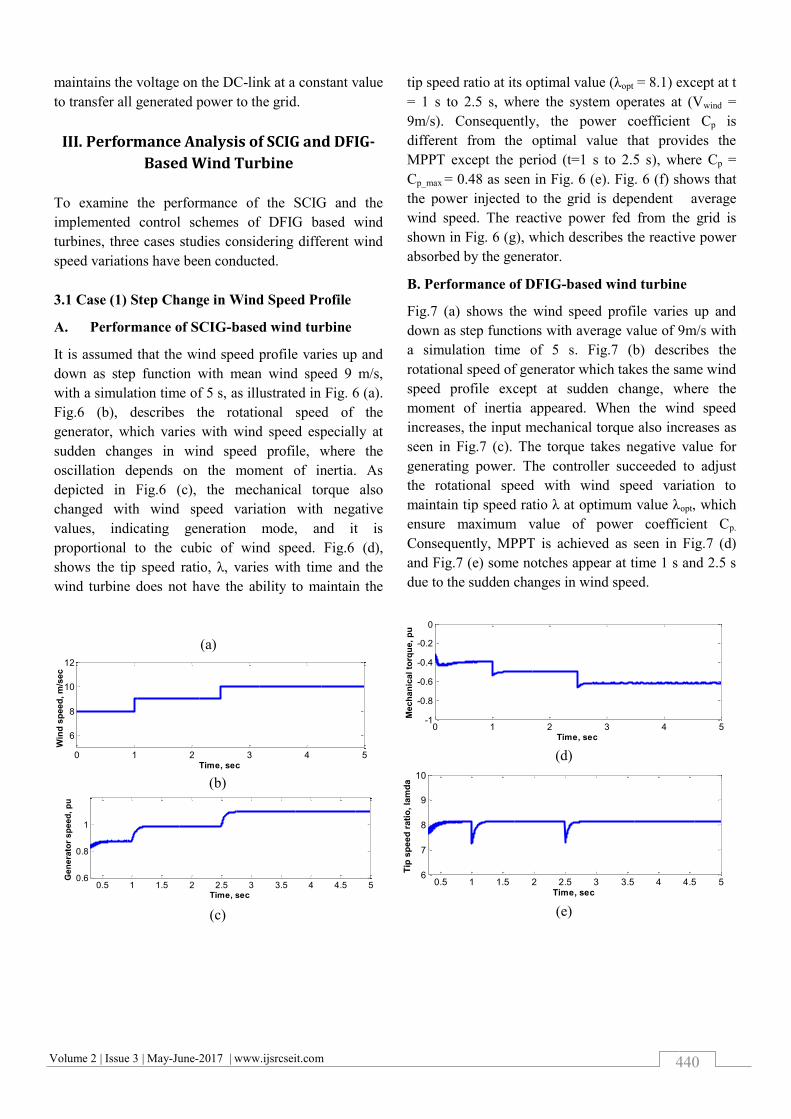
3.1 Case (1) Step Change in Wind Speed Profile
A. Performance of SCIG-based wind turbine
It is assumed that the wind speed profile varies up and
down as step function with mean wind speed 9 m/s,
with a simulation time of 5 s, as illustrated in Fig. 6 (a).
Fig.6 (b), describes the rotational speed of the
generator, which varies with wind speed especially at
sudden changes in wind speed profile, where the
oscillation depends on the moment of inertia. As
depicted in Fig.6 (c), the mechanical torque also
changed with wind speed variation with negative
values, indicating generation mode, and it is
proportional to the cubic of wind speed. Fig.6 (d),
shows the tip speed ratio, λ, varies with time and the
wind turbine does not have the ability to maintain the
tip speed ratio at its optimal value (λopt = 8.1) except at t
= 1 s to 2.5 s, where the system operates at (Vwind =
9m/s). Consequently, the power coefficient Cp is
different from the optimal value that provides the
MPPT except the period (t=1 s to 2.5 s), where Cp =
Cp_max = 0.48 as seen in Fig. 6 (e). Fig. 6 (f) shows that
the power injected to the grid is dependent average
wind speed. The reactive power fed from the grid is
shown in Fig. 6 (g), which describes the reactive power
absorbed by the generator.
B. Performance of DFIG-based wind turbine
Fig.7 (a) shows the wind speed profile varies up and
down as step functions with average value of 9m/s with
a simulation time of 5 s. Fig.7 (b) describes the
rotational speed of generator which takes the same wind
speed profile except at sudden change, where the
moment of inertia appeared. When the wind speed
increases, the input mechanical torque also increases as
seen in Fig.7 (c). The torque takes negative value for
generating power. The controller succeeded to adjust
the rotational speed with wind speed variation to
maintain tip speed ratio λ at optimum value λopt, which
ensure maximum value of power coefficient Cp.
Consequently, MPPT is achieved as seen in Fig.7 (d)
and Fig.7 (e) some notches appear at time 1 s and 2.5 s
due to the sudden changes in wind speed.
(a)
(b)
(c)
(d)
(e)
0 1 2 3 4 5
6
8
10
12
Time, sec
Win
d s
pe
ed
, m
/se
c
0.5 1 1.5 2 2.5 3 3.5 4 4.5 50.6
0.8
1
Time, sec
Gen
era
tor
sp
eed
, p
u
0 1 2 3 4 5-1
-0.8
-0.6
-0.4
-0.2
0
Time, sec
Me
ch
an
ica
l to
rqu
e,
pu
0.5 1 1.5 2 2.5 3 3.5 4 4.5 56
7
8
9
10
Time, sec
Tip
sp
eed
rati
o, la
md
a
Volume 2 | Issue 3 | May-June-2017 | www.ijsrcseit.com 441
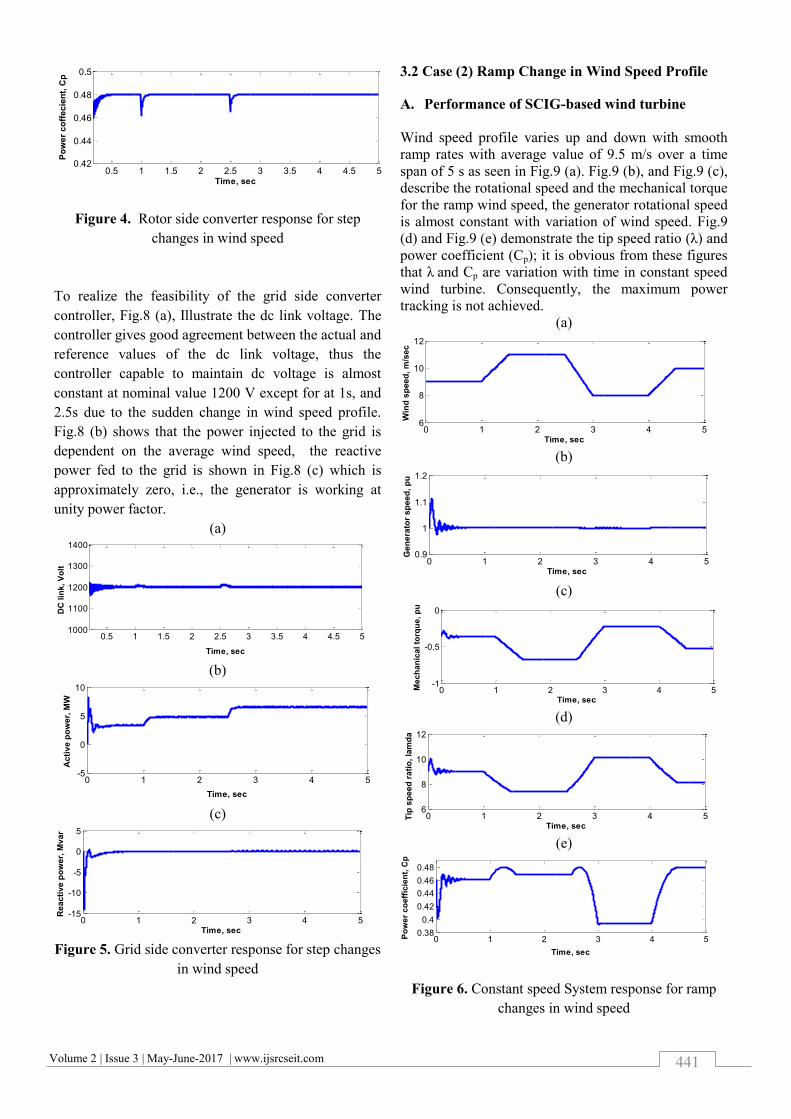
Figure 4. Rotor side converter response for step
changes in wind speed
To realize the feasibility of the grid side converter
controller, Fig.8 (a), Illustrate the dc link voltage. The
controller gives good agreement between the actual and
reference values of the dc link voltage, thus the
controller capable to maintain dc voltage is almost
constant at nominal value 1200 V except for at 1s, and
2.5s due to the sudden change in wind speed profile.
Fig.8 (b) shows that the power injected to the grid is
dependent on the average wind speed, the reactive
power fed to the grid is shown in Fig.8 (c) which is
approximately zero, i.e., the generator is working at
unity power factor.
(a)
(b)
(c)
Figure 5. Grid side converter response for step changes
in wind speed
3.2 Case (2) Ramp Change in Wind Speed Profile
A. Performance of SCIG-based wind turbine
Wind speed profile varies up and down with smooth
ramp rates with average value of 9.5 m/s over a time
span of 5 s as seen in Fig.9 (a). Fig.9 (b), and Fig.9 (c),
describe the rotational speed and the mechanical torque
for the ramp wind speed, the generator rotational speed
is almost constant with variation of wind speed. Fig.9
(d) and Fig.9 (e) demonstrate the tip speed ratio (λ) and
power coefficient (Cp); it is obvious from these figures
that λ and Cp are variation with time in constant speed
wind turbine. Consequently, the maximum power
tracking is not achieved.
(a)
(b)
(c)
(d)
(e)
Figure 6. Constant speed System response for ramp
changes in wind speed
0.5 1 1.5 2 2.5 3 3.5 4 4.5 50.42
0.44
0.46
0.48
0.5
Time, sec
Po
wer
co
ffecie
nt,
Cp
0.5 1 1.5 2 2.5 3 3.5 4 4.5 51000
1100
1200
1300
1400
Time, sec
DC
lin
k, V
olt
0 1 2 3 4 5-5
0
5
10
Time, sec
Acti
ve p
ow
er,
MW
0 1 2 3 4 5-15
-10
-5
0
5
Time, sec
Reacti
ve p
ow
er,
Mvar
0 1 2 3 4 56
8
10
12
Time, sec
Win
d s
peed
, m
/sec
0 1 2 3 4 50.9
1
1.1
1.2
Time, sec
Gen
era
tor
sp
eed
, p
u
0 1 2 3 4 5-1
-0.5
0
Time, sec
Mech
an
ical to
rqu
e, p
u
0 1 2 3 4 56
8
10
12
Time, sec
Tip
sp
ee
d r
ati
o,
lam
da
0 1 2 3 4 50.38
0.4
0.42
0.44
0.46
0.48
Time, sec
Po
wer
co
eff
icie
nt,
Cp
Volume 2 | Issue 3 | May-June-2017 | www.ijsrcseit.com 442
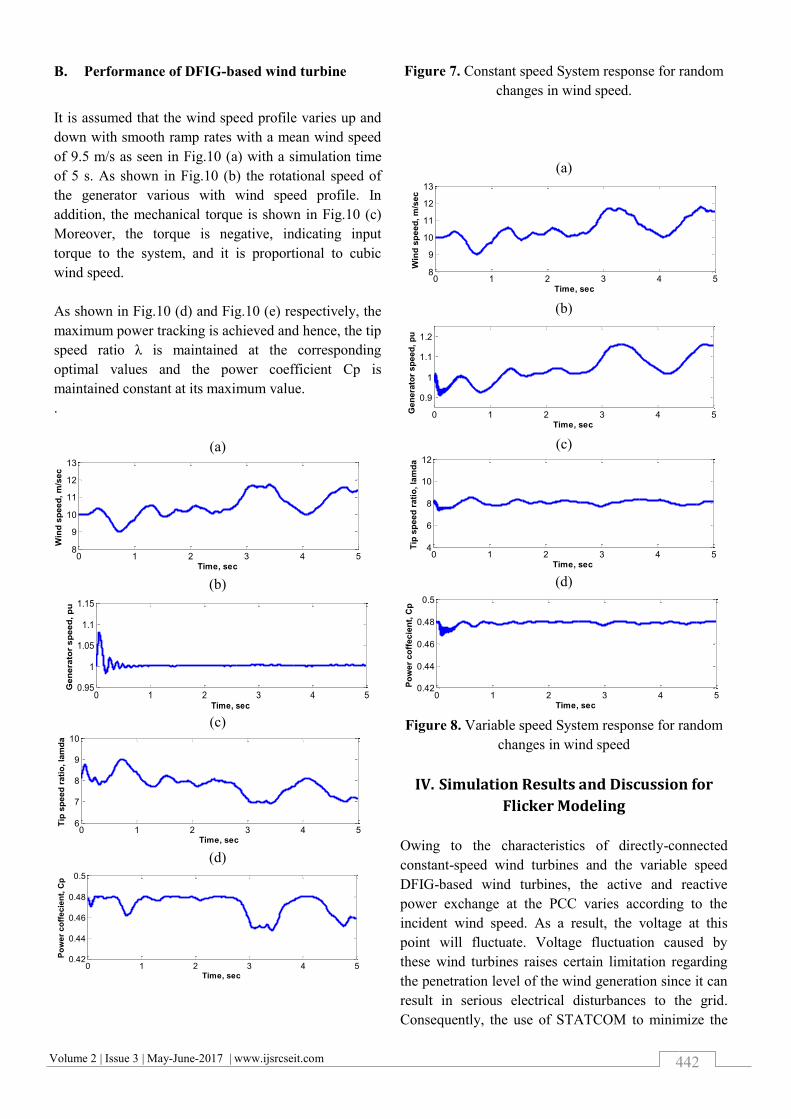
B. Performance of DFIG-based wind turbine
It is assumed that the wind speed profile varies up and
down with smooth ramp rates with a mean wind speed
of 9.5 m/s as seen in Fig.10 (a) with a simulation time
of 5 s. As shown in Fig.10 (b) the rotational speed of
the generator various with wind speed profile. In
addition, the mechanical torque is shown in Fig.10 (c)
Moreover, the torque is negative, indicating input
torque to the system, and it is proportional to cubic
wind speed.
As shown in Fig.10 (d) and Fig.10 (e) respectively, the
maximum power tracking is achieved and hence, the tip
speed ratio λ is maintained at the corresponding
optimal values and the power coefficient Cp is
maintained constant at its maximum value.
.
(a)
(b)
(c)
(d)
Figure 7. Constant speed System response for random
changes in wind speed.
(a)
(b)
(c)
(d)
Figure 8. Variable speed System response for random
changes in wind speed
IV. Simulation Results and Discussion for
Flicker Modeling
Owing to the characteristics of directly-connected
constant-speed wind turbines and the variable speed
DFIG-based wind turbines, the active and reactive
power exchange at the PCC varies according to the
incident wind speed. As a result, the voltage at this
point will fluctuate. Voltage fluctuation caused by
these wind turbines raises certain limitation regarding
the penetration level of the wind generation since it can
result in serious electrical disturbances to the grid.
Consequently, the use of STATCOM to minimize the
0 1 2 3 4 58
9
10
11
12
13
Time, sec
Win
d s
peed
, m
/sec
0 1 2 3 4 50.95
1
1.05
1.1
1.15
Time, sec
Gen
era
tor
sp
eed
, p
u
0 1 2 3 4 56
7
8
9
10
Time, sec
Tip
sp
eed
rati
o, la
md
a
0 1 2 3 4 50.42
0.44
0.46
0.48
0.5
Time, sec
Po
we
r c
off
ec
ien
t, C
p
0 1 2 3 4 58
9
10
11
12
13
Time, sec
Win
d s
pe
ed
, m
/se
c0 1 2 3 4 5
0.9
1
1.1
1.2
Time, sec
Gen
era
tor
sp
eed
, p
u
0 1 2 3 4 54
6
8
10
12
Time, sec
Tip
sp
eed
rati
o, la
md
a
0 1 2 3 4 50.42
0.44
0.46
0.48
0.5
Time, sec
Po
wer
co
ffecie
nt,
Cp
Volume 2 | Issue 3 | May-June-2017 | www.ijsrcseit.com 443
voltage fluctuation for constant speed wind turbines is
essential. The impacts of different factors on the short-
term flicker index, Pst, are presented in the following
subsections.
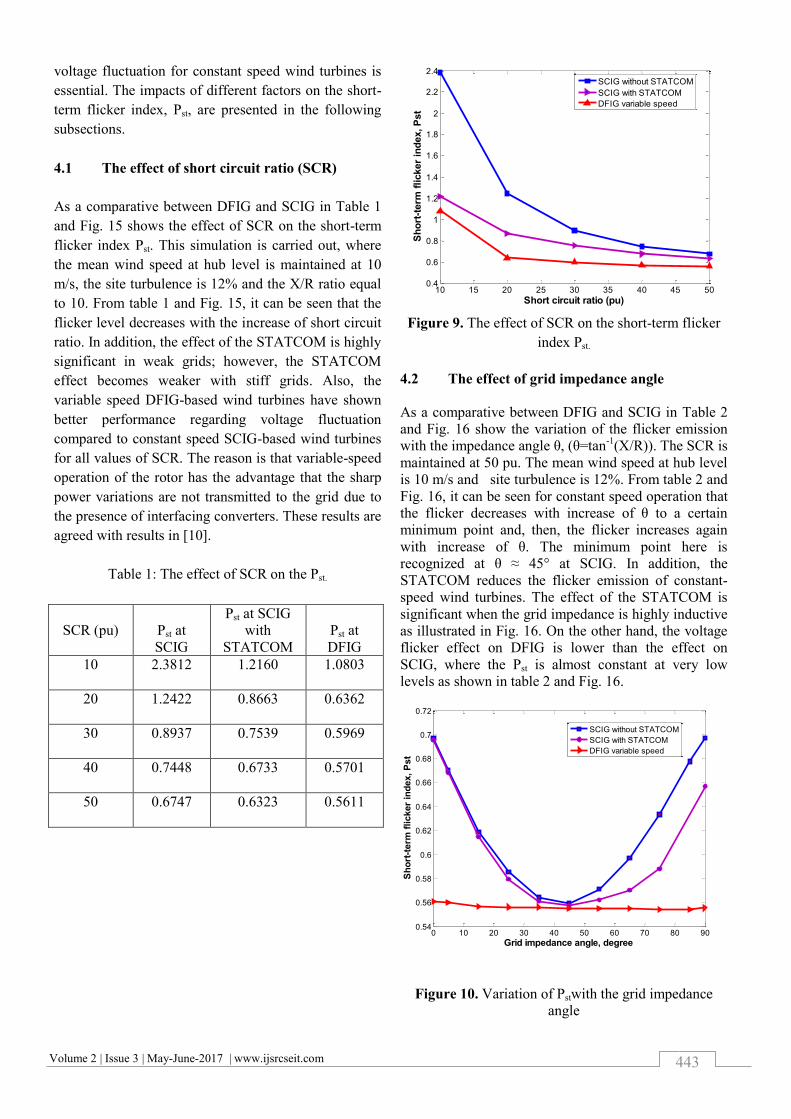
4.1 The effect of short circuit ratio (SCR)
As a comparative between DFIG and SCIG in Table 1
and Fig. 15 shows the effect of SCR on the short-term
flicker index Pst. This simulation is carried out, where
the mean wind speed at hub level is maintained at 10
m/s, the site turbulence is 12% and the X/R ratio equal
to 10. From table 1 and Fig. 15, it can be seen that the
flicker level decreases with the increase of short circuit
ratio. In addition, the effect of the STATCOM is highly
significant in weak grids; however, the STATCOM
effect becomes weaker with stiff grids. Also, the
variable speed DFIG-based wind turbines have shown
better performance regarding voltage fluctuation
compared to constant speed SCIG-based wind turbines
for all values of SCR. The reason is that variable-speed
operation of the rotor has the advantage that the sharp
power variations are not transmitted to the grid due to
the presence of interfacing converters. These results are
agreed with results in [10].
Table 1: The effect of SCR on the Pst.
Pst at
DFIG
Pst at SCIG
with
STATCOM
Pst at
SCIG
SCR (pu)
3..0.1 1.2160 2.3812
10
...1.0 0.8663
1.2422
20
..90.0 0.7539
0.8937
30
..95.3 0.6733
0.7448
40
..9.33 0.6323
0.6747
50
Figure 9. The effect of SCR on the short-term flicker
index Pst.
4.2 The effect of grid impedance angle
As a comparative between DFIG and SCIG in Table 2
and Fig. 16 show the variation of the flicker emission
with the impedance angle θ, (θ=tan-1
(X/R)). The SCR is
maintained at 50 pu. The mean wind speed at hub level
is 10 m/s and site turbulence is 12%. From table 2 and
Fig. 16, it can be seen for constant speed operation that
the flicker decreases with increase of θ to a certain
minimum point and, then, the flicker increases again
with increase of θ. The minimum point here is
recognized at θ ≈ 45° at SCIG. In addition, the
STATCOM reduces the flicker emission of constant-
speed wind turbines. The effect of the STATCOM is
significant when the grid impedance is highly inductive
as illustrated in Fig. 16. On the other hand, the voltage
flicker effect on DFIG is lower than the effect on
SCIG, where the Pst is almost constant at very low
levels as shown in table 2 and Fig. 16.
Figure 10. Variation of Pstwith the grid impedance
angle
10 15 20 25 30 35 40 45 500.4
0.6
0.8
1
1.2
1.4
1.6
1.8
2
2.2
2.4
Short circuit ratio (pu)
Sh
ort
-term
flicker
ind
ex, P
st
SCIG without STATCOM
SCIG with STATCOM
DFIG variable speed
0 10 20 30 40 50 60 70 80 900.54
0.56
0.58
0.6
0.62
0.64
0.66
0.68
0.7
0.72
Grid impedance angle, degree
Sh
ort
-term
flicker
ind
ex, P
st
SCIG without STATCOM
SCIG with STATCOM
DFIG variable speed
Volume 2 | Issue 3 | May-June-2017 | www.ijsrcseit.com 444
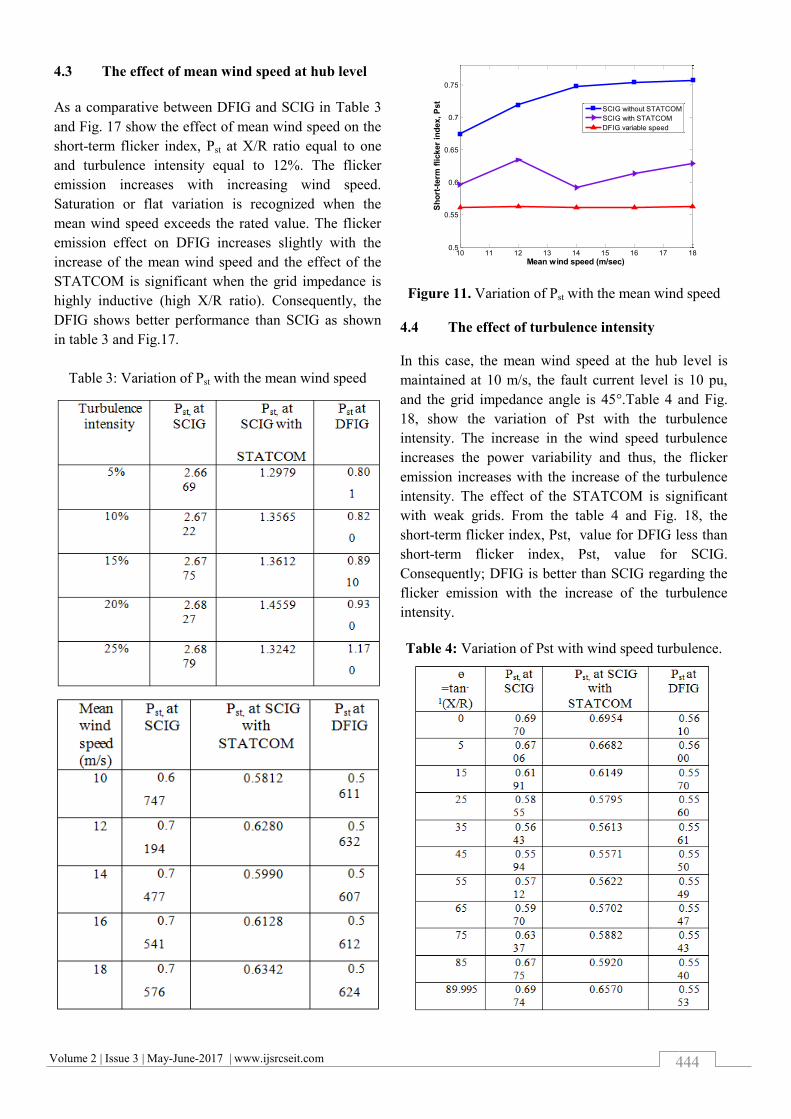
4.3 The effect of mean wind speed at hub level
As a comparative between DFIG and SCIG in Table 3
and Fig. 17 show the effect of mean wind speed on the
short-term flicker index, Pst at X/R ratio equal to one
and turbulence intensity equal to 12%. The flicker
emission increases with increasing wind speed.
Saturation or flat variation is recognized when the
mean wind speed exceeds the rated value. The flicker
emission effect on DFIG increases slightly with the
increase of the mean wind speed and the effect of the
STATCOM is significant when the grid impedance is
highly inductive (high X/R ratio). Consequently, the
DFIG shows better performance than SCIG as shown
in table 3 and Fig.17.
Table 3: Variation of Pst with the mean wind speed
Figure 11. Variation of Pst with the mean wind speed
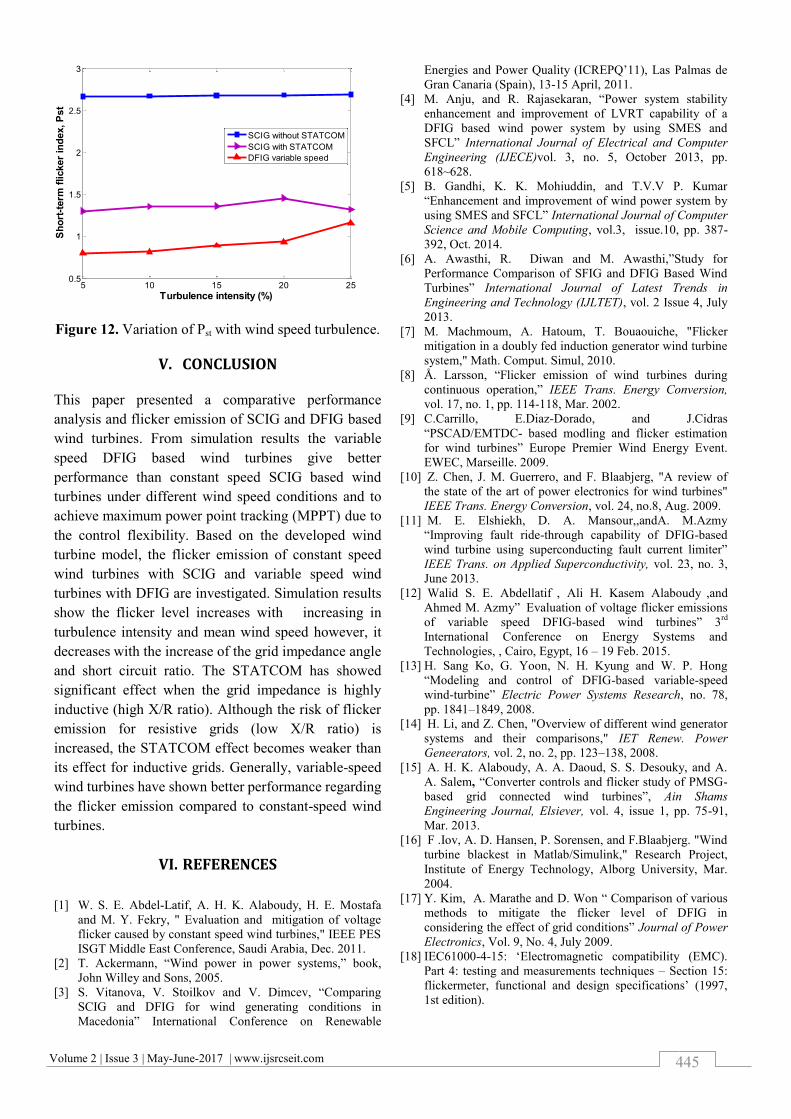
4.4 The effect of turbulence intensity
In this case, the mean wind speed at the hub level is
maintained at 10 m/s, the fault current level is 10 pu,
and the grid impedance angle is 45°.Table 4 and Fig.
18, show the variation of Pst with the turbulence
intensity. The increase in the wind speed turbulence
increases the power variability and thus, the flicker
emission increases with the increase of the turbulence
intensity. The effect of the STATCOM is significant
with weak grids. From the table 4 and Fig. 18, the
short-term flicker index, Pst, value for DFIG less than
short-term flicker index, Pst, value for SCIG.
Consequently; DFIG is better than SCIG regarding the
flicker emission with the increase of the turbulence
intensity.
Table 4: Variation of Pst with wind speed turbulence.
10 11 12 13 14 15 16 17 180.5
0.55
0.6
0.65
0.7
0.75
Mean wind speed (m/sec)
Sh
ort
-term
flicker
ind
ex, P
st
SCIG without STATCOM
SCIG with STATCOM
DFIG variable speed
Volume 2 | Issue 3 | May-June-2017 | www.ijsrcseit.com 445
Figure 12. Variation of Pst with wind speed turbulence.
V. CONCLUSION
This paper presented a comparative performance
analysis and flicker emission of SCIG and DFIG based
wind turbines. From simulation results the variable
speed DFIG based wind turbines give better
performance than constant speed SCIG based wind
turbines under different wind speed conditions and to
achieve maximum power point tracking (MPPT) due to
the control flexibility. Based on the developed wind
turbine model, the flicker emission of constant speed
wind turbines with SCIG and variable speed wind
turbines with DFIG are investigated. Simulation results
show the flicker level increases with increasing in
turbulence intensity and mean wind speed however, it
decreases with the increase of the grid impedance angle
and short circuit ratio. The STATCOM has showed
significant effect when the grid impedance is highly
inductive (high X/R ratio). Although the risk of flicker
emission for resistive grids (low X/R ratio) is
increased, the STATCOM effect becomes weaker than
its effect for inductive grids. Generally, variable-speed
wind turbines have shown better performance regarding
the flicker emission compared to constant-speed wind
turbines.
VI. REFERENCES
[1] W. S. E. Abdel-Latif, A. H. K. Alaboudy, H. E. Mostafa
and M. Y. Fekry, " Evaluation and mitigation of voltage
flicker caused by constant speed wind turbines," IEEE PES
ISGT Middle East Conference, Saudi Arabia, Dec. 2011.
[2] T. Ackermann, “Wind power in power systems,” book,
John Willey and Sons, 2005.
[3] S. Vitanova, V. Stoilkov and V. Dimcev, “Comparing
SCIG and DFIG for wind generating conditions in
Macedonia” International Conference on Renewable
Energies and Power Quality (ICREPQ‟11), Las Palmas de
Gran Canaria (Spain), 13-15 April, 2011.
[4] M. Anju, and R. Rajasekaran, “Power system stability
enhancement and improvement of LVRT capability of a
DFIG based wind power system by using SMES and
SFCL” International Journal of Electrical and Computer
Engineering (IJECE)vol. 3, no. 5, October 2013, pp.
618~628.
[5] B. Gandhi, K. K. Mohiuddin, and T.V.V P. Kumar
“Enhancement and improvement of wind power system by
using SMES and SFCL” International Journal of Computer
Science and Mobile Computing, vol.3, issue.10, pp. 387-
392, Oct. 2014.
[6] A. Awasthi, R. Diwan and M. Awasthi,”Study for
Performance Comparison of SFIG and DFIG Based Wind
Turbines” International Journal of Latest Trends in
Engineering and Technology (IJLTET), vol. 2 Issue 4, July
2013.
[7] M. Machmoum, A. Hatoum, T. Bouaouiche, "Flicker
mitigation in a doubly fed induction generator wind turbine
system," Math. Comput. Simul, 2010.
[8] Å. Larsson, “Flicker emission of wind turbines during
continuous operation,” IEEE Trans. Energy Conversion,
vol. 17, no. 1, pp. 114-118, Mar. 2002.
[9] C.Carrillo, E.Diaz-Dorado, and J.Cidras
“PSCAD/EMTDC- based modling and flicker estimation
for wind turbines” Europe Premier Wind Energy Event.
EWEC, Marseille. 2009.
[10] Z. Chen, J. M. Guerrero, and F. Blaabjerg, "A review of
the state of the art of power electronics for wind turbines"
IEEE Trans. Energy Conversion, vol. 24, no.8, Aug. 2009.
[11] M. E. Elshiekh, D. A. Mansour,,andA. M.Azmy
“Improving fault ride-through capability of DFIG-based
wind turbine using superconducting fault current limiter”
IEEE Trans. on Applied Superconductivity, vol. 23, no. 3,
June 2013.
[12] Walid S. E. Abdellatif , Ali H. Kasem Alaboudy
,and
Ahmed M. Azmy” Evaluation of voltage flicker emissions
of variable speed DFIG-based wind turbines” 3rd
International Conference on Energy Systems and
Technologies, , Cairo, Egypt, 16 – 19 Feb. 2015.
[13] H. Sang Ko, G. Yoon, N. H. Kyung and W. P. Hong
“Modeling and control of DFIG-based variable-speed
wind-turbine” Electric Power Systems Research, no. 78,
pp. 1841–1849, 2008.
[14] H. Li, and Z. Chen, "Overview of different wind generator
systems and their comparisons," IET Renew. Power
Geneerators, vol. 2, no. 2, pp. 123–138, 2008.
[15] A. H. K. Alaboudy, A. A. Daoud, S. S. Desouky, and A.
A. Salem, “Converter controls and flicker study of PMSG-
based grid connected wind turbines”, Ain Shams
Engineering Journal, Elsiever, vol. 4, issue 1, pp. 75-91,
Mar. 2013.
[16] F .Iov, A. D. Hansen, P. Sorensen, and F.Blaabjerg. "Wind
turbine blackest in Matlab/Simulink," Research Project,
Institute of Energy Technology, Alborg University, Mar.
2004.
[17] Y. Kim, A. Marathe and D. Won “ Comparison of various
methods to mitigate the flicker level of DFIG in
considering the effect of grid conditions” Journal of Power
Electronics, Vol. 9, No. 4, July 2009.
[18] IEC61000-4-15: „Electromagnetic compatibility (EMC).
Part 4: testing and measurements techniques – Section 15:
flickermeter, functional and design specifications‟ (1997,
1st edition).
5 10 15 20 250.5
1
1.5
2
2.5
3
Turbulence intensity (%)
Sh
ort
-term
flicker
ind
ex, P
st
SCIG without STATCOM
SCIG with STATCOM
DFIG variable speed

![Control of SCIG Based Constant Voltage Generation Scheme ... · lower wind speed [9]. By integrating battery energy storage system (BESS) in DFIG, power supply remains invariant w.r.t](https://img.pdfslide.net/doc/110x75/5f5b0a2b3734bf32b13106f2/control-of-scig-based-constant-voltage-generation-scheme-lower-wind-speed-9.jpg)