Embed Size (px)
Citation preview
(JETAE) Journal of Emerging Trends in Applied Engineering (ISSN 2518-4059),Vol. 1, No. 3, 2016
Performance Analysis of Spectral AmplitudeCoding OCDMA Detection Techniques
Fahad AteeqDepartment of Electrical Engineering
IQRA National UniversityPeshawar, Pakistan
Abstract—As increase in the number of Internet users dayby day as growth in technology, so demands of Internet usersalso increasing, as such launching new applications like HighDefinition Television(HDTV), video on demand, live streaming,online shopping, online banking and multi player gaming pushesthe telecommunication operators towards the latest structure ofthe access network to fulfill the users ever increasing demandof traffic. These demands have brought many challenges fornetwork providers, especially in the access domain. An opticalfiber cable is already deployed in the metropolitan and corenetworks and now penetrating in access network. It is difficultto use the same expensive optical devices, due to low numberof users sharing the network resources. The Fiber to the Home(FTTH) networks are expected to resolve the last mile bottleneckbetween core and access networks by using passive opticalnetworks (PON) technologies. The existing PONs using timedivision multiplexing (TDM) and wavelength division multiplex-ing (WDM) techniques which are not suitable furthermore forhigh data rates and with minimum cost. In particular, thisresearch concentrates on analysis of comparative performance offamous detection schemes namely the Spectral Direct DetectionTechnique, Complementary Subtraction Detection Technique,AND Subtraction Detection Technique and coding schemes forSAC-OCDMA systems. The SAC-OCDMA systems have abilityto completely eliminate multiple access interference (MAI) andphase induces intensity noise (PIIN). An experimental simulationwas carried out using optisystem and performance of OCDMAnetwork will be analyzed in term of BER with suitable detectionscheme and suitable code.
Index Terms—SAC-OCDMA; multiple access interference(MAI) and phase induces intensity noise (PIIN).
I. INTRODUCTION
FTTH networks are expected to efficiently settle down thelast mile bottle neck between the large size core networksand the end users. PON technology is affected to implementthe future FTTH networks, due to cost efficient and easilyservice upgradability with low impact on existing architecture.Moreover, the use of low cost passive devices between opticalline terminal (OLT) and optical network unit (ONU) or opticalline terminal (ONT) at the users sites has fueled the applicationof PONs into FTTH networks [1], [2].
The Cisco latest projects predict among the years of 2009and 2014, worldwide traffic of Internet will raise by a factorof four with services of live streaming video going to be themost common traffic [3]. Therefore, the transmission withlow noise and design with low cost is critical to manage
the end users high bandwidth needs. The high bandwidth atlow cost has fueled the penetration of optical fiber in theaccess domain. Now there is a enormous attraction to fiberoptic communication systems to use Code Division MultipleAccess (CDMA) technique. This technique is popular amongall the multiple techniques due to their advantages suchas ability to operate asynchronously, flexibly allocating ofchannels, privacy increase and increased capacity of the burstynetworks[4].
For OCDMA system different coding schemes have beenproposed to implement an efficient yet cost effective however;each of them faces disadvantages like high noise, and highequipment cost etc. SAC-OCDMA codes are impressive ap-plicant for easily execution of long-haul transmission of anoptical access network. SAC-OCDMA system has capabilityto suppress the multiple access interference (MAI) and pro-vides a high quality transmission [5]–[7]. Besides that, forsynchronization it does not need any electronics which providea low cost, processing all optical, clarified network control, andefficiency of bandwidth[5].
The most popular codes among the propose codes forOCDMA are Hadamard, Prime codes, and Optical Orthogonalcodes and newly proposed code is MFH code. But still theseall codes experience from different limitations one way oranother. The construction of these codes are also complicated(e.g. OOC and MFH codes), the not ideal cross-correlation(e.g. Hadamard and Prime codes), or too long the code length(e.g. OOC and Prime code). The long code lengths havedisadvantages in its implementation since either very broadband sources or very narrow filter bandwidths are required.A newly proposed code structure depends on double weight(DW) code families for SAC-OCDMA systems [?]. The useof a mapping technique restriction of constant weight of 2 forthe DW code can be relaxed. By using this technique, largenumber of code weights can be developed. Modified Double-Weight (MDW) Code is differential of a DW code family thatcan have a variable weight greater than two and Enhanceddouble-weight (EDW) code is another variation of a DW codefamily that can has a variable weight greater than one.
The EDW code has ideal cross-correlation properties andfor every natural number n exists. It has been notice thattheoretical analysis for EDW has shown much better per-formance compared to Hadamard and Modified Frequency-Hopping (MFH) codes and can support up to 10Gbps data
1
(JETAE) Journal of Emerging Trends in Applied Engineering (ISSN 2518-4059),Vol. 1, No. 3, 2016
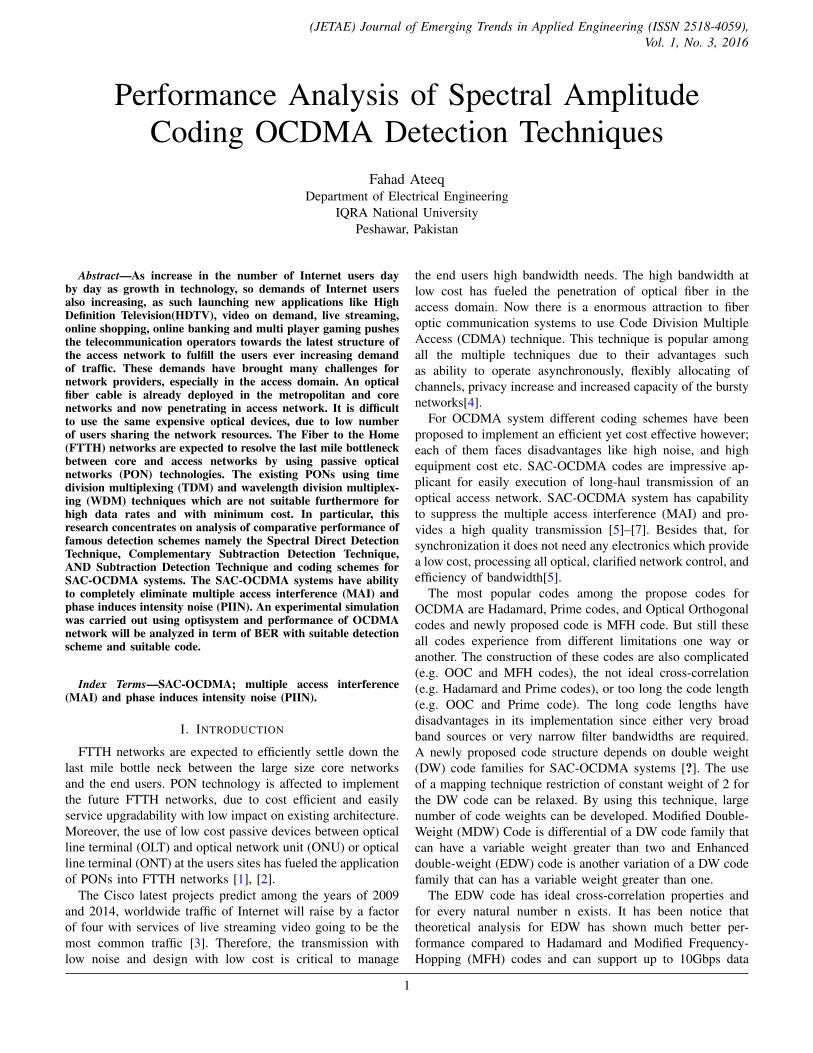
transmissions and a code structure can efficiently suppressintensity noise and hence the bit error rate (BER) performancecan also be improves.Figure 1 and 2 shows the performanceof EDW code as compared to other codes.
Fig. 1: Performance comparison of Hadamard, MFH and EDW code
Fig. 2: Performance comparison of DW and EDW code
The way to an efficient SAC-OCDMA system is the selec-tion of efficient codes and detection techniques for encodingand decoding of the source bits. Different detection techniqueslike direct detection technique, AND subtraction technique,complementary subtraction technique etc, have been proposedto efficiently eliminate MAI, however a complete system withefficient detection technique is still an open issue. The keyobjective of this research is the performance of differentdetection techniques that are employed in SAC OCDMAsystem, and select a suitable scheme which can provide thebest necessary performance in terms of BER.
II. CONSTRUCTION OF EDW CODE
The latest design of DW code is EDW code. The numbergreater than one it may be any odd number, is a weight ofEDW code. In this example, the number of three is used asa weight for the EDW code. The following steps are use toconstructed the EDW code.Step1 :A K x N can represent the EDW code. In the structure of
the EDW codes, the minimum length of code and the numberof users represented by the matrix columns N and rows K
respectively. A matrix 3×6 represents the primary EDW code,as shown below:
H0 =
∣∣∣∣∣∣0 0 : 1 1 : 0 10 1 : 0 0 : 1 11 1 : 0 1 : 0 0
∣∣∣∣∣∣EDW code has similar structure as compared to the basic
DW code and still maintained with a slight modification andonly two overlapping chips are allow in every column tomaintain the double weight pairs.Step2 :A larger number of K can be achieved by using a mapping
technique from the basic matrix as shown in eq. (1),
H1 =
∣∣∣∣∣∣∣∣∣∣∣∣∣∣∣∣∣∣∣∣
0 0 0 0 0 0... 0 0 1 1 0 1
0 0 0 0 0 0... 0 1 0 0 1 1
0 0 0 0 0 0... 1 1 0 1 0 0
· · · · · · · · ·
0 0 1 1 0 1... 0 0 0 0 0 0
0 1 0 0 1 1... 0 0 0 0 0 0
1 1 0 1 0 0... 0 0 0 0 0 0
∣∣∣∣∣∣∣∣∣∣∣∣∣∣∣∣∣∣∣∣H1 =
∣∣∣∣ 0 H0
H0 0
∣∣∣∣ (1)
For any code length N, an EDW code with weight of 3denoted by (N, 3, 1) and related to the number of K user by,N = 2K+ 4
23 [sin(Kπ3 )]2 8
3 [sin((K+1)π
3 )]2+ 43 [sin(
(K+2)π3 )]2
III. DETECTION TECHNIQUES
In SAC-OCDMA system, the detection is considered as oneof the important process to design the system transmitter andreceivers for the enhancement of the system performance [8].In general, the two basic known detection techniques namelycoherent and incoherent are widely used. The knowledge ofthe phase information of the carriers keeps big impact whencoherent detection sends the detection signal, but on the otherhand incoherent detection has no such kinds of knowledgerequired. Alternatively, the incoherent detection is performedin a unipolar approach and coherent is performed in a biopolarbehavior with the coding operation. Furthermore, the inco-herent detection does not need any phase synchronizationand complex hardware, which motivated us to choose theincoherent detection techniques. The well known incoherentdetection techniques are the spectral direct detection technique(SDD), complimentary subtraction technique and AND sub-traction technique and these detection techniques are also lesscomplicated and cost efficient.
A. Spectral Direct Detection Technique
The spectral direct detection technique is totally dissimilarfrom all the other detection techniques in the process ofexecution and in an optical domain only required spectral chipis filtered and at the receiver side does not need any subtraction
2
(JETAE) Journal of Emerging Trends in Applied Engineering (ISSN 2518-4059),Vol. 1, No. 3, 2016
detection technique [9]-[10].Therefore, in this scheme theaffects of MAI and PIIN will not further exists.
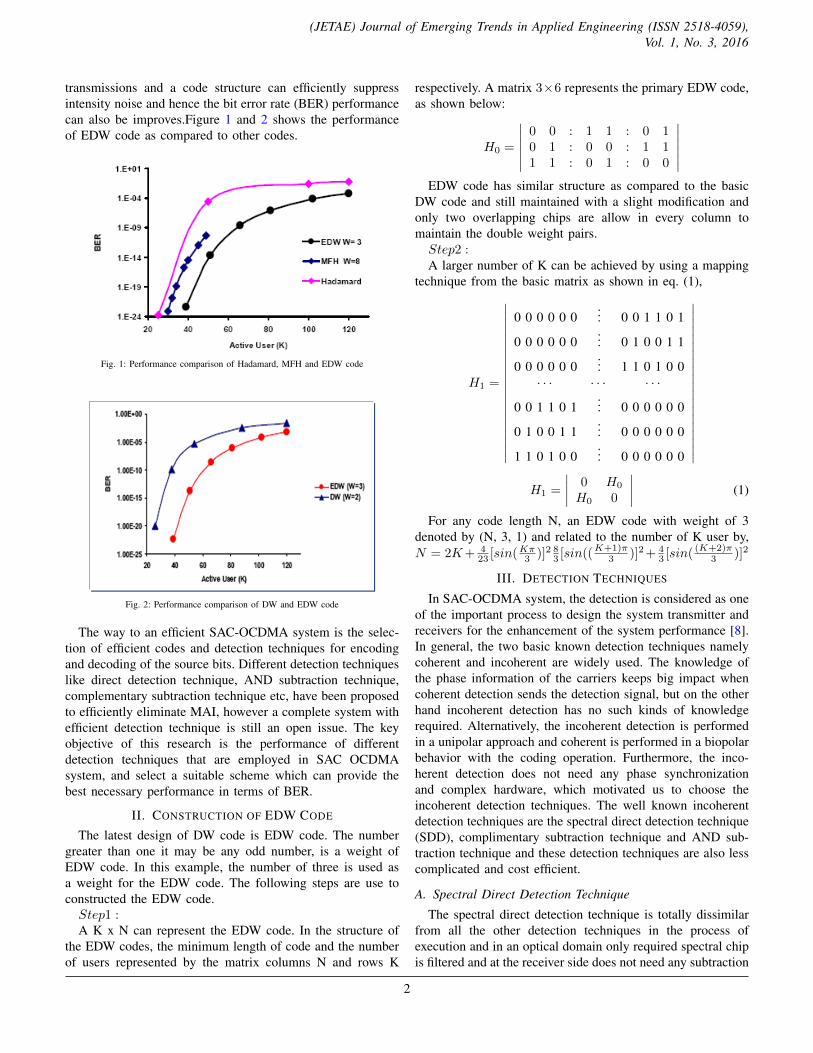
This technique is only valid to those codes, in which thespectral chips of one channel are not overlapped with spectralchips of the other channels, i.e. a minimum of one clean chip inevery code sequence. The circuit design proposed for spectraldirect detection technique is very simple and costless. Figure3 shows the SAC-OCDMA network from OLT to ONT for 32users using the spectral direct detection technique.
Fig. 3: SAC-OCDMA network using the spectral direct detection technique
B. Complementary Subtraction Detection Technique
The complementary detection technique is stable detectiontechnique and the cross-correlation is defined as:
θXY (k) =
N−1∑i=0
xiyi+k (2)
Where X and Y are the OCDMA sequences of code and thecomplement of sequence (X) is given by (X) which basics aregather from (X) by X = 1−X . Let X = 1100 and Y = 0011and therefore X= 0011 [9]-[10]. The sequence of periodiccross correlation is similar among (X) and (Y) is similar asEquation (2) and given as:
θx(k) =
N−1∑i=0
xiyi+k (3)
Now sequence can be consider as θXY (k) = θXY (k). Atthe receiver side the two complementary inputs will detectsby photo detectors which can be connected to the subtractors,whose Z output cross-correlation can be given as:
ZComplementary = θXY (k)− θXY (k) (4)
The architecture of complementary transmitter is as sameas to the direct detection. At the receiver side, the receivedsignal is further split up into two spectral chips branches ofcomplementary. These two branches of spectral signal aresent to a balanced detector that determines the correlationdifference.
The 0 result can be achieve at the end and no more termsrepresenting of cross-correlation at the end of the subtractor. In
the intended channel from other users there is no more signals.Figure 4 shows the SAC-OCDMA network from OLT to ONTfor 32 users using the complementary subtraction detectiontechnique.
Fig. 4: SAC-OCDMA network using the complementary subtraction detection technique
C. AND Subtraction Detection Technique
In AND subtraction technique, the received signal at re-ceiver side is further split up into two spectral chips branchesof AND and have the cross-correlation θX(k) is swap byθX&Y (k) where the θ(X&Y ) between sequences X and Ythe AND operation represented [4], [9]. For example, let X =0011 and Y = 0110 and therefore (X AND Y) = 0010. Nowat the receiver side,
ZAND = θXY (k)− θ(X&Y )(k) (5)
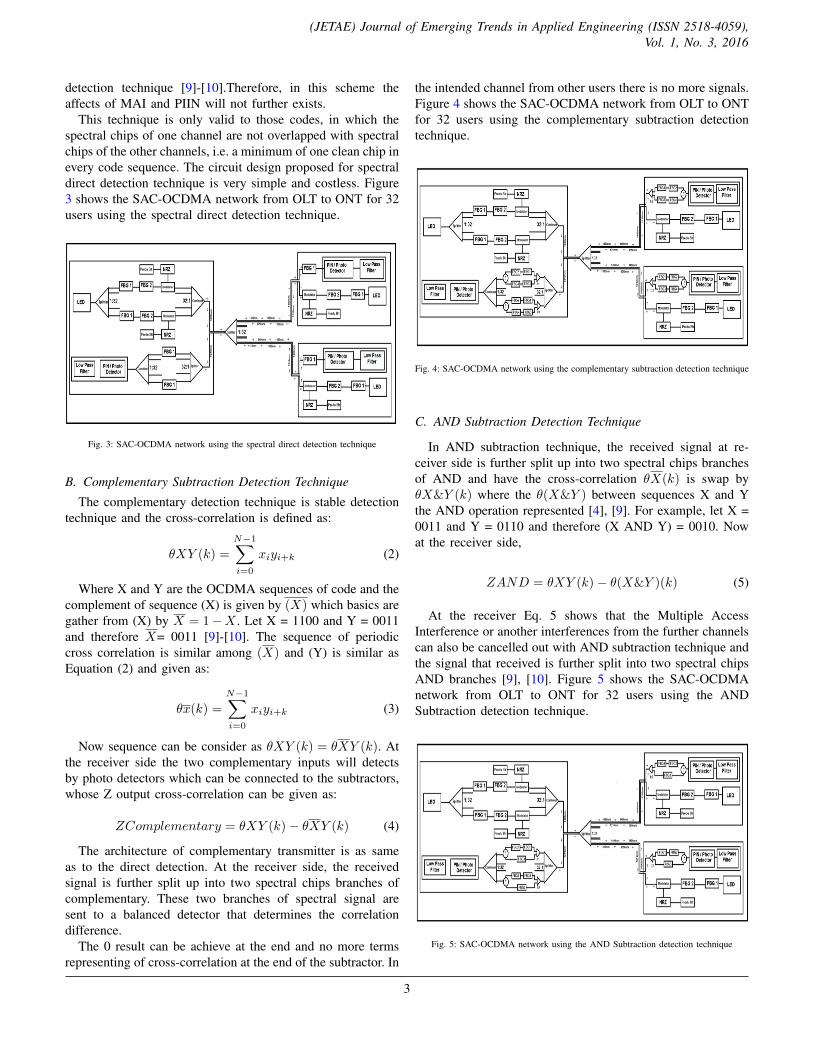
At the receiver Eq. 5 shows that the Multiple AccessInterference or another interferences from the further channelscan also be cancelled out with AND subtraction technique andthe signal that received is further split into two spectral chipsAND branches [9], [10]. Figure 5 shows the SAC-OCDMAnetwork from OLT to ONT for 32 users using the ANDSubtraction detection technique.
Fig. 5: SAC-OCDMA network using the AND Subtraction detection technique
3

(JETAE) Journal of Emerging Trends in Applied Engineering (ISSN 2518-4059),Vol. 1, No. 3, 2016
The compaison between AND subtraction and complemen-tary subtraction technique shown in Table I
TABLE I: Comparison between AND subtraction and complementary subtraction detec-tion technique
ANDSubtraction Technique
ComplementarySubtraction Technique
C1 C2 C3 C4 C1 C2 C3 C4User 1 (X) 0 0 1 1 0 0 1 1User 2 (Y) 0 1 1 0 0 1 1 0
θXY = 1 θXY = 1
X&Y = 0010 X = 1100=1 =1
ZAND = θXY − θX&Y = 0 ZCOM = θXY − θXY = 0
The AND subtraction architect needs less number of filtersin the a at receiver side. The filter is only needed at the locationof overlapping spectra occurring in the code sequences.
In complementary subtraction architect the number of filterrequired depends on the value of weight in the code sequence.The cost and complexity of the system can be minimized andincreased in performance by using less number of filters in thedecoders at the receiver side in detection and the total powerloss can also be minimized.
IV. IMPLEMENTATION OF CODE
In this research we use EDW code for the particular sys-tem of OCDMA and simulate in optisystem. The transmittersections for all the detection techniques using EWD codeare same. The main two important parameters in OCDMAnetworks are designing of encoder and decoder [11]-[12].
This coding scheme is designed in a way to decrease thenumber of FBGs used in the encoder and decoder modulesto maintain the cross-correlation parameter (c) as one. EDWallows the code weight (number of ones in a row) to be inany odd number which is greater than one. The basic EDWcode denoted by (6, 3, 1) is shown below. This can be usedto encode 3 users.
H0 =
∣∣∣∣∣∣0 0 1 1 0 10 1 0 0 1 11 1 0 1 0 0
∣∣∣∣∣∣We can use following code for 6 users,
H1 =
∣∣∣∣∣∣∣∣∣∣∣∣
0 0 0 0 0 0 0 0 1 1 0 10 0 0 0 0 0 0 1 0 0 1 10 0 0 0 0 0 1 1 0 1 0 00 0 1 1 0 1 0 0 0 0 0 00 1 0 0 1 1 0 0 0 0 0 01 1 0 1 0 0 0 0 0 0 0 0
∣∣∣∣∣∣∣∣∣∣∣∣
The EDW basic code denoted by (24, 3, 1) is shown below.This can be used to encode 12 users.
H2 =
∣∣∣∣∣∣∣∣∣∣∣∣∣∣∣∣∣∣∣∣∣∣∣∣
0 0 0 0 0 0 0 0 0 0 0 0 0 0 0 0 0 0 0 0 1 1 0 10 0 0 0 0 0 0 0 0 0 0 0 0 0 0 0 0 0 0 1 0 0 1 10 0 0 0 0 0 0 0 0 0 0 0 0 0 0 0 0 0 1 1 0 1 0 00 0 0 0 0 0 0 0 0 0 0 0 0 0 1 1 0 1 0 0 0 0 0 00 0 0 0 0 0 0 0 0 0 0 0 0 1 0 0 1 1 0 0 0 0 0 00 0 0 0 0 0 0 0 0 0 0 0 1 1 0 1 0 0 0 0 0 0 0 00 0 0 0 0 0 0 0 1 1 0 1 0 0 0 0 0 0 0 0 0 0 0 00 0 0 0 0 0 0 1 0 0 1 1 0 0 0 0 0 0 0 0 0 0 0 00 0 0 0 0 0 1 1 0 1 0 0 0 0 0 0 0 0 0 0 0 0 0 00 0 1 1 0 1 0 0 0 0 0 0 0 0 0 0 0 0 0 0 0 0 0 00 1 0 0 1 1 0 0 0 0 0 0 0 0 0 0 0 0 0 0 0 0 0 01 1 0 1 0 0 0 0 0 0 0 0 0 0 0 0 0 0 0 0 0 0 0 0
∣∣∣∣∣∣∣∣∣∣∣∣∣∣∣∣∣∣∣∣∣∣∣∣In EDW code, one pair of ones (higher bits) is present
in every code word (Row). Thus in encoder or decoder thenumber of FBG used can be minimized by half since a broaderline width single FBG represent the pair of chips as shown inFig. 6.
Fig. 6: Wavelengths assignment for EDW Codes
The EDW code in order to implement in OCDMA networka specific wavelength is assigned to each column of bits inthe basic EDW code matrix. A range of wavelength startingfrom 1551nm to 1557.9nm with a chip width of 0.3 nm isassumed here. The wavelength assignment corresponding tothe column of bits is shown in Fig. 6. In a 12 user networkFBG will encode wavelengths which are represented by thewavelength values of 1557.15nm (λ21, 22), 1557.9nm (λ24)for the first code word (row), 1556.7nm (λ20), 1557.75nm(λ23, 24) for the second code word and 1556.55nm (λ19, 20),1557.3nm (λ22) for the third code word and its go up to for
4
(JETAE) Journal of Emerging Trends in Applied Engineering (ISSN 2518-4059),Vol. 1, No. 3, 2016
twelve code word which will be 1551nm (λ1, 2), 1551.9nm(λ4) as shown.
A. Encoder Design
The 8 user network is analyzed here. The wavelengthassignment for FBG is shown in Table II.
TABLE II: Centre Wavelength assignment for FBGs at the encoder side
User FBG Centre Wavelengths(nm)
Bandwidth(nm)
User1 FBG1FBG2
1557.151557.9
0.60.3
User2 FBG3FBG4
1556.71557.75
0.30.6
User3 FBG5FBG6
1556.551557.3
0.60.3
User4 FBG7FBG8
1555.351556.1
0.60.3
User5 FBG9FBG10
1554.91555.95
0.30.6
User6 FBG11FBG12
1554.751555.5
0.60.3
User7 FBG13FBG14
1553.551554.3
0.60.3
User8 FBG15FBG16
155.311553.13
0.30.6
The setup model for encoder module in this design is shownin Fig. 7. A FBGs arrangement in series is used for thewavelengths to encode. The branches that are reflected aremerge together to construct the code. In Channel 1 the firstFBG1 of the transmitted branch is linked with the secondFBG2 and in channel 2 first FBG3 of the transmitted branchis linked with the second FBG4 and its goes up to 8 channelswhere all FBGs are linked to the broadband source directly.
Fig. 7: Encoder Module for 8 user network
B. Decoder Design
Three detection techniques like Spectral Direct, Compli-mentary subtraction, AND subtraction detection techniques areanalyzed here. Either one of these can be used for the decodingpurpose.
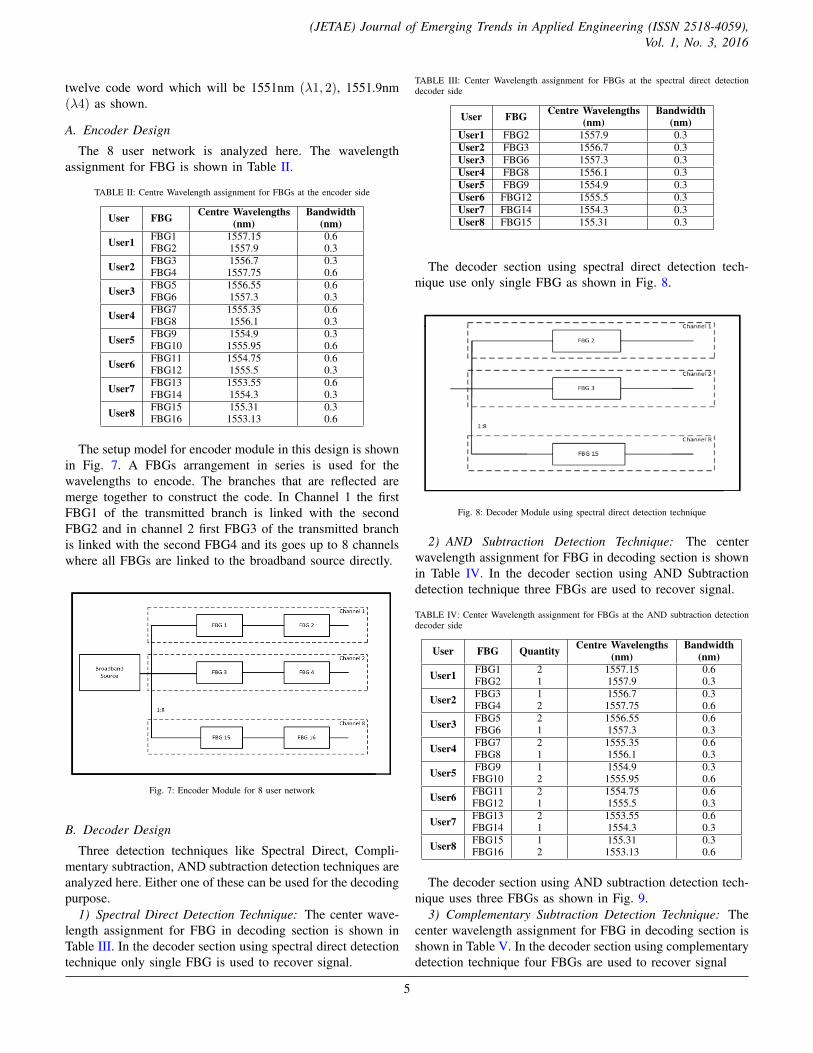
1) Spectral Direct Detection Technique: The center wave-length assignment for FBG in decoding section is shown inTable III. In the decoder section using spectral direct detectiontechnique only single FBG is used to recover signal.
TABLE III: Center Wavelength assignment for FBGs at the spectral direct detectiondecoder side
User FBG Centre Wavelengths(nm)
Bandwidth(nm)
User1 FBG2 1557.9 0.3User2 FBG3 1556.7 0.3User3 FBG6 1557.3 0.3User4 FBG8 1556.1 0.3User5 FBG9 1554.9 0.3User6 FBG12 1555.5 0.3User7 FBG14 1554.3 0.3User8 FBG15 155.31 0.3
The decoder section using spectral direct detection tech-nique use only single FBG as shown in Fig. 8.
Fig. 8: Decoder Module using spectral direct detection technique
2) AND Subtraction Detection Technique: The centerwavelength assignment for FBG in decoding section is shownin Table IV. In the decoder section using AND Subtractiondetection technique three FBGs are used to recover signal.
TABLE IV: Center Wavelength assignment for FBGs at the AND subtraction detectiondecoder side
User FBG Quantity Centre Wavelengths(nm)
Bandwidth(nm)
User1 FBG1FBG2
21
1557.151557.9
0.60.3
User2 FBG3FBG4
12
1556.71557.75
0.30.6
User3 FBG5FBG6
21
1556.551557.3
0.60.3
User4 FBG7FBG8
21
1555.351556.1
0.60.3
User5 FBG9FBG10
12
1554.91555.95
0.30.6
User6 FBG11FBG12
21
1554.751555.5
0.60.3
User7 FBG13FBG14
21
1553.551554.3
0.60.3
User8 FBG15FBG16
12
155.311553.13
0.30.6
The decoder section using AND subtraction detection tech-nique uses three FBGs as shown in Fig. 9.
3) Complementary Subtraction Detection Technique: Thecenter wavelength assignment for FBG in decoding section isshown in Table V. In the decoder section using complementarydetection technique four FBGs are used to recover signal
5
(JETAE) Journal of Emerging Trends in Applied Engineering (ISSN 2518-4059),Vol. 1, No. 3, 2016
Fig. 9: Decoder Module using AND subtraction detection technique
TABLE V: Center Wavelength assignment for FBGs at the complementary subtractiondetection decoder side
User FBG Centre Wavelengths(nm)
Bandwidth(nm)
User1
FBG1FBG2
FBG17FBG18
1557.151557.9
1555.951557.6
0.60.30.60.3
User2
FBG3FBG4
FBG19FBG20
1556.71557.751556.4
1557.15
0.30.60.30.6
User3
FBG5FBG6
FBG21FBG22
1556.551557.3
1554.751557.9
0.60.30.603
User4
FBG7FBG8
FBG23FBG24
1555.351556.1
1554.151557.6
0.60.30.60.3
User5
FBG9FBG10FBG25FBG26
1554.91555.951554.3
1557.15
0.30.60.30.6
User6
FBG11FBG12FBG27FBG28
1554.751555.5
1553.251557
0.60.30.60.3
User7
FBG13FBG14FBG 29FBG30
1553.551554.3
1552.351555.8
0.60.30.60.3
User8
FBG15FBG16FBG31FBG31
155.311553.131552.2
1557.15
0.30.60.30.6
The decoder section using complementary subtraction de-tection technique uses four FBGs as shown in Fig. 10.
V. SIMULATION SETUP
The particular system setup of SAC OCDMA using EDWcode is simulated by Opti System. In the transmitter part, eachof transmitters consists of six components; a dc bias generator,a LED, Uniform Fiber Bragg Gratings (FBGs), a Pseudo-Random Bit Sequence (PRBS) generator, a Non-Return toZero (NRZ) pulse generator and a Mach-Zehnder Modulator.Each chip has a 0.3 nm spectral width. The tests wereper-formed at a data rate of 1.5 Gb/s and 2 Gb/s for a 15, 20 and
Fig. 10: Decoder Module using complimentary subtraction detection technique
25 KM transmission length with the ITU-T G.652 standardsingle mode optical fiber (SMF). The data stream modulatesa LED central wavelength of 1550 nm and bandwidth 20 nm.All the attenuation a (i.e.0.2dB/km), dispersion (i.e.18ps/nmkm), polarization mode dispersion coefficient (i.e.0.075ps/km)and activated of nonlinear effects and specified according tothe typical industry values to simulate the real environmentas close as possible. The performances of the system weredescribed by referring to the Bit Error Rate (BER), aftertransmission we used a splitters followed by a FBGs Filtersand adder/subtractors to decode the code at the data level.
The decoded signal paased by a photo detector(PD) and thenby low pass filter (LPF). At the receiver, the noise generatedwas made to be random and totally uncorrelated. The value ofdark current value 10nA, and the coefficient of thermal noisewas 1×10⁻²² W/Hz for every the photo-detector. The systemperformance was characterized by referring to the eye patternand the Bit Error Rate (BER).
VI. RESULT ANALYSIS
SAC-OCDMA using EDW code along with NRZ, PRBSsignals at different data rates like 1.5 Gb/s and 2 Gb/s withdifferent transmission lengths 15 KM, 20 KM and 25 KM. Eyediagram is the methodology used to analyze the performanceof the system. As the signal passes through the fiber, distortionmay occur which affects the receiver side spectrum. The BERof different detection technique are given below.
A. Spectral Direct Detection Technique
The BER of user obtained from different data rates andtransmission lengths using spectral direct detection techniqueare shown in Table VI.
TABLE VI: BER using spectral direct detection technique
Spectral Direct Detection Technique
Data Rate TransmissionLength
BERUser 1
1.5Gb 15KM 1.35× 10⁻²³
1.5Gb 20KM 2.03× 10⁻²³
1.5Gb 25KM 2.45× 10⁻²²
2Gb 15KM 9.86× 10⁻²²
2Gb 20KM 1.02× 10⁻¹⁶
2Gb 25KM 2.01× 10⁻¹¹
6

(JETAE) Journal of Emerging Trends in Applied Engineering (ISSN 2518-4059),Vol. 1, No. 3, 2016
The BER of user using spectral direction detection tech-nique as shown in Fig. 11.
Fig. 11: BER versus different data rates and transmission lengths using spectral directdetection technique
The eye diagrams for spectral direction detection techniqueas shown in Fig. 12(a), 12(b), 13(a), 13(b), 14(a) and 14(b)respectively.
Fig. 12: Eye diagrams of direct detection technique using data rate 1.5 Gb/s(a)transmission length 15 KM and (b)transmission length 20 KM
B. AND Subtraction Detection Technique
The BER of user obtained from different data rates andtransmission lengths using AND subtraction detection tech-nique is shown in Table VII.
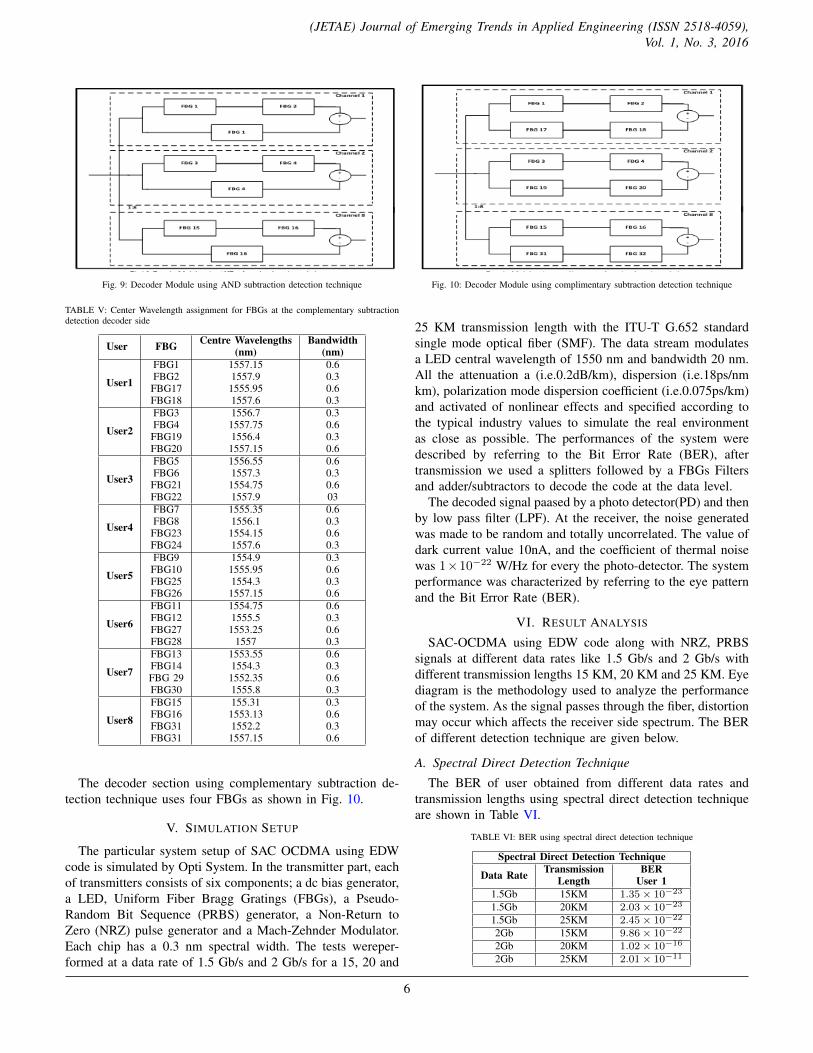
The BER of user using AND subtraction detection techniqueas shown in Fig. 15.
The receiver side eye diagrams for AND subtraction de-tection technique as shown in Fig. 16(a), 16(b), 17(a), 17(b),18(a) and 18(b) respectively.
Fig. 13: Eye diagrams of direct detection technique using data rate 2 Gb/s (a)transmissionlength 15 KM and (b)transmission length 20 KM
Fig. 14: Eye diagrams of direct detection technique using data rate 2.5 Gb/s(a)transmission length 15 KM and (b)transmission length 20 KM
TABLE VII: BER using AND subtraction detection technique
AND Subtraction Detection Technique
Data Rate TransmissionLength
BERUser 1
1.5Gb 15KM 1.6× 10⁻¹⁵
1.5Gb 20KM 2.8× 10⁻¹⁵
1.5Gb 25KM 4.9× 10⁻¹⁴
2Gb 15KM 3.4× 10⁻¹²
2Gb 20KM 2.8× 10⁻¹¹
2Gb 25KM 1.4× 10⁻⁸
7
(JETAE) Journal of Emerging Trends in Applied Engineering (ISSN 2518-4059),Vol. 1, No. 3, 2016
Fig. 15: BER versus different data rates and transmission lengths using AND subtractiondetection technique
Fig. 16: Eye diagrams of AND subtraction technique using data rate 1.5 Gb/s(a)transmission length 15 KM and (b)transmission length 20 KM
Fig. 17: Eye diagrams of AND subtraction technique using data rate 2 Gb/s(a)transmission length 15 KM and (b)transmission length 20 KM
Fig. 18: Eye diagrams of AND subtraction technique using data rate 2.5 Gb/s(a)transmission length 15 KM and (b)transmission length 20 KM
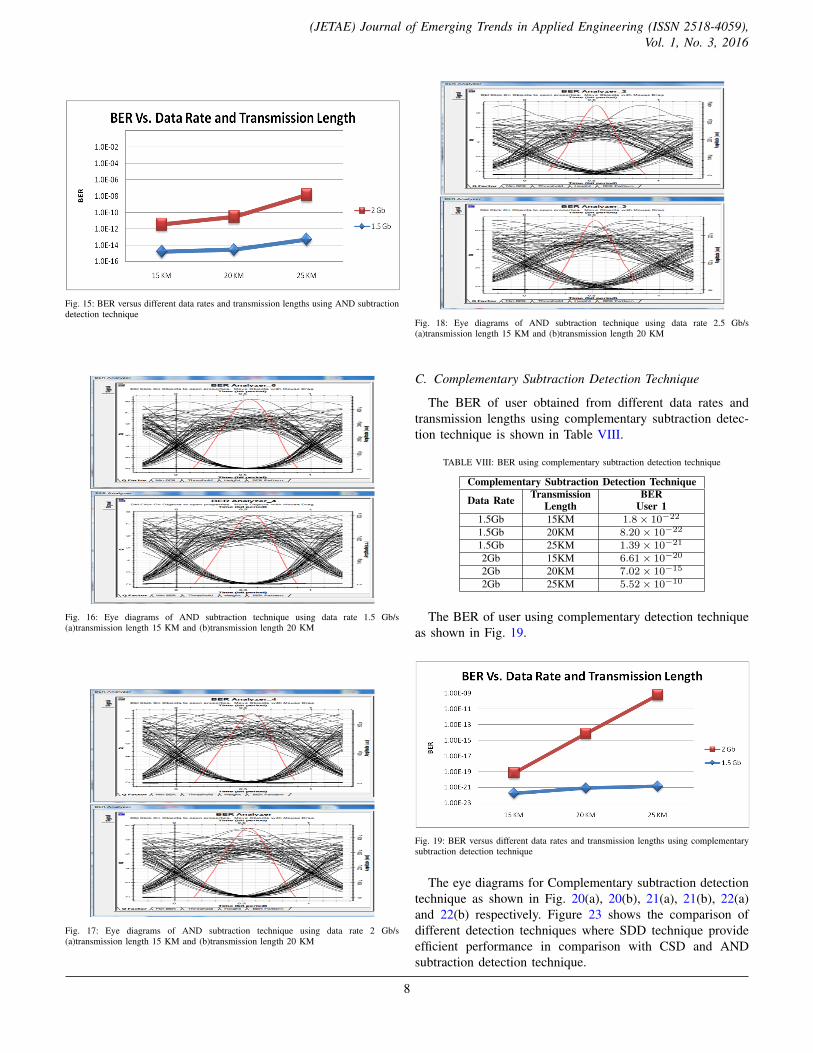
C. Complementary Subtraction Detection Technique
The BER of user obtained from different data rates andtransmission lengths using complementary subtraction detec-tion technique is shown in Table VIII.
TABLE VIII: BER using complementary subtraction detection technique
Complementary Subtraction Detection Technique
Data Rate TransmissionLength
BERUser 1
1.5Gb 15KM 1.8× 10⁻²²
1.5Gb 20KM 8.20× 10⁻²²
1.5Gb 25KM 1.39× 10⁻²¹
2Gb 15KM 6.61× 10⁻²⁰
2Gb 20KM 7.02× 10⁻¹⁵
2Gb 25KM 5.52× 10⁻¹⁰
The BER of user using complementary detection techniqueas shown in Fig. 19.
Fig. 19: BER versus different data rates and transmission lengths using complementarysubtraction detection technique
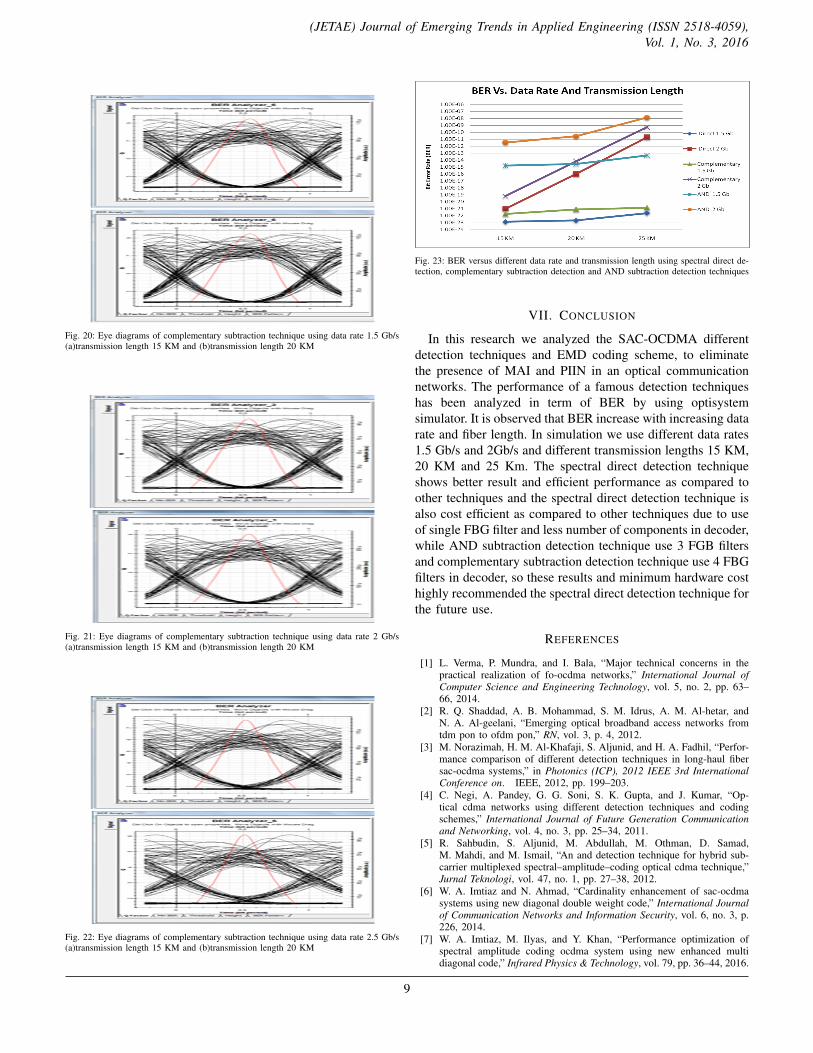
The eye diagrams for Complementary subtraction detectiontechnique as shown in Fig. 20(a), 20(b), 21(a), 21(b), 22(a)and 22(b) respectively. Figure 23 shows the comparison ofdifferent detection techniques where SDD technique provideefficient performance in comparison with CSD and ANDsubtraction detection technique.
8
(JETAE) Journal of Emerging Trends in Applied Engineering (ISSN 2518-4059),Vol. 1, No. 3, 2016
Fig. 20: Eye diagrams of complementary subtraction technique using data rate 1.5 Gb/s(a)transmission length 15 KM and (b)transmission length 20 KM
Fig. 21: Eye diagrams of complementary subtraction technique using data rate 2 Gb/s(a)transmission length 15 KM and (b)transmission length 20 KM
Fig. 22: Eye diagrams of complementary subtraction technique using data rate 2.5 Gb/s(a)transmission length 15 KM and (b)transmission length 20 KM
Fig. 23: BER versus different data rate and transmission length using spectral direct de-tection, complementary subtraction detection and AND subtraction detection techniques
VII. CONCLUSION
In this research we analyzed the SAC-OCDMA differentdetection techniques and EMD coding scheme, to eliminatethe presence of MAI and PIIN in an optical communicationnetworks. The performance of a famous detection techniqueshas been analyzed in term of BER by using optisystemsimulator. It is observed that BER increase with increasing datarate and fiber length. In simulation we use different data rates1.5 Gb/s and 2Gb/s and different transmission lengths 15 KM,20 KM and 25 Km. The spectral direct detection techniqueshows better result and efficient performance as compared toother techniques and the spectral direct detection technique isalso cost efficient as compared to other techniques due to useof single FBG filter and less number of components in decoder,while AND subtraction detection technique use 3 FGB filtersand complementary subtraction detection technique use 4 FBGfilters in decoder, so these results and minimum hardware costhighly recommended the spectral direct detection technique forthe future use.
REFERENCES
[1] L. Verma, P. Mundra, and I. Bala, “Major technical concerns in thepractical realization of fo-ocdma networks,” International Journal ofComputer Science and Engineering Technology, vol. 5, no. 2, pp. 63–66, 2014.
[2] R. Q. Shaddad, A. B. Mohammad, S. M. Idrus, A. M. Al-hetar, andN. A. Al-geelani, “Emerging optical broadband access networks fromtdm pon to ofdm pon,” RN, vol. 3, p. 4, 2012.
[3] M. Norazimah, H. M. Al-Khafaji, S. Aljunid, and H. A. Fadhil, “Perfor-mance comparison of different detection techniques in long-haul fibersac-ocdma systems,” in Photonics (ICP), 2012 IEEE 3rd InternationalConference on. IEEE, 2012, pp. 199–203.
[4] C. Negi, A. Pandey, G. G. Soni, S. K. Gupta, and J. Kumar, “Op-tical cdma networks using different detection techniques and codingschemes,” International Journal of Future Generation Communicationand Networking, vol. 4, no. 3, pp. 25–34, 2011.
[5] R. Sahbudin, S. Aljunid, M. Abdullah, M. Othman, D. Samad,M. Mahdi, and M. Ismail, “An and detection technique for hybrid sub-carrier multiplexed spectral–amplitude–coding optical cdma technique,”Jurnal Teknologi, vol. 47, no. 1, pp. 27–38, 2012.
[6] W. A. Imtiaz and N. Ahmad, “Cardinality enhancement of sac-ocdmasystems using new diagonal double weight code,” International Journalof Communication Networks and Information Security, vol. 6, no. 3, p.226, 2014.
[7] W. A. Imtiaz, M. Ilyas, and Y. Khan, “Performance optimization ofspectral amplitude coding ocdma system using new enhanced multidiagonal code,” Infrared Physics & Technology, vol. 79, pp. 36–44, 2016.
9
(JETAE) Journal of Emerging Trends in Applied Engineering (ISSN 2518-4059),Vol. 1, No. 3, 2016
[8] R. K. Z. Sahbudin, M. Abdullah, M. Mokhtar, S. Hitam, A. Anas,and S. Barirah, “Design and cost performance of decoding techniquefor hybrid subcarrier spectral amplitude coding-optical code divisionmultiple access system.” Journal of Computer Science, vol. 7, no. 10,pp. 1525–1531, 2011.
[9] N. Ahmed, S. Aljunid, R. Ahmad, H. A. Fadil, and M. Rashid, “Novelocdma detection technique based on modified double weight code foroptical access network,” Elektronika ir Elektrotechnika, vol. 18, no. 8,pp. 117–121, 2012.
[10] M. K. Abdullah, F. N. Hasoon, S. A. Aljunid, and S. Shaari, “Per-formance of ocdma systems with new spectral direct detection (sdd)technique using enhanced double weight (edw) code,” Optics Commu-nications, vol. 281, no. 18, pp. 4658–4662, 2008.
[11] A. Kaur and G. Singh, “Performance comparison of various detectiontechniques for sac-ocdma system using dw and mdw code,” in Com-puting and Communication (IEMCON), 2015 International Conferenceand Workshop on. IEEE, 2015, pp. 1–6.
[12] S. J. Syed Alwee Aljunid, M. Othman, S. NSM, M. Samad, R. Sa-habudin, A. Mohamad Khazani et al., “Spectral amplitude coding ocdmausing and subtraction technique,” 2007.
10