Embed Size (px)
Citation preview
Performance and Availability Benefits of Global
Overlay Routing
Hariharan S. Rahul ∗ Mangesh Kasbekar †
Ramesh K. Sitaraman ‡ Arthur W. Berger §
1 Introduction
There have been several inflection points in human history where an inno-vation changed every aspect of human life in a fundamental and irreversiblemanner. There is no doubt that we are now in the midst of a new inflec-tion point: the Internet revolution. However, if the Internet is to realize itspromise of being the next revolutionary global communication medium, weneed to achieve the five grand challenges that this technology offers: perfectavailability , high performance, “infinite” scalability , complete security , and,last but not the least, affordable cost .
As the Internet was never designed to be a mission-critical communica-tion medium, it is perhaps not surprising that it does not provide much ofwhat we require from it today. Therefore, significant scientific and techno-logical innovation is required to bring the Internet’s potential to fruition.Content Delivery Networks (CDNs, for short) that overlay the traditionalInternet show great promise and is projected as the technology of the futurefor achieving these objectives.
∗MIT Computer Science and Artificial Intelligence Laboratory, Cambridge, MA 02139
USA. [email protected].†Akamai Technologies, Staines, TW18 4EP, UK. [email protected].‡Department of Computer Science, University of Massachusetts, Amherst, MA 01003,
USA. [email protected].§MIT Computer Science and Artificial Intelligence Laboratory, Cambridge, MA 02139,
USA and Akamai Technologies, Cambridge, MA 02142, USA. [email protected].
1
1.1 Architecture of CDNs Revisited
To set the context, we briefly review the evolution and architecture of com-mercial CDNs. Please see Chapter 1 for a more detailed overview. Before theexistence of CDNs, content providers typically hosted a centralized clusterof Web and streaming servers at a data center and served content to a globalaudience of end users (a.k.a clients). However, this solution falls significantlyshort of meeting the critical requirements of availability, performance, andscalability. It suffers from both the first-mile bottleneck of getting contentfrom the origin servers into the Internet, and the middle-mile bottleneckof transporting the content across multiple long-haul networks and peeringpoints to the access network of the client. On the first-mile, the data centeritself is a single point of failure. Any connectivity problems at the data cen-ter such as an overloaded or faulty switch can result in reduced availabilityor even a complete outage. On the middle mile, transporting the contentover the long-haul through potentially congested peering points significantlydegrades both availability and performance by increasing round-trip laten-cies and loss. Further, there is no protection against a flash-crowd, unlessthe data center is grossly over-provisioned to start with.
One can alleviate some of the shortcomings of the traditional hostingsolution by multihoming the data center where the content is hosted [3].This is achieved by provisioning multiple links to the data center via multi-ple network providers and specifying routing policies to control traffic flowson the different network links. A different but complementary approachto alleviate the problems of centralized hosting is mirroring the content inmultiple data centers located in different networks and geographies. Both ofthese approaches ameliorate some of the first-mile availability concerns withcentralized hosting where the failure of a single datacenter or network canbring the Website down. But, middle-mile degradations and scalability re-main issues. Additionally, the operational cost and complexity are increasedas multiple links and/or data centers must be actively managed. Further,network and server resources need to be overprovisioned, since a subset ofthe links and/or data centers must be able to handle the entire load incase of failures. As the quest for more availability and greater performancedrive up the need for more multi-homed mirrors with larger server-farms,all of which mean more infrastructure costs, a CDN with a large shareddistributed platform becomes attractive.
A CDN is a distributed network of servers that act as an overlay on topof the Internet with the goal of serving content to clients with high per-formance, high reliability, high scalability and low cost. A highly-simplified
2
TRANSPORT
MAPPINGMONITORING
EDGE
PORTAL
END
USERS
INFRASTRUCTURE
CONTROL
DATA
1
2
3 4
5
6
7
8
ORIGIN
Figure 1: High-level architecture of a CDN
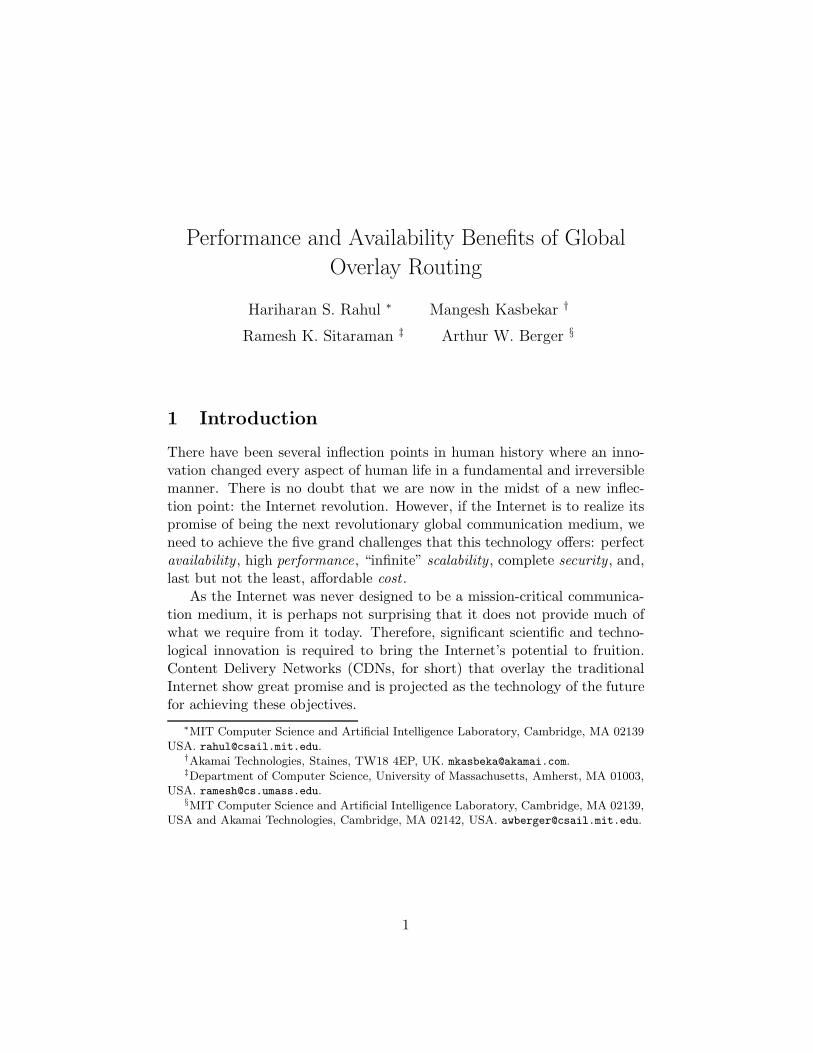
architectural diagram consisting of five major components is shown in Fig. 1.
Edge system. This system consist of Web, streaming, or applicationedge servers located close to the clients at the “edges” of the Internet. A ma-jor CDN has tens of thousands of servers situated in thousands of networks(ISPs) located in all key geographies around the world. The edge systemdownloads content from the origin system (Arrow 1 in Fig. 1), caches it whenrelevant, and serves it out to the clients. A more sophisticated system mayalso perform application processing to dynamically construct the content atthe edge before delivering it to the client.
Monitoring system. This system monitors in real-time both the “In-ternet weather” and the health of all the components of the CDN, includingthe edge servers. Input (5) in Fig. 1 from the Internet cloud could con-sist of slow-changing information such as BGP feeds from tens of thousandsof networks, and fast-changing performance information collected throughtraceroutes and “pings” between hundreds of thousands of points in the In-ternet. Input (8) consists of detailed information about edge servers, routers,and other system components, including their liveness, load, and resourceusage.
Mapping system. The job of the mapping system is to direct clients to
3
their respective “optimal” edge servers to download the requested content(Arrow 6). The common mechanism that mapping uses to direct clientsto their respective target edge servers is the Domain Name System (DNS,Arrow 7). Typically, a content provider’s domain www.cp.com is aliased (i.e.CNAME’d) to a domain hosted by the CDN, such as www.cp.com.cdn.net.A name lookup by a client’s nameserver of the latter domain results inthe target server’s ip being returned [10]. Mapping must ensure that it“maps” each client request to an “optimum” target server that possessesthe following properties: (a) the target server is live and is likely to havethe requested content and is capable of serving it; (b) the target server isnot overloaded, where load is measured in terms of CPU, memory, disk andnetwork utilization; (c) the target server has good network connectivity tothe client, example, little or no packet loss and small round-trip latencies.To make its decisions, mapping takes as input both the Internet weatherand the condition of the edge servers from the monitoring system (Input 4),and an estimate of traffic generated by each nameserver on the Internet andperforms a complex optimization to produce an assignment.
Transport system. This system is responsible for transporting dataover the long-haul across the Internet. The types of content transported bythe system is varied and have different quality-of-service requirements, whichmakes the design of this system very challenging. For instance, transportinglive streaming content from the origin (i.e. encoders) to the edge servers hasa different set of requirements, as compared to transporting dynamic Webcontent from origin to the edge. The challenge of course is designing a smalland maintainable set of general-purpose mechanisms and abstractions thatcan satisfy the diverse requirements.
Origin system. This system originates the content that is served out toa global audience of the clients, and as such a large CDN could have tens ofthousands of origin systems (one or more per content provider) that interactwith the rest of the CDN. The origin Web infrastructure may include appli-cation, database, and Web servers. The origin infrastructure for streamingmedia could include large fault-tolerant replicated storage servers for storingon-demand (i.e. pre-recorded) content or equipment for video capture andencoding for live content. The origin infrastructure is usually (but not al-ways) operated by the content provider, typically out of a single data centerthat is in a some cases multihomed and/or mirrored. The origin system alsoincludes the portal operated by the CDN that is the “command center” forthe content provider to provision and control their content (Arrows 2 and3).
4
Reflectors
Edge Servers
Entry PointsS
I J
D
An Encoder
An End User
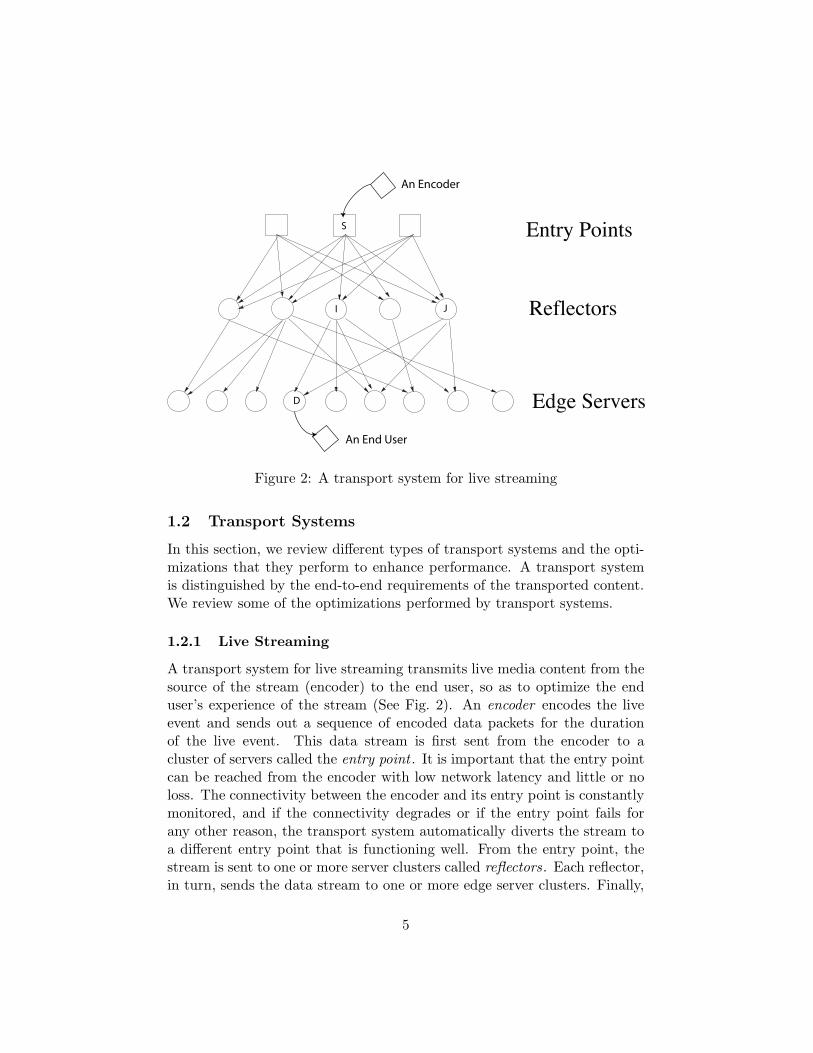
Figure 2: A transport system for live streaming
1.2 Transport Systems
In this section, we review different types of transport systems and the opti-mizations that they perform to enhance performance. A transport systemis distinguished by the end-to-end requirements of the transported content.We review some of the optimizations performed by transport systems.
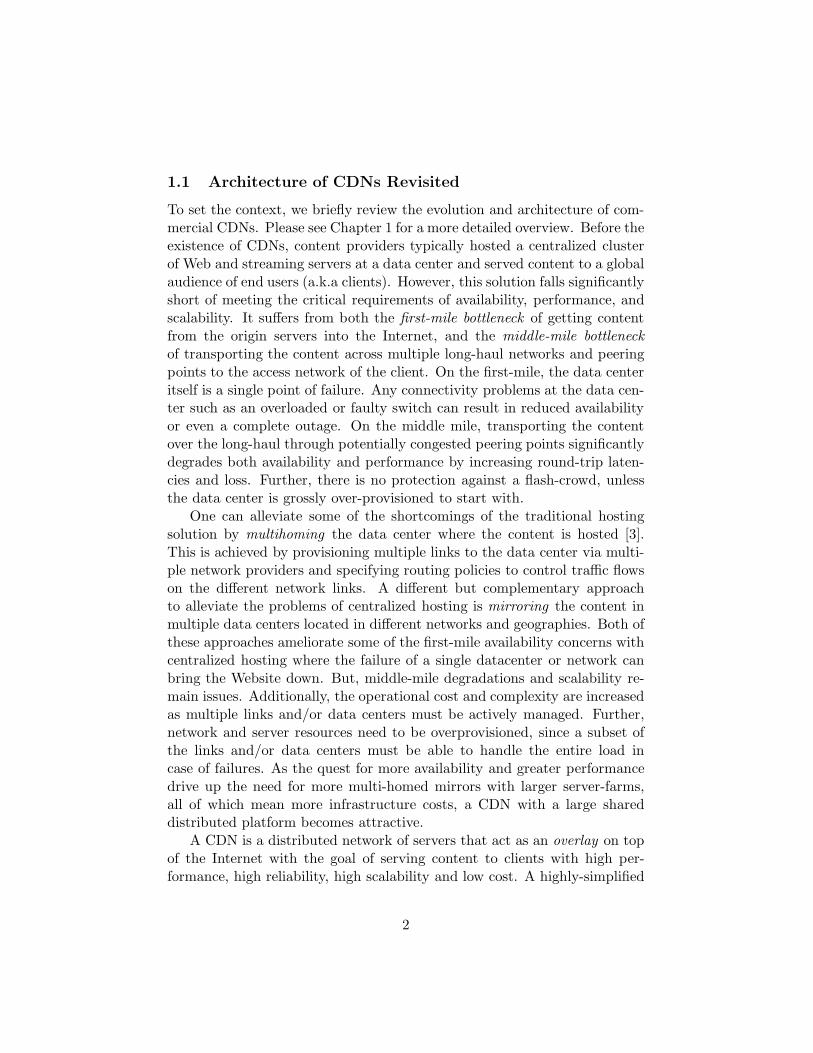
1.2.1 Live Streaming
A transport system for live streaming transmits live media content from thesource of the stream (encoder) to the end user, so as to optimize the enduser’s experience of the stream (See Fig. 2). An encoder encodes the liveevent and sends out a sequence of encoded data packets for the durationof the live event. This data stream is first sent from the encoder to acluster of servers called the entry point . It is important that the entry pointcan be reached from the encoder with low network latency and little or noloss. The connectivity between the encoder and its entry point is constantlymonitored, and if the connectivity degrades or if the entry point fails forany other reason, the transport system automatically diverts the stream toa different entry point that is functioning well. From the entry point, thestream is sent to one or more server clusters called reflectors. Each reflector,in turn, sends the data stream to one or more edge server clusters. Finally,
5

each end user obtains the live stream from a nearby edge server using themapping system.
The goal of the transport system is to transmit live streams in a mannerthat stream quality is enhanced and distortions are minimized. Distortionsexperienced by end users include large delays before the stream starts up,information loss leading to degraded audio and video, and freezes duringplayback. Each stream is sent through one or more paths adaptively by usingthe reflectors as intermediate nodes between the entry point and the edgeserver. As an example, the stream entering entry point S can be duplicatedacross one path through reflector I and an additional path through reflectorJ to reach edge server D (see Fig. 2). If a data packet is lost on one path, thepacket may be recovered at the edge if its duplicate is received through theother path. A more sophisticated technique would be to use a coding schemeto encode the data packets, and send the encoded stream across multiplepaths. Even if some packets are lost in transit, they may be recovered atthe edge servers using a decoding process.
Another example of an optimization is prebursting , where the initialportion of the stream is transported to the end user at a rate higher thanthe encoded bit rate, so as to fill the buffer of the end user’s media playerquickly. This allows the media player to start the stream up quicker andalso decreases the likelihood of a freeze in the middle of a playback. Formore discussion of the algorithmic and architectural issues in the design ofstreaming transport systems, see [6] and [12] respectively.
1.2.2 Web and Online Applications
A transport system for the Web transports dynamically-generated contentbetween the origin and the edge. Such content includes both dynamic Webpages downloaded by the end user and user-generated content that is up-loaded to a Website. A goal of such a transport system is to optimizethe response times of Web transactions performed by the end users. Aswith streaming, the transport system may use one more intermediate nodesto efficiently transmit information from the origin to edge. Also as withstreaming, the transport system performs several application-specific opti-mizations. For instance, a transport system for accelerating dynamic Webcontent may prefetch the embedded content on a Web page from the originto the edge, so as to “hide” the communication latency between the originand the edge.
A transport system for ip-based applications is focused on acceleratingspecific (non-http) application technologies such as Virtual Private Networks
6

(VPNs) and Voice-over-IP (VOIP). The architectural issues in such systemsare qualitatively different from that of the Web due to the highly-interactivereal-time nature of the end user experience.
1.2.3 Overlay Routing Schemes
A transport system uses a number of application-specific enhancements tomeet the end-to-end requirements. For instance, as noted, transport sys-tems use coding for loss recovery, prebursting for fast stream startup, andprefetching for fast downloads [6, 12]. These types of application-specificenhancements play a significant part of the overall performance benefit of-fered by the transport system, but are not the focus of the empirical studypresented in this chapter. However, a fundamental benefit of all transportsystem is finding a “better path” through the Internet from the point wherethe content originates (origin, encoder, etc) to the point where the content isserved to the end user (edge). This purely network-level benefit is achievedthrough an overlay routing scheme that is implemented as a part of thetransport system.
A generic overlay routing scheme computes one or more overlay pathsfrom each source node S (typically the origin) to each destination node D(typically the edge server) such that the overlay path(s) have high availabil-ity and low latency. The overlay routing scheme typically computes overlaypaths for millions of source-destination pairs using Internet measurementdata. Often, the BGP-determined Internet path from a source S to a desti-nation D, also called the direct path, is not the “best path” between thosetwo nodes. This should not be surprising as the Internet protocols that selectthe route are largely policy-based rather than performance-based. It couldwell be that an indirect path1 that goes from S to an intermediate node I(typically another server cluster belonging to the CDN) and then goes fromI to D is faster and/or more available! An overlay routing scheme exploitsthis phenomenon to choose the best overlay path (direct or indirect) to routethe content, thereby enhancing the end-to-end availability and performanceexperienced by the end user. The benefits of a global overlay routing schemesis our focus for the rest of this chapter.
1.3 Our Contributions
We present an empirical evaluation of the performance and availability ben-efits of global overlay routing. There has been much recent work [4, 11, 22]
1An indirect path may have more than one intermediate node if necessary.
7
on improving the performance and availability of the Internet using overlayrouting, but they have one of the following limitations:
• Prior work was performed on a platform hosted largely on Internet22,whose capacity and usage patterns, as well as policies and goals, differsignificantly from the commercial Internet.
• Overlays used in prior work have a footprint primarily in North Amer-ica. However, it is well known that network interconnectivity and rela-tionships in Europe and Asia are different than the continental UnitedStates.
In this chapter, we present the results of the first empirical study of theperformance and availability benefits of routing overlays on the commercialInternet. We use a global subset of the Akamai CDN for data collection.Specifically, we collect measurements from 1100 locations distributed acrossmany different kinds of ISPs in 77 countries, 630 cities, and 6 continents.We address the problem of picking optimum overlay paths between the edgeservers situated near end users and origin servers situated in the core ofthe Internet. We investigate both performance characterized by round triplatency as well as path availability. Applications such as large file downloadswhose performance is more accurately characterized by throughput are notaddressed in this study.
The key contributions of this chapter are the following:
• It is the first evaluation of an overlay that utilizes data from the com-mercial Internet. Our study provides useful cross validation for thecurrently deployed testbeds such as PlanetLab [18] and RON [22], andindicates that, while these deployments provide qualitatively similardata for the commercial Internet in North America, they do not cap-ture the global diversity of network topology, especially in Asia.
• We show that randomly picking a small number of redundant paths (3for Europe and North America, and 5 for Asia) achieves availabilitygains that approach the optimal. Additionally, we demonstrate thatfor reasonable probing intervals (say, 10 minutes) and redundancy (2paths), over 90% of the source-destination pairs outside Asia havelatency improvements within 10% of the ideal, whereas paths thatoriginate or end in Asia require 3 paths to reach the same levels ofperformance.
2Internet2 is an advanced networking consortium consisting of several major research
and educational institutions in the US. Internet2 operates an IP network that can be used
for research purposes.
8
• We provide strong evidence that overlay choices have a surprisinglyhigh level of persistence over long periods of time (several hours), in-dicating that relatively infrequent network probing and measurementscan provide optimal performance for almost all source-destination pairs.
1.4 Roadmap
The rest of the chapter is organized as follows. Section 2 presents an overviewof related work, and outlines the context of our present study. Section 3 de-scribes our testbed and how the measurement data is collected. Sections 4and 5 provide detailed metrics on the ideal performance and availabilitygains that can be achieved by overlays in a global context. Section 6 ad-dresses issues in real overlay design, and explores structural and temporalproperties of practical overlays for performance and availability. In Sec-tions 7 and 8, we provide directions for further research and a vision forthe future.
2 Related work
There have been many measurement studies of Internet performance andavailability, for example, the work at the Cooperative Association for In-ternet Data Analysis (CAIDA) [7], and the National Internet MeasurementInfrastructure (NIMI) [16, 17]. Examples of routing overlay networks builtin academia include the Resilient Overlay Networks project at MIT [22]and the Detour project at U. Washington [11]. Commercial delivery ser-vices offered by Akamai Technologies [1] incorporate overlay routing for livestreaming, dynamic Web content, and application acceleration.
Andersen et al. [5] present the implementation and performance analysisof a routing overlay called Resilient Overlay Networks (RON). They foundthat their overlay improved latency 51% of the time, which is comparable tothe 63% we obtain for paths inside North America. Akella et al. [2] investi-gate how well a simpler route-control multi-homing solution compares withan overlay routing solution. Although the focus of that study is differentfrom our current work, it includes results for a default case of a single-homedsite, and the authors find that overlay routing improves performance as mea-sured by round-trip latency by 25% on average. The experiment was runusing 68 nodes located in 17 cities in the U.S., and can be compared withthe 110 node, intra-North-America case in our study, where we find that theoverall latency improvement is approximately 21%. However, we show thatthe improvement varies significantly for other continents. Savage et al. [23]
9
used data sets of 20 to 40 nodes and found that for roughly 10% of thesource-destination pairs, the best overlay path has 50% lower latency thanthe direct path. We obtain the comparable value of 9% of source-destinationpairs for the case of intra-North America nodes, though again significantlydisparate results for other continent pairs. In parallel with our evaluation,Gummadi et al. [13] implemented random one-hop source routing on Planet-Lab and showed that using up to 4 randomly chosen intermediaries improvesthe reliability of Internet paths.
3 Experimental Setup
We describe the experimental setup for collecting data that can be used tooptimize Internet paths between edge networks where end users are locatedand enterprise origin servers. End users are normally located in small lower-tier networks, while enterprise origin servers are usually hosted in tier-onenetworks. We consider routing overlays comprised of nodes deployed in largetier-one networks that function as intermediate nodes in an indirect pathfrom the source (enterprise origin server) to the destination (edge server).
3.1 Measurement Platform
The servers of the Akamai CDN are deployed in clusters in several thousandgeographic and network locations. A large set of these clusters is locatednear the edge of the Internet, i.e. close to the end users in non-tier-oneproviders. A smaller set exists near the core ISPs directly located in tier-one providers, i.e. in locations that are suitable for enterprise origin servers.We chose a subset of 1100 clusters from the whole CDN for this experiment,based on geographic and network location diversity, security, and other con-siderations. These clusters span 6 continents, 77 countries, and 630 cities.Machines in one cluster get their connectivity from a single provider. Ap-proximately 15% of these clusters are located at the core, and the rest are atthe edge. The intermediate nodes of the overlay (used for the indirect paths)are limited to the core set. Table 1 shows the geographic distribution of theselected nodes. All the data collection for this work was done in completeisolation from the CDN’s usual data collection activity.
3.2 Data Collection for Performance and Availability
Each of the 1100 clusters ran a task that sent ICMP echo requests (pings)of size 64 bytes every 2 minutes to each node in the core set (this keeps the
10
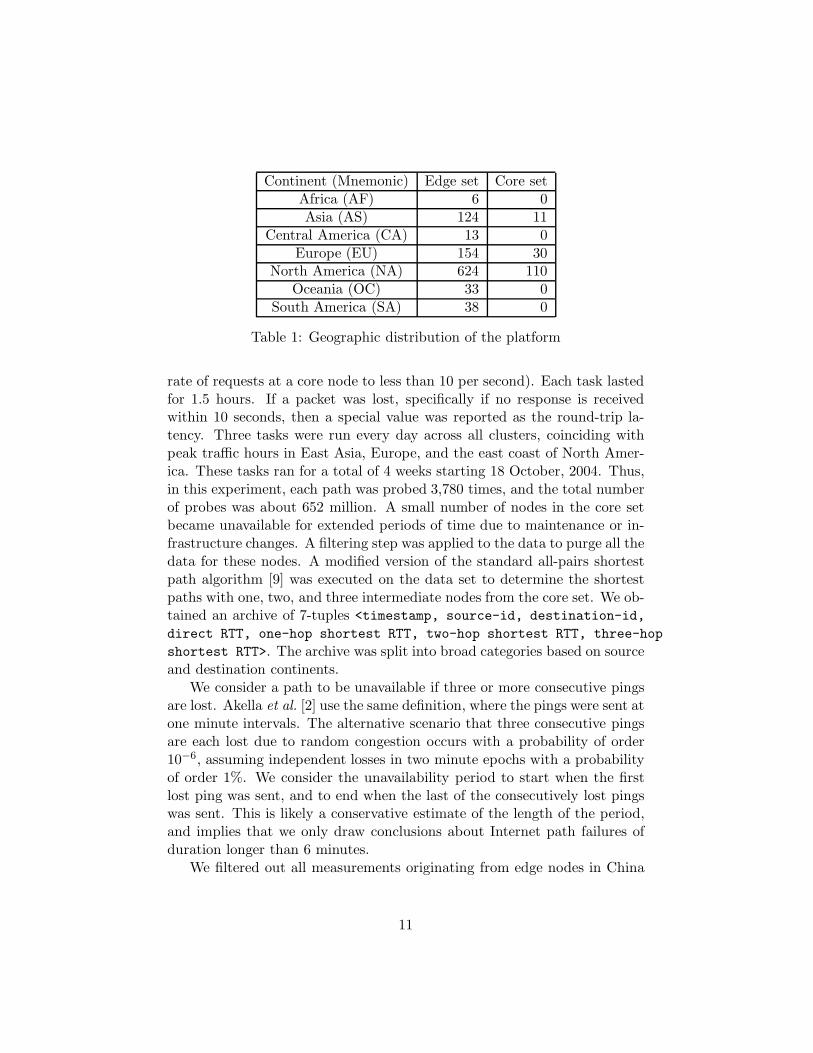
Continent (Mnemonic) Edge set Core setAfrica (AF) 6 0Asia (AS) 124 11
Central America (CA) 13 0Europe (EU) 154 30
North America (NA) 624 110Oceania (OC) 33 0
South America (SA) 38 0
Table 1: Geographic distribution of the platform
rate of requests at a core node to less than 10 per second). Each task lastedfor 1.5 hours. If a packet was lost, specifically if no response is receivedwithin 10 seconds, then a special value was reported as the round-trip la-tency. Three tasks were run every day across all clusters, coinciding withpeak traffic hours in East Asia, Europe, and the east coast of North Amer-ica. These tasks ran for a total of 4 weeks starting 18 October, 2004. Thus,in this experiment, each path was probed 3,780 times, and the total numberof probes was about 652 million. A small number of nodes in the core setbecame unavailable for extended periods of time due to maintenance or in-frastructure changes. A filtering step was applied to the data to purge all thedata for these nodes. A modified version of the standard all-pairs shortestpath algorithm [9] was executed on the data set to determine the shortestpaths with one, two, and three intermediate nodes from the core set. We ob-tained an archive of 7-tuples <timestamp, source-id, destination-id,
direct RTT, one-hop shortest RTT, two-hop shortest RTT, three-hop
shortest RTT>. The archive was split into broad categories based on sourceand destination continents.
We consider a path to be unavailable if three or more consecutive pingsare lost. Akella et al. [2] use the same definition, where the pings were sent atone minute intervals. The alternative scenario that three consecutive pingsare each lost due to random congestion occurs with a probability of order10−6, assuming independent losses in two minute epochs with a probabilityof order 1%. We consider the unavailability period to start when the firstlost ping was sent, and to end when the last of the consecutively lost pingswas sent. This is likely a conservative estimate of the length of the period,and implies that we only draw conclusions about Internet path failures ofduration longer than 6 minutes.
We filtered out all measurements originating from edge nodes in China
11
for our availability analysis. Their failure characteristics are remarkablydifferent from all other Internet paths as a consequence of firewall policiesapplied by the Chinese government.
3.3 Evaluation
We aggregate our results based on the continents of the source and destina-tion nodes, motivated by the fact that enterprise Websites tend to specifytheir audience of interest in terms of their continent. The categories are de-noted by obvious mnemonics such as AS-NA (indicated in Table 1), denotingthat the edge servers are in Asia and origin servers are in North America.
4 Performance Benefits of Overlay Routing
In this section, we evaluate the performance benefits of overlay routing inthe ideal situation where all possible indirect paths are considered for eachsource-destination pair, and the optimal indirect path is chosen in real time.Recall that our metric of performance is latency which is the round-trip time(abbreviated to RTT) from source to destination.
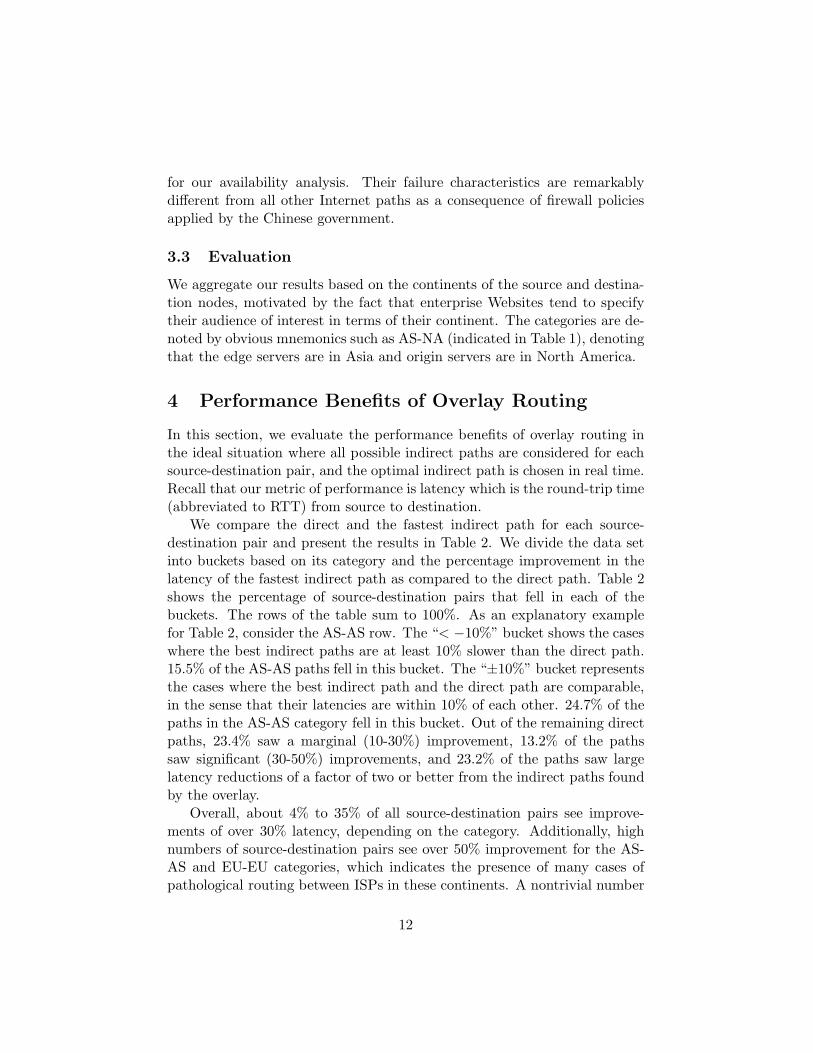
We compare the direct and the fastest indirect path for each source-destination pair and present the results in Table 2. We divide the data setinto buckets based on its category and the percentage improvement in thelatency of the fastest indirect path as compared to the direct path. Table 2shows the percentage of source-destination pairs that fell in each of thebuckets. The rows of the table sum to 100%. As an explanatory examplefor Table 2, consider the AS-AS row. The “< −10%” bucket shows the caseswhere the best indirect paths are at least 10% slower than the direct path.15.5% of the AS-AS paths fell in this bucket. The “±10%” bucket representsthe cases where the best indirect path and the direct path are comparable,in the sense that their latencies are within 10% of each other. 24.7% of thepaths in the AS-AS category fell in this bucket. Out of the remaining directpaths, 23.4% saw a marginal (10-30%) improvement, 13.2% of the pathssaw significant (30-50%) improvements, and 23.2% of the paths saw largelatency reductions of a factor of two or better from the indirect paths foundby the overlay.
Overall, about 4% to 35% of all source-destination pairs see improve-ments of over 30% latency, depending on the category. Additionally, highnumbers of source-destination pairs see over 50% improvement for the AS-AS and EU-EU categories, which indicates the presence of many cases ofpathological routing between ISPs in these continents. A nontrivial number
12
Category< −10% ±10% 10 − 30% 30 − 50% > 50%(Slower) (Comparable) (Marginal) (Significant) (Large)
AF-AS 4.0 44.5 44.2 5.7 1.6
AF-EU 0.6 69.3 18.1 9.7 2.3
AF-NA 0.0 74.2 21.6 3.5 0.6
AS-AS 15.5 24.7 23.4 13.2 23.2
AS-EU 0.9 33.9 45.5 12.5 7.2
AS-NA 0.1 43.2 42.4 7.6 6.7
CA-AS 0.0 40.5 53.5 4.6 1.4
CA-EU 1.4 53.2 42.3 2.5 0.7
CA-NA 1.7 44.1 41.3 11.2 1.8
EU-AS 0.6 24.5 63.8 7.8 3.2
EU-EU 10.5 36.4 30.5 12.6 10.0
EU-NA 0.0 50.6 45.1 3.3 0.9
NA-AS 0.0 34.0 57.9 5.4 2.6
NA-EU 0.1 43.1 51.1 4.4 1.4
NA-NA 2.4 34.7 39.0 15.0 9.0
OC-AS 6.1 38.9 18.9 22.9 13.2
OC-EU 0.0 60.4 35.1 3.9 0.7
OC-NA 0.0 66.7 25.6 6.3 1.4
SA-AS 0.1 43.1 47.9 5.5 3.4
SA-EU 0.4 66.1 28.9 2.3 2.2
SA-NA 0.9 55.1 35.1 5.7 3.3
Table 2: Histogram of latency reduction percentages
of AS-AS paths are routed through peering locations in California, for ex-ample, the path between Gigamedia, Taipei and China Telecom, Shanghai.All the traceroutes in our snapshot that originated at Gigamedia, Taipeiand ended at other locations in Asia went via California, except the pathto China Telecom, Shanghai, which went directly from Taipei to Shanghai.The Taipei-Shanghai path thus sees little or no improvement with an over-lay, since all the alternatives are very convoluted. At the same time, all thepaths that originate in Gigamedia, Taipei and end in other locations in Asiasee large improvements, since their direct routes are very convoluted, butthere exists a path via China Telecom, Shanghai, which is more than 50%faster.
13
Category50th percentile 90th percentile
Direct Fastest Reduction Direct Fastest Reduction
(ms) (ms) (%) (ms) (ms) (%)
AF-AS 350 290 17 740 700 5
AF-EU 150 120 20 620 620 0
AF-NA 200 180 10 560 550 2
AS-AS 230 110 52 590 350 41
AS-EU 320 260 19 500 360 28
AS-NA 230 200 13 470 280 40
CA-AS 230 200 13 300 250 17
CA-EU 160 140 12 200 170 15
CA-NA 90 70 22 130 100 23
EU-AS 300 260 13 390 300 23
EU-EU 30 30 0 80 60 25
EU-NA 130 120 8 190 160 16
NA-AS 190 160 16 260 210 19
NA-EU 130 110 15 180 150 17
NA-NA 50 40 20 90 70 22
OC-AS 200 140 30 340 220 35
OC-EU 330 300 9 400 330 17
OC-NA 220 200 9 280 230 18
SA-AS 320 280 12 470 340 28
SA-EU 230 210 9 290 250 14
SA-NA 160 150 6 240 190 21
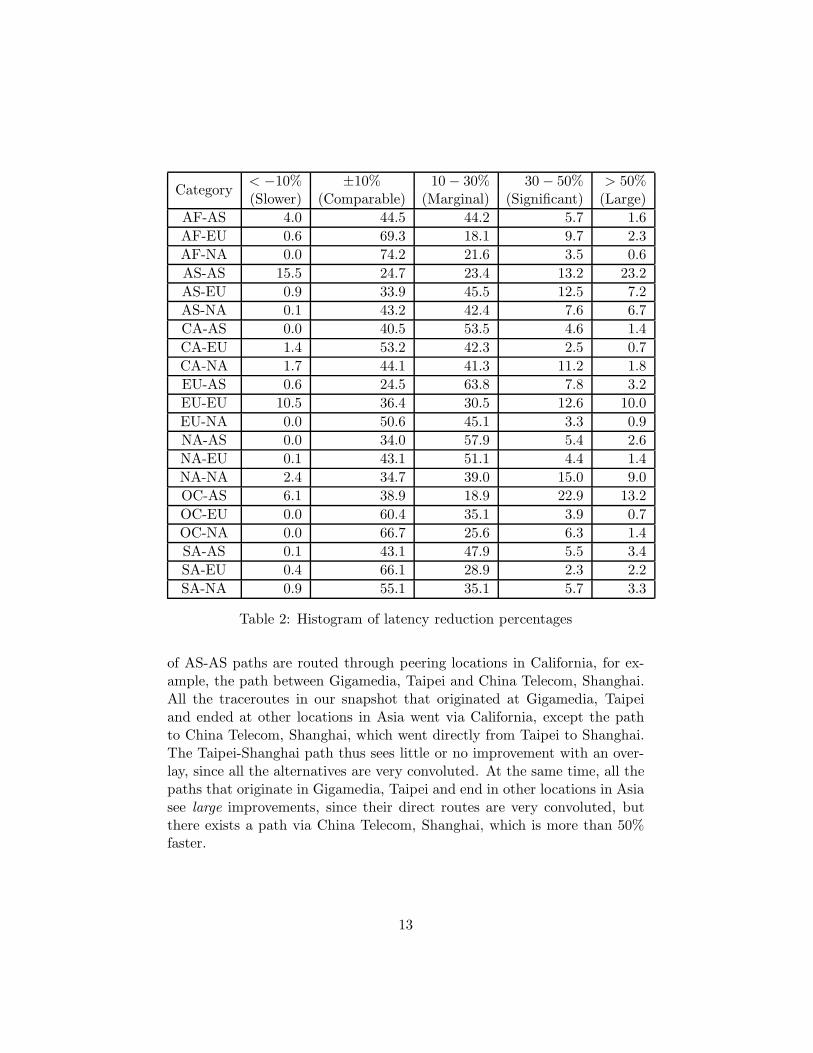
Table 3: Latency reduction for typical and poorly-connected source-destination pairs
4.1 Source-Destination Pairs with Poor Connectivity
Enterprises are particularly interested in enhancing the worst-case perfor-mance of their Website, by speeding up the clients who see the worst perfor-mance. Therefore, the benefits provided by overlay routing in minimizingthe worst path latencies in each category are especially interesting. We com-pare the latency reduction enjoyed by a “typical” source-destination pair ina given category with that of a “poorly connected” source-destination pair inthe same category. We bucketed the data set for each category into 10 mil-lisecond buckets based on the latency of the direct path. We then looked atthe 50th percentile bucket (“typical” source-destination pairs) and the 90th
14
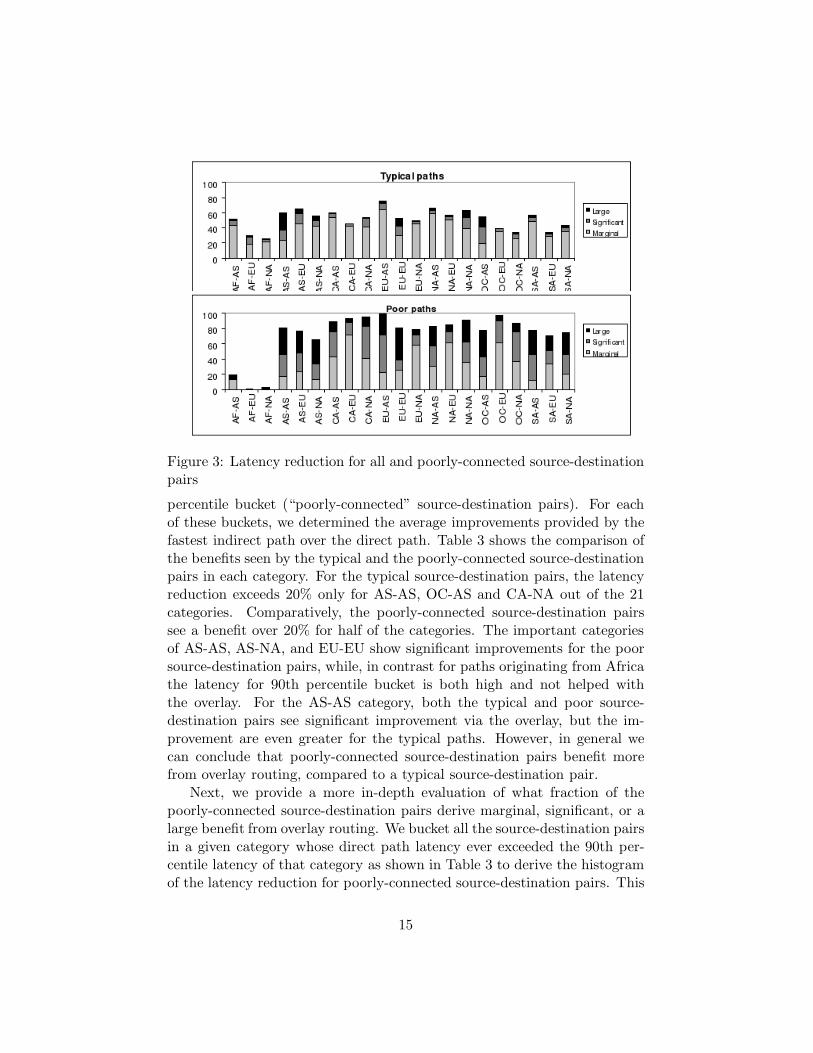
Figure 3: Latency reduction for all and poorly-connected source-destinationpairs
percentile bucket (“poorly-connected” source-destination pairs). For eachof these buckets, we determined the average improvements provided by thefastest indirect path over the direct path. Table 3 shows the comparison ofthe benefits seen by the typical and the poorly-connected source-destinationpairs in each category. For the typical source-destination pairs, the latencyreduction exceeds 20% only for AS-AS, OC-AS and CA-NA out of the 21categories. Comparatively, the poorly-connected source-destination pairssee a benefit over 20% for half of the categories. The important categoriesof AS-AS, AS-NA, and EU-EU show significant improvements for the poorsource-destination pairs, while, in contrast for paths originating from Africathe latency for 90th percentile bucket is both high and not helped withthe overlay. For the AS-AS category, both the typical and poor source-destination pairs see significant improvement via the overlay, but the im-provement are even greater for the typical paths. However, in general wecan conclude that poorly-connected source-destination pairs benefit morefrom overlay routing, compared to a typical source-destination pair.
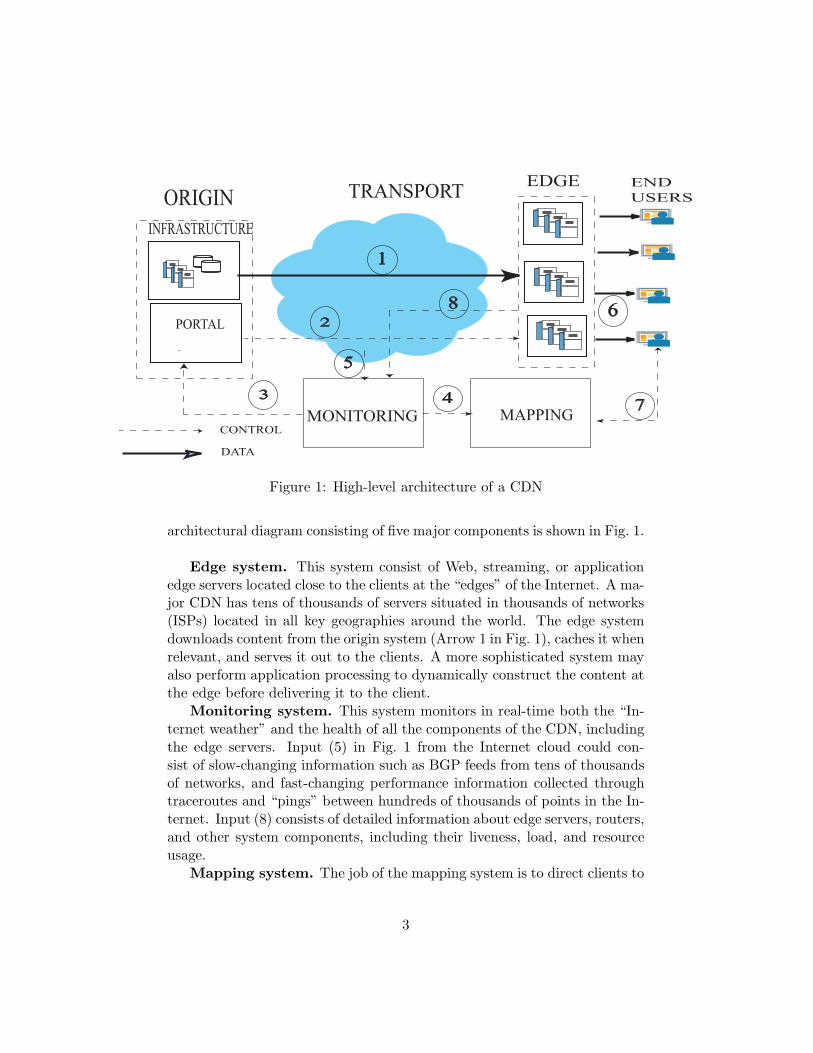
Next, we provide a more in-depth evaluation of what fraction of thepoorly-connected source-destination pairs derive marginal, significant, or alarge benefit from overlay routing. We bucket all the source-destination pairsin a given category whose direct path latency ever exceeded the 90th per-centile latency of that category as shown in Table 3 to derive the histogramof the latency reduction for poorly-connected source-destination pairs. This
15
histogram of the latency reduction for poorly-connected source-destinationpairs is shown along side the same values for all source-destination pairsin that category in Fig. 3. (Note that the data charted in Fig. 3 for allsource-destination pairs was presented in the last three columns of Table 2).Poorly-connected source-destination pairs see at least marginal benefits inover 80% of the samples, while 67% of the samples see significant or largebenefits. Some categories do deviate from this observation in the figure. Forexample, even poorly-connected source-destination pairs with destinationsin Africa do not derive much help from an overlay.
5 Availability Gains of Overlays
In this section, we evaluate the availability benefits of overlay routing inthe ideal situation, where all possible indirect paths are considered for eachsource-destination pair, and when possible an indirect path that is availableis chosen in real time to mitigate failures.
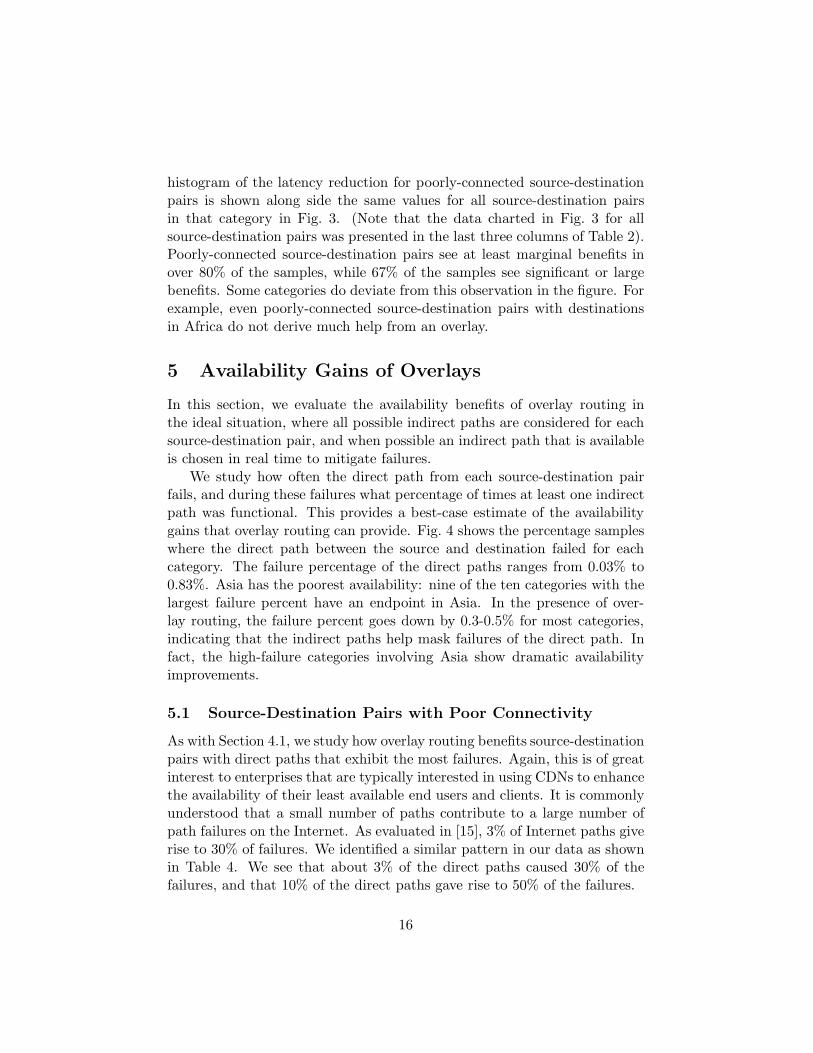
We study how often the direct path from each source-destination pairfails, and during these failures what percentage of times at least one indirectpath was functional. This provides a best-case estimate of the availabilitygains that overlay routing can provide. Fig. 4 shows the percentage sampleswhere the direct path between the source and destination failed for eachcategory. The failure percentage of the direct paths ranges from 0.03% to0.83%. Asia has the poorest availability: nine of the ten categories with thelargest failure percent have an endpoint in Asia. In the presence of over-lay routing, the failure percent goes down by 0.3-0.5% for most categories,indicating that the indirect paths help mask failures of the direct path. Infact, the high-failure categories involving Asia show dramatic availabilityimprovements.
5.1 Source-Destination Pairs with Poor Connectivity
As with Section 4.1, we study how overlay routing benefits source-destinationpairs with direct paths that exhibit the most failures. Again, this is of greatinterest to enterprises that are typically interested in using CDNs to enhancethe availability of their least available end users and clients. It is commonlyunderstood that a small number of paths contribute to a large number ofpath failures on the Internet. As evaluated in [15], 3% of Internet paths giverise to 30% of failures. We identified a similar pattern in our data as shownin Table 4. We see that about 3% of the direct paths caused 30% of thefailures, and that 10% of the direct paths gave rise to 50% of the failures.
16
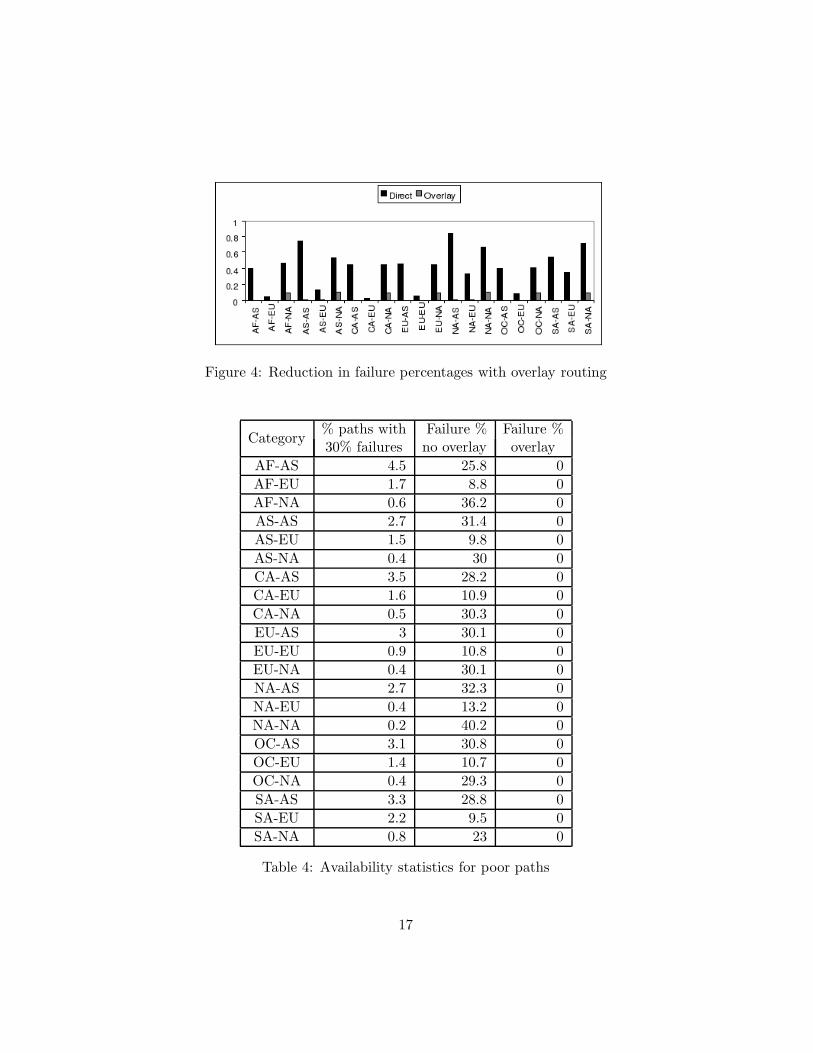
Figure 4: Reduction in failure percentages with overlay routing
Category% paths with Failure % Failure %30% failures no overlay overlay
AF-AS 4.5 25.8 0
AF-EU 1.7 8.8 0
AF-NA 0.6 36.2 0
AS-AS 2.7 31.4 0
AS-EU 1.5 9.8 0
AS-NA 0.4 30 0
CA-AS 3.5 28.2 0
CA-EU 1.6 10.9 0
CA-NA 0.5 30.3 0
EU-AS 3 30.1 0
EU-EU 0.9 10.8 0
EU-NA 0.4 30.1 0
NA-AS 2.7 32.3 0
NA-EU 0.4 13.2 0
NA-NA 0.2 40.2 0
OC-AS 3.1 30.8 0
OC-EU 1.4 10.7 0
OC-NA 0.4 29.3 0
SA-AS 3.3 28.8 0
SA-EU 2.2 9.5 0
SA-NA 0.8 23 0
Table 4: Availability statistics for poor paths
17
We identified the least-available source-destination pairs in each categorythat cumulatively gave rise to 30% of the failures, and re-ran the availabilityanalysis for only these source-destination pairs. The results are shown in Ta-ble 4. A failure rate higher than 20% for direct paths for a source-destinationpair is indicative of some specific chronic trouble, rather than random, tran-sient failures or short-lived congestion. Almost all these source-destinationpairs with a chronic availability problem saw perfect availability with overlayrouting! Enhancing the availability of the least available origin-destinationpairs is a key benefit of overlay routing.
6 Achieving the Benefits in a Practical Design
The analysis presented in Sections 4 and 5 characterizes an ideal case wherenetwork measurements are used in the computation of indirect paths in real-time. In addition, we assumed that an unlimited number of indirect pathscan be probed and utilized as indirect routes. Therefore, this analysis isa best-case estimate on the performance and availability gains that can beexpected from overlay routing. However, in a practical system, measure-ments made at a given time t is used for constructing overlay paths thatare utilized by the transport system till some time t + τ into future. And,only a small number of indirect paths can be constructed and used at anygiven time for a given source-destination pair (call the number of paths κ).This section incorporates these practical considerations into the analysis andevaluates its impact on the results. As κ increases and τ decreases, the costof constructing the overlay paths goes up but one would expect the qualityof constructed overlay paths to increase and approach the best-case routesconstructed in Sections 4 and 5.
First, we evaluate a simple multi-path memoryless overlay routing schemethat randomly selects a subset of κ paths based purely on static informa-tion and uses it to route content. It is natural to expect that this overlaywill likely be inferior to the ideal, but our goal is to develop a straw manto validate the importance of intelligence and adaptiveness in overlay pathselection. Surprisingly, we found that random selection is successful in pro-viding near optimal availability for κ = 3, substantiating the fact that theInternet offers very good path diversity, and generally has low rates of fail-ure. The policy, however, fails in improving performance, suggesting thatcareful path selection is very important in building overlays for performancegains. Such performance-optimizing overlay routing schemes are the focusof the rest of the section.
18
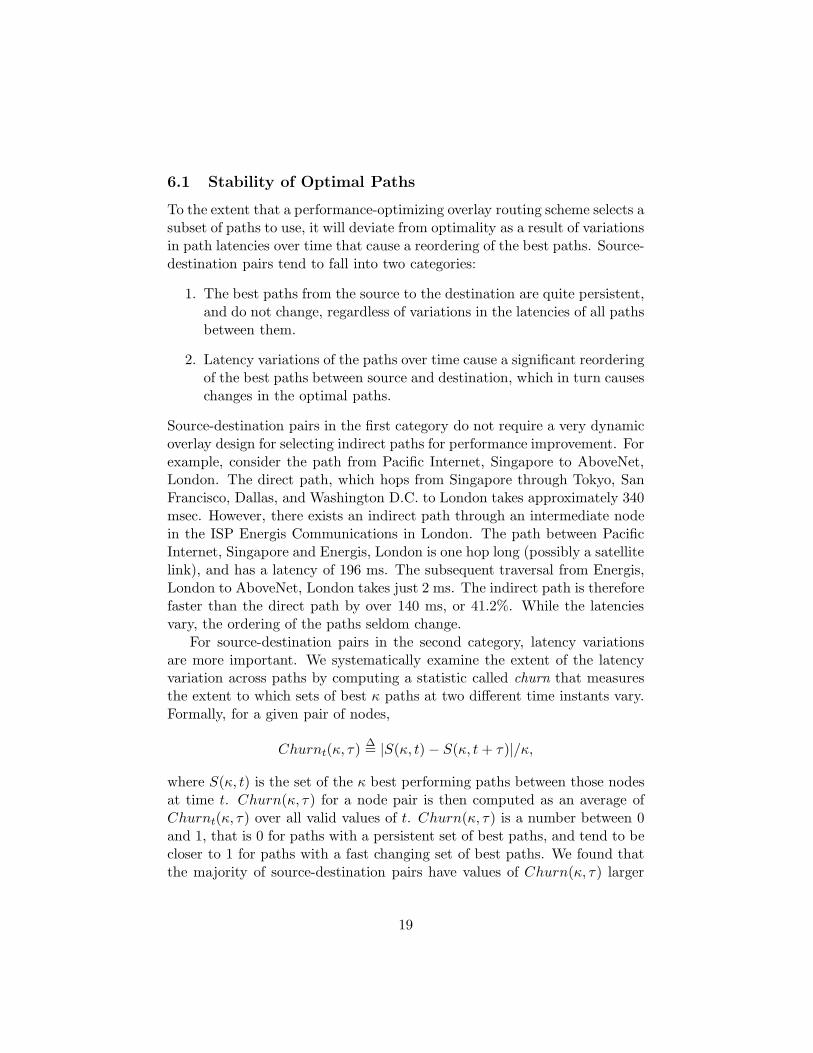
6.1 Stability of Optimal Paths
To the extent that a performance-optimizing overlay routing scheme selects asubset of paths to use, it will deviate from optimality as a result of variationsin path latencies over time that cause a reordering of the best paths. Source-destination pairs tend to fall into two categories:
1. The best paths from the source to the destination are quite persistent,and do not change, regardless of variations in the latencies of all pathsbetween them.
2. Latency variations of the paths over time cause a significant reorderingof the best paths between source and destination, which in turn causeschanges in the optimal paths.
Source-destination pairs in the first category do not require a very dynamicoverlay design for selecting indirect paths for performance improvement. Forexample, consider the path from Pacific Internet, Singapore to AboveNet,London. The direct path, which hops from Singapore through Tokyo, SanFrancisco, Dallas, and Washington D.C. to London takes approximately 340msec. However, there exists an indirect path through an intermediate nodein the ISP Energis Communications in London. The path between PacificInternet, Singapore and Energis, London is one hop long (possibly a satellitelink), and has a latency of 196 ms. The subsequent traversal from Energis,London to AboveNet, London takes just 2 ms. The indirect path is thereforefaster than the direct path by over 140 ms, or 41.2%. While the latenciesvary, the ordering of the paths seldom change.
For source-destination pairs in the second category, latency variationsare more important. We systematically examine the extent of the latencyvariation across paths by computing a statistic called churn that measuresthe extent to which sets of best κ paths at two different time instants vary.Formally, for a given pair of nodes,
Churnt(κ, τ)∆= |S(κ, t) − S(κ, t + τ)|/κ,
where S(κ, t) is the set of the κ best performing paths between those nodesat time t. Churn(κ, τ) for a node pair is then computed as an average ofChurnt(κ, τ) over all valid values of t. Churn(κ, τ) is a number between 0and 1, that is 0 for paths with a persistent set of best paths, and tend to becloser to 1 for paths with a fast changing set of best paths. We found thatthe majority of source-destination pairs have values of Churn(κ, τ) larger
19

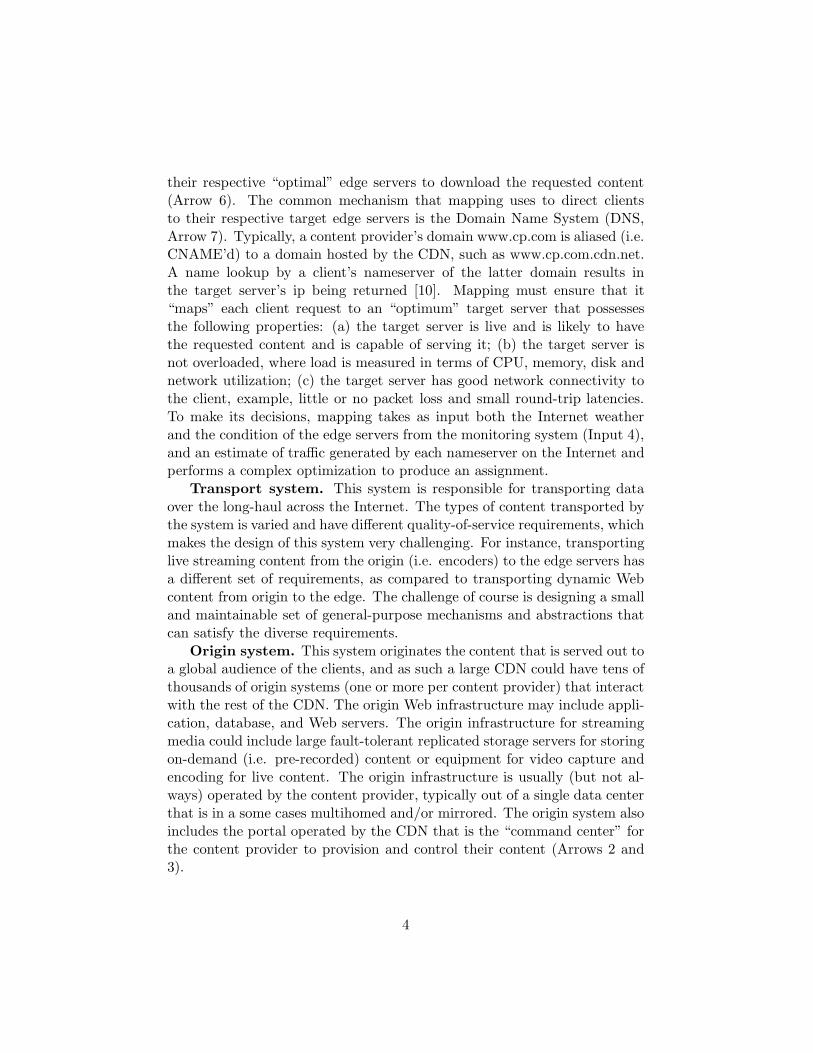
Figure 5: Percentage of source-destination pairs with low Churn andRelaxChurn for τ = 2 minutes and κ = 1
than 10%, even when selecting up to κ = 5 best performing paths and usingthis prediction for only τ = 2 minutes into the future.
To examine path churn more closely, one can define a relaxed measurecalled RelaxChurn(κ, τ) that counts only paths π ∈ S(κ, t) − S(κ, t + τ)whose latency at t + τ is higher than 110% of the latency of the path withthe worst latency in S(κ, t + τ), i.e. keeping path π would worsen the per-formance at time t + τ by more than 10%. Interestingly, RelaxChurn(κ, τ)is less than 10% on average for over 80% of source-destination pairs in mostcategories. This indicates that a path selection algorithm that makes pre-dictions into the future based on current measurements, can achieve perfor-mance close to the ideal.
Fig. 5 shows the percentage of source-destination pairs that have Churn(κ, τ)and RelaxChurn(κ, τ) of less than 10% for κ = 1 and τ = 2 minutes.Note that paths with both the end points in Asia do have a higher valueof RelaxChurn than Churn, but still only 63% AS-AS source-destinationpairs have low-churn paths. Thus, potentially higher performance bene-fits for AS-AS paths are likely only obtainable at a higher cost in terms ofnetwork measurement.
6.2 Performance Gains of a Predictive Overlay
The analysis in Section 6.1 examined stability using purely structural prop-erties. In this section, we compare the performance of overlay routing withparameters κ and τ with the performance of the ideal case where the optimalpath is always chosen. Note that this measure holds overlays to a higher
20
CategoryPercentage of paths
κ = 1 κ = 1 κ = 2 κ = 3τ = 2 τ = 10 τ = 2 τ = 2
AS-AS 62.4 59.5 84.6 89.4
AS-EU 76.2 74.1 92.2 94.5
AS-NA 74.8 71.6 94.0 96.0
EU-AS 74.4 72.3 88.4 92.8
EU-EU 80.1 78.1 91.6 93.1
EU-NA 83.0 82.2 94.7 96.2
NA-AS 68.1 66.2 88.8 93.7
NA-EU 82.3 81.3 95.4 97.2
NA-NA 71.6 69.6 92.0 95.0
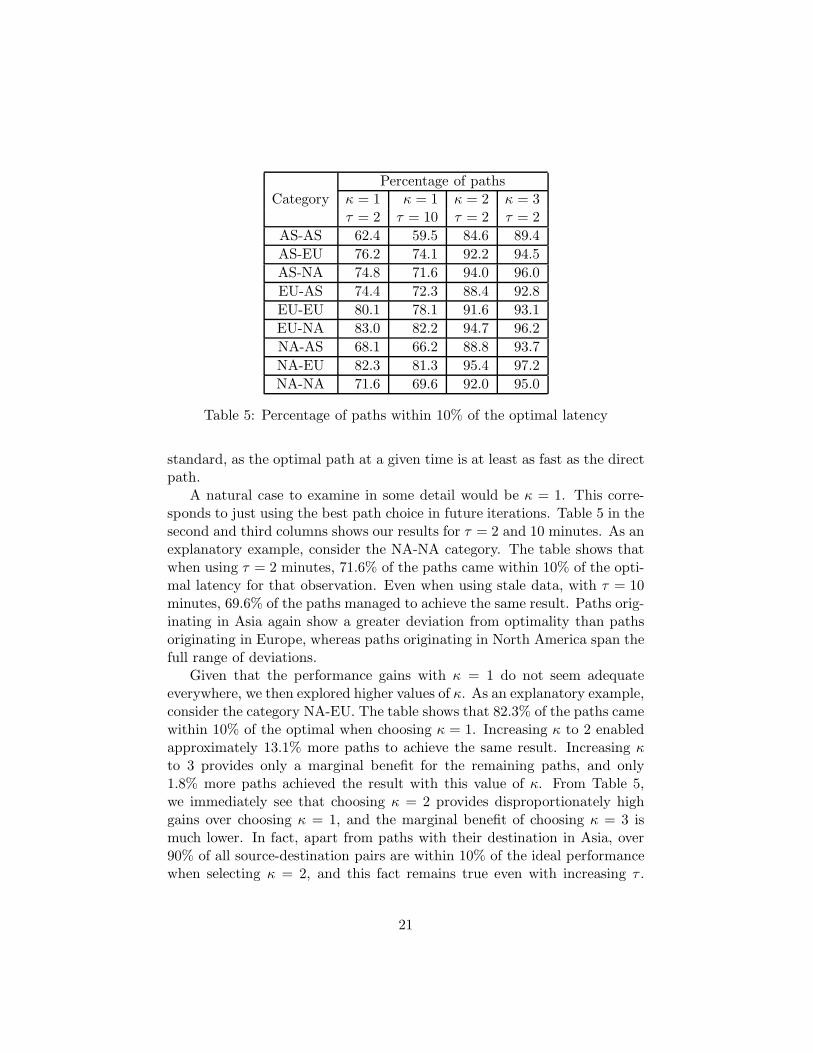
Table 5: Percentage of paths within 10% of the optimal latency
standard, as the optimal path at a given time is at least as fast as the directpath.
A natural case to examine in some detail would be κ = 1. This corre-sponds to just using the best path choice in future iterations. Table 5 in thesecond and third columns shows our results for τ = 2 and 10 minutes. As anexplanatory example, consider the NA-NA category. The table shows thatwhen using τ = 2 minutes, 71.6% of the paths came within 10% of the opti-mal latency for that observation. Even when using stale data, with τ = 10minutes, 69.6% of the paths managed to achieve the same result. Paths orig-inating in Asia again show a greater deviation from optimality than pathsoriginating in Europe, whereas paths originating in North America span thefull range of deviations.
Given that the performance gains with κ = 1 do not seem adequateeverywhere, we then explored higher values of κ. As an explanatory example,consider the category NA-EU. The table shows that 82.3% of the paths camewithin 10% of the optimal when choosing κ = 1. Increasing κ to 2 enabledapproximately 13.1% more paths to achieve the same result. Increasing κto 3 provides only a marginal benefit for the remaining paths, and only1.8% more paths achieved the result with this value of κ. From Table 5,we immediately see that choosing κ = 2 provides disproportionately highgains over choosing κ = 1, and the marginal benefit of choosing κ = 3 ismuch lower. In fact, apart from paths with their destination in Asia, over90% of all source-destination pairs are within 10% of the ideal performancewhen selecting κ = 2, and this fact remains true even with increasing τ .
21

The results also suggest that an overlay routing scheme where either κ =1 or 2 paths are used would work well. For example, 95.4% of all NA-EUsource-destination pairs are within 10% of optimal for overlays with κ = 2.Combining this with the fact that 82.3% of these pairs require only onechoice to come within the same limits, it is conceivable that an overlayrouting scheme could potentially use two paths only for the excess 13.1% ofpairs, for an average overhead of just 1.09 paths per pair.
Source-destination pairs where both are in Asia show a different behav-ior. For example, the proportion of AS-AS source-destination pairs within10% of optimal jumps from 62.44% to 84.57% when going from κ = 1 toκ = 2 (for a weighted average set size of 1.31). However, achieving within10% of optimal for close to 90% of the source-destination pairs requiresκ = 3.
Note that although Table 5 shows results for τ = 2 minutes for κ = 2,these values remain relatively stable for higher values of τ between 2 and 10minutes (similar to the case of κ = 1). This implies that increasing the rateof probing does not lead to gains in latency for a significantly higher numberof paths. We expand on the sensitivity of the results to τ in Section 6.3.
Interestingly, overlays designed for high performance show reduced avail-ability as compared to the ideal situation. This is because, as illustrated inearlier examples in this chapter, better performing paths are typically con-strained to share a small set of common links, leading to less path diversityand a greater vulnerability that all these shared links will simultaneouslyfail.
6.3 Persistence
The analysis in Section 6.2 indicates that the benefits of overlays are onlymildly sensitive to the value of τ , at least in the range of 2 to 10 minutes. Inthis section, we explore the time sensitivity of predictive overlays by usingsome extreme cases. Our daily 1.5 hour samples are separated by a gap of4 to 11 hours. We used overlays based on measurements in one 1.5 hoursample, and evaluated their performance on the next sample. While it isentirely possible that the overlay might have been suboptimal in the inter-vening time period, we see that around 87% of NA-NA, and 74% of AS-ASpaths are within 10% of ideal even with these long term predictions. Thesestatistics point to a high degree of consistency in the relative performanceof alternative paths between a source-destination pair, for most pairs. Incontrast, there is a small number of paths [20] with high short term varia-tions, and it is difficult for a predictive overlay to optimize these paths even
22

with κ going up to 5 or 6.
7 Future Research Directions
In this chapter, we quantified the performance and availability benefitsachievable by overlay routing, and how it differs from continent to conti-nent. The inefficiencies of the Internet have deep roots in economic consid-erations of the individual ISPs and are here to stay for a long time. Further,the significant geographical variations in behavior may well be artifacts ofa deeper structural nature, and are not expected to even out over time asconnectivity and economies improve. These facts point to a continued rapidgrowth in high-value traffic routed by overlay networks of CDNs. As over-lay routing optimizations become more and more prevalent, the impact ofthese optimizations on individual ISPs operating the “underlay” and the op-timizations they perform within their own networks become an interestingtopic of future study [14, 19, 8].
8 Visionary Thoughts for Practitioners
After a decade of evolution, there is no doubt that CDNs now play a centralrole in enabling business on the Internet. Businesses in every vertical, includ-ing technology, media, entertainment, commerce, software, and government,have adopted CDN technology. The traffic hosted on CDNs continue growby leaps and bounds, year after year. The dual challenges of enhancingthe performance and availability of web sites, streaming media and applica-tions has been a fundamental driving force of CDN evolution over the pastdecade. We end the chapter by refocusing our vision on those challengesand the road ahead.
• Consider that there are now retailers selling billions of dollars of goodson the Internet for whom even a 10-minute downtime of their Websiteduring a peak period translates to millions of dollars of lost revenueand can also result in poor user perception [24]. Further, e-commercerevenue is growing at a significant rate and is expected to double everytwo to three years! In addition, there is growing evidence that fastdownloads of Web pages are linked to larger conversion rates at e-commerce sites, leading to greater revenue. We need to deliver contenton the Internet to provide ever higher levels performance with little orno downtime.
23
• Consider that there are large media and entertainment companies whorely on the Internet to disseminate content to vast numbers of endusers. While they like the on-demand and ubiquitous nature of In-ternet streaming, they want a true television-like experience, wherethe video starts up immediately and never freezes! We need to de-liver content on the Internet with higher performance than traditionalmethods.
• As the Internet becomes more and more entrenched as a primarysource of entertainment and news, a number of content providers facethe so-called flash crowd problem. We need to deliver content on theInternet in a scalable fashion to end users even during a flash crowd,without loss of availability or performance.
• New business trends such as outsourcing and workforce consolidation,as well as government communications necessitate exacting perfor-mance and availability standards, not just within a single country orsmall group of countries, but globally. It is becoming more commonto have large virtual teams with individuals across the world collabo-rating in real-time on a single project via the Internet. Further, manynovel Internet applications have more stringent performance require-ments than ever. Interactive applications, such as remote shells overvirtual private networks (VPNs) and multi-user games, and emergingtechnologies such as voice over IP (VoIP) are highly latency sensitive.We need to meet novel and more stringent availability and performancerequirements to support the next-generation of Internet applications.
These challenges will continue to drive the field forward and shape the futureCDN in the coming years.
9 Acknowledgments
The experimental results presented in this chapter appeared as a technicalreport in [20] and as a conference paper in [21]. Ramesh Sitaraman wassupported in part by NSF Award CNS-0519894.
References
[1] Akamai Technologies, Inc. http://www.akamai.com.
24
[2] Akella, A., Pang, J., Maggs, B., Seshan, S., and Shaikh, A. A compar-ison of overlay routing and multihoming route control. In Proc. ACMSIGCOMM, pages 93–106, Portland, OR, Aug. 2004.
[3] Akella, A., Maggs, B., Seshan, S., Shaikh, A., and Sitaraman, R. AMeasurement-Based Analysis of Multihoming. Proceedings of the 2003ACM SIGCOMM Conference on Applications, Technologies, Architec-tures, and Protocols for Computer Communication (SIGCOMM), Au-gust 2003.
[4] Andersen, D. G. Improving End-to-End Availability Using Overlay Net-works. PhD thesis, MIT, 2005.
[5] Andersen, D. G., Balakrishnan, H., Kaashoek, F., and Morris, R. Re-silient Overlay Networks. In 18th ACM SOSP, Banff, Canada, October2001.
[6] Andreev, K., Maggs, B., Meyerson, A., and Sitaraman, R. Design-ing Overlay Multicast Networks for Streaming. Proceedings of the Fif-teenth Annual ACM Symposium on Parallel Algorithms and Architec-tures (SPAA), June 2003.
[7] CAIDA. http://www.caida.org.
[8] Clark, D., Lehr, B., Bauer, S., Faratin, P., Sami, R., and Wroclawski,J. The Growth of Internet Overlay Networks: Implications for Archi-tecture, Industry Structure and Policy. In 33rd Research Conference onCommunication, Information and Internet Policy, Arlington, Virginia,September 2005.
[9] Cormen, T.H., Leiserson, C.E., Rivest, R.L., and Stein, C. Introductionto Algorithms. MIT Press and McGraw-Hill, 2001.
[10] Dilley, J., Maggs, B., Parikh, J., Prokop, H., Sitaraman, R., and Weihl,B. Globally distributed content delivery. IEEE Internet Computing,September 2002, pp. 50–58.
[11] Detour. http://www.cs.washington.edu/research/networking/detour/.
[12] Kontothanassis, L., Sitaraman, R., Wein, J., Hong, D., Kleinberg, R.,Mancuso, B., Shaw, D., and, Stodolsky, D. “A Transport Layer for LiveStreaming in a Content Delivery Network”. Proceedings of the IEEE,Special issue on evolution of internet technologies, pages 1408- 1419,Volume 92, Issue 9, August 2004.
25
[13] Gummadi, K. P., Madhyastha, H., Gribble, S., Levy, H., and Wether-all, D. Improving the Reliability of Internet Paths with One-hop SourceRouting. In Symposium on Operating System Design and Implementa-tion (OSDI), San Diego, CA, 2003.
[14] Keralapura, R., Taft, N., Chuah, C., and Iannaccone, G. Can ISPstake the heat from overlay networks? In ACM SIGCOMM Workshopon Hot Topics in Networks (HotNets), 2004.
[15] Markopoulou, A., Iannaccone, G., Bhattacharyya, S., Chuah, C.-N.,and Diot, C. Characterization of failures in an ip backbone. In IEEEInfocom, Hong Kong, 2004.
[16] NIMI. http://ncne.nlanr.net/nimi/.
[17] Paxson, V., Mahdavi, J., Adams, A., and Mathis, M. An Architecturefor Large-Scale Internet Measurement. IEEE Communications, August1998.
[18] PlanetLab. http://www.planet-lab.org/.
[19] Qiu, L., Yang, Y. R., Zhang, Y., and Shenker, S. On Selfish Routingin Internet-Like Environments. In ACM SIGCOMM, 2003.
[20] Rahul, H., Kasbekar, M., Sitaraman, R., and Berger, A. Towards Re-alizing the Performance and Availability Benefits of a Global OverlayNetwork. MIT CSAIL TR 2005-070, December 2005.
[21] Rahul, H., Kasbekar, M., Sitaraman, R., and Berger, A. Towards Re-alizing the Performance and Availability Benefits of a Global OverlayNetwork. Passive and Active Measurement Conference, Adelaide, Aus-tralia, March, 2006.
[22] RON. http://nms.csail.mit.edu/ron/.
[23] Savage, S., Collins, A., Hoffman, E., Snell, J., and Anderson, T. TheEnd-to-End Effects of Internet Path Selection. In Proc. ACM SIG-COMM, pages 289–299, Cambridge, MA, 1999.
[24] Zona Research. The need for speed II. Zona Market Bulletin 5 (Apr.2001).
26