Embed Size (px)
DESCRIPTION
Glass Coating & Reliability study of Anti Reflective Coated Glass
Citation preview

Performance and Reliability of Modules with Anti-Reflective Coated Glass
by Gabriela Bunea, Grace Xavier, Doug Rose, Lauren Nelson, and Jack Peurach2010

2
EXECUTIVE SUMMARY
E X E C U T I V E S U M M A R Y
Anti-reflection coated (ARC) glass is being used in an increasing percentage of PV modules due to expected
higher power and energy output. Assurance of the energy gain and the reliability of the coating is essential
to create value. This paper reports on the steps taken to test, qualify, and release in production photovoltaic
modules made with ARC glass. The work focuses on porous SiO2 coatings made by sol-gel process.
The qualification and validation methodology used included:
1 extensive accelerated testing for reliability and long-term performance based on tests identified using a Design Failure Mode and Effect Analysis (FMEA)
2 measurement of power gains over a large number of modules
3 side-by-side field testing including frequently-monitored, large-volume sites and experiments to identify sources of energy gain beyond the standard test conditions for power gain and validate the coating reliability.
Our production results to date show that standard test condition (STC) flash power gain due to ARC glass is
on average 2.7%. After more than three years of outdoor testing in various climates, the energy production
gain from ARC glass modules is 3.5-5% depending on the type of installation and location. The higher
energy gain as compared to STC flash gain is due to improved coating gain in diffuse and off-angled light
due to the effect of the refractive index and the light scattering within the coating. Two years of controlled
side-by-side testing at National Renewable Energy Lab (NREL) shows that both uncoated and ARC coated
modules increase in power, with modules with ARC increasing the most.

3S E C T I O N 1 INTRODUCT ION
RELIABILITY AND PERFORMANCESunPower Corporation employs a Design Failure Mode and Effect Analysis (FMEA) to any change in module materials that could impact 25 years performance and reliability. Based on this analysis, the testing protocol to be used for qualification of the material is developed. Additionally, tests and procedures for quality assurance, in process manufacturing control, and ongoing reliability monitoring for the particular change are developed as well.
Our approach is to test to failure, and understand and quantify the risk and probability of failure. One of the most challenging tasks is to define acceleration factors for various failures observed and predict performance degradation over such a long period of time in a variety of environments and types of systems in which the modules will be installed.
In the case of ARC glass, the qualification and validation methodology used included:• Extensive accelerated testing for reliability and
long-term performance based on tests developed using FMEA
• Measurement of standard test conditions (STC) power gains over a large number of modules
• Side by side field testing including frequently-monitored, large volume sites and experiments to identify sources of energy gain beyond the standard test conditions for power gain, and validate the coating long term reliability.
A subset of the FMEA developed for ARC glass is shown in Table I. We have identified over 70 potential failure modes and performed in excess of 40 tests as part of our qualification process.
Table I: A sub-set of FMEA used for qualification of ARC glass
The study and qualification process in the initial phase included twelve ARC coatings from different suppliers; some of the coatings were in commercial phase at the beginning of the study, while some were still in development phase but with plans for commercialization.
INTRODUCTION
ARC glass has been available for many years but the concern in regard to the ability of the coating to maintain
performance over long periods of time has slowed the large scale adoption for PV modules. Recent progress in
coating technology and increase in the number of suppliers for durable, high performance coating has made it
possible for the module manufacturers to consider ARC glass as part of their products
1. J. Wohlgemuth et al. “Crystalline Silicon Photovoltaic modules with anti-reflective coated glass”, Photovoltaic Specialists Conference, 2005. Conference Record of the Thirty-first IEEE Page(s): 1015 – 1018 (2005); 2. C. Ballif et al., “Solar glass with industrial porous SiO2 antireflection coating: measurements of photovoltaic module properties improvement and modeling of yearly energy yield gain”, Solar Energy Materials & Solar Cells, Vol. 82, pg. 331 (2004); 3. D. DeGraaff, et al., “Qualification, Manufacturing, and Reliability Testing Methodologies for Deploying High-Reliability Solar Modules”, PVSEC 2010 (Valencia, Spain)
S E C T I O N 1
Failure CauseQualification and Reli-
ability Test Plan
Reducedpower
Coatingdegradation
Included boiling water, acid test, salt fog, UV, cross hatch, sand blast, cleaning agents, extended versions of tests in IEC61215, and Alpha site energy monitoring at various geographical locations;Soiling
Opticaldegradation
Included monitoring optical properties pre and post stress testing, cleaning tests.
AestheticsDamaged coating from field exposure or handling
Included scratch resistance, soiling tests, change in energy production, handling in manu-facturing, transportation and installation, and field tests.

4S E C T I O N 1 REL IAB I LTY AND PERFORMANCE
The qualification process started with screening tests that are designed to give an early indication of the robustness of the coating performance and maintaining of the aesthetics. The coatings that passed the screening tests were subjected to subsequent testing (on prototype and module level) based on extended versions of tests in IEC 61215, custom accelerated tests developed in house and field exposure in various locations.
In general, the ARC glasses that passed the initial screening and subsequent accelerated tests, have shown no defects or performance degradation during the field test period of 3 years in various locations. However, depending on the porosity and the pore size of the top most layer of the coating, various temporary defects have been observed. For example, in figure 1 below, appearance of silvery steaks and brown spots was noticed on modules fielded in residential and heavy pollen areas
Figure 1: Temporary staining due to plant residue observed during field exposure of ARC glass modules in heavy pollen areas in California.
These defects are only visible at close up inspection and cannot be seen from 5 m away. The same type of defects are also noticed on uncoated glass exposed
in the same locations, however the area affected is less pronounced than in the case of ARC glass. Failure analysis confirmed the debris to be plant residue causing the staining of AR coating in the spots. Cross-section SEM confirmed normal coating thickness in stained areas with only the porosity of the top surface of the coating affected. This was further confirmed by elipsometry porosity measurements, which shows reduced porosity and increase in refractive index in defect area. Localized transmission data on brown spots show <1% decrease in solar weighted transmission. The defect area was small (<2% of total PV area) and no influence on the power data was measured at flash test, as expected based on transmission data. Further outdoor exposure of the modules in the same location show that the staining is a temporary effect as the defect disappears within 1-2 months. We believe this is due to decomposition and flaking-off of the trapped organic material under sun exposure. The AR coating composition and thickness are not affected by the temporary presence of the plant residue, hence we do not believe this type of defects is of concern for long term reliability of the AR coatings. This is further supported by field performance data as described in section below.
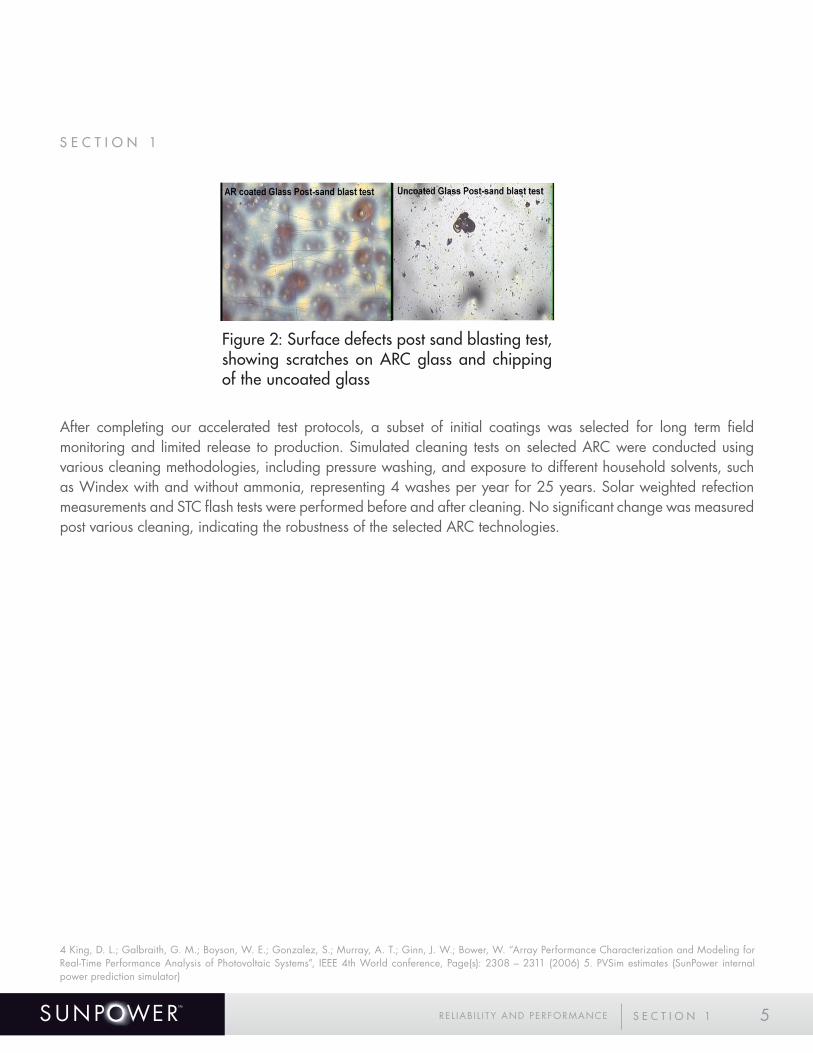
Durability and long term performance of the ARC glass has been evaluated through extensive environmental studies that significantly exceed the IEC 61215 requirements. Some of the tests have clearly shown that a well designed AR coating helps protect the glass from environmental effects such as humidity and sand blasting. Figure 2 shows, as an example, the difference in the surface defects post sand blast test conducted on the uncoated and ARC glass. The uncoated glass resulted in chipping of the surface while no chipping was observed on the ARC glass, only scratches.
S E C T I O N 1
5S E C T I O N 1 REL IAB I L I TY AND PERFORMANCE
S E C T I O N 1
4 King, D. L.; Galbraith, G. M.; Boyson, W. E.; Gonzalez, S.; Murray, A. T.; Ginn, J. W.; Bower, W. “Array Performance Characterization and Modeling for Real-Time Performance Analysis of Photovoltaic Systems”, IEEE 4th World conference, Page(s): 2308 – 2311 (2006) 5. PVSim estimates (SunPower internal power prediction simulator)
After completing our accelerated test protocols, a subset of initial coatings was selected for long term field monitoring and limited release to production. Simulated cleaning tests on selected ARC were conducted using various cleaning methodologies, including pressure washing, and exposure to different household solvents, such as Windex with and without ammonia, representing 4 washes per year for 25 years. Solar weighted refection measurements and STC flash tests were performed before and after cleaning. No significant change was measured post various cleaning, indicating the robustness of the selected ARC technologies.
Figure 2: Surface defects post sand blasting test, showing scratches on ARC glass and chipping of the uncoated glass
6S E C T I O N 2 F IE LD PERFORMANCE
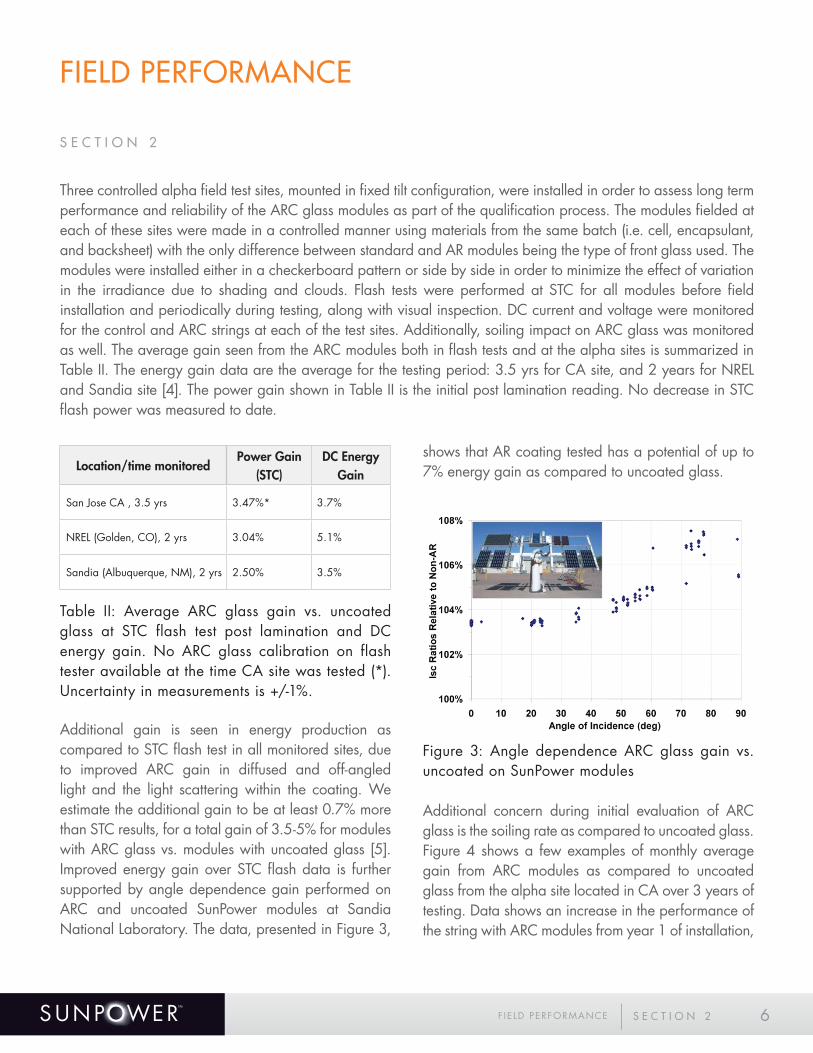
Table II: Average ARC glass gain vs. uncoated glass at STC flash test post lamination and DC energy gain. No ARC glass calibration on flash tester available at the time CA site was tested (*). Uncertainty in measurements is +/-1%.
Additional gain is seen in energy production as compared to STC flash test in all monitored sites, due to improved ARC gain in diffused and off-angled light and the light scattering within the coating. We estimate the additional gain to be at least 0.7% more than STC results, for a total gain of 3.5-5% for modules with ARC glass vs. modules with uncoated glass [5]. Improved energy gain over STC flash data is further supported by angle dependence gain performed on ARC and uncoated SunPower modules at Sandia National Laboratory. The data, presented in Figure 3,
shows that AR coating tested has a potential of up to 7% energy gain as compared to uncoated glass.
Figure 3: Angle dependence ARC glass gain vs. uncoated on SunPower modules
Additional concern during initial evaluation of ARC glass is the soiling rate as compared to uncoated glass. Figure 4 shows a few examples of monthly average gain from ARC modules as compared to uncoated glass from the alpha site located in CA over 3 years of testing. Data shows an increase in the performance of the string with ARC modules from year 1 of installation,
S E C T I O N 2
FIELD PERFORMANCE
Location/time monitoredPower Gain
(STC)DC Energy
Gain
San Jose CA , 3.5 yrs 3.47%* 3.7%
NREL (Golden, CO), 2 yrs 3.04% 5.1%
Sandia (Albuquerque, NM), 2 yrs 2.50% 3.5%
Three controlled alpha field test sites, mounted in fixed tilt configuration, were installed in order to assess long term performance and reliability of the ARC glass modules as part of the qualification process. The modules fielded at each of these sites were made in a controlled manner using materials from the same batch (i.e. cell, encapsulant, and backsheet) with the only difference between standard and AR modules being the type of front glass used. The modules were installed either in a checkerboard pattern or side by side in order to minimize the effect of variation in the irradiance due to shading and clouds. Flash tests were performed at STC for all modules before field installation and periodically during testing, along with visual inspection. DC current and voltage were monitored for the control and ARC strings at each of the test sites. Additionally, soiling impact on ARC glass was monitored as well. The average gain seen from the ARC modules both in flash tests and at the alpha sites is summarized in Table II. The energy gain data are the average for the testing period: 3.5 yrs for CA site, and 2 years for NREL and Sandia site [4]. The power gain shown in Table II is the initial post lamination reading. No decrease in STC flash power was measured to date.

7S E C T I O N 2 F IE LD PERFORMANCE
suggesting potential improvement of the coating performance and or less soiling of AR modules.
Additional performance data from the alpha site at the National Renewable Energy Laboratory Outdoor Test Facility (NREL OTF) in Golden, CO, are shown in Figure 5, 6. Because the staff at NREL is measuring DC power data as well as AC power data, they are able to perform the rating on both the DC side and the AC side of the inverter. For this analysis, data is restricted to periods in which Irradiance > 800 W/m2 and Power > 700 W. PTC (power test conditions) are defined as 1,000 W/m2 plane-of-array irradiance, 20°C ambient temperature, and 1 m/s wind speed.
Figure 4: Examples of monthly energy gain from ARC glass as a function of install year for CA alpha site.
Average measured power change by NREL is +0.6%/yr ± 0.6%/yr for ARC modules vs. +0.4%/yr ± 0.5%/yr for controlled uncoated modules. This means that over the two year test period, the modules with ARC glass and the modules with normal glass gained in power, (as opposed to the typical industry assumption of a loss 0.5-1%/yr), with the ARC modules increasing
the most. While the difference is within the error of measurement, it points once again to an improvement of the performance of modules with ARC glass as compared to uncoated with time, as measured in CA alpha site.
Figure 5: PTC Power Rating vs. Time for string of modules with AR glass fielded at NREL OTF. The measured change is +0.6%/yr ± 0.6%/yr.
Figure 6: PTC Power Rating vs Time for string of modules with standard glass fielded at NREL OTF. The measured change is +0.4%/yr ± 0.5%/yr.
S E C T I O N 2
0.85
0.90
0.95
600
700
800
900
1000
1100
Mar -07 Jun -07 Sep -07 Jan-08 Apr -08 Jul -08 Oct-08 Feb -09 May-09
Time
PTC Power Rating vs TimeIrradiance > 800 W/m 2, Power > 700 W
DC Power
IV curves
Efficiency
Degradation fit
+6.5W/year=+0.62%/year
0.80
0.82
0.84
0.86
0.88
0.90
0.92
0.94
0.96
0.98
1.00
600
700
800
900
1000
1100
Jan-07 Apr -07 Aug -07 Nov -07 Feb -08 Jun -08 Sep -08 Dec -08 Mar -09 Jul -09
Time
PTC Power Rating vs TimeIrradiance > 800 W/m 2, Power > 700 W
DC Power
IV curves
Efficiency
Degradation fit
+3.5W/year=+0.35%/year

8
Figure 7: Average STC module power for modules made with ARC vs. uncoated glass for beta testing
S E C T I O N 2 F IE LD PERFORMANCE
S E C T I O N 2
Power (W)
200
210
220
230
240
AR Non AR
Glass

9S E C T I O N 3 LARGE SCALE PERFORMANCE VAL IDAT ION
S E C T I O N 3
LARGE SCALE PERFORMANCEVALIDATION
ARC glass is somewhat more susceptible to visual defects caused by handling compared to uncoated glass. The issue was eliminated as a concern with minor modification to the transport mechanisms and the standard operating procedures for transport shipping, and installation of the modules in the field.
More than 2MW of modules with ARC were installed at Nellis Air force in NV in 2008 as part of limited release of this technology. The average STC flash power gain due to ARC was 2.73%, as shown in Figure 7. The energy production exceeds the predicted results of 3.5%. A picture of the installed arrays is shown in Figure 8.
Figure 8: Picture of the T20 trackers with ARC modules (front dark panels) at Nellis Air Force base, NV

10
S E C T I O N 4
CONCLUSIONS
This paper presented a summary of the qualification test protocols and results for testing ARC glass for use in SunPower PV modules. More than three years of field data show that the energy gain from ARC glass significantly exceeds the flash STC, with a total gain of 3.5-5% over uncoated glass, due to improved performance of the coating with off-angled and diffused light. Slight increase in energy gain performance was measured with time from modules with ARC glass as compared to uncoated potential improvement of the coating performance and/or less soiling of AR modules. Two years of controlled side-by-side testing at NREL shows that both uncoated and ARC coated modules increase in power, with modules with ARC glass increasing the most. ARC glass is more sensitive to handling during module manufacturing and installation, but these challenges can be overcome through process modifications and training, enabling the use of ARC glass in large volume manufacturing. Though more suppliers are offering ARC glass, the design and quality varies significantly. Out of the twelve initial coatings that were evaluated, only a small subset was selected for release to volume manufacturing for SunPower modules.
ACKNOWLEDGEMENTThis material is based upon work supported by the Department of Energy under Award Number DE-FC36-07GO17043.
We would like to thank: Michael Quintana, Jennifer Granata, Jay A. Kratochvil and Gary Galbraith at Sandia National Laboratory (Albuquerque, NM) for performing testing on alpha site modules and for angle of incidence measurements.
We would like to thank: Sarah Kurtz, Carl Osterwald and Bill Sekulic of NREL (Golden, CO) for performing testing on alpha site modules and performance and analysis of degradation rates.
S E C T I O N 4 CONCLUS IONS
SUNPOWER CORPORATION3939 North 1st StreetSan Jose, CA 95134 1.800.SUNPOWER (1.800.786.7693)sunpowercorp.com
SUNPOWER and the SUNPOWER logo are trademarks or registered trademarks of SunPower Corporation.© February 2011 SunPower Corporation. All rights reserved.