Embed Size (px)
Citation preview
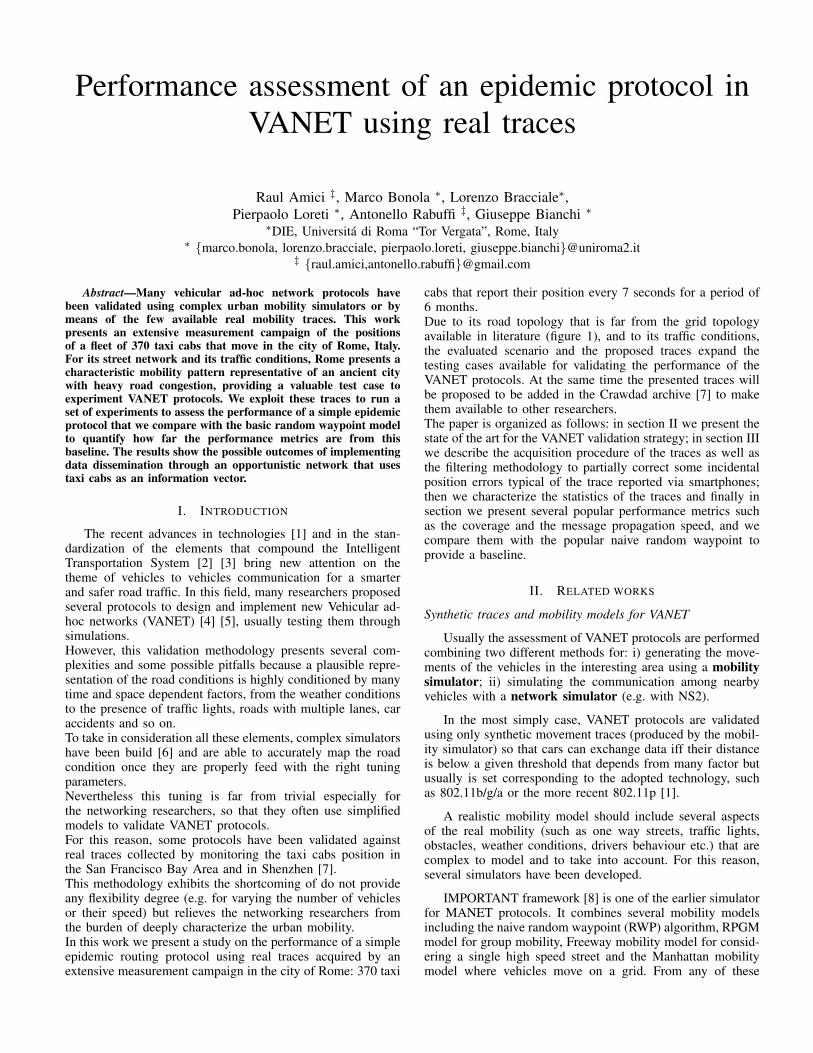
Performance assessment of an epidemic protocol inVANET using real traces
Raul Amici ‡, Marco Bonola ∗, Lorenzo Bracciale∗,Pierpaolo Loreti ∗, Antonello Rabuffi ‡, Giuseppe Bianchi ∗
∗DIE, Universita di Roma “Tor Vergata”, Rome, Italy∗ {marco.bonola, lorenzo.bracciale, pierpaolo.loreti, giuseppe.bianchi}@uniroma2.it
‡ {raul.amici,antonello.rabuffi}@gmail.com
Abstract—Many vehicular ad-hoc network protocols havebeen validated using complex urban mobility simulators or bymeans of the few available real mobility traces. This workpresents an extensive measurement campaign of the positionsof a fleet of 370 taxi cabs that move in the city of Rome, Italy.For its street network and its traffic conditions, Rome presents acharacteristic mobility pattern representative of an ancient citywith heavy road congestion, providing a valuable test case toexperiment VANET protocols. We exploit these traces to run aset of experiments to assess the performance of a simple epidemicprotocol that we compare with the basic random waypoint modelto quantify how far the performance metrics are from thisbaseline. The results show the possible outcomes of implementingdata dissemination through an opportunistic network that usestaxi cabs as an information vector.
I. INTRODUCTION
The recent advances in technologies [1] and in the stan-dardization of the elements that compound the IntelligentTransportation System [2] [3] bring new attention on thetheme of vehicles to vehicles communication for a smarterand safer road traffic. In this field, many researchers proposedseveral protocols to design and implement new Vehicular ad-hoc networks (VANET) [4] [5], usually testing them throughsimulations.However, this validation methodology presents several com-plexities and some possible pitfalls because a plausible repre-sentation of the road conditions is highly conditioned by manytime and space dependent factors, from the weather conditionsto the presence of traffic lights, roads with multiple lanes, caraccidents and so on.To take in consideration all these elements, complex simulatorshave been build [6] and are able to accurately map the roadcondition once they are properly feed with the right tuningparameters.Nevertheless this tuning is far from trivial especially forthe networking researchers, so that they often use simplifiedmodels to validate VANET protocols.For this reason, some protocols have been validated againstreal traces collected by monitoring the taxi cabs position inthe San Francisco Bay Area and in Shenzhen [7].This methodology exhibits the shortcoming of do not provideany flexibility degree (e.g. for varying the number of vehiclesor their speed) but relieves the networking researchers fromthe burden of deeply characterize the urban mobility.In this work we present a study on the performance of a simpleepidemic routing protocol using real traces acquired by anextensive measurement campaign in the city of Rome: 370 taxi
cabs that report their position every 7 seconds for a period of6 months.Due to its road topology that is far from the grid topologyavailable in literature (figure 1), and to its traffic conditions,the evaluated scenario and the proposed traces expand thetesting cases available for validating the performance of theVANET protocols. At the same time the presented traces willbe proposed to be added in the Crawdad archive [7] to makethem available to other researchers.The paper is organized as follows: in section II we present thestate of the art for the VANET validation strategy; in section IIIwe describe the acquisition procedure of the traces as well asthe filtering methodology to partially correct some incidentalposition errors typical of the trace reported via smartphones;then we characterize the statistics of the traces and finally insection we present several popular performance metrics suchas the coverage and the message propagation speed, and wecompare them with the popular naive random waypoint toprovide a baseline.
II. RELATED WORKS
Synthetic traces and mobility models for VANET
Usually the assessment of VANET protocols are performedcombining two different methods for: i) generating the move-ments of the vehicles in the interesting area using a mobilitysimulator; ii) simulating the communication among nearbyvehicles with a network simulator (e.g. with NS2).
In the most simply case, VANET protocols are validatedusing only synthetic movement traces (produced by the mobil-ity simulator) so that cars can exchange data iff their distanceis below a given threshold that depends from many factor butusually is set corresponding to the adopted technology, suchas 802.11b/g/a or the more recent 802.11p [1].
A realistic mobility model should include several aspectsof the real mobility (such as one way streets, traffic lights,obstacles, weather conditions, drivers behaviour etc.) that arecomplex to model and to take into account. For this reason,several simulators have been developed.
IMPORTANT framework [8] is one of the earlier simulatorfor MANET protocols. It combines several mobility modelsincluding the naive random waypoint (RWP) algorithm, RPGMmodel for group mobility, Freeway mobility model for consid-ering a single high speed street and the Manhattan mobilitymodel where vehicles move on a grid. From any of these
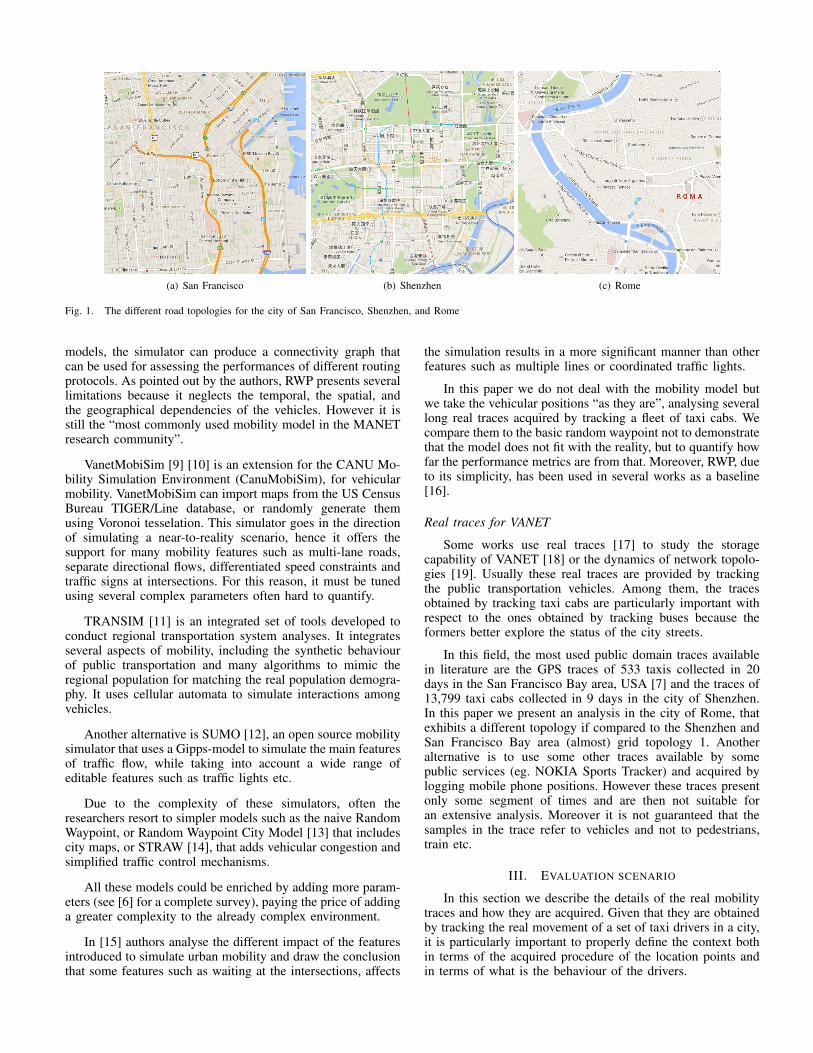
(a) San Francisco (b) Shenzhen (c) Rome
Fig. 1. The different road topologies for the city of San Francisco, Shenzhen, and Rome
models, the simulator can produce a connectivity graph thatcan be used for assessing the performances of different routingprotocols. As pointed out by the authors, RWP presents severallimitations because it neglects the temporal, the spatial, andthe geographical dependencies of the vehicles. However it isstill the “most commonly used mobility model in the MANETresearch community”.
VanetMobiSim [9] [10] is an extension for the CANU Mo-bility Simulation Environment (CanuMobiSim), for vehicularmobility. VanetMobiSim can import maps from the US CensusBureau TIGER/Line database, or randomly generate themusing Voronoi tesselation. This simulator goes in the directionof simulating a near-to-reality scenario, hence it offers thesupport for many mobility features such as multi-lane roads,separate directional flows, differentiated speed constraints andtraffic signs at intersections. For this reason, it must be tunedusing several complex parameters often hard to quantify.
TRANSIM [11] is an integrated set of tools developed toconduct regional transportation system analyses. It integratesseveral aspects of mobility, including the synthetic behaviourof public transportation and many algorithms to mimic theregional population for matching the real population demogra-phy. It uses cellular automata to simulate interactions amongvehicles.
Another alternative is SUMO [12], an open source mobilitysimulator that uses a Gipps-model to simulate the main featuresof traffic flow, while taking into account a wide range ofeditable features such as traffic lights etc.
Due to the complexity of these simulators, often theresearchers resort to simpler models such as the naive RandomWaypoint, or Random Waypoint City Model [13] that includescity maps, or STRAW [14], that adds vehicular congestion andsimplified traffic control mechanisms.
All these models could be enriched by adding more param-eters (see [6] for a complete survey), paying the price of addinga greater complexity to the already complex environment.
In [15] authors analyse the different impact of the featuresintroduced to simulate urban mobility and draw the conclusionthat some features such as waiting at the intersections, affects
the simulation results in a more significant manner than otherfeatures such as multiple lines or coordinated traffic lights.
In this paper we do not deal with the mobility model butwe take the vehicular positions “as they are”, analysing severallong real traces acquired by tracking a fleet of taxi cabs. Wecompare them to the basic random waypoint not to demonstratethat the model does not fit with the reality, but to quantify howfar the performance metrics are from that. Moreover, RWP, dueto its simplicity, has been used in several works as a baseline[16].
Real traces for VANET
Some works use real traces [17] to study the storagecapability of VANET [18] or the dynamics of network topolo-gies [19]. Usually these real traces are provided by trackingthe public transportation vehicles. Among them, the tracesobtained by tracking taxi cabs are particularly important withrespect to the ones obtained by tracking buses because theformers better explore the status of the city streets.
In this field, the most used public domain traces availablein literature are the GPS traces of 533 taxis collected in 20days in the San Francisco Bay area, USA [7] and the traces of13,799 taxi cabs collected in 9 days in the city of Shenzhen.In this paper we present an analysis in the city of Rome, thatexhibits a different topology if compared to the Shenzhen andSan Francisco Bay area (almost) grid topology 1. Anotheralternative is to use some other traces available by somepublic services (eg. NOKIA Sports Tracker) and acquired bylogging mobile phone positions. However these traces presentonly some segment of times and are then not suitable foran extensive analysis. Moreover it is not guaranteed that thesamples in the trace refer to vehicles and not to pedestrians,train etc.
III. EVALUATION SCENARIO
In this section we describe the details of the real mobilitytraces and how they are acquired. Given that they are obtainedby tracking the real movement of a set of taxi drivers in a city,it is particularly important to properly define the context bothin terms of the acquired procedure of the location points andin terms of what is the behaviour of the drivers.
Traces acquisition methodology
Each driver has a tablet device with the Android OS andan app that sends the GPS position every 7 seconds towards aserver.On the application side, the position is updated using thegetLastKnownLocation method of the LocationManager An-droid object and it is filtered against its precision, using thegetAccuracy() function. This function returns the estimatedaccuracy in meters with 68% of probability. A sample isaccepted only if the accuracy is less than 20m and it isdiscarded otherwise.
We subsequently filter the collected traces to mitigate somelocalization errors. In particular, analysing the trace we noticethat there are some “oddities” that we recognize because thedistance between two subsequent points is more than 125mthat corresponds to a speed greater than 64km/h, a reasonableupper bound considering that the speed limit in the downtownis 50km/h. These oddities usually happen when the driversare in some part of the city where the GPS service qualityis poor (e.g. tunnels, high buildings etc.). In these cases wedistinguish if the duration of the anomaly if lesser or greaterthan 42s (i.e. 6 points). In the former case we simply discardthe “bad” samples. In the latter case (and if the anomalyis not too long, less than 8 minutes), we correct the traceby introducing artificial samples according to the short pathbetween the endpoints of the gap. For this task we use theOpen Streetmap database. Finally, if the gap is greater than 8minutes, we consider it as a service interruption (lunch break,end of shift etc) and we take no action in this case.
Description of the sampled scenario
We limit our analysis to the center of Rome, where thedensity of the taxi cabs is relevant.We consider an area of 8km x 8km whose bounds are givenby the coordinates pairs (41.856, 12.442) (41.928, 12.5387).This scenario is characterized by very thin and congestedroads, high traffic volume and slow speed.The area has been analysed using a 32x32 grid. A grid cellcovers a square area of 250x250m.
Statistical parameters of the evaluated traces
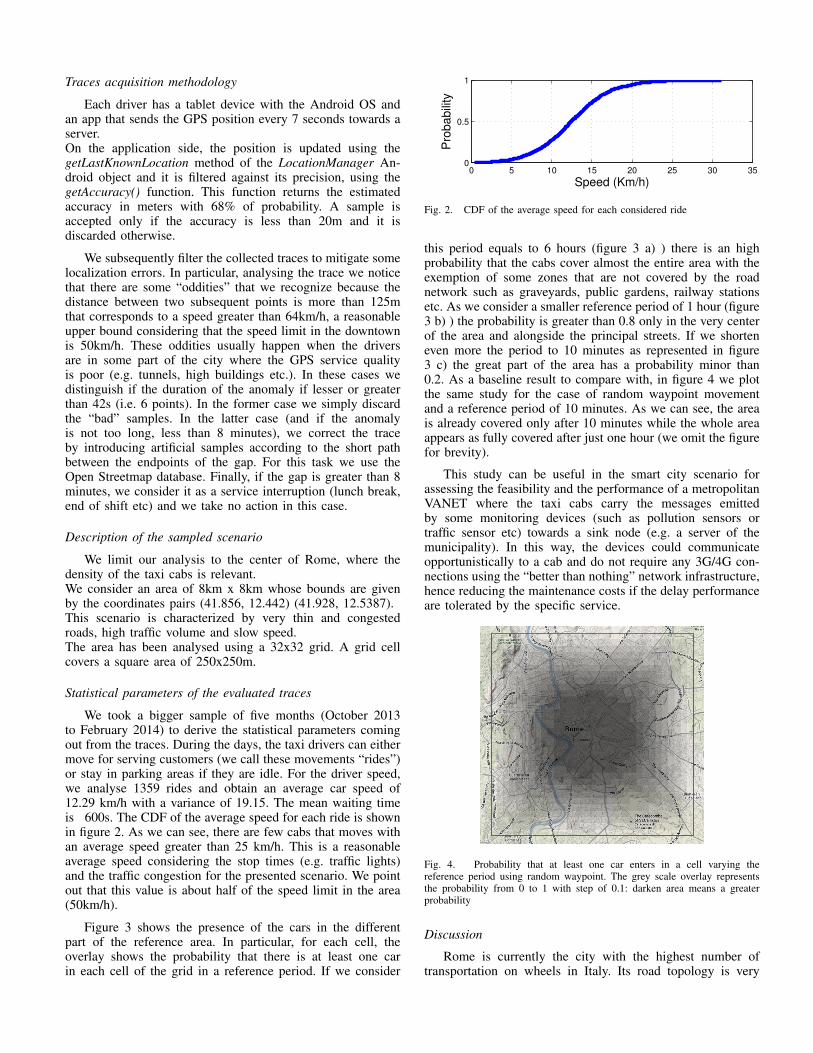
We took a bigger sample of five months (October 2013to February 2014) to derive the statistical parameters comingout from the traces. During the days, the taxi drivers can eithermove for serving customers (we call these movements “rides”)or stay in parking areas if they are idle. For the driver speed,we analyse 1359 rides and obtain an average car speed of12.29 km/h with a variance of 19.15. The mean waiting timeis 600s. The CDF of the average speed for each ride is shownin figure 2. As we can see, there are few cabs that moves withan average speed greater than 25 km/h. This is a reasonableaverage speed considering the stop times (e.g. traffic lights)and the traffic congestion for the presented scenario. We pointout that this value is about half of the speed limit in the area(50km/h).
Figure 3 shows the presence of the cars in the differentpart of the reference area. In particular, for each cell, theoverlay shows the probability that there is at least one carin each cell of the grid in a reference period. If we consider
0 5 10 15 20 25 30 350
0.5
1
Speed (Km/h)
Pro
babili
ty
Fig. 2. CDF of the average speed for each considered ride
this period equals to 6 hours (figure 3 a) ) there is an highprobability that the cabs cover almost the entire area with theexemption of some zones that are not covered by the roadnetwork such as graveyards, public gardens, railway stationsetc. As we consider a smaller reference period of 1 hour (figure3 b) ) the probability is greater than 0.8 only in the very centerof the area and alongside the principal streets. If we shorteneven more the period to 10 minutes as represented in figure3 c) the great part of the area has a probability minor than0.2. As a baseline result to compare with, in figure 4 we plotthe same study for the case of random waypoint movementand a reference period of 10 minutes. As we can see, the areais already covered only after 10 minutes while the whole areaappears as fully covered after just one hour (we omit the figurefor brevity).
This study can be useful in the smart city scenario forassessing the feasibility and the performance of a metropolitanVANET where the taxi cabs carry the messages emittedby some monitoring devices (such as pollution sensors ortraffic sensor etc) towards a sink node (e.g. a server of themunicipality). In this way, the devices could communicateopportunistically to a cab and do not require any 3G/4G con-nections using the “better than nothing” network infrastructure,hence reducing the maintenance costs if the delay performanceare tolerated by the specific service.
Fig. 4. Probability that at least one car enters in a cell varying thereference period using random waypoint. The grey scale overlay representsthe probability from 0 to 1 with step of 0.1: darken area means a greaterprobability
Discussion
Rome is currently the city with the highest number oftransportation on wheels in Italy. Its road topology is very
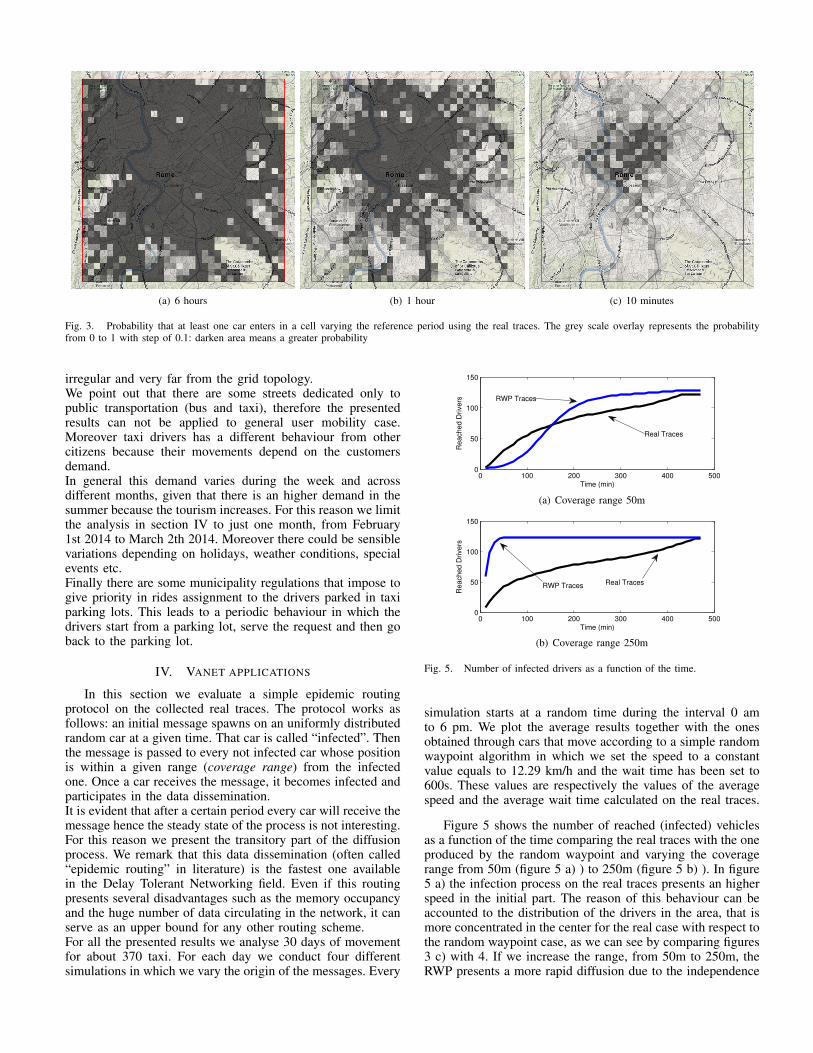
(a) 6 hours (b) 1 hour (c) 10 minutes
Fig. 3. Probability that at least one car enters in a cell varying the reference period using the real traces. The grey scale overlay represents the probabilityfrom 0 to 1 with step of 0.1: darken area means a greater probability
irregular and very far from the grid topology.We point out that there are some streets dedicated only topublic transportation (bus and taxi), therefore the presentedresults can not be applied to general user mobility case.Moreover taxi drivers has a different behaviour from othercitizens because their movements depend on the customersdemand.In general this demand varies during the week and acrossdifferent months, given that there is an higher demand in thesummer because the tourism increases. For this reason we limitthe analysis in section IV to just one month, from February1st 2014 to March 2th 2014. Moreover there could be sensiblevariations depending on holidays, weather conditions, specialevents etc.Finally there are some municipality regulations that impose togive priority in rides assignment to the drivers parked in taxiparking lots. This leads to a periodic behaviour in which thedrivers start from a parking lot, serve the request and then goback to the parking lot.
IV. VANET APPLICATIONS
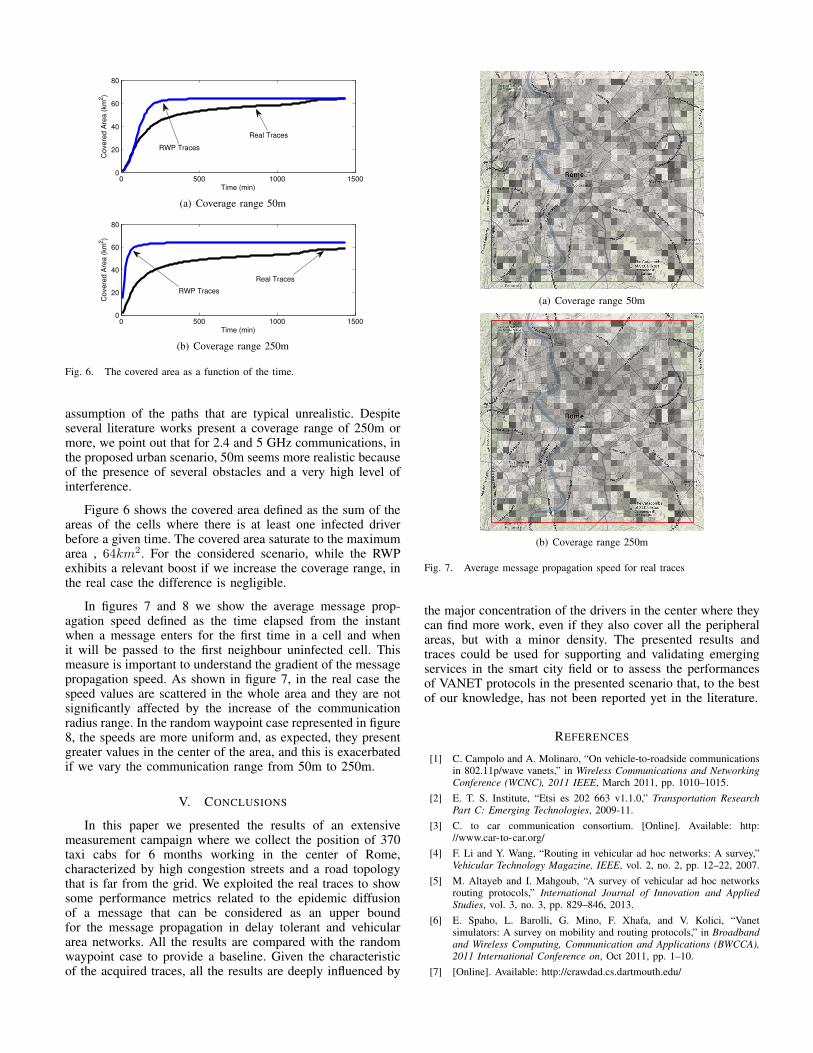
In this section we evaluate a simple epidemic routingprotocol on the collected real traces. The protocol works asfollows: an initial message spawns on an uniformly distributedrandom car at a given time. That car is called “infected”. Thenthe message is passed to every not infected car whose positionis within a given range (coverage range) from the infectedone. Once a car receives the message, it becomes infected andparticipates in the data dissemination.It is evident that after a certain period every car will receive themessage hence the steady state of the process is not interesting.For this reason we present the transitory part of the diffusionprocess. We remark that this data dissemination (often called“epidemic routing” in literature) is the fastest one availablein the Delay Tolerant Networking field. Even if this routingpresents several disadvantages such as the memory occupancyand the huge number of data circulating in the network, it canserve as an upper bound for any other routing scheme.For all the presented results we analyse 30 days of movementfor about 370 taxi. For each day we conduct four differentsimulations in which we vary the origin of the messages. Every
0 100 200 300 400 5000
50
100
150
Time (min)
Re
ach
ed
Drive
rs RWP Traces
Real Traces
(a) Coverage range 50m
0 100 200 300 400 5000
50
100
150
Time (min)
Re
ach
ed
Drive
rs
RWP Traces Real Traces
(b) Coverage range 250m
Fig. 5. Number of infected drivers as a function of the time.
simulation starts at a random time during the interval 0 amto 6 pm. We plot the average results together with the onesobtained through cars that move according to a simple randomwaypoint algorithm in which we set the speed to a constantvalue equals to 12.29 km/h and the wait time has been set to600s. These values are respectively the values of the averagespeed and the average wait time calculated on the real traces.
Figure 5 shows the number of reached (infected) vehiclesas a function of the time comparing the real traces with the oneproduced by the random waypoint and varying the coveragerange from 50m (figure 5 a) ) to 250m (figure 5 b) ). In figure5 a) the infection process on the real traces presents an higherspeed in the initial part. The reason of this behaviour can beaccounted to the distribution of the drivers in the area, that ismore concentrated in the center for the real case with respect tothe random waypoint case, as we can see by comparing figures3 c) with 4. If we increase the range, from 50m to 250m, theRWP presents a more rapid diffusion due to the independence
0 500 1000 15000
20
40
60
80
Time (min)
Co
ve
red
Are
a (
km
2)
RWP Traces
Real Traces
(a) Coverage range 50m
0 500 1000 15000
20
40
60
80
Time (min)
Co
ve
red
Are
a (
km
2)
Real Traces
RWP Traces
(b) Coverage range 250m
Fig. 6. The covered area as a function of the time.
assumption of the paths that are typical unrealistic. Despiteseveral literature works present a coverage range of 250m ormore, we point out that for 2.4 and 5 GHz communications, inthe proposed urban scenario, 50m seems more realistic becauseof the presence of several obstacles and a very high level ofinterference.
Figure 6 shows the covered area defined as the sum of theareas of the cells where there is at least one infected driverbefore a given time. The covered area saturate to the maximumarea , 64km2. For the considered scenario, while the RWPexhibits a relevant boost if we increase the coverage range, inthe real case the difference is negligible.
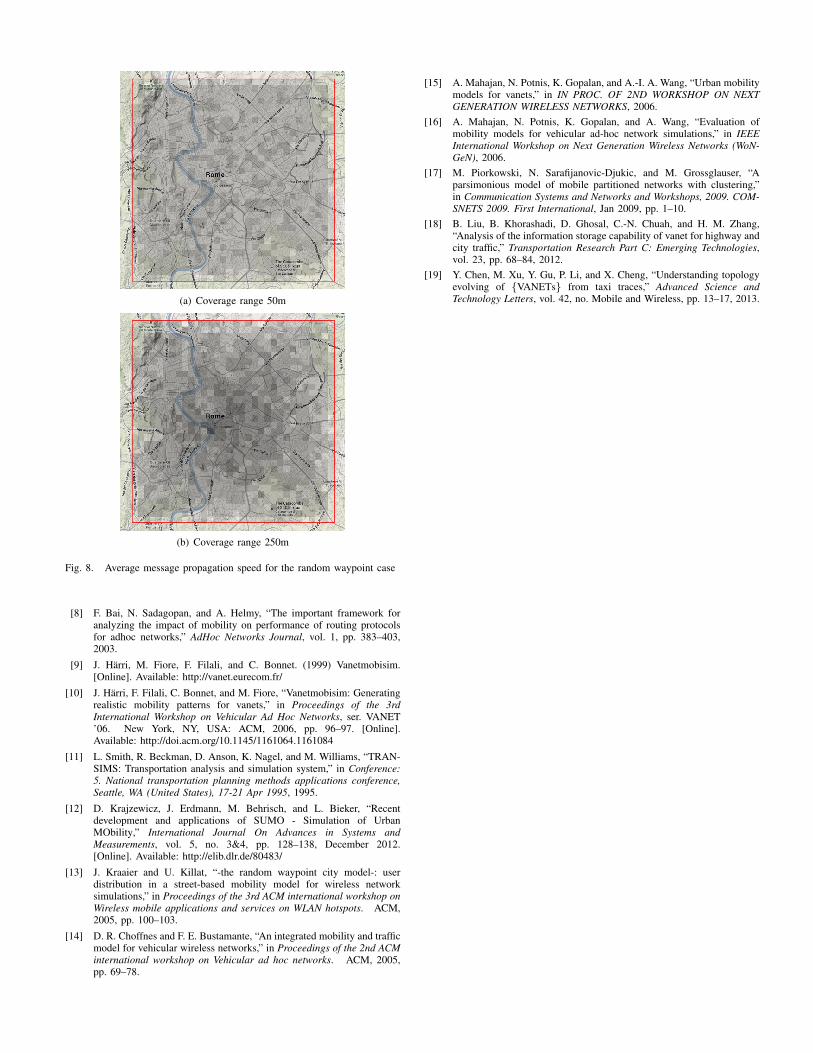
In figures 7 and 8 we show the average message prop-agation speed defined as the time elapsed from the instantwhen a message enters for the first time in a cell and whenit will be passed to the first neighbour uninfected cell. Thismeasure is important to understand the gradient of the messagepropagation speed. As shown in figure 7, in the real case thespeed values are scattered in the whole area and they are notsignificantly affected by the increase of the communicationradius range. In the random waypoint case represented in figure8, the speeds are more uniform and, as expected, they presentgreater values in the center of the area, and this is exacerbatedif we vary the communication range from 50m to 250m.
V. CONCLUSIONS
In this paper we presented the results of an extensivemeasurement campaign where we collect the position of 370taxi cabs for 6 months working in the center of Rome,characterized by high congestion streets and a road topologythat is far from the grid. We exploited the real traces to showsome performance metrics related to the epidemic diffusionof a message that can be considered as an upper boundfor the message propagation in delay tolerant and vehiculararea networks. All the results are compared with the randomwaypoint case to provide a baseline. Given the characteristicof the acquired traces, all the results are deeply influenced by
(a) Coverage range 50m
(b) Coverage range 250m
Fig. 7. Average message propagation speed for real traces
the major concentration of the drivers in the center where theycan find more work, even if they also cover all the peripheralareas, but with a minor density. The presented results andtraces could be used for supporting and validating emergingservices in the smart city field or to assess the performancesof VANET protocols in the presented scenario that, to the bestof our knowledge, has not been reported yet in the literature.
REFERENCES
[1] C. Campolo and A. Molinaro, “On vehicle-to-roadside communicationsin 802.11p/wave vanets,” in Wireless Communications and NetworkingConference (WCNC), 2011 IEEE, March 2011, pp. 1010–1015.
[2] E. T. S. Institute, “Etsi es 202 663 v1.1.0,” Transportation ResearchPart C: Emerging Technologies, 2009-11.
[3] C. to car communication consortium. [Online]. Available: http://www.car-to-car.org/
[4] F. Li and Y. Wang, “Routing in vehicular ad hoc networks: A survey,”Vehicular Technology Magazine, IEEE, vol. 2, no. 2, pp. 12–22, 2007.
[5] M. Altayeb and I. Mahgoub, “A survey of vehicular ad hoc networksrouting protocols,” International Journal of Innovation and AppliedStudies, vol. 3, no. 3, pp. 829–846, 2013.
[6] E. Spaho, L. Barolli, G. Mino, F. Xhafa, and V. Kolici, “Vanetsimulators: A survey on mobility and routing protocols,” in Broadbandand Wireless Computing, Communication and Applications (BWCCA),2011 International Conference on, Oct 2011, pp. 1–10.
[7] [Online]. Available: http://crawdad.cs.dartmouth.edu/
(a) Coverage range 50m
(b) Coverage range 250m
Fig. 8. Average message propagation speed for the random waypoint case
[8] F. Bai, N. Sadagopan, and A. Helmy, “The important framework foranalyzing the impact of mobility on performance of routing protocolsfor adhoc networks,” AdHoc Networks Journal, vol. 1, pp. 383–403,2003.
[9] J. Harri, M. Fiore, F. Filali, and C. Bonnet. (1999) Vanetmobisim.[Online]. Available: http://vanet.eurecom.fr/
[10] J. Harri, F. Filali, C. Bonnet, and M. Fiore, “Vanetmobisim: Generatingrealistic mobility patterns for vanets,” in Proceedings of the 3rdInternational Workshop on Vehicular Ad Hoc Networks, ser. VANET’06. New York, NY, USA: ACM, 2006, pp. 96–97. [Online].Available: http://doi.acm.org/10.1145/1161064.1161084
[11] L. Smith, R. Beckman, D. Anson, K. Nagel, and M. Williams, “TRAN-SIMS: Transportation analysis and simulation system,” in Conference:5. National transportation planning methods applications conference,Seattle, WA (United States), 17-21 Apr 1995, 1995.
[12] D. Krajzewicz, J. Erdmann, M. Behrisch, and L. Bieker, “Recentdevelopment and applications of SUMO - Simulation of UrbanMObility,” International Journal On Advances in Systems andMeasurements, vol. 5, no. 3&4, pp. 128–138, December 2012.[Online]. Available: http://elib.dlr.de/80483/
[13] J. Kraaier and U. Killat, “-the random waypoint city model-: userdistribution in a street-based mobility model for wireless networksimulations,” in Proceedings of the 3rd ACM international workshop onWireless mobile applications and services on WLAN hotspots. ACM,2005, pp. 100–103.
[14] D. R. Choffnes and F. E. Bustamante, “An integrated mobility and trafficmodel for vehicular wireless networks,” in Proceedings of the 2nd ACMinternational workshop on Vehicular ad hoc networks. ACM, 2005,pp. 69–78.
[15] A. Mahajan, N. Potnis, K. Gopalan, and A.-I. A. Wang, “Urban mobilitymodels for vanets,” in IN PROC. OF 2ND WORKSHOP ON NEXTGENERATION WIRELESS NETWORKS, 2006.
[16] A. Mahajan, N. Potnis, K. Gopalan, and A. Wang, “Evaluation ofmobility models for vehicular ad-hoc network simulations,” in IEEEInternational Workshop on Next Generation Wireless Networks (WoN-GeN), 2006.
[17] M. Piorkowski, N. Sarafijanovic-Djukic, and M. Grossglauser, “Aparsimonious model of mobile partitioned networks with clustering,”in Communication Systems and Networks and Workshops, 2009. COM-SNETS 2009. First International, Jan 2009, pp. 1–10.
[18] B. Liu, B. Khorashadi, D. Ghosal, C.-N. Chuah, and H. M. Zhang,“Analysis of the information storage capability of vanet for highway andcity traffic,” Transportation Research Part C: Emerging Technologies,vol. 23, pp. 68–84, 2012.
[19] Y. Chen, M. Xu, Y. Gu, P. Li, and X. Cheng, “Understanding topologyevolving of {VANETs} from taxi traces,” Advanced Science andTechnology Letters, vol. 42, no. Mobile and Wireless, pp. 13–17, 2013.