Embed Size (px)
Citation preview

Performance Assurance Framework - Annual Review and Feedback Request 2021
23rd September 2021
V 1.3 FINAL

2
Contents
Contents ................................................................................................................................................................. 2
Change History ....................................................................................................................................................... 3
Document Controls ................................................................................................................................................. 3
About this document .............................................................................................................................................. 4
Feedback request: .................................................................................................................................................. 4
Executive Summary ................................................................................................................................................ 6
1. Performance Assurance Committee ......................................................................................................... 10
2. Performance Assurance Reports and the Data Delivery Platform ............................................................ 12
3. Performance Assurance Techniques ......................................................................................................... 14
4. Performance improvements (to date) ...................................................................................................... 16
5. Industry Engagement/ Future plans for secure file sharing ...................................................................... 22
6. Risk Register .............................................................................................................................................. 24
7. UNC Modification proposals – Industry change ........................................................................................ 27
Appendix 1: PARR description .............................................................................................................................. 29
Appendix 2: Performance Improvement Process ................................................................................................. 32
Appendix 3: Annual performance graphs ............................................................................................................. 34

3
CHANGE HISTORY
Version Status Issue Date Author Comments
V1.0 Draft 23/07/2021 Rachel Clarke Initial Draft
V 1.1 Draft 01/09/2021 Rachel Clarke PAC additions
V1.2 Draft 20/09/2021 Anne Jackson PAC additions
V1.3 Final 23/09/2021 Anne Jackson PAC additions
DOCUMENT CONTROLS
Reviewer Role Responsibility Date
Anne Jackson Reviewer Initial review 06/09/2021
Sara Usmani Reviewer Quality review 06/09/2021
Sara Usmani Reviewer Quality review 20/09/2021
Sara Usmani Reviewer Quality review 23/09/2021

4
About this document
This report provides an overview of the work undertaken by the Performance Assurance Committee (PAC),
Performance Assurance Framework Administrator (PAFA) and the Central Data Service Provider (CDSP) for the
operation of the Uniform Network Code (UNC) Gas Performance Assurance regime between the period 1st July
2020 to 30th June 2021.
The PAC operates within the Performance Assurance Framework (PAF). The PAF is limited to energy and supply
points within local distribution zones, including those in Independent Gas Transport Networks (IGT) (although
PAC governance is limited to the UNC and PAC have no jurisdiction over matters governed by the IGT UNC), it
does not extend to energy transported through the National Transmission System and supply meter points
connected to it.
The PAC monitors Shippers’ performance against the Performance Assurance Reports Register (PARR). The data
within these reports is used by the PAFA to review Industry performance, identify areas for performance
improvement and to target poorly performing Shippers to request performance improvement action. The PAC
also monitor the risks in the risk register and their impacts on gas industry settlement risk.
Feedback request:
As part of the annual review process the PAC are seeking views from industry on the following areas:
• Performance Assurance Framework (PAF) arrangements;
o Please comment on whether the Framework meets the needs of the UNC, your organisation,
and the wider gas industry;
o Please indicate its strengths and weaknesses;
• PAC (in its role as managers of the PAF);
o Are you aware of the work the PAC do? If so, how have you become aware of the work?
o Please comment on the PAC’s management of the framework in terms of the PAF, the UNC,
your organisation, and the wider gas industry;
o Please share identified positives and negatives;
• PAFA (in its role as administrators of the PAF)
o Please comment on the work of the PAFA in relation to the PAF, your organisation, the UNC
and the wider industry;
o Please share identified positives and negatives;
5
o If you’ve been engaged with PAFA following receipt of a performance communication, how
would you rate your experience:
▪ E.g. Professionalism
▪ E.g. Knowledge
▪ E.g. Helpfulness
• CDSP (for the provision of performance insights and information)
o Please comment on the work of the CDSP in the context of Performance Assurance and in
relation to performance insights and information for your organisation, the PAF, the UNC, the
DDP and PA reports;
o Please share identified positives and negatives; and
• Performance Impacting Operational and Industry issues
o Please indicate any issues that are impacting performance reports for the industry or your
organisation.
• If your organisation has been involved in an improvement plan, would you say it helped you focus
improvement action within your organisation?
• Does your organisation obtain the monthly Performance Assurance Reports via the Huddle platform?
If not, why? E.g., view performance in DDP, not relevant, not user friendly etc.
Comments, feedback, or suggestions may be sent to [email protected]
Anonymous/confidential response should be marked as such.

6
Executive Summary
The work of the PAC over the past twelve months has culminated in multiple success stories with a record
number of Shippers completing improvement plans and meeting UNC target since the regime’s inception.
The profile of the PAC and its implementation of the Performance Assurance Framework (PAF) in the past year
has been raised, with the work of the PAC being increasingly recognised across the industry. This has been seen
through wider industry engagement and improvements in the data the PAC analyse monthly. The PAC have
formulated new performance assurance techniques in the past year, with the creation of an escalation process
being introduced for poorly performing Shippers.
Table 1.2: Average read performance (%) of Parties under active monitoring
PC1 PC2 PC3 PC4 Monthly
July 2020 72% 54% 40% 34%
July 2021 98% 68% 66% 44%
Variation 16% 14% 26% 10%
Figure 1.1 illustrates the improvements made over the year from active monitoring by PAC. A record number of
Shippers have been contacted regarding making improvements to their performance against the requirements
of the UNC. PAC successes of performance improvement plan requests and industry improvements seen as a
result of this action in the previous year supported this approach.
Some of the most notable PAC and PAF achievements over the last 12 months have been:
• Significant increase in the number of performance improvement techniques being applied:
▪ Issuing 54 Performance Observation letters;
▪ Making 40 Performance Improvement Plan Requests
▪ 5 Read performance improvement requests were made covering all markets
(PC1, PC2, PC3, PC4 monthly and PC4 annual)
▪ 35 Read performance improvement requests were made on the PC4 Monthly
market
▪ Contacting 18 Shippers regarding the provision of NDM sample data;
• The closure of two Shipper’s performance plans following the Shippers enhanced performance of reaching
UNC target for three consecutive months, which demonstrated they were able to improve performance and
maintain the required standard of performance

7
• The number of Shippers achieving UNC target for a period of three or more months has increased on average
from 7% to 20% in the PC2 market in 2020 to 2021. It has also increased from 4% to 16% in the PC4 Monthly
market in the same period.
• The continued development of the PARR
o Over the course of the year, the number of reports has grown within both the anonymised (“A” for
industry) and non-anonymised reports (“B” for PAC)
▪ The Anonymised PARR reporting suite has seen an increase from ten anonymised reports
(thirteen including the sub-reports) to thirteen anonymised reports (nineteen including
the sub-reports)
▪ The Non-Anonymised PARR reporting suite has increased from a total of eleven reports
(twenty-one including the sub-reports) to fourteen non-anonymised reports (twenty-
seven including the sub-reports).
o An increasing number of UNC modifications contain recognition for the requirement of PARR
reports.
o PAFA have worked closely with the CDSP to test the development of the Data Delivery Platform
helping to ensure that the logic used for the PAC reports is reflective of the requirements of the
PARR and offers the PAC the appropriate level of insight. This has in turn allowed Shippers to save
resource costs on testing in order to ensure that the DDP is delivered on schedule.
• Increased Shipper engagement levels, demonstrated through engagement in performance improvement
plans, requests to attend PAC meetings and emails to the PAFA mailbox.
• Risk register redesign completed:
o 30 risks recorded;
o 4 risks closed;
o 4 open issues recorded;
o PAC worked on grouping risks into topics, to target specific areas for improvement including;
▪ Data/Volume;
▪ Meter Read;
▪ Retrospective;
▪ Unattributed;
▪ Meter Asset; and
▪ General.
Additionally the PAC requested a Shipper attend a PAC meeting to discuss their performance in Settlement and
how the party intended on addressing this performance. The meeting was well received and identified several
areas the Shipper needed to address in order to be able to meet their UNC targets. PAFA and the Correla
Customer Advocate Managers (CAMs) have worked closely with this Shipper, bringing monthly updates back to
the PAC on their progress.
8
The PAC met a total of eighteen times over the past twelve months; consisting of twelve Committee meetings,
three Data Delivery Platform (DDP) outputs development workshops and three PARR/risk review workshops. A
considerable amount of work has been undertaken to re-engineer the Risk evaluation tool as well as the Risk
Register over this period. To date, twelve of the sixteen PARR reports are available on Xoserve’s Data Delivery
Platform (DDP), with work continuing to deliver the remaining reports as soon as possible. An increasing number
of UNC modifications contain reference to the requirement for PAC to monitor industry behaviour in a particular
area and consider development of a PARR report.
The PAC has also continued to work closely with the PAFA and CDSP to further develop the range of performance
assurance techniques available to them. PAFA have continued to work with the Xoserve Customer Advocate
team, meeting with them every two weeks. The primary aim of these meetings is to increase communication
with Shipper organisations, highlighting areas of concern and offering performance assurance advice. The
implementation of these techniques has led to performance improvements across many of the areas monitored
by the PARR reports.
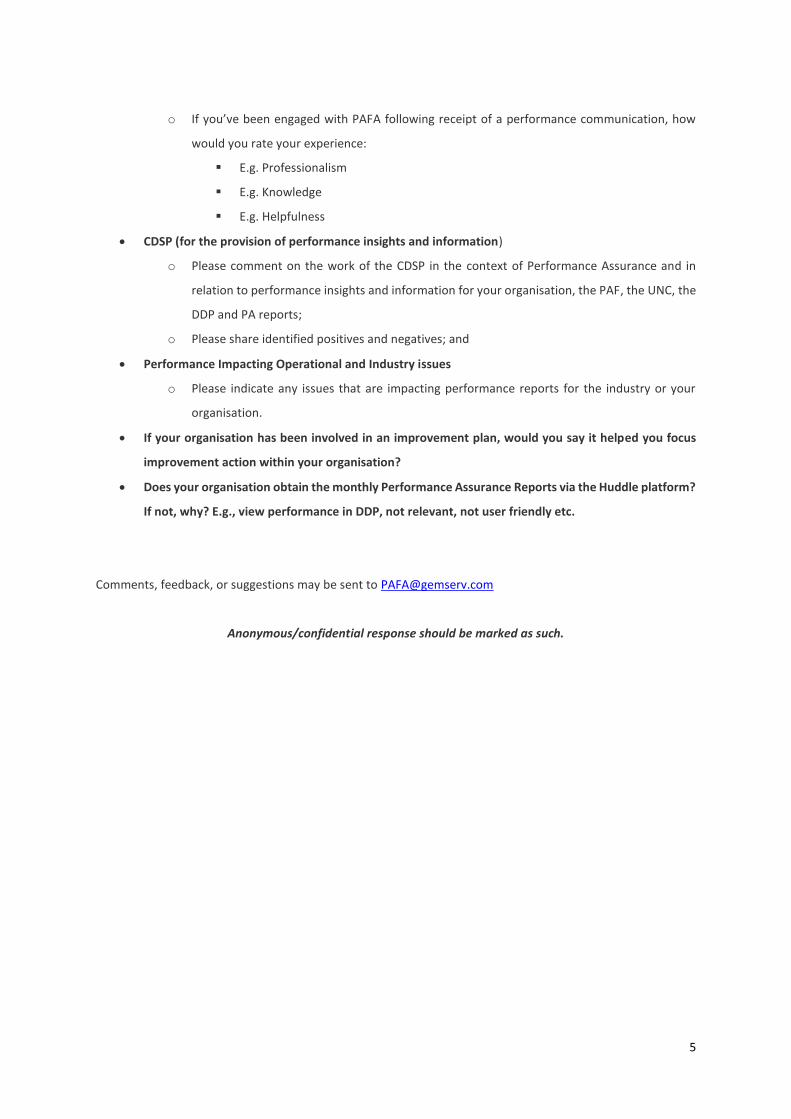
Although there have been many successes over the past twelve months, there is still some way to go to ensure
industry are moving towards and maintaining UNC target for meter reading and helping parties meet their UNC
obligations. Table1.2 below shows the current levels of parties meeting UNC requirements for meter reading
across the industry by product class1.
Table 1.2: The percentage (%) of Parties meeting UNC requirements for each meter reading class
PC1 PC2 PC3 PC4 Monthly PC4 Annual
2020 37% 7% 33% 4% 31%
2021 32% 20% 32% 16% 28%
Variation -5% +13% -1% +12% -3%
Although meter reading performance was impacted by the Government’s Covid measures, there is still clear
evidence that the PAC need to maintain and, in some areas, increase the levels of pressure on the industry to
ensure performance reaches a stage at which maintenance of target performance is achieved. As well as using
the PAF to improve gas settlement, there is work to be done in educating the industry on Settlement, meter
read performance and UNC obligations. The Gas Performance Assurance Framework will be enhanced radically
if UNC674 (Performance Assurance Techniques and Controls) is implemented, however, this may not be for
1 Percentage calculated over the previous three months (May – June 2021 for PC1, PC2 and PC3) (April – June 2021 for PC4 Monthly and PC4 Annual)

9
some time and the PAC are aware that there is much work to be done in the interim of such changes being
brought in.
For the coming contract year, one aspect of the PAC’s focus will continue to be meter readings with an objective
to improve meter read performance across all product classes. In the past year the PAC carried out strategic
targeting of all product classes and good work has been carried out on bringing the industry on that journey. In
the next year the PAC expect to see the benefits of this targeting approach and it will help to steer their future
strategy, complimented by the Risk Register and the Risk Evaluation Tool.

10
1. Performance Assurance Committee
The PAC is made up of a total of twelve seats, nine of which are held by Shippers and three by Transporters. This
is illustrated below in Figure 1.1.
Figure 1.1: Performance Assurance Committee Member structure as of August 2021.
Due to the sensitive nature of the information discussed at the PAC, the meetings are closed. However, industry
participants are able to request attendance to some sections of the meetings by emailing a request to the Joint
Office of Gas Transporters. Ofgem also has an optional non-voting seat on the committee and are able to attend
PAC meetings. During 2020 – 2021 there has been a Shipper vacancy on the Performance Assurance Committee,
however, the PAC have rarely experienced quoracy issues. PAC elections take place every year and new PAC
members are appointed on 1st October following an election process which is carried out by the Joint Office as
the PAC Secretariat.
The PAC meetings are held on the second Tuesday of each month and are supported by the Joint Office of Gas
Transporters in its role as UNCC sub-committee chair and secretariat, and PAFA as administrator of the
Performance Assurance Framework (PAF). Xoserve in its role as the Central Data Service Supplier (CDSP) also
attends as an observer.

11
The PAF contains the following objectives:
• To determine the appropriate reporting and analysis to measure energy settlement performance and
risks to it;
• To create a risk register and supporting analysis to assess risks and determine mitigation activities for
energy settlement performance;
• To report as necessary; and
• To create a regime incentivising the required performance, if necessary, by proposing modifications to
the UNC.
The primary goal of the monthly PAC meetings is to work towards the achievement of these objectives. The PAC
and its relationship to the rest of the industry is demonstrated below in Figure 1.2.
Figure 1.2: PAC industry structure
The PAC terms of reference and the Performance Assurance Framework document can be found on the PAC
section of the Joint Office website: https://www.gasgovernance.co.uk/PAC

12
2. Performance Assurance Reports and the Data
Delivery Platform
The PARR reports are separated into two reports: anonymised (marked as “A” reports) and non-anonymised
(marked as “B” reports) versions. The anonymised reports are reported to the industry whilst the non-
anonymised reports are only available to PAC members. Non-anonymised reports are used by the PAFA to
monitor Shipper performance and in turn, provide performance assurance to the PAC. It should be noted that
the PARR reports consider data relating to all energy and supply points within local distribution zones, including
those in Independent Gas Transport Networks (IGT) – but excluding those directly connected to the National
Transmission System.
Both A and B reports are published via the Huddle platform, with a separate location for the non-anonymised
reporting which is closely monitored by the PAFA in order to ensure the Huddle Workspace is being used
appropriately. The PARR reports included within the industry view (A) are below in Figure 2.
Figure 2: PARR report structure – anonymised reports
Report
number Report Title
2A.1 Estimated read performance
2A.2 No meter recorded in the Supply Point Register
2A.3 No meter recorded and data flows received
2A.4 Shipper Transfer read performance
2A.5 Meter read performance
2A.6 Meter read validity failure
2A.7 No read received for 1, 2, 3 or 4 years
2A.8 AQ corrections by reason code
2A.9 Standard Correction Factors
2A.10 Replaced Meter reads
2A.11 Sites above the Class 1 threshold which are not in Class 1
2A.12 Class 4 read submission performance as a percentage of portfolio AQ

13
2A.13 Breakdown of AQ overdue for a Meter Reading
The PAFA also receive WAR band updates and NDM Sample data updates throughout the year and ensure this
data is fed into PAC discussions.
The full specification of these reports and the non-anonymised reports can be found in Appendix 1 of this
document. Graphs demonstrating average industry performance across all thirteen PARR reports can be found
in Appendix 4 of this report.
The PAC and PAFA have continued to work on the development of the PARR, adding granularity and clarity to
the reports and identifying the requirement for additional data items to add context and additional dimensions
to the reporting. PAC welcomes the increasing number of UNC modifications, whereby the proposer now
includes the requirement for a PARR report and associated transparency and monitoring ability that this brings.
As a result of this the number of reports included in the PARR is growing.
Change Management Committee (ChMC) change XRN4876 was delivered during this year, and it provided
further data, through the DDP to PAFA to aid analysis of performance reporting. The change will allow the PAFA
to access more up to date data and the ability to cross-reference the data to bring more in-depth analysis and
considerations to the PAC.
The development of the Data Delivery Platform (DDP) by the CDSP is set to enable the PAFA (and Shippers),
when fully rolled out, to ’self-serve’ their monthly reports. To facilitate this, PAFA were added to the Data
Permissions Matrix (DPM), through the implementation of modification UNC0707S: Introducing ‘Performance
Assurance Framework Administrator’ as a User Type to the Data Permissions Matrix2.
Currently twelve PARR reports are available on the DDP, with the remaining four reports to be delivered as soon
as possible. The additional reporting that is available to the PAC, as well as additional reports due to
implementation of modifications, are also expected to be available imminently. The PAFA, alongside Xoserve
carried out sub-groups to scope and spec out the user stories which would be later added into the DDP for both
PAFA and Shipper views. PAFA have also carried out testing for all stages of implementation of the platform,
ensuring that all user stories implemented met the specifications and identified any anomalies.
Details of the change proposal requests can be found here: https://www.xoserve.com/change/change-
proposals/?customers=&statuses=&search=
2 https://www.gasgovernance.co.uk/0707

14
3. Performance Assurance Techniques
The PAC, with the support of PAFA, monitors Shipper performance against the PARR. The data within these
reports alongside market intelligence and input from the Xoserve Customer Advocate teams is used by the PAFA
to identify areas for industry performance improvement and target specific Shippers exhibiting poor
performance for performance improvement action.
Where areas for performance improvement are identified the PAC have deployed several performance
assurance techniques to encourage Shippers to work towards meeting the requirements of the UNC. Over the
course of the year, the PAC have worked to deploy these techniques across the PARR, issuing a total of One
hundred nine Shipper specific communications. These are spread across the performance assurance techniques
as follows:
• Issuing 54 Performance Observation letters,
• Making 23 Performance Improvement Requests PC1, 2, 3 and PC4 Annual,
• Making 32 PC4 Monthly Performance Improvement Requests, leading to;
o Establishing 48 Performance improvement plans with Shipper organisations; and
• Contacting 18 Shippers regarding the provision of NDM sample data.

15
The Performance Assurance Techniques are displayed below in Figure 3, a full description of the techniques can
be found in Appendix 2 of this document.
Figure 3: Performance Assurance Techniques

16
4. Performance improvements (to date)
The PAC and PAFA have continued to work closely alongside the Xoserve Customer Advocate Team (CAMs) to
encourage improvements in Shipper performance. PAFA meets with the CAMS every two weeks to discuss areas
of concern, discuss progress, and understand issues that are currently impacting the industry as a whole.
Following the outbreak of COVID-19 and the multiple UK lockdowns, PAC took the decision, guided by Ofgem
communications in this area, to suspend performance improvement activities from 24th March 2020 and
resumed this work in July 2020. The PAC have maintained throughout the Pandemic consideration of the
difficulties Shippers have experienced in obtaining meter reads, especially through the early part of this period.
The PAC have discussed at recent meetings the expectation that meter read activity should return to normal
levels upon the Government Roadmap coming to fruition and the economy opening up again.
The below charts show the improvements in meter read performance over the past year, taking into account
the difficulties parties have faced this year, the improvements can still be seen in PC1, PC2 and PC3 markets.
Over the past two years the PAC have deployed various techniques to encourage industry engagement. The PAC
have issued various letters to Shippers who are not reaching the UNC targets taking into consideration both a
risk and market model. PAC successfully engaged with parties through requesting improvement plans on
Shipper’s mitigations and journey to UNC target. The PAFA manages these plans and liaises with industry
throughout their plan length to ensure parties are supported in reaching target. This technique has been very
successful and has contributed to the improvements in industry performance that we are now starting to see
through the data. Performance improvement plans have been so successful that PAC tasked the PAFA to engage
in a PC4 Monthly targeting project which has resulted in 48 in-flight improvement plans.
Within the last year we have also seen the successful closing of plans for Shippers who have consistently met
UNC target for more than three consecutive months. PAC have been very encouraged by these gains and are
motivated by the industry’s efforts in improving their performance.
Targeting of PC4 Monthly and PC4 annual began in late 2020 and although numbers are encouraging, the PAC
have yet to fully see the new landscape of these product classes following good industry engagement.
Figures 4.1 and 4.2 demonstrate the distribution of percentage of read performance across product class 1 (PC1)
and product class 2 (PC2) from July 2020 to July 2021, respectively.

17
Figure 4.1: Read Performance for PC1 Market – July 2020 vs July 2021
July 2020 July 2021 Variance
Industry Average 92.8% 82.9% -10.1%
Average performance
for Shippers on
improvement plans
71.8% 97.6% +15.8%
- Industry average has declined over the course of the year, mainly due to two Shippers skewing the
average. PAC are aware who these Shippers are and are aware of the challenges, but read performance
is expected to improve over the next few months as Shippers look to resolve the issues.
- For those Shippers on performance improvement plans, there has been significant improvement in this
area with read performance improving by c. 16% on average. Two of the three Shippers on performance
improvement plans (in July 2020) have now been closed with the Shippers both achieving and
maintaining 100% read performance.
- PAFA will continue to work with the low performing Shippers.
UNC target

18
Figure 4.2: Read Performance for PC2 Market – July 2020 vs July 2021
July 2020 July 2021 Variance
Industry Average 70.7% 71.9% +1.2%
Average performance
for Shippers on
improvement plans
53.6% 67.9% +14.3%
- Industry average in the market has increased by c. +1%. The number of Shippers achieving UNC target
has increased from one Shipper to four Shippers over the course of the year
- There has been a total of four Shippers who have been targeted on PC2 read performance between
July 2020 and July 2021, of which one Shipper has successfully managed to achieve and maintain UNC
target with the performance plan now closed.
- Average performance for the poorly performing Shippers has increased by c. 14%
Increasing feedback has been received by the PAFA from Shippers noting that large scale data cleanse activities
are being carried out to ensure that meters are situated in the correct product class.
Figure 4.3 and 4.4 and 4.5 demonstrate the distribution of percentage of read performance across product class
3 (PC3), product class 4 Monthly (PC4M) and product class 4 Annual (PC4 Annual) from July 2020 to July 2021
and July 2020 to June 2021, respectively.
UNC target

19
Figure 4.3: Read Performance for PC3 Market – July 2020 vs July 2021
July 2020 July 2021 Variance
Industry Average 54.75% 57.75% +3%
Average performance
for Shippers on
improvement plans
39.8% 66.3% +26.5%
- Performance has improved slightly within the market, with the number of Shippers achieving 95%+ has increased.
- Industry average read performance has improved by 3% over the course of the year, primarily driven by increases
in read performance for those Shippers on improvement plans though offset by an increased number of Shippers
achieving less than 10% read performance.
- The PAFA have been working with Shippers in this area with poor read performance and Shippers have been
struggling with systemic issues in getting reads uploaded. Advice for Shippers is to leave a handful of sites for
testing in PC3 until you are successfully able to load reads and then move all applicable sites across to product class
- PAC remain conscious that a number of Shippers are performing below UNC target and will be addressed over the
next term
UNC target

20
Figure 4.4: Read Performance for PC4 Monthly Market – July 2020 vs June 2021
July 2020 July 2021 Variance
Industry Average 45.5% 54.8% +9.3%
Average performance
for Shippers on
improvement plans
33.9% 43.9% +10%
- PAC have issued a number of performance improvement plans in this area over the past year – effects
already beginning to materialise with the average performance in the market improving
Figure 4.5: Read Performance for PC4 Annual Market – July 2020 vs June 2021
- This is not an area that PAC have actively targeted but have been monitoring closely.
- Performance has been declining over the year, with the average percentage of meter readings within
the market declining.
UNC target
UNC target

21
- This is an area PAC are currently monitoring but many Shippers are citing covid restrictions being a
barrier in obtaining meter readings.
- PAC are aware that industry standards are dropping and will address these.

22
5. Industry Engagement/ Future for secure file sharing
Huddle is a platform that has been utilised by the PAFA to securely share reporting on industry performance
with the PAC, CDSP and industry members. Current arrangements allow each Shipper organisation access
licences to the Huddle platform.
This year, PAFA have undertaken a full review of the Shipper access to the Huddle platform, encouraging
Shippers to update their contact details and advising Shippers of the level of information that is available for
Shippers to access.
Despite work on increasing visibility and access to the platform, utilisation still remains lower than expected.
Currently 42 licences have been issued to Shipper organisations, with industry utilisation decreasing over the
past year from 35% to a 33% average.
To identify who has access for your organisation, please contact the PAFA: [email protected].
The graph below illustrates the Huddle utilisation rate across industry members (excluding PAC, CDSP & PAFA).
The Huddle industry (orange bar) figure show the total number of industry users with a login during a given
month whilst the industry users (blue bar) illustrate the number of users who either viewed and/or downloaded
a document from the platform. The utilisation rate (right hand side axis) is the rate which indicates platform
usage.
Figure 5.1: Huddle utilisation rate

23
More work needs to be done to engage the industry in this aspect of the PAC communication work and, although
we are seeing an increase in Shippers enquiring about Huddle, we are not seeing that progress through the
utilisation percentages. The current provisions for Shipper access to data has improved with the DDP and this
gives an individual performance indicator. Reports contained on Huddle give wider industry view averages and
are consolidated into one report. We intend to seek views from the industry through this review on their views
of the current arrangements and what could be done to improve engagement.
In response to industry feedback, all secure file sharing will move to a new Gas Performance Assurance Portal
(GPAP) which is currently being built. This will ensure that previous restrictions on licences will be removed as
an obstacle to access, further analytics can be gained and most importantly, access to data can be more
transparent for industry parties.
The PAFA encourages industry parties who would like access to the new portal to email [email protected]
to express their interest in gaining access, copying in their Contract Manager.

24
6. Risk Register
The PAFA has this year, redesigned the risk register and risk evaluation tool which informs the values included
in the register. The redesign has simplified the way risks are measured and has grouped risks into topics to
enable the PAC to focus on specific areas of industry performance rather than individual risks in isolation. The
redesign of the risk register has been carried out alongside the PAC with PAFA hosting subgroups to ensure the
redesign was dynamic and informed the PAC sufficiently.
As a result, the number of risks recorded on the register has increased from eighteen to thirty, and six topic
groups have been determined. Four risks have been closed and there are four open issues recorded.
The six topic groups are set out below, with an explanation of what is included in these areas;
▪ Meter Reads – This includes those risks that directly affect meter reading activities or areas that are
directly affected by data going into central systems. These include WAR bands, no read ‘line in the sand’
and meter read classes.
▪ Meter Assets – This includes those risks that are concerned with physical meter assets and includes
missing or incorrect asset data.
▪ Data/Volume – This included both Data Corrections and Volume Corrections and includes areas such as
Correction factors and use of the AQ correction process.
▪ Unattributed – This includes those risk areas that have a level of unquantifiable gas attributed to them.
This includes Theft of Gas, LDZ offtake and Shipperless sites. These areas can have high fluctuations and
therefore do not sit in another category.
▪ General – These are used for risks that do not directly affect settlement but do have impacts on the
Performance Assurance regime. These include PARR report review, UNC674 and DDP implementation.
▪ Retrospective – This area looks at all risks which look at retrospective reads.
Risks can be raised by any PAC member and then presented to the rest of the PAC to reach agreement for
inclusion in the register. PAFA and CDSP then work to provide evidence to support the risk and define possible
target measures.

25
A list of the risks on the register is detailed below, with the full risk register being available on Huddle.
PAC Risk no.
Risk Title Category
PACR001 Theft of gas: The consumption recorded at and by the meter does not record the actual consumption at the
premise because of theft of gas at that premise UNATTRIBUTED
PACR002 AQ correction process: The process to correct AQ's is not used correctly or appropriately thereby applying a
bias to the AQ corrections which is not reflective of the AQ corrections needed in any shipper portfolio DATA/VOLUME
PACR003 Use of estimated daily meter reads: For daily metered sites in Product class 1 & 2 due to an actual daily
reading not being loaded on to UK Link METER READS
PACR004 Identified LDZ Offtake measurement errors: The gas measured into the network has been identified as
being incorrect UNATTRIBUTED
PACR005 Incorrect or absent meter asset data: Consumptions are inaccurately derived from the meter billing
attributes provided METER READS
PACR006 Site-specific winter annual ratio (WAR) bands: site specific WAR bands are not available for End User
Category (EUC) 03-08 sites METER READS
PACR007 Undetected LDZ offtake measurement errors: The gas measured into the network is incorrect and remains
undetected UNATTRIBUTED
PACR008 Unregistered Supply points: The supply point is not registered, but is consuming gas UNATTRIBUTED
PACR009 Shipperless Supply points: The supply point exists on the Supply Point Register with no registered Shipper
whilst consuming gas UNATTRIBUTED
PACR010 Meter readings fail validation (product class 3 and 4): Insufficient reads are loading into UK Link eroding the
accuracy of the AQ METER READS
PACR011 Derived meter read drift: The consumption derived from automatic reads is not reflective of the actual
consumption recorded on the meter and this is not identified METER READS
PACR012 Required meter read frequency for product 4 meters: the differing required frequency in meter read
provision between product class 3 and 4 sites METER READS
PACR013 Change of Shipper reads: Estimated change of shipper reads are used and rather than actual reads, creating
inaccurate reconciliation to the shippers involved METER READS
PACR014 CLOSED: Meter readings not provided within the settlement window: Sites do not have any reads loaded in
the settlement window METER READS
PACR015 Retrospective updates: Application of an inconsistent approach by Shippers and the industry to
retrospective updates DATA/VOLUME
PACR016 Correction factors (CF): incorrect use of standard CF above 732,000 kwh DATA/VOLUME
PACR017 Correction factors (CF): Use of standard CF for sites consuming on or below 732,000 kwh DATA/VOLUME
PACR018 Correction factors (CF): incorrect use of non-standard CF below 732,000 kwh DATA/VOLUME
PACR019 Smart meter exchanges: Late meter exchanges involving smart meters GENERAL
PACR020 ISSUE: Issues with UK link post New UK Link implementation METER ASSETS
PACR021 ISSUE: AMR data provision: there is a risk that poor meter read services and data provision will distort
settlement accuracy METER READS

26
PACR022 Use of meter by-pass: Inappropriate use of meter by-pass and/or inaccurate records kept UNATTRIBUTED
PACR023 ISSUE: Post New UK Link implementation reconciliations: delay in finalising 'pot 2' reconciliations DATA/VOLUME
PACR024 CLOSED: Understated Aqs on 177,000 PC3 meters CENTRAL SYSTEMS
PACR025 CLOSED: Impact on performance assurance reporting of change to PC3 settlement process for EUC01 CENTRAL SYSTEMS / METER
READ PERFORMANCE
PACR026 ISSUE: Removal and/or non-replacement of correction equipment: There is a risk that Suppliers (at
customer request) remove onsite correction equipment, relying on standard/non-standard correction factors
DATA/VOLUME
PACR027 CLOSED: COVID-19 - impact on the operation of the PAC ALL
PACR028 COVID-19 - related UNC modifications: A number of urgent UNC modifications have been raised by industry
to an attempt to mitigate the impact of COVID-19 on Shippers GENERAL
PACR029 NDM sites in EUC09, increase AQ above NDM threshold METER READS
PACR030 Delay in between UNC mod implementation and PARR report delivery GENERAL
PAC and PAFA would welcome any feedback on the Risk Register or should any Industry Party wish to highlight
a risk to settlement accuracy for consideration by the PAC, please pass details to either a PAC member or to
[email protected] and PAFA will table for PAC members to discuss.

27
7. UNC Modification proposals – Industry change
Discussions during PAC meetings often identify the need for potential changes to the UNC arrangements. The
PAFA and PAC are unable to raise UNC modifications in their own right, although UNC0674/IGT138, proposes to
change this. Initial proposals for change are discussed at PAC meetings and then adopted by a UNC/IGT UNC
Party as modification sponsor and developed through the modification process.
The PAC, PAFA and CDSP have so far worked collaboratively to facilitate the development of the below UNC
modification proposals which has led to the raising of mods in the IGT UNC to mirror the requirements:
• UNC0674 / IGT138: Performance Assurance Techniques and Controls
o To provide an effective framework for the governance of industry performance that gives
industry participants mutual assurance in the accuracy of settlement volume allocation
o It should be noted that if successful, these modifications will allow the PAC jurisdiction over all
supply points including those on the IGT networks.
o IGT138 will only be implemented if UNC674 is passed for implementation by the Authority.
Currently there is no performance assurance regime in the IGT UNC.
• UNC0664VV / IGT145: Transfer of sites with Low Read Submission Performance from Class 2 and 3
into Class 4
o To create an obligation for Shippers to move sites with low meter read submission
performance from Product Class 2 and 3 into Product Class 4, in the first three months of entry
to the settlement class.
o UNC664VV has been passed for implementation in the UNC, however, to date IGT145 is still
under development.
• UNC0677R: Shipper and Supplier Theft of Gas Reporting Arrangements
o Request to review and identify any discrepancies in Shippers and Suppliers theft of gas
reporting arrangements.
• UNC0734S: Reporting Valid Confirmed Theft of Gas into Central Systems and Reporting Suspected
Theft to Suppliers
o The intent of this Modification is to introduce a new process to help ensure that valid
confirmed theft data (claims), received from Suppliers via the Retail Energy Code (REC), is
appropriately reported into central systems.

28
• UNC0763R: Review of Gas Meter By-Pass Arrangements
o To request a review of the current Uniform Network Code (UNC) Meter By-Pass
arrangements.
The PAC have been and will also continue to pay close attention to the impact of UNC modifications
implemented to provide economic relief and assistance to Consumers and Shippers through the period of the
government’s COVID-19 lockdown and other measures. This will include reviewing their use and, when
appropriate, suggesting that the reversing of these measures is raised in Code. Or corrections as consumption
levels resume or the period of need is deemed to have passed. This includes the UNC modifications UNC0722 –
Allow Users to submit Estimated Meter Reads during the COVID-19 period3 and UNC0723 – Use of the Isolation
Flag to identify sites with abnormal load reduction during COVID-19 period4.
3 https://www.gasgovernance.co.uk/0722 4 https://www.gasgovernance.co.uk/0723

29
Appendix 1: PARR description
Report
ID
Topic Details Split by 12 Months
Rolling
Report
Format
Condition
2B.1 Estimated & Check reads used for Gas Allocation and Consumption Adjustments for Product Classes 1 & 2
Estimated Reads: Checks Class 1 & 2 portfolios for each reporting day and count of MPRNs where a read has been estimated and no actual present on the same day. Only includes instances where an estimate read is still present at D+6 Check Reads: As at the report snapshot day check how many class 1 & 2 MPRNs are present with DRE/AMR. For those MPRNs validate if we have a site visit read <+14 months and no subsequent site visit read.
Class Annual % M-1
2B.2 No meter recorded in the supply point register
Meter serial number should be blank and MPR status should be LI. Dead and extinct are excluded
Class Annual Count M
2B.3 No Meter Recorded in the Supply Point Register and data flows received by Xoserve
Same as above but additional validation to confirm if Data Flows have been received in that month e.g. Asset Updates
Class Annual Count M
2B.4 Shipper Transfer Read Performance
Only covers a Change of Supply Event. Read Reason Code of O (opening read). Read Reason Code of R with a source read of A (if within the submission window)
No split Annual % M-2
2B.5 Read Performance As per the read frequency and latest read received date, validate if we have received the expected read e.g. monthly read site we will check if we have received the read in month. Class and Shipper transfer are excluded. M-2, exclude sites where class changes happened in M-2, Shipper changes
Class Month % M-2
2B.6 Meter Read Validity monitoring
MRE01026: Reading breached the lower Outer tolerance MRE01027: Reading breached the Upper Outer tolerance
Reason codes
Month % M-1
30
MRE01028: Reading breached the lower inner tolerance value and no override flag provided MRE01029: Reading breached the upper inner tolerance value and no override flag provided MRE01030: Override tolerance passed, and override flag provided The total calculation is based on the Number of Rejections for each category / number of reads received by Class type
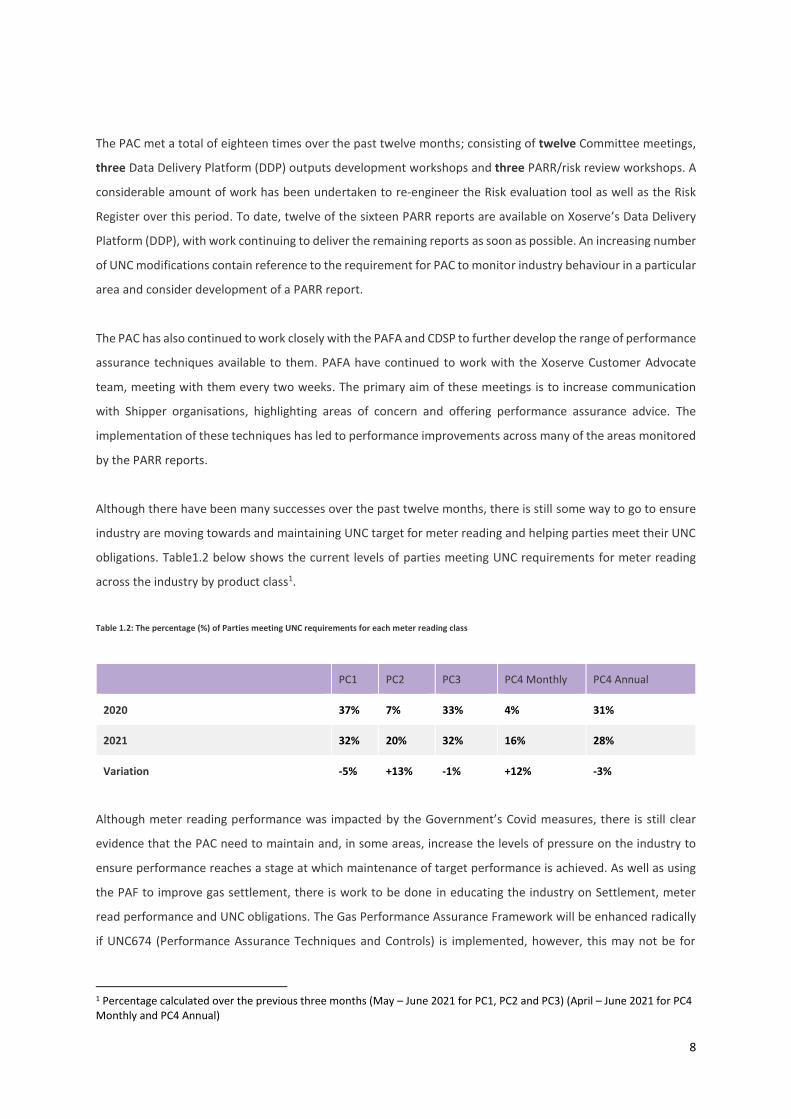
2B.7 No reads received for 1,2,3 or 4 years
For reporting 22.11.2018 No reads received for 1 year – latest read date between 22.11.2016 and 22.11.2017 No reads received for 2 years – Latest read date between 21.11.2015 and 22.11.2016 No reads received for 3 years – Latest read date between 21.11.2014 and 22.11.2015 No reads received more than 4 years – Latest read date less than 22.11.2014. Report currently includes NTS sites in Class 1 which is incorrect
AQ band
Annual % M
2B.8 AQ Corrections AQ correction by reason code: cancellations of AQ corrections in the same month are excluded from the report
AQ band
Annual Count M-1
2B.9 Standard Correction Factors for sites with AQ>732,000mwh
Standard correction factor by AQ band
AQ band
Annual Count M
2B.10 Replaced Meter reads Count of meter points where replacement reads received by AQ band. Only reports class 3 & 4
AQ band
Annual Count M-1
2B.11a AQ Portfolio Calculation Percentage of Shipper's portfolio calculated in Month.
Class Monthly % M-1
2B.11b AQ Portfolio Calculation Increase
Percentage of Shipper's portfolio calculated in Month which has seen AQ increase.
Class Monthly % M-1
2B.11c AQ Portfolio Calculation Decrease
Percentage of Shipper's portfolio calculated in Month which has seen AQ decrease.
Class Monthly % M-1
2B.11d AQ Portfolio Calculation by frequency of 1, 4, 12, 24 or 36+ months
Percentage of Shipper's portfolio calculated in Month by frequency.
Class Annual % M-1
2B.11e AQ Portfolio Calculation 12 month rolling
Percentage of Shipper's portfolio calculated by frequency
Class Annual % M-1

31
2B.11f AQ Portfolio Calculation Increase 12 month rolling
Percentage of Shipper's portfolio calculated which has seen AQ increase.
Class Annual % M-1
2B.11g AQ Portfolio Calculation Decrease 12 month rolling
Percentage of Shipper's portfolio calculated which has seen AQ decrease.
Class Annual % M-1
2B.11h AQ Portfolio Calculation failure by reason code
Count of failure to calculate by Rejection Codes.
AQ banding
Annual Count M-1
2B.14 Sites above the Class 1 threshold which are not in Class 1
The report measures the number of sites meeting or approaching or have reached the criteria for re-confirmation as Class 1 as set out in UNC G2.3.15b. Count of supply points/Total AQ (gWh) of supply points above Class 1 threshold but not in Class 1. Count of supply points/Total AQ (gWh) of supply points above Class 1 threshold but Class 1 criteria not yet met
Class Monthly Count M
2B.15a Class 4 Monthly read submission performance as a percentage portfolio AQ
Class 4 sites with an AQ >=293,000 to submit a meter reading within a 1-month window for 90% of their Shipper AQ Portfolio. The report measures the percentage of monthly read AQ for sites >=293,000.
Class Annual % M-1
2B.15b Class 4 Monthly read submission performance as a percentage portfolio AQ
Class 4 sites with an AQ <293,000 and no SMART/AMR present need to submit a meter reading within a 1-month window for 90% of their Shipper AQ Portfolio. The report measures the percentage of monthly read AQ for sites <293,000 with SMART/AMR.
Class Annual % M-1
2B.15c Class 4 Annual read submission performance as a percentage portfolio AQ
The report measures the percentage of annually read AQ for sites <293,000 with no SMART/AMR. Class 4 sites with an AQ <293,000 and no SMART/AMR present need to submit a meter reading within a 12-month window for 90% of their Shipper AQ Portfolio.
Class Annual % M-1

32
Appendix 2: Performance Improvement Process
Regular monitoring
• PARR reporting is used to monitor Shipper performance.
• Monitoring is likely to be an area of constant evolution as drivers of settlement risks are identified by
PAC and shipper action improves performance with the resultant impact on settlement risk.
Targeted Monitoring
• Detailed analysis of the PARR reports identifies those Shippers that are consistently not performing as
expected.
• Shippers are closely monitored for 3 months, working with the Xoserve CAMs to identify any issues
before any performance improvement recommendations are made to the PAC.
Performance Observation/ Data cleanliness letter
• Following identification of sub-optimal performance in a particular PARR report, communication is sent
to all Shippers operating within that area.
• Communications advise that PAC are paying particular attention to this report and that performance
improvement is required.
• No formal response from Shippers is required.
• Failure to improve performance within 3 months of receipt of this communication could lead to
escalation through a ‘Performance Improvement Request’.

33
Performance Improvement Request letters
A suite of Shipper communications has been designed to encourage performance improvement.
Performance Improvement Request (letter):
• Using PARR data and market intelligence, PAFA identify those Shippers who have demonstrated 3
months of sub-optimal performance.
• PAC approve issuing of a ‘Performance Improvement Request’.
• Shippers are required to both acknowledge receipt of this letter and provide details of an improvement
plan.
• Failure to respond or provide adequate details of their improvement plan could lead to escalation.
Urgent Performance Management Request (letter):
• PAFA identify Shippers whose performance is of significant concern to the PAC, using PARR data, market
intelligence and Xoserve CAM input.
• PAC approve issue of an ‘Urgent Performance Management’ request.
• Shippers are required to respond with details of Performance Improvement Plans in expedited
timescales.
• Failure to provide or an inadequate response could lead to escalation.
PAFA Meeting
Alongside written communication, a face-to-face meeting may also be arranged. PAC can request PAFA to meet
with Shippers to discuss performance in more detail and/or explore the measures proposed in their performance
improvement plan. PAFA also work alongside the Xoserve Customer Advocate teams (CAMs) to increase
communication with Shippers.
This combination of written communication and face-to-face meetings has proved successful to date, and we
are currently seeing performance improvements in all areas that have been targeted.
PAC Call in
PAC can request senior representatives within a Shipper organisation attend a meeting with the PAC to answer
questions around their Company’s performance and plans to improve.
Presentation of case to Ofgem
Failure to improve performance to a level that is either in line with the requirements of the UNC or aligned with
the rest of the industry, can lead to Shippers’ names, details of relevant PAC and PAFA contacts and performance
data being passed to Ofgem as an evidence pack. This technique has not been applied this year.
34
Appendix 3: Annual performance graphs
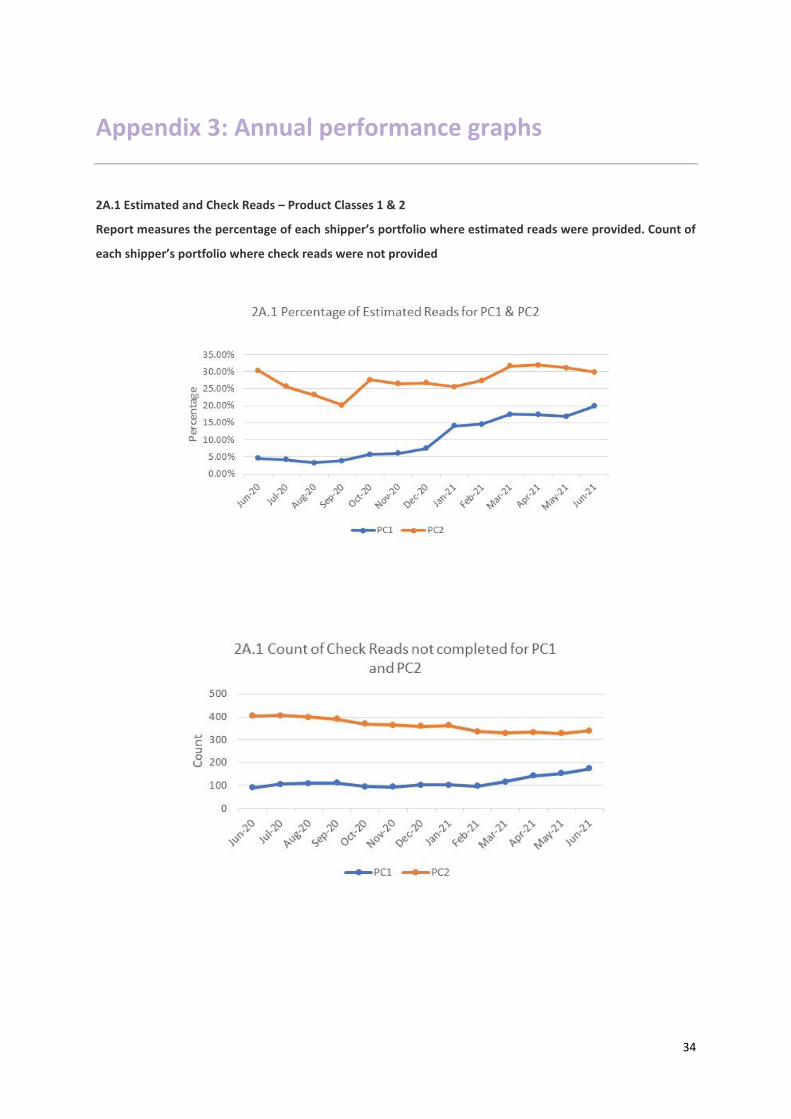
2A.1 Estimated and Check Reads – Product Classes 1 & 2
Report measures the percentage of each shipper’s portfolio where estimated reads were provided. Count of
each shipper’s portfolio where check reads were not provided

35
2A.2 No Meter Recorded
Report measures the percentage of each shipper’s portfolio where no meter recorded in the supply point
register
2A.3 No Meter Recorded and Data Flows Received
Report measures the percentage of each shipper’s portfolio where no meter recorded in the supply point
register and data flows received

36
2A.4 Shipper Transfer Performance
Report measures the percentage of Shipper portfolio of opening meters reads provided following
confirmation
2A.5 Read Performance
Report measures the average percentage of Shipper portfolio submitting reads in June 2021
PC4 Monthly and Annually read measures the percentage of Shipper portfolio submitting reads in May 2021

37
2A.6 Meter Read Validity Monitoring
Report measures the percentage of Shipper portfolio where reads submitted failed validation
2A.7 No Reads Received for 1,2,3,4 years (PC1 EUC07)
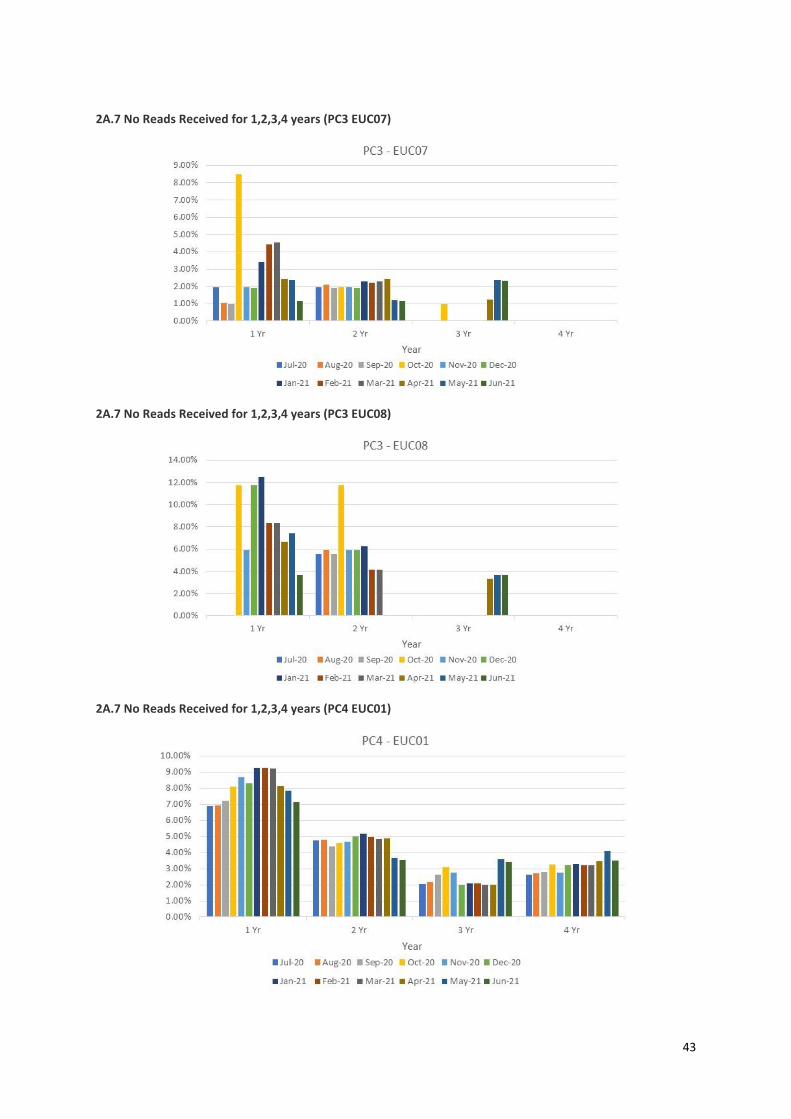
Report measures the percentage of Shipper portfolio in the specified AQ band without a meter reading for
the specified period
EUC01 – EUC06, EUC08 have no meters which have not been unread for a period less than one year in recent
months

38
2A.7 No Reads Received for 1,2,3,4 years (PC1 EUC09)
2A.7 No Reads Received for 1,2,3,4 years (PC2 EUC01)

39
2A.7 No Reads Received for 1,2,3,4 years (PC2 EUC03)
2A.7 No Reads Received for 1,2,3,4 years (PC2 EUC04)
2A.7 No Reads Received for 1,2,3,4 years (PC2 EUC05)

40
2A.7 No Reads Received for 1,2,3,4 years (PC2 EUC06)
2A.7 No Reads Received for 1,2,3,4 years (PC2 EUC07)
2A.7 No Reads Received for 1,2,3,4 years (PC2 EUC08)

41
2A.7 No Reads Received for 1,2,3,4 years (PC3 EUC01)
2A.7 No Reads Received for 1,2,3,4 years (PC3 EUC02)
2A.7 No Reads Received for 1,2,3,4 years (PC3 EUC03)

42
2A.7 No Reads Received for 1,2,3,4 years (PC3 EUC04)
2A.7 No Reads Received for 1,2,3,4 years (PC3 EUC05)
2A.7 No Reads Received for 1,2,3,4 years (PC3 EUC06)
43
2A.7 No Reads Received for 1,2,3,4 years (PC3 EUC07)
2A.7 No Reads Received for 1,2,3,4 years (PC3 EUC08)
2A.7 No Reads Received for 1,2,3,4 years (PC4 EUC01)

44
2A.7 No Reads Received for 1,2,3,4 years (PC4 EUC02)
2A.7 No Reads Received for 1,2,3,4 years (PC4 EUC03)
2A.7 No Reads Received for 1,2,3,4 years (PC4 EUC04)

45
2A.7 No Reads Received for 1,2,3,4 years (PC4 EUC05)
2A.7 No Reads Received for 1,2,3,4 years (PC4 EUC06)
2A.7 No Reads Received for 1,2,3,4 years (PC4 EUC07)

46
2A.7 No Reads Received for 1,2,3,4 years (PC4 EUC08)
2A.7 No Reads Received for 1,2,3,4 years (PC4 EUC09)

47
2A.8 AQ Correction by Reason Code
Report measures the count of Shipper Portfolio of MPRNs where AQ Correction process used
2A.9 Standard CF >732,000 kWh
Report measures the count of sites with an AQ>732,000 kWh, but having a standard correct factor

48
2A.10 Replaced Meter Reads
Report measures the count of meter reading replacements which results in reconciliation adjustments

49
To find out more please contact:
Rachel Clarke
T: 020 7091 1527
W: www.gemserv.com
London Office:
8 Fenchurch Place
London
EC3M 4AJ
Company Reg. No: 4419878