Embed Size (px)
Citation preview
IJSRD - International Journal for Scientific Research & Development| Vol. 5, Issue 05, 2017 | ISSN (online): 2321-0613
All rights reserved by www.ijsrd.com 55
Performance Based Analysis of RC Moment Resisting Frame Siddharth N. Joshi1 Dr. H. R. Magarpatil2
1PG Student 2Professor 1,2Department of Applied Mechanics
1,2Maharashtra Institute of Technology, Pune, Maharashtra, India
Abstract— The objective of performance based seismic
design (PBSD) is to design structures so that they have
predictable seismic behavior. Performance-based analysis
evaluates how the building will perform in given potential
hazard. In performance-based design, it is an important part
of the design procedure to identify and assess performance
capability of building and guide the many decisions that must
be made. In this paper pushover analysis of multi-storey
(G+5), (G+8), (G+11) RCC building has been done. Pushover
analysis is a modern and excellent tool for performance-based
analysis due to its accurate seismic assessment of the
structure. The pushover analysis is performed using SAP2000
software. The results obtained after performing pushover
analysis are compared in terms of parameters like base shear,
storey displacements, spectral acceleration, time period and
spectral displacement. From analysis results obtained, it is
seen that base shear and spectral acceleration decreases,
whereas displacement, spectral displacement is increased
with the increase in number of storey. The seismic response
of RC building frame in terms of performance point and the
effect of earthquake forces on multi story building frame with
the help of pushover analysis is carried out in this paper.
Key words: Nonlinear Static Analysis, Performance Based
Design, Performance Point, Plastic Hinge, Pushover
Analysis, SAP2000
I. INTRODUCTION
Earthquakes causes severe damage to property and life. There
is need of up-to-date engineering tools for accurately
analyzing the structure subjected to Earthquake forces. PBSD
is a modern design methodology to determine the likely
performance of the structure under input ground motions. The
basic concept of PBSD is to design structures with predictable
seismic performance. Performance-based seismic design
objective is to effectively reduce the damage caused due to
Earthquakes on the structure and ensure the safety and
stability of the structure. Pushover analysis can be used as
reliable and effective tool for analyzing the structure
performance and check the performance objective of the
structure. In order to carry out performance-based analysis
effectively and accurately, one should be aware of the
difficulties involved in both seismic hazard estimates and
structural performance. A vital requirement of performance-
based analysis is the ability to correctly estimate seismic
demand and capacities with a reasonable degree of accuracy.
Capacity: Deformation and strength capacity of
individual components are vital properties as structure
Strength and capacity depends on it. Capacity denotes
the ability of the structure to resist damage. Capacities
beyond the linear elastic limit of material can be
determined by using nonlinear type of analysis like
pushover analysis.
Demand: An earthquake causes Ground motion which
produces horizontal displacement in the structures. For a
given structure and ground motion, the displacement
demand is an estimate of the maximum expected
response of the building during the ground motion. Once,
a demand displacement and capacity curve are defined, a
Structure performance check can be done.
Performance: It is a point where structure capacity curve
and demand spectrum intersect. The performance of a
building is depended upon the performance of the
structural and the nonstructural components. The
Structure performance is check at various performance
level after obtaining the performance point.
Immediate occupancy: It is a damage state after
occurrence of the Earthquake in which structure has
sustain some very minor damage. There is no substantial
reduction in lateral and gravity load resistance. In this
performance level, there is some local yielding of
structural element and limited damage to connection.
There are very low odds of fatal injury due to structural
failure. Significant Nonstructural damage may occur but
it does not cause any harm to life.
Life safety: It is a state in which structure sustain damage
to the load carrying members but there is some margin of
safety against partial or total collapse. Injuries may occur
during the earthquake, but the danger of fatal injury from
structural damage is very low. There may be significant
damage to Non-Structural Elements of the building.
Collapse prevention: In this state, the building has
sustained extreme damage with permanent deformation
and drifts, high degradation in strength and stiffness of
the lateral force resisting system and degradation of the
gravity load carrying system. In this performance level
structure is on verge of collapsing either locally or
globally. The structure may have residual strength and
stiffness with wide damages occurred to nonstructural
element.
Fig. 1: Force vs Deformation
Point A represents unloaded condition and is always the
origin.
Point B indicates the yielding of the Structural element.
Point C denotes the ultimate capacity of the structure
Point D represents a residual strength of structure.
Point E represents total failure
II. PUSHOVER ANALYSIS
In Pushover analysis, a static horizontal force distribution
proportional to the seismic design forces calculated from the
Performance Based Analysis of RC Moment Resisting Frame
(IJSRD/Vol. 5/Issue 05/2017/014)
All rights reserved by www.ijsrd.com 56
respective codes, is applied on the structure. The distributed
force pattern is then increased in small steps and the analysis
is done at each step for the structure. As the loading increases
the building undergoes yielding at a few locations. The
structural properties are modified suitably to reflect the
yielding at every instant such yielding takes place. The
analysis is continued till the building reaches certain level of
lateral displacement or structure collapses. The formation of
plastic hinge, the sequence of cracking and failure of the
structural elements during the pushover procedure is
observed. The relation is plotted between base shear and
controlled displacement for the pushover analysis carried.
Graph of base shear to controlled node displacement curve is
termed as pushover curve or capacity curve
A. Pushover Analysis Procedure
The ATC 40 [1] have specified detailed procedure on how to
perform a pushover Analysis. The following steps are given
by the ATC 40.
Make the analytical model of the nonlinear structure.
Set the limiting performance condition, like storey drift
at selected floor levels, plastic hinge rotation limit at
specific selected plastic hinge locations, etc.
Analyze the internal forces develop in the structure after
applying the gravity load.
Apply the defined lateral force distribution on the
structure incrementally.
Set a control target displacement.
Gradually apply the lateral load and increase it
iteratively.
Draw the “Base Shear vs. Controlled Displacement”
curve. This curve is called “pushover curve”.
Build Acceleration-Displacement Response-Spectra
(ADRS) curvet from the pushover curve.
Obtain the equivalent damping based on the expected
performance level.
Get the design Response Spectra for different levels of
damping and adjust the spectra for the nonlinearity based
on the damping in the Capacity Spectrum.
Plot the capacity curve and Demand curve together.
The intersection of the capacity curve and the demand
curve is the performance point.
III. STRUCTURE MODELLING
In present study FEM based software SAP2000 has been used
to model RC ductile frames to carry out pushover analysis for
Seismic Performance Design of Building. Frame is designed
optimally as per guidelines of I.S 456:2000, I.S:1893:2000
(Part 1), I.S 875:1987 and I.S 13920:1993. The building
frame considered is 4*4 bay with floor height 3.5 m and bay
width 5 m situated in seismic zone V in India on the medium
soil type.
A three-dimensional structural model has been built
to carry out the pushover analysis. Beams and columns are
modeled as frame elements with plastic hinge at the start and
the end of each element. The default M3 hinges provided by
SAP2000 were assigned for beams and P-M2-M3 hinges
were assigned for column. Structure general information &
preliminary design consideration are tabulated in Table 1.
Shown below.
Sr.
No. Contents Description
1 Type of
Structure
Multi Storied RC Rigid Jointed
Plane Frame (SMRF).
2 Number of
Storey G+5, G+8.G+11
4 Materials Concrete(M25)
Steel Reinforcement(Fe415)
8 Specific Weight
of RCC 25 KN/m3
9 Specific weight
of infill 19 KN/m3(230 mm width)
10 Type of soil Medium Soil
11 Impose load 2 KN/m2
12 Importance
Factor I
13 Seismic Zone V
14 Zone Factor 0.36
15
Response
Reduction
Factor
5
Table 1: General description and parameters of the
structures
No. of stories G+5 G+8 G+11
Beam
230*350
mm
250*450
mm
230*350
mm
250*450
mm
230*350 mm
250*450 mm
Column
300*350
mm
300*400
mm
300*500
mm
350*400
mm
350*500
mm
350*750
mm
350*450 mm
350*650 mm
350*800 mm
350*1000mm
Slab thickness 150 mm 150 mm 150 mm
Height of
each floor 3.5 m 3.5 m 3.5 m
Height of
structure 21 m 31.5 m 42 m
Table 2: Dimension values of Structure
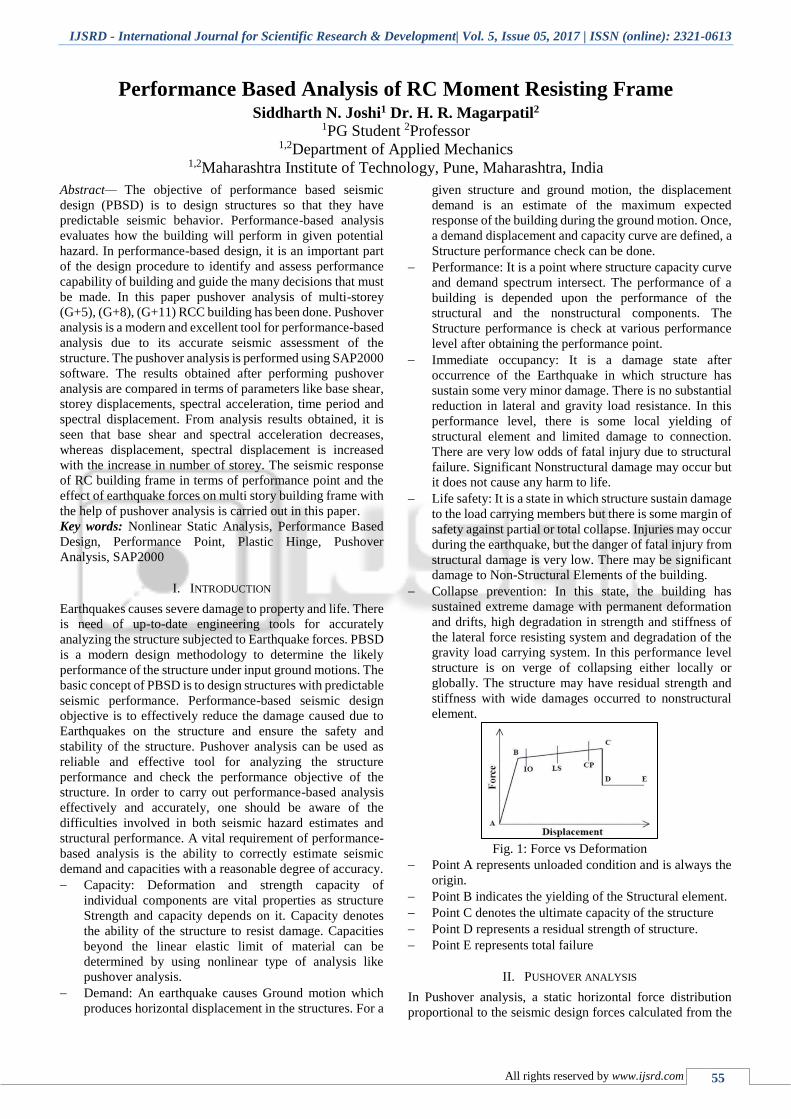
Fig. 2: Plan
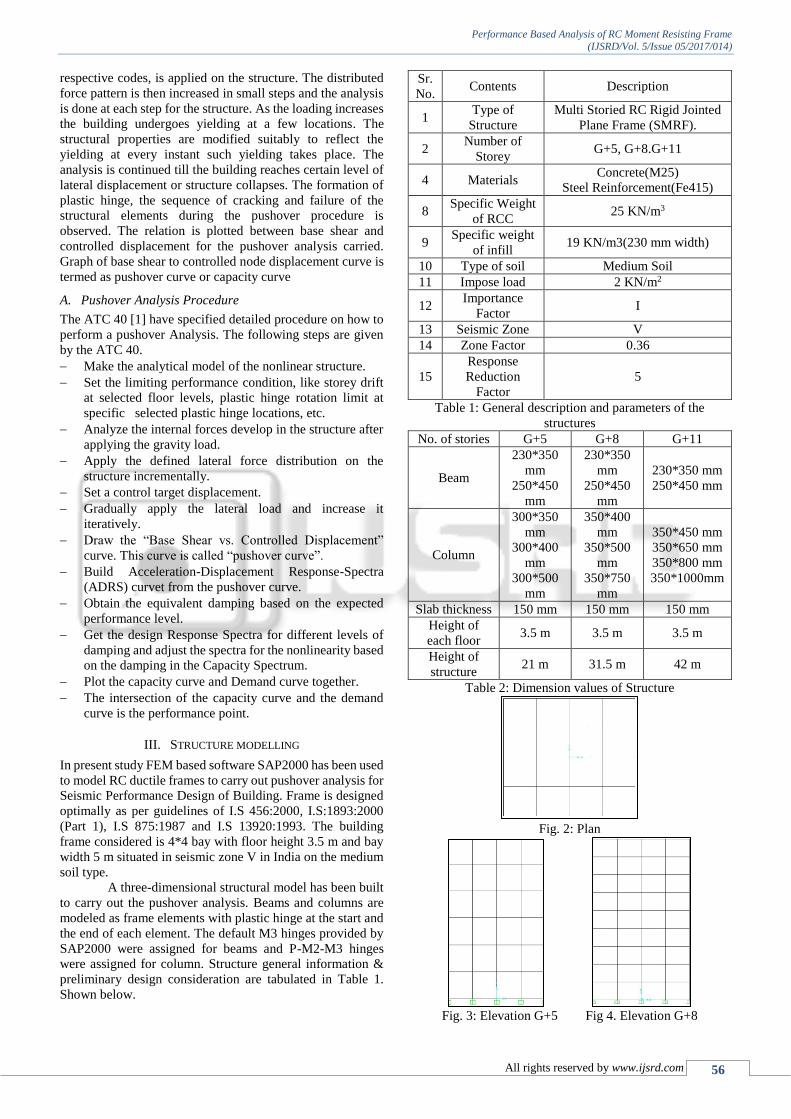
Fig. 3: Elevation G+5 Fig 4. Elevation G+8
Performance Based Analysis of RC Moment Resisting Frame
(IJSRD/Vol. 5/Issue 05/2017/014)
All rights reserved by www.ijsrd.com 57
Fig. 5: Elevation G+11
IV. RESULTS AND DISCUSSION
A. Pushover Curve
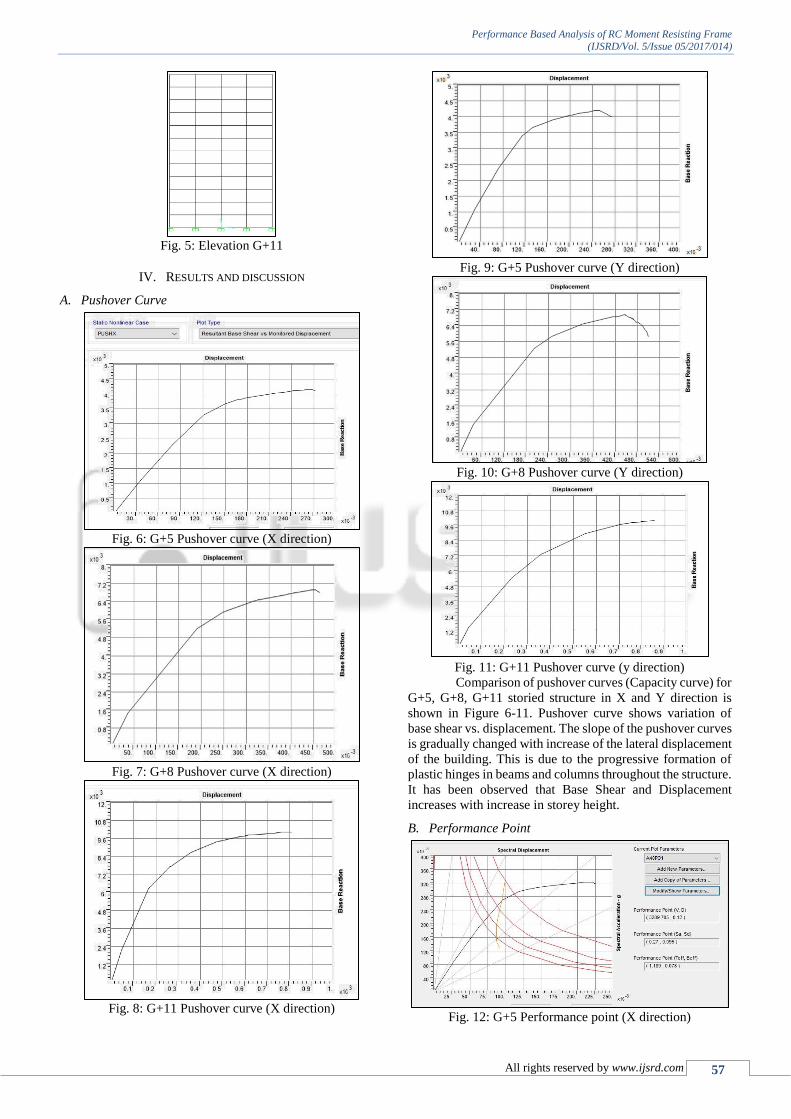
Fig. 6: G+5 Pushover curve (X direction)
Fig. 7: G+8 Pushover curve (X direction)
Fig. 8: G+11 Pushover curve (X direction)
Fig. 9: G+5 Pushover curve (Y direction)
Fig. 10: G+8 Pushover curve (Y direction)
Fig. 11: G+11 Pushover curve (y direction)
Comparison of pushover curves (Capacity curve) for
G+5, G+8, G+11 storied structure in X and Y direction is
shown in Figure 6-11. Pushover curve shows variation of
base shear vs. displacement. The slope of the pushover curves
is gradually changed with increase of the lateral displacement
of the building. This is due to the progressive formation of
plastic hinges in beams and columns throughout the structure.
It has been observed that Base Shear and Displacement
increases with increase in storey height.
B. Performance Point
Fig. 12: G+5 Performance point (X direction)
Performance Based Analysis of RC Moment Resisting Frame
(IJSRD/Vol. 5/Issue 05/2017/014)
All rights reserved by www.ijsrd.com 58
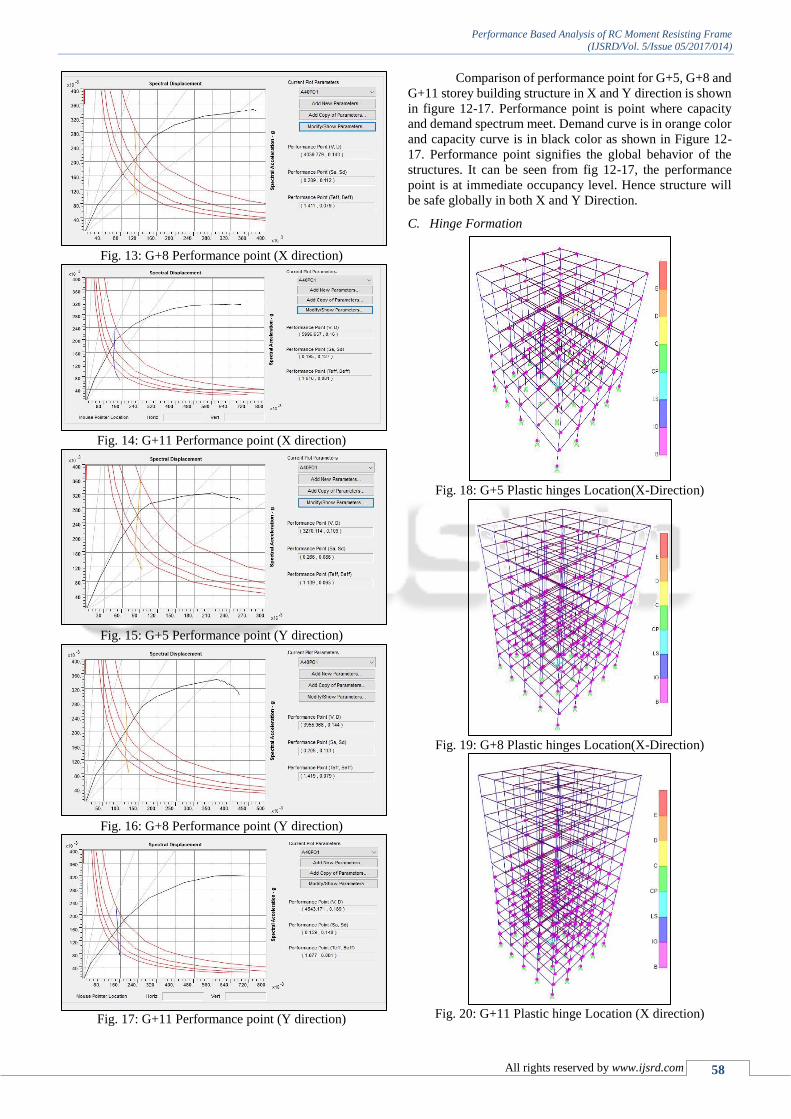
Fig. 13: G+8 Performance point (X direction)
Fig. 14: G+11 Performance point (X direction)
Fig. 15: G+5 Performance point (Y direction)
Fig. 16: G+8 Performance point (Y direction)
Fig. 17: G+11 Performance point (Y direction)
Comparison of performance point for G+5, G+8 and
G+11 storey building structure in X and Y direction is shown
in figure 12-17. Performance point is point where capacity
and demand spectrum meet. Demand curve is in orange color
and capacity curve is in black color as shown in Figure 12-
17. Performance point signifies the global behavior of the
structures. It can be seen from fig 12-17, the performance
point is at immediate occupancy level. Hence structure will
be safe globally in both X and Y Direction.
C. Hinge Formation
Fig. 18: G+5 Plastic hinges Location(X-Direction)
Fig. 19: G+8 Plastic hinges Location(X-Direction)
Fig. 20: G+11 Plastic hinge Location (X direction)
Performance Based Analysis of RC Moment Resisting Frame
(IJSRD/Vol. 5/Issue 05/2017/014)
All rights reserved by www.ijsrd.com 59
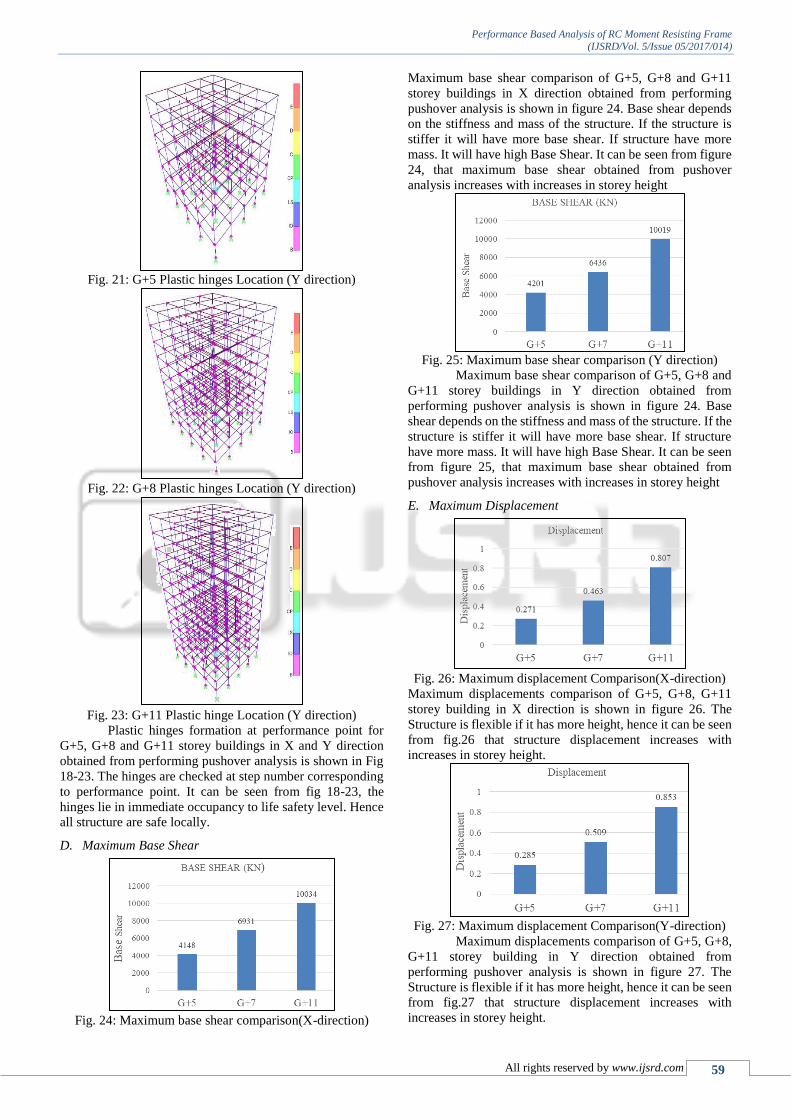
Fig. 21: G+5 Plastic hinges Location (Y direction)
Fig. 22: G+8 Plastic hinges Location (Y direction)
Fig. 23: G+11 Plastic hinge Location (Y direction)
Plastic hinges formation at performance point for
G+5, G+8 and G+11 storey buildings in X and Y direction
obtained from performing pushover analysis is shown in Fig
18-23. The hinges are checked at step number corresponding
to performance point. It can be seen from fig 18-23, the
hinges lie in immediate occupancy to life safety level. Hence
all structure are safe locally.
D. Maximum Base Shear
Fig. 24: Maximum base shear comparison(X-direction)
Maximum base shear comparison of G+5, G+8 and G+11
storey buildings in X direction obtained from performing
pushover analysis is shown in figure 24. Base shear depends
on the stiffness and mass of the structure. If the structure is
stiffer it will have more base shear. If structure have more
mass. It will have high Base Shear. It can be seen from figure
24, that maximum base shear obtained from pushover
analysis increases with increases in storey height
Fig. 25: Maximum base shear comparison (Y direction)
Maximum base shear comparison of G+5, G+8 and
G+11 storey buildings in Y direction obtained from
performing pushover analysis is shown in figure 24. Base
shear depends on the stiffness and mass of the structure. If the
structure is stiffer it will have more base shear. If structure
have more mass. It will have high Base Shear. It can be seen
from figure 25, that maximum base shear obtained from
pushover analysis increases with increases in storey height
E. Maximum Displacement
Fig. 26: Maximum displacement Comparison(X-direction)
Maximum displacements comparison of G+5, G+8, G+11
storey building in X direction is shown in figure 26. The
Structure is flexible if it has more height, hence it can be seen
from fig.26 that structure displacement increases with
increases in storey height.
Fig. 27: Maximum displacement Comparison(Y-direction)
Maximum displacements comparison of G+5, G+8,
G+11 storey building in Y direction obtained from
performing pushover analysis is shown in figure 27. The
Structure is flexible if it has more height, hence it can be seen
from fig.27 that structure displacement increases with
increases in storey height.
Performance Based Analysis of RC Moment Resisting Frame
(IJSRD/Vol. 5/Issue 05/2017/014)
All rights reserved by www.ijsrd.com 60
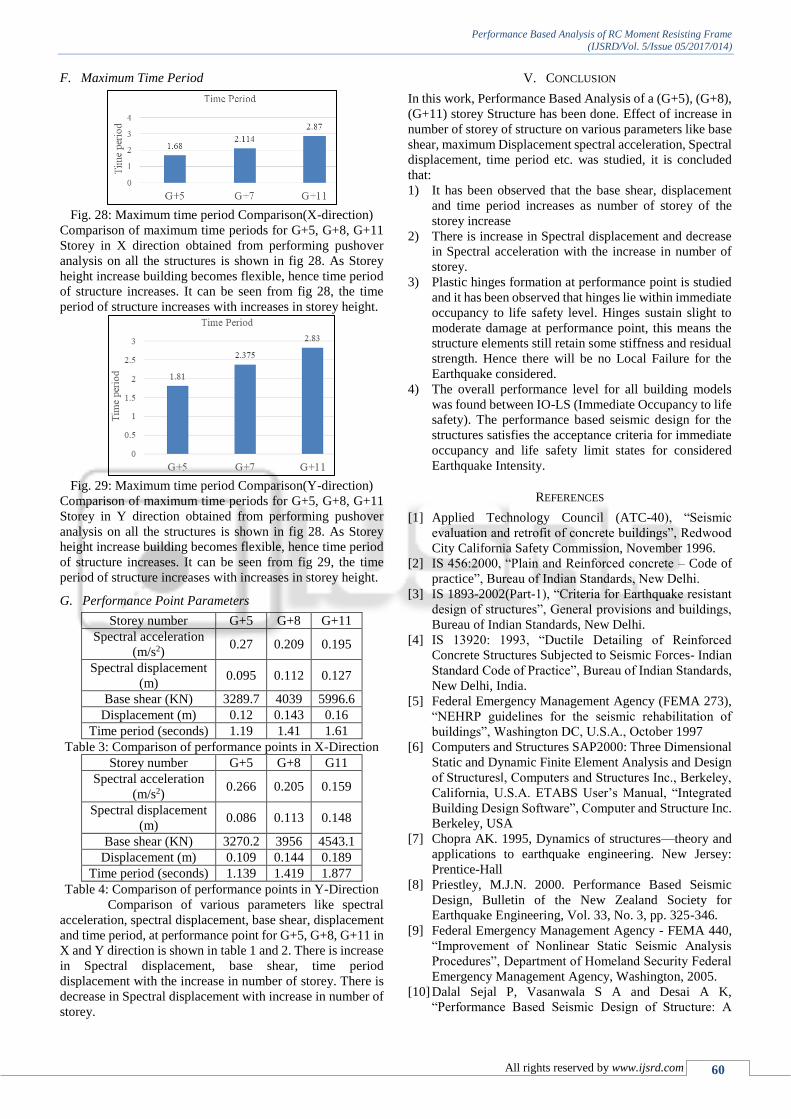
F. Maximum Time Period
Fig. 28: Maximum time period Comparison(X-direction)
Comparison of maximum time periods for G+5, G+8, G+11
Storey in X direction obtained from performing pushover
analysis on all the structures is shown in fig 28. As Storey
height increase building becomes flexible, hence time period
of structure increases. It can be seen from fig 28, the time
period of structure increases with increases in storey height.
Fig. 29: Maximum time period Comparison(Y-direction)
Comparison of maximum time periods for G+5, G+8, G+11
Storey in Y direction obtained from performing pushover
analysis on all the structures is shown in fig 28. As Storey
height increase building becomes flexible, hence time period
of structure increases. It can be seen from fig 29, the time
period of structure increases with increases in storey height.
G. Performance Point Parameters
Storey number G+5 G+8 G+11
Spectral acceleration
(m/s2) 0.27 0.209 0.195
Spectral displacement
(m) 0.095 0.112 0.127
Base shear (KN) 3289.7 4039 5996.6
Displacement (m) 0.12 0.143 0.16
Time period (seconds) 1.19 1.41 1.61
Table 3: Comparison of performance points in X-Direction
Storey number G+5 G+8 G11
Spectral acceleration
(m/s2) 0.266 0.205 0.159
Spectral displacement
(m) 0.086 0.113 0.148
Base shear (KN) 3270.2 3956 4543.1
Displacement (m) 0.109 0.144 0.189
Time period (seconds) 1.139 1.419 1.877
Table 4: Comparison of performance points in Y-Direction
Comparison of various parameters like spectral
acceleration, spectral displacement, base shear, displacement
and time period, at performance point for G+5, G+8, G+11 in
X and Y direction is shown in table 1 and 2. There is increase
in Spectral displacement, base shear, time period
displacement with the increase in number of storey. There is
decrease in Spectral displacement with increase in number of
storey.
V. CONCLUSION
In this work, Performance Based Analysis of a (G+5), (G+8),
(G+11) storey Structure has been done. Effect of increase in
number of storey of structure on various parameters like base
shear, maximum Displacement spectral acceleration, Spectral
displacement, time period etc. was studied, it is concluded
that:
1) It has been observed that the base shear, displacement
and time period increases as number of storey of the
storey increase
2) There is increase in Spectral displacement and decrease
in Spectral acceleration with the increase in number of
storey.
3) Plastic hinges formation at performance point is studied
and it has been observed that hinges lie within immediate
occupancy to life safety level. Hinges sustain slight to
moderate damage at performance point, this means the
structure elements still retain some stiffness and residual
strength. Hence there will be no Local Failure for the
Earthquake considered.
4) The overall performance level for all building models
was found between IO-LS (Immediate Occupancy to life
safety). The performance based seismic design for the
structures satisfies the acceptance criteria for immediate
occupancy and life safety limit states for considered
Earthquake Intensity.
REFERENCES
[1] Applied Technology Council (ATC-40), “Seismic
evaluation and retrofit of concrete buildings”, Redwood
City California Safety Commission, November 1996.
[2] IS 456:2000, “Plain and Reinforced concrete – Code of
practice”, Bureau of Indian Standards, New Delhi.
[3] IS 1893-2002(Part-1), “Criteria for Earthquake resistant
design of structures”, General provisions and buildings,
Bureau of Indian Standards, New Delhi.
[4] IS 13920: 1993, “Ductile Detailing of Reinforced
Concrete Structures Subjected to Seismic Forces- Indian
Standard Code of Practice”, Bureau of Indian Standards,
New Delhi, India.
[5] Federal Emergency Management Agency (FEMA 273),
“NEHRP guidelines for the seismic rehabilitation of
buildings”, Washington DC, U.S.A., October 1997
[6] Computers and Structures SAP2000: Three Dimensional
Static and Dynamic Finite Element Analysis and Design
of Structures‖, Computers and Structures Inc., Berkeley,
California, U.S.A. ETABS User’s Manual, “Integrated
Building Design Software”, Computer and Structure Inc.
Berkeley, USA
[7] Chopra AK. 1995, Dynamics of structures––theory and
applications to earthquake engineering. New Jersey:
Prentice-Hall
[8] Priestley, M.J.N. 2000. Performance Based Seismic
Design, Bulletin of the New Zealand Society for
Earthquake Engineering, Vol. 33, No. 3, pp. 325-346.
[9] Federal Emergency Management Agency - FEMA 440,
“Improvement of Nonlinear Static Seismic Analysis
Procedures”, Department of Homeland Security Federal
Emergency Management Agency, Washington, 2005.
[10] Dalal Sejal P, Vasanwala S A and Desai A K,
“Performance Based Seismic Design of Structure: A

Performance Based Analysis of RC Moment Resisting Frame
(IJSRD/Vol. 5/Issue 05/2017/014)
All rights reserved by www.ijsrd.com 61
review”, International Journal of Civil and Structural
Engineering, vol. 1, no. 4, pp 795-803, year 2011.