Embed Size (px)
Citation preview
Performance Based Design of DeepPerformance-Based Design of Deep Foundations within the LRFD Framework
Lance A. Roberts, Ph.D., P.E.A i t t P fAssistant ProfessorSouth Dakota School of Mines and TechnologyRapid City South DakotaRapid City, South Dakota
Presented at:
Committee Meeting AFS30Foundations of Bridges and Other StructuresTransportation Research Board 88th Annual Meetingp gJanuary 12, 2009
Deep Foundation Designp gCurrent Design Approach• Numerous methods exist to compute the ultimate axial capacity
for static capacity techniques or from load test data Whichfor static capacity techniques or from load test data. Whichcapacity is correct?
• The ultimate axial capacity of a deep foundation is often achievedat a deformation that is greater than the deformation that aat a deformation that is greater than the deformation that astructure can tolerate.
Performance-Based Design ApproachPerformance Based Design Approach• A performance-based design approach for axial design of deep
foundations utilizes criteria based on tolerable deformations asopposed to traditional force-based requirements.
• A design approach that is deformation based must utilize a modelthat can predict the load-deformation behavior of a deepfoundation while ensuring strain compatibility between the variousg p yresisting components (i.e. side and tip resistance).

The “t-z” Model Method
• Load transfer along the soil-structure interface and tip isrepresented by a spring-slider system.p y p g y
• This is the so-called “t-z” method of load-displacement analysis.
Springp g
Slider
Spring
Slider

The “t-z” Model Method
For the soil-structure interface, the following parameters are used:
K = Shear modulus of sub-grade reaction (stiffness parameter)τu = Ultimate shear strength (strength parameter)
For the tip soil, the following parameters are used:
K S b d ti ( tiff t )Kt = Sub-grade reaction (stiffness parameter)qt = Tip point bearing capacity (strength parameter)
Model Parameter Determination
•Subsurface exploration and laboratory test dataSubsurface exploration and laboratory test data•Back-calculations from field load test data

00 500 1000 1500 2000 2500 3000 3500 4000
Load (kN)
5
10
15
20m)
20
25
30
35
40
u (m
m TestModel Head-settlement data
40
45
00 500 1000 1500 2000 2500 3000 3500
Load in Pile (kN)
5
10
h (m
)
3000 kN2225 kN1110 kN3000 kN2225 kN1110 kN
Strain gauge data
15
20
Dep
th
Note: Points are based on strain readings obtained from load test and solid lines are strain (loads) predicted from the "t-z" model.
250 500 1000 1500 2000 2500 3000 3500
Back-analysis of ACIP pile load test using “t-z” model approach.

0 1000 2000 3000 4000 5000
Load (kN)
0.0
10.0Nominal Load-Settlement Curve
20.0
30.0
u (m
m)
40.0
50.0
Variability in model parameters
• The strength and stiffness of the side and tip springs are assumedto be random variables defined by a mean and standard
60.0
to be random variables, defined by a mean and standarddeviation, and are assumed to follow a probability distributionfunction.
• A Latin Hypercube approach is used to randomly select values for• A Latin Hypercube approach is used to randomly select values forthe strength and stiffness of the springs. These values aresubstituted into the “t-z” model.

Performance-Based Design
00 1000 2000 3000 4000 5000
Load (kN)
10ea
bilit
y@
100
0 kN
20
30
u (m
m) Se
rvic
eSe
ttlem
ent
40
50
u
Limiting Tolerable Settlement = 40 mm
A l th d l t d l d ttl t t
50
60
Analyze the randomly generated load-settlement curves at a limiting tolerable settlement and a serviceability settlement.

Performance-Based Design Criteria
• Corresponds to the limiting permissible settlement for thef d ti l t d th f t d l d
Limiting Tolerable Settlement
foundation element under the factored load.• Settlement where the stresses within a structure become greater
than allowable or where the settlement causes the structure tobecome inoperablebecome inoperable.
• This defines the Strength Limit State design requirements.
S i bilit S ttl t
• Corresponds to the desirable settlement for the foundationelement under the working load.
Serviceability Settlement
g• Settlement where serviceability issues may become an aesthetic
problem.• This defines the Service Limit State design requirements.g q
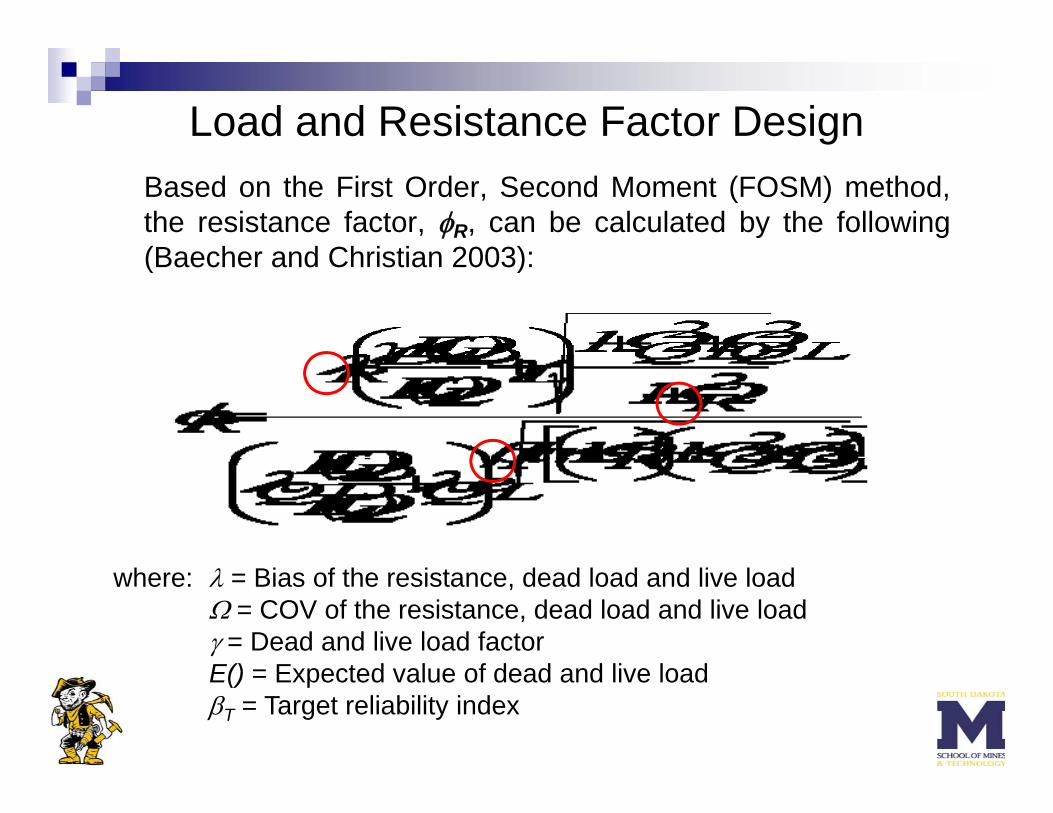
Load and Resistance Factor DesignBased on the First Order, Second Moment (FOSM) method,the resistance factor, φR, can be calculated by the following(Baecher and Christian 2003):(Baecher and Christian 2003):
where: λ = Bias of the resistance, dead load and live loadΩ = COV of the resistance, dead load and live loadγ = Dead and live load factor
() fE() = Expected value of dead and live loadβT = Target reliability index
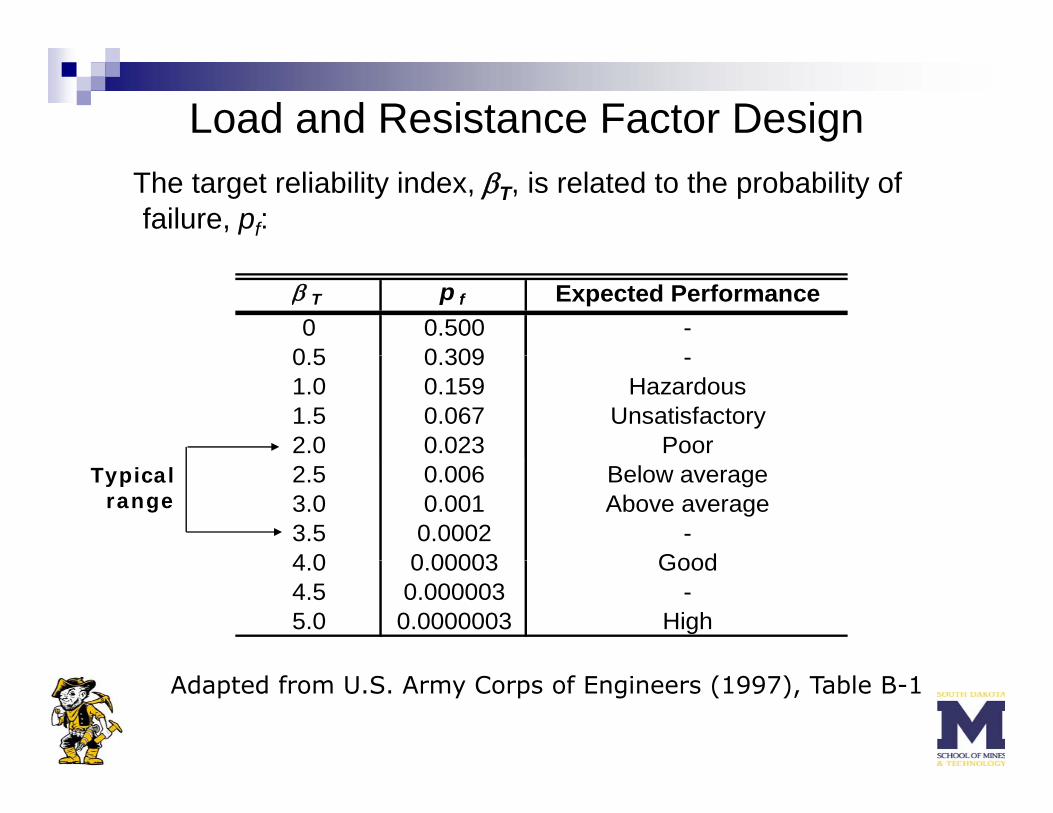
Load and Resistance Factor DesignThe target reliability index, βT, is related to the probability of failure, pf:
β T p f Expected Performance0 0.500 -
0 5 0 3090.5 0.309 -1.0 0.159 Hazardous1.5 0.067 Unsatisfactory2.0 0.023 Poor2.5 0.006 Below average3.0 0.001 Above average3.5 0.0002 -4 0 0 00003 Good
Typicalrange
4.0 0.00003 Good4.5 0.000003 -5.0 0.0000003 High
Adapted from U.S. Army Corps of Engineers (1997), Table B-1

Load and Resistance Factor DesignBias
λR = ?λQD = 1.05*λQD 1.05λQL = 1.15*
COVΩ ?ΩR = ?ΩQD = 0.10*
ΩQL = 0.20*
Load Factors (AASHTO 2007)γD = 1.25 (Strength Limit State) 1.0 (Service Limit State)γL = 1.75 (Strength Limit State) 1.0 (Service Limit State)γL 1.75 (Strength Limit State) 1.0 (Service Limit State)
Expected ValuesE(QD) / E(QL) = 2.0*
*Based on factors used in the calibration of resistance factors reported in AASHTO (2007).

Performance-Based Design
00 1000 2000 3000 4000 5000
Load (kN)
10ab
ility
@ 1
000
kN
20
30(mm
) Serv
icea
Settl
emen
t @
40
u
Limiting Tolerable Settlement = 40 mm
50
60

Strength Limit State Design
RQ φ RQ Rii φγ ≤
Substitute into resistance factor equation to obtain φR.
λR = 1.0 (“t-z” fit)ΩR = COV of PDF

Performance-Based Design
00 1000 2000 3000 4000 5000
Load (kN)
10ab
ility
@ 1
000
kN
20
30(mm
) Serv
icea
Settl
emen
t @
40
u
Limiting Tolerable Settlement = 40 mm
50
60

Service Limit StateEnsure the probability of exceeding the serviceability settlement is less than a desired magnitude (≈0.5%)
Performance-Based Design
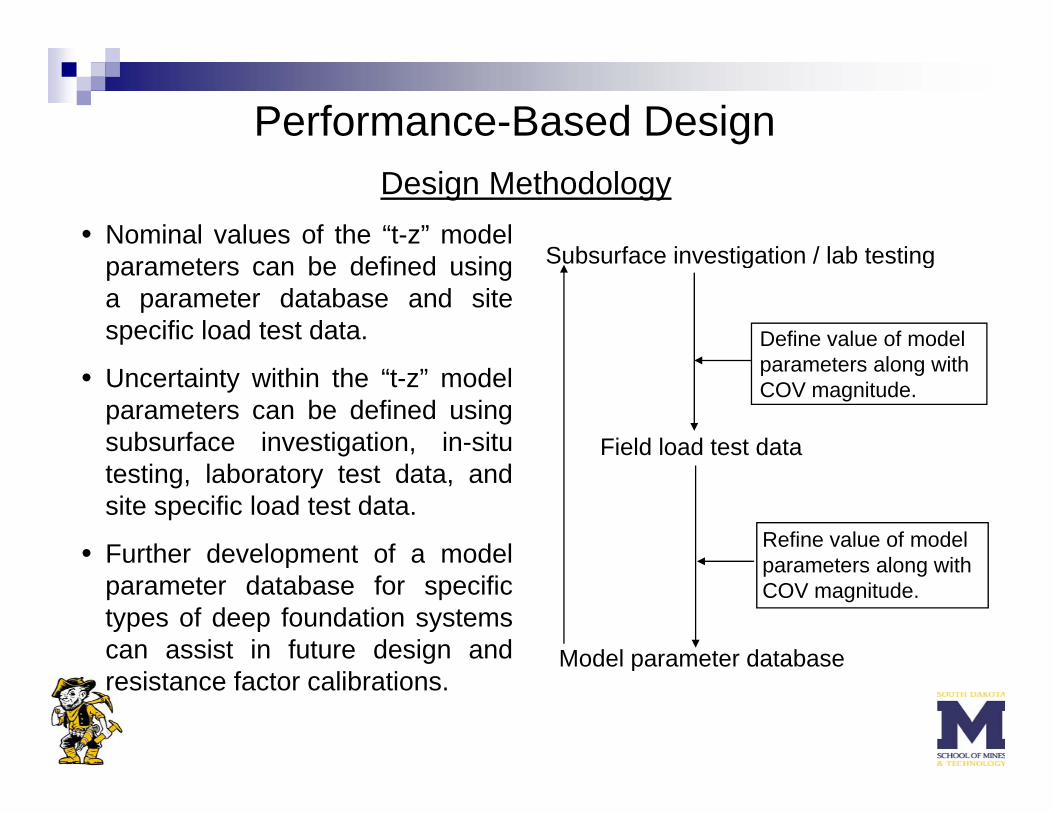
• Nominal values of the “t-z” model
Design Methodology
Subsurface investigation / lab testingparameters can be defined usinga parameter database and sitespecific load test data.
Subsurface investigation / lab testing
Define value of model
• Uncertainty within the “t-z” modelparameters can be defined usingsubsurface investigation, in-situ Field load test data
parameters along with COV magnitude.
testing, laboratory test data, andsite specific load test data.
• Further development of a model Refine value of model t l ithFurther development of a model
parameter database for specifictypes of deep foundation systemscan assist in future design and
parameters along with COV magnitude.
Model parameter databasegresistance factor calibrations.
Model parameter database
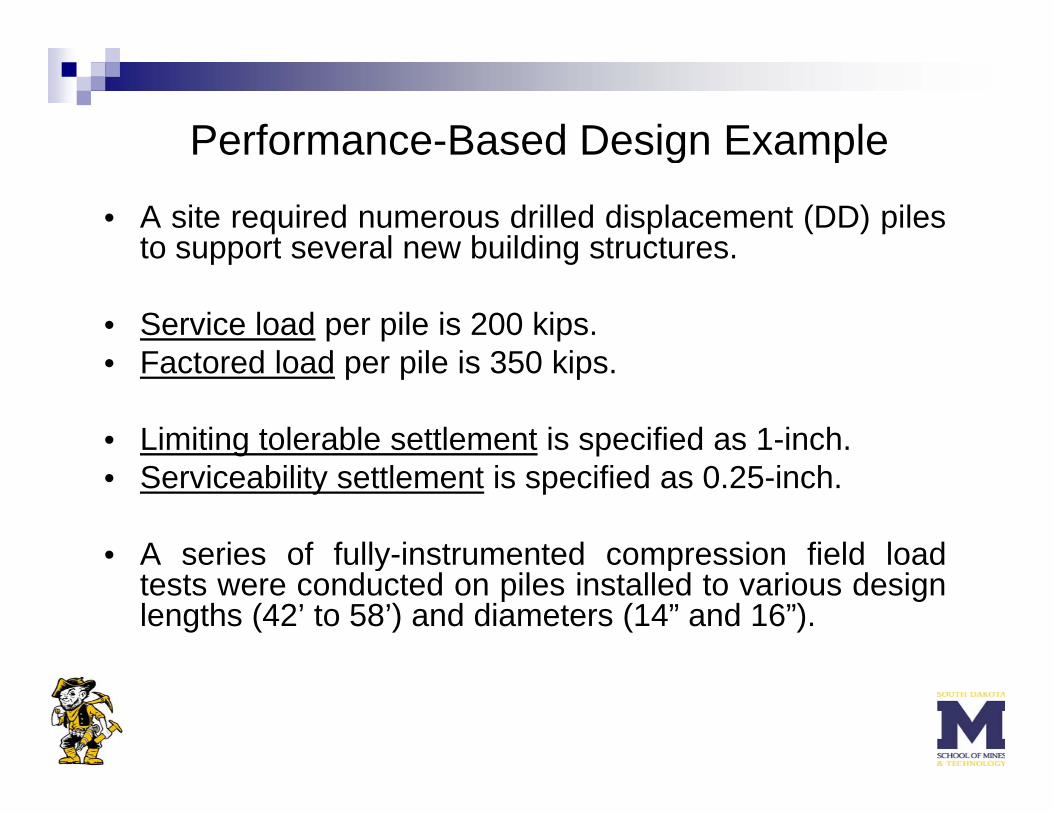
Performance-Based Design ExamplePerformance Based Design Example
• A site required numerous drilled displacement (DD) pilesto support several new building structuresto support several new building structures.
• Service load per pile is 200 kips.F t d l d il i 350 ki• Factored load per pile is 350 kips.
• Limiting tolerable settlement is specified as 1-inch.• Serviceability settlement is specified as 0.25-inch.
• A series of fully-instrumented compression field loadA series of fully instrumented compression field loadtests were conducted on piles installed to various designlengths (42’ to 58’) and diameters (14” and 16”).

Performance-Based Design Example
0.000 50 100 150 200 250 300 350 400
Load (ton)
0.00
0.20
0.40
0.60
0.80
1 00in)
Test 1Test 2Test 3Test 41.00
1.20
1.40
u ( Test 5
Test 6Test 7Test 8
1.60
1.80
2 002.00
Load-settlement data for DD piles.
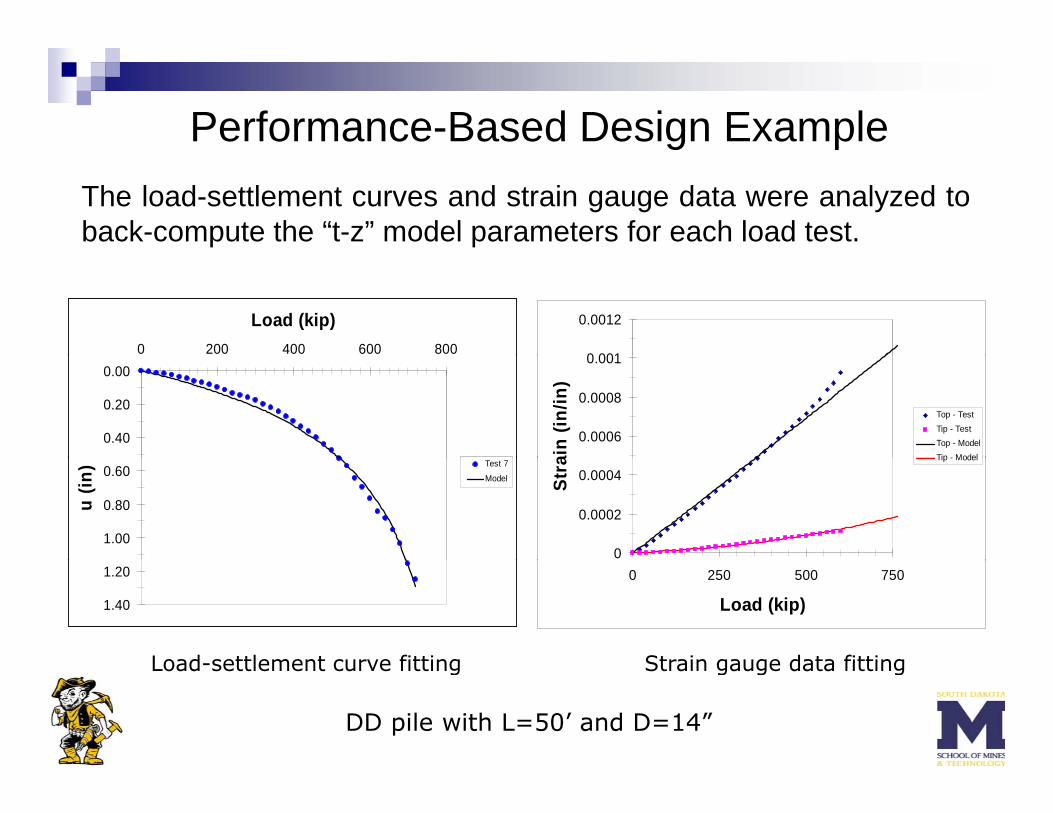
Performance-Based Design ExampleThe load-settlement curves and strain gauge data were analyzed toback-compute the “t-z” model parameters for each load test.
0 001
0.0012
0 200 400 600 800
Load (kip)
0.0006
0.0008
0.001
ain
(in/in
)
Top - TestTip - TestTop - ModelTip - Model
0.00
0.20
0.40
0
0.0002
0.0004Stra Tip - Model
0.60
0.80
1.00
u (in
) Test 7
Model
0 250 500 750
Load (kip)
Load settlement curve fitting Strain gauge data fitting
1.20
1.40
Load-settlement curve fitting Strain gauge data fitting
DD pile with L=50’ and D=14”
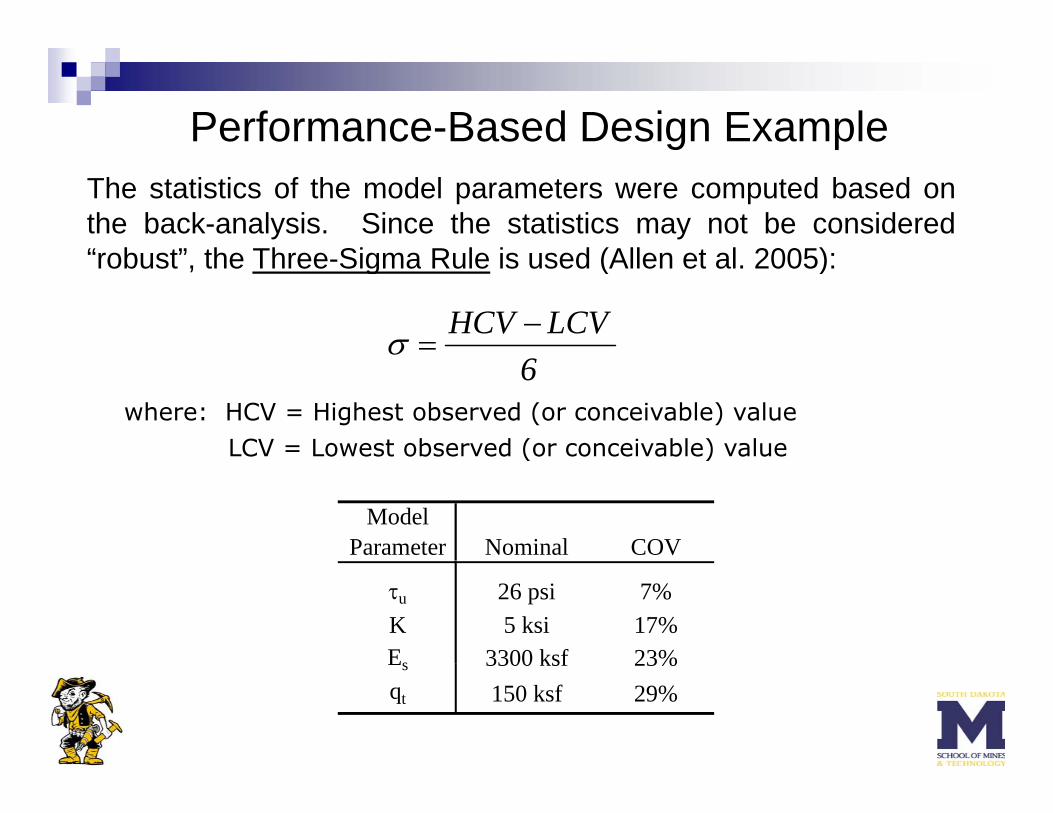
Performance-Based Design ExampleThe statistics of the model parameters were computed based onthe back-analysis. Since the statistics may not be considered“rob st” the Three Sigma R le is sed (Allen et al 2005)
LCVHCV −=σ
“robust”, the Three-Sigma Rule is used (Allen et al. 2005):
6where: HCV = Highest observed (or conceivable) value
LCV = Lowest observed (or conceivable) value( )
ModelParameter Nominal COV
τu 26 psi 7%K 5 ksi 17%Es 3300 ksf 23%Es 3300 ksf 23%qt 150 ksf 29%

Performance-Based Design Exampleg p• A Latin Hypercube simulation was conducted using the nominal
values and COV magnitudes of each model parameter.
• Several different pile lengths and pile diameters were assumed inthe simulations:
• L = 40’ with D = 14”• L = 40’ with D = 16”• L = 60’ with D = 14”• L = 60’ with D = 16”
• All randomly generated load-settlement curves were analyzed atthe limiting tolerable settlement for the Strength Limit State. Theserviceability settlement was analyzed at the Service Limit State.

Performance-Based Design Example
0.00 200 400 600 800 1000
Load (kip)
0.5 Service Limit State Load
1.0
(in)
Limiting Tolerable Settlement for Strength Limit State
1.5
u (
2.0
2 5
Latin Hypercube Simulation with L=40’ and D=16”
2.5
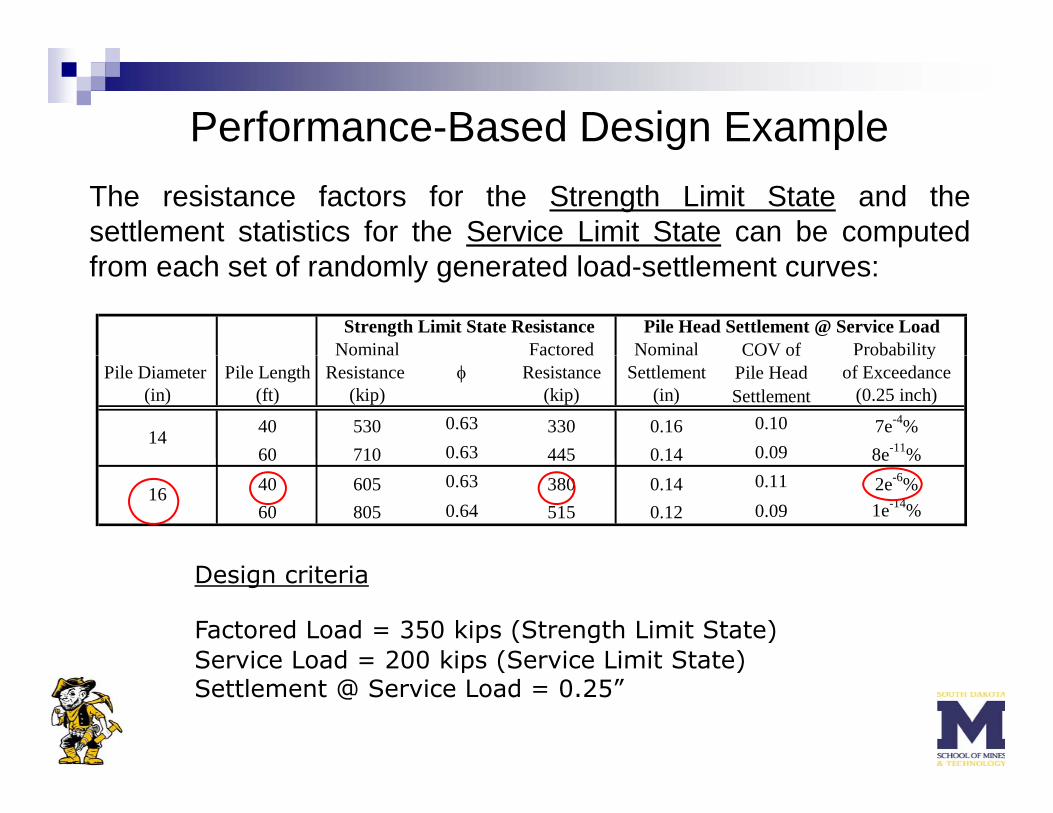
Performance-Based Design ExampleThe resistance factors for the Strength Limit State and thesettlement statistics for the Service Limit State can be computedfrom each set of randomly generated load-settlement curves:
Nominal Factored Nominal COV of Probability Strength Limit State Resistance Pile Head Settlement @ Service LoadNo a ac o ed No a COV of obab y
Pile Diameter Pile Length Resistance Resistance Settlement Pile Head of Exceedance(in) (ft) (kip) (kip) (in) Settlement (0.25 inch)
40 530 0.63 330 0.16 0.10 7e-4%60 710 0.63 445 0 14 0.09 8e-11%
14
φ
60 710 0.63 445 0.14 0.09 8e %40 605 0.63 380 0.14 0.11 2e-6%60 805 0.64 515 0.12 0.09 1e-14%
16
Design criteria
Factored Load = 350 kips (Strength Limit State)Service Load = 200 kips (Service Limit State)Service Load = 200 kips (Service Limit State)Settlement @ Service Load = 0.25”

Summary and Conclusions• The advantages of a performance-based design approach
within the LRFD framework are numerous:
1. The approach ensures that the performance of a structure at boththe Strength and Service Limit States will be tolerable throughoutthe design life of the structure.
2. The approach can rationally incorporate the numerous design andconstruction uncertainties known to exist in deep foundationengineering (i.e. inherent variability, measurement errors, model
)uncertainty, construction processes).
3. The approach allows for the development of a site specificresistance factor that incorporates these sources of uncertaintyresistance factor that incorporates these sources of uncertaintyand permits the inclusion of engineering judgment.
4. The approach can be easily accomplished through the utilizationof a reliability based design software package recently developedof a reliability-based design software package recently developedat SDSM&T.

Re-Ba Deep 1.0Re Ba Deep 1.0Reliability-Based Deep Foundation Design
D t t f Ci il d E i t l E i i Ci il E i t l d A hit t l E i i D t tDepartment of Civil and Environmental EngineeringDepartment of Mathematics and Computer Science
501 E. Saint Joseph StreetRapid City, South Dakota 57701
Civil, Environmental and Architectural Engineering DepartmentLearned Hall
1530 W. 15th StreetLawrence, Kansas 66045

References from Presentation1. AASHTO (2007). LRFD Bridge Design Specifications. 4th Edition. American Association
of State Highway and Transportation Officials, Washington, D.C.
2. Allen, T.M., Nowak, A.S. and Bathurst, R.J. (2005). Calibration to Determine Load andResistance Factors for Geotechnical and Structural Design. Transportation ResearchCircular E-C079, Transportation Research Board, Washington, D.C.
3. Baecher, G.B. and Christian, J.T. (2003). Reliability and Statistics in GeotechnicalEngineering. Wiley, West Sussex, UK.
4. US Army Corps of Engineers (1997). Engineering and Design: Introduction to Probabilityand Reliability Methods for Use in Geotechnical Engineering: Engineering TechnicalLetter No. 1110-2-547. Department of the Army, Washington, D.C.
References1. Misra, A., Chen, C.-H., Oberoi, R. and Kleiber, A. (2004). “Simplified analysis method
for micropile pullout behavior”, Journal of Geotechnical and GeoenvironmentalEngineering, 130(10), 1024-1033.
2 Mi A d R b t L A (2005) “P b bili ti i l l d di l t l ti hi2. Misra, A. and Roberts, L.A. (2005). “Probabilistic axial load-displacement relationshipsfor drilled shafts”, in GSP 131, CD Proceedings of Geo Frontiers 2005, Austin, 15 pages.
3. Misra, A. and Roberts, L.A. (2006). “Axial service limit state design of drilled shaftsusing probabilistic approach”, Geotechnical and Geological Engineering, 24(6), 1561-15801580.
4. Misra, A. and Roberts, L.A. (2006). “Probabilistic analysis of drilled shaft service limitstate using 't-z' method”, Canadian Geotechnical Journal, 43(12), 1324-1332.
5. Misra, A. and Roberts, L.A. (2006). “Finite difference method for probabilistic load-displacement analysis of drilled shafts”, CD Proceedings of Geo Congress 2006, Atlanta,6 pages.
6. Misra, A. and Roberts, L.A. (2006). “Monte Carlo simulation and serviceabilityresistance factors for micropile pullout”, CD Proceedings of Geo Congress 2006, Atlanta,6 pages.
7. Misra, A., Roberts, L.A. and Levorson, S.M. (2007). “Reliability analysis of drilled shaftbehavior using finite difference method and Monte Carlo simulation”, Geotechnical andGeological Engineering, 25(1), 65-77.
References8. Misra, A., Roberts, L.A., Oberoi, R. and Chen, C.-H. (2007). “Uncertainty analysis of
micropile pullout based upon load test results”, Journal of Geotechnical andGeoenvironmental Engineering, 133(8), 1017-1025.
9. Roberts, L.A., Misra, A. and Levorson, S.M. (2007). “Probabilistic design methodology( ) g gyfor differential settlement of deep foundations”, CD Proceedings of Geo Denver 2007,Denver, 8 pages.
10. Roberts, L.A. and Misra, A. (2007). “Reliability-based design of shallow foundationsbased on elastic settlement”, Proceedings of the First International Symposium onGeotechnical Safety and Risk, Shanghai, 12 pages.
11. Roberts, L.A., Gardner, B.S. and Misra A. (2008). “Multiple resistance factormethodology for service limit state design of deep foundations using ‘t-z’ modelapproach”, Proceedings of Geo Congress 2008, New Orleans, 8 pages.
12. Roberts, L.A., Misra, A. and Levorson, S.M. (2008). “Practical method for load andresistance factor design (LRFD) of deep foundations at the strength and service limitstates”, International Journal of Geotechnical Engineering, 2(4), 355-368.
13. Misra, A. and Roberts, L.A. (2008). “Service limit state resistance factors for drilled13. Misra, A. and Roberts, L.A. (2008). Service limit state resistance factors for drilledshafts”, Geotechnique, 10.1680/geot.2008.3605.
14. Roberts, L.A. and Misra, A. (2008) “Reliability-based design of deep foundations basedupon differential settlement criteria”, Canadian Geotechnical Journal, in print.
15 R b t L A (2008) “LRFD f d f d ti R l i th t diti l f t f15. Roberts, L.A. (2008). “LRFD for deep foundations: Replacing the traditional factor ofsafety in design”, Proceedings of the 33rd Annual Conference of the Deep FoundationsInstitute, New York (won 4th Annual Young Professors Paper Competition).

THANK YOU.
QUESTIONS?QUESTIONS?
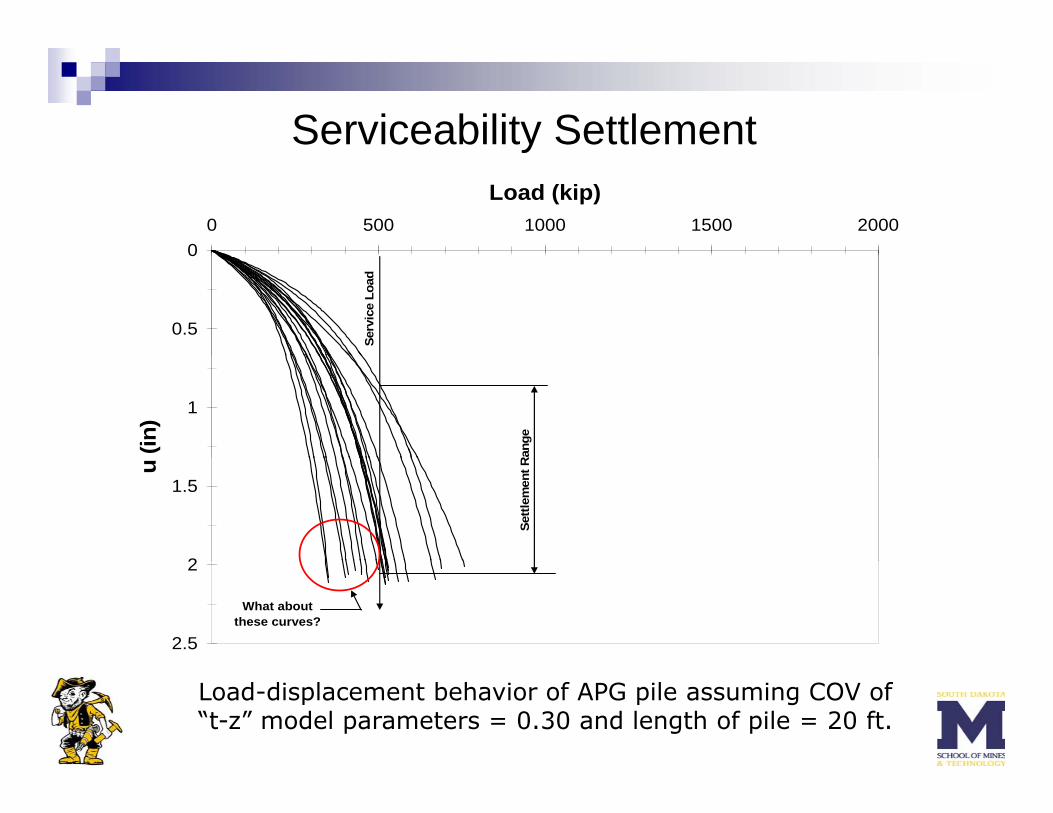
Serviceability Settlementy
00 500 1000 1500 2000
Load (kip)
0
0.5
Serv
ice
Load
1
(in)
Ran
ge
1.5
2
u
Settl
emen
t R
2
2.5
What about these curves?
Load-displacement behavior of APG pile assuming COV of “t-z” model parameters = 0.30 and length of pile = 20 ft.