Embed Size (px)
Citation preview
PERFORMANCE-BASED REGULATION
OF UTILITIES
Mark Newton Lowry, Ph.D. * Lawrence Kaufmann, Ph.D. *
Performance-based regulation (PBR) is an alternative to traditional cost of service regulation of energy utilities. In North America, PBR plans have been approved in such diverse jurisdictions as Alberta, California, Florida, Illinois, Maine, and Ontario. The Federal Energy Regulatory Commission (FERC) and Canada's National Energy Board (NEB) use PBR to regulate oil pipelines and some gas lines. The FERC has recently encouraged the use of PBR to regulate electric power transmission. Outside North America, PBR is now the standard form of investor-owned energy utility regulation. PBR is also extensively used in other regulated industries, most notably in telecommunications.
Despite the growing importance of PBR, the attention paid to it by econo- mists is uneven. Several economists have addressed the incentive impacts of al- ternative regulatory systems using mathematical theory. Sophisticated cost re- search has been submitted as evidence in PBR proceedings. However, there has not to our knowledge been a scholarly and thorough non-technical review of PBR concepts and precedents serving as a reference for practitioners.
This paper is intended to fill this gap. While not all-inclusive, we believe this PBR survey is the most authoritative and complete to date. Information is presented on a proved plans for energy utilities in North America, Great Britain, and Australia.P Analysis of plan design options is tendered reflecting the au- thors' practical experience.
The paper is structured as follows. Section I1 discusses criteria economists use to select among alternative regulatory regimes. Section I11 examines cost of service regulation and introduces the PBR alternative. Sections IV through VI explore the main approaches to PBR in greater detail. The approaches examined are rate and revenue caps and benchmark regulation. In each of these sections, the regulatory mechanism is described, precedents are detailed, and the merits of the approach are evaluated. Sections VII and VIII explore two important sets of plan provisions that must be addressed under all of the general approaches. These are benefit sharing and plan termination provisions. Important details of
* Mark Newton Lowry [B.A., M.A., and Ph.D. (Applied Economics) University of Wisconsin] and Lawrence Kaufmann [B.A. and M.A. University of Missouri, Ph.D. (Economics) University of Wis- consin] are Partners of Pacific Economics Group in Madison, WI.
1. PBR is also found in many countries with less advanced economies, including Argentina, Co- lombia, and Mexico. We confine our attention to PBR in advanced industrial countries to place a sensible limit on the scope of survey.
400 ENERGY LAW JOURNAL [Vol. 23:399
energy PBR plans approved to date are summarized in the Appendix. Citations are provided for specific plans discussed in the text.
In appraising alternative approaches to rate regulation, it is useful to have clear evaluation criteria. This chapter presents criteria widely used by econo- mists in policy analysis. In later sections, we assess different regulatory systems primarily on the basis of these criteria.
A. Eflciency
In the view of economists, there are two fundamental criteria for evaluating regulatory systems. One is economic efficiency. A regulatory system is eco- nomically efficient to the extent that it generates the maximum possible net eco- nomic benefits for society.
In appraising the efficiency of a regulatory regime, it is useful to recognize some major dimensions of efficiency. In this study, we separate efficiency into three components. These components are productive efficiency, allocative effi- ciency, and regulatory cost.
1. Productive Efficiency
Utility regulation encourages productive efficiency to the extent that it in- duces the subject utility to meet the demand for its products at minimum cost. In the short run, some inputs are "fixed" in the sense that adjustments in the amounts used are quite expensive. Automated meter reading equipment is an example. Introduction of such equipment may save cost over time, but it would not be cost effective to transform the entire metering system in one year. In the short run, productive efficiency depends on meeting demand with a minimum- cost mix of other, variable inputs. In the long run, all inputs are variable, and the cost-effective use of capital equipment is also a central efficiency concern.
2. Allocative Efficiency
Rate regulation encourages allocative efficiency to the extent that the value of service to the customers exceeds the cost of service provi~ion.~ A company's success in achieving this goal depends on its product development and marketing operations. In the short run, the adjustment in rates for existing services to re- flect changing market conditions is the main allocative efficiency challenge. In the long run, the mix of services offered by a company becomes an important concern.
The allocative efficiency of a company's operations does not depend solely
2. It should be noted that economists have used the term "allocative efficiency" in a number of ways. For example, allocative efficiency is sometimes defined so it includes using the optimal mix of pro- duction inputs for given levels of input prices, whereas productive efficiency pertains only to optimal in- put levels. We believe there is little practical value in making this distinction and include both types of decisions in the productive efficiency criterion. In our taxonomy, allocative efficiency applies to choices leading to an optimal allocation of goods in the marketplace given consumer demands. Our definition of allocative efficiency therefore applies to marketing as opposed to production decisions.
20021 PERFORMANCE-BASED REGULATION 40 1
on "core" services offered to customers without competitive options. Companies may also be able to enhance welfare by meeting demands in more competitive markets. Involvement in competitive markets can spread the cost of inputs used to provide monopoly services across more output, thereby reducing unit costs for the range of products provided by the company. Competitive market involve- ment can also potentially increase the number and variety of products available to customers in these markets. This is especially attractive in markets, such as those for local telecommunications services, where additional competition is es- pecially welcome.
Product quality is another important aspect of allocative efficiency. Cus- tomers have varied needs for quality. Competitive markets often feature an array of competing products with different price-quality attributes. Competition be- tween firms and the consumers' ability to choose among alternatives is often suf- ficient to ensure that the quality of products available in the marketplace is ap- propriate.
The threat of lost business is weaker for utility companies than for other businesses where product quality is a vehicle for competition. In many cases, the local utility is a monopoly provider and stands to lose fewer sales than a similar competitive firm if service quality is off the mark. Since social benefits from regulation depend on both price and quality, the encouragement of appro- priate quality levels is a proper regulatory objective.
3. Regulatory Cost
Costs are incurred in utility regulation. These include, most obviously, the resources (e.g. accountants, lawyers, and hearing rooms) of utilities, interveners, and government agencies dedicated to the regulatory process. Senior company officials are also drawn into the regulatory arena. This can divert management attention from market developments and performance may suffer as a result. The reduction of regulatory cost is not an end in itself, but regulation is more ef- ficient to the extent that it is not needlessly costly.
B. Fairness
A second fundamental criterion for appraising regulatory systems is fair- ness. This may be defined as the manner in which social benefits are divided among the stakeholders in the regulatory process. Customers and shareholders are the primary stakeholder groups. However, the division of net benefits among residential, industrial, and other customer sub-groups is also of concern.
Economic analysis can be used to assess the net social benefits from alter- native regulatory systems. Distributional issues can also be analyzed. However, distributional criteria can rank regulatory systems only if there are weights for the welfare of different stakeholder groups. There is no objective basis for as- signing these weights. For this and other reasons, economists have to date dwelled mainly on the efficiency of alternative regulatory systems.
402 ENERGY LAW JOURNAL [Vol. 23:399
A. Cost of Service Regulation
1. Description and Precedent
Cost of service regulation (COSR) is a convenient term for the common ap- proach to regulation of investor-owned energy utilities in the United ~ t a t e s . ~ Under this system, the rates approved by a commission are expected to recover the company's prudently incurred cost of providing regulated services. This cost includes a return on capitaL4 Rate cases are held occasionally in which estimates are made of the prudent cost of capital, labor, and other inputs used to provide regulated services. This becomes the base rate revenue requirement. The vola- tility of energy prices has prompted some regulators to provide for a shorter lag between the purchase of energy inputs and the addition of these costs to the revenue requirement.
For both kinds of inputs, the determination of allowed cost is complicated if the utility company sells some products in unregulated markets. Almost every utility has some involvement in such markets. The rental of under utilized real estate is illustrative of such a market. To the extent a utility has such operations, its total cost will exceed the cost of regulated services and some share must be assigned to the regulated services.
Once the revenue requirement is determined, it is allocated for recovery from the various regulated services offered. The rate for a service is designed to recover this assigned cost given estimates of customer numbers, delivery vol- umes, and other billing determinants. The regulated service offerings and rate designs require commission approval. These terms are reviewed occasionally at the insistence of either the utility or the regulatory agency.
The determination of the revenue requirement and its allocation among cus- tomer groups is complicated by the common costs incurred jointly in the provi- sion of various services. The inherently arbitrary nature of common cost alloca- tions makes them a source of controversy in COSR.
2. Evaluation
COSR is widely suspected of failing to achieve the maximum net benefit to society that is possible from utility company operations. The heart of the prob- lem is the high cost that must be incurred for regulators to acquire knowledge of utility operations. If they knew the efficient way to produce and market utility services, they could simply mandate the provision of the optimal services and set prices to recover the minimum cost of providing them. Unfortunately, it is often
3. The term "utility" is defined here and throughout this article to be an enterprise that provides essential senices on a monopoly basis and, if private, is subject to rate and service regulation. As such, the term encompasses oil and gas transmission companies, electric utilities, and gas distributors.
4. This characterization of cost of service regulation is, of course, stylized. The terminology and precise procedure for setting rates varies considerably across regulated industries and regulatory jurisdic- tions.
PERFORMANCE-BASED REGULATION
difficult, even for company managers, to recognize best practices given the sub- stantial uncertainty that exists regarding future supply, demand, and policy con- ditions. The challenge is much greater for regulators since they are apt to have little direct experience with utility operation. Economists call this situation one of information asymmetry. A redressing of the informational asymmetry be- tween company managers and regulators requires substantial data exchange, processing, and analysis.
Measures are naturally taken to contain these regulatory costs. Rate cases may occur less frequently than at annual intervals. When rates are reset, they may be based more on the company's unit cost than on external unit cost stan- dards. One means of achieving this is to scale back on the prudence review process. Companies may be placed at significant risk only for actions with con- spicuously unfortunate outcomes. Penalties may not be levied for failure to adopt the best or the most innovative practices. Rewards may not be considered for superior performance.
Regulatory cost can also be contained by restricting practices that compli- cate regulation. For example, service offerings may be limited and rate struc- tures kept simple. Companies may be discouraged from engaging in novel or risky activities. Transactions with unregulated affiliates are a third common area of restriction. Such simplifications can reduce regulatory costs, but they can also diminish the productive and allocative efficiency of utility operations. If rate ad- justments are based on the trend in the company's own unit cost, efforts to trim costs or improve the market responsiveness of rates and services lead eventually to lower rates. This weakens company performance incentives. Incentives are especially weak for performance initiatives involving upfront costs to achieve long term benefits. Another class of initiatives strongly discouraged is those in- volving a significant risk of conspicuous failure. This would presumably include many kinds of innovations.
Restrictions on utility operations can also reduce efficiency. For example, limited service offerings and inflexible rates hamper the utility's ability to satisfy its customers' complex and changing needs. The efficiency consequences of in- effective marketing are especially acute where demand is elastic with respect to rate and service offerings. These situations include services to customers with access to competitive service arrangements, including the ability to shift activi- ties to sites served by other utilities. Incremental consumption of utility services is another important category since this may require a discount. A timely exam- ple is longer distance power transmission, which promotes the development of competitive power markets. A third important category is service to economi- cally distressed customers. Unresponsive market offerings can lead to uneco- nomic bypass of the company's services. More typically, margins from services to markets with high demand elasticity will not be maximized, so that a larger share of the utility's cost must be recovered from other customers.
Restrictions on affiliate transactions can also reduce efficiency. Utility companies sometimes seek to achieve economies of scale and scope by moving operations to affiliates with the ability to serve competitive markets and the util- ity simultaneously. Under COSR, utility purchases of services from such affili- ates can raise cross-subsidy concerns. Some regulators have responded to this
404 ENERGY LAW JOURNAL [Vol. 23:399
challenge by discouraging affiliate transactions or placing onerous and intrusive restrictions on affiliate operations. These problems and the attendant regulatory costs may lead utility companies either to forgo competitive market involvement or to serve competitive markets through unregulated affiliates lacking the full potential benefits of scale and scope economies. Failures of unregulated affili- ates of utilities are reported routinely in the trade press and some may be traced to this problem.
One economy measure that can increase the efficiency of COSR is a reduc- tion in the frequency of rate cases. As the period between rate cases, sometimes called regulatory lag, increases, the length of time during which the company re- tains the benefits of performance improvements increases. Performance incen- tives are thereby strengthened, especially for projects involving up front costs to achieve long-term gains.
Extended regulatory lag is most feasible in periods of slow input price infla- tion, and when industries or individual companies are positioned to achieve rapid productivity growth. For example, extended lag has been feasible for many years in the telecommunications industry due to slow input price inflation and the exceptionally rapid productivity growth of that industry. The productivity growth prospects of an energy utility might improve temporarily due to a merger that accelerates scale economy realization.
Notwithstanding these situations, the potential for regulatory lag is limited in most energy utility industries. Prices of some utility inputs, like natural gas, are volatile. A failure to adjust rates for changes in the cost of these inputs would make earnings volatile and thereby raise the cost of capital. Another rea- son regulatory lag is limited is that in most utility industries, as in the economy as a whole, prices must trend upward in nominal terms to compensate utilities for unavoidable inflation in input prices. Infrequent rate cases are also less ten- able during times of rapid industry change. Even if revenue requirements do not need to be adjusted, companies will want to modify their rate structures and ser- vice offerings in response to changing market conditions. The end result is that rate case cycles in utility industries typically do not exceed three years and an- nual rate cases are common. Regulatory lag is especially short for energy pro- curement activities.
In summary, there is a tradeoff in COSR between productive and allocative efficiency and the cost of regulation. Maximum productive and allocative effi- ciency can only be achieved at high regulatory cost. Many efforts to contain these costs impair these efficiencies.
B. The PBR Alternative
PBR is a general approach to utility rate regulation encompassing a wide range of mechanisms that can weaken the link between a utility's rates and its unit cost of service. To the extent that the goal is met, it is possible to attain higher levels of productive and allocative efficiency from a given level of regula- tory cost. PBR can then be said to represent progress in "regulatory technology" that increases the size of the economic pie available for higher earnings and bet- ter terms of service.
There are several sources of this technological progress. First, PBR makes
PERFORMANCE-BASED REGULATION
use of automatic rate adjustment mechanisms established in advance of their op- eration. Such mechanisms are often represented by mathematical formulas. The use of such mechanisms can reduce the frequency and scope of regulatory inter- vention. A second source of progress is that PBR mechanisms rely heavily on data that are external in the sense of being insensitive to the actions of utility managers. Data on the input price and productivity trends of other utilities are illustrative.
To the extent that rate adjustments are based on a combination of external data and automatic adjustment mechanisms, the regulatory system is externalized and utilities can be more confident that superior performance will not trigger changes in regulatory policies depriving shareholders of benefits. This process strengthens performance incentives and promotes the attainment of productive and allocative efficiency. In addition, lessened concern about cross subsidies and risky ventures makes it possible to accord utilities greater operating flexibil- ity.
The use of economic research is a third source of progress. Theoretical and empirical research can be brought to bear on the appropriate combination of automatic mechanisms and external data. For example, research can be used to design a regulatory system that protects utilities fiom unavoidable input price fluctuations while ensuring customers the benefit of normal performance im- provements.
The combined effect of these attributes is a regulatory process that, in spite of lower cost, can strengthen performance incentives and afford an increase in operating flexibility by making price restrictions less sensitive to company ac- tions. The potential benefits fiom rate regulation are therefore increased and PBR plans can be designed so the benefits of performance improvements are shared between shareholders and customers.
A wide variety of mechanisms are available to craft PBR plans. These may usellly be grouped into basic approaches to PBR and other plan provisions that must be specified under various basic approaches. The basic approaches to PBR include rate caps, revenue caps, and benchmarking. Two important categories of other PBR tools are benefit sharing and plan termination provisions. We address each of these topics in the sections that follow.
C. Application: Energy Supply
The potential advantages of PBR may be clarified by discussing the chal- lenge of regulating one important class of utility services, which is retail energy supply. We define retail energy supply as the business of securing supplies of gas or electric power for retail customers. Power supplies can, in principle, be obtained from power procurement or self generation.
The choice of this business to illustrate key concepts in our discussion may surprise some readers. After all, this business is widely considered to be poten- tially competitive, and thus, less appropriate for regulation than more natural monopolies like power distribution. However, electric utilities still monopolize power supply to retail customers in roughly half the North American markets. These markets include: Mexico, most of Canada, and the southeast, the mid- continent, the Rocky Mountain, and the northwest regions of the United States.
ENERGY LAW JOURNAL
There is, furthermore, no conspicuous move towards retail competition in these regions. Natural gas distributors, meanwhile, still monopolize about half of the retail North American gas supply market. Most gas and electric utilities subject to retail competition still provide default energy supply services subject to regu- lation.
Setting aside the desirability of monopolies on retail energy supply, it is noteworthy that the business is one of the more difficult to regulate using COSR. Since prices for power, natural gas, and other fuels are volatile, it is rislq to fix charges for their procurement for extended periods. Many gas and electric utili- ties recover the cost of fuel and power procurement almost immediately. The resultant reduction in regulatory lag weakens performance incentives. Under COSR, this means an unusual reliance on prudence reviews to ensure that charges for energy supply are just and reasonable.
The risk of prudence disallowance in the energy supply business is substan- tial. A myriad of options is available to procure fuel and power and to deliver them to a utility's system. Supplies can, for instance, be purchased with varying degrees of reliability and price stability. For power suppliers, there is the added challenge of choosing between power purchases and the various technologies for self-generation. Additionally, given the volatility of energy prices, it is all too easy for a utility to make energy supply decisions that are later found to have been unfortunate.
There is no shortage of evidence of prudence risk in the energy supply business. In the 1980s and early 1990s, many electric utilities received prudence disallowances for building capital-intensive nuclear generation in an era of high capital costs and low energy prices. In the mid to late nineties, disparities be- tween the average regulated cost of power supply and lower spot prices placed many utilities under the threat of stranded cost. More recently, some utilities have faced prudence reviews for excessive reliance on spot purchases of natural gas and power. The risk of prudence disallowance fiom inferior performance is generally not counterbalanced by the opportunity to profit from superior per- formance as it would in an unregulated market.
A further complication occurs where a company wishes to supply energy to a mix of competitive and monopoly markets. In that event, economies of scale and scope can often be realized by having a single enterprise serve both lunds of markets. For smaller utilities especially, a consolidated operation can be a key to competitive market success. One approach to consolidation is to have the utility make sizable sales of energy to competitive markets. This can raise complex is- sues about the sharing of cost and competitive market margins. Another ap- proach is to place energy supply operations in an unregulated affiliate that sells energy to the utility. This raises the issue of fair transfer prices.
Our discussion suggests the energy supply business is unusually costly to regulate well using COSR. The high cost compels regulators to limit prudence vigilance and restrict operating practices that complicate review. In the after- math of restructuring, for instance, California's power distributors were discour- aged from employing hedging practices that might have stabilized the cost of power procured for default customers. Considering additionally the typically short regulatory lag for fuel and power purchases, the end result is that regulation
20021 PERFORMANCE-BASED REGULATION 407
of energy supply using COSR can involve weak performance incentives and ex- tensive operating restrictions. These problems help to explain why this sector has produced some of the more impressive failures of North American regula- tion.
PBR has significant advantages in the regulation of energy supply. By weakening the link between a utility's charges for energy supply and its own cost, it can strengthen incentives for efficient operation, improve the risk return balance, and facilitate relaxation of operating restrictions. Stronger incentives permit economies in the prudence review process. Intelligent use of economic reason and empirical research can reduce the risk of energy supply PBR. An ex- ample is the careful use of data on energy market price trends.
Given these advantages, it is not surprising that PBR is used fairly exten- sively in energy supply regulation today. Its use is especially common in regula- tion of natural gas procurement by distributors. Plans have been approved for more than a dozen distributors, including Avista (Idaho, Or., Wash.), Northern Illinois Gas (Ill.), and Southern California Gas (Cal.). In approving PBR plans for gas procurement, regulators in both California and Illinois have portrayed PBR as an alternative to detailed prudence reviews. In approving the Avista plan in Oregon, regulators expressly acknowledged an intent to facilitate gas purchases from an unregulated affiliate.
To date, PBR has not made significant inroads into the regulation of default power procurement services by distributors. Instead, utilities have generally chosen conservative procurement strategies that minimize risk of a prudence dis- allowance. A PBR settlement agreement proposed by San Diego Gas and Elec- tric was rejected by the California om mission.^ The company was subse- quently subject to a review of its purchasing practices. PBR is used for bundled power service in many states that have not elected to pursue retail competition. Pricing energy purchases from unregulated affiliates using competitive bidding is not typically viewed as PBR, but is very consistent with PBR principles.
Rate caps are the most common form of PBR in the world today. This sec- tion addresses the rate-cap approach. Discussions of procedures and important issues in plan design are followed by an evaluation of the approach.
A. Overview
Under a rate-cap plan, restrictions are placed on the terms of certain regu- lated services. Restrictions commonly take the form of limits on rate escalation. The limits are called caps since utilities are often free to charge rates that are less than the maximum allowed.
The mechanisms for determining allowed rate growth vary, but all have the attribute of being external. The simplest approach is to hold rates constant for the plan duration, which is sometimes called a rate freeze or moratorium. A
5. Protest of Utility Consumers' Action Network to SDG&E's Application to Change Electric Rates Pursuant to Full Collection of Competition Transition Costs, No. 99-02-029 (Cal. P.U.C. 1999).
408 ENERGY LAW JOURNAL [Vol. 23:399
simple variant of the rate freeze is a set of pre-scheduled rate adjustments, which may be increases or decreases.
Still another approach is to limit rate adjustments using indexes. Under this approach, growth in baskets of the utility's prices may be measured using actual price indexes (APIs). Growth in each API is limited using a price cap index (PcI).~
B. Precedents
1. United States
Extended periods of operation without rate cases have been achieved at one time or another by many utilities. These sometimes result from commitments to rate freezes. The rate freeze approach has been especially common in telecom- munications.
Many energy utilities that have operated under rate freezes do not perceive this form of regulation as PBR. However, several companies have in recent years chosen rate freezes as key components of a PBR package. Noteworthy in this regard are plans for bundled power services of AmerenUE (Mo.), Black Hills Power & Light (S.D.), and Edison Sault Electric (Mich.); for the power dis- tribution services of National Grid in Massachusetts and New York; and for the gas distribution services of Consumers Energy (Mich.) and Michigan Consoli- dated Gas (Mich.). The Michigan plans are especially interesting as they applied to both the gas supply and delivery services of the companies. The rate morato- rium for International Transmission Company (ITC) is also of interest as the first PBR plan for unbundled power transmission approved by the FERC. This plan will take effect, however, only if ITC joins a regional transmission organization and is sold to a company that is not a market participant.
The first large scale rate indexing plan in the United States was that for Class I line haul railroads under the terms of the Staggers Rail Act of 1980.' Rate indexing has since been used extensively in U.S. telecommunications. The Federal Communications Commission (FCC) played a leadership role in this re- gard, approving price cap plans for AT&T in 1989 and for interstate services of local exchange carriers (LECs) in 199 1 .9 Rate indexing is now widely used in state-level telecom regulation.
Rate indexing has been used to regulate several U.S. energy utilities. Fed- erally regulated services of U.S. oil pipelines are subject to rate indexing. A rate-indexing plan has also been approved by the FERC for Transwestern Pipe- line Company, a natural gas pipeline.
The first rate indexing plan approved for a U.S. electric utility was for the bundled power services of PacifiCorp (Cal.). Since then, plans have been ap-
--
6. The useful acronyms API and PC1 appear to have developed in U.S. Federal Communications Commission proceedings.
7. International Transmission Co., 92 F.E.R.C. fi 61,276 (2000). 8. Staggers Rail Act of 1980, Pub. L. No. 96-448,94 Stat. 1895 (1980) [hereinafter Staggers Act]. 9. Policy and Rules Concerning Rates for Dominant Camers, F.C.C. 89-314, No. 87-313 (pro-
posed May 8, 1989) (codified at 47 C.F.R. pts. 61,65,69).
20021 PERFORMANCE-BASED REGULATION 409
proved for the bundled power service of Central Maine Power (Me.), the power distribution services of Bangor Hydro Electric (Me.), Central Maine Power (Me.), National Grid (Mass.), SDG&E (Cal.), and Southern California Edison (Cal.), and for the gas delivery services of Bangor Gas (Me.), Boston Gas (Mass.), and SDG&E (~al.) ."
2. Canada
Rate indexing in Canada began in the telecommunications industry. The Canadian Radio-Television and Telecommunications Commission (CRTC) ap- proved a plan that applies to nearly all telecom utilities in the country." Rate in- dexing has also found favor with regulators in Ontario. Rate-cap plans have been approved there for the distribution services of Ontario power distributors and Union Gas.
3. Britain
Rate indexing has been extensively used by regulators in Britain. It was first applied to British Telecom in 1984. Since then, rate indexing has been ap- plied to electric, gas, and water utilities.
4. Australia
Rate indexing is also common in Australian regulation. The country's tele- communications industry has been under "price controls" since 1989. Power distribution rates for utilities in the states of New South Wales and Victoria are also subject to indexing.
C. The PCI Formula
Price cap indexes are determined by mathematical formulas. While the formulas vary from plan to plan, it is generally true that the PC1 growth rate (APCI ) is the difference between an inflation factor (P) and an X-factor (3, plus or minus a Z-factor (z)." The standard formula may be stated succinctly as
We consider each of the formula components in turn.
1 . The Inflation Measure
The inflation factor, P, is the growth rate in an external price inflation measure. Three basic kinds of measures have been used in approved rate-cap plans. These may be constructively described as macroeconomic, industry-
10. The plan for National Grid (Mass.) involves a rate freeze and rate indexing. 1 1 . Price Cap Regulation and Related Issues, Telecom Decision, C.RT.C. 97-9 (1997) mereinafter
Telecom Decision]. 12. The term Z-factor appears to have developed in the FCC proceeding to develop a price cap plan
for AT&T. It was so called because the PC1 for AT&T also included an X-factor as here described and a "Y'factor to effect a specific category of price cap adjustments.
410 ENERGY LAW JOURNAL [Vol. 23:399
specific, and peer price measures. Macroeconomic inflation measures are summary measures of growth in the
prices of a wide range of the economy's goods and services. Those used in PBR plans are typically computed by government agencies. Examples include the chain-weighted price index for gross domestic product (GDPPI), consumer price indexes (CPIs), and producer price indexes (PPIs). Macroeconomic measures are almost universally used in telecom utilities' rate-cap plans. They are also the most common measures in plans for energy utilities outside North America. In- dexes of consumer price inflation are used in most overseas indexing plans.
An important advantage of macroeconomic inflation measures is their sim- plicity. They also have credibility, since they are computed with some care by government agencies. The main concern with macroeconomic inflation meas- ures is their ability to track growth in the prices of utility inputs.
Industry-specific inflation measures are expressly designed to track infla- tion in the prices of the relevant utility inputs. Such measures summarize the growth in sub-indexes that are chosen to track trends in the prices of major input categories. The index formula customarily assigns weights to the sub-index growth rates that reflect the shares of the input categories in utility cost. Cost share weighting is a method of developing a summary inflation measure which reflects the impact of input price growth on cost.
An industry-s ecific inflation measure was first used in the indexing plan for U.S. railroads.' It was first approved in the U.S. energy industry for the bundled power services of PacifiCorp (Cal.). This precedent is of added impor- tance because the California Public Utilities Commission staff played an instru- mental role in the index design. Industry-specific inflation measures have since been approved for the gas delivery services of Southern California Gas (Cal.), the gas and electric power delivery services of SDG&E (Cal.), and the power distribution services of Ontario utilities.
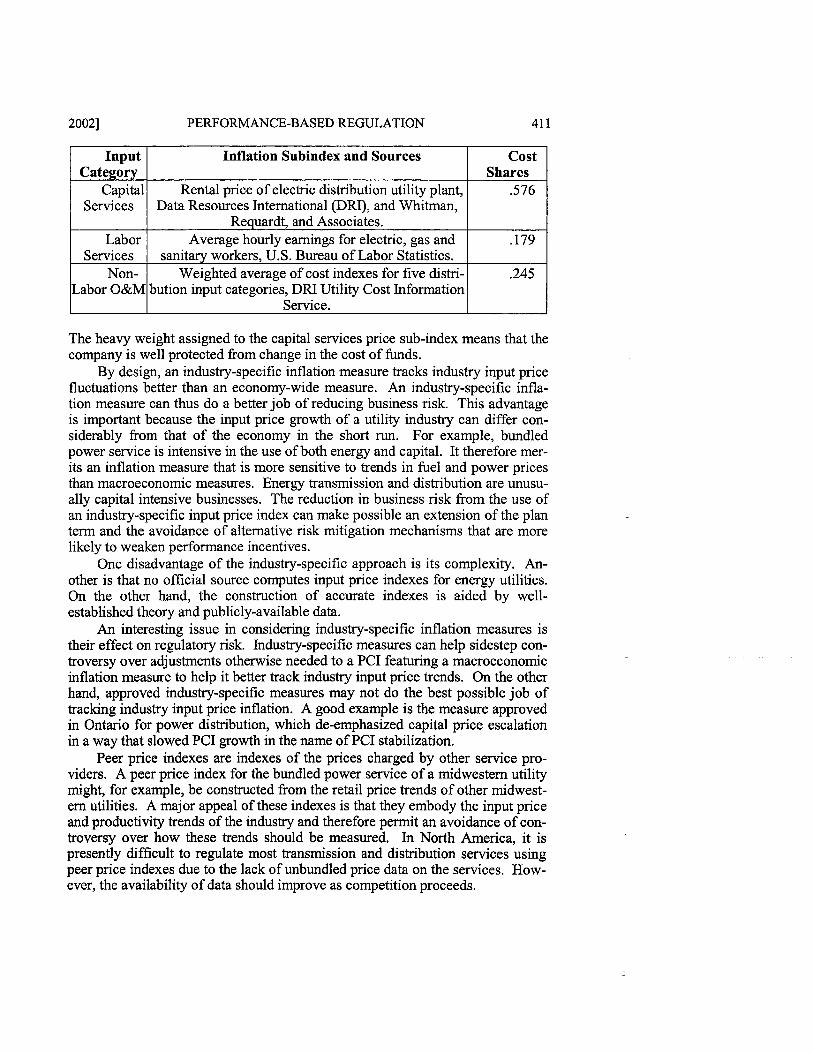
The inflation measure in San Diego's PC1 for power distribution merits de- scription as an example of the genre. It features sub-indexes for three input categories: capital services, labor services, and miscellaneous operation and maintenance (O&M) inputs. The weights assigned to the sub-indexes are the shares of each input group in the distribution cost of California investor-owned utilities calculated over a recent five-year period. Here are the sub-indexes and the corresponding cost shares:
- -
13. The inflation measure in the railroad indexing plan is a weighted average of the growth rates in external indexes of the prices of railroad inputs, including labor, fuel, materials, equipment rentals, depre- ciation, interest, and miscellaneous inputs. Each input is assigned a weight that reflects its share of the total cost of the railroad industry.
20021 PERFORMANCE-BASED REGULATION 41 1
The heavy weight assigned to the capital services price sub-index means that the company is well protected from change in the cost of funds.
By design, an industry-specific inflation measure tracks industry input price fluctuations better than an economy-wide measure. An industry-specific infla- tion measure can thus do a better job of reducing business risk. This advantage is important because the input price growth of a utility industry can differ con- siderably from that of the economy in the short run. For example, bundled power service is intensive in the use of both energy and capital. It therefore mer- its an inflation measure that is more sensitive to trends in fuel and power prices than macroeconomic measures. Energy transmission and distribution are unusu- ally capital intensive businesses. The reduction in business risk from the use of an industry-specific input price index can make possible an extension of the plan term and the avoidance of alternative risk mitigation mechanisms that are more likely to weaken performance incentives.
One disadvantage of the industry-specific approach is its complexity. An- other is that no official source computes input price indexes for energy utilities. On the other hand, the construction of accurate indexes is aided by well- established theory and publicly-available data.
An interesting issue in considering industry-specific inflation measures is their effect on regulatory risk. Industry-specific measures can help sidestep con- troversy over adjustments otherwise needed to a PC1 featuring a macroeconomic inflation measure to help it better track industry input price trends. On the other hand, approved industry-specific measures may not do the best possible job of tracking industry input price inflation. A good example is the measure approved in Ontario for power distribution, which de-emphasized capital price escalation in a way that slowed PC1 growth in the name of PC1 stabilization.
Peer price indexes are indexes of the prices charged by other service pro- viders. A peer price index for the bundled power service of a midwestern utility might, for example, be constructed from the retail price trends of other midwest- ern utilities. A major appeal of these indexes is that they embody the input price and productivity trends of the industry and therefore permit an avoidance of con- troversy over how these trends should be measured. In North America, it is presently difficult to regulate most transmission and distribution services using peer price indexes due to the lack of unbundled price data on the services. How- ever, the availability of data should improve as competition proceeds.
Input Category
Capital Services
Labor Services
Non- Labor O&M
Inflation Subindex and Sources
Rental price of electric distribution utility plant, Data Resources International (DRI), and Whitrnan,
Requardt, and Associates. Average hourly earnings for electric, gas and
sanitary workers, U.S. Bureau of Labor Statistics. Weighted average of cost indexes for five distri-
bution input categories, DRI Utility Cost Information Service.
Cost Shares
.576
.I79
.245
412 ENERGY LAW JOURNAL [Vol. 23:399
2. The X-Factor
The X-factor is an external parameter in the PC1 formula that typically causes the PC1 to grow more slowly than the inflation measure, to the benefit of customers. Thus, prices for regulated services are likely to decline in real terms. X is sometimes called a "productivity factor" since considerations of productiv- ity growth are sometimes involved explicitly in choosing its value.
Various methods have been used to ensure the external character of X. Most commonly, its value in each year of the plan is set in advance and is con- stant throughout the plan. However, in several approved plans, the X-factors are set in advance, but scheduled to vary from year to year. For example, X-factors have been scheduled to rise gradually over the term of the plan. X may also be recomputed periodically to reflect new information as long as the computation formula is insensitive to the actions of subject utility managers. The best known precedent for this approach is the X-factor in the indexing plan for U.S. rail- roads.14 This was an annually updated rolling average of the recent productivity growth of the railroad industry.
3. The Z-Factor
The Z-factor term of a PC1 adjusts the allowed rate of price escalation for external developments that are not reflected in the inflation and X-factors. It is apt to differ fkom period to period. One of the primary rationales underlying Z- factor adjustments is the need to adjust price limits for the effect of changes in tax rates and other government policies (e.g., conductor undergrounding re- quirements and policies promoting energy conservation) on the company's unit cost. Absent such adjustments, policymakers can adopt new policies that in- crease the company's unit cost, confident in the knowledge that earnings, rather than rates, will be affected. Another rationale for Z-factors is to adjust for the effect of other miscellaneous external developments on industry unit costs that are not captured by the inflation and X-factors. An advantage of Z-factors is that they reduce risk without weakening performance incentives. A disadvantage is that they can significantly raise regulatory cost.
D. The American Approach to PCI Design
At present, two countries have extensive experience with price cap regula- tion: the United States and Great Britain. Each country has its own approach to PC1 design, and the methodologies differ greatly. In general, the differences be- tween the British and American approaches to PC1 design are poorly understood on both sides of the Atlantic.
1. The American Approach
Although rate indexing is associated in the minds of many with Great Brit- ain, North America actually has a longer history with this regulatory system. E. Fred Sudit of Rutgers University outlined the approach to PC1 design that has
14. This is discussed in more detail infro Part IV.D.3.
20021 PERFORMANCE-BASED REGULATION 413
become common in North America in a 1979 paper.'5 William Baumol, then at Princeton University, elaborated on the idea in a 1982 paper.'6 These early trea- tises influenced the American approach to PC1 design, but credit must also go to other individuals who were involved in the early regulatory proceedings and supporting legislation.
2. Index Logic
The founding principle of PC1 design in North America is that indexes should simulate the workings of competitive markets. The logic of economic in- dexes yields information about competitive markets that can be used to imple- ment this principle. A central result of index logic is that if an industry earns a competitive rate of return in the long-run, the long-run growth trend in an index of the prices that it charges (its output prices) will equal the trend in its unit cost index.
Trend Output ~ r i c e s ' " ~ " ~ = Trend Unit ~ o s t ' " ~ " ~ (1)
The unit cost of an industry is its cost per unit of output. In a competitive market, maximum prices reflect industry conditions and
each individual supplier keeps all of the after-tax benefits accruing from its ef- forts to slow its own unit cost growth. This creates strong incentives for suppli- ers to contain unit cost growth. Competition ensures that slower growth in an industry's unit cost leads eventually to slower growth in the prices that it charges.
A price cap plan can simulate these competitive market conditions. Actual price indexes can measure the growth in a utility's prices for services offered on a non-competitive basis. The growth in the APIs can then be limited by PCIs that track the unit cost trend of the relevant utility industry.
A PC1 conforming to the following formula reflects the industry unit cost trend:
Trend PC1 = Trend Unit ~ o s t " ' ~ ~ ~ ~ (2)
Conformance can be achieved when the PC1 tracks either the annual fluctuations in the unit cost of an industry or the industry's longer run unit cost trend. Each approach has advantages and disadvantages. The unit cost of an industry can be volatile from year to year due to input price fluctuations or to a temporary slack- ening or strengthening of market conditions. Unit cost responds to input prices in much the same manner as output prices do, but responds differently to de- mand fluctuations. For example, a slackening of demand typically lowers prices
15. E. Fred Sudit, Automatic Rate Adjusmtents Based on Total Factor Productivity Pet$ormance in Public Utility Regulation, in PROBLEMS IN PUBLIC UTILITY ECONOMICS AND REGULATION 55 (Michael A. Crew ed., Lexington Books 1979).
16. William J. Baumol, Productivity Incentive Clauses and Rate Adjustment fir Infation, PUB. UTIL. FORTNIGHTLY, July 22,1982, at 1 I.
414 ENERGY LAW JOURNAL [Vol. 23:399
but raises unit cost. Thus, linking the PC1 to annual industry unit cost fluctua- tions honors the competitive market standard only in the long run. Another problem with a short-term annual approach is that often the data needed to calcu- late industry unit cost trends accurately are not available in a timely fashion. For example, the final data needed to calculate the cost of power distribution nation- wide in 2002 is not available until the middle of 2003, when the FERC Form 1 reports are due. Delays for gas distribution data are even longer.
A PC1 that is calibrated to reflect only the industry's long-run unit cost trend can mitigate these problems. However, in times of input price volatility, the long-run approach may subject utilities to undue financial distress and send the wrong price signals to customers. Rapid price inflation occurs periodically in the U.S. economy and is even more common abroad.
A second result of indexing logic further facilitates the design of a PC1 that honors the competitive market standard. The trend in an industry's unit cost in- dex can be shown to be the difference between the trends in its input price and total factor productivity (TFP) indexes.
Trend Unit costrndusQ - - Trend Input Pricesrnduw - Trend T F P ~ ~ ~ ~ ~ ~ (3)
The TFP index of an industry captures the wide range of developments that can cause its unit cost to grow at a different rate than its input prices. These de- velopments include technological progress and the realization of scale econo- mies. TFP is volatile but typically trends upward, so that an industry's unit cost grows more slowly than its input prices over time.
Our discussion suggests that a PC1 can honor the competitive market stan- dard by conforming to the following formula:
Trend PCI = Trend Input Pricesrndusv - Trend T F P ~ ~ ~ ~ ~ ~
= Trend Input PricesrndusQ -X (4)
This formula has two terms: the industry's input price index and an X-factor. The X-factor is calibrated to reflect the industry's long-run TFP trend.
One practical advantage of this formula is that data on price trends are available in a more timely fashion than data on industry TFP trends. It is thus possible to have an inflation measure that reflects the latest developments, while the X-factor reflects only long-term TFP trends. Having X reflect the long-run TFP trend sidesteps the need for more timely data and avoids annual TFP calcu- lations. It also smoothes the effect on unit cost of short-run demand shifts.
Now let us consider the implications of using a macroeconomic inflation measure in lieu of an industry-specific measure. Suppose, for example, that the GDPPI is used as the inflation measure. Index logic implies that the trend in a .PC1 that honors the competitive market standard should then conform to the fol- lowing formula. l7
-- - -
17. The economy can reasonably be expected to earn, in the long run, a competitive return. Index-
20021 PERFORMANCE-BASED REGULATION
TrendPCI = Trend GDPPI- [ ( T r e n d T ~ P ' " ~ ~ ~ ~ ~ - ~ r e n d T F P " " ) Economy + (TrendInputPiices - Trendlnptt ~ i i c e , ? ' ~ ~ ~ * ~ ] ( 5 )
= TrendGDPPI- X
The X-factor in this case contains multiple terms. One is the difference be- tween the TFP trends of the industry and the economy, which is sometimes called the "TFP differential." The second term is the difference between the in- put price trends of the economy and the industry, which is sometimes called the "inflation differential." X is larger, slowing PC1 growth; the larger are both terms.
Even when developing a PC1 that uses a macroeconomic inflation measure, the issue of whether short-term or longer term trends should be tracked remains relevant. It is customary for the inflation measure to track recent trends and for the TFP differential to track long-term trends. The practice regarding the infla- tion differential is less established. Inflation in the input prices of the economy and capital-intensive industries like energy distribution can differ substantially in the short-term and medium-term, so an inflation differential that reflects more recent historical differences can lead to an unusually high or low X-factor. Unfortunately, the trend in the recent past may not be a good indicator of the trend during the PBR plan. In the past twenty years, for example, the trend in the input price index of the U.S. economy has, by some measures, been more rapid than the trend for capital-intensive industries like energy distribution due to a secular decline in interest rates. Information from input price forecasts, how- ever, suggests that any such differential is unlikely to continue.
Although an extreme value for the inflation differential is attractive to the benefiting party, either customers or shareholders, it is apt to lead to considerable X-factor volatility down the road. The injured party will inevitably suspect that the rules for X-factor calibration will be revised before X would be allowed to swing sharply in the opposite direction. One means of resolving this problem is to base the inflation differentials on inflation trends in the very long run, such as over a thirty-year period. Another is to base it on input price forecasts.
3. Early History
The earliest use of this index logic emerged from hearings before U.S. fed- eral regulatory commissions. As early as 1980, the Interstate Commerce Com- mission (ICC) proposed to determine allowable increases in rail freight rates us- ing the average increase in rail carrier costs.18 The Staggers Rail Act of 1980 was noted above to require index-based regulation for larger railroads. The law established a Zone of Rate freedom for certain rail services. Under section 203 of the Act, the boundary of this zone was to be adjusted each quarter by an "In-
ing logic then suggests that the input price inflation of the economy exceeds GDPPI inflation by the econ- omy's TFP growth.
18. Railroad Cost Recovery Procedures, 49 CFR $1 135.1 (Aug. 22,2002).
416 ENERGY LAW JOURNAL [Vol. 23:399
dex of Railroad Cost . . . compiled or verified by the Commission, with appro- priate adjustments to reflect the changing composition of railroad costs, includ- ing the quality and mix of material and labor . . . ."I9 The growth rate of this in- dex came to be called the Rail Cost Adjustment Factor (RCAF).
There was vigorous and protracted debate before the ICC regarding the ap- propriate form of this index. The most fundamental issue was whether the index should reflect the trend in the TFP of the industry as well as the input price trend. An index reflecting both would track the unit cost of the industry, as noted above.
In 1989, the ICC concluded that the index should reflect the TFP trend of the railroad industry as well as its input price trend.20 The X-factor it adopted is a moving average of the growth rate in an index of railroad industry TFP, as noted above. The index measured the productivity of the very companies that were subject to the PBR plan. The staff of the Surface Transportation Board, successor to the ICC, now computes the index. However, the plan is no longer operative since the railroads have exercised options contained in the plan to exit it.
The Federal Communications Commission (FCC) has issued landmark de- cisions on PC1 design that are broadly consistent with the principles established in the railroad case. In approving the price cap plan for AT&T in 1989:~ infla- tion measures and industry TFP trends were discussed extensively.22 The X- factor reflected the industry productivity trend and an inflation measure adjust- ment.
In approving rate indexing for the interstate services of LECs, the need to calibrate the PC1 to the industry unit cost standard was explicitly recognized. For example, in a 1995 order dealing with the PC1 for LECs, the FCC states that "[tlhe indexes are adjusted each year in accordance with a formula that accounts for industry-wide changes in unit costs."23
Since the approval of the first plans at the federal level, rate-cap plans have been adopted by a number of other regulatory commissions. The industry unit cost standard is frequently observed in PC1 design. Commissions sometimes recognize the standard explicitly. Thus the Massachusetts Department of Public Utilities (DPU), in approving a rate-cap plan for NYNEX, notes that, "price cap regulation replaces company- specific, test year cost-based control of a f m ' s rates with an index representing the expected changes in costs for the average firm in the industry."24
The California Public Utilities Commission states, in approving the rate-cap plan for Southern California Edison, that:
19. Staggers Act, supra note 8 , § 203(a)(2)(B) at 1901. 20. Railroad Cost Recovery Procedures-Productivity Adjustment, 5 I.C.C.2d 434 (1989). 21. In re Policy and Rules Concerning Rates for Dominant Carriers, CC No. 87-313 (1989) (codi-
fied at 47 C.F.R. pts. 61,65,69). 22. The affected rates of AT&T were subsequently decontrolled. 23. In re Price Cap Performance for Local Exchange Caniers, 10 F.C.C. Rcd 8961,8965 (1995). 24. New England Tel. & Tel. Co., Mass. D.P.U. 94-50,45 (1995).
20021 PERFORMANCE-BASED REGULATION
[Tlhe price and productivity values should come from national or industry meas- ures and not from the utility itself. The independence of the update rule from the utility's own costs allows PBR regulation to resemble the unregulated market where the firm faces market prices which develop independently of its own cost and productivity . . . The ~~oductivity measure should come from a forecast of industry- specific productivity.
In Canada, the Canadian Radio and Telecommunications Commission (CRTC) has also subscribed to the industry unit cost standard. In its order ap- proving the rate-cap plan for the Stentor Companies, the CRTC states that, "the price cap formula is composed of three basic components which, in total, reflect changes in the industry's long-run unit costs."26
4. Total Factor Productivity (TFP)
The TFP index of a utility industry is the ratio of its output and input quan- tity indexes.27 The output quantity index measures the trend in the amount of work performed by the industry. The output of energy distributors, for instance, will typically grow with the number of customers served. An input quantity in- dex measures the trend in the amounts of labor and capital services and other in- puts used to provide service. The growth in the TFP index is then the difference between the growth rates of the output and input quantity indexes.28 TFP grows if output growth exceeds input growth.
A representative study of industry TFP trends was recently filed by Bangor Hydro-Electric in support of a proposed PBR plan. The primary source of the data for the study was the FERC Form 1, which every major investor-owned electric utility in the United States is required to file annually. The U.S. Energy Information Administration (EIA) has published selected Form 1 data for several years in a document series currently entitled Financial Statistics of Major US. Investor-Owned Electric Utilities. Research data were also obtained from the U.S. Department of Commerce and Whitrnan, Requardt, and Associates.
The data was used to calculate the TFP trend of the northeast power distri- bution industry. Two definitions of the northeast were considered: (1) New Eng- land and (2) New England plus New York. The sample period was 1988-1999.
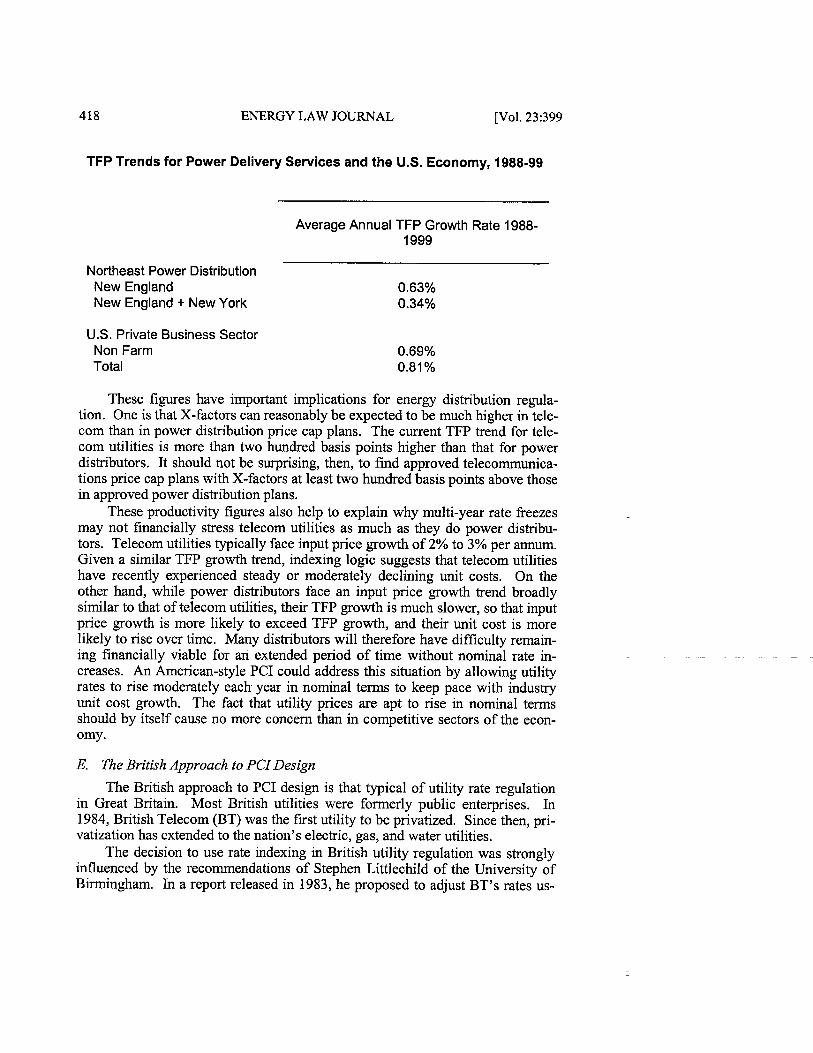
The following table presents the 1989-1999 growth trends in the power dis- tribution TFP indexes computed for the northeast, as well as the multi-factor pro- ductivity index for the U.S. private business sector over a similar period. It can be seen that the 0.63% growth trend in the TFP of New England power distribu- tors was similar to that for the private business sector. The trend in the TFP of New England and New York distributors combined was somewhat slower.
25. Re Southern Cal. Edison Co., 172 P.U.R.4th 393,402 (Cal. P.U.C. 1996). 26. Telecom Decision, supra note 11, at 729. 27. All indexes in this discussion are assumed to measure trends in the values of economic vari-
ables over time. 28. Equation 3 above implies that TFP growth can also be calculated as the rate at which input
price growth exceeds unit cost growth.
418 ENERGY LAW JOURNAL [Vol. 23:399
TFP Trends for Power Delivery Services and the U.S. Economy, 1988-99
Average Annual TFP Growth Rate 1988- 1999
Northeast Power Distribution New England 0.63% New England + New York 0.34%
U.S. Private Business Sector Non Farm Total
These figures have important implications for energy distribution regula- tion. One is that X-factors can reasonably be expected to be much higher in tele- com than in power distribution price cap plans. The current TFP trend for tele- com utilities is more than two hundred basis points higher than that for power distributors. It should not be surprising, then, to find approved telecomrnunica- tions price cap plans with X-factors at least two hundred basis points above those in approved power distribution plans.
These productivity figures also help to explain why multi-year rate freezes may not financially stress telecom utilities as much as they do power distribu- tors. Telecom utilities typically face input price growth of 2% to 3% per annurn. Given a similar TFP growth trend, indexing logic suggests that telecom utilities have recently experienced steady or moderately declining unit costs. On the other hand, while power distributors face an input price growth trend broadly similar to that of telecom utilities, their TFP growth is much slower, so that input price growth is more likely to exceed TFP growth, and their unit cost is more likely to rise over time. Many distributors will therefore have difficulty remain- ing financially viable for an extended period of time without nominal rate in- creases. An Arnerican-style PC1 could address this situation by allowing utility rates to rise moderately each year in nominal terms to keep pace with industry unit cost growth. The fact that utility prices are apt to rise in nominal terms should by itself cause no more concern than in competitive sectors of the econ- omy.
E. The British Approach to PCIDesign
The British approach to PC1 design is that typical of utility rate regulation in Great Britain. Most British utilities were formerly public enterprises. In 1984, British Telecom (BT) was the first utility to be privatized. Since then, pri- vatization has extended to the nation's electric, gas, and water utilities.
The decision to use rate indexing in British utility regulation was strongly influenced by the recommendations of Stephen Littlechild of the University of Birmingham. In a report released in 1983, he proposed to adjust BTYs rates us-
20021 PERFORMANCE-BASED REGULATION 419
ing an index with a growth rate formula of "RPI-X form. 29 The RPI term is the inflation in the Retail Price Index, which is Britain's consumer price index. A specific value for X was not recommended, nor was there significant discussion in Littlechild's paper of the appropriate framework to be used to determine X. Rather, the value for X was described as "a number to be negotiated."30 The lack of a well-defined framework has given British regulators considerable discretion in determining X-factors. Over time, however, broadly similar approaches have developed for the energy utility industries.
Under "British-style" rate indexing, rate cases are held at regular intervals that usually last five years. The rate case involves multi-year cost forecasts. The principle "building blocks" of the total cost forecast are the forecasts of the value of the current capital stock and of capital spending, depreciation, the return on capital, and O&M spending. A macroeconomic inflation index such as Britain's RPI is used as the inflation measure of the price cap index. Given the forecasts of total cost, billing determinants, and the RPI, it is possible to choose a combi- nation of initial rates and an X-factor such that forecasted revenue equals fore- casted cost.
This procedure might be characterized as five-year cost of service regula- tion in which indexing is used only to increase regulatory lag. However, British regulators have made increasing use of statistical benchmarking to further exter- nalize regulation. In the case of power distribution, for instance, statistical methods are used to compare the efficiency of British distributors. The results of these studies have a bearing on the allowed cost of ser~ice.~ ' The use of bench- marking in Britain has proven more complicated for industries, like power and gas transmission, in which the only available peers are in other countries.
F. Price Caps and Marketing FlexibiIity
A major attraction of price cap plans is the potential for enhanced marketing flexibility. As discussed in subsection 2 infia, price caps can enhance the mar- keting freedom of a utility since the allowed escalation in rates for regulated ser- vices is determined by an external mechanism. This reduces potential concerns with cross-subsidization that result when a utility's own unit cost data are used to set prices. Utilities can benefit from greater marketing freedom to enhance the market responsiveness of rate and service offerings. Fewer marketing restric- tions also allow diversification projects to be pursued in the most cost-effective manner, either through the utility or affiliated companies. The amount of market- ing flexibility afforded by a price cap plan depends greatly on the details of the plan.
- -
29. Stephen C. Littlechild, Regulation of British Telecommunications' Profitability: Report to the Secretary of State (London: Dept. of Industry, 1983).
30. Id. 31. Statistical benchmarking is also used increasingly in North American PBR. An early use of
benchmarking methods was in the PBR proceeding leading to the rate-cap plan for Boston Gas. The com- pany used the results of benchmarking to argue against the addition of an "accumulated inefficiencies fac- tor" to the X-factor. The Ontario Energy Board is currently considering the integration of benchmarking methods into its PBR procedures.
420 ENERGY LAW JOURNAL [Vol. 23:399
1. Automatic Rate Redesign and Rebalancing
The rates that most American utilities charge are inconsistent with the known structure of their cost. This is especially true of the power transmission services and power and gas distribution services that have only recently been un- bundled. Quite often, rates for energy distribution could be made more efficient by raising customer charges relative to usage charges and by implementing us- age charges that reflect the time of use.
Although restructuring proceedings provide an opportunity to get rates for wires and pipe services "right," practical considerations can prevent this from happening. An abrupt change in the design of rates may be undesirable. A de- tailed review of rate design considerations may also be a relatively low priority as the parties to the proceeding grapple with more pressing restructuring issues. The design of rates may redistribute cost responsibility in ways that are politi- cally unpopular.
A rate-cap plan makes it possible to redesign rates for utility services gradually and automatically. The API that is capped can summarize the overall escalation in the prices of a service basket and adjustments in individual rate elements need not be re~tr ic ted.~~ If an API for an energy distribution service is allowed to rise by 2%, for instance, it might be possible to raise the customer charge more rapidly than this so long as the volumetric charge rose less rapidly.
Some regulators may want to limit these rate design freedoms. In the case of energy distribution, a common concern is that higher customer charges can disadvantage small-volume customers. In such a case, regulators may place side conditions on allowed changes in certain rates or rate elements in order to protect certain customers or customer classes. For example, customer charges could be limited to the growth in the PC1 plus 5%.
A related source of marketing flexibility is rate rebalancing. Rebalancing occurs when some service prices grow more rapidly than the PC1 and other ser- vice prices grow less rapidly. However, as with rate redesign, regulators may want to restrict rebalancing in order to protect the interests of affected customer groups. Rebalancing can be controlled with side conditions that limit the growth in prices for particular services. Rebalancing can also be controlled by reducing the scope of baskets. The potential to rebalance rates is effectively eliminated when each service constitutes a separate basket. The lesson to be learned is that an indexing plan provides a ready vehicle for controlling the amount of rebalanc- ing that occurs.
2. Optional Rates and Services
A second source of market flexibility under rate-cap regulation is the intro-
32. Utilities can choose from among a number of alternative methods for computing the API of a particular service basket. Important criteria to use when selecting an appropriate API calculation method- ology may include: 1) ease of computation; 2) the extent to which the API accurately measures the change in customer welfare from utility pricing policy; and 3) the extent to which a particular API method gives companies "credit" for discounts that may be allowed under the plan (discounts generally receive more weight in API calculations when the index accounts for consumption increases that result from price de- clines).
20021 PERFORMANCE-BASED REGULATION 42 1
duction of optional rates and services. These can be subject to light-handed regulation or, in the extreme, decontrolled. Several kinds of optional offerings may reasonably be considered such as: optional tariffs for regulated services, new services, unusually complex service packages, or services to competitive markets. Economists studying price cap regulation have found that it can sub- stantially mitigate the cross-subsidy concerns that these offerings raise under COSR. This is because prices charged are not linked directly to costs, and utili- ties have no incentive to manipulate cost allocations in a manner that creates cross subsidies.33
G. Evaluation
Rate caps can generate utility performance incentives much stronger than those obtained under typical cost of service regulation. One reason is that incen- tives are comprehensive so that a wide range of cost containment, product devel- opment, and marketing initiatives are encouraged. Another is that indexing can facilitate an extension of the period between rate cases. To the extent that this is true, improved unit cost performance does not reduce allowed price escalation. The benefits of improved performance can thus go straight to the bottom line.34 The potential impact on productive and allocative efficiency is substantial. The actual incentive effects of rate caps depend greatly on plan details. For example, incentives increase with the length of the indexing period and with the introduc- tion of post plan sharing provisions.
Rate caps can provide a further boost to efficiency by permitting a relaxa- tion of operating restrictions. The case of marketing flexibility is illustrative. To the extent that rate restrictions are external, customers of monopoly services can be insulated from the effects of a company's operations in competitive markets. This reduces concerns about cross subsidization. Light-handed regulation of utility rates for non-core services is then possible. A company can also have more leeway in its purchases from affiliates and its depreciation practices.
Rate caps also facilitate rate redesign. As noted above, a wide range of rate element adjustments is consistent with a given rate of allowed price increase. A company will typically use these freedoms to move usage charges downward in the direction of marginal cost. The consequence should be a boost in usage and a reduction in the risk of volume fluctuations.
Rate caps can reduce regulatory cost. Some startup costs must, of course, be incurred to master the new regulatory system. These may include a close monitoring of the company's operations during the terms of the first indexing plans. But the frequency of future rate cases can be substantially reduced. Fur- thermore, reliance on external indexes diffuses inherently controversial cost allo- cation and transfer pricing issues. On the other hand, controversy can be consid- erable over alternative methods for measuring input price and productivity growth.
33. Ronald R. Brauetigam & John C. Panzar, Diversijication Incentives Under "Price-Based'' and "Cost-Bases' Regulation, 20 RAND J. OF ECON. 373 (1989).
34. Central Maine Power executives have noted the sfiking effects of price caps on performance incentives and corporate culture in a series of public appearances.
422 ENERGY LAW JOURNAL [Vol. 23:399
The numerous inherent advantages of rate caps are offset to some degree by disadvantages. One is regulatory risk. In this paper we have described two sen- sible approaches to PC1 design that should mitigate regulatory risk. However, the novelty of rate indexing still invites regulators to choose important plan terms arbitrarily. These reduce the willingness of parties to try the rate-indexing option and can weaken the incentive benefits of price cap plans substantially. A rate freeze is a sensible alternative to indexing in jurisdictions where this is a concern but is not suitable in all times and places, as has been noted.
Rate caps also involve business risk such as the possibility that price restric- tions will not track trends in external business conditions that affect a company's unit cost. Relevant business conditions include weather, the business cycle, prices of competing energy products, and government policy. Windfall gains and losses may occur if the PC1 does not reflect changes in these conditions.
Business risks can be mitigated through careful plan design and empirical research supporting key plan parameters. For example, an industry-specific in- flation measure will track fluctuations in input prices better than a macroeco- nomic measure. An X-factor based on a regional rather than a national TFP trend may better reflect local economic activity. The Z-factor should reflect changes in government policy as noted earlier. An earnings-sharing mechanism can also mitigate business risk, as we discuss further below. However, some windfalls may occur even if the plan is well supported and designed. Ironically, this is another way in which rate-cap plans mimic competitive markets.
A. Comprehensive Revenue Caps
1. Description
Under a comprehensive revenue cap it is the revenue of the company and not its rates that is the focus of restriction. Service offerings and the fashioning of rates from revenue can, in fact, continue using traditional methods. The addi- tion of a balancing account mechanism can ensure that actual revenues are simi- lar or equal to the revenue requirement. The balancing account contains the value of any mismatch between actual revenue and the revenue requirement until rates can be adjusted to eliminate it. This is sometimes called a revenue- decoupling mechanism since it severs the link between revenue and efforts to market regulated services.35
The growth of allowed revenue is usually limited using an index. The in- dex formulas commonly feature an inflation measure, an X-factor, and a Z- factor. As with rate caps, the indexes can be designed using either an American or British approach.
Compared with the rate indexing formula presented earlier, a growth rate formula for a revenue cap index requires some adjustment to reflect the effect of
35. Decoupling mechanisms have also been used in the absence of indexing. Prominent examples include the electric revenue adjustment mechanisms that have been used in California and Maine.
20021 PERFORMANCE-BASED REGULATION 423
output growth on cost. An explicit term for such an adjustment may be called an output factor, which is denoted by Y. An index-based restriction on revenue re- quirement growth may then be written:
A Revenue Requirement = P - X + Y f Z .
The X and Y terms, as here described, are sometimes captured in a consolidated X. IfXhappens to be similar to the expected growth of output (i.e., Y = X ), the formula can be simplified to:
A Revenue Requirement = P f Z .
Some revenue cap indexes therefore do not contain X or Y factors. Because of these practices, X-factors from revenue cap plans must be used
carefully in plan comparisons. Some plans restrict growth in revenue per cus- tomer. This is equivalent to revenue requirement indexing where the growth rate in the number of customers is the output factor.
2. Precedents
a. United States
A revenue per customer indexing plan has been approved for the gas delivery services of Southern California Gas (Cal.). The company had pro- posed price caps but a revenue cap was deemed more consistent with its previous regulatory commitments. A comprehensive revenue cap plan be- gan in 1998 for the power distribution services of PacifiCorp in Oregon. The X-factor in this plan emerged from negotiations. Energy conservation was an especially important issue in the evolution of this plan.
b. Canada
The NEB of Canada has approved comprehensive revenue caps for two oil pipelines, Enbridge Pipelines (formerly Interprovincial Pipe Line) and TransMountain Pipe Line. Plans for both companies resulted from set- tlement agreements. There is no evidence that industry unit cost trends were explicitly considered.
c. Britain
The power transmission services of National Grid have been subject to revenue caps since 1993. All regulated transmission services were origi- nally subject to revenue caps. System operation services were exempted from revenue caps at the most recent plan update.
d. Australia
Revenue requirement indexing has also been approved for the power transmission services of Energy Australia, Powerlink Queensland, and
ENERGY LAW JOURNAL [Vol. 23:399
Trans Grid in Australia. The inflation factors in all of these plans are con- sumer price indexes. Plan updates have been fashioned in the British style. The current X-factor for TransGrid is designed to compensate the utility for exceptional capital expenditures that are anticipated in the development of a national energy market.
3. Evaluation
Comprehensive revenue caps can create strong incentives for cost contain- ment by permitting operation for an extended period with an externalized reve- nue requirement. The extent of externalization depends on other plan provisions, including those for benefit sharing and plan termination. There are incentives for a wide range of cost containment initiatives. The external basis for the reve- nue cap also encourages some forms of operating flexibility. For example, ex- tended utility operation under a revenue cap could permit a regulator to relax its concern about the terms of purchases from an unregulated affiliate.
The main difference between the consequences of rate and revenue index- ing lies in the area of allocative efficiency. One reason is that revenue caps fo- cus on an incorrect measure of consumer welfare. Consumer welfare is properly measured as "consumer surplus," or the difference between the value received and the expenditure on a product. Consumer surplus always increases when prices decline, but this is not always true for lower customer bills (equal to total company revenues when summed over all customers) because the quantities pur- chased may, for whatever reason, be less. When the demand for a good is elas- tic, price declines lead to increases in both consumer surplus and total expendi- tures on the product. Revenue cap regulation therefore focuses on a variable (the sum of customer bills) that is fundamentally flawed as a welfare measure. In contrast, price cap regulation controls the escalation in utility prices and hence has a direct link to the welfare of utility customers.
A company is apt to continue facing restrictions on the development of market responsive rates and services. If the plan includes a revenue decoupling mechanism, incentives for an improved marketing performance will also be compromised. Marketing incentives may, in fact, be weaker than under cost of service regulation. For example, reducing volumetric charges in the direction of marginal cost will, by raising total revenue, promptly lower rates.
Revenue indexing can raise more concerns than rate caps about the quality of utility services. As with rate caps, service quality may suffer because there are strong incentives to cut costs. While the pressures to minimize costs are the same under rate and revenue caps, under the latter approach, revenues that are lost if poor service leads to fewer sales can be recovered through price increases on remaining customers using the balancing account. Since this is not possible under rate caps, the incentives to maintain service quality are weaker in the ab- sence of counterbalancing incentive provisions.
Revenue indexing that is tied to a revenue decoupling mechanism reduces windfall gains and losses from demand fluctuations. This stabilizes company earnings and can thereby lower capital cost, but in the process, it destabilizes rates. For example, a recession in the service territory can place upward pressure on rates.
20021 PERFORMANCE-BASED REGULATION 425
Another important attribute of decoupling is its ability to strengthen incen- tives to promote energy conservation. Conservation is an important goal in some jurisdictions. However, there are other methods for promoting energy conserva- tion. One possibility is appending a targeted benchmark incentive for demand- side management to a comprehensive price cap plan. The costs of this program can be collected via a Z-factor. Such an incentive mechanism can be used to achieve conservation objectives without having the same implications for alloca- tive efficiency as revenue caps.
Consideration may be finally paid to the issue of regulatory cost. Revenue indexing can permit economies in the cost of regulation relative to the cost of service approach. However, regulatory cost is likely to be somewhat greater than under rate indexing. The main reason is the continued need to approve the allocation of revenue requirements between customer groups, service offerings, and rate design.
B. Non-Comprehensive Revenue Caps
1. Basics
Under non-comprehensive revenue caps there are caps on only a portion of the company's rates or revenue requirement. An example might be a cap on the revenue requirement (allowed cost) for O&M expenses. As with comprehensive revenue caps, partial caps are usually fashioned using indexes. In the event of indexing, an adjustment for output quantity growth is once again needed. Partial indexing plans typically do not address rate and service offerings. Utilities therefore typically require authority outside of partial rates and revenue caps to alter these offerings. Design of a partial revenue cap index involves the usual choices of an inflation measure, X-factor, and Z-factor. The inflation measure in a revenue cap index for energy procurement would presumably be sensitive to changes in energy prices.
2. Precedents
a. United States
An important early example of non-comprehensive revenue caps is the first PBR plan for San Diego Gas and Electric. This plan, which applied to both gas and electric services, was approved in 1994. It has been claimed that the term "performance based ratemaking" was coined by San Diego personnel during this plan's development.
The plan included index-based adjustments for revenue requirements corresponding to allowed O&M expenses and capital spending. Separate O&M indexing mechanisms were specified for gas and electric operations. The mechanisms included inflation factors, X-factors, and adjustments for output growth.
b. Canada
Non-comprehensive revenue caps have been more widely used in
426 ENERGY LAW JOURNAL [Vol. 23:399
Canada than in the United States. BC Gas began operating under caps for certain categories of base rate revenue in 1994. The caps pertained to O&M expenses and small capital expenditures. BC Gas also operates under a revenue decoupling mechanism called the Revenue Stabilization Adjust- ment Mechanism. It applies only to revenues from residential and commer- cial sales.
The NEB approved a non-comprehensive revenue cap plan for gas transmission services for Westcoast Energy in 1996. Indexing limited growth in the revenue requirement components covering O&M expenses and small capital additions. The formula for growth in both revenue cap indexes was forecasted inflation in a CPI. There were no explicit X or out- put factors in the formula.
The Alberta commission has approved non-comprehensive revenue caps for NOVA Gas Transmission. The caps apply to O&M expenses and small capital additions. A plan was approved for the gas delivery O&M expenses of Toronto-based Consumers Gas in 1998.
3. Evaluation
Non-comprehensive revenue caps can substantially externalize revenue re- quirements in the targeted areas. The full degree of externalization depends on other plan provisions, including plan termination and benefit sharing measures. The approach can focus management attention on specific problems and help ac- celerate their rectification. A partial indexing approach is also useful where there is consensus only on PBR for certain areas of the company's business. If the scope of regulation is changng, for instance, plans may be designed to focus only on areas subject to continuing regulation.
Non-comprehensive revenue caps can also permit increased operating flexi- bility in some areas. Suppose, by way of example, that a utility wishes to play an asset manager role and purchase numerous O&M services from unregulated affiliates. A cap on allowed O&M expenses can then permit relaxed vigilance on service transfers without placing recovery of capital cost at risk.
One potential problem with partial revenue caps is the unevenness of per- formance incentives. There will, at a minimum, be no special incentives to mar- ket or to control cost in non-targeted areas. At worst, the company may be given an incentive to improve performance in the targeted areas at the expense of per- formance in other areas. If a utility were subject only to a cap on O&M revenue, for instance, excessive capital spending could be undertaken to reduce O&M ex- penses. Overall, the company's performance might not improve.
This problem is mitigated to the extent that the partial caps cover most areas of controllable cost. For example, plans covering both O&M expenditures and capital expenditures have been defended on the grounds that they cover all "con- trollable" costs. However, plans approved to date have typically not extended to major capital additions.
By itself, partial indexing also does not improve allocative efficiency rela- tive to cost of service regulation. As noted above, partial indexing approaches do not typically provide for the pricing and marketing flexibility that is helpful in achieving allocative efficiency. Partial indexing also does not create strong in-
20021 PERFORMANCE-BASED REGULATION
centives for aggressive product development and marketing.
VI. BENCHMARK REGULATION
A. Benchmarking Basics
Benchmark regulation involves the evaluation of one or more indicators of company activity using external performance standards (benchmarks). The stan- dards are external to the extent that they are insensitive to the actions of subject utility managers. Evaluations and rate adjustments are accomplished by formal mechanisms that are established in advance of use and typically function for sev- eral years.
The key features of a benchmark plan are the performance indicators, the performance benchmarks, and the rate adjustment mechanism. The performance indicators used in approved benchmark plans vary greatly in scope. Plans are comprehensive to the extent that they cover all of the utility performance dimen- sions that matter to customers.
The performance benchmarks used in benchmark plans are also varied. A common benchmark is a company's activity level in a period just prior to plan commencement. A company is rewarded for improvement in its performance relative to recent history.
An alternative approach, which is an example of "yardstick regulation" or statistical benchmarking, is to use the corresponding performance indicator of a group of utilities. Under this approach, a company is rewarded for improving its performance indicator relative to the group. The utility group is sometimes called a peer group, but can consist of all utilities in the same region as the com- pany subject to the plan. In that event, the peer group may be viewed as a proxy for the regional industry. In principle, the region can also be the entire nation.
The rate adjustment mechanisms in approved benchmark plans vary. A ma- jor design issue is the customer sharing percentage. The mechanism may or may not feature a deadband in which deviations fiom the benchmark do not induce rate adjustments.
Benchmarking plans provide supplemental adjustments to rates rather than serving as the sole basis for rate adjustment restrictions. Several rate adjustment mechanisms can, in principle, coincide with a benchmarking plan. At one ex- treme, rates may be adjusted for the actual trend in a company's unit cost. At the other, rates may be predetermined for several years.
B. Comprehensive Benchmark Regulation
1. Description
A comprehensive benchmark plan is one in which benchmarking mecha- nisms cover substantially all facets of company performance that matter to cus- tomers. Comprehensiveness can be achieved by having a large number of indi- cators that cover separate performance dimensions, or by having a small number of broadly focused indicators.
Retail price indexes, unit cost indexes, and TFP indexes are examples of
428 ENERGY LAW JOURNAL [Vol. 23:399
broad-based performance indicators. A basic unit cost index is the ratio of total utility cost to a utility output quantity index. Unit cost indexes can also rigor- ously incorporate additional utility performance dimensions that may influence customer welfare. These include service quality, environmental degradation, and the promotion of conservation. Conceptually, a benchmark plan with such a "master index" can be separated into a plan with a set of consistent non- comprehensive performance variables and associated weights. Decomposing a master index in this manner does not affect its incentive properties.
The following two relations detail an interesting example of the relationship between the award mechanism and the primary rate adjustment mechanism:
Here APNDxaWard is the adjustment in the utility's output price escalation due to the award. It is proportional to the difference between the growth rates in UCNDX external (a unit cost index benchmark) and in the unit cost index of the company. The award rate, a , may assume a value between zero and unity. Thus, it determines the share of the measured performance improvement that is kept by the utility. If a = 1, the utility keeps all of the benefits of improving its performance relative to the unit cost benchmark. If a = 0, the utility keeps none of the benefits.
Assume, now, that other than the award mechanism, the escalation in a company's rates is approximately equal to the growth in its unit cost index. The escalation in a company's price index is then given by:
It can be seen that the allowed inflation in a company's output price index (PNDXCompanY.) is approximated by a weighted average of the inflation in its unit cost index and in the external unit cost standard. The weights assigned to each category depend on the award rate. If a = 0, inflation in the output price index is approximated by the inflation in a company's unit cost index. This may be termed "cost plus" regulation. If a = 1, output price escalation is approximated by the growth in the external unit cost standard. This is a form of rate indexing.
The plan described in these relations therefore places a utility on a contin- uum between a variant of cost of service regulation (one without prudence re- views) and a variant of index-based regulation ("pure" price caps without dis- counting). That is, comprehensive benchmark regulation provides an opportunity to move "part way" towards rate indexing.
20021 PERFORMANCE-BASED REGULATION
2. Precedents
a. United States
Several comprehensive benchmark incentive plans have been ap- proved for U.S. energy utilities. Included are plans for Mississippi Power, Niagara Mohawk Power, Northern States Power, and Otter Tail Power. All of the plans involve multiple performance indicators. The Mississippi Power plan is noteworthy for being an early and influential example of the genre. The Niagara Mohawk plan is noteworthy for using unit cost indexes for other gas and electric utilities as benchmarks for evaluating the com- pany's unit cost performance. This was an early formal use of statistical benchmarking in U.S. regulation.
b. Canada
A plan for West Kootenay Power was approved in 1996. Benchmarks were developed for a sizable number of narrowly defined cost categories. Different inflation measures, X-factors, and output factors were used to construct the benchmarks. An Incentive Adjustment Mechanism reduced business risk by sharing differences between Target Cost and Actual Cost with customers.
3. Evaluation
Comprehensive benchmarking has the potential to strengthen utility per- formance incentives relative to cost of service regulation with short rate case cy- cles. Incentives are potentially balanced and comprehensive so that companies are guided to pursue the most promising of a wide range of performance im- provements. For instance, companies can work to beat a unit cost or productiv- ity benchmark through old-fashioned cost cutting or aggressive marketing to boost the usage of system capacity.
Comprehensive benchmarking can also help to extend the period between rate cases by sharing deviations of actual performance fiom targeted perform- ance using an automatic mechanism. This reduces regulatory and business risk in a manner that may predispose interested parties to agree on longer periods be- tween plan reviews. The reduction in risk is, of course, valuable in its own right.
The actual effects of comprehensive benchmarking on performance incen- tives depend on plan details. The other provisions for rate adjustments are espe- cially crucial. Incentives are weakened to the extent that other rate adjustment provisions involve regulator discretion. This is because regulators with discre- tion can respond to large performance awards by taking a tough line on other rate adjustments. A company will view this as an expropriation of benefits with dis- incentive consequences. Another plan detail with important incentive conse- quences is the share of the benefits of improved performance that is due to cus- tomers. Incentives weaken as the customer share rises. However, incentives can be strengthened relative to cost of service regulation if the benchmarking plan permits an extension of the period between rate cases.
We should also consider the extent to which comprehensive benchmarking
430 ENERGY LAW JOURNAL [Vol. 23:399
can reduce regulatory cost and ease inefficient restrictions on operating flexibil- ity. The sharing of performance gains under a benchmarking mechanism can raise awkward issues of cost allocation and transfer pricing. Resolving these is- sues can raise regulatory cost and may lead to operating restrictions. Compre- hensive benchmarking also does not, by itself, allow for rate redesign or the in- troduction of new rates and services.
C. Service Quality Benchmarking
1. Description
Service quality is becoming an important issue in utility regulation. A re- port issued by North American regulators states that "[alttention to service qual- ity will be of greater importance as competitive markets proliferate and financial regulation dim in is he^."^^ Service quality incentives designed to maintain or im- prove the quality of utility services can be either a stand-alone PBR application or a component of broader PBR packages.
A service quality incentive mechanism is a form of benchmark PBR which rewards or penalizes a utility depending on the relationship between its measured quality of service and quality benchmarks. There are three basic elements in a service quality incentive plan: a series of indicators of the company's quality of service, an associated set of quality benchmarks, and an award mechanism that leads to changes in utility rates or allowed returns. The indicators are measur- able service quality dimensions. The benchmarks are the standards against which the indicators are judged. They can be based on the company's historical performance, industry norms, or levels that are deemed to be acceptable for other reasons. An award mechanism determines the adjustment in rates that is war- ranted by the change in service quality. Important design issues include the symmetry of awards and penalties, and the customers' valuation of specific qual- ity indicators.
A critical issue in the development of an effective service quality incentive plan is the choice of indicators on which performance will be judged. Ideally, individual quality indicators should satisfy three criteria: 1) they should be re- lated to the relevant aspects of service; 2) they should focus on monopoly ser- vices; and 3) they should cover all major quality dimensions.
First, since measured service quality can ultimately affect customer rates, indicators should be linked to aspects of utility service that customers actually value. This may seem obvious, but a strict application of this criteria excludes indicators that have been included in some plans. For instance, the knowledge and courtesy of phone center employees may be a legitimate quality indicator, but the goal of establishing worker training programs to build these skills is not. By the same token, quality indicators should depend on qualityper se and not on other aspects of distribution service. This has implications for the appropriate use of customer satisfaction surveys, since expressed satisfaction levels can de-
36. THE NATIONAL REGULATORY RESEARCH INSTITUTE, MISSIONS, STRATEGIES, AND IMPLEMENTATION STEPS FOR STATE PUBLIC UTILITY COMMISSIONS IN THE YEAR 2000: PROCEEDINGS OF THE NARUC 95-8 (NRRI 1995).
20021 PERFORMANCE-BASED REGULATION 43 1
pend on the perceived fairness of prices. In the case of power distribution, satis- faction can even depend on competitive transition charges and prices in the bulk power market. If survey results reflect price perceptions, they may create a kind of "double counting" of warranted price changes and, therefore, be inappropriate for use in incentive plans.
Second, indicators should focus on the quality of the activities for which there are few, if any, alternative suppliers. This is consistent with the principle that regulation, including regulation of service quality, is less necessary in com- petitive markets. Market forces are likely to create acceptable quality levels when products are available from multiple providers.
Third, quality indicators should not focus on some areas while ignoring others because performance may deteriorate in the non-targeted areas. Compre- hensiveness can be achieved simply by adding indicators to a plan. However, regulatory costs often rise accordingly since more utility and commission re- sources must be devoted to quality monitoring and measurement of quality indi- cators. Some commissions have been sensitized to the regulatory costs of com- plex service quality plans. In these jurisdictions, service quality incentives have been simplified by relying on fewer, but more broadly-based, indicato~-s.37 While the specific indicators may vary widely among approved service quality incentive plans, there are broad similarities between the types of indicators used for energy utilities. We have found it useful to group service quality indicators into seven broad categories.
Reliability indicators measure the continuity of the basic service. Electric utilities are expected to provide a continuous power supply at all times, so inter- ruptions in power supply constitute a diminution in service quality. Reliability is often measured by the frequency and duration of power interruptions.
Non-emergency on-site services pertain to non-safety related services that require visits to customer premises, such as a visit to repair a broken meter. On- site visits to restore power supplies may fall into this category if the supply prob- lems are customer-specific rather than network-related. An example of a non- emergency on-site indicator is the percentage of non-emergency calls that the company responds to within twenty-four hours.
Safety indicators reflect possible health and safety problems if utility prod- ucts are not delivered properly. Safety indicators are much more common for gas than electric utilities. An example is the time it takes to respond to calls about gas odors.
Telephone services pertain to the quality of service provided by the com- pany's phone center. Since most customers communicate complaints or con- cerns by telephone, the quality of phone contacts is an important component of overall service and is often linked to other indicators (e.g., the response time for emergency visits depends in part on how rapidly calls are answered and relayed to field personnel). One example of a telephone service indicator is the average time it takes to answer customer calls.
Metering and Billing indicators reflect the quality of these services that the
37. For example, an updated service quality incentive for Brooklyn Union Gas used just eight indi- cators, while the plan it replaced contained twenty-one.
432 ENERGY LAW JOURNAL [Vol. 23:399
company provides. Quality in this area will be enhanced by timely and accurate meter-reading and bill preparation. Examples of quality indicators include the percentage of prepared bills that must be adjusted because of errors.
Customer satisfaction is a category that reflects how content customers are with their utilities. Indicators include surveys of overall customer satisfaction.
Finally, the other category includes a panoply of miscellaneous indicators that have been featured in approved service quality incentive plans. Examples include employee safety and customer outreach and education programs.
Many of these indicators relate to services that non-regulated energy retail- ers can provide in a competitive market. Therefore, service quality incentives may be less appropriate for these indicators once the competitive marketplace has matured. In the interim, however, the quality of the services that the utility provides is likely to remain an important regulatory concern.
Quality benchmarks are the standards against which measured quality is judged. Benchmarks should be ideally sensitive to a utility's external business conditions and relatively immune to the influence of random events. The quality of energy distribution service, for example, is potentially influenced by a number of external factors, which may be called quality "drivers." The list of relevant factors includes: weather (e.g. winds, lightning, extreme heat and cold); vegeta- tion (contact with power lines); the amount of undergrounding mandated by lo- cal authorities; the degree of ruralization in the territory (typically increasing the exposure of feeders to the elements and lengthening response times when faults occur); the difficulty of the terrain served; the mix of residential, commercial, and industrial customers; the incidence of poverty; the heterogeneity of lan- guages spoken; the rate of growth in the number of customers; the tendency of customers to relocate; and regulatory changes such as a restructuring of the in- dustry to promote competition. Quality drivers influence customer satisfaction as well as the more operation-specific quality indicators.
Universally accepted quality standards do not exist for utility industries, so commissions have considerable latitude in setting benchmarks. For any given indicator, one straightforward benchmark is the utility's average performance over a recent period. Quality assessments would then depend on measured qual- ity levels that differ either positively or negatively from recent historical experi- ence.
Using past utility performance to set benchmarks is appealing in many ways. This approach ensures that benchmarks will reflect the typical external factors faced by a company which, as noted, may vary substantially between utilities. In addition, the resources needed to deliver recent quality levels are presumably reflected in current rates.
However, regulators may not consider a utility's past performance to be an adequate quality standard, especially if recent service levels are poor. Some util- ity managers may also view the company's history as inappropriate when its per- formance is exceptionally good. In this case, it may be considered unfairly de- manding to expect the utility to match its historically superior performance on an ongoing basis.
An alternative is to base benchmarks on the service quality performance of the industry, defined either nationally or regionally. Industry benchmarks may
20021 PERFORMANCE-BASED REGULATION 433
also be based on measured performance levels for a peer group of comparable utilities. In principle, industry-based benchmarks may be attractive in PBR. They are clearly external to the subject utility, which creates strong performance incentives. Industry benchmarks also tend to be consistent with the operation of competitive market, where customer choices are driven by the cost and quality of products relative to available substitutes.
In practice, however, industry-based benchmarks are often problematic be- cause uniform and publicly-available data are not collected for large numbers of energy utilities. This lack of available data probably explains why so few ap- proved plans contain industry-based quality benchmarks. While this is a recog- nized problem, some commissions (e.g. Massachusetts) are nevertheless examin- ing the desirability of using peer data within their state to set reliability benchmarks for individual ~ t i l i t i e s .~~
As noted, a company's measured service quality performance can be af- fected by external business conditions that are beyond management control. Some of these business conditions are volatile and prone to fluctuations that are hard to predict. Utilities should not ideally be subject to penalties or rewards be- cause random factors have affected their measured service quality. PBR plans can be designed to mitigate the impact of random factors in leading to inappro- priate penalties or rewards.
One way to handle the impact of external business conditions is through deadbands. A deadband is a range around a quality benchmark where measured performance is neither penalized nor rewarded. Statistical methods can provide a rigorous foundation for setting deadbands that reduce the probability of inap- propriate penalties or rewards to specified levels (e.g. 5%). Such statistical methods have been used in several service quality PBR plans for telecom utili- ties and have been proposed by energy utilities in some states.3g
The symmetry of the award mechanism is another important design issue. It has been argued that symmetric awards (i.e. both rewards and penalties are possible) are not needed when quality incentives are designed only to maintain quality levels which might otherwise decline due to the stronger incentives to cut costs under PBR. However, a strong case can be made that symmetric incentive plans are more appropriate. Symmetric plans can in fact be calibrated to incite only the maintenance of current quality standards. The encouragement of better quality may, in any event, be desirable. All types of PBR, including service quality incentives, are fundamentally motivated by a desire to improve utility performance and not simply prevent performance from slipping. Asymmetric plans generally do not create incentives for companies to improve quality and thus may limit the total customer benefit that is available from utility operations.
Symmetric plans are also more consistent with the behavior of unregulated markets and the competitive market paradigm for regulatory design. Customers
38. Order on Motion for Clarification by Joint Utilities, Mass. D.T.E. 99-84 (2001) [hereinafter Order on Motion].
39. See generally Pacific Economics Group, Statistical Benchmarking of Utility Service Quality, (November 9, 2000), available at http:l~www.state.ma.us/dpu~electricI99-84lucappb.pdf (offered in tes- timony by Massachusetts Energy distributors in D.T.E. 99-84).
434 ENERGY LAW JOURNAL [Vol. 23:399
in competitive markets routinely pay higher prices for higher quality products, and a symmetric service quality incentive reflects this phenomena. However, competitive markets usually offer an array of goods with varying quality levels, and not all customers choose to consume high-quality goods. In some cases, in- centive plans lead to price increases on monopoly ~ervices.~' Where this is the case, at least some customers may be paying for quality improvements that they do not want.41
Symmetric service quality plans have been approved for energy utilities. For example, both the California and New York commissions adopted symmet- ric service quality plans based on explicit findings that the underlying principles are sound. However, asymmetric service incentives are somewhat more com- mon.
The impact of external business conditions on measured service quality per- formance also tends to support symmetric service quality incentives. As noted, some business conditions can be quite volatile and may lead to inappropriate penalties or rewards. Symmetric service quality incentives reduce the likelihood that random factors will lead to inappropriate net penalties or rewards over the course of a multi-year incentive plan. That is because random changes in busi- ness conditions can lead to rewards as well as penalties. Over time, the magni- tudes of any inappropriate penalties and rewards can therefore be expected to cancel each other out. All else equal, this leads to reasonable penalties and re- wards that on average reflect a utility's underlying quality performance. This would not be the case with an asymmetric service quality incentive, where exter- nal factors may subject a company to penalties without the chance of being com- pensated with offsetting rewards.
Another significant plan design issue is the magnitude of rewards or penal- ties levied. In practice, empirical evidence is rarely presented to justify the amount of potential penalties or rewards in a plan. Instead, penalty levels are sometimes chosen with the idea that they are "significant" enough to prevent service levels from declining. The rationale seems to be that the penalties should at least exceed cost savings that the utility might expect by cutting resources used to deliver service quality.
The uncertainties related to the magnitude of rewards or penalties lends ad- ditional support for symmetric service incentives over asymmetric incentives. Since regulators often use considerable discretion in setting penalty rates, a symmetric plan may discipline regulators into choosing more appropriate rates. That is, with an asymmetric plan, regulators may err on the side of choosing very high penalties to assure that quality does not decline under the plan. This is less
40. Note that, depending on the other features of the PBR plan, symmetric service quality incentive plans may not lead to price increases even if the utility is rewarded under the plan. For example, if the PBR plan also features as ESM, the service quality reward can be an increase in the allowed return at which earnings are shared, rather than a price increase.
41. This distributional implication is tempered somewhat by some research showing that the opti- mal level of quality in a monopoly market can be provided only if prices are sensitive to the quality of services. Lawrence White, Quality Variations When Prices Are Regulated, 3 BELL J . OF ECON. & MGMT. ScI., 425-36 (1972); Carl Shapiro, Premiums for High Quality Products as Returns to Reputations, 98 Q. J . of ECON. 659-79 (1983).
20021 PERFORMANCE-BASED REGULATION 435
likely under a symmetric plan, which would require an equally high reward due to performance improvements. Hence, even if an asymmetric plan is ultimately approved, a symmetric service quality proposal may be beneficial if the prospect of symmetry leads to more appropriate magnitudes for penalty payments.
Ideally, a service quality incentive requires information on how customers value different quality indicators so that the potential rewards and penalties for performance will reflect the value of the service provided. Given its importance, it is somewhat surprising that little empirical work has been done on customer valuations of quality indicators included in incentive plans. In part, this is be- cause quality is inherently difficult to value. But while this information may not be readily available, it can be gathered from a number of sources.
Although a complete discussion of the topic is beyond the scope of this arti- cle, three basic methods are used to estimate the value of service quality. One method uses proxy data related to the service attribute. For example, the value of having to wait for a field service representative to arrive can be approximated as the customer's lost wages (i.e., the opportunity cost of the customer's time). Proxy prices have the advantage of simplicity, but they can be imprecise and bear a tenuous link to actual service valuations.
A second method of estimating customer valuation uses market-based measures for the value of service. The difference between fm and interruptible rates is one example of market-based data that reflects some customers' valua- tions of reliability. Another example of market-based measures is the use of he- donic price indexes, which are developed by regressing market prices on identi- fiable quality attributes. Hedonic price indexes reflect the notion that price differences are due to implicit markets for individual product characteristics. Some official statistics utilize hedonic methods; for example, the Bureau of La- bor Statistics adjusts for quality changes of some products when computing the Consumer Price Index.42 While market-based methods are often conceptually sound, they can be controversial, are often not well-understood, and can produce divergent estimates of underlying quality valuations. In addition, hedonic meth- ods are less likely to capture the underlying quality valuations in utility markets since prices often reflect regulatory decisions rather than market forces.
Finally, quality valuations can also be obtained through customer surveys. An advantage of this approach is that surveys can focus on specific aspects of utility services that might be included in an incentive plan. However, survey re- sults reflect subjective perceptions rather than actual consumer behavior, and hypothetical valuations may not be a good guide to how consumers would actu- ally act in markets.
2. Precedents
There are a large number of approved PBR plans for service quality. Ser- vice quality PBR is especially well established in New York and California. Generic proceedings on service quality PBR have been held in several states.43
42. The CPI calculations consider improvements in personal computers, for example. 43. Seegenerally Order on Motion, supra note 38.
436 ENERGY LAW JOURNAL [Vol. 23:399
3. Evaluation
Service quality PBR is becoming more important in utility regulation. Quality incentive mechanisms can play an important role in ensuring that incen- tives for quality and unit cost containment are balanced. Despite their impor- tance, research to place these plan provisions on a solid foundation of reason and empirical research is not well advanced.
D. Other Non-Comprehensive Benchmarking
1. Basics
Non-comprehensive benchmark plans are similar in many respects to com- prehensive benchmark plans. They involve performance indicators, performance benchmarks, and award mechanisms. The main difference is that a non- comprehensive plan does not cover all dimensions of company performance.
2. Precedents
Traditionally, many approved benchmark plans for energy utilities have been markedly non-comprehensive insofar as they feature a small number of nar- rowly focused performance variables. For electric utilities, indicators measuring performance in the areas of fuel procurement, generator management, and de- mand-side management (DSM) have also historically been common. In a 1986 survey on incentive regulation, Joskow and Schmalensee identified forty-three generator performance plans in nineteen states.44
In the gas distribution industry, there are numerous approved benchmarking plans for gas procurement cost. The design of gas supply benchmarking has been challenging. Frontier issues include the treatment of transportation cost and the provision of incentives for gas cost stability.
3. Evaluation
The merits of non-comprehensive benchmark plans are broadly similar to those of non-comprehensive indexing mechanisms. Performance areas can be targeted that are of special concern to the regulatory community. The chief dif- ference between non-comprehensive benchmarking and non-comprehensive in- dexing results from the sharing that necessarily applies to the latter approach. Sharing reduces regulatory and business risks. The net effect of sharing on in- centives depends on whether the presence of a sharing mechanism permits an ex- tension of the period between general rate cases.
VII. BENEFIT SHARING PROVISIONS
As we explained in section 11, a well-designed PBR plan generates stronger performance incentives with fewer operating restrictions than cost of service regulation. Performance is then expected to improve under such a plan, and
44. Paul R. Joskow & Richard Schmalensee, Incentive Regulation for Electric Utilities, 4 YALE J . ON REG. 1 (1986).
20021 PERFORMANCE-BASED REGULATION 437
utilities can earn more and their customers pay less, at the same time, than could be the case under cost of service regulation. The details of a PBR plan will in- fluence the allocation of plan benefits between utilities and their customers, and the proper mechanism for sharing plan benefits is a controversial issue in many PBR proceedings.
Appropriate benefit-sharing provisions allow both shareholders and cus- tomers to fare better than under standard rate regulation. If PBR is voluntary, utilities have little incentive to agree to a plan unless it offers a reasonable chance for higher earnings, especially in view of the higher risk entailed. It is incorrect, then, to point to higher utility earnings as evidence of the "failure" of PBR. Higher utility earnings are consistent with successful PBR as long as cus- tomers also benefit compared to a continuation of the status quo.
The selection of a benefit sharing mechanism should be based on sensible criteria. We evaluate alternative sharing mechanisms primarily in terms of their effect in three areas: performance incentives, cross-subsidization, and risk reduc- tion. Other attributes considered include simplicity and "salability," i.e., the ability to convincingly demonstrate benefit sharing. In this section, we evaluate three benefit-sharing provisions that may be used under various approaches to PBR: I) stretch factors; 2) adjustments to initial rates; and 3) earnings-sharing mechanism^.^' We describe the basic features of each approach, detail important precedents, and evaluate its advantages and disadvantages as a means of benefit- sharing.
A. The Stretch Factor
As we have already seen, the X-factor in a rate or revenue-cap index influ- ences the allowed escalation of rates or revenues. A higher value for X therefore benefits customers of regulated services. An X-factor designed in accordance with classic American principles is calibrated to reflect the TFP trend of the relevant industry. One way to share expected plan benefits with customers, then, is to set the X-factor at a level above the calibration point. This component of the X-factor is often called a stretch factor. It is set in advance to help ensure an external character for X. However, it can be allowed to vary from year to year.
An early use of stretch factors was in the initial price cap plan approved by the FCC for AT&T. A "consumer dividend" of 0.5% was added to the calcu- lated TFP differential of 2.5% to yield an X-factor of 3%. Since then, stretch factors have been featured in many U.S. indexing plans. They are sometimes explicit and sometimes implicit in the choice of an X-factor.
An important advantage of stretch factors is that their values can be as- signed independently of a company's unit cost growth during the plan, so they do not compromise performance incentives or raise cross-subsidy issues. Valua- tions made prior to the first indexing period clearly have this attribute.
Some critics of stretch factors have argued that regulators cannot commit to a stretch factor policy for subsequent plans. Absent such commitments, parties
45. A less general form of sharing which is not discussed at length is the kind encountered in benchmarking mechanisms. This was discussed supra Part VI.
438 ENERGY LAW JOURNAL [Vol. 23:399
might reasonably expect stretch factors in future plans to reflect the utility's unit cost in the current plan. However, the brief hstory of U.S. price cap regulation does not provide much evidence to support the validity of this concern.
To the extent that they are external, stretch factors are not useful in reducing business risk. For example, the application of a stretch factor may give custom- ers a 0.5% break in rates even if the company's earnings were depressed by mild weather and a regional recession. As for regulatory risk, the short history of U.S. price cap regulation provides few clear lessons. Critics of stretch factors argue that they lack the solid foundation in economic research that unit cost cali- bration points have. Regulators' abilities to assign values for stretch factors arbi- trarily exacerbates the risk. On the other hand, the range of explicit stretch factor values that have been approved is actually fairly narrow. Nearly all have fallen in the 0% to 1.0% range.
Regarding their salability, stretch factors are appealing to regulators insofar as they represent an advance commitment to customer benefits. Customers therefore benefit whether or not performance improvements are realized. On the other hand, customers and their representatives may not understand that stretch factors are designed to be insensitive to a utility's current earnings and so may resent high earnings if they occur.
B. Adjustment of Initial Rates
Another important approach to sharing plan benefits is to lower the initial (base year) rates or revenue requirement below the levels that would otherwise result. When this is done, consumers immediately reap a plan benefit. More- over, benefits continue to be created in subsequent years since, with lower initial rates, lower prices result from index-based rate adjustments. This approach has been more widely used in Great Britain than in North American PBR to date.
The advantages and disadvantages of initial rate cuts as a benefit sharing mechanism are similar to those for stretch factors. To the extent rate cuts do not deepen in response to performance improvements, performance incentives are strong. Cuts at the outset of the first plan are not problematic. The concern is, instead, with the size of initial rate cuts that might occur at the start of subse- quent plans and their linkage to past performance improvements under PBR. As with stretch factors, initial rate cuts do not mitigate business risk and can actu- ally increase regulatory risk absent a proper conceptual and empirical founda- tion. Customers benefit whether or not utility performance improves, but may resent high earnings if they occur.
A unique advantage of initial rate adjustments is the immediacy of the benefits. On the other hand, a unique disadvantage is the difficulty of demon- strating that rate cuts are in fact being made when, as is common for energy utili- ties, companies propose rate increases just prior to indexing. Utilities are then in the awkward position of claiming they could have asked for even larger price in- creases and that customers have benefited from the company's restraint. Since other parties will have differing opinions about whether any increase is war- ranted, the benefits may be less convincing.
20021 PERFORMANCE-BASED REGULATION 43 9
C. Earnings-Sharing Mechanisms
An earnings-sharing mechanism (ESM) adjusts a company's price restric- tions when its earnings rate has been in a certain range over a recent historical period. The mechanisms are established in advance of their use and typically function for several years. The most widely-used earnings rate measure is return on equity (ROE).
Approved ESMs vary significantly in several ways. The most important difference is the shares of surplus (andlor deficit) earnings assigned to share- holders and customers. These shares may change in different ranges of the ROE. Many plans feature a range (called a deadband) in which rates are not sensitive to ROE fluctuations. Immediately beyond the deadband, the customer share is commonly 50%. In some plans, it increases substantially when ROE is extraor- dinarily high and falls substantially when it is extraordinarily low. Such plans are said to be characterized by "regressive" sharing mechanisms. Alternatively, a "progressive" ESM reduces the customer's share of benefits as ROE increases. Some plans are symmetric in the sense that they provide for rate decreases when earnings are high and rate increases when earnings are low. Other plans provide for rate adjustments only when earnings are high.
ESMs are one of the oldest approaches to PBR. They were used in England as early as 1855 to regulate local gas companies.46 A plan was adopted in Can- ada in 1877 to regulate Consumers Gas. An early American plan was estab- lished in 1905 for Boston Consolidated Gas. A plan for Potomac Electric Power, approved in 1925, remained in effect until 1955. More recent PBR plans for many U.S. and Canadian energy utilities involve ESMs. However, ESMs were not included in the rate-cap plans for National Grid (Mass.) or the plans ap- proved by the FERC for oil pipelines or the power transmission services of In- ternational Transmission.
Experience with ESMs in the U.S. telecommunications industry is also in- teresting. For example, ESMs were featured in an early PBR plan that the FCC approved for LECs in 1991.~' At around the same time, commissions in several states approved price cap plans with ESMs for LEC services under their jurisdic- tion. However, ESMs have become rare in the telecom industry in more recent years. Instead of ESMs, most plans use either stretch factors or initial rate cuts to ensure benefit-sharing. The rate-indexing plan for Canadian telecom utilities does not have an ESM.
Regulators in Britain have considered the adoption of ESMs on several oc- casions. One review of a British Gas plan featured an especially thorough delib-
46. For further discussion of the early precedents see generally Hany Trebing, Toward An Incen- tive System ofRegulation, PUB. UTIL. FORTNIGHTLY, July 18, 1963, at 22.
47. The decision to allow ESMs in this plan was due in part to the unique circumstances of the case. The plan applied to eight different companies with service territories as diverse as New England and the Pacific Northwest. Although the FCC recognized that regional differences in economic growth and other conditions could cause variations in the productivity growth potential of LECs, it also found that the service tenitories of several LECs accounted for most of the business in their regions. Because the re- gional data would be inappropriate for these essentially one-firm service areas, the PCIs were designed using national unit cost data. The ESMs were viewed in large part as a "backstop" to reduce the resulting risk.
440 ENERGY LAW JOURNAL [Vol. 23:399
eration of this issue. However, few ESMs have been adopted to date in Britain. A recent and notable exception is the latest plan for the transmission system op- eration (SO) services of National Grid. There are also no ESMs in the approved index plans for Australia's power transmission and distribution utilities.
ESMs have some important advantages as benefit sharing mechanisms. One is their ability to mitigate risk. ESMs are an automatic means of adjusting rates for a wide range of risky external developments. As an alternative to initial rate reductions and X-factors, they also reduce regulatory risk. In effect, benefits are shared as they are realized and there is less pressure on regulators to choose stretch factors and initial rate reductions that share the (usually speculative) plan benefits. There is, however, some regulatory risk to the utility in proposing an ESM: principally, the risk that the Commission will approve an asymmetric ESM in which earnings shortfalls are not shared.
In addition to risk management, another benefit of ESMs is their salability. Customers and their representatives can appreciate how an ESM aligns share- holder and customer interests. Benefits seem transparent and easily computed. If the distributor had a 14% ROE last year, for instance, the ESM might reduce the revenue from regulated services by the value of a percentage point of ROE. ESMs will also keep utility earnings within politically acceptable bounds.
On the downside, ESMs do not, by themselves, guarantee that customers benefit from a PBR plan. Customers may complain if distributor earnings ex- ceed the target ROE but fail to reach the sharing range. Higher rates due to an earnings shortfall can be especially controversial.
Another disadvantage of ESMs is that the continued focus on earnings keeps alive inherently controversial issues like utility-affiliate transactions and cost allocations between a utility's various regulated services and any competi- tive market services. Unwarranted or excessive regulator attention to these is- sues can both discourage efficient diversification and impose undue regulatory costs. Utilities will become more sensitive to the problems associated with ESMs as they seek to realize potential scale and scope economies from simulta- neous involvement in regulated and competitive markets.
The effect of ESMs on performance incentives is controversial. Compared to a multi-year rate-cap plan in which rate restrictions are completely insensitive to a utility's performance, a plan with an ESM weakens a company's perform- ance incentives. After all, utility managers have less incentive to improve per- formance if half of the after-tax benefits go to customers. On the other hand, the various advantages of ESMs may permit the interested parties to agree to an ex- tension of the period between plan reviews. ESMs may also help the parties agree to plan termination provisions that have less deleterious incentive conse- quences. For example, it can be agreed that in the event of any cost based true- up of rates at the end of the plan, a company is entitled to keep its share of any surplus earnings and is not entitled to compensation for its share of surplus losses.
The analysis of the impact of ESMs on the direct cost of regulation has a similar flavor. ESMs increase regulatory costs during periods where companies are not otherwise subject to regulatory intervention, such as a multi-year rate plan. For example, with ESMs it may be necessary to compute the cost of regu-
20021 PERFORMANCE-BASED REGULATION 44 1
lated services, and therefore to allocate total cost between regulated and unregu- lated services.48 This effect is offset to the extent that an ESM can extend the pe- riod between other, more extensive regulatory interventions.
The reasons for the prevalence of ESMs in the approved PBR plans of U.S. energy utilities and their relative paucity in the PBR plans of telecom utilities merit brief consideration. Two explanations seem plausible. First, cost alloca- tion issues have historically loomed larger for telecom companies than for en- ergy utilities. Interstate access and local exchange services to business custom- ers of LECs have long been subject to physical bypass, while residential customers have cellular bypass options and, increasingly, access to alternative land line providers. Because customers have so many alternatives to utility net- work service, the marketing and cost allocation issues that result from ESMs may be more costly for telecom utilities. A second reason for the discrepancy in the use of ESMs may be the relative novelty of PBR for energy utilities. As noted above, many early PBR plans for telecoms featured ESMs, but earnings- sharing in the industry has become rarer over time. Similarly, ESMs may be- come less common for energy utilities as regulators and parties gain experience with PBR.
Plan termination provisions are another important class of PBR tools that are applicable to a range of basic PBR approaches. One important provision is the term of the plan. Provisions for resetting rates at the conclusion of the plan are also important.
A. Plan Term
Regarding plan term, the trend in PBR has clearly been towards longer term plans. Three year plans of durations were typical during the 1990's. More re- cently, five-year terms have become standard and some plans of considerably longer duration have been approved. Especially noteworthy in this regard are the ten-year plans for power distribution services of National Grid in Massachu- setts and New York.
Plans of longer duration strengthen performance incentives and alleviate concerns about cross-subsidies and novel operating practices that can lead to op- erating restrictions. Longer terms are especially useful in encouraging initiatives that involve up-front costs to achieve long-run efficiency gains. That is one rea- son why longer plan terms are of interest in PBR plans occasioned by utility mergers. Both of the National Grid plans just mentioned involved mergers.
On the downside, longer plan terms can increase both business and regula- tory risk. This makes them less suitable for businesses undergoing rapid change or for regulatory jurisdictions where there is exceptional risk of unusual stretch factors or initial rate adjustments. The risk of a longer plan term can be reduced by several other plan provisions, including industry-specific inflation measures,
48. This is a major concern for telecom utilities, which typically provide extensive regulated and unregulated services from the same facilities.
442 ENERGY LAW JOURNAL [Vol. 23:399
Z-factors, marketing flexibility, and ESMs. In choosing among these tools, plan designers should, as usual, be mindful of their differential effects on plan exter- nality.
B. Rate Reset Provision
The rate reset provisions of PBR plans vary widely. At one extreme, the plan may include a provision for a full-scale cost-based rate or revenue require- ment true-up at the plan's conclusion. At the other, a plan could be reset entirely on the basis of external data. For example, a rate or revenue cap index could be revised only to better reflect the recent unit cost trend of the relevant industry.
The rate reset provisions of most PBR plans for energy utilities lie between these extremes. The most common approach is to simply not specify how rates might be reset. An interesting alternative is to establish by some means that in the event of a cost-based rate true-up, utilities will be entitled to keep some of the demonstrable benefits of superior performance.49 Plans with this innovative feature have included those for the power distribution services of National Grid (Mass.) and of power distributors in Victoria, Australia.
Rate reset provisions are important because of their effect on the externali- zation of the regulatory mechanism. To the extent that a full cost-based rate true-up is not ensured, performance incentives are strengthened and there are re- duced concerns about cross subsidies and novel practices that can lead to operat- ing restrictions. Incentives for initiatives involving up-front costs and long term benefits are, once again, especially affected. On the downside, rate plans that do not call for a full cost-based rate reset involve greater risk. As in the case of longer plan terns, a variety of other mechanisms are available to mitigate the re- sultant risk.
IX. CONCLUSION
Our survey has revealed that many tools are available for the construction of PBR plans for energy utilities. These tools have differential impacts on risk and return. Careful plan design can help achieve a risk-return balance that is right for utilities and their customers. Tools that reduce risk without unduly rais- ing concerns about performance incentives and operating practices are especially desirable. In our experience, this list includes industry-specific inflation meas- ures, X-factors based on regional productivity trends, Z-factors, and optional rates and services.
Our analysis has also highlighted the importance of encouraging energy utilities to undertake initiatives that involve up-front cost to achieve long term performance gains. Plan termination provisions play an especially critical role in the incentives for such initiatives. The greater risk of provisions that strengthen such incentives can be offset by more careful attention to eliminating unneces- sary sources of operating risk under the plan. The time horizons of most PBR plans are still sufficiently short that utilities must plan carefully if they hope to
49. In principle, they might also be asked to share the losses from demonstrably inferior perfonn- ance.
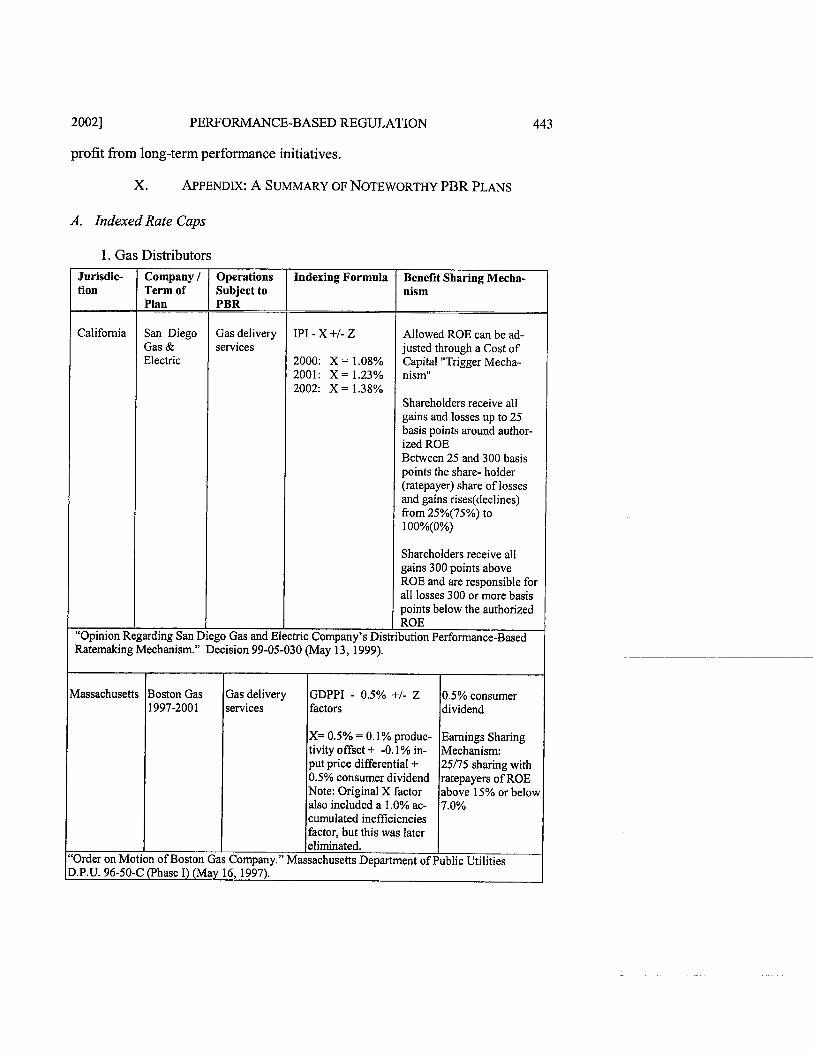
20021 PERFORMANCE-BASED REGULATION
profit from long-term performance initiatives.
X. APPENDIX: A SUMMARY OF NOTEWORTHY PBR PLANS
A. Indexed Rate Caps
1. Gas Distributors Jurisdic- tion
California
"Opinion
Massachusetts
X= 0.5% = 0.1% produc- tivity offset + -0.1 % in- put price differential + 0.5% consumer dividend Note: Original X factor also included a 1 .O% ac- cumulated inefficiencies factor, but this was later eliminated.
Ratemaking Mechanism." Decision 99-05-030 (May 13, 1999).
Company 1 Term of Plan
San Diego Gas & Electric
Regarding San
Boston Gas 1997-200 1
Earnings Sharing Mechanism: 25/75 sharing with ratepayers of ROE above 15% or below 7.0%
"Order on Motion of Boston Gas Company." Massachusetts Department of Public Utilities D.P.U. 96-50-C (Phase I) (May 16, 1997).
Operations Subject to PBR
Gas delivery services
Diego Gas and
Gas delivery services
Indexing Formula
IPI - X +I- Z
2000: X = 1.08% 2001: X = 1.23% 2002: X = 1.38%
Electric Company's
GDPPI - 0.5% +I- Z factors
Benefit Sharing Mecha- nism
Allowed ROE can be ad- justed through a Cost of Capital "Trigger Mecha- nism"
Shareholders receive all gains and losses up to 25 basis points around author- ized ROE Between 25 and 300 basis points the share- holder (ratepayer) share of losses and gains rises(dec1ines) from 25%(75%) to 1 OO%(O%)
Shareholders receive all gains 300 points above ROE and are responsible for all losses 300 or more basis points below the authorized ROE
Distribution Performance-Based
0.5% consumer dividend
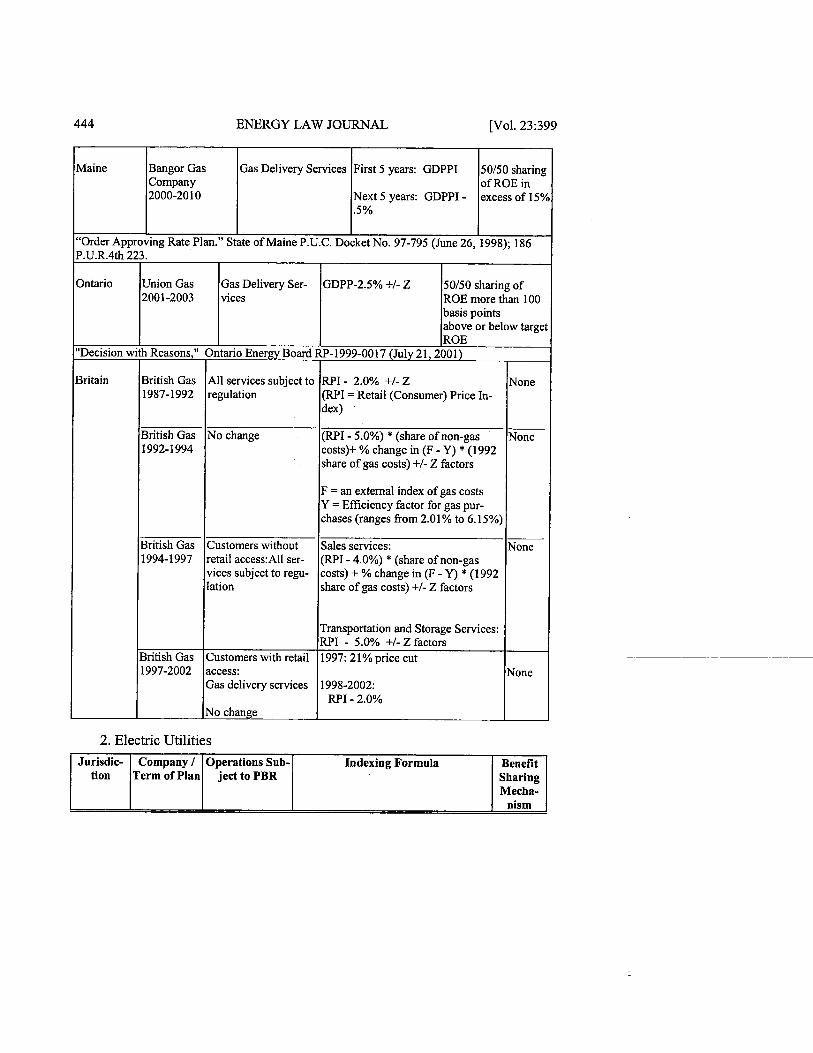
444 ENERGY LAW JOURNAL [Vol. 23:399
2. Electric Utilities
Maine Bangor Gas Company 2000-201 0
Jurisdic- tion
"Order Approving Rate Plan." State of Maine P.U.C. Docket No. 97-795 (June 26, 1998); 186
Gas Delivery Services
P.U.R.4th 223.
Ontario
"Decision with
Britain
Company 1 Term of Plan
First 5 years: GDPPI
Next 5 years: GDPPI - .5%
Union Gas 2001-2003
Operations Sub- ject to PBR
50150 sharing of ROE in excess of 15%
Gas Delivery Ser- vices
Indexing Formula Benefit Sharing Mecha-
nism
GDPP-2.5% +I- Z
Reasons," Ontario Energy Board I
50150 sharing of ROE more than 100 basis points above or below target ROE
RP-1999-0017 (July 21,2001)
RPI - 2.0% +I- Z (RPI = Retail (Consumer) Price In- dex)
(RPI - 5.0%) * (share of non-gas costs)+ % change in (F - Y) * (1992 share of gas costs) +I- Z factors
F = an external index of gas costs Y = Efficiency factor for gas pur- chases (ranges from 2.01% to 6.15%)
Sales services: (RPI - 4.0%) * (share of non-gas costs) + % change in (F - Y) * (1 992 share of gas costs) +I- Z factors
Transportation and Storage Services: RPI - 5.0% +I- Z factors 1997: 21% price cut
1998-2002: RPI - 2.0%
British Gas 1987-1992
None
None
None
None
All services subject to regulation
British Gas 1992-1 994
No change
British Gas 1994-1997
Customers without retail access:All ser- vices subject to regu- lation
British Gas 'Customers with retail 1997-2002 access:
Gas delivery services
No change
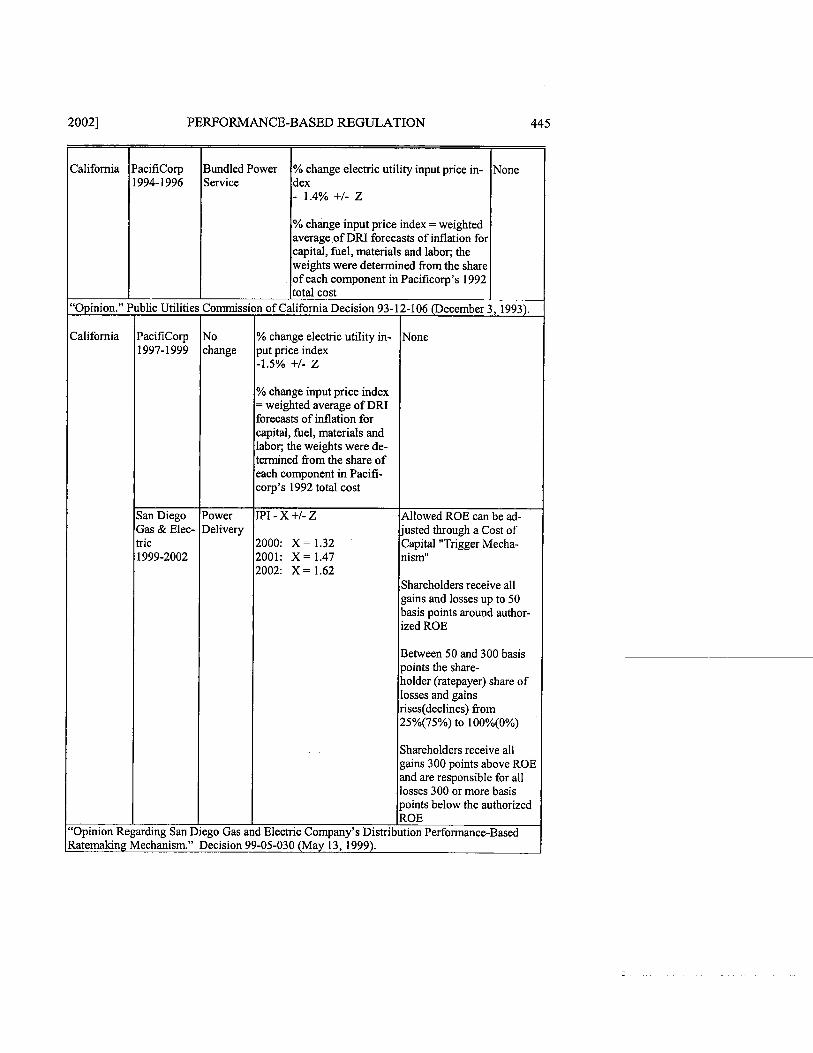
20021 PERFORMANCE-BASED REGULATION 445
California PacifiCorp 1994-1 996
Bundled Power Service
"Opinion."
California
"Opinion
Public Utilities
PacifiCorp 1997-1 999
San Diego Gas & Elec- tric 1999-2002
Regarding San
Commission
No change
Power Delivery
Diego Gas and
% change electric utility input price in- dex - 1.4% +/- z
% change input price index = weighted average of DRI forecasts of inflation for capital, fuel, materials and labor; the weights were determined from the share of each component in Pacificorp's 1992 total cost
Ratemaking Mechanism."
None
Decision 99-05-030 (May 13, 1999).
of California Decision
% change electric utility in- put price index -1.5% +/- z
% change input price index = weighted average of DRI forecasts of inflation for capital, fuel, materials and labor; the weights were de- termined from the share of each component in Pacifi- corp's 1992 total cost
IPI - X +/- Z
2000: X = 1.32 2001: X = 1.47 2002: X = 1.62
Electric Company's Distribution
93-12-106 (December 3, 1993).
None
Allowed ROE can be ad- justed through a Cost of Capital "Trigger Mecha- nism"
Shareholders receive all gains and losses up to 50 basis points around author- ized ROE
Between 50 and 300 basis points the share- holder (ratepayer) share of losses and gains rises(dec1ines) from 25%(75%) to 100%(0%)
Shareholders receive all gains 300 points above ROE and are responsible for all losses 300 or more basis points below the authorized ROE
Performance-Based
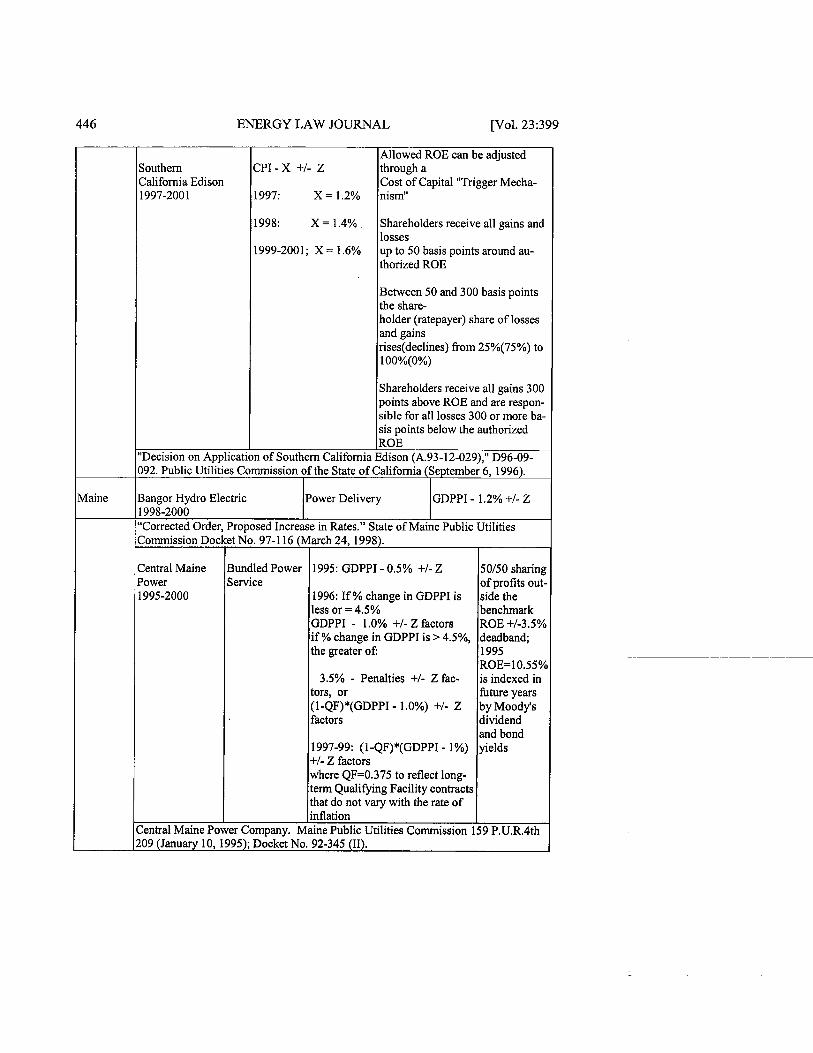
446 ENERGY LAW JOURNAL [Vol. 23:399
Maine
Southern California Edison 1997-200 1
"Decision on Application
CPI - X +I- Z
1997: X = 1.2%
1998: X = 1.4%
1999-2001; X = 1.6%
of Southern California
Allowed ROE can be adjusted through a Cost of Capital "Trigger Mecha- nism"
Shareholders receive all gains and losses up to 50 basis points around au- thorized ROE
Between 50 and 300 basis points the share- holder (ratepayer) share of losses and gains rises(dec1ines) from 25%(75%) to lOO%(O%)
Shareholders receive all gains 300 points above ROE and are respon- sible for all losses 300 or more ba- sis points below the authorized ROE
Edison (A.93-12-029)," D96-09- 092. Public Utilities Commission of the State of California (September 6, 1996).
Bangor Hydro Electric 1998-2000
Power Delivery GDPPI - 1.2% +I- Z
"Corrected Order, Proposed Increase in Rates." State of Maine Public Utilities Commission Docket
Central Maine Power 1995-2000
Central Maine Power Company. Maine Public Utilities Commission 159 P.U.R.4th 209 (January 10, 1995); Docket No. 92-345 (11).
No. 97-1 16
Bundled Power Service
(March 24, 1998).
1995: GDPPI - 0.5% +I- Z
1996: If % change in GDPPI is less or = 4.5% GDPPI - 1.0% +I- Z factors if % change in GDPPI is > 4.5%, the greater of:
3.5% - Penalties +I- Z fac- tors, or (I-QF)*(GDPPI - 1.0%) +I- Z factors
1997-99: (1-QF)*(GDPPI - 1%) +I- Z factors where QF=0.375 to reflect long- term Qualifying Facility contracts that do not vary with the rate of inflation
50150 sharing of profits out- side the benchmark ROE +I-3.5% deadband; 1995 ROE=10.55% is indexed in future years by Moody's dividend and bond yields
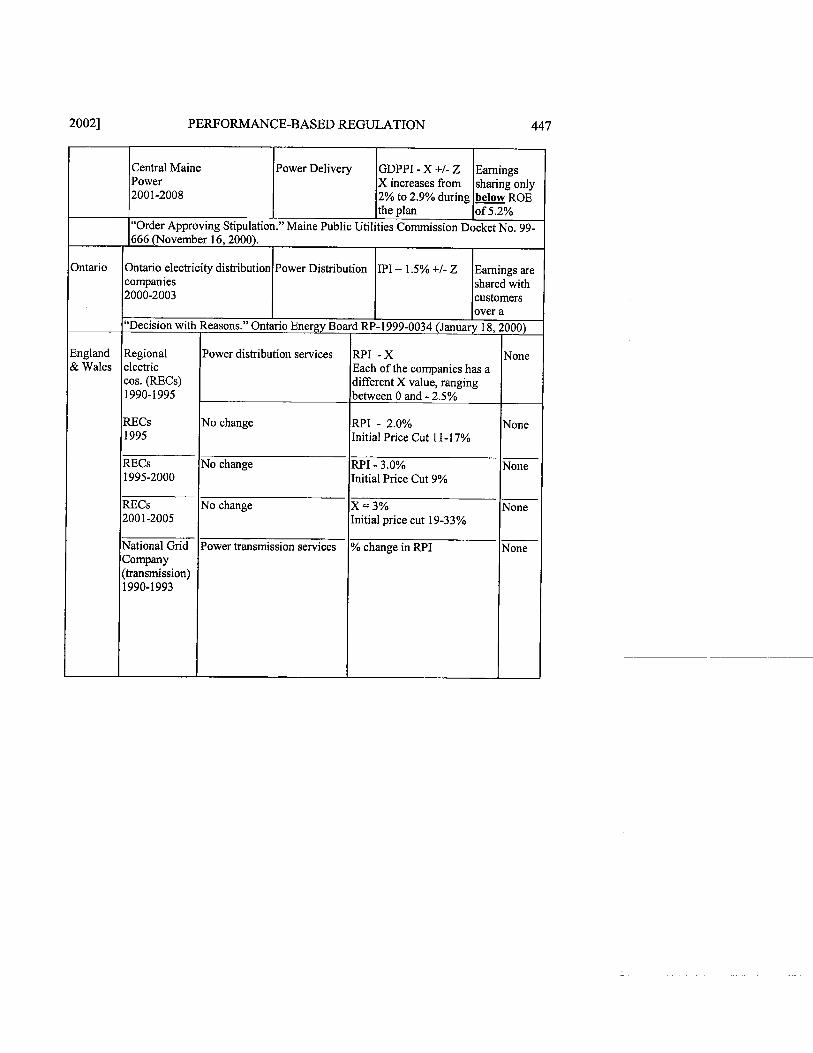
20021 PERFORMANCE-BASED REGULATION 447
Central Maine Power 2001-2008
Power Delivery
Ontario
England & Wales
GDPPI - X +/- Z X increases from 2% to 2.9% during the plan
Earnings sharing only below ROE of 5.2%
"Order Approving Stipulation." Maine Public Utilities Commission Docket No. 99- 666 (November 16,2000).
Ontario electricity distribution companies 2000-2003
Power Distribution
"Decision with
Regional electric cos. (RECs) 1990-1 995
RECs 1995
RECs 1995-2000
RECs 200 1-2005
National Grid Company (transmission) 1990-1993
IPI - 1.5% +/- Z Earnings are shared with customers over a
Reasons." Ontario Energy Board
Power distribution services
No change
No change
No change
Power transmission services
RP-1999-0034 (January
RPI - X Each of the companies has a different X value, ranging between 0 and - 2.5%
RPI - 2.0% Initial Price Cut 1 1-1 7%
RPI - 3.0% Initial Price Cut 9%
X=3% Initial price cut 19-33%
% change in RPI
18,2000)
None
None
None
None
None
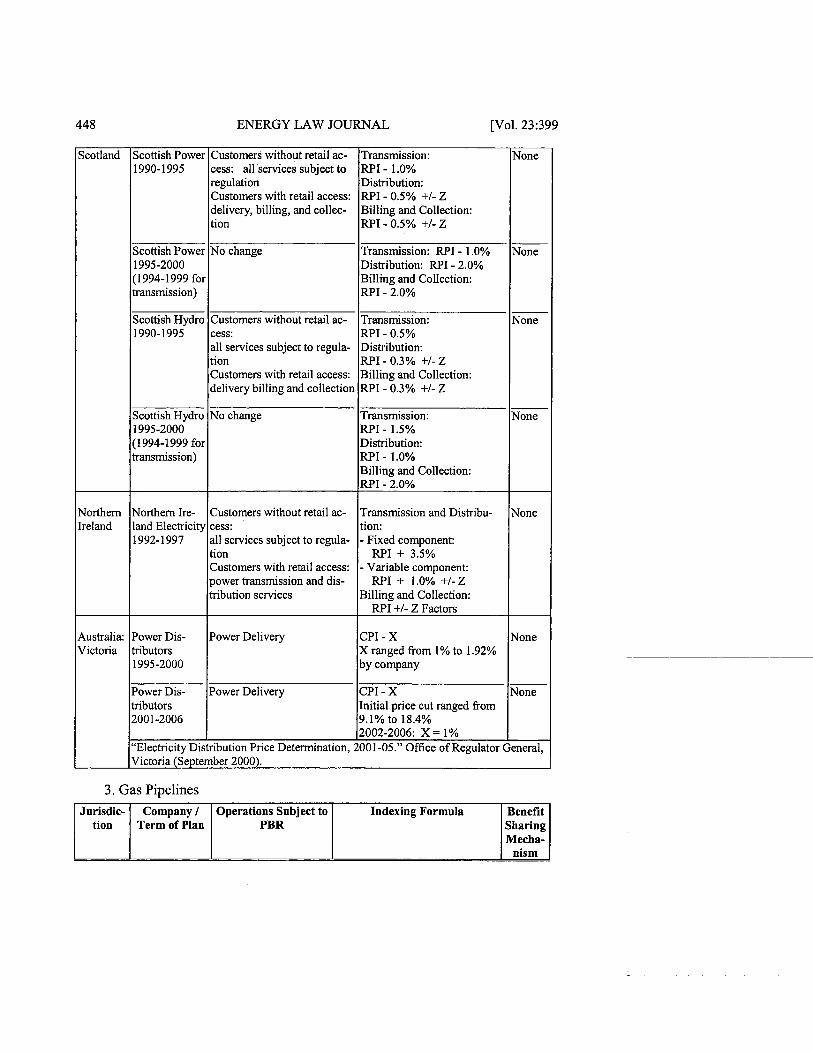
448 ENERGY LAW JOURNAL [Vol. 23:399
3. Gas Pipelines
Scotland
Northern Ireland
Australia: Victoria
Transmission: RPI - 1 .O% Distribution: RPI - 0.5% +I- Z Billing and Collection: RPI - 0.5% +I- Z
Transmission: W I - 1 .O% Distribution: W I - 2.0% Billing and Collection: RPI - 2.0%
Transmission: RPI - 0.5% Distribution: RPI - 0.3% +I- Z Billing and Collection: RPI - 0.3% +I- Z
Transmission: RPI - 1.5% Distibution: RPI - 1.0% Billing and Collection: RPI - 2.0%
Transmission and Distribu- tion: - Fixed component:
RPI + 3.5% - Variable component:
RPI + 1 .O% +I- Z Billing and Collection:
RPI +I- Z Factors
CPI - X X ranged from 1 % to 1.92% by company
CPI - X Initial price cut ranged from 9.1 % to 18.4% 2002-2006: X = 1%
2001-05." Office of Regulator
Jurisdic- tion
Scottish Power 1990-1 995
Scottish Power 1995-2000 (1994-1999 for transmission)
Scottish Hydro 1990-1 995
Scottish Hydro 1995-2000 (1 994-1999 for transmission)
Northern Ire- land Electricity 1992-1997
Power Dis- tributors 1995-2000
Power Dis- tibutors 2001 -2006
"Electricity Victoria (September
None
None
None
None
None
None
None
General,
Customers without retail ac- cess: all services subject to regulation Customers with retail access: delivery, billing, and collec- tion
No change
Customers without retail ac- cess: all services subject to regula- tion Customers with retail access: delivery billing and collection
No change
Customers without retail ac- cess: all services subject to regula- tion Customers with retail access: power transmission and dis- tribution services
Power Delivery
Power Delivery
Distribution Price Determination, 2000).
Company 1 Term of Plan
Operations Subject to PBR
Indexing Formula Benefit Sharing Mecha-
nism
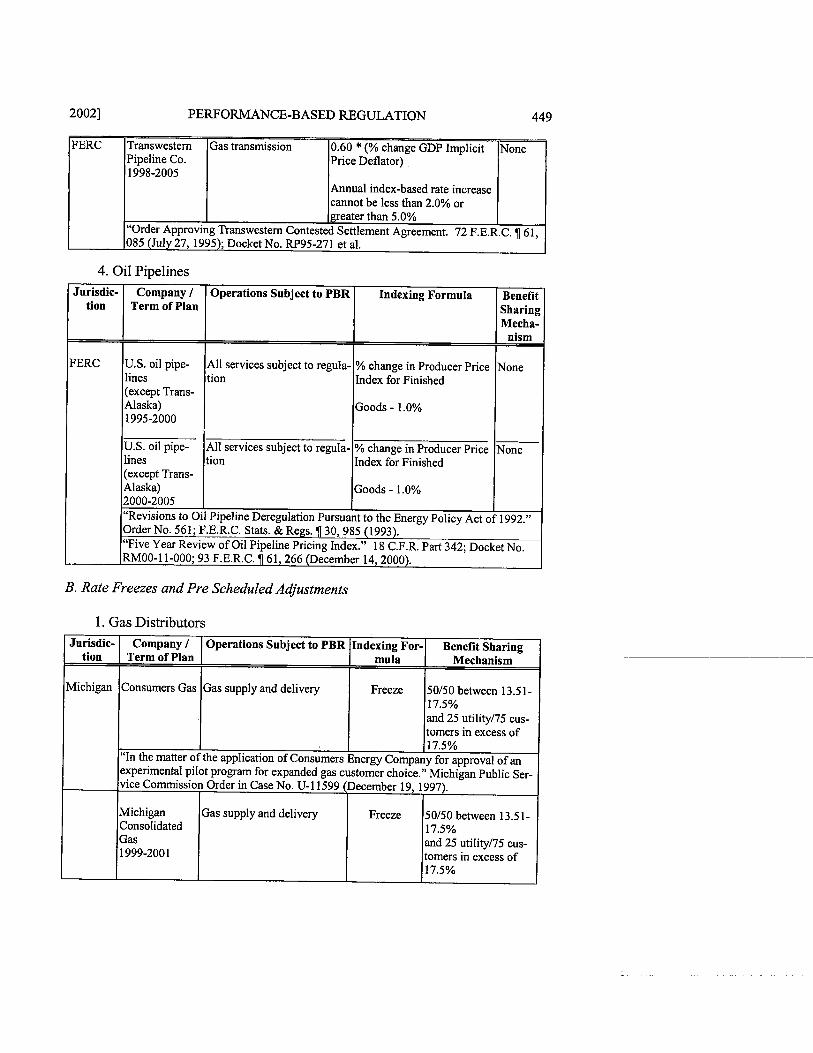
20021 PERFORMANCE-BASED REGULATION 449
nual index-based rate increase not be less than 2.0% or
4. Oil Pipelines
B. Rate Freezes and Pre Scheduled Adjustments
1. Gas Distributors
Benefit Sharing Mecha-
nism
None
None
"Revisions to Oil Pipeline Deregulation Pursuant to the Energy Policy Act of 1992." Order No. 561; F.E.R.C. Stats. & Regs. fi 30, 985 (1993). "Five Year Review of Oil Pipeline Pricing Index." 18 C.F.R. Part 342; Docket No. RM00-11-000; 93 F.E.R.C. 7 61,266 (December 14,2000).
Jurisdic- tion
FERC
Jurisdic- tion
Michigan
Operations Subject to PBR
All services subject to regula- tion
All services subject to regula- tion
Company I Term of Plan
U.S. oil pipe- lines (except Trans- Alaska) 1995-2000
U.S. oil pipe- lines (except Trans- Alaska) 2000-2005
Indexing Formula
% change in Producer Price Index for Finished
Goods - 1 .O%
% change in Producer Price Index for Finished
Goods - 1 .O%
Company I Term of Plan
Consumers Gas
Operations Subject to PBR
Gas supply and delivery
"In the matter of the application of Consumers Energy Company for approval of an experimental pilot program for expanded gas customer choice." Michigan Public Ser- vice Commission Order in Case No. U-11599 (December 19, 1997).
Indexing For- mula
Freeze
Michigan Consolidated Gas 1999-2001
Benefit Sharing Mechanism
50150 between 13.5 1- 17.5% and 25 utility175 cus- tomers in excess of 17.5%
Gas supply and delivery Freeze 50150 between 13.51- 17.5% and 25 utility175 cus- tomers in excess of 17.5%
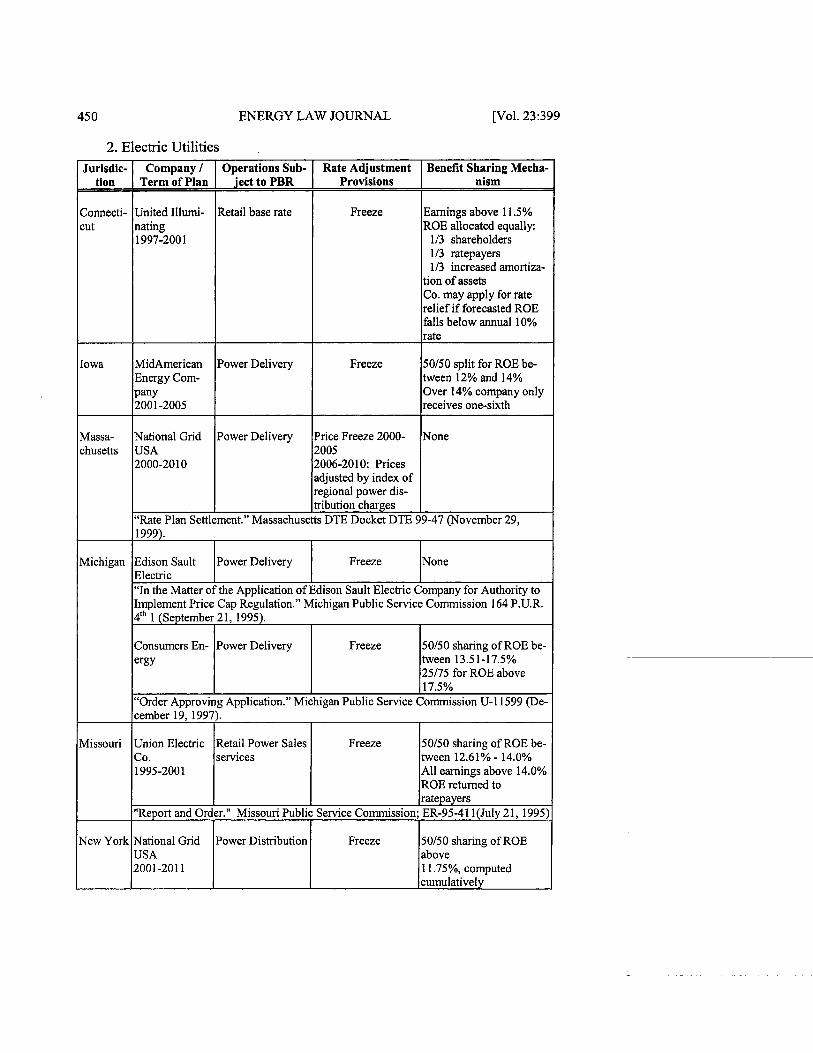
450 ENERGY LAW JOURNAL [Vol. 23:399
2. Electric Utilities Operations Sub-
ject to PBR
Retail base rate
Power Delivery
Power Delivery
Settlement." Massachusetts
Rate Adjustment Provisions
Freeze
Freeze
Price Freeze 2000- 2005 2006-2010: Prices adjusted by index of regional power dis- tribution charges
DTE Docket DTE
Jurisdic- tion
Connecti- cut
Iowa
Massa- chusetts
Benefit Sharing Mecha- nism
Earnings above 1 1.5% ROE allocated equally:
113 shareholders 113 ratepayers 113 increased amortiza-
tion of assets Co. may apply for rate relief if forecasted ROE falls below annual 10% rate
50150 split for ROE be- tween 12% and 14% Over 14% company only receives one-sixth
None
99-47 (November 29,
Company / Term of Plan
United Illumi- nating 1997-2001
MidAmerican Energy Com- PanY 200 1-2005
National Grid USA 2000-201 0
"Rate Plan
Michigan
Missouri
New York
1999).
Edison Sault Electric
Power Delivery
"In the Matter of the Application of Edison Sault Electric Company for Authority to Implement Price Cap Regulation." Michigan Public Service Commission 164 P.U.R. 4th 1 (September 21, 1995).
Freeze None
Consumers En- ergy
Freeze Power Delivery 50150 sharing of ROE be- tween 13.51-17.5% 25/75 for ROE above 17.5%
"Order Approving Application." Michigan Public Service Commission U-11599 (De- cember 19, 1997).
Union Electric Co. 1995-2001
Retail Power Sales services
ER-95-4 1 1 (July 2 1, 1995)
50150 sharing of ROE above 1 1.75%, computed cumulatively
Freeze
"Report and Order." Missouri Public Service Commission;
50150 sharing of ROE be- tween 12.61% - 14.0% All earnings above 14.0% ROE returned to ratepayers
National Grid USA 2001-201 1
Power Distribution Freeze
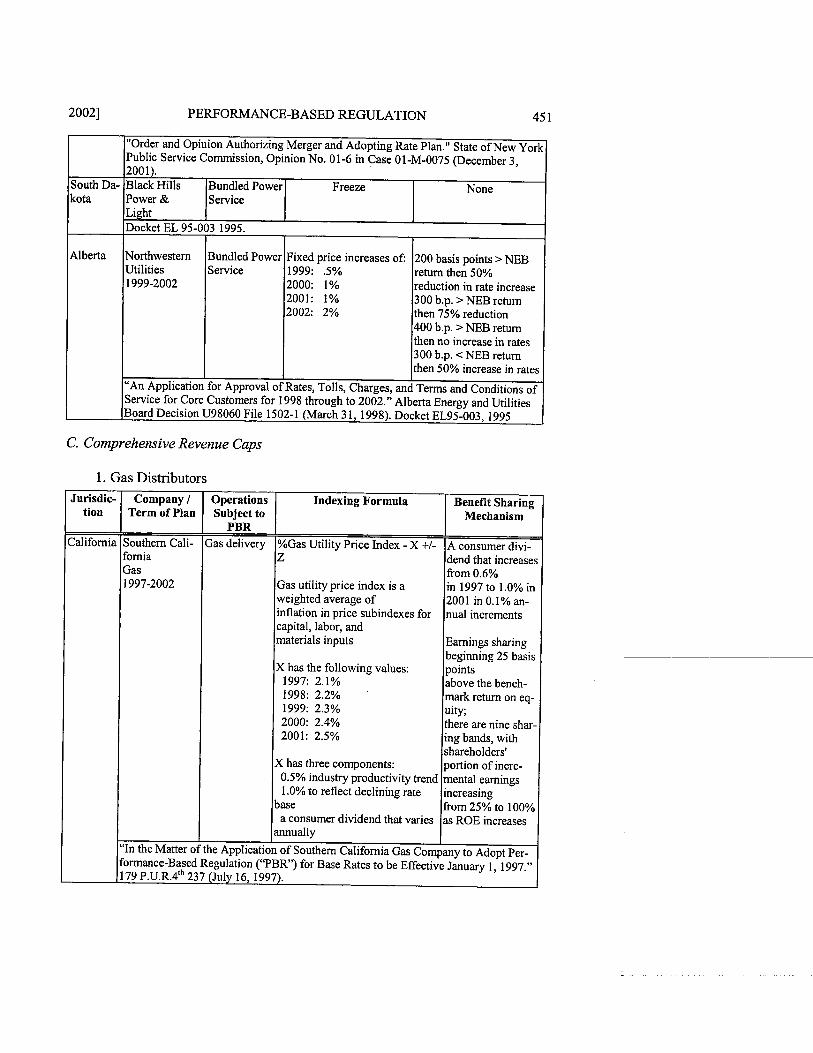
20021 PERFORMANCE-BASED REGULATION 45 1
C. Comprehensive Revenue Caps
1. Gas Distributors
South Da- kota
Alberta
"Order and Opinion Authorizing Merger and Adopting Rate Plan." State of New York Public Service Commission, Opinion No. 01-6 in Case 01-M-0075 (December 3, 2001). Black Hills Power & Light
formance-Based Regulation ("PBR) for Base Rates to be Effective January 1, 1997." 179 P.u.R.~'~ 237 (July 16, 1997).
Operations Subject to
PBR Gas delivery
the Application
Indexing Formula
%Gas Utility Price Index - X +I- Z
Gas utility price index is a weighted average of inflation in price subindexes for capital, labor, and materials inputs
X has the following values: 1997: 2.1% 1998: 2.2% 1999: 2.3% 2000: 2.4% 2001: 2.5%
X has three components: 0.5% industry productivity trend 1 .O% to reflect declining rate
base a consumer dividend that varies
annually
of Southern California Gas Company
Jurisdic- tion
California
"An Application for Approval of Rates, Tolls, Charges, and Terms and Conditions of Service for Core Customers for 1998 through to 2002." Alberta Energy and Utilities Board Decision U98060 File 1502-1 (March 3 1,1998). Docket EL95-003, 1995
Freeze Bundled Power Service
Benefit Sharing Mechanism
A consumer divi- dend that increases from 0.6% in 1997 to 1.0% in 2001 in 0.1% an- nual increments
Earnings sharing beginning 25 basis points above the bench- mark return on eq- uity; there are nine shar- ing bands, with shareholders' portion of incre- mental earnings increasing from 25% to 100% as ROE increases
to Adopt Per-
Company / Term of Plan
Southern Cali- fornia Gas 1997-2002
"In the Matter of
None
Docket EL 95-003 1995.
Northwestern Utilities 1999-2002
Fixed price increases of: 1999: .5% 2000: 1% 2001: 1% 2002: 2%
Bundled Power Service
200 basis points > NEB return then 50% reduction in rate increase 300 b.p. > NEB return then 75% reduction 400 b.p. >NEB return then no increase in rates 300 b.p. < NEB return then 50% increase in rates
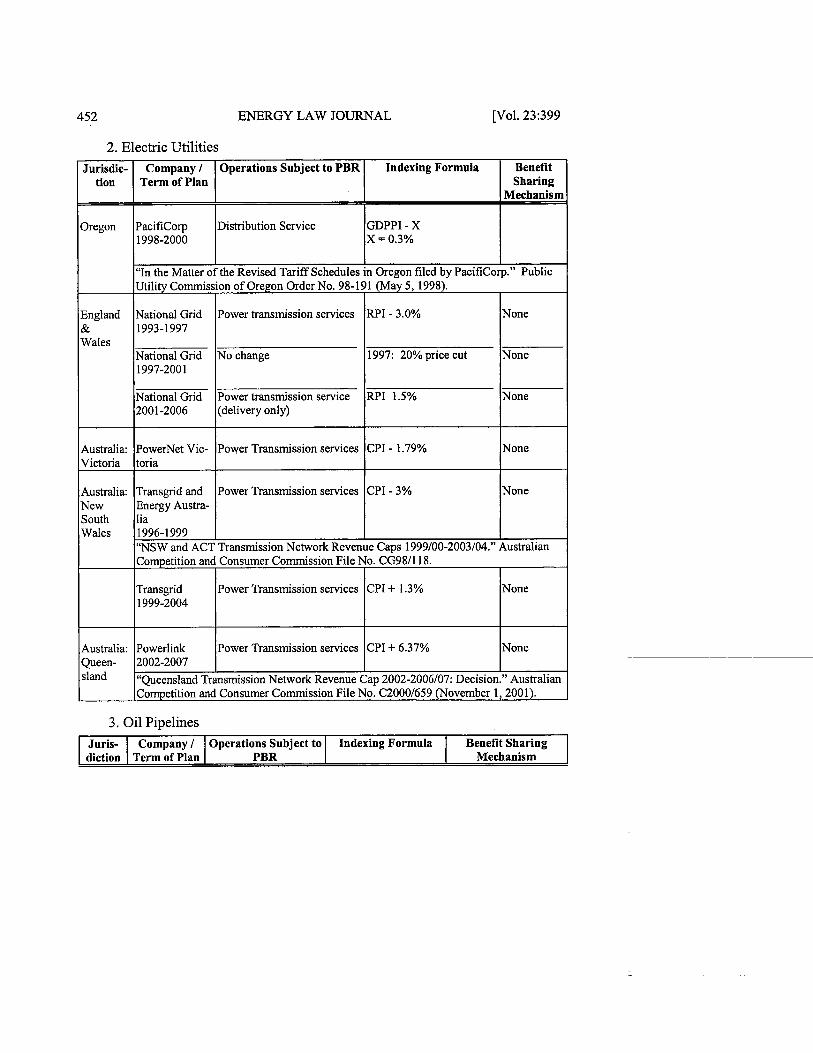
452 ENERGY LAW JOURNAL [Vol. 23:399
2. Electric Utilities
3. Oil Pipelines
Indexing Formula
GDPPI - X X = 0.3%
Operations Subject to PBR
Distribution Service
Jurisdic- tion
Oregon
Benefit Sharing
Mechanism
Company 1 Term of Plan
PacifiCorp 1998-2000
England & Wales
Australia: Victoria
Australia: New South Wales
Australia: Queen- sland
Indexing Formula Operations Subject to PBR
Juris- diction
"In the Matter of the Revised Tariff Schedules in Oregon filed by PacifiCorp." Public
Benefit Sharing Mechanism
Company 1 Term of Plan
None
None
None
None
None
Utility Commission of Oregon Order No. 98-191 (May 5, 1998).
RPI - 3.0%
1997: 20% price cut
RPI 1.5%
CPI - 1.79%
CPI - 3%
National Grid 1993-1997
National Grid 1997-2001
National Grid 2001 -2006
PowerNet Vic- toria
Transgrid and Energy Austra- lia 1996-1 999 "NSW and ACT Transmission Network Revenue Caps 1999100-2003104." Australian Competition and Consumer Commission File No. CG981118.
Power transmission services
No change
Power transmission service (delivery only)
Power Transmission services
Power Transmission services
None
None
"Queensland Transmission Network Revenue Cap 2002-2006107: Decision." Australian Competition and Consumer Commission File No. C20001659 (November 1,2001).
CPI + 1.3%
CPI + 6.37%
Transgrid 1999-2004
Powerlink 2002-2007
Power Transmission services
Power Transmission services
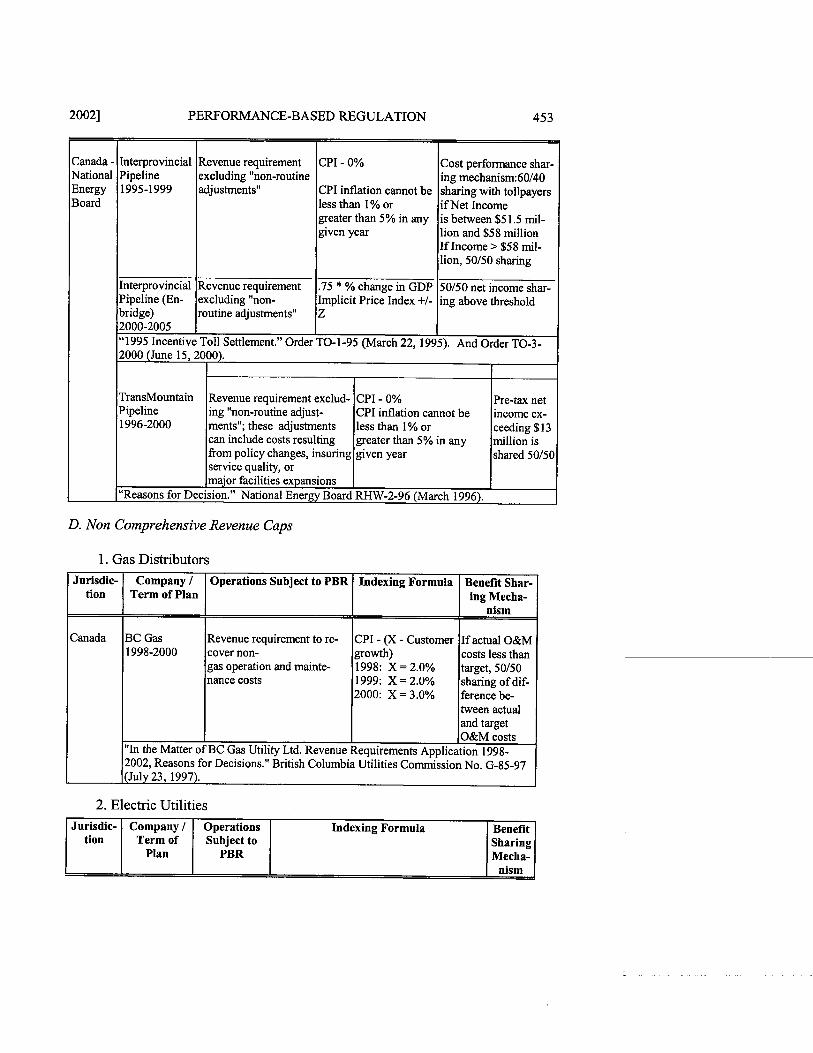
20021 PERFORMANCE-BASED REGULATION 453
Canada. National Energy Board
- I
Interprovincial Pipeline (En- bridge) 2000-2005
from policy changes, insuring given year service aualitv. or I
Interprovincial Pipeline 1995-1 999
TransMountain Pipeline 1996-2000
. - - lmajor facilities expansions I I
"Reasons for Decision." National Energy Board RHW-2-96 (March 1996).
"1995 Incentive Toll Settlement." Order TO-1-95 (March 22, 1995). And Order TO-3- 2000 (June 15,2000).
I I
Revenue requirement excluding "non- routine adjustments"
D. Non Comprehensive Revenue Caps
Revenue requirement excluding "non-routine adjustments"
Revenue requirement exclud- ing "non-routine adjust- ments"; these adjustments can include costs resulting
1. Gas Distributors
.75 * % change in GDP Implicit Price Index +/- Z
CPI - 0%
CPI inflation cannot be less than 1 % or greater than 5% in any given year
50150 net income shar- ing above threshold
CPI - 0% CPI inflation cannot be less than 1 % or greater than 5% in any
2. Electric Utilities
Cost performance shar- ing mechanism:60/40 sharing with tollpayers if Net Income is between $5 1.5 mil- lion and $58 million If Income > $58 mil- lion, 50150 sharing
Pre-tax net income ex- ceeding $13 million is
Jurisdic- tion
Canada
"In the Matter of BC Gas Utility Ltd. Revenue Requirements Application 1998- 2002, Reasons for Decisions." British Columbia Utilities Commission No. G-85-97 (July 23, 1997).
Indexing Formula
CPI - (X - Customer growth) 1998: X = 2.0% 1999: X = 2.0% 2000: X = 3.0%
Jurisdic- tion
Company I Term of Plan
BC Gas 1998-2000
Benefit Shar- ing Mecha-
nism
If actual O&M costs less than target, 50150 sharing of dif- ference be- tween actual and target O&M costs
Operations Subject to PBR
Revenue requirement to re- cover non- gas operation and mainte- nance costs
Company I Term of
Plan
Operations Subject to
PBR
Indexing Formula Benefit Sharing Mecha-
nism
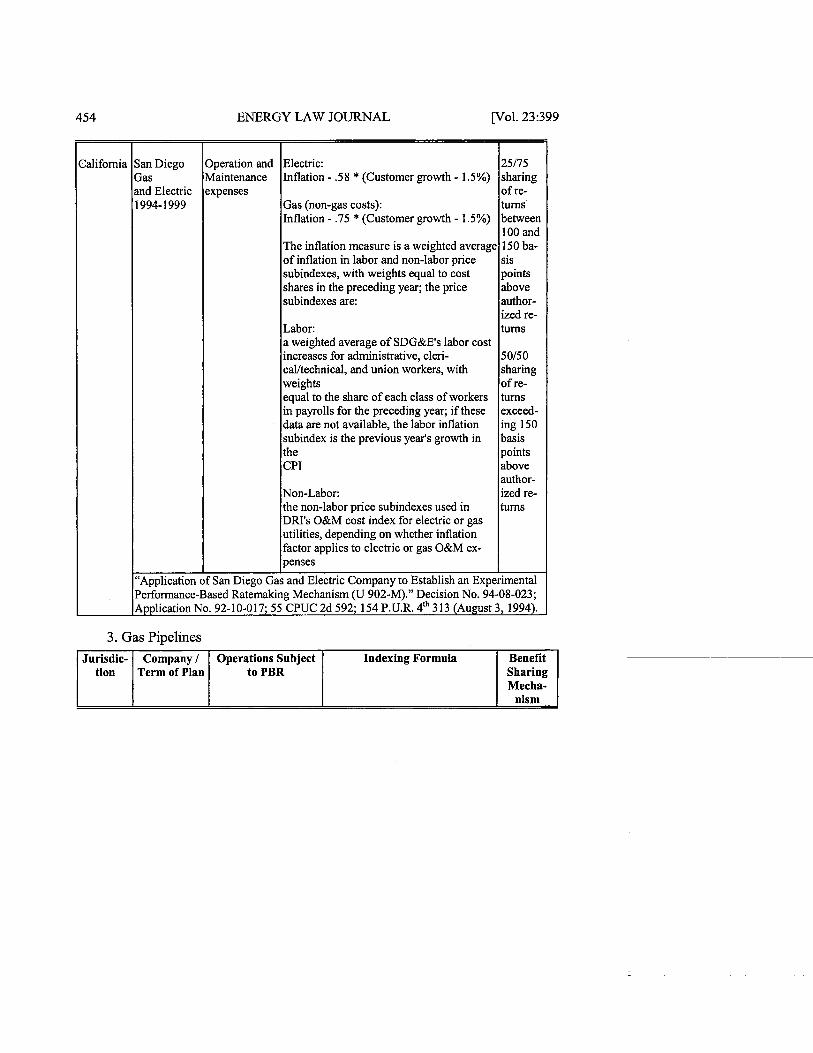
454 ENERGY LAW JOURNAL [Vol. 23:399
25/75 sharing of re- turns between 100 and 150 ba- sis points above author- ized re- turns
5 015 0 sharing of re- turns exceed- ing 150 basis points above author- ized re- turns
Experimental
California Operation and Maintenance expenses
of San Diego Gas
San Diego Gas and Electric 1994- 1999
"Application Performance-Based Ratemaking Mechanism (U 902-M)." Decision No. 94-08-023; Application No. 92-10-01 7; 55 CPUC 2d 592; 154 P.U.R. 4th 3 13 (August 3, 1994).
3. Gas Pipelines
Electric: Inflation - .58 * (Customer growth - 1.5%)
Gas (non-gas costs): Inflation - .75 * (Customer growth - 1.5%)
The inflation measure is a weighted average of inflation in labor and non-labor price subindexes, with weights equal to cost shares in the preceding year; the price subindexes are:
Labor: a weighted average of SDG&E1s labor cost increases for administrative, cleri- calltechnical, and union workers, with weights equal to the share of each class of workers in payrolls for the preceding year; if these data are not available, the labor inflation subindex is the previous year's growth in the CPI
Non-Labor: the non-labor price subindexes used in DRI's O&M cost index for electric or gas utilities, depending on whether inflation factor applies to electric or gas O&M ex- penses
and Electric Company to Establish an
Benefit Sharing Mecha-
nism
Jurisdic- tion
Operations Subject to PBR
Company / Term of Plan
Indexing Formula
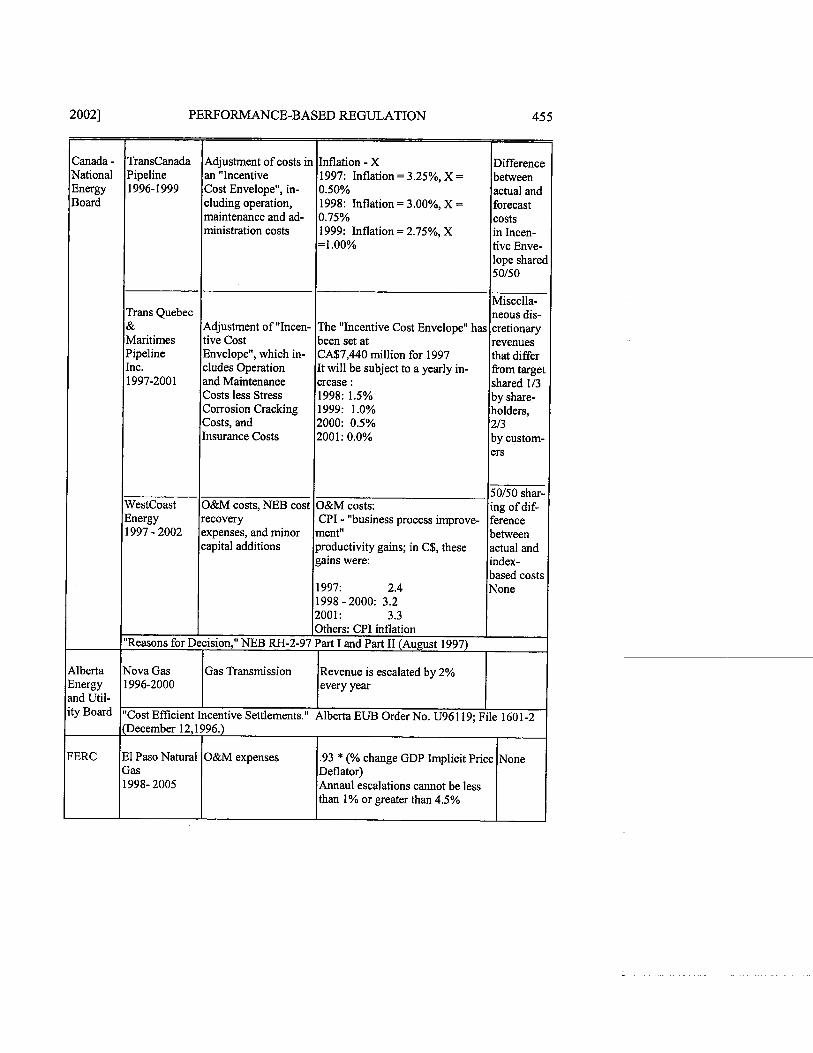
PERFORMANCE-BASED REGULATION
Canada - National Energy Board
Alberta Energy and Util- ity Board
FERC
TransCanada Pipeline 1996-1999
Trans Quebec & Maritimes Pipeline Inc. 1997-2001
Westcoast Energy 1997 - 2002
"Reasons for
Adjustment of costs in an "Incentive Cost Envelope", in- cluding operation, maintenance and ad- ministration costs
Adjustment of "Incen- tive Cost Envelope", which in- cludes Operation and Maintenance Costs less Stress Corrosion Cracking Costs, and Insurance Costs
O&M costs, NEB cost recovery expenses, and minor capital additions
Decision," NEB RH-2-97
1601-2
Inflation - X 1997: Inflation = 3.25%, X = 0.50% 1998: Inflation = 3.00%, X = 0.75% 1999: Inflation = 2.75%, X =1.00%
The "Incentive Cost Envelope" has been set at CA$7,440 million for 1997 It will be subject to a yearly in- crease : 1998: 1.5% 1999: 1 .O% 2000: 0.5% 2001: 0.0%
O&M costs: CPI - "business process improve-
ment" productivity gains; in C$, these gains were:
1997: 2.4 1998 - 2000: 3.2 2001: 3.3 Others: CPI inflation Part I and Part I1 (August 1997)
Nova Gas 1996-2000
Difference between actual and forecast costs in Incen- tive Enve- lope shared 5 015 0
Miscella- neous dis- cretionary revenues that differ from target shared 113 by share- holders, 213 by custom- ers
50150 shar- ing of dif- ference between actual and index- based costs None
"Cost Efficient Incentive Settlements." Alberta EUB Order No. U96119; File (December 12,1996.)
Gas Transmission
El Paso Natural Gas 1998- 2005
Revenue is escalated by 2% every year
O&M expenses .93 * (% change GDP Implicit Price Deflator) Annaul escalations cannot be less than 1% or greater than 4.5%
None
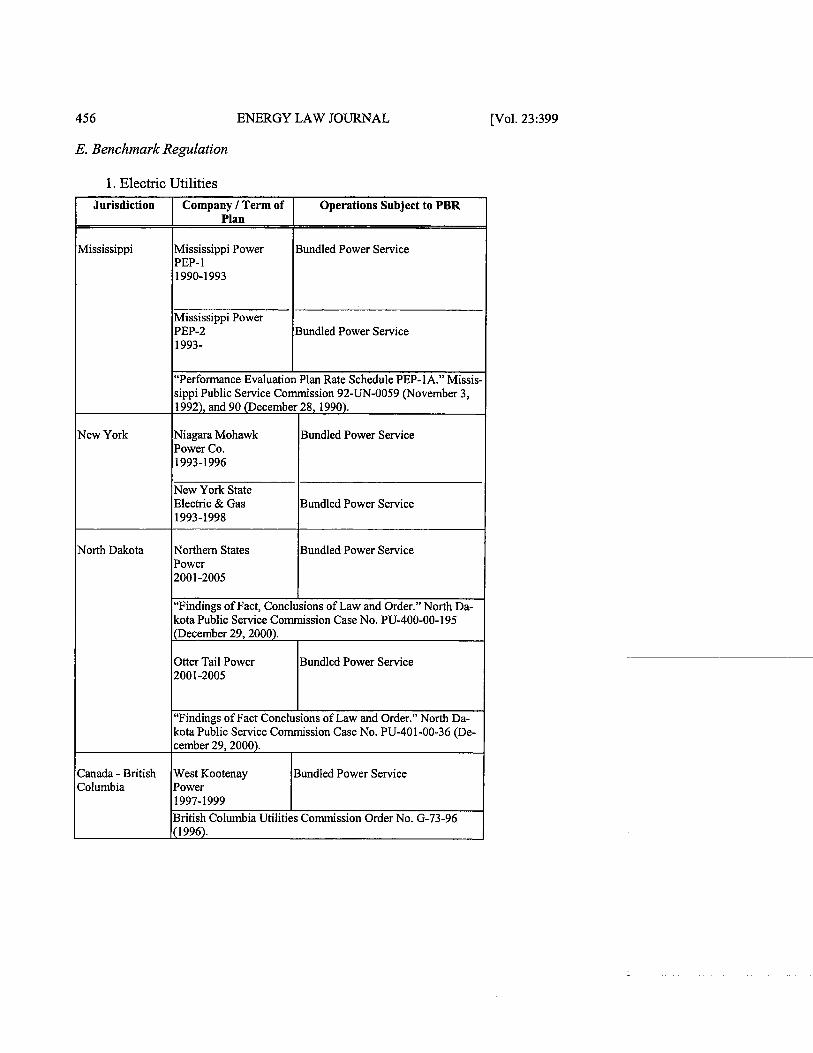
456 ENERGY LAW JOURNAL
E. Benchmark Regulation
1. Electric Utilities
[Vol. 23:399
Jurisdiction
Mississippi
New York
North Dakota
Canada - British Columbia
Company 1 Term of Plan
Mississippi Power PEP- I 1990-1993
Mississippi Power PEP-2 1993-
Operations Subject to PBR
Bundled Power Service
Bundled Power Service
"Performance Evaluation Plan Rate Schedule PEP-1 A." Missis- sippi Public Service Commission 92-UN-0059 (November 3, 1992), and 90 (December 28,1990).
Niagara Mohawk Power Co. 1993-1996
New York State Electric & Gas 1993-1998
Northern States Power 2001 -2005
Bundled Power Service
Bundled Power Service
Bundled Power Service
"Findings of Fact, Conclusions of Law and Order." North Da- kota Public Service Commission Case No. PU-400-00-195 (December 29,2000).
Otter Tail Power 2001 -2005
Bundled Power Service
"Findings of Fact Conclusions of Law and Order." North Da- kota Public Service Commission Case No. PU-401-00-36 (De- cember 29,2000).
West Kootenay Power 1997-1999
Bundled Power Service
British Columbia Utilities Commission Order No. G-73-96 (1 996).
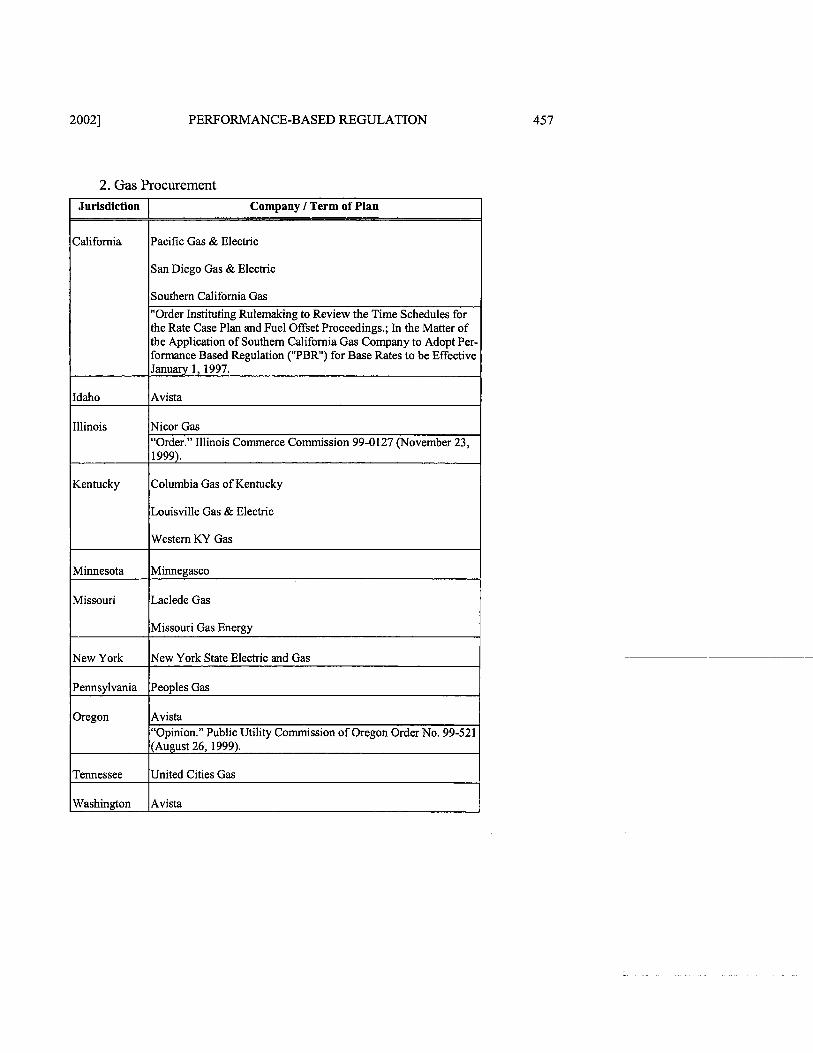
20021 PERFORMANCE-BASED REGULATION
2. Gas Procurement Jurisdiction
California
Idaho
Illinois
Kentucky
Minnesota
Missouri
New York
Pennsylvania
Oregon
Tennessee
Washington
Company I Term of Plan
Pacific Gas & Electric
San Diego Gas & Electric
Southern California Gas
"Order Instituting Rulemaking to Review the Time Schedules for the Rate Case Plan and Fuel Offset Proceedings.; In the Matter of the Application of Southern California Gas Company to Adopt Per- fonnance Based Regulation ("PBR") for Base Rates to be Effective January 1, 1997.
Avista
Nicor Gas "Order." Illinois Commerce Commission 99-0127 (November 23, 1999).
Columbia Gas of Kentucky
Louisville Gas & Electric
Western KY Gas
Minnegasco
Laclede Gas
Missouri Gas Energy
New York State Electric and Gas
Peoples Gas
Avista "Opinion." Public Utility Commission of Oregon Order No. 99-521 (August 26, 1999).
United Cities Gas
Avista