Embed Size (px)
Citation preview

www.bu.edu/bhr
Published by the Boston University School of Hospitality Administration
The hotel industry’s Achilles Heel? Quantifying the
negative impacts of Airbnb on Boston’s hotel
performance
By Tarik Dogru, Makarand Mody, and Courtney Suess,
Fall 2017, Volume 5, Issue 3
© Copyright 2017 by Boston University

pg. 1
By Tarik Dogru, PhD, Makarand Mody, PhD, Courtney Suess, PhD
Airbnb is the largest firm in the sharing economy marketplace, with about 3 million listings, including entire homes, shared rooms, and private rooms—more than the world’s largest three hotel chains combined (IHG, Marriott, Hilton, 2.58 M listings). It has hosted about 50 million guests in 5 years, 30 million of whom were hosted in 2015 alone (Airbnb Summer Travel Report, 2015). Furthermore, Airbnb is valued at around $31 billion. Due to its meteoric rise in popularity and, more importantly, its uncalculated potential impact, it has been in the center of discussions in the world of hospitality and beyond. Specifically, Airbnb might negatively affect the hotel industry if visitors were to shift their demand from hotels to Airbnb accommodations. However, it is not clear whether Airbnb is taking a part from the existing pie or increasing the size of the pie itself.
The increasing number of Airbnb listings might also have undesirable effects on the residential housing market. Homeowners might simply turn their properties into Airbnb listings if they believe they could make more money, which may exacerbate already existing housing problems in cities (Lee, 2016). Furthermore, Airbnb could have an adverse impact on the residents’ quality of life because of nuisances caused by visitors.
The course and the magnitude of these impacts, however, do not go beyond speculation, with the exception of some empirical evidence on the economic impacts supporting both proponents and critics of Airbnb. The results from the most comprehensive study analyzing the effects of Airbnb on the hotel industry showed that a 1% increase in Airbnb listings decreases hotel revenue by 0.04% (Zervas, Proserpio, & Byers, 2016). However, a recent study conducted
pg. 2
by STR reported that Airbnb listings did not affect hotel demand and revenues (Haywood, Mayock, Freitag, Owoo, & Fiorilla, 2017). As such, the jury is still out on this issue.
While there are limited studies from which to draw definite conclusions about the effects of Airbnb on the hotel industry, Airbnb founder Brian Chesky claims that the company does not directly compete with the hotel industry because Airbnb guests are not typical hotel customers, but rather those who would have stayed with friends and family during the regular course of their travels (Intelligence, 2017). Although Airbnb argues that it brings new visitors to the markets and that 70% of its listings are outside of hotel districts, a report by Morgan Stanley indicates that about 42% and 36% of Airbnb guests switched from hotels and bed and breakfasts, respectively, whereas only 31% of Airbnb guests are those who would have stayed with friends and family (Intelligence, 2017), thus countering Mr. Chesky’s claims. Furthermore, a recent study conducted in Los Angeles showed that more than 60% of the properties listed on Airbnb are solely used for commercial purposes and are thus excluded from the residential real estate market (Lee, 2016). According to a recent report by CBRE, revenue generated by hosts renting two or more units was about $1.8 billion, and hosts renting ten or more units generated $175 million in 13 major US markets in 2016 (CBRE, 2017).
Airbnb is considered to be one of the major competitors of the traditional lodging industry, considering its market share, value, and potential economic impacts. In a recent study, we analyzed whether Airbnb directly competes with hotels in Boston (see Dogru, Mody, & Suess, 2017). We simply compared Airbnb dynamics with those of the hotel market, including supply, demand, occupancy, ADR, RevPAR, and market share. This study was descriptive in nature mainly due to the unavailability of data and was thus limited in its ability to draw a conclusion about the causal effects of Airbnb on hotels in Boston. We have now obtained a comprehensive dataset that allows us to analyze the effects of Airbnb on hotels. Therefore, we examine the extent to which Airbnb supply affects hotel room revenues (RevPAR), average daily rate (ADR), and occupancy rates (OCC) in the Boston hotel market for the period between July 2008 and June 2017.
Airbnb and Hotel Data
In our analyses, we consider Airbnb an alternative accommodations company to analyze the effects of Airbnb supply on hotels. The cumulative number of listings created (including entire homes and private and shared rooms) since the introduction of Airbnb constitutes Airbnb supply (hereafter referred to as “total cumulative listings”). Further, we also measure the cumulative number of listings created (including entire homes and private and shared rooms) since the introduction of Airbnb that were active within the past twelve months. That is, an Airbnb unit must have been rented at least once within the past twelve months to be included in our alternative measure of Airbnb supply (referred to hereafter as “active cumulative listings”).
The Airbnb data were obtained from Airdna, a company that provides data and analytics to entrepreneurs, investors, and academic researchers. Hotel data, inclusive of hotels within the Boston metropolitan statistical area (MSA), were provided by Smith Travel Research (STR). The Airbnb data also includes listings from MSA. Put simply, the Airbnb supply and Boston hotel market goes beyond the city of Boston and comprise hotels from the “Greater Boston” area.

pg. 3
Column 1 (i.e., All Listings) of Table 1
presents the cumulative total number of
listings (i.e., Airbnb supply) as of June
2017, including entire homes, private
rooms, and shared rooms, created from
the introduction of Airbnb in Boston in
July 2008. Column 5 of Table 1 presents
the cumulative total Airbnb listings as of
June 2017 that were created since the
introduction of the Airbnb and were still
active within the past 12 months. As the
data shows, 16,160 out of 28,957 listings
created were still active as of June 2017.
Airbnb supply has increased dramatically
from 4 units in July 2008 to 28,957units
in June 2017. The extreme increase in Airbnb supply is due to the superior flexibility in adding
existing residential properties in the market. Indeed, this gives an unfair advantage to Airbnb
in competing against the hotel industry because adding a new hotel to the market might take
several years.
Table 1. Total number of listings created from the introduction of Airbnb as of June 2017 Total cumulative listings Active cumulative listings*
Year All Listings (1)
Entire Home
(2)
Private Room
(3)
Shared Room (4)
All Active Listings (5)
Entire Home (6)
Private Room (7)
Shared Room (8)
2008 4 2 2 - 3 2 1 -
2009 59 34 25 - 43 25 18 -
2010 169 90 79 - 119 60 59 -
2011 371 177 189 5 252 118 130 4
2012 861 432 414 15 526 265 253 8
2013 2,214 1,082 1,094 38 1,221 601 604 16
2014 6,295 3,162 3,009 124 2,673 1,372 1,267 34
2015 14,392 7,126 6,882 384 6,202 3,214 2,883 105
2016 23,981 11,890 11,389 702 13,980 7,149 6,498 333
2017 28,957 14,288 13,798 834 16,160 8,152 7,593 395
*Listings with at least one booking within the past 12 months as of June 2017
In addition to the total number of Airbnb listings, it is also important to see the extent to which entire homes, private rooms, and shared rooms constitute the total Airbnb supply. Columns 2, 3, and 4 of Table 1 present cumulative Airbnb supply for entire homes, private rooms, and shared rooms, while Columns 6,7, and 8 present respective figures for our alternative metric of Airbnb supply, active cumulative listings.
1Airbnb host Jennifer Lawrence offers a pull-out couch with nearby
toiletries that she rents in the living room of her Somerville home on July 12, 2014. Photo source: Boston Globe.

pg. 4
To put these figures in perspective, we present the percentages of the supply of entire homes, private rooms, and shared rooms since the introduction of Airbnb in Table 2. Entire home listings comprised the majority of the total listings in Airbnb in most years. While the number of shared rooms appears to be negligible, the supply of private rooms constitutes the second largest Airbnb supply in the market.
Table 2. The percentage of entire home, private room, and shared room listings in Airbnb
Total cumulative listings Active cumulative listings*
Year Entire Home
Private Room
Shared Room
Entire Home
Private Room
Shared Room
2008 50% 50% 0.0% 66.6% 33.3% 0.0%
2009 57.6% 42.3% 0.0% 58.1% 41.8% 0.0%
2010 53.2% 46.7% 0.0% 50.4% 49.6% 0.0%
2011 47.7% 50.1% 1.3% 46.8% 51.5% 1.6%
2012 50.2% 48.1% 1.7% 50.3% 48.1% 1.5%
2013 48.8% 49.4% 1.7% 49.2% 49.4% 1.3%
2014 50.2% 47.8% 1.9% 51.3% 47.4% 1.2%
2015 49.5% 47.8% 2.6% 51.8% 46.4% 1.7%
2016 49.5% 47.4% 2.9% 51.1% 46.4% 2.4%
2017 49.3% 47.6% 2.89% 50.4% 46.9% 2.4%
*Listings with at least one booking within the past 12 months as of June 2017
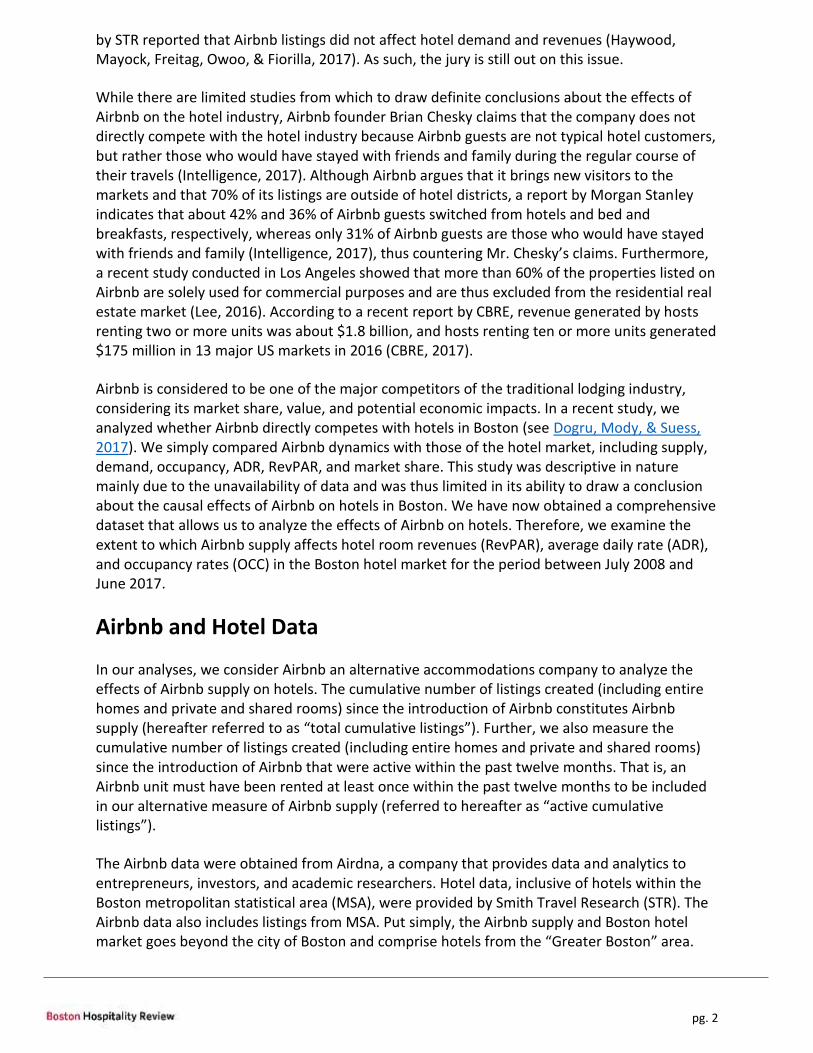
While the number of listings has reached a striking level within a relatively short period of time, the speed at which new properties are added to the market is even more striking. Figure 1 presents the year-over-year change in Airbnb supply that has remained active within the past 12 months in Boston. Accordingly, the number of total listings that were still active as of June 2017 has increased dramatically by more than 100% each year. The ability to add existing residential properties to the market as part of the Airbnb property supply increases the potential for adverse effects on hotels. As an accommodations platform, Airbnb offers properties that are alternatives to hotels but does not play by the same rules as hoteliers. Adding properties with a pace of 100% increase every year makes hotels vulnerable to the adverse economic effects of Airbnb. Therefore, we further examined the extent to which Airbnb affects the key performance metrics for the hotel industry in Boston.

pg. 5
Figure 1. Year over year change in Airbnb supply
The effects of Airbnb on Hotel RevPAR, ADR, and OCC
We utilized a panel data fixed effect regression technique to examine the effects of Airbnb supply on hotel revenues. Similar to the methodology employed in Zervas et al. (2016), we treated Airbnb supply as a variable intervention in time against hotel data in Boston. In particular, this technique allows for the analysis of Airbnb’s effects on hotel revenues by comparing differences in hotel revenues before and after Airbnb’s entry in Boston. We examine the effects of Airbnb supply on hotel room revenues using two measures of Airbnb supply. First, we use cumulative total Airbnb listings that were created since the introduction of Airbnb. Second, we use cumulative total Airbnb listings that were created since the introduction of Airbnb and were still active within 12 months prior to June 2017. We consider an Airbnb listing active if the unit had been booked at least once within the prior 12 months. We also include a number of control variables that might potentially affect hotel room revenues regardless of Airbnb’s entry in these markets. Specifically, we control for the effects of hotel room supply, number of employees in the hospitality sector, population, unemployment rate, and number of airport arrivals in Boston. Table 3 presents the results from the DD regression for the effects of Airbnb supply, both total and active Airbnb supply, on hotel RevPAR, ADR, and OCC.

pg. 6
Table 3. The effects of Airbnb on Hotel Performances in Boston
Total Airbnb Supply Active Airbnb Supply RevPAR ADR OCC RevPAR ADR OCC
Log Airbnb Supply -0.025a
(-4.64)
-0.019a
(-4.30)
-0.003c
(-1.67)
-0.027a
(-4.70)
-0.022a
(-4.86)
-0.002
(-1.22)
Log Hotel Supply -2.32a
(-5.75)
0.03
(0.09)
-1.55a
(-9.34)
-2.26a
(-5.66)
0.04 (0.13)
-1.52a
(-9.23)
Log Population 1.98c
(1.70)
-0.96
(-1.01)
1.93a (4.00)
1.86
(1.59)
-1.10
(-1.18)
1.93a (3.99)
Log Hospitality Employees
2.13a
(4.91)
1.50a (4.28)
0.41b (2.30)
2.12a
(4.95)
1.61a (4.69)
0.35b (1.98)
Log Airport Arrivals
0.63a
(3.63)
0.26c (1.85)
0.25a (3.53)
0.64a
(3.71)
0.27c (1.95)
0.25a (3.53)
Unemployment Rate
-0.05
(-0.04)
-0.74
(-0.81)
0.49
(1.05)
-0.02
(-0.02)
-0.52
(-0.58)
0.38
(0.83)
Constant -39.26a
(-2.84)
0.01
(0.00)
-24.71a
(-4.35)
-37.73a
(-2.74)
1.09 (0.10)
-24.45a
(-4.29)
Adjusted R-Square 0.97 0.91 0.97 0.97 0.91 0.97
t-statistics are in parenthesis. a, b, and c denote 1%, 5%, and 10% statistical significance levels, respectively.
The results show that hotel RevPAR, ADR, and OCC were negatively affected by Airbnb. Specifically, a 1% increase in Airbnb supply decreases hotel RevPAR by 0.025% and ADR by 0.02%. These effects might be seen as marginal if Airbnb supply was increasing at only a 1% level. However, our data showed that Airbnb has been increasing more than 100% year-over-year. Thus, a 100% increase in Airbnb supply (as has been the case consistently since 2008) decreases hotel RevPAR by around 2.5%.
We further examined the effects of active Airbnb supply on hotel RevPAR because some of the existing listings might have been inactive and hence might not necessarily affect hotels. Nevertheless, the findings were similar to those of all Airbnb supply. That is, a 100% increase in Airbnb supply decreases hotel RevPAR by 2.7%.
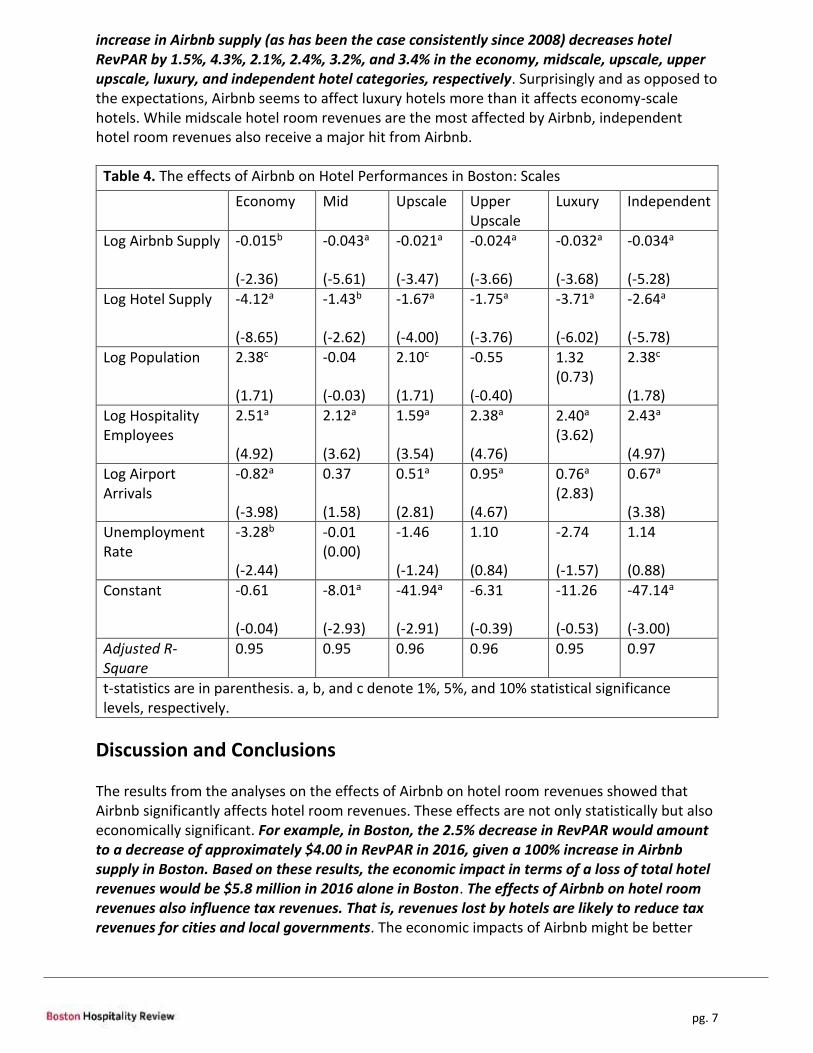
In addition to the examination of Airbnb’s effect on overall Boston hotel market, we also analyzed the effects of Airbnb on the various hotel class segments. The results show that each class segment is negatively impacted by Airbnb. Specifically, a 1% increase in Airbnb decreases hotel RevPAR by 0.015%, 0.043%, 0.021%, 0.024%, 0.032%, and 0.034% in the economy, midscale, upscale, upper upscale, luxury, and independent hotel categories, respectively. Again, these effects might be considered minimal if Airbnb supply was increasing at only a 1% level, but Airbnb supply has been increasing by over 100% year-over-year. Therefore, a 100%
pg. 7
increase in Airbnb supply (as has been the case consistently since 2008) decreases hotel RevPAR by 1.5%, 4.3%, 2.1%, 2.4%, 3.2%, and 3.4% in the economy, midscale, upscale, upper upscale, luxury, and independent hotel categories, respectively. Surprisingly and as opposed to the expectations, Airbnb seems to affect luxury hotels more than it affects economy-scale hotels. While midscale hotel room revenues are the most affected by Airbnb, independent hotel room revenues also receive a major hit from Airbnb.
Table 4. The effects of Airbnb on Hotel Performances in Boston: Scales
Economy Mid Upscale Upper Upscale
Luxury Independent
Log Airbnb Supply -0.015b
(-2.36)
-0.043a
(-5.61)
-0.021a
(-3.47)
-0.024a
(-3.66)
-0.032a
(-3.68)
-0.034a
(-5.28)
Log Hotel Supply -4.12a
(-8.65)
-1.43b
(-2.62)
-1.67a
(-4.00)
-1.75a
(-3.76)
-3.71a
(-6.02)
-2.64a
(-5.78)
Log Population 2.38c
(1.71)
-0.04
(-0.03)
2.10c
(1.71)
-0.55
(-0.40)
1.32 (0.73)
2.38c
(1.78)
Log Hospitality Employees
2.51a
(4.92)
2.12a
(3.62)
1.59a
(3.54)
2.38a
(4.76)
2.40a (3.62)
2.43a
(4.97)
Log Airport Arrivals
-0.82a
(-3.98)
0.37
(1.58)
0.51a
(2.81)
0.95a
(4.67)
0.76a (2.83)
0.67a
(3.38)
Unemployment Rate
-3.28b
(-2.44)
-0.01 (0.00)
-1.46
(-1.24)
1.10
(0.84)
-2.74
(-1.57)
1.14
(0.88)
Constant -0.61
(-0.04)
-8.01a
(-2.93)
-41.94a
(-2.91)
-6.31
(-0.39)
-11.26
(-0.53)
-47.14a
(-3.00)
Adjusted R-Square
0.95 0.95 0.96 0.96 0.95 0.97
t-statistics are in parenthesis. a, b, and c denote 1%, 5%, and 10% statistical significance levels, respectively.
Discussion and Conclusions
The results from the analyses on the effects of Airbnb on hotel room revenues showed that Airbnb significantly affects hotel room revenues. These effects are not only statistically but also economically significant. For example, in Boston, the 2.5% decrease in RevPAR would amount to a decrease of approximately $4.00 in RevPAR in 2016, given a 100% increase in Airbnb supply in Boston. Based on these results, the economic impact in terms of a loss of total hotel revenues would be $5.8 million in 2016 alone in Boston. The effects of Airbnb on hotel room revenues also influence tax revenues. That is, revenues lost by hotels are likely to reduce tax revenues for cities and local governments. The economic impacts of Airbnb might be better

pg. 8
observed once the sharing economy market is regulated. Therefore, future studies are necessary to analyze the tax implications of Airbnb listings.
Nevertheless, Airbnb has become a major phenomenon as an alternative platform for potential hotel guests. Moreover, while Airbnb may provide economic benefits to consumers, it may also offer social benefits (Dogru & Pekin, 2017). Also, Airbnb accommodations may provide substantial economic and social benefits to the city of Boston if these listings are used to accommodate additional tourists. During peak seasons or in the cases of mega-events like the Olympics, the availability of supplementary Airbnb rentals may be more beneficial than building hotels that will later not be utilized at optimal levels (Dogru, 2016).
The sharing economy phenomenon and the economic, social, and technological changes fueling its growth have challenged the hotel industry to rethink its experiential value proposition to the customer (Mody, Suess, & Lehto, 2017). Therefore, traditional hotels should create more opportunities for unique experiences, post more photos of the hotel and guest rooms, provide a family friendly environment, and offer activities for families. In particular, hotel firms might offer alternative packages to attract Airbnb guests, especially when operating at lower occupancies.
This study was an overall investigation of Boston hotel market at the MSA level. Further analyses are necessary to investigate the effects of Airbnb at neighborhood and property levels. Also, additional analysis is required to determine the extent to which Airbnb’s effects on asset-heavy REITs or franchising and management companies vary. Most importantly, overall economic and social impacts of Airbnb on the greater economy (e.g.tax revenues and residents’ quality of life) need to be examined. Therefore, further investigations are necessary to measure the economic and social impacts of Airbnb.
Summary of key findings
Airbnb supply has increased dramatically and consistently by over 100% each year, between 2008 and 2017. The majority of this supply has been entire home listings. The flexibility and ease of adding new supply, owing to the lack of governmental? regulation, gives Airbnb an unfair advantage in competing against the hotel industry, because adding a new hotel to the market might take several years.
Using a difference in difference (DD) regression analysis, and controlling for a variety of hotel demand and revenue drivers, we found that a 1% increase in Airbnb supply decreases hotel RevPAR by 0.025% and ADR by 0.02%. Thus, a 100% increase in Airbnb supply (as has been the case consistently since 2008) decreases hotel RevPAR by around 2.5%. The effects of “active” Airbnb supply on hotel revenue are higher (2.7% decrease in RevPAR).
Similarly, a 100% increase in Airbnb supply (as has been the case consistently since 2008) decreases hotel RevPAR by between 1.5% and 4.3% across the various hotel class segments. While the impact is most pronounced for midscale hotels (4.3%), somewhat surprisingly, luxury hotels have also taken a significant hit (3.2% decrease in RevPAR).
The loss in RevPAR has significant economic implications for the hotel industry. For example, the 2.5% decrease in RevPAR in 2016 alone would amount to a total loss in hotel revenues of $5.8 million in Boston and, consequently, a loss of taxation for city

pg. 9
and state governments. Over time, at a 100% increase in Airbnb supply every year, these losses add up, and their resulting impacts on other economic vitality indicators for the industry, such as employment rate, and social impact indicators can be significant and must be examined in future research.

pg. 10
Tarik Dogru earned his Ph.D. in Hospitality Management from University of South
Carolina, and holds Master’s degree in Business Administration from Zonguldak
Karaelmas University in Turkey.Prior to joining the Boston University School of
Hospitality Administration faculty, he was an adjunct faculty at University of South
Carolina (2013-2016) and research assistant at Ahi Evran University (2009-2012) in
Turkey. He has taught a variety of courses, including Economics, Finance,
Accounting, Hospitality, and Tourism in business and hospitality schools. He is a
Certified Hospitality Educator (CHE) and holds Certification in Hotel Industry
Analytics (CHIA) from American Hotel & Lodging Educational Institute. Tarik’s research interest’s span a
wide range of topics in hospitality finance, corporate finance, behavioral finance, real estate investment
trusts (REITs), hotel investments, tourism economics, and climate change.
Makarand Mody, Ph.D. has a varied industry background. He has worked with
Hyatt Hotels Corporation in Mumbai as a Trainer and as a Quality Analyst with
India’s erstwhile premier airline, Kingfisher Airlines. His most recent experience has
been in the market research industry, where he worked as a qualitative research
specialist with India’s leading provider of market research and insights, IMRB
International. Makarand’s research is based on different aspects of marketing and
consumer behavior within the hospitality and tourism industries. He is published in
leading journals in the field, including the International Journal of Contemporary Hospitality
Management, Tourism Management Perspectives, Tourism Analysis and the International Journal of
Tourism Anthropology. His work involves the extensive use of inter and cross-disciplinary perspectives to
understand hospitality and tourism phenomena. Makarand also serves as reviewer for several leading
journals in the field. In fall 2015, he joined the faculty at the Boston University School of Hospitality
Administration (SHA). He received his Ph.D. in Hospitality Management from Purdue University, and also
holds a Master’s degree from the University of Strathclyde in Scotland.
Courtney Raeisinafchi, Ph.D spent 6 years designing and developing hotels and restaurants with Jordan Mozer and Associates, Ltd., an architecture firm based in Chicago, IL, after completing a bachelors degree at the School of the Art Institute of Chicago where she studied architecture. Some notable projects she was involved in includes Marriott’s Renaissance Hotel, Times Square and Hotel 57 in Manhattan, NY; both hotels have received the International Hotel , Motel and Restaurant Society’s Golden Key Awards for Best hotel design. While drafting new proposals for hospitality projects for Jordan Mozer and Associates in Southeast Asia, she
began a masters degree, studying hospitality administration, at the University of Nevada, Las Vegas (UNLV) in Singapore. After graduating, she continued to complete her doctoral degree in Hospitality Administration at UNLV in Las Vegas and studied towards a second masters degree in architecture at UNLV’s School of Architecture. Courtney joined the Boston University School of Hospitality Administration in 2013. She teaches the Design and Development Class as well as Lodging Operations and Technology. She is an active quantitative researcher on the topics of hospitality development and built environments, as well as design and atmospherics impacts on consumer behavior.

pg. 11
References
CBRE. (2017). Hosts with Multiple Units – A Key Driver of Airbnb Growth. Retrieved from https://www.ahla.com/sites/default/files/CBRE_AirbnbStudy_2017.pdf
Dogru, T. (2016). Development of the Hotel Industry in China: Mega-Events, Opportunities, and Challenges. E-review of Tourism Research, 13.
Dogru, T., Mody, M., & Suess, C. (2017). Comparing apples and oranges? Examining the impacts of Airbnb on hotel performance in Boston. Boston Hospitality Review, 5(2).
Dogru, T., & Pekin, O. (2017). What do guests value most in Airbnb accommodations? An application of the hedonic pricing approach. 2017, 5(2).
Haywood, J., Mayock, P., Freitag, J., Owoo, K. A., & Fiorilla, B. (2017). Airbnb & Hotel Performance: An analysis of proprietary data in 13 global markets. Retrieved from http://www.str.com/Media/Default/Research/STR_AirbnbHotelPerformance.pdf
Intelligence, B. (Producer). (2017). Airbnb CEO speaks on disrupting hotel industry. Retrieved from http://www.businessinsider.com/airbnb-ceo-speaks-on-disrupting-hotel-industry-2017-3
Lee, D. (2016). How Airbnb Short-Term Rentals Exacerbate Los Angeles's Affordable Housing Crisis: Analysis and Policy Recommendations. Harvard Law and Policy Review, 10, 229-253.
Mody, M., Suess, C., & Lehto, X. (2017). The Accommodations Experiencescape: A Comparative Assessment of Hotels and Airbnb. International Journal of Contemporary Hospitality Management.
Zervas, G., Proserpio, D., & Byers, J. W. (2016). The Rise of the Sharing Economy: Estimating the Impact of Airbnb on the Hotel Industry. Journal of Marketing Research, Research In-Press. doi:http://dx.doi.org/10.1509/jmr.15.0204