Embed Size (px)
Citation preview
NISTIR 8108
Performance Challenges
Identification Method for Smart
Manufacturing Systems
Kiwook Jung
Katherine Morris
Kevin W Lyons
Swee Leong
Hyunbo Cho
This publication is available free of charge from
httpdxdoiorg106028NISTIR8108
NISTIR 8108
Performance Challenges
Identification Method for Smart
Manufacturing Systems Kiwook Jung
Katherine Morris
Kevin W Lyons
Swee Leong
Systems Integration Division
Engineering Laboratory
NIST
Hyunbo Cho
Department of Industrial and Management Engineering
Pohang University of Science and Technology
This publication is available free of charge from
httpdxdoiorg106028NISTIR8108
February 2016
US Department of Commerce Penny Pritzker Secretary
National Institute of Standards and Technology
Willie May Under Secretary of Commerce for Standards and Technology and Director
Abstract
Smart Manufacturing Systems (SMS) need to be agile to adapt to new situations by using
detailed precise and appropriate data for intelligent decision-making The intricacy of
the relationship of strategic goals to operational performance across the many levels of a
manufacturing system inhibits the realization of SMS This paper proposes a method for
identifying what aspects of a manufacturing system should be addressed to respond to
changing strategic goals The method uses standard modeling techniques in specifying a
manufacturing system and the relationship between strategic goals and operational
performance metrics Two existing reference models related to manufacturing operations
are represented formally and harmonized to support the proposed method The method is
illustrated for a single scenario using agility as a strategic goal By replicating the
proposed method for other strategic goals and with multiple scenarios a comprehensive
set of performance challenges can be identified
i
Table of Contents
1 Introduction 1 2 Foundations 3
Harmonization of SCOR and SIMA via ontology 3 Representation of activities via IDEF0 6
3 SMS challenges identification method 8 Scope determination 10 Current manufacturing system representation 12 Enhanced manufacturing system 13 Planned manufacturing system representation 16 Gap analysis 16
4 Discussion 18 Reference models validity 19 Method validity 20
5 Conclusion and future work 20 6 Acknowledgement 20 7 Disclaimer 21 8 References 21
ii
1 Introduction
Smart Manufacturing Systems (SMS) are defined by the advent of new technologies that
promote rapid and widespread information flow within the systems and surrounding its
control [37 43] Along with these technologies however comes a greater need to be
able to respond to information quickly [8] and effectively thereby disrupting ongoing
processes SMS need to be agile to adapt to these challenges by using real-time data for
intelligent decision-making as well as predicting and preventing failures proactively [25
b] To support this agility SMS need to meet rigorous performance requirements where
performance measures accurately and effectively establish targets assure conformance to
these targets and flag performance issues as evidenced by deviations from performance
expectations [6] By putting in place a continuous performance assurance process
companies can ensure products are manufactured through verifiable manufacturing
processes
Both new and longstanding challenges at all levels of a manufacturing system inhibit the
realization of SMS The intricacy of describing these challenges stems from the grand
complexity of manufacturing systems This paper proposes a method for identifying
challenges by focusing on a particular aspect of a manufacturing system The proposed
method integrates two existing models related to manufacturing operations
The Supply Chain Operations Reference (SCOR) from the Supply Chain Council (SCC)
[45] and
The manufacturing activity models from the Systems Integration for Manufacturing
Applications (SIMA) Reference Architecture [4]
The goal of the SCC is to identify and promote best practices in the management and
operation of supply chain activities across many industries The SCOR reference model
provides a standard language for characterizing individual supply-chain activities The
SCOR model defines a system for organizing performance metrics and for associating
those metrics with strategic goals and business processes The SIMA Reference
Architecture defines a set of activities describing the engineering and operational aspects
of manufacturing a product from conception through production For this research we
have identified where the two models overlap when the business processes from SCOR
directly correspond with the more technical detailed and operational SIMA activities
Our intent in harmonizing these two models is to illustrate how performance metrics from
the business-focused SCOR model can be identified in the operational activities of the
SIMA model We base this mapping on the use of formal representation methods for
defining both models The SIMA model uses a formal activity modeling technique
known as IDEF0 To formalize the SCOR model which is presented in plain English we
use the Web Ontology Language [35] For IDEF0 which is a formal diagramming
technique we develop an ontology that facilitates the mapping between the different
viewpoints of the two models
1
Figure 1 depicts how performance metrics are identified in the SCOR context In this
example the agility goal is selected from the SCOR model The agility goal is defined as
the percentage of orders which are perfectly fulfilled when a disturbance is introduced
into the manufacturing system The disturbance in this case is a sudden increase in
customer demand [34]
(a) Current manufacturing system (b) Planned manufacturing system
Figure 1 Illustrative manufacturing system performance
The agility goal is shown to be a function of time to recovery and residual performance
Agility enables the manufacturing system to shorten the time to recovery while also
maintaining a high level of residual performance during the disturbance Parts (a) and (b)
in the figure illustrate a measurable improvement in agility between an existing system
and a planned system The challenge to improving agility is then reduced to challenges
in improving these two performance metrics While the goal of agility is not measured
directly performance metrics which are measurable are used to measure the capability of
the manufacturing system to achieve the goal [45] In this paper we explain how this
method can be consistently implemented for various goals and performance metrics using
the formal representation methods for the two foundation models
The remainder of this paper is organized as follows ldquoFoundationsrdquo reviews the
foundations to the proposed challenges identification method We describe the challenges
identification method in ldquoSMS challenges identification methodrdquo illustrate it with an
example and show how it can be used to identify challenges for performance assurance
ldquoDiscussionrdquo provides discussion on the proposed method in the context of continuous
improvement Finally we present our conclusion and discuss future work
2
2 Foundations
In this section we review the use of the two formal representation methods used in the
proposed challenges identification method the Web Ontology Language (OWL) [35] and
IDEF0 [19] models
Harmonization of SCOR and SIMA via ontology
We develop an ontology to represent the SCOR model and the SIMA activity model
Originally the SCOR model is presented in plain English whereas the SIMA activity
model is represented in IDEF0OWL is a knowledge representation language for
authoring ontologies It is based on description logic which is a subset of first order logic
Gruber defines an ontology as the specification of conceptualization in formal description
[15] An ontology is a set of shared definitions of classes properties and rules describing
the way those classes and properties are employed
In this paper we use the following notations for ontological constructs classes which
represent the concepts being captured in Bold the properties which describe the
concepts are in Italics with leading character in lowercase (groups) and individualsmdash
instances of the concepts reflecting the real world example are in Italics with leading
character in uppercase (Upside_Make_Flexibility)
There are three main benefits of encoding the reference models in OWL 1) structural
support for harmonization of existing information 2) querying capability and 3) reasoning
capability Structural support for harmonization of existing information is not discussed
in detail for this paper but the capability of the resulting ontology acquired from the
harmonization is discussed in the context of building the classification for manufacturing
operations from SCORrsquos process model and SIMArsquos activity model Querying capability
is illustrated in this paper in ldquoScope determinationrdquo It is used to help scope the analysis
Lastly reasoning capability is briefly highlighted below
The SCOR model is published as a nearly 1thinsp000 page long document The publisher
APICS (American Production and Inventory Control Society) recommends two days of
intensive training to learn the structure interpretation and use of SCOR framework
elements Representing this information using OWL provides improved accessibility to
users tools and knowledge engineers [3]
We use OWL to formally represent the major concepts and relationships described in
SCOR SCOR lends itself to representation in OWL in that it contains a rich network of
hierarchical definitions which are interconnected with each other Each of the abstract
concepts is hierarchically decomposed in the SCOR model and different elements across
the decompositions are associated to each other For example SCOR contains a model of
the business activities associated with all phases of satisfying a customerrsquos demand The
model consists of the four major components performance processes practices and
people The performance component consists of performance attributes and performance
metrics A performance attribute is a grouping or categorization of performance metrics
to express a strategic goal Table 1 provides the complete list of performance attributes
in SCOR
3
Table 1 Performance attributes in SCOR [45]
Performance
Attribute
Definition
Reliability The ability to perform tasks as expected Reliability focuses on the
predictability of the outcome of a process
Responsiveness The speed at which tasks are performed The speed at which a supply
chain provides products to the customer
Agility The ability to respond to external influences the ability to respond to
marketplace changes to gain or maintain competitive advantage
Costs The cost of operating the supply chain processes This includes labor
costs material costs management and transportation costs
Asset Management
Efficiency (Assets)
The ability to efficiently utilize assets Asset management strategies in a
supply chain include inventory reduction and in-sourcing vs
outsourcing
Figure 2 High level view of the harmonization ontology
These performance attributes are used to express the strategy for a manufacturing system
A Strategic goal (SG) is expressed by weighted Performance attributes (PA)
This can be interpreted as a multiple criteria decision-making (MCDM) problem in itself
[16 23] Most MCDM problems consider the use of criteria to assess effectiveness of a
selection against a defined problem Criteria can be used to structure complex problems
well by considering the multiple criteria individually and simultaneously
4
Figure 2 illustrates the high level view of the ontology we developed to harmonize the
SCOR and the SIMA model The SIMA activities are represented using the Activity class
in the ontology The ontological constructs enable the mapping between strategic
objectives and operational activities For the purpose of identifying challenges to SMS
only select components of the reference models depicted in Figure 2 are used in the
examples In addition the illustrated example provided in this paper only considers one
performance attribute--agility
Note that what is referred to as activities in SIMA are very similar to the processes in the
SCOR model Process and Activity are related using the aggregates-todecomposes-to
object property in Figure 2 In this paper the details of the harmonization of the two
models are not discussed but rather the method In brief all the activities in the SIMA
activity model are encoded as individuals of Activity which is a subclass of
Manufacturing operation An activityrsquos name is represented as an individualrsquos label
Parent and child activities are related using the object property aggregates-
todecomposes-to
Figure 2 also provides representation of how a Manufacturing operation is defined in
the harmonization ontology Inputs controls outputs and mechanisms of an activity in
the SIMA model are classified into inputs of a manufacturing operation Activity from
the SIMA model and Process from the SCOR model are both subclass of
Manufacturing operation and therefore inherit the same properties Also Activity and
Processes are related using aggregates-todecomposes-to which is the same object
property used for parentchild relationships in the SIMA activity model and for capturing
the interrelations in the SCORrsquos process hierarchy model The ontology facilitates this
semantic mapping and enables the proposed performance challenges identification
method to focus on very specific activities
Table 2 An example of reasoning provided by the ontology
Aim Infer that a performance metric that diagnoses other performance metrics is a
leading performance metric
Classes Performance metric Leading metric
Properties diagnoses (Domain Performance metric Range Performance metric)
Restriction On Leading metric diagnoses min 1
(a performance metric must be a Leading Metric if it is related with at least 1
performance metric)
Input An individual of Level-3 Metric (Current Purchase Order Cycle Times) is not
diagnosed by any other Performance metric
Output Current Purchase Order Cycle Times is classified as an individual of the class
Leading Metric in addition to explicitly stated Level-3 Metric
Finding the correct performance metrics has always been a difficult task It is important
to measure both the bottom-line results of manufacturing processes as well as how well
the manufacturing system will perform in future For this reason companies often use a
combination of lagging and leading metrics of performance A lagging metric also
known as a lagging indicator measures a companyrsquos performance in the form of past
statistics Itrsquos the bottom-line numbers that are used to evaluate the overall performance
5
The major drawback to only using lagging metrics is that they do not tell how the
company will perform in the future A leading metric also known as a leading indicator
is focused on future performance For simplicity we qualify leading metrics as metrics
that diagnose at least one other metric A performance metric can be lagging andor
leading depending on the circumstances Table 2 explains the rules embedded in the
ontology to infer and classify performance metrics into lagging andor leading Figure 3
shows the implementation in Proteacutegeacute 43 [44] The query is written based on the
Manchester OWL syntax [54] One can only execute a query on an ontology after a
reasoner (aka classifiers) is selected In the following example we used the Pellet
reasoner [42]
(a) Before reasoning (Leading_Metric) (b) After reasoning (Leading_Metric)
Figure 3 The difference in classification of individualsrsquo membership before and after the
inference
Figure 3b shows that Leading_Metric has new individuals after reasoning The aim
described in Table 2 is fulfilled by reasoning This type of inference is not limited to
classifying leading and lagging metrics For example individuals of
Performance_Metric can be classified into a new class called KPI (Key Performance
Indicator) when we have a logical and agreed upon definition for the concept KPI and
the ontology captures properties that distinguish KPIs from other performance metrics
These illustrated and potential classifications highlight the reasoning capability using
OWL to represent the SCOR and the SIMA model for the purpose of finding the correct
performance metrics
Representation of activities via IDEF0
The IDEF0 definition of a function is lsquolsquoa set of activities that takes certain inputs and by
means of some mechanism and subject to certain controls transforms the inputs into
outputsrdquo IDEF0 models consist of a hierarchy of interlinked activities in box diagrams
with defined terms Arrows attached to the boxes indicate the interfaces between
activities The interfaces can be one of four types input control output or mechanism
6
An IDEF0 model represents the entire system as a single activity at the highest level This
activity diagram is broken down into more detailed diagrams until the necessary detail is
presented for the specified purpose Figure 4 shows the basic IDEF0 representation with
its primary interfaces The decomposition of activities is represented using a numbering
scheme Numbers appear in the lower right corner of the box Decomposed activities are
always prefaced with the number of their parent activity
Figure 4 Basic IDEF0 representation of an activity and its related information overlaid
on SIMA A0
(a) Current activity from SIMArsquos A413 (b) Planned activity
A413
Create Production Orders
Tooling designs
Master Production Schedule
Toolingmaterials orders
Production Orders
Tooling list
Final Bill of Materials
Planning Policies
A413
Create Production Orders (modified)
Tooling designs
Bill of materials
CAD documents
Master Production Schedule
Toolingmaterials orders
Production Orders
Tooling list
Final Bill of Materials
Planning Policies
Web registry of suppliers
Figure 5 Activity of interest
7
Using SIMA to identify challenges the IDEF0 function represents an activity of interest
in the proposed challenges identification method The activity of interest is subject to
modifications to meet the strategic goal Figure 5a depicts the activity A413 Create
Production Orders one of the lower level activities from the SIMA model The arrows
entering the activity from the left represent processing inputs to the activity in this case
the Master Production Schedule The arrows coming in from above represent controls
that guide the activity For example Planning Policies for a given organization will
guide the creation of production orders Arrows on the right are outputs from the
activity in this case tooling material and production orders Finally arrows coming in
from the bottom represent mechanisms on the activity
Figure 6 depicts the next level of break down for this activity as is indicated by the
numbers labeled on each box which all begin with A413 Figure 5b and 6 depict the
modified version of the original A413 activity and are discussed in depth in ldquoPlanned
manufacturing system representationrdquo
A4131
Retrieve capable
suppliers
A4132
Predict
purchasing cost
List of capable
suppliersBill of materials
CAD documents
Master Production
Schedule
Web
registry of
suppliers
A4133
Simulate in-house
manufacturing
cost
A4134
Determine an
optimal ratio
Purchasing alternatives
Production
alternatives
A4135
Plan orders
Optimal
ratio
Planning policy
Production
orders
Toolingmateri
als orders
Tooling designs
Final Bill of Materials
Tooling list
Figure 6 Planned activity model decomposed
3 SMS challenges identification method
One of the drivers for smart manufacturing is the need to respond to changes in demand
more quickly and efficiently [10 52] For example we consider how a manufacturing
operation might respond to an order that they are not able to fulfill in its entirety in-house
in the time frame needed In this scenario we postulate that the manufacturer could fill
8
the order by outsourcing a portion of the production needs through the use of smart
manufacturing technologies which would enable them to identify suitable and capable
partners The understanding of how to implement such a scenario down to the operational
level is one of the grand challenges in modeling of complex manufacturing systems [13]
and is the objective of our challenge identification method An order of scope reduction
is needed for any requirements analysis to be meaningful and practical Using the formal
methods described we are able to precisely delineate scope This helps to relate high-level
strategic goals and requirements to low-level operational activities and provides the
means to understand and represent interrelationships among the different elements of a
manufacturing system Further the method supports effective communication across a
manufacturing organization
Table 3 The proposed challenges identification method
Task 1
Determine scope
Explanation Identifies manufacturing operations and
performance metrics relevant to the scope
of the challenges
identification Input A strategic goal of a manufacturing system
(Figure 7a) in query analysis Output A set of manufacturing operations and
performance metrics relevant to the specified
strategic goal (Figure 7ab)
Task 2
Represent current
Explanation Represent the identified manufacturing operation
formally
manufacturing
system Input An identified manufacturing operation (Figure
7b)
Output A set of activities from the current manufacturing
system (Figure 5a)
Task 3
Represent planned
manufacturing
Explanation Define the modifications to the current
manufacturing system to improve the identified
performance metrics
system Input An identified activity and a set of performance
metrics relevant to the specified strategic goal
(Figure 5a)
Output An improved activity from the planned
manufacturing system (Figure 5b and 6)
Task 4
Gap analysis
Explanation Compare the activity models of the current and
the planned manufacturing system to highlight
implementation barriers
Input An activity from the current manufacturing
system and the corresponding improved activity
from the planned manufacturing system (Figure
5b and 6)
Output An analysis of implementation barriers for current
manufacturing system (Table 8 9)
Note that Activities are subset of Manufacturing Operations
9
Table 3 shows the proposed challenges identification method that integrates SCOR SIMA
Reference Architecture and scenario-based validation In Table 3 we provide references
within parentheses to illustrated examples in this paper
To determine a scope of analysis we use the SCOR mappings between performance
goals and performance metrics of a manufacturing system Further SCOR links the
performance metrics to business processes which can be aligned to activities in a
manufacturing system These mappings determine the scope by identifying the relevant
activities The activities are drawn from the SIMA models which we used to represent
the current manufacturing system We then create a planned manufacturing system
activity model to identify modified capabilities The planned activities reflect the
enhanced capabilities envisioned for smart manufacturing and are then validated through
a realistic scenario Through a realistic scenario a gap analysis between the activity
model of the current and that of the planned system identifies challenges in the specific
terms associated with the activity models Table 3 summarizes these steps and they are
illustrated below in the context of an example based on the Create Production Order
activity
Scope determination
This section highlights the query capability of the ontology as a key enabler to the
proposed method To evaluate performance with respect to SMS goals we identify
specific manufacturing operations that contribute to a goal and subsequently the activities
which support those manufacturing operations The SMS concept has several goals
including agility productivity sustainability and others [17 38] In this paper agility is
selected to test the proposed challenges identification method
The result of the following series of queries and mappings defines the scope for our
analysis Figure 7a shows the results of querying the ontology to find leading metrics to
the agility goal Query 1 ldquoWhat are the leading performance metrics to be monitored for
agilityrdquo is written in DL Query [54] as follows Leading_Metric and (grouped-by value
Agility) Performance metrics are organized hierarchically One can drill down into lower
levels of the hierarchy for one of the agility performance metrics
Upside_Make_Flexibility to find the lower level metrics associated with the agility goal
and to find processes associated with those metrics Current_Make_Volume is one of the
lower level metrics one can choose to investigate If one chooses to investigate a
performance metric at high level the subsequent analysis and the identified challenges
will likewise be at high level Query 2 ldquoWhat are the low-level manufacturing
operations associated with agility goalrdquo is written in DL Query as follows
Manufacturing_operation and (contributes-to value Agility) The query results are
partially shown in Table 4 Figure 7 shows the implementation of the queries We
identify generic processes that are important to agility Engineer-to-Order Make-to-
Order and Make-to-Stock These identified processes can be drilled down into the activity
Create Production Orders One of the explanations for this mapping is shown in Figure
8 Create Production Orders is related to Engineer-to-Order with an object property
aggregates-to (line 3) Engineer-to-Order is linked-to Upside_Make_Adapatability which
10
is grouped-by Agility (line 8 9) A new property between Create Production Orders and
Agility is inferred based on line 5 which chains several object properties into one object
property
Table 4 DL query condition and query results
Query Additional source volumes obtained in 30days Customer return order
result 1 cycle time reestablished and sustained in 30days Upside Deliver Return
Adaptability Upside Source Flexibility Downside Source Adaptability
Upside Deliver Adaptability Current Deliver Return volume Percent of
labor used in logistics not used in direct activity Current Make Volume
SupplierrsquosCustomerrsquosProductrsquos Risk Rating Upside Deliver Flexibility
Value at Risk Make Upside Source Return Flexibility Value at Risk Plan
Current Purchase Order Cycle Times Value at Risk Deliver Demand
sourcing supplier constraints Upside Make Adaptability Upside Source
Return Adaptability Downside Make Adaptability Value at Risk Source
Upside at Risk Return Additional Delivery Volume Current source return
volume Percent of labor used in manufacturing not used in direct activity
Query
result 2
SCOR Process Receive Product Mitigate Risk Schedule Product
Deliveries Checkout Route Shipments Route Shipments Process Inquiry
and Quote Stage Finished Product Package Authorize Defective Product
Return Receive product at Store Receive Defective Product includes verify
Ship Product Schedule Defective Product Shipment Release Finished
Product to Deliver Identify Sources of Supply Issue SourcedIn-Process
Product Enter Order commit Resources and Launch Program Schedule
Installation Waste Disposal Build Loads Invoice Request Defective
Product Return Authorization Verify Product Receive and verify Product
by Customer Schedule MRO Return Receipt Issue Material Receive Excess
product Load Product and Generate Shipping Docs Finalize Production
Engineering Schedule Excess Return Receipt Receive MRO Product
Quantify Risks Identify Risk Events Return Defective Product Deliver
andor Install Pack Product Transfer Excess Product Stage Product
Transfer MRO Product Transfer Defective Product Authorize MRO
Product Return Receive Configure Enter and Validate Order Generate
Stocking Schedule Evaluate Risks Identify Defective Product Condition
Produce and Test Pick Product Obtain and Respond to RFPRFQ
Negotiate and Receive Contract Stock Shelf Transfer Product Authorize
Supplier Payment Disposition Defective Product Schedule Production
Activities Establish Context Fill Shopping Cart Authorize Excess Product
return Receive Enter and Validate Order Consolidate Orders Select Final
Supplier and Negotiate Release Product to Deliver Reserve Inventory and
Determine Delivery Date Select Carriers and Rate Shipments Receive
Product from Source or make Load Vehicle and Generate Shipping
Documents Pick Product from backroom Install Product
SIMA Activity Create Production Orders (illustrative)
11
(a) A DL query for retrieving leading metrics (b) A DL query for retrieving low-level
manufacturing operation
Figure 7 DL query and query results on Proteacutegeacute 43 (illustrative)
Figure 8 An inference explanation for the mapping between SIMA activity and SCOR
process
The identified operational activities are subject to redesigning for improvement By
redesigning the identified operational activities the manufacturing system is assumed to
be more capable of satisfying strategic objectives [9] The redesign of the activities
incorporates new and emerging capabilities that are the foundation of Smart
Manufacturing New capabilities from machine sensors to internet-enabled supply chains
are emerging every day and can improve manufacturing operations We provide a
demonstration of this redesigning for improvement with the following example in the
sections below-- ldquoCurrent manufacturing system representationrdquo and ldquoPlanned
manufacturing system representationrdquo
Current manufacturing system representation
A manufacturing system is defined as the configuration and operation of its subelements
such as machines tools material people and information to produce a value-added
physical informational or service product [9] The SIMA architecture represents the
current manufacturing system While this model does not represent any specific
12
manufacturing system it is representative of the state of the practice We use it as a
baseline from which we can illustrate how new technologies will impact manufacturing
practices The new practices are described in the planned manufacturing system in the
following section As an example Figure 5a shows the original Create Production Orders
activity from the SIMA model and the planned activity model Additional elements are
highlighted in Figure 5b to show the difference Table 5 defines four of the ICOMs from
the figure that are discussed further in our example
Table 5 ICOM definitions for the current manufacturing system
Element Definition Category
Master
Production
Schedule
A list of end products to be manufactured in each of the next N
time periods The list specifies product IDs quantities and due
dates
Input
Planning
Policies
The business rules by which the manufacturing organization does
production planning including product prioritization facility
usage rules make-to-inventorymake-to-order and selection of
planning strategies
Control
Tooling list The complete tooling list for some batch of the part in exploded
form including all tools fixtures sensors gages probes The list
identifies tool numbers quantities and sources This list may
include estimates for consumption of shop materials
Control
Final Bill of
Materials
The complete Bill of Materials (BOM) for the partproduct in
exploded form with quantities of all materials needed for some
batch size of the Part This may include any special materials
which will be consumed in the process of making the part batch
such as fasteners spacers adhesives alternatively those may be
considered ldquoshop materialsrdquo and included in the tooling list
Control
Enhanced manufacturing system To illustrate our approach consider the following scenario for a company that
manufactures gears The company receives a customer order change request for one of
their specialized gears The required delivery date for this order is reduced by two weeks
from the original production schedule The gears are produced by specialized processes
of either powder metal extrusion or hot isostatic pressing (HIP) method HIP is similar to
the process used to produce powder metallurgy steels Heat treating of gears is also a
required process step The manufacturing system is constrained by the capacity of the
specialized processes and the heat-treating machine to satisfy this rush order request
With the current system the company would risk losing the order because they would not
be able to produce the product in the required time In the envisioned system however
the company would look for partners to help where their own capacity is limited A web-
based registry of suppliers is used to quickly find capable partners in this new
environment [2] The digital representation of precise engineering and manufacturing
information is used to specify production requirements for new partners [31 37]
These proposed enhancements to the system may very well make the company more
competitive but before attempting to introduce these changes the company must fully
13
understand the implications The method that we propose allows a company to
understand how the business processes will be impacted and what performance metrics
will be needed for that assessment as well as what new information flows will be needed
In terms of information flows there are several notable changes in the current system
For the planned system to identify capable suppliers a Request for Proposal (RFP)
package is prepared and sent to a web-based supplier registry for quote This package
contains all the required product and process information necessary to respond to the
RFP Information includes but is not limited to CAD documents bill of materials
quantity due dates product specifications process technical data characteristics and
other information necessary to produce the part assembly or product Other suppliers
prerequisitesrsquo to qualify to quote are supplier competency in the specialized processes
powder metal extrusion or hot isostatic pressing process past quality performance
history capacity and sound financial standing Qualified suppliers will be evaluated
based on supply flexibility in make delivery delivery return source source return and
other qualifications A web-based supplier registry contains a supplier-capability
database
Upon receipt of the RFP at the supplier registry the performance metrics for measuring
supply flexibility in make delivery delivery return source and source return are
retrieved Other secondary performance metrics can be used as required This includes
mapping the supplier capabilities with the performance metrics matching supplier
capability with RFPrsquos evaluation criteria and retrieving a list of capable suppliers that
meet the performance evaluation criteria Each supplier provides a price quotation to
deliver the BOMrsquos order quantity at the requested due date The remaining activities are
simulate and predict the in-house manufacturing cost for the quantity specified in the
MPS (Master Production Schedule) determine an optimal ratio between supplierrsquos
purchasing and in-house production cost for each BOM and finally plan and execute
production orders
We have defined formal representations of performance metrics and performance goals
for agility their relationships and properties The performance metrics are supply
flexibility in make delivery delivery return source and source return Based on the
harmonization ontology concepts definitions relationships and properties we
implemented the mapping between performance goals and performance metrics
For each supplier a predictive model of the planned system provides a purchasing cost
for all variations in the ratio of in-house production to outsourced from one to the
quantity specified in the MPS The in-house manufacturing cost for the quantity
specified in the MPS can be simulated using a cost table For all pairs of outsourcing and
in-house production costs the minimum cost can be found By exploding the BOM
individual items and consequent tooling and materials orders are identified Then the
optimal ratio between in-house and outsourcing is determined
14
Table 6 Select elements in identified activity for a planned manufacturing system
Element Current definition Planned definition
Bill of The complete Bill of Materials for The BOM is used as an input to
materials the partproduct in exploded form discover suppliers The part
(BOM) with quantities of all materials
needed for some batch size of the
Part This may include any special
materials which will be consumed
in the process of making the part
batch such as fasteners spacers
adhesives alternatively those may
be considered ldquoshop materialsrdquo and
included in the tooling list
number in the BOM is attached to
supporting Computer-Aided Design
(CAD) documents
CAD Not used in this activity STEP (Standard for the Exchange
documents of Product model data) is used to
express 3D objects for CAD and
product manufacturing information
[21] This exchange technology
enables the discovery of suppliers
that can manufacture such parts
Alternatively Web Computer
Supported Cooperative Work
(CSCW) to translate CAD and FEA
(Finite Elements Analysis) data into
VRML (Virtual Reality Markup
Language) can provide an easy-toshy
access to mechanical-design-andshy
analysis in a collaborative
environment [11 48 55]
Web registry Does not exist This registry of suppliers stores
of suppliers supplierrsquos information using MSC
(manufacturing service capability)
model The MSC model enables
semantically precise representation
of information regarding production
capabilities [11 28 29 30 49 50]
Planning The business rules by which the The planning policy in the planned
policy manufacturing organization does
production planning This includes
product prioritization facility usage
rules make-to-inventorymake-toshy
order and selection of planning
strategies
eg Just-In-Time Critical
Inventory Reserve
system may include a decision-
making mechanism that determines
an optimal ratio between purchasing
and in-house production quantity
This extension allows the enterprise
to not only meet the customer
demands with flexible capacity but
also in the most economical way
15
Planned manufacturing system representation
The SIMA model describes manufacturing activities at a level of detail that does not
prescribe how to achieve the activities Thus in our method the activities are further
decomposed into specific tasks This conceptual design through further decomposition is
crucial to defining new creative manufacturing systems [32] Figure 6 is a decomposition
of the planned activity in Figure 5b with modifications that reflect how the activities are
made more robust by the envisioned enhancements The particular modification reflects
the sourcing of capable suppliers more intelligently using the web-based registry as
described above To meet increased demand production capacity is rapidly increased by
identifying capable suppliers that meet the production requirements A sample of
enhanced capabilities is given in Table 6 Note that these enhanced capabilities are only
for demonstration purposes and does not imply that these are the best for the purpose
Other of alternatives such as simulation-based integrated production planning approach
[26] and SOA-based configurable production planning approach [27] are possible
In short the enhanced capabilities of the planned manufacturing system can be
summarized as follows First using product and process data the system discovers and
retrieves a list of candidate suppliers who can manufacture the required product Second
the system is able to predict both the purchasing and in-house production cost given the
MPS Based on the predicted costs an optimal ratio of in-house production versus
purchasing is determined Finally using the optimal ratio between in-house and
purchasing the system generates production tooling and materialsrsquo orders Note that the
activity A4131 Retrieve capable suppliers would be further decomposed to describe those
details
Gap analysis
Challenges to assuring the performance of an enhanced system fall into two categories
technology and performance measures Once an enhanced system is planned suitable
technology can be sought to satisfy the new system Table 7 illustrates some of the
technology challenges for our example
Table 7 Identified technology challenges
Activity Challenges Reference
Retrieve capable suppliers Supplier capabilities are marked up using
semantic manufacturing service model
Queries are generated automatically from
product and process data
[7 24 28
46]
Predict purchasing cost
Predict in-house
manufacturing cost
Part cost are predicted for new parts that
have never been produced before
[12 14
33 47
51]
16
To ensure that the new system will actually improve performance performance measures
need to be identified The application of performance assurance principles through-out
all phases and levels of manufacturing help ensure that the manufacturing processes meet
their intended functional requirements while providing necessary feedback for continuous
improvement Performance data must support the objectives of the manufacturer from
the highest organizational level cascading downward to the lowest appropriate levels It is
critical that these lower level measurements reflect the assigned work at their own level
while contributing toward overall operational performance measurements for the
enterprise
For example two key measures of performance manageable quantities and production
cost (defined in detail in the SIMA documentation) are significantly impacted in the
planned system and more data is needed to calculate these in the new system In the
enhanced system the capacity that determines the manageable quantities becomes
flexible by identifying capable suppliers via the web Once the production orders become
a combination of in-house and purchasing a decision needs to be made on which orders
will be sent out to bid Secondly determining the production cost is not a simple addition
of costs between in-house and purchased parts For example quality may not be
consistent with purchased parts From the total cost point of view this may result in more
cost than expected due to inspection and customer claims Thus the concept of a cost is
much more complex in the planned system It is a comprehensive metric that is closely
integrated with a predictive model to estimate the cost incurred in later stages of
production and usage The comparison of the activities relevant to the above ideas is
summarized in Table 8 and potential enablers for the enhanced capabilities of the planned
manufacturing system are listed in Table 9
Table 8 Manufacturing system design comparison
Current activity design Limitation Planned activity design
Create production orders
for manageable quantities
with specific due dates
Production orders may not
be able to produce
quantities with specific due
dates given the capacity of
resources
Rapidly identify capable
suppliers on web who are
capable of producing
required products
Determine which orders
will be produced in-house
(and in what facilities) and
which will be sent out to
bid
The determination of the
ratio between in-house and
outsourcing does not
account for total cost of
production including
quality and inspection
Determine an optimal ratio
of which orders will be
produced in-house and
which will be sent out to
bid based on the total cost
of production
17
Table 9 Mapping between enhanced capabilities and potential enablers
Enhanced capabilities of
the planned
manufacturing system
Potential enablers Relevant current
manufacturing system
elements
Semantically rich
production and process
information can help to
dynamically discover
capable suppliers using the
product information of the
required production
MIL-STD [31]
ISO 10303 [21 40]
STEP-NC [22]
MTConnect [36]
Tooling list (Control)
Final Bill of Materials
(Control)
Manufacturing cost for the
new parts that have never
been produced before are
initially unknown but need
to be approximated
Predictive analysis models
[41]
Not used in this activity
4 Discussion
This section discusses the proposed method in the context of larger practice the
continuous improvement process We acknowledge that the proposed method has
limitations Then we lay out the plans for improving the proposed method
The proposed method is based on an ontology that explicitly represents the relationship
between high-level strategic goals and requirements to low-level operational activities
This provides the means to understand the interrelationship among the elements of a
manufacturing system at multiple levels The method also provides a potential means to
communicate across a manufacturing organization More importantly it clearly
distinguishes between what (goals) and how (manufacturing system design) This
powerful capability however has innate limitations in the design In addition there are
areas in the proposed method that require further validation to assure performance of a
manufacturing system
Figure 9 shows the identification of performance challenges in the context of a
continuous improvement process [5] The proposed method helps to specify what needs
to be considered to meet a strategic goal Performance metrics associated with a strategic
goal and respective manufacturing operations at all levels of a manufacturing system are
retrieved A planned system is a configuration of a manufacturing system known and
available Usersrsquo expertise sets the boundary for available configurations The resulting
configuration is expected to meet the strategic goal Therefore planned manufacturing
systems are subject to expertise of the users which is unaccounted for in the scope of the
method Figure 9 also has the shading that the proposed method addresses
18
Specify what needs to be considered
to meet the strategic goal
Usersrsquo expertise (knownavailable
configurations of manufacturing system)
A user needs to improve manufacturing
system to meet a strategic goal
Is it the ideal configuration
Yes
NoIs there a configuration that
meets the goal (pre)
Yes
Did it meet the strategic goal
(post)
Identify implementation barriers
Manufacturing system is improved
and meets the strategic goalYes
No
Create a
configuration
No
Figure 9 Performance challenges identification in the context of continuous
improvement process
Reference models validity
SCOR and SIMA may not capture all possible strategic goals and manufacturing
operations required for the performance challenges identification In other words agility
in the SCOR model cannot be representative of all agility concepts used in practice
Table 10 shows similar but not identical definitions for agility from various sources
Table 10 Agility definitions
Sources Definition
Dictionary Definition for agile
Marketed by ready ability to move with quick easy grace
Having a quick resourceful and adaptable character [1]
SCOR
model
The ability to respond to external influences the ability to respond to
marketplace changes to gain or maintain competitive advantage [45]
IEC 62264shy
1
Agility in manufacturing is the ability to thrive in a manufacturing
environment of continuous and often unanticipated change and to be fast
to market with customized products Agile manufacturing uses concepts
geared toward making everything reconfigurable [20]
Wiendahl
model
Agility means the strategic ability of an entire company to open up new
markets to develop the required products and services and to build up
necessary manufacturing capacity [53]
Likewise the manufacturing operations defined in the ontology do not account for all the
manufacturing operations The ontological structure provides means to harmonize
reference models to better characterize such concepts with more detail
We chose the SIMA model to represent manufacturing operations but actual systems will
vary We also need to better understand the relationship among the low-level activities
19
and performance metrics as well They not only have impact on the high-level strategic
goals but they also interrelate with each other For example increasing the batch size
influences the average work-in-progress changing the supplier portfolio affects the
quality of the product Ultimately designing a manufacturing system should account for
the interrelationships between low-level activities and performance metrics as well as
their relation to high-level strategic goals
Method validity
The proposed method does not assure that the planned system actually meets the
specified strategic goal Or the planned system may not be the ideal configuration for the
given strategic goal This validation and evaluation of a planned system corresponds to
ldquoIs it the ideal configurationrdquo ldquoIdentify implementation barriersrdquo ldquoDid it meet the
specified strategic goalrdquo in the Figure 9 Thus it is logical to provide a means to further
validate and evaluate the planned system Various technologies can be used in this regard
including physical testbed construction simulation mathematical formulation of the
planned system and others Physical testbeds enable validation of the planned system by
collecting data from a shop floor for analytical use This proposed method is only a
starting point for system enhancement
5 Conclusion and future work
Smart Manufacturing Systems (SMS) are characterized by their capability to make
performance-driven decisions based on appropriate data however this capability requires
a thorough understanding of particular requirements associated with performance across
all levels of a manufacturing system The proposed method uses standard techniques in
representing operational activities and their relationship with strategic goals This paper
proposed a method to systematically identify operational activities given a strategic goal
It is an integrated approach that uses multiple reference models and formal
representations to identify challenges for enhancing existing systems to take into account
new technologies A scenario that illustrates how a manufacturing operation might
respond to an order that it is not able to fulfill in-house in its entirety in the time frame
needed was presented We demonstrated the proposed method with that scenario By
replicating the proposed method for other performance goals and with other scenarios a
more comprehensive set of challenges to SMS can be identified
Future work will 1) replicate the proposed method for other performance goals 2)
validate the proposed method discussed in ldquoDiscussionrdquo and 3) explore ways in which the
identified challenges can be systematically addressed thereby reducing the risk for a
manufacturer to introduce new technologies We plan to expand on the ontology as more
examples are developed The ontology will serve a fundamental role in managing the
system complexity as more SMS technologies are introduced and will be described
further in future work
6 Acknowledgement
The authors are indebted to Dr Moneer Helu for feedback which helped to improve the
paper
20
7 Disclaimer
Certain commercial products in this paper were used only for demonstration purposes
This use does not imply approval or endorsement by NIST nor does it imply that these
products are necessarily the best for the purpose
8 References
1 ldquoagilerdquo Merriam-Webstercom Merriam-Webster Retrieved March 11th 2015 from
httpwwwmerriam-webstercominterdest=dictionaryagile
2 Ameri F amp Patil L (2012) Digital manufacturing market a semantic web-based framework for
agile supply chain deployment Journal of Intelligent Manufacturing 23(5) 1817-1832
3 Barbau R Krima S Rachuri S Narayanan A Fiorentini X Foufou S amp Sriram R D
(2012) OntoSTEP Enriching product model data using ontologies Computer-Aided
Design 44(6) 575-590
4 Barkmeyer E Christopher N Feng S (1987) SIMA reference architecture part 1 activity
models NIST (National Institute of Standards and Technology) NIST IR (5939)
5 Bhuiyan Nadia and Amit Baghel An overview of continuous improvement from the past to the
present Management Decision 435 (2005) 761-771
6 Chandrasegaran S K Ramani K Sriram R D Horvaacuteth I Bernard A Harik R F amp Gao
W (2013) The evolution challenges and future of knowledge representation in product design
systems Computer-aided design45(2) 204-228
7 Chen Y J Chen Y M amp Wu M S (2010) Development of an ontology-based expert
recommendation system for product empirical knowledge consultation Concurrent Engineering
8 Choi S Jung K amp Do Noh S (2015) Virtual reality applications in manufacturing industries
Past research present findings and future directionsConcurrent Engineering
1063293X14568814
9 Cochran D S Arinez J F Duda J W amp Linck J (2002) A decomposition approach for
manufacturing system design Journal of manufacturing systems20(6) 371-389
10 Davis J Edgar T Porter J Bernaden J amp Sarli M (2012) Smart manufacturing manufacturing intelligence and demand-dynamic performanceComputers amp Chemical Engineering 47 145-156
11 Eynard B Lieacutenard S Charles S amp Odinot A (2005) Web-based collaborative engineering
support system applications in mechanical design and structural analysis Concurrent
engineering 13(2) 145-153
12 Fernandez Marco Gero et al Decision support in concurrent engineeringndashthe utility-based
selection decision support problem Concurrent Engineering 131 (2005) 13-27
13 Fowler John W and Oliver Rose Grand challenges in modeling and simulation of complex
manufacturing systems Simulation 809 (2004) 469-476
14 Giachetti R E amp Arango J (2003) A design-centric activity-based cost estimation model for
PCB fabrication Concurrent Engineering 11(2) 139-149
15 Gruber T R (1995) Toward principles for the design of ontologies used for knowledge sharing International journal of human-computer studies 43(5) 907-928
16 Ho W Xu X amp Dey P K (2010) Multi-criteria decision making approaches for supplier
evaluation and selection A literature review European Journal of Operational Research 202(1)
16-24
17 Hon K K B (2005) Performance and evaluation of manufacturing systemsCIRP Annals-
Manufacturing Technology 54(2) 139-154
21
18 Horridge M amp Patel-Schneider P F (2009) OWL 2 web ontology language manchester
syntax W3C Working Group Note
19 IEEE 13201 IEEE Functional Modeling Language ndash Syntax and Semantics for IDEF0
International Society of Electrical and Electronics Engineers New York 1998
20 International Electrotechnical Commission (2013) IEC 62264-1 Enterprise-control system
integrationndashPart 1 Models and terminology IEC Genf
21 ISO 10303-11994 Industrial automation systems and integrationmdashProduct data representation
and exchangemdashPart 1
22 ISO 14649-1 (2003) Industrial automation systems and integration -- Physical device control -- Data
model for computerized numerical controllers -- Part 1 Overview and fundamental principles Geneva
International Organization for Standardization
23 Jia H Z Fuh J Y Nee A Y amp Zhang Y F (2002) Web-based multi-functional scheduling
system for a distributed manufacturing environmentConcurrent Engineering 10(1) 27-39
24 Jung K W Lee J H Koh I Y Joo J K amp Cho H B (2012) Ontology for Supplier
Discovery in Manufacturing Domain IE interfaces 25(1) 31-39
25 Jung K Morris K Lyons K Leong S amp Cho H (2015) Mapping Strategic Goals and
Operational Performance Metrics for Smart Manufacturing Systems Procedia Computer Science
44C 504-513
26 Kibira D Choi S S Jung K amp Bardhan T (2015) Analysis of Standards Towards
Simulation-Based Integrated Production Planning In Advances in Production Management
Systems Innovative Production Management Towards Sustainable Growth (pp 39-48) Springer
International Publishing
27 Kim T Bang S Jung K amp Cho H (2015) Decomposing Packaged Services Towards
Configurable Smart Manufacturing Systems In Advances in Production Management Systems
Innovative Production Management Towards Sustainable Growth (pp 74-81) Springer
International Publishing
28 Kulvatunyou B Cho H amp Son Y J (2005) A semantic web service framework to support
intelligent distributed manufacturing International Journal of Knowledge-based and Intelligent
Engineering Systems 9(2) 107-127
29 Lee J Jung K Kim B H Peng Y amp Cho H (2015) Semantic web-based supplier discovery
system for building a long-term supply chain International Journal of Computer Integrated
Manufacturing 28(2) 155-169
30 Lee J Jung K Kim B H amp Cho H (2013) Semantic Web-Based Supplier Discovery
Framework In Advances in Production Management Systems Sustainable Production and Service
Supply Chains (pp 477-484) Springer Berlin Heidelberg
31 Lubell J Frechette S Lipman R Proctor F Horst J Carlisle M Huang P (2013) MILshy
STD-31000A NIST Tech Rep
32 Ma J Hu J Zheng K amp Peng Y H (2013) Knowledge-based functional conceptual design
Model representation and implementation Concurrent Engineering 21(2) 103-120
33 Mauchand M Siadat A Bernard A amp Perry N (2008) Proposal for tool-based method of
product cost estimation during conceptual design Journal of Engineering Design 19(2) 159-172
34 McDaniels T Chang S Cole D Mikawoz J amp Longstaff H (2008) Fostering resilience to
extreme events within infrastructure systems Characterizing decision contexts for mitigation and
adaptation Global Environmental Change 18(2) 310-318
35 McGuinness D L amp Van Harmelen F (2004) OWL web ontology language overview W3C
recommendation 10(10) 2004
22
36 MTConnect standard version 120
wwwmtconnectorggettingstarteddevelopersstandardsaspx
37 National Institute of Standards and Technology Digital Thread for Smart Manufacturing
httpwwwnistgovelmsidsysengdtsmcfm
38 National Institute of Standards and Technology Performance Assurance for Smart
Manufacturing Systems httpwwwnistgovelmsidinfotestapsmscfm
39 National Institute of Standards and Technology Smart Manufacturing Systems Design
and Analysis Program httpwwwnistgovelmsidsysengsmsdacfm
40 Pratt M J (2005) ISO 10303 the STEP standard for product data exchange and its PLM
capabilities International Journal of Product Lifecycle Management 1(1) 86-94
41 Sandberg M Boart P amp Larsson T (2005) Functional product life-cycle simulation model for
cost estimation in conceptual design of jet engine components Concurrent Engineering 13(4)
331-342
42 Sirin E Parsia B Grau B C Kalyanpur A amp Katz Y (2007) Pellet A practical owl-dl
reasoner Web Semantics science services and agents on the World Wide Web 5(2) 51-53
43 Smart Manufacturing What is Smart Manufacturing
httpsmartmanufacturingcomwhat
44 Stanford University Proteacutegeacute httpprotegestanfordedu
45 Supply Chain Council (2008) Supply Chain Operations Reference Model
46 Tang D Zheng L Chin K S Li Z Liang Y Jiang X amp Hu C (2002) E-DREAM A
Web-based platform for virtual agile manufacturing Concurrent Engineering 10(2) 165-183
47 Tornberg K Jaumlmsen M amp Paranko J (2002) Activity-based costing and process modeling for
cost-conscious product design A case study in a manufacturing company International Journal of
Production Economics 79(1) 75-82
48 Torres V H Riacuteos J Vizaacuten A amp Peacuterez J M (2013) Approach to integrate product conceptual
design information into a computer-aided design systemConcurrent Engineering
1063293X12475233
49 Vujasinovic M Ivezic N Barkmeyer E amp Marjanovic Z (2010) Semantic B2B-integration
Using an Ontological Message Metamodel Concurrent Engineering
50 Vujasinovic M Ivezic N Kulvatunyou B Barkmeyer E Missikoff M Taglino F amp
Miletic I (2010) Semantic mediation for standard-based B2B interoperability Internet
Computing IEEE 14(1) 52-63
51 Watson P Curran R Murphy A amp Cowan S (2006) Cost estimation of machined parts
within an aerospace supply chain Concurrent Engineering14(1) 17-26
52 Wikipedia SMART criteria httpenwikipediaorgwikiSMART_criteria
53 Wiendahl H P ElMaraghy H A Nyhuis P Zaumlh M F Wiendahl H H Duffie N amp
Brieke M (2007) Changeable manufacturing-classification design and operation CIRP Annals-
Manufacturing Technology 56(2) 783-809
54 W3C Manchester Syntax for OWL 2
httpwwww3org2007OWLwikiManchesterSyntax
55 Zaletelj V Sluga A amp Butala P (2008) A conceptual framework for the collaborative
modeling of networked manufacturing systems Concurrent Engineering 16(1) 103-114
23
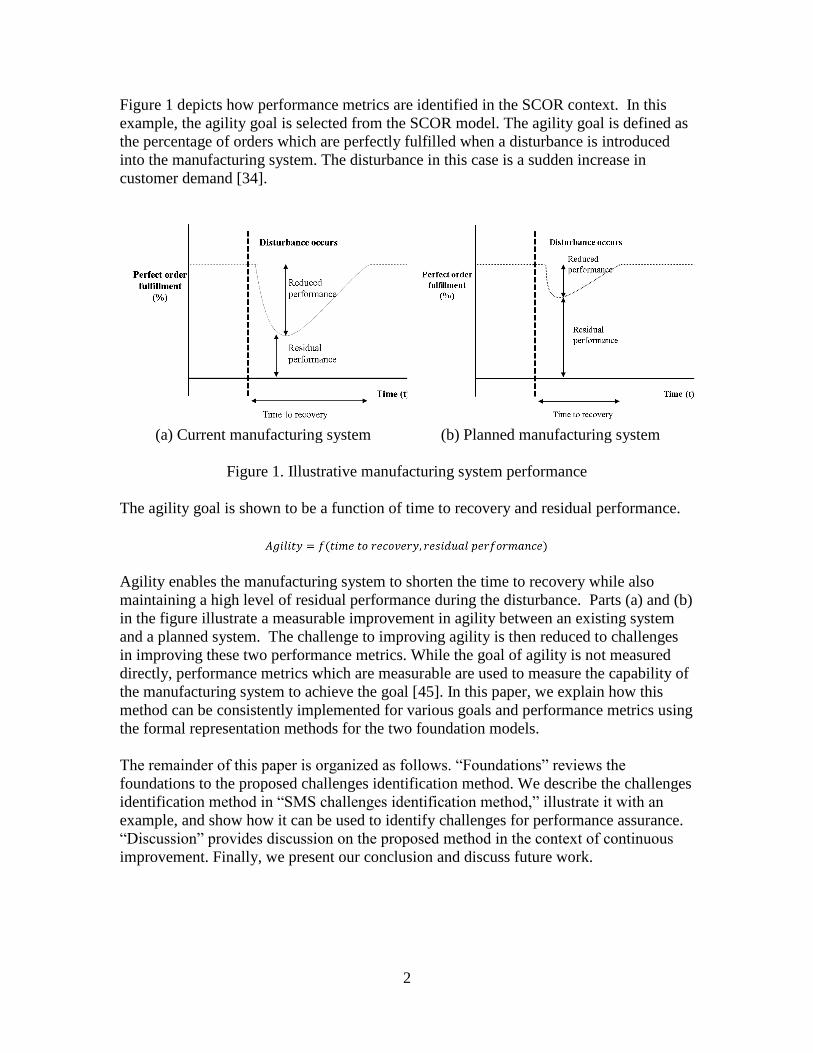
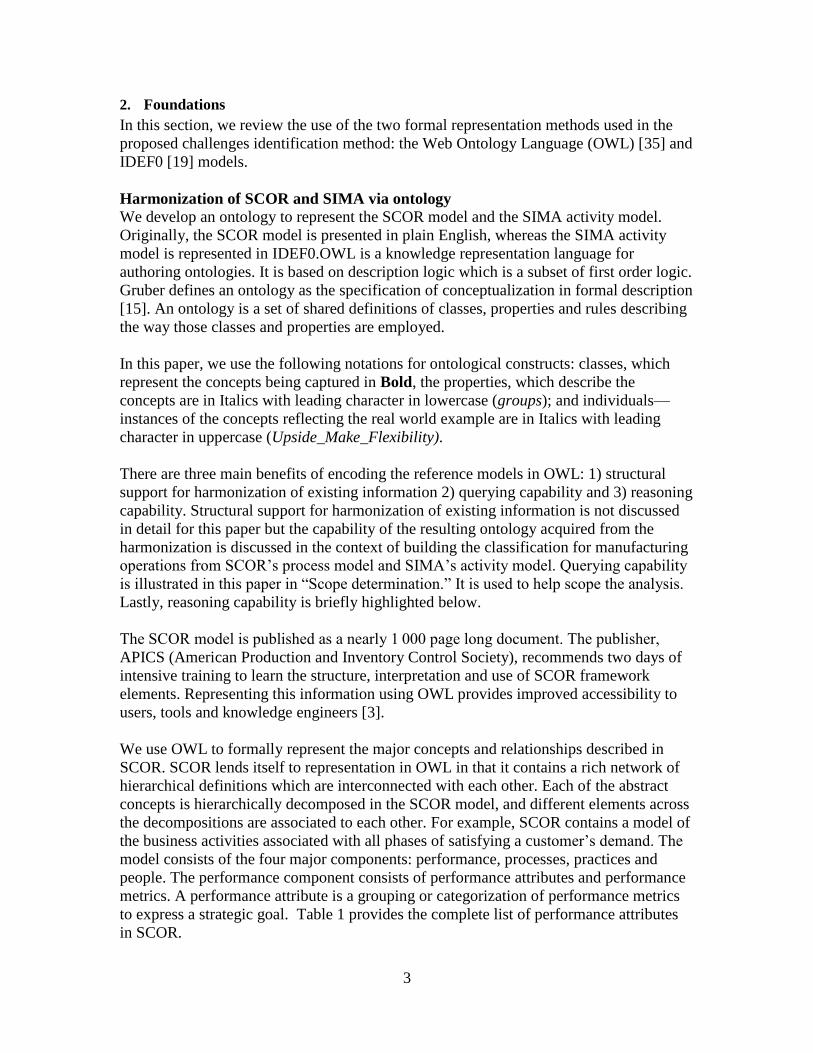
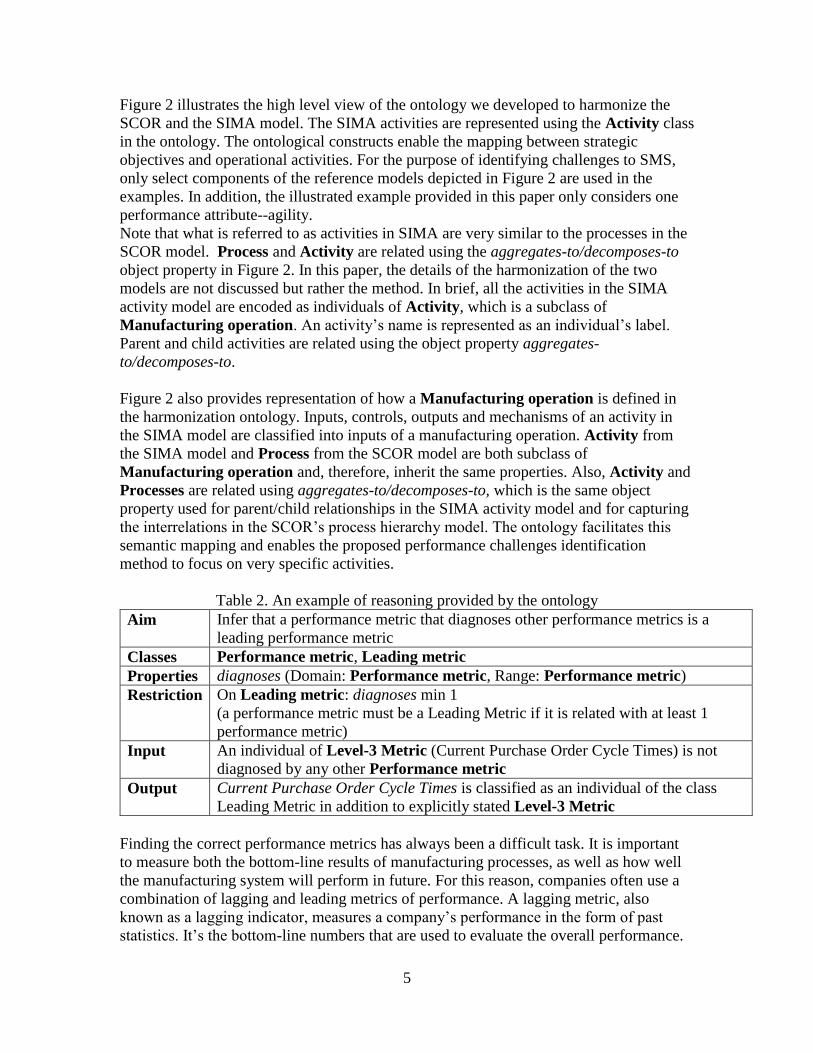
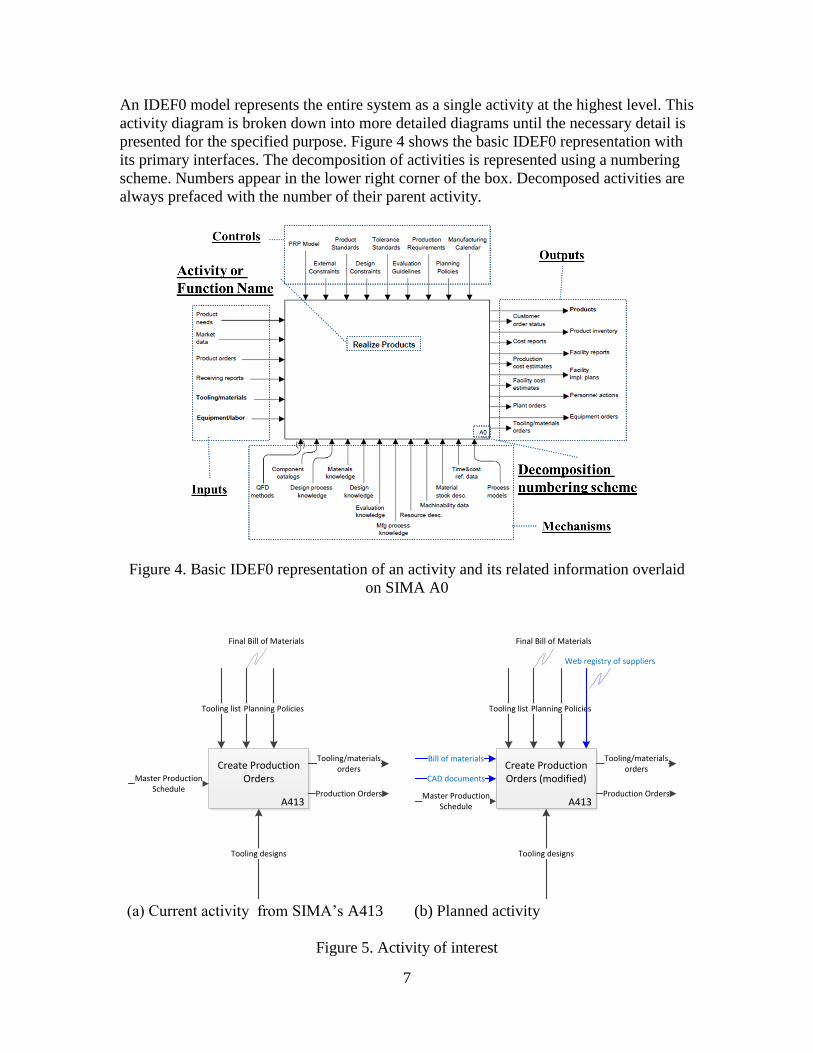
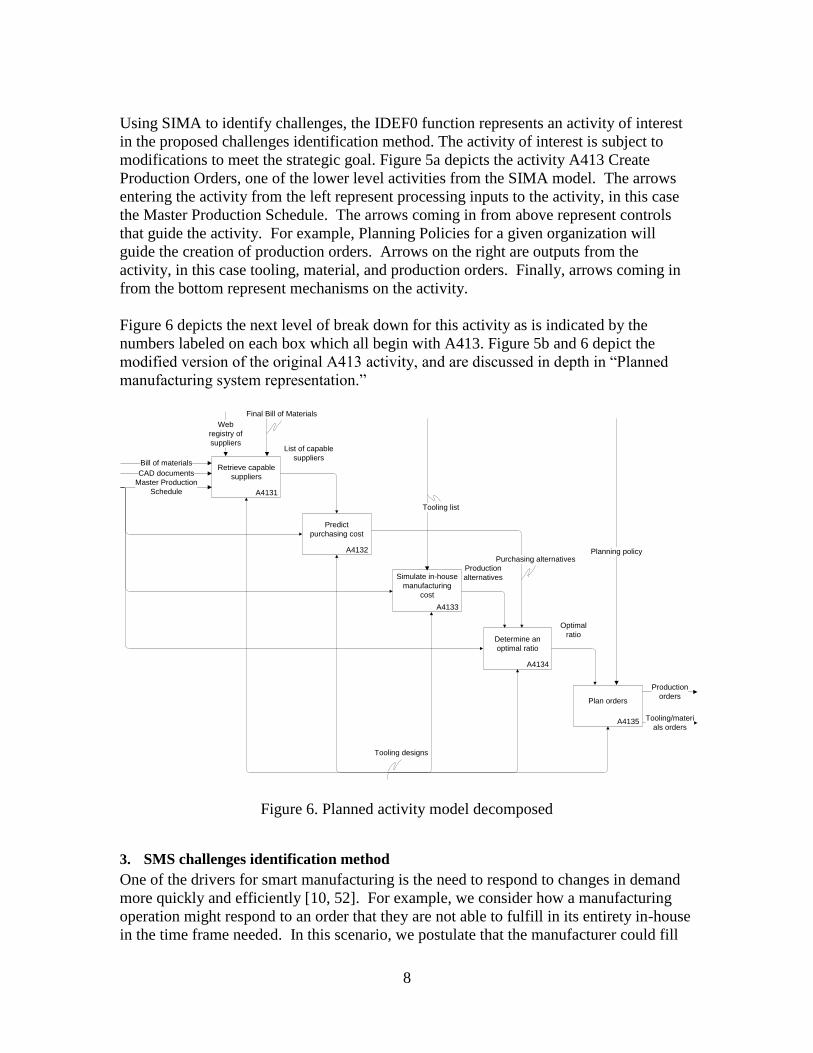
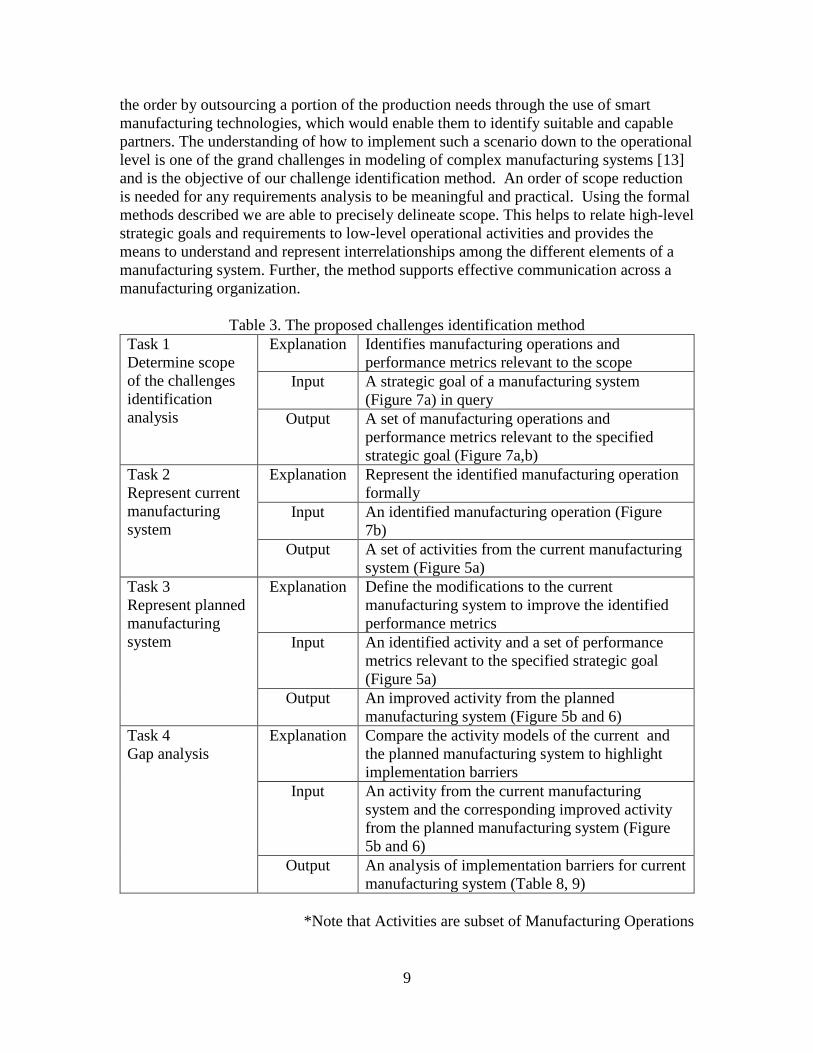
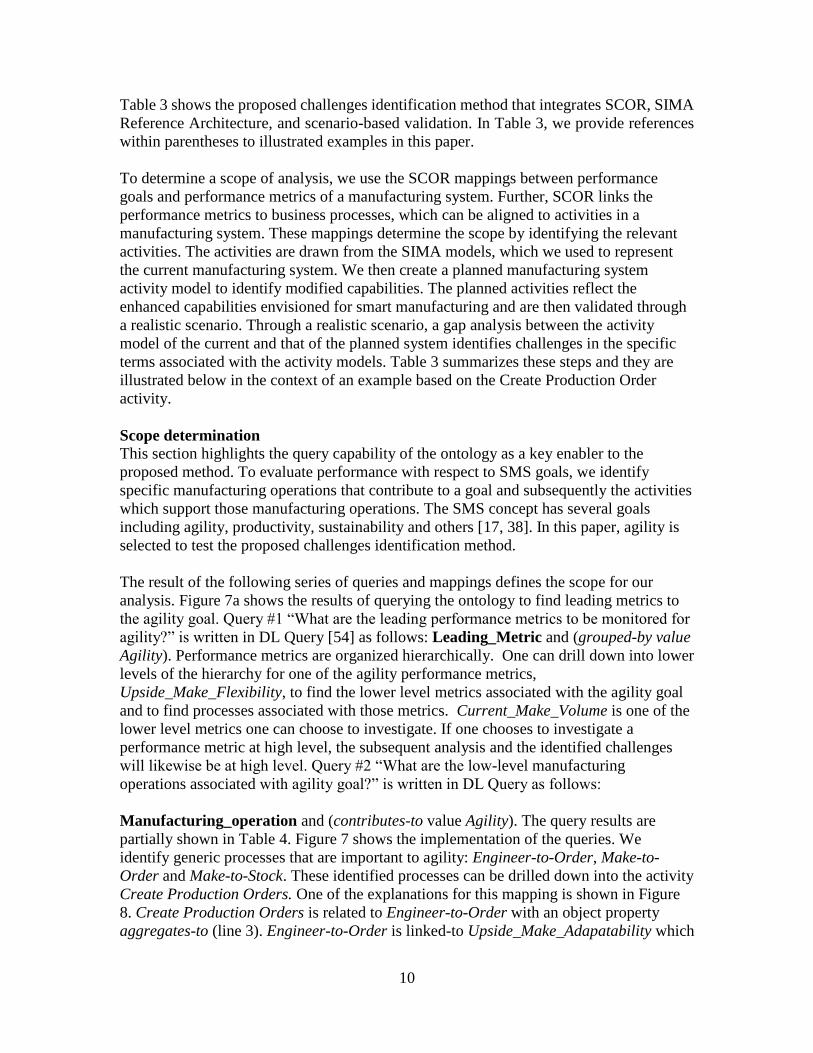
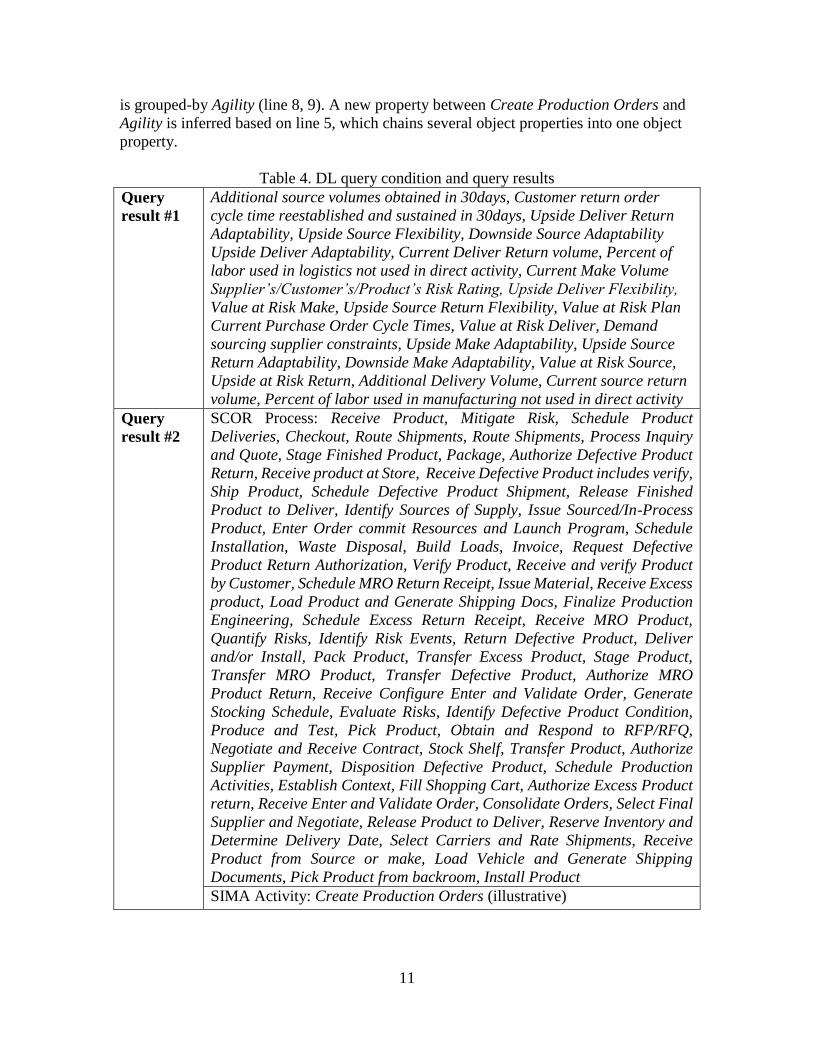
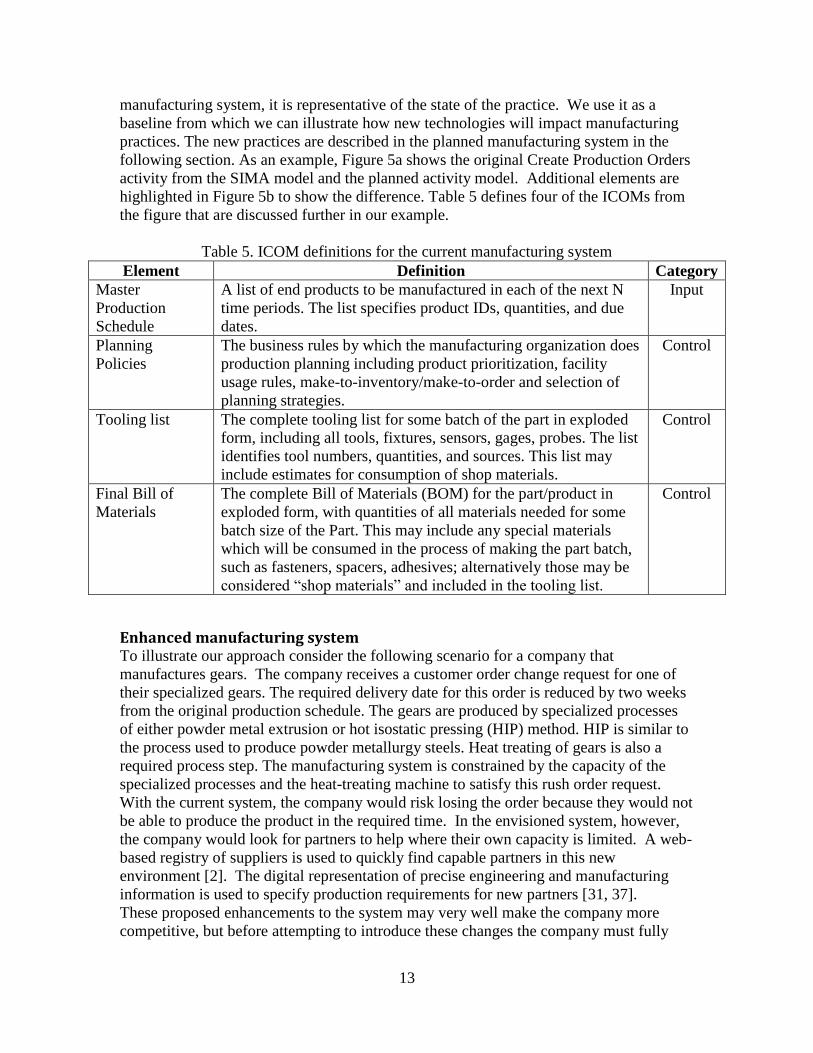
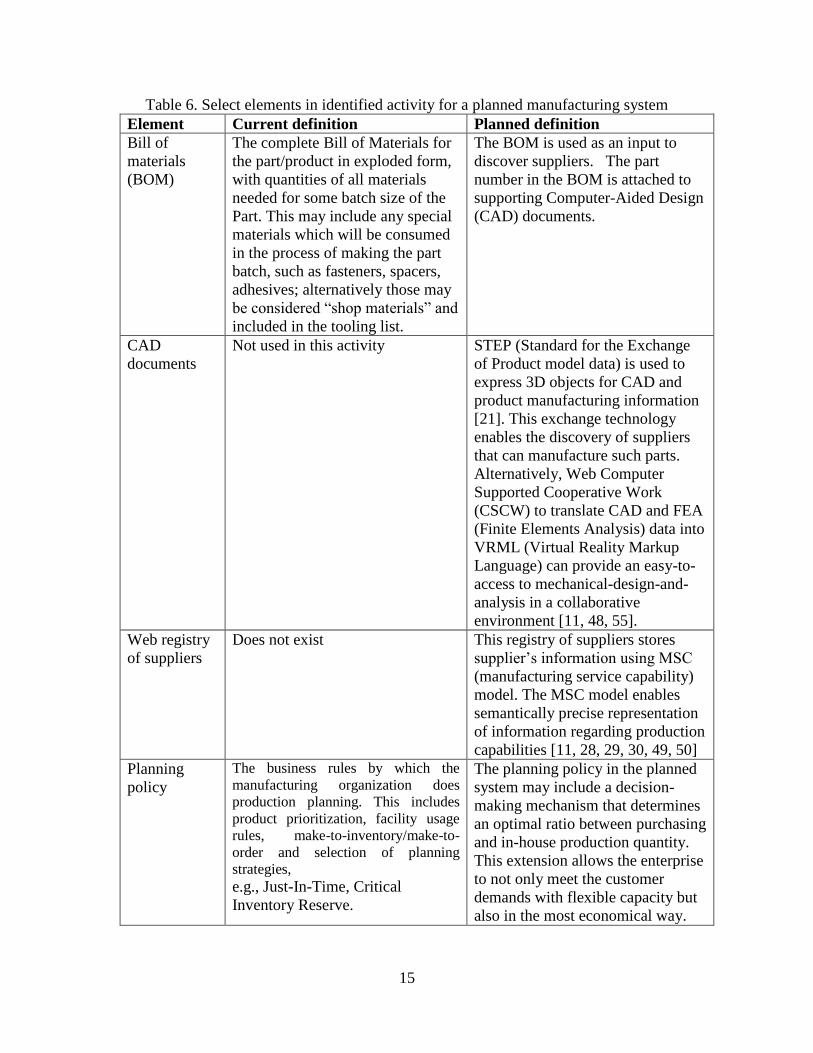
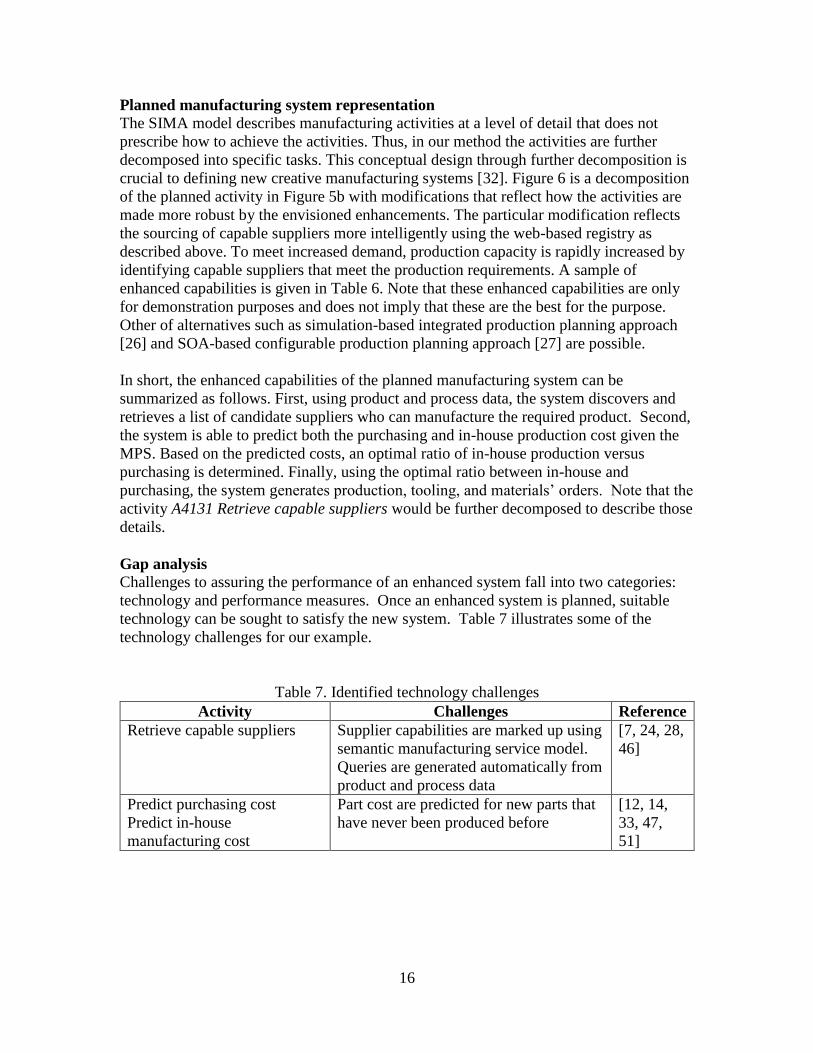
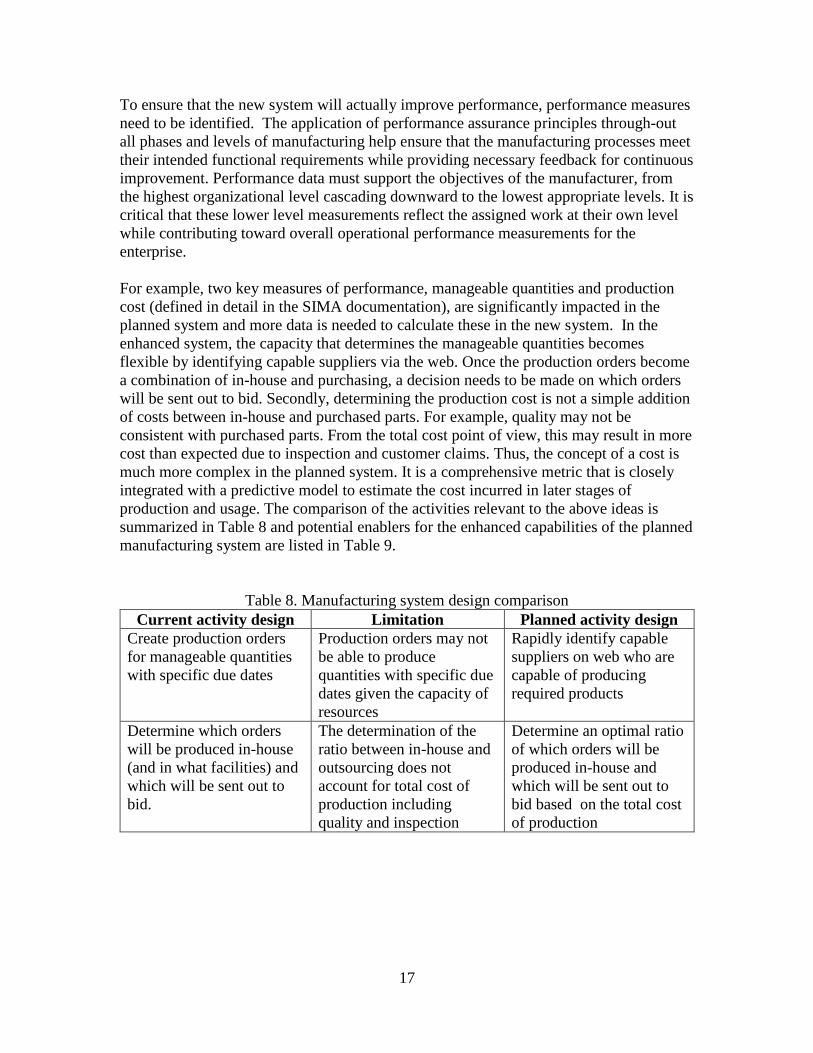
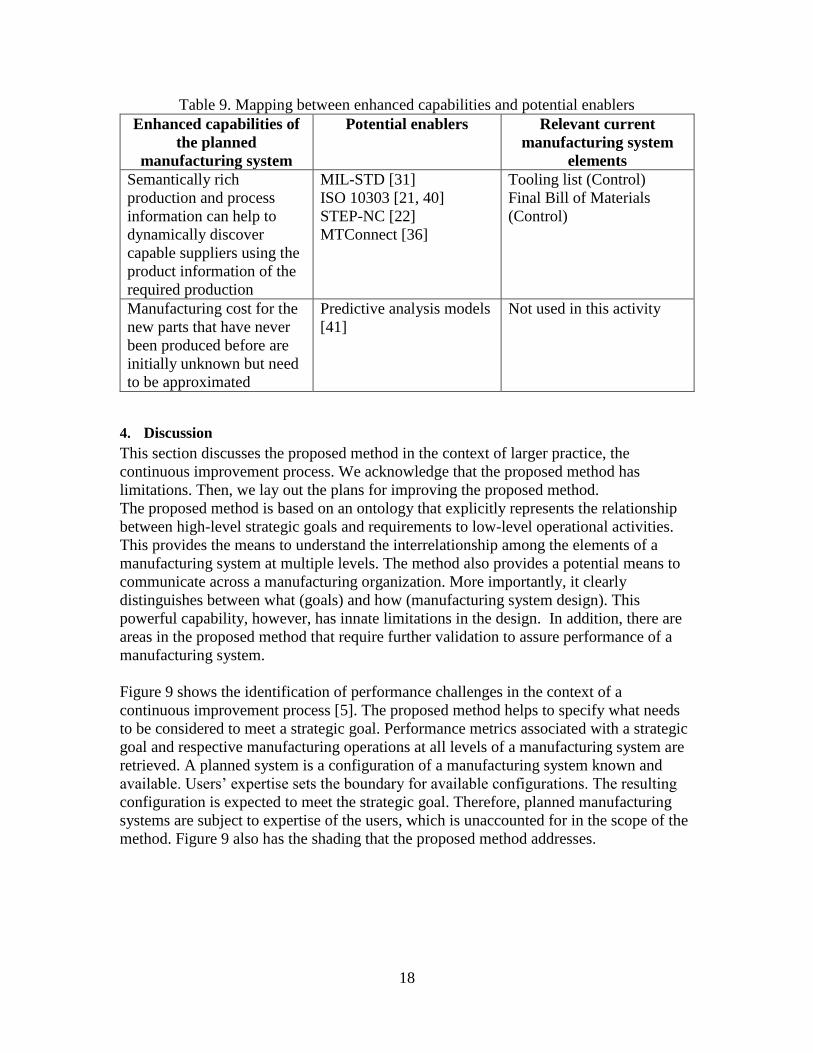
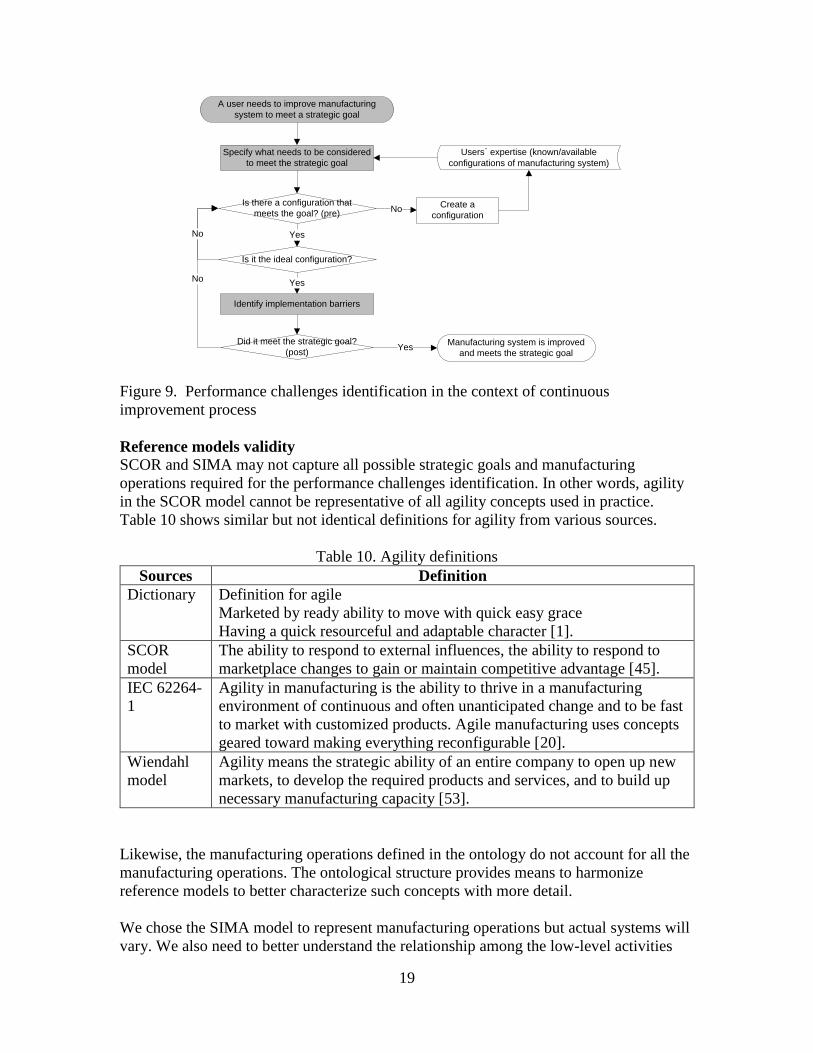