Embed Size (px)
Citation preview

Performance characterization of anintegrated ultrasound, photoacoustic,and thermoacoustic imaging system
Haixin KeTodd N. ErpeldingLadislav JankovicChangjun LiuLihong V. Wang
Downloaded from SPIE Digital Library on 09 May 2012 to 128.252.15.82. Terms of Use: http://spiedl.org/terms

Performance characterization of an integrated ultrasound,photoacoustic, and thermoacoustic imaging system
Haixin Ke,a Todd N. Erpelding,b Ladislav Jankovic,b Changjun Liu,a,c and Lihong V. WangaWashington University, Department of Biomedical Engineering, Optical Imaging Laboratory, St. Louis, MissouribPhilips Research North America, Briarcliff Manor, New YorkcSichuan University, School of Electronics and Information Engineering, Chengdu, China
Abstract. Wedeveloped a novel trimodality system for human breast imaging by integrating photoacoustic (PA) andthermoacoustic (TA) imaging techniques into a modified commercial ultrasound scanner. Because light was deliv-ered with an optical assembly placed within the microwave antenna, no mechanical switching between the micro-wave and laser sources was needed. Laser and microwave excitation pulses were interleaved to enable PA and TAdata acquisition in parallel at a rate of 10 frames per second. A tube (7 mm inner diameter) filled with oxygenatedbovine blood or 30 mM methylene blue dye was successfully detected in PA images in chicken breast tissue atdepths of 6.6 and 8.4 cm, respectively, for the first time. The SNRs at these depths reached ∼24 and ∼15 dB,respectively, by averaging 200 signal acquisitions. Similarly, a tube (13 mm inner diameter) filled with saline solu-tion (0.9%) at a depth of 4.4 cm in porcine fat tissue was successfully detected in TA images. The PA axial, lateral,and elevational resolutions were 640 μm, 720 μm, and 3.5 mm, respectively, suitable for breast cancer imaging.A PA noise-equivalent sensitivity to methylene blue solution of 260 nM was achieved in chicken tissue at a depthof 3.4 cm. © 2012 Society of Photo-Optical Instrumentation Engineers (SPIE). [DOI: 10.1117/1.JBO.17.5.056010]
Keywords: photoacoustic tomography; thermoacoustic tomography; ultrasound imaging.
Paper 11739 received Dec. 19, 2011; revised manuscript received Mar. 28, 2012; accepted for publication Mar. 29, 2012; publishedonline May 4, 2012.
1 IntroductionUltrasound (US) imaging is widely used for clinical diagnosticimaging, but its application in cancer detection is limited bypoor sensitivity. Photoacoustic (PA) tomography (PAT) and ther-moacoustic (TA) tomography (TAT) are novel hybrid imagingtechniques that achieve both high ultrasonic resolution andhigh contrast owing to light or microwave/radio-frequency(RF) absorption.1,2 Photoacoustic and thermoacoustic effectsare based on the generation of pressure waves upon absorptionof electromagnetic energy.3 Absorbed energy is converted intoheat, which launches a pressure wave via thermoelastic expan-sion. In PAT, biological tissues are usually irradiated by a pulsedlaser. When the excitation laser is replaced by microwave or RFsources, the technique is called TAT.4–6 PA or TA image con-trasts reflect the absorbed optical or RF energy within the sam-ple, respectively. The absorption reveals optical or dielectricproperties of the tissue that are closely related to its physiolo-gical and pathological state.1,7 PAT/TAT overcomes the disad-vantages of pure optical or microwave/RF imaging, such asshallow penetration depth or poor spatial resolution, and the dis-advantages of pure ultrasonic imaging, such as poor soft-tissuecontrast and speckle.
PAT and TAT techniques have been widely studied for bio-medical applications, including brain structural and functionalimaging, blood oxygenation and hemoglobin monitoring, andimaging of tumor angiogenesis.8–13 Recently, investigationshave sought to improve PAT/TAT performance.14–17 The resultsshowed that PAT/TATwas capable of high-resolution structural,
functional, and molecular imaging that was free of speckle arti-facts. Combinations of PAT/TAT or PAT/US were investigatedfor breast cancer and sentinel lymph node imaging.1,3,18–21
A coregistered PA, TA, and US system has been constructedfor small-animal imaging,22 where different detectors wereused for PA/TA and US data.
We successfully integrated all three modalities (US/PA/TA)into one system based on a modified clinical US imaging scan-ner. Figure 1(a) shows a photograph of the integrated clinicalsystem. Patients lie in the prone position on a bed with alarge round opening. The breast is positioned through theround opening onto a transparent plate. Laser and microwaveare delivered from below the patient, and coregistered US/PAT/TAT images can be acquired. The complementary contrastmechanisms provided by an integrated US/TAT/PAT systemcould provide a novel method to monitor and predict responseto breast cancer therapies.8,23,24 The functional contrast mechan-isms provided by TAT/PAT have the potential to assess therapeu-tic response at an earlier time than the morphological contrastmechanisms detected by conventional anatomical imaging mod-alities. We tested our system using embedded objects withknown optical absorption characteristics in ex vivo tissue. Inthis article, we present results of the system performance interms of resolution, sensitivity, and penetration depth.
2 Materials and Methods
2.1 PA/TA/US System
Figure 1(b) shows a block diagram of the trimodality imagingsystem that we developed by modifying a clinical US imaging
Address all correspondence to: Lihong V. Wang, Washington University, Depart-ment of Biomedical Engineering, Optical Imaging Laboratory, St. Louis, Missouri.Tel.: +314 9356152; Fax: +314 9357448; E-mail: [email protected] 0091-3286/2012/$25.00 © 2012 SPIE
Journal of Biomedical Optics 056010-1 May 2012 • Vol. 17(5)
Journal of Biomedical Optics 17(5), 056010 (May 2012)
Downloaded from SPIE Digital Library on 09 May 2012 to 128.252.15.82. Terms of Use: http://spiedl.org/terms
scanner (iU22, Philips Healthcare). The system had four maincomponents: a laser system, a microwave system, the modifiedclinical ultrasound scanner, and a custom-made data acquisitionsystem. The commercial US scanner was modified to allowaccess to raw per-channel RF acoustic data, whereas all imagingcapabilities of the scanner were retained.19
The laser system consisted of a tunable dye laser (Precision-Scan-P, Sirah) pumped by a Q-switched Nd:YAG laser (PRO-350-10, Newport). The chosen laser wavelength was 650 nm,where our laser system provides the highest power. The laserpulse width was 6.5 ns and the repetition rate was 10 Hz.Laser pulses were delivered by free-space optics to the openingof a horn antenna through a small hole on the narrow side walland optically expanded to form a beam with a 1.6-cm radius atthe antenna opening.
The microwave system generated 3.0-GHz microwave pulseswith different pulse widths (0.16 to 1.2 μs) and repetition rates(<100 Hz) and directed the pulses toward the target through thehorn antenna. For this study, the microwave pulse width was0.6 μs and the repetition rate was 10 Hz. The peak powerwith 0.6-μs pulse width was 58 kW, which generated an averagepower density of 4.5 mW∕cm2 at the opening of the antenna,which is below the maximum permissible exposure limit setby the IEEE standard.25 The size of the antenna opening was11 by 7 cm. The hole in the antenna that allowed the laserbeam to pass through was small compared to the microwavewavelength in air. The current distribution on the antenna,and therefore the electromagnetic field, was not significantlydisturbed.
An US phased array probe (S5-1, Philips Healthcare) with 80elements and a nominal frequency band of 1 to 5 MHz was usedto acquire US, PA, and TA signals. Although this probe had alower center frequency than typical breast imaging probes, itwas well suited for detecting low-MHz-frequency, micro-wave-induced thermoacoustic signals. The custom-made dataacquisition system controlled the triggering of all threemodalities and collected raw data for image display and post-processing. PA and TA images were reconstructed using adelay-and-sum or Fourier beam-forming algorithm implementedin Matlab, generating cross-sectional B-mode images.26 Toimprove the SNR, PA and TA acquisitions were repeated 200times and raw data were averaged before image reconstruction.
2.2 PAT Experiments
Low-density polyethylene (LDPE) tubes filled with either oxy-genated bovine blood or methylene blue dye (30 mM) wereembedded in layers of chicken breast tissue and imagedusing PA/US. In PA penetration-depth experiments, additionallayers of chicken breast tissue were sequentially added to assess
the PA detection limits for the trimodality system. Methyleneblue dye was used as a target for PAT because it is routinelyused clinically during sentinel lymph node biopsy for axillarystaging of breast cancer patients. In methylene blue detec-tion-sensitivity experiments, an LDPE tube filled with methy-lene blue solution was buried within layers of chicken breasttissue at a fixed depth of ∼3.5 cm, and the concentration ofthe solution was varied from 2 μM to 1 mM. In spatial resolutionexperiments, the PA resolutions were evaluated using blackhuman hairs mounted on a plastic holder placed in a water tank.
2.3 TAT Experiments
LDPE tubes filled with saline solution (0.9%) diluted fromphosphate saline buffer and embedded in porcine fat wereimaged using TA/US. Saline solution was used for TAT becauseprevious studies showed that TAT contrast between normal andtumor tissues was mainly due to the higher sodium and watercontent in tumors.4,27 In TA penetration-depth experiments,additional layers of porcine fat were sequentially added to assessthe TA detection limits for the trimodality system. The TA spa-tial resolutions were evaluated using a thin saline tube placed ina tank filled with mineral oil for TAT.
3 Results
3.1 Multimodality Phantom Imaging
A phantom test was conducted to validate and show the benefitsof the trimodality system. The experiment setup is illustrated inFig. 2(a). Three LDPE tubes filled with mineral oil, methyleneblue (30 mM), or 0.9% saline solution were placed at the open-ing of the antenna. The US image, overlaid PA/US image, andoverlaid TA/US image are shown in Fig. 2(b), 2(c), and 2(d),respectively. As expected, all three tubes were observed inthe US image. Owing to the strong optical absorption of thedye at 650 nm, only the methylene blue tube was observedin the PA image. Both the methylene blue and saline solutiontubes were observed in the TA image, but the signal from methy-lene blue was weaker than that from saline solution, as saline hasstronger microwave absorption than methylene blue. Accuratecoregistration of the tube locations was maintained in allthree modalities, which was facilitated by using the sameprobe for detection of US, PA, and TA signals.
The tubes were identified in the images by the boundariesfacing the ultrasound transducer. Because the low-frequencyinformation in the acoustic signal was filtered by the transducerbandwidth, only the boundaries of the tubes were visible.Moreover, the transducer position was fixed and had a limitedaperture for detection, leading to incomplete boundaries of thetubes in the images.28
The PA spatial resolutions of the trimodality imaging systemwere estimated using black human hairs immersed in a watertank. The PA axial and lateral resolutions were calculated fromthe FWHM widths in the cross-sectional hair images that werereconstructed using a Fourier transform algorithm. Figure 2(e)shows an image of the hairs placed at a depth of 2.7 cm. ForPA elevational resolution, one hair was imaged in a longitudinalview (i.e., along the long axis of the transducer), and a 2-Dmaximum amplitude projection (MAP) image was created byscanning the transducer in the elevational direction. The PAelevational resolution was then measured from the FWHM ofthe hair signal in the resulting MAP image. Figure 2(f) shows
Fig. 1 The integrated trimodality imaging system. (a) Photograph show-ing the clinical setup. (b) Block diagram of the system.
Journal of Biomedical Optics 056010-2 May 2012 • Vol. 17(5)
Ke et al.: Performance characterization of an integrated ultrasound, photoacoustic, and thermoacoustic imaging system
Downloaded from SPIE Digital Library on 09 May 2012 to 128.252.15.82. Terms of Use: http://spiedl.org/terms

one such MAP image after interpolation in the width direction ata depth of 6 cm. The PA axial resolution, 640 μm, was nearlyconstant over the full range of depths. The PA lateral resolutionranged from 720 μm to 2 mm, and it increased with depth. ThePA elevational resolution also varied with depth, and the bestresolution was 3.5 mm. It is worth noting that in our PATstudy, we used diffuse light to illuminate the sample, so thephotoacoustic resolution of the system was determined by theultrasound transducer. Scattering tissues such as human breasttissue will affect the SNR but not the resolution.
A similar resolution measurement was done for TAT using athin tube (inner diameter ∼0.3 mm) filled with 0.9% saline. TATresolution depends on the microwave pulse width.29,30 To mini-mize the effect of the microwave pulse width, we measured thetemporal profile of the microwave pulse and used the Fourierdeconvolution method described in Ref. 31. Figure 2(g)shows a TA image of the tube placed at a depth of 2.8 cmafter deconvolution. The TA axial and lateral resolutionswere ∼0.5 and ∼0.8 mm, respectively. In general, the spatialresolutions of this system are adequate for imaging clinically
Fig. 2 PA/TA/US phantom images. (a) Diagram of the experimental setup imaging three tubes filled with different solutions. (b) US image showing allthree tubes. MB, methylene blue; Sa, saline; MO, mineral oil. (c) Overlaid PA and US image. The PA image shows only the tube filled with MB. (d)Overlaid TA and US image. Both tubes filled with MB and Sa are shown in the TA image, and the Sa tube has stronger signal. (e) PA image showing thecross-section of three black human hairs. (f) MAP image of one hair in the en face view. (g) TA image showing the cross-section of a saline tube.
Journal of Biomedical Optics 056010-3 May 2012 • Vol. 17(5)
Ke et al.: Performance characterization of an integrated ultrasound, photoacoustic, and thermoacoustic imaging system
Downloaded from SPIE Digital Library on 09 May 2012 to 128.252.15.82. Terms of Use: http://spiedl.org/terms
significant breast tumors, which range in size from several milli-meters to several centimeters.
3.2 PAT Penetration Depth in Chicken Breast Tissue
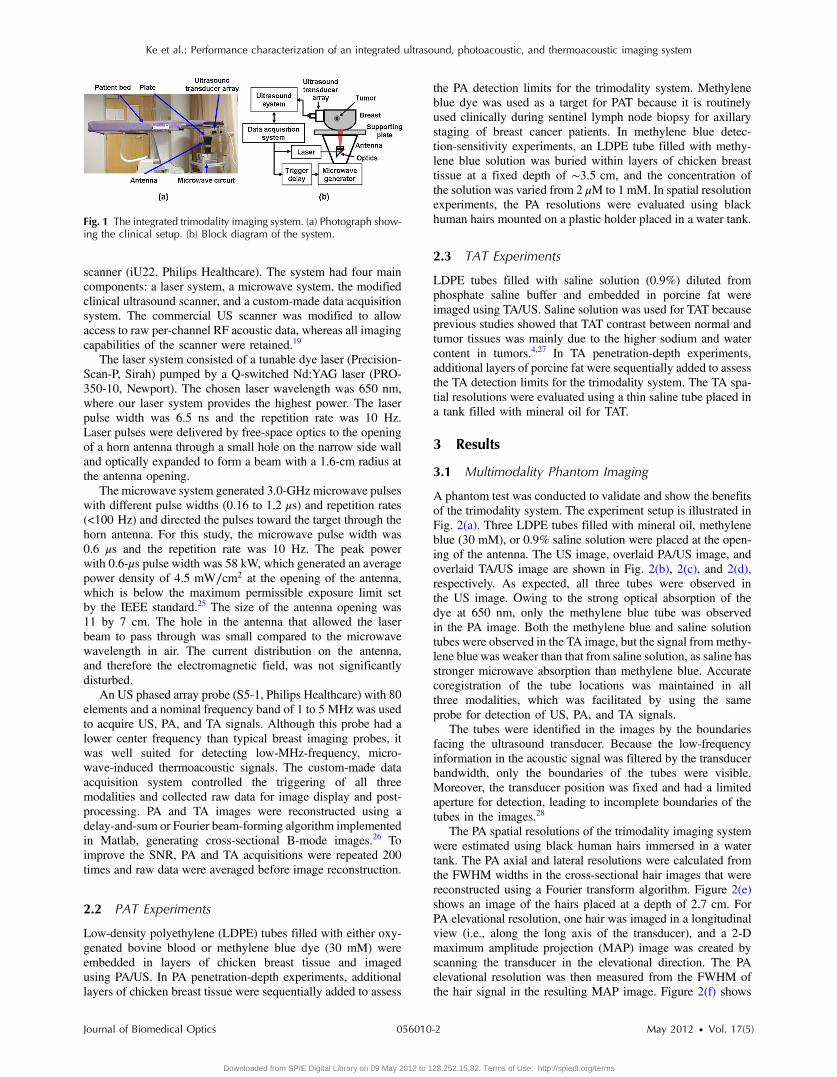
To measure the PAT penetration depth, an LDPE tube (7 mminner diameter, 25 mm length) filled with oxygenated bovineblood was embedded in layers of chicken breast tissue. Chickenbreast tissue has optical properties comparable to human breasttissue. The optical 1∕e penetration depth in chicken breast tissueat 650 nm is between 0.9 and 1.6 cm,32 and that of human breasttissue at 656 nm is about 0.78 cm.33 During the experiment, thewhole sample was placed inside a plastic container to supportthe layers of chicken breast tissue, as shown in Fig. 3(a). Thesame thicknesses of tissue were used above and below the tubeto ensure that both the laser pulses and the generated acousticsignals traveled the same distance. With this arrangement,penetration-depth measurements acquired in transmission modeare analogous to reflection mode acquisitions, where both thesource and detector are placed on the same side of the tissue.The laser beam had a diameter of ∼3.2 cm at the surface of thetissue, and the fluence was ∼19 mJ∕cm2. With these settings, amaximum penetration depth of 6.6 cm was obtained. Figure 3(b)shows a US image of the full sample captured on the USmachine, when the blood tube boundary was 7.0 and 6.6 cmfrom the top and bottom surfaces, respectively. Figure 3(c)shows the corresponding overlaid PA/US image. PA signalsfrom the blood at different depths were normalized to the signalat the smallest depth and are plotted in Fig. 3(d). By fitting thedata according to the exponential decay, the 1∕e penetrationdepth was calculated to be 0.84 cm, which was influencedby both laser and acoustic attenuations. The R2 value of thefitting was 0.99. The 6.6-cm depth is approximately 7.9 timesthe 1∕e penetration depth, corresponding to nearly 34 dBattenuation of the incident laser power density. The SNR at6.6 cm in the reconstructed image was ∼24 dB.
The experiment was repeated using a tube filled with methy-lene blue solution (30 mM) as the target. The laser beam size
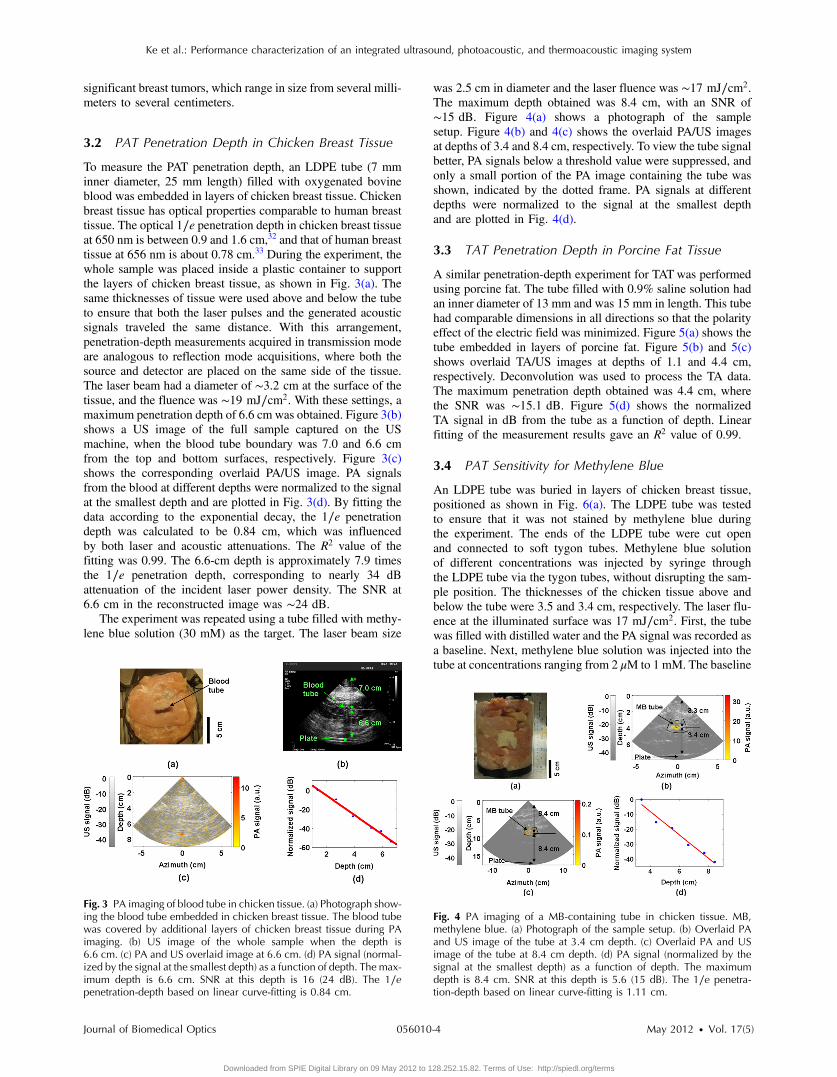
was 2.5 cm in diameter and the laser fluence was ∼17 mJ∕cm2.The maximum depth obtained was 8.4 cm, with an SNR of∼15 dB. Figure 4(a) shows a photograph of the samplesetup. Figure 4(b) and 4(c) shows the overlaid PA/US imagesat depths of 3.4 and 8.4 cm, respectively. To view the tube signalbetter, PA signals below a threshold value were suppressed, andonly a small portion of the PA image containing the tube wasshown, indicated by the dotted frame. PA signals at differentdepths were normalized to the signal at the smallest depthand are plotted in Fig. 4(d).
3.3 TAT Penetration Depth in Porcine Fat Tissue
A similar penetration-depth experiment for TAT was performedusing porcine fat. The tube filled with 0.9% saline solution hadan inner diameter of 13 mm and was 15 mm in length. This tubehad comparable dimensions in all directions so that the polarityeffect of the electric field was minimized. Figure 5(a) shows thetube embedded in layers of porcine fat. Figure 5(b) and 5(c)shows overlaid TA/US images at depths of 1.1 and 4.4 cm,respectively. Deconvolution was used to process the TA data.The maximum penetration depth obtained was 4.4 cm, wherethe SNR was ∼15.1 dB. Figure 5(d) shows the normalizedTA signal in dB from the tube as a function of depth. Linearfitting of the measurement results gave an R2 value of 0.99.
3.4 PAT Sensitivity for Methylene Blue
An LDPE tube was buried in layers of chicken breast tissue,positioned as shown in Fig. 6(a). The LDPE tube was testedto ensure that it was not stained by methylene blue duringthe experiment. The ends of the LDPE tube were cut openand connected to soft tygon tubes. Methylene blue solutionof different concentrations was injected by syringe throughthe LDPE tube via the tygon tubes, without disrupting the sam-ple position. The thicknesses of the chicken tissue above andbelow the tube were 3.5 and 3.4 cm, respectively. The laser flu-ence at the illuminated surface was 17 mJ∕cm2. First, the tubewas filled with distilled water and the PA signal was recorded asa baseline. Next, methylene blue solution was injected into thetube at concentrations ranging from 2 μM to 1 mM. The baseline
Fig. 3 PA imaging of blood tube in chicken tissue. (a) Photograph show-ing the blood tube embedded in chicken breast tissue. The blood tubewas covered by additional layers of chicken breast tissue during PAimaging. (b) US image of the whole sample when the depth is6.6 cm. (c) PA and US overlaid image at 6.6 cm. (d) PA signal (normal-ized by the signal at the smallest depth) as a function of depth. The max-imum depth is 6.6 cm. SNR at this depth is 16 (24 dB). The 1∕epenetration-depth based on linear curve-fitting is 0.84 cm.
Fig. 4 PA imaging of a MB-containing tube in chicken tissue. MB,methylene blue. (a) Photograph of the sample setup. (b) Overlaid PAand US image of the tube at 3.4 cm depth. (c) Overlaid PA and USimage of the tube at 8.4 cm depth. (d) PA signal (normalized by thesignal at the smallest depth) as a function of depth. The maximumdepth is 8.4 cm. SNR at this depth is 5.6 (15 dB). The 1∕e penetra-tion-depth based on linear curve-fitting is 1.11 cm.
Journal of Biomedical Optics 056010-4 May 2012 • Vol. 17(5)
Ke et al.: Performance characterization of an integrated ultrasound, photoacoustic, and thermoacoustic imaging system
Downloaded from SPIE Digital Library on 09 May 2012 to 128.252.15.82. Terms of Use: http://spiedl.org/terms

PA signal, defined as the signal from the tube filled with water,was subtracted from the PA signal from each concentration ofmethylene blue. The contrast-to-noise ratio (CNR) in dB,defined as the ratio between the PA signal after background sub-traction and the noise, is plotted in Fig. 6(b) versus the concen-tration of methylene blue on a log scale. The linear curve-fittingof these data gave an R2 value of 0.996, which means the PAsignal changed linearly as the concentration changed. Atconcentrations higher than 1 mM, the PA signal varied in anonlinear fashion because of the depth-dependent distributionof optical energy deposition inside the methylene blue.34 TheSNR from the tube filled with 2 μM methylene blue was 7.8,or 17.8 dB. Therefore, the noise-equivalent sensitivity, definedas the ratio of the methylene blue concentration to the SNR, was∼260 nM at a depth of 3.4 cm in chicken breast tissue.
4 DiscussionWe aimed to design a clinical imaging system that combinescontrasts from PAT, TAT, and ultrasonography to monitorfunctional changes during breast neoadjuvant therapy and pre-dict treatment efficacy. This new system is significantly differentfrom previous systems3,20 with respect to the ultrasound
detection system, light delivery scheme, and data acquisition.Both PAT and TAT work in transmission mode because ofthe size of the antenna. Moreover, decoupling the ultrasoundtransducer and laser/microwave source makes it possible to opti-mize the source path and the ultrasound path independently. PAand TA signals can be acquired in parallel, and PA, TA, and USdata are exactly coregistered because they use the same arraytransducer for detection. With the free-space laser deliverydesign, we achieved a high laser fluence for PAT that was withinANSI safety limits.35 The high laser fluence and probe sensitiv-ity enabled PA imaging of blood at a depth of 6.6 cm in chickenbreast tissue. We also imaged methylene blue at an even largerdepth of 8.4 cm. This penetration depth exceeds the previouslyreported depth for PA detection of methylene blue by more than3 cm, and the noise-equivalent sensitivity for methylene blue inchicken breast tissue measured with this system (260 nM at adepth of 3.4 cm) is a significant improvement over previousreports.20
The maximum penetration depth of our TAT combined withthe clinical ultrasound system is 4.4 cm. The TA signal dropfrom 1 to 4 cm is much less than the PA signal drop for thesame depth range. This suggests that the microwave attenuatesmore slowly than light in breast tissue, assuming the breast tis-sue has dielectric properties similar to porcine fat and opticalproperties similar to chicken tissue. The TAT system designcan be improved to image more deeply by increasing the micro-wave energy.
We measured the resolution of the trimodality imagingsystem and found that it is suitable for deep PAT/TAT. Theseresults help to quantify the system performance, which is criticalfor future clinical applications.
This study is not without limitations. We used chicken breastand porcine fat tissue to mimic human breast tissue; however,human breast tissue is more complicated. It consists of variousstructures and may contain more blood than excised chickenbreast tissue and more water than porcine fat, thus attenuatingmore light and microwave energy. Breast tumors may be lessabsorptive than the methylene blue solution or salt water.The imaging penetration depth in real human breast tissuewill be assessed more accurately in human subjects.
The interaction of microwave and biological tissues is rathercomplicated. The biological effects of microwaves do notdepend solely on the external power density. The intensity ofthe internal fields depends on a number of parameters: fre-quency, intensity, and polarization of the external field; size,shape, and dielectric properties of the body; spatial configura-tion between the exposure source and the exposed body; and thepresence of other objects in the vicinity.36 In future clinicalapplications, improved image quality may be achieved by apply-ing a compensation model during image reconstruction.
5 ConclusionsWe developed a multimodality system that integrates threeimaging techniques, namely, ultrasound, photoacoustic, andthermoacoustic tomography. The system adds PA and TAcontrast mechanisms to traditional US imaging techniques andprovides complementary information on optical, dielectric, andultrasonic tissue properties. We evaluated the performance ofthe system in terms of penetration depth, spatial resolution,and sensitivity. Using endogenous hemoglobin contrast inwhole blood, we demonstrated that the maximum penetrationdepth of PAT in chicken breast tissue was 6.6 cm; using
Fig. 5 TA imaging of saline tube in pork fat tissue. (a) Photograph show-ing the saline tube embedded in fat tissue. The saline tube was buriedunder additional layers of fat tissue during TA imaging. (b) TA and USoverlaid image at a depth of 1.1 cm. (c) TA and US overlaid image of thetube at a depth of 4.4 cm (in the dotted frame). (d) TA signal (normalizedby the signal at the smallest depth) as a function of depth. The maximumdepth is 4.4 cm. SNR at this depth is 5.7 (15.1 dB).
Fig. 6 PA signal strength as a function of methylene blue concentrationat a depth of 3.4 cm measured using the S5-1 probe. (a) Photographshowing the methylene blue tube embedded in chicken breast tissue.The methylene blue tube was covered by 3.5 cm of chicken breast tis-sue during PA imaging. (b) CNR versus concentration after subtractionof the baseline signal.
Journal of Biomedical Optics 056010-5 May 2012 • Vol. 17(5)
Ke et al.: Performance characterization of an integrated ultrasound, photoacoustic, and thermoacoustic imaging system
Downloaded from SPIE Digital Library on 09 May 2012 to 128.252.15.82. Terms of Use: http://spiedl.org/terms

methylene blue solution, we showed that it was 8.4 cm. To ourknowledge, this is the first time photoacoustic imaging at thesedepths has been reported. The maximum penetration depth ofTAT in porcine fat was 4.4 cm. The noise equivalent sensitivityof the methylene blue solution in chicken tissue was measured tobe 260 nM at a depth of 3.4 cm. These promising results moti-vate further development of the system for clinical applicationsin breast cancer imaging.
AcknowledgmentsWe acknowledge John Dean, Viktor Gornstein, and RamonErkamp from Philips Research North America for their helpwith building the system. This work was sponsored in partby National Institutes of Health grants R01 CA134539,U54 CA136398, R01 EB000712, R01 EB008085, R01EB010049, and R01 CA157277. L.V.W. has a financial interestin Microphotoacoustics, Inc., and in Endra, Inc., which, how-ever, did not support this work.
References1. G. Ku et al., “Thermoacoustic and photoacoustic tomography of thick
biological tissues toward breast imaging,” Technol. Cancer Res. Treat.4, 559–565 (2005).
2. L. V. Wang, “Prospects of photoacoustic tomography,” Med. Phys. 35,5758–5767 (2008).
3. M. Pramanik et al., “Design and evaluation of a novel breast cancerdetection system combining both thermoacoustic (TA) and photoacoustic(PA) tomography,” Med. Phys. 35, 2218–2223 (2008).
4. R. A. Kruger, D. R. Reinecke, and G. A. Kruger, “Thermoacousticcomputed tomography—technical considerations,” Med. Phys. 26,1832–1837 (1999).
5. L. V. Wang et al., “Microwave-induced acoustic imaging of biologicaltissues,” Rev. Sci. Instrum. 70, 3744–3748 (1999).
6. M. Xu and L. V. Wang, “Photoacoustic imaging in biomedicine,”Rev. Sci. Instrum. 77, 041101 (2006).
7. Y. Xu and L. V. Wang, “Effects of acoustic heterogeneity on thermo-acoustic tomography in the breast,” IEEE Trans. Ultrason. Ferroelec-trics Freq. Contr. 50, 1134–1146 (2003).
8. R. A. Kruger et al., “Breast cancer in vivo: contrast enhancementwith thermoacoustic CT at 434 MHz-feasibility study,” Radiology216, 279–283 (2000).
9. R. A. Kruger et al. and R. P. Doyle, “Photoacoustic angiography of thebreast,” Med. Phys. 37, 6096–6100 (2010).
10. S. Manohar et al., “Initial results of in vivo non-invasive cancer imagingin the human breast using near-infrared photoacoustics,” Opt. Express15, 12277–12285 (2007).
11. S. A. Ermilov et al., “Laser optoacoustic imaging system for detectionof breast cancer,” J. Biomed. Opt. 14, 024007 (2009).
12. X. D.Wang et al., “Noninvasive laser-induced photoacoustic tomographyfor structural and functional invivo imagingof the brain,”Nat. Biotechnol.21, 803–806 (2003).
13. G. Ku et al., “Imaging of tumor angiogenesis in rat brains in vivo byphotoacoustic tomography,” Appl. Opt. 44, 770–775 (2005).
14. M. Pramanik, G. Ku, and L. V. Wang, “Tangential resolution improve-ment in thermoacoustic and photoacoustic tomography using a negativeacoustic lens,” J. Biomed. Opt. 14, 024028 (2009).
15. H. Grün et al., “Three-dimensional photoacoustic imaging using fiber-based line detectors,” J. Biomed. Opt. 15, 021306 (2010).
16. M. Pramanik et al., “Single-walled carbon nanotubes as a multimodal-thermoacoustic and photoacoustic-contrast agent,” J. Biomed. Opt. 14,034018 (2009).
17. L. Nie, Z. Guo, and L. V. Wang, “Photoacoustic tomography of monkeybrain using virtual point ultrasonic transducers,” J. Biomed. Opt. 16,076005 (2011).
18. S. Y. Emelianov et al., “Combined ultrasound, optoacoustic andelasticity imaging,” Proc. SPIE 5320, 101–112 (2004).
19. T. N. Erpelding et al., “Sentinel lymph nodes in the rat: noninvasivephotoacoustic and US imaging with a clinical US system,” Radiology256, 102–110 (2010).
20. C. Kim et al., “Deeply penetrating in vivo photoacoustic imaging usinga clinical ultrasound array system,” Biomed. Opt. Express 1, 278–284(2010).
21. C.Kim et al., “Handheld array-based photoacoustic probe for guiding nee-dle biopsy of sentinel lymph nodes,” J. Biomed. Opt. 15, 046010 (2010).
22. D. R. Reinecke et al., “Co-registered photoacoustic, thermoacoustic andultrasound mouse imaging,” Proc. SPIE 7564, 756420 (2010).
23. Q. Zhu et al., “Noninvasive monitoring of breast cancer duringneoadjuvant chemotherapy using optical tomography with ultrasoundlocalization,” Neoplasia 10, 1028–1040 (2008).
24. A. Cerussi et al., “Predicting response to breast cancer neoadjuvant che-motherapy using diffuse optical spectroscopy,” Proc. Natl. Acad. Sci.USA 104, 4014–4019 (2007).
25. IEEE International Committee on Electromagnetic Safety (SCC39),“IEEE Standard for Safety Levels with Respect to Human Exposureto Radio Frequency Electromagnetic Fields, 3 kHz to 300 GHz,”IEEE Std C95.1-2005 (Revision of IEEE Std C95.1-1991), pp. 1–238(2006).
26. K. P. Köstli et al., “Temporal backward projection of optoacousticpressure transients using Fourier transform methods,” Phys. Med. Biol.46, 1863–1872 (2001).
27. K. R. Foster and J. L. Schepps, “Dielectric properties of tumor andnormal tissues at radio through microwave frequencies,” J. Microw.Power 16, 107–119 (1981).
28. Y. Xu et al., “Reconstructions in limited-view thermoacoustic tomogra-phy,” Med. Phys. 31, 724–733 (2004).
29. X. Zeng, S. Yan, and G. Wang, “Effects of microwave pulse widthon the spatial resolution of microwave-induced thermoacousticimaging,” Antennas, Propagation & EM Theory, 2006. ISAPE '06.7th International Symposium on, pp. 1–4 (2006).
30. G. Ku and L. V. Wang, “Scanning microwave-induced thermoacoustictomography: signal, resolution, and contrast,”Med. Phys. 28, 4–10 (2001).
31. M. J. E. Salami and S. N. Sidek, “Performance evaluation of the decon-volution techniques used in analyzing multicomponent transient sig-nals,” TENCON 2000, Proc. 1, 487–492 (2000).
32. G. Marquez et al., “Anisotropy in the absorption and scattering spectraof chicken breast tissue,” Appl. Opt. 37, 798–805 (1998).
33. L. Spinelli et al., “Bulk optical properties and tissue components in thefemale breast from multiwavelength time-resolved optical mammogra-phy,” J. Biomed. Opt. 9, 1137–1142 (2004).
34. M. Sivaramakrishnan et al., “Limitations of quantitative photoacousticmeasurements of blood oxygenation in small vessels,” Phys. Med. Biol.52, 1349–1361 (2007).
35. American National Standards Institute, American National Standard forSafe Use of Lasers ANSI Z136.1-2000, Laser Institute of America(2000), ISBN: 978-0-912035-65-9.
36. A. Vorst, A. Rosen, and Y. Kotsuka, RF/Microwave Interaction withBiological Tissues, IEEE Press, Totowa, NJ (2006).
Journal of Biomedical Optics 056010-6 May 2012 • Vol. 17(5)
Ke et al.: Performance characterization of an integrated ultrasound, photoacoustic, and thermoacoustic imaging system
Downloaded from SPIE Digital Library on 09 May 2012 to 128.252.15.82. Terms of Use: http://spiedl.org/terms