Embed Size (px)
Citation preview

Performance Characterization of the ABI Cryocooler
P. Ramsey1, S. Clark1, A. Chuchra2, R. Boyle3, D. Early4, and R. Colbert5
1ITT Space Systems Division, Fort Wayne, IN, USA 46801 2Thermac LLC, Arnold, MD USA 21012 3NASA Goddard Space Flight Center, Greenbelt, MD, USA 20771 4Chesapeake Aerospace, Grasonville, MD 21638 5Northrop Grumman Space Technology, Redondo Beach, CA, USA 90278
ABSTRACT
The Advanced Baseline Imager (ABI) cryocooler is a two-stage hybrid cooler that will provide cooling for two sets of focal planes on the GOES-R imager, which is also known as ABI. The cooler is based on the NGST HEC product line, but includes a second cold head that operates off the one compressor. The performance of this combined system is sufficiently uncertain that a test program was undertaken to characterize the cooler over a range of potential operating conditions.
The basic purpose of the test program was to measure performance near the expected operating points. In December 2007 and January 2008, the ABI Proto-Type Module (PTM) coolers were tested at NGST, Redondo Beach, California. Various combinations of cooler power and cold tip heat load were applied and the temperature response measured.
The results were used to develop a parametric model simple enough for use in system-scale models. ABI is a NOAA funded, NASA administered instrument contract.
INTRODUCTION
The ABI cryocooler is a two-stage hybrid cooler based on the NGST HEC.1 The purpose of the cooler is to provide cooling for two sets of focal planes at two temperatures on the GOES-R imager, which is also known as ABI. The performance of this combined system is sufficiently uncertain that a test program was undertaken to characterize the cooler over a range of potential operating conditions. ABI is currently building a PTM, a fully flight-like Proto-Type Module as a pathfinder for flight.
A schematic of the ABI cryocooler is shown in Figure 1. It is essentially an NGST HEC integral pulse-tube cryocooler with a tap and transfer line to deliver working fluid to a second, remote cooler. The amount of gas that is delivered to the remote is not necessarily fixed; rather it is determined by the interaction of gas flows in the two cold heads.
The integral cooler uses a linear pulse tube, with the regenerator below the cold block and pulse tube above when oriented as shown. The remote has a coaxial pulse tube, with both regenerator and pulse tube below as shown. On the ground, gravity can induce convection in the
55
Integral (Linear) Coldhead
Compressor
Remote (Coaxial) Coldhead
Transfer line
Figure 1. Schematic layout of ABI cryocooler in finger up orientation
pulse tube when it is below the cold block. The integral, therefore, is in its most flight-like orientation with the finger up, as shown, while the remote is the opposite. Installation into a common vacuum housing mandated that the two pulse tubes be parallel as shown, which means that there is no ground test orientation that is best for both coolers. As it currently stands, ABI could be tested in two orientations, either of which would operate with horizontal pulse tubes.
Determining flight-like performance requires being able to operate with the pulse tubes in an orientation that delivers performance similar to flight, i.e. vertical. It is therefore necessary to test the individual coolers in all possible orientations so that the performance can be determined before integration into the instrument.
TEST PLAN AND EXECUTION
The original test plan called for several types of measurements. First was to measure relative to the acceptance specifications on the cooler, which require 2.27 W of cooling at 53.0 K and 5.14 W of cooling at 183.1 K. Since predicted loads have changed since the spec was issued, it was also of interest to measure the cooling available at Current Best Estimate (CBE) thermal loads. Based on modeling the cooler and optics, the test loads and test temperatures required to meet the temperatures at the focal planes can be predicted. This is the CBE test case. ABI carries a required 30% heat load margin at the cryogenic level. Added heat load increases temperature drops in the system, so that the cooler not only needs to handle the increased heat load, the required temperatures are lower. The PTM coolers will also be used in a future combined active cooler/aft optics test. Some of the characterizations are to provide known cooling reference points for the combined test. We also want to characterize the cooler with varying reject temperature, both above and below the nominal operating reject temperature of 300 K.
A baseline thermodynamic performance test was included at the suggestion of NGST. This test consisted of measuring a load line between the spec load and temperature and zero load at the same compressor power. The test had already been run on this cooler, but the purpose was to ensure that the performance had not changed since assembly. The test had also been run on the bare coldheads. This turned out to be a very valuable test.
The two coolers delivered for the PTM are known as PTM1 and PTM2. It is known that PTM2 is somewhat stronger than PTM1, therefore more in-family with the flight coolers to
56 20 K-150 K two-Stage pulSe tube cooler DevelopmentS
follow. We selected PTM2 as the cooler to receive the most extensive testing. In total, 40 tests were originally planned. PTM2 would be tested under 31 conditions: 15 with fingers up, 9 with fingers down and 7 with fingers horizontal. Nine tests were scheduled for PTM1, four with fingers up, and five in a down orientation.
A famous general once said, “No test plan survives contact with the hardware.” (Or something like that.) This effort was no exception. It was soon discovered that some of the test points were unachievable within the established safe operating limits for the cooler. Initial attempts to fit the data made the value of the baseline performance test apparent, and some variations were added to allow separation of interacting effects.
Test execution ran well ahead of schedule, so some far-off-nominal tests were added to the PTM1 docket. These were included to examine the ability of the cooler to provide an adiabatic cold head, which could be useful for system-level troubleshooting. These cases stretched the correlations to the limits.
In the end, a total of 41 cases were completed for PTM2: 21 with fingers up, 10 with fingers down and 9 with fingers horizontal. Twenty-seven tests were completed for PTM1, ten for up nine down and seven horizontal.
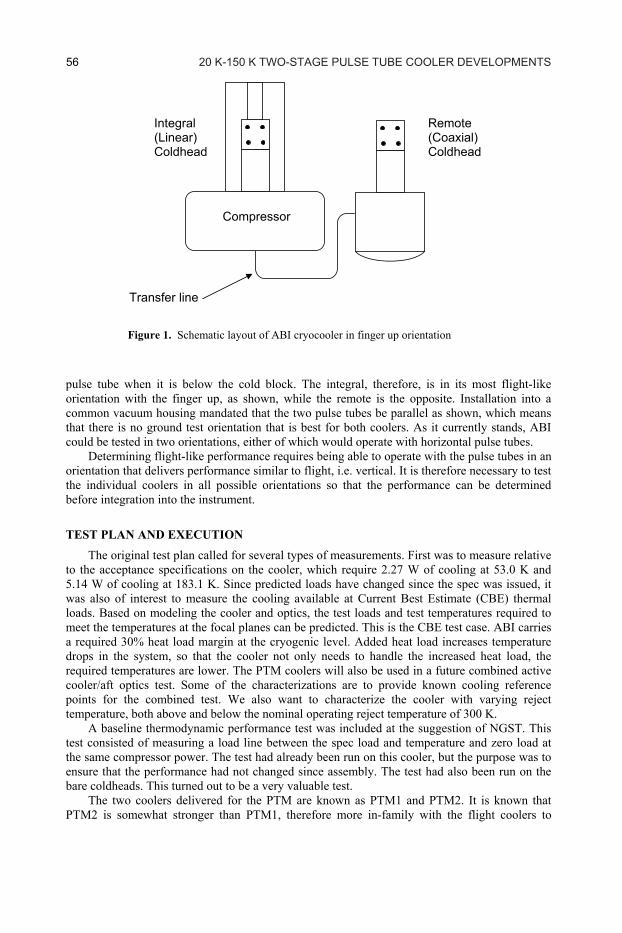
TEST RESULTS Figure 2a shows the calculated efficiency of the integral cold head as a function of cold tip
temperature for all of the PTM2 cases. Efficiency is defined as the cooling divided by compressor PV work delivered to the cold head. PV work is a function of the input power, according to a quadratic function provided by NGST. For these calculations, 23.5% of the PV work was assumed to be delivered to the remote cooler, with the balance to the integral. Results are segregated by orientation. The “up” cases show greater efficiency than the horizontal, and both are better than down. This was expected because of convection in the pulse tubes. There are
the prominent outliers in Figure 2a have a reject temperature other than 300 K. Figure 2b similarly shows the results for the remote. Again, the results are remarkably
linear, although there appears to be a bit of curvature toward the lower end. The difference between the three orientations is less noticeable.
FITTING A MODEL TO PTM2 UP MEASUREMENTS
(a) Integral
Figure 2. Efficiencies for integral and remote, PTM2
( ) Remote
a few outliers, but on the whole the results are remarkably linear. On closer examination, most of
b
The initial load line measurement (cases 0a and 0b) establishes a line along which temperature will move as the heat input is changed while maintaining constant cooler input
57CHArACTerizATion of THe Abi CryoCooler
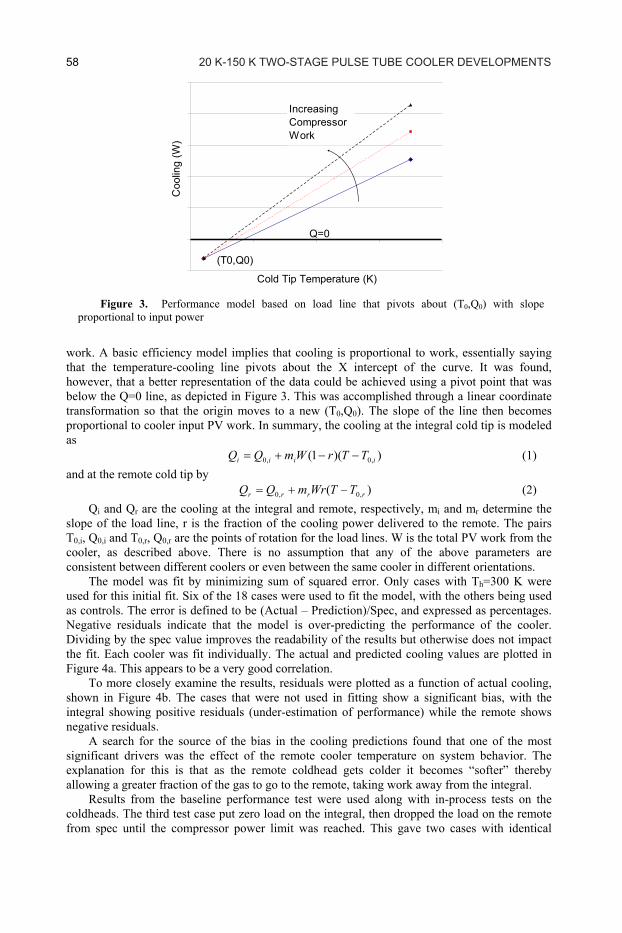
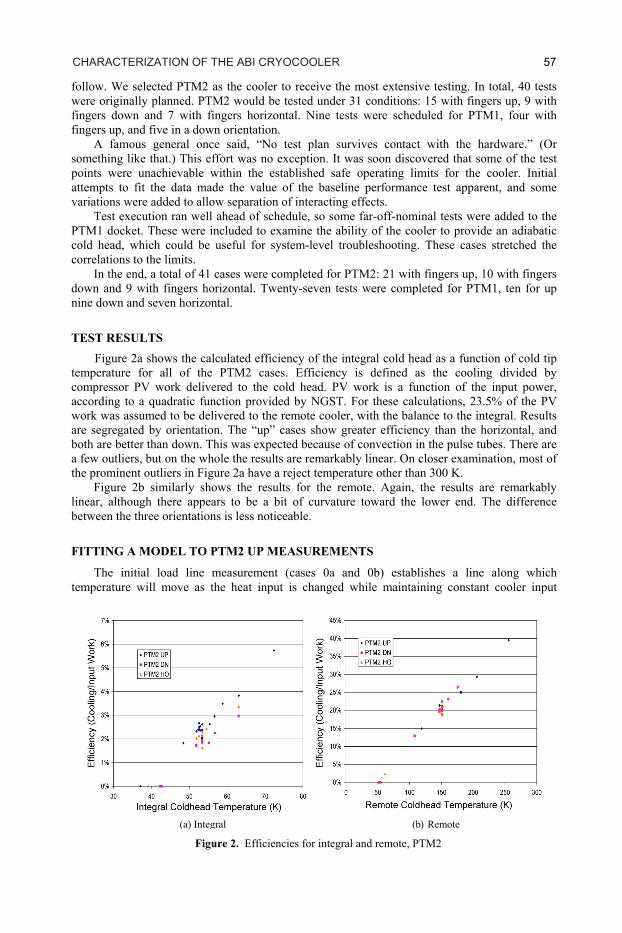
Figure 3. Performance model based on load line that pivots about (T0,Q0) with slope proportional to input power
Cold Tip Temperature (K)
Coo
ling
(W)
(T0,Q0)
Q=0
Increasing Compressor Work
work. A basic efficiency model implies that cooling is proportional to work, essentially saying that the temperature-cooling line pivots about the X intercept of the curve. It was found, however, that a better representation of the data could be achieved using a pivot point that was below the Q=0 line, as depicted in Figure 3. This was accomplished through a linear coordinate transformation so that the origin moves to a new (T0,Q0). The slope of the line then becomes proportional to cooler input PV work. In summary, the cooling at the integral cold tip is modeled as ))(1( ,0,0 iiii TTrWmQQ −−+= (1) and at the remote cold tip by )( ,0,0 rrrr TTWrmQQ −+= (2)
Qi and Qr are the cooling at the integral and remote, respectively, mi and mr determine the slope of the load line, r is the fraction of the cooling power delivered to the remote. The pairs T0,i, Q0,i and T0,r, Q0,r are the points of rotation for the load lines. W is the total PV work from the cooler, as described above. There is no assumption that any of the above parameters are consistent between different coolers or even between the same cooler in different orientations.
The model was fit by minimizing sum of squared error. Only cases with Th=300 K were used for this initial fit. Six of the 18 cases were used to fit the model, with the others being used as controls. The error is defined to be (Actual – Prediction)/Spec, and expressed as percentages. Negative residuals indicate that the model is over-predicting the performance of the cooler. Dividing by the spec value improves the readability of the results but otherwise does not impact the fit. Each cooler was fit individually. The actual and predicted cooling values are plotted in Figure 4a. This appears to be a very good correlation.
To more closely examine the results, residuals were plotted as a function of actual cooling, shown in Figure 4b. The cases that were not used in fitting show a significant bias, with the integral showing positive residuals (under-estimation of performance) while the remote shows negative residuals.
A search for the source of the bias in the cooling predictions found that one of the most significant drivers was the effect of the remote cooler temperature on system behavior. The explanation for this is that as the remote coldhead gets colder it becomes “softer” thereby allowing a greater fraction of the gas to go to the remote, taking work away from the integral.
Results from the baseline performance test were used along with in-process tests on the coldheads. The third test case put zero load on the integral, then dropped the load on the remote from spec until the compressor power limit was reached. This gave two cases with identical
58 20 K-150 K two-Stage pulSe tube cooler DevelopmentS

(a) Correlation (b) Residuals
Figure 4. Comparison of model to actual test data for PTM2 up at 300 K
integral conditions, but different remote conditions. Comparing these to in-process tests on the cold heads alone, the load split at two points could be derived.
The load split parameter r was modeled to be a linear function of (Tr/Ti), since the softening spring effect should go both ways. Various models of the effects of this parameter were proposed and tried, all ultimately reducible to the form
(3) kir TTrrr )/(10 +=
Over the range of interest it was found that the results were very weakly dependent on the value of k, so in the end it was set to 1. Results from fitting the model using this form for r showed no serious biases, either in the fit or control cases. Residuals were generally less than four percent, but there are two outliers where the remote residuals are 6% and 12%. These two cases are for low compressor power (~60% of maximum) at relatively high loads.
The final variable to be fit with the PTM2 up data is reject temperature effect. The impact was assumed to impact the cooler efficiency, so that Eq. (1) becomes (with subscript i for the integral, similarly using subscript r for the remote):
))300(*1(*))(1( ,0,0 −+−−+= hiiiiii TCTTrWmQQ (4)
The temperature impact is a multiplier on the cooling capacity of the cooler, crafted to be equal to 1 when Th=300 K. This can be solved in closed form for C. Results from tests at 287 K and 313 K are then used to find the appropriate value. The negative impact of a 13 K rise was greater than the positive impact of a 13 K drop on Th, which would argue for a quadratic function. The errors are less than 1% so the linear function is retained for simplicity..
A plot of the residuals for the full model compared to PTM2 up measurements is shown in Figure 5. For evaluating the fit, three classifications were considered. The “fit” are for the eight cases used in fitting the model, “All” is for all measurements (22 cases), and “w/o Outliers” includes all cases except where the residual exceeds 7% (21 cases). The only case that fails is a case at 60% of maximum power and 1.5 times expected load. This case is far outside the expected operating condition, so it is reasonable to exclude it. The integral fit shows an RMS error of less than 1% for the fit cases and less than 2% for all data when outliers are excluded. The RMS error for the remote is 2.3% when all cases are considered.
59CHArACTerizATion of THe Abi CryoCooler
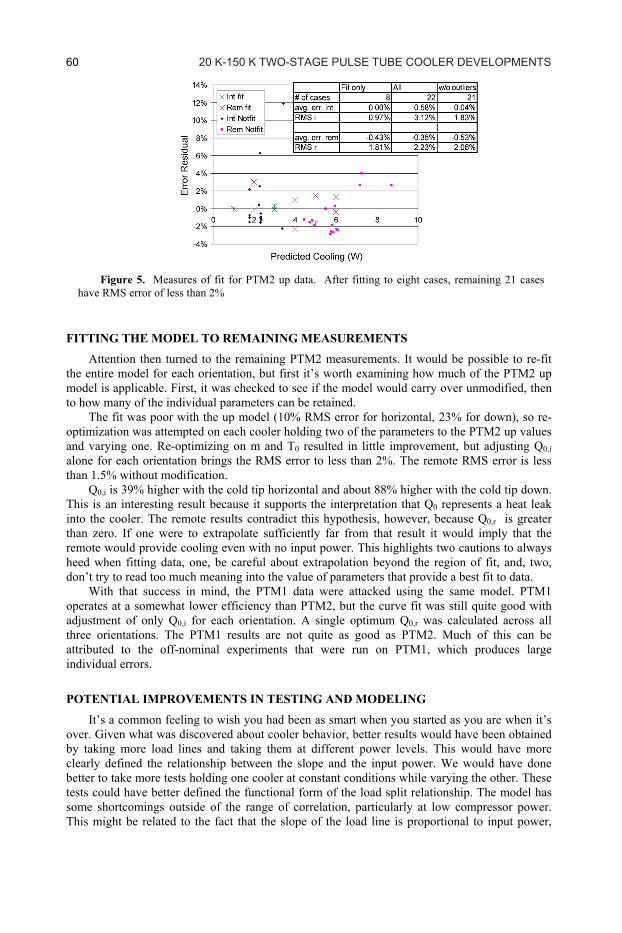
Figure 5. Measures of fit for PTM2 up data. After fitting to eight cases, remaining 21 cases have RMS error of less than 2%
FITTING THE MODEL TO REMAINING MEASUREMENTS
Attention then turned to the remaining PTM2 measurements. It would be possible to re-fit the entire model for each orientation, but first it’s worth examining how much of the PTM2 up model is applicable. First, it was checked to see if the model would carry over unmodified, then to how many of the individual parameters can be retained.
The fit was poor with the up model (10% RMS error for horizontal, 23% for down), so re-optimization was attempted on each cooler holding two of the parameters to the PTM2 up values and varying one. Re-optimizing on m and T0 resulted in little improvement, but adjusting Q0,i alone for each orientation brings the RMS error to less than 2%. The remote RMS error is less than 1.5% without modification.
Q0,i is 39% higher with the cold tip horizontal and about 88% higher with the cold tip down. This is an interesting result because it supports the interpretation that Q0 represents a heat leak into the cooler. The remote results contradict this hypothesis, however, because Q0,r is greater than zero. If one were to extrapolate sufficiently far from that result it would imply that the remote would provide cooling even with no input power. This highlights two cautions to always heed when fitting data, one, be careful about extrapolation beyond the region of fit, and, two, don’t try to read too much meaning into the value of parameters that provide a best fit to data.
With that success in mind, the PTM1 data were attacked using the same model. PTM1 operates at a somewhat lower efficiency than PTM2, but the curve fit was still quite good with adjustment of only Q0,i for each orientation. A single optimum Q0,r was calculated across all three orientations. The PTM1 results are not quite as good as PTM2. Much of this can be attributed to the off-nominal experiments that were run on PTM1, which produces large individual errors.
POTENTIAL IMPROVEMENTS IN TESTING AND MODELING
It’s a common feeling to wish you had been as smart when you started as you are when it’s over. Given what was discovered about cooler behavior, better results would have been obtained by taking more load lines and taking them at different power levels. This would have more clearly defined the relationship between the slope and the input power. We would have done better to take more tests holding one cooler at constant conditions while varying the other. These tests could have better defined the functional form of the load split relationship. The model has some shortcomings outside of the range of correlation, particularly at low compressor power. This might be related to the fact that the slope of the load line is proportional to input power,
60 20 K-150 K two-Stage pulSe tube cooler DevelopmentS
with no zero offset. The fact that the best fit value of Q0,r is greater than zero is obviously un-physical and will lead to errors at conditions far from normal.
CONCLUSION
Measurements of the performance of the ABI PTM cryocoolers were made and fit to a ten parameter model. The basic form of the model is a load line that rotates around a point that is determined from fitting the data. Each cooler is described by four parameters, three to describe the offset load line and one for the reject temperature effects, and a two-parameter linear function to describe the fraction of the PV work that is delivered to each cooler.
ACKNOWLEDGMENT
This work was performed under contract to ITT Corporation. All opinions and conclusions presented are those of the authors and do not necessarily reflect the position and views of other organizations. The ABI program is a NASA administered and NOAA funded program.
REFERENCES
1. Tward, E. et al., "High Efficiency Pulse Tube Cooler," Cryocoolers 11, Kluwer Academic/Plenum Publishers, New York (2001), pp. 163-167.
61CHArACTerizATion of THe Abi CryoCooler