Embed Size (px)
Citation preview

PERFORMANCE DATA AND EVIDENCE-BASED DECISION MAKING
Dr. Edward Monaghan Annual Directors’ Meeting March 12, 2019
The mission of the Office of Migrant Education is to provide excellent leadership, technical assistance, and financial support to improve the educational opportunities and academic success
of migratory children, youth, agricultural workers, fishers, and their families.

AGENDA / OBJECTIVES
• Introduction – Short History of Performance Reporting and Evidence
• Evidence Definitions • Evidence in Program Design • Summary
2

LEGAL PAGE
Statute Title I, Part C, Section 1304(c)(5).
Code of Federal Regulations 34 CFR 200.84.
Guidance Migrant Education Program (MEP) Guidance, March, 2017. Chapter VIII, Program Evaluation, pages 84-95.
3

INTRODUCTION - SHORT HISTORY OF PERFORMANCE REPORTING AND EVIDENCE
4

PERFORMANCE REPORTING: 2017 MEP ADM
Our Consolidated State Performance Report (CSPR) Jeopardy Show!
5

EVIDENCE: 2018 MEP ADM
Our Family Feud Show!
6

MEP PROGRAM IMPROVEMENT WEBINAR
oOccurred on November 14, 2018 oExplored What Works Clearinghouse, the website to find
strategies and interventions that are supported by strong or moderate evidence
oExplored Levels of Evidence
7

READING/LANGUAGE ARTS PROFICIENCY
39.4% 40.2% 39.6%
29.1% 30.0% 29.1%
41.7% 43.4% 43.1%
27.8% 29.4% 28.3%
20%
25%
30%
35%
40%
45%
SY 2014-15 SY 2015-16 SY 2016-17
Perc
ent P
rofic
ient
Low SESELHispanicMigrant
8

MATHEMATICS PROFICIENCY
35.0%
36.7%
39.6%
26.4%
30.4% 31.1%
37.0% 39.2%
40.3%
26.2% 28.5% 28.5%
20%
25%
30%
35%
40%
45%
SY 2014-15 SY 2015-16 SY 2016-17
Perc
ent P
rofic
ient
Low SESELHispanicMigrant
9

GOVERNMENT PERFORMANCE RESULTS ACT (GPRA) TARGETS
From a base in SY 2015-16, GPRA targets increased 2.0% in both SY 2016-17 and SY 2017-18.
10

MEP READING/LA GPRA TARGET AND ACTUAL DATA
27.8% 29.4% 28.3%
31.4% 33.4%
0%5%
10%15%20%25%30%35%40%45%50%
SY 2014-15 SY 2015-16 SY 2016-17 SY 2017-18
ActualTarget
11

MEP MATHEMATICS GPRA TARGET AND ACTUAL DATA
26.2% 28.5% 28.5%
30.5% 32.5%
0%5%
10%15%20%25%30%35%40%45%50%
SY 2014-15 SY 2015-16 SY 2016-17 SY 2017-18
ActualTarget
12

EVIDENCED-BASED PRACTICES AND GPRA ATTAINMENT
If we seek to radically change the GPRA trajectories, let’s consider how implementation of “evidence-based practices” may improve our students’ Reading/LA and Mathematics proficiency…what does that term mean to you?
13

EVIDENCE DEFINITIONS
14
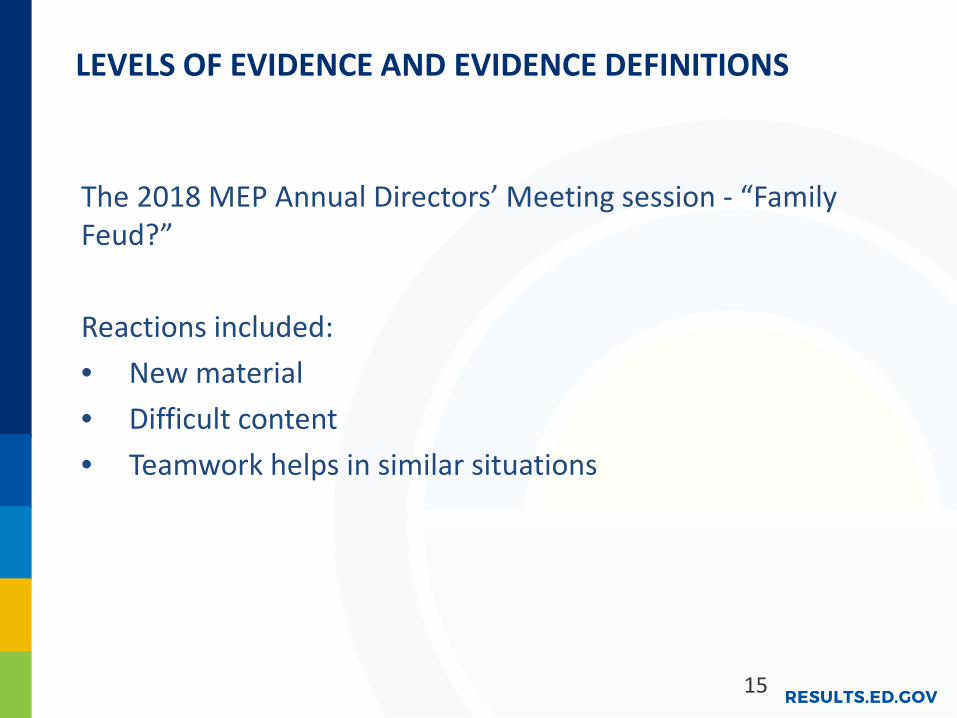
LEVELS OF EVIDENCE AND EVIDENCE DEFINITIONS
The 2018 MEP Annual Directors’ Meeting session - “Family Feud?” Reactions included: • New material • Difficult content • Teamwork helps in similar situations
15

EVIDENCE DEFINITIONS
And “Family Feud” content included: • Collection of data, analysis, interpretation, scientific
method, data visualizations • Logic model, demonstrates a rationale, experimental,
quasi-experimental, regression, correlation (methodology)
• Program requirements • CSPR questions
16

EVIDENCE DEFINITIONS (CONTINUED)
Our “Family Feud” session was an introduction to evidence. Today, we examine the four levels of evidence: • Strong Evidence • Moderate Evidence • Promising Evidence • Demonstrates a Rationale
17

STRONG EVIDENCE
Includes at least one well-designed and well-implemented experimental study on the intervention. • Statistically significant and positive effect of the
intervention on the outcome. • Not be overridden by unfavorable evidence • Have a large sample and multi-site sample • Sample overlaps with the populations.
18

MODERATE EVIDENCE
Includes at least one well-designed and well-implemented quasi-experimental study on the intervention. • Statistically significant and positive effect of the
intervention on the outcome. • Not be overridden by unfavorable evidence. • Have a large sample and multi-site sample. • Sample overlaps with the populations.
19

PROMISING EVIDENCE
Includes at least one well-designed and well-implemented correlational study with statistical controls on the intervention. • Statistically significant and positive effect of the
intervention on the outcome. • Not be overridden by unfavorable evidence.
20

DEMONSTRATES A RATIONALE
• The intervention has a well-specified logic model that is informed by research or an evaluation that suggests how the intervention is likely to improve the relevant outcome, and
• The intervention should include an effort to study the effects of the intervention, ideally producing promising evidence or higher.
21

EVIDENCE IN PROGRAM DESIGN
22

MIGRANT EDUCATION PROGRAM – LOGIC MODEL
Leading Indicators
1. Percent of PFS
Served
2. Percent Grades 7-12 Received Services
3. Percent Received Full Credit for Algebra I
IMPACT Gap Reduction in Student Achievement in Elementary School, Middle School, & High School Increased Graduation Rate Increased Post-Secondary Participation
RESULTS
Improved Student Proficiency in Reading/LA & Mathematics Improved Secondary Student Promotion & Graduation Improved Algebra I Success Rate
OUTCOMES
Increased Percentage of PFS Students Receiving Services Increased Percentage of Secondary Students Receiving Services Increased Percentage of 8tj Grade Students Proficient in Mathematics
OUTPUT
Children Recruited & Identified MSIX Facilitates Records Transfer & Coordination Children’s Secondary Course History Collected for Purpose of Credit Accrual Children Served, Particularly PFS, With Instructional Services, & Support Services w/Breakout of Counseling Children Referred to Other Programs Children Served Under COS Authority
PROCESS SEA Grants Provide Resources For: Instructional & Support Services Identification & Recruitment Re-Interviewing CNA/SDP/ Evaluation Coordination of Services Parent Involvement Collection of Data Within EDFacts and MSIX Technical Assistance & Monitoring of Award & Subawards
INPUT
Resources: $374,751,000 Funding (FY 16) OME Excellent Leadership, TA, & Financial Support Consortium Grants MSIX Barriers: Student Mobility Instructional Time School Engagement Low SES/Educational Support EL Status Health Access to Services

SDP STRATEGY SELECTION RESOURCES: “NON-REGULATORY GUIDANCE – USING EVIDENCE TO STRENGTHEN EDUCATION INVESTMENTS PART I”
• Identify local needs • Select relevant, evidence-based interventions • Plan for implementation • Implement • Examine and reflect ESSA - Using Evidence to Strengthen Investment
24

SDP STRATEGY SELECTION RESOURCES: WHERE DO I FIND THEM?
Institute of Educational Sciences (IES): IES - "What Works Clearinghouse“ (WWC) • Select topics to find “What Works” based on
evidence • Reviewed research includes outcome domains,
effectiveness ratings, studies that meet standards, improvement index, etc. • Let’s look at an example!
25

SDP STRATEGY SELECTION RESOURCES: IES EXAMPLE
After identifying local needs for decreasing dropouts, review a dropout prevention strategy, “Check and Connect.” • Domains • Effectiveness ratings • Studies that meet standards • Grades and numbers of students • Improvement index
26

SDP STRATEGY SELECTION ACTIVITY
• Identify a partner. • Review and quiz partner on types of evidence. • Describe one Comprehensive Needs Assessment
(CNA) need that your MEP must address differently for migratory students to succeed.
• Explore the WWC for potential solutions. • Report-out.
27

SUMMARY
28

THOUGHTS ON EVIDENCE…
“Extraordinary observations require extraordinary evidence.” -Buzz Aldrin (astronaut)
29

MORE THOUGHTS ON EVIDENCE…
“Science has authority, not because of white coats, or titles, but because of precision and transparency; you explain your theory, set out your evidence, and reference the studies that support your case.” -Ben Goldacre (physician, writer)
30