Embed Size (px)
Citation preview

Dr. J T VergheseManaging DirectorSTEAG Energy Services, India
Performance enhancement of old thermal power stations
using software tools
EEC Workshop - 29th August , New Delhi

STEAG Energy Services India Business Lines
2
Textmasterformate durch Klicken bearbeitenZweite Ebene
Dritte EbeneVierte Ebene
Fünfte Ebene
STEAG Energy Services India offers services in the field of:
Engineering Consulting Services
Diagnostic Study and Testing
Energy Audit
Renovation & Modernization Consultancy
Operation and Maintenance
Information Technology for Power Plants
New Technologies for Power Plants
Advisory

STEAG Energy Services India Offices / O & M Sites
3
Hazira
New Delhi
Haldia
Bangalore
Hyderabad
Ahmedabad
Jharsuguda
Chennai
Noida
Corporate & Registered Offices of STEAG India
Regional Offices of STEAG India
O & M Sites of STEAG India
Bathinda

Major Clients
4Many more

O & M Projects
5
CCPP Hazira, Gujarat - India
4 X 600 MW Coal Based Power Plant at Jharsuguda, Orrisa - India
S. No. Type Capacity Location Owner Scope
Duration
From To
1. CCPP 156 MW Hazira GSEG O & M 2001 2010
2. CCPP 30 MW Gandhar ONGC O & M 2005 2007
3. CCPP 116 MW Haldia HPL O & M 2006 2012
4. WHRP 30 MW Goa Videocon O & M Advisory 2006 2011
5. Coal 4 X 600 MW JharsugudaSterlite Energy O & M 2010 2017
6. CCPP507 MW
(156 MW + 351 MW)
Hazira GSEG O & M 2011 2015
7. CCPP 165 MW Bathinda HMEL O & M 2011 2015

R & M and LE
6
Mapping using Ebsilon Software to check the potential for efficiency improvement
Mapping using Ebsilon Software to check the potential for efficiency improvement
RLA Studies & Performance
Evaluation Tests
RLA Studies & Performance
Evaluation Tests
Techno-economic Analysis of R&M
Measures
Techno-economic Analysis of R&M
Measures
R&M Measures should include online software
tools to optimize efficiency
R&M Measures should include online software
tools to optimize efficiency
Preparation of technical and commercial
specification for R&M
Preparation of technical and commercial
specification for R&M
Tendering and award of contract
for R&M
Tendering and award of contract
for R&M

How to Improve Efficiency
7
First Step: low hanging fruits
Improve efficiency by improving operation and maintenance by the normal methods:
● Maintenance Planning● Training● Standard Operating
Procedures● Improve maintenance methods

How to Improve Efficiency
8
Next Steps
• Audit or “map the plant using offline modeling tool to detect causes for sub-optimal operations
• Provide online systems for
• optimization of resources• fault detection and prediction• lifetime monitoring for better planning of inspections and
maintenance and calculation of life-time consumption
• Provide customized systems for maintenance planning

Audit or “map“ the plant using off line modelling
Summary of the mapping exercise conducted jointly by CEA and Steag under the Indo
German Efficiency Program
9

Mapping of 85 power plants - EBSILON Design Model
10
Performance as per design documents
1. Output 210 MW
2. Gross Heat Rate 2305.16 kcal/kWh
3. Coal Consumption 110 t/h
4. Boiler Efficiency 86
5. Turbine Cycle Heat Rate 1982.72 kcal/kWh
6. Unit Efficiency 37.3%
Analysis

EBSILON Running Model
11
Simulated Performance as per operating GCV
1. Output 210 MW
2. Gross Heat Rate 2664.22 kcal/kWh
3. Coal Consumption 166 t/h
4. Boiler Efficiency 79.6%
5. Turbine Cycle Heat Rate 2122.50 kcal/kWh
6. Unit Efficiency 32.3%
Analysis

85 Units Mapped – Size-wise
12
Capacity (MW) Number of Units
100 1105 1110 6120 8125 1140 4195 1200 4210 49250 5500 5
Total 85

Analysis of 16 Units Under 16 Years of Age with Reaction Type Turbine Including Indicative Saving of Coal
13
0
200
400
600
800
1000
1200
Analysis of 16 units under 16 years of age with reaction type turbineIndicative saving of coal
potentially conserved coal bestth tons of consumed coal per year
If all the units would have the same gross heat rate as the most efficient unit, 8.6% of the coal, altogether 1,256,650 tons, approx. Rs 113.1 crores would be saved by the 15 less efficient units each year.Assumptions: all the units work at a PLF of 80%, use coal with 4000 kcal/kg calorific value and 1ton coal costs Rs 900

Analysis of 16 Units Under 16 Years of Age with Reaction Type Turbine
14
0
200
400
600
800
1000
1200
1400
1600
Analysis of 16 units under 16 years of age with reaction type turbine
Indicative additional capacity
additional capacitymillion units/ yearmillion units per year
If all the units would have the same capacity as the unit with the highest capacity, the overall output would be by 9.7% or 2,173 million units higher each year.Assumption: all the units work at a PLF of 80%

Analysis of 16 Units Above 16 Years of Age with Reaction Type Turbine
15
U1
U2
U3
U4
U5
U6
U7
U8
U9
U10
U11
U12
U13
U14
U15
U16
0
200
400
600
800
1,000
1,200
Analysis of 16 units above 15 years of age with reaction type turbineIndicative saving of coal
potentially conserved coal bestth tons of consumed coal per year
If all the units would have the same gross heat rate as the most efficient unit, 7.3% of the coal, 1,122,600 tons, approx. Rs 101 crore would be saved by the 15 less efficient units each year.Assumptions: all the units work at a PLF of 80%, use coal with 4000 kcal/kg calorific value and 1ton coal costs Rs 900

Analysis of 16 Units Above 15 Years of Age with Reaction Type Turbine
16
0
200
400
600
800
1000
1200
1400
1600
Analysis of 16 units above 15 years of age with reaction type turbine
Indicative additional capacity
additional capacitymillion units/ year
million units per year
If all the units would have the same capacity as the unit with the highest capacity, the overall output would be by 8.1% or 1,807 million units higher each year.Assumption: all the units work at a PLF of 80%

Analysis of 17 Units Above 15 Years of Age with Impulse Type Turbine
17
If all the units would have the same gross heat rate as the most efficient unit, 7.3% of the coal, 1,122,600 tons, approx. Rs 128.8 crore would be saved by the 15 less efficient units each year Assumptions: all the units work at a PLF of 80%, use coal with 4000 kcal/kg calorific value and 1ton coal costs Rs 900
U1
U2
U3
U4
U5
U6
U7
U8
U9
U10
U11
U12
U13
U14
U15
U16
U17
0
200
400
600
800
1,000
1,200
Analysis of 17 units above 15 years of age with impulse type turbineIndicative saving of coal
potentially conserved coal bestth tons of consumed coal per year
If all the units would have the same gross heat rate as the most efficient unit, 7.3% of the coal, 1,122,600 tons, approx. Rs 128.8 crore would be saved by the 15 less efficient units each year Assumptions: all the units work at a PLF of 80%, use coal with 4000 kcal/kg calorific value and 1ton coal costs Rs 900

Analysis of 17 Units Above 15 Years of Age with Impulsive Type Turbine
18
U1
U2
U3
U4
U5
U6
U7
U8
U9
U10
U11
U12
U13
U14
U15
U16
U17
0
200
400
600
800
1000
1200
1400
1600
Analysis of 17 units above 15 years of age with impulse type turbine
Indicative additional capacity
additional capacity realmillion units per year
If all the units would have the same capacity as the unit with the highest capacity, the overall output would be by 7.1% or 1,655 million units higher each year.Assumption: all the units work at a PLF of 80%

Auxiliary Consumption of 210 MW Capacity Units
19
7
8
9
10
11
12
13
Auxiliary Consumption of 210 MW capacity units (%)
Auxiliary consumption (%)

Generally Observed Problems
20
Systems Observations
Maintenance planning and management
Needs to be upgraded
Online monitoring Not provided
DCS Only some units have been provided
Documentation Needs improvement
Operating instruction and manual Needs to be updated

Online systems
– Provide Online systems for:● optimization of
processes● fault detection and
prediction system ● life time monitoring for
better planning of inspections and maintenance and calculation of life time consumption.
21

Why to use the software tools ?
DCS has the information needed to do the calculation of efficiencies and heat rates – it gives performance calculation, trending and values of parameters
But what are the limitations ?
1.DCS does not give the system wise efficiencies so you do not know where the losses occur
2.Data from I/O points e.g. Temperature, pressure mass flow could be wrong because of sensor errors, bad connectors etc. That makes calculation erroneous.
3.DCS does not give advice what to do
22

Online Tool: Optimization Sequence
1. All relevant data from DCS which goes into calculation need to be validated i.e. all implausible values have to be replaced by plausible values
2. All calculations must be done every 5 minutes (not only once a day) since the quality of coal and combustion process is changing. Threfore the state of heating surfaces must be monitored constantly.
3. Results are presented in a user friendly manner:Status of the subsystems is indicated by green, yellow, red and losses expressed in money terms.
23

24/09/2008 ES-ST_ING_neu
Page 24
PADO Screens

24/09/2008 ES-ST_ING_neu
Page 25
PADO Screens
Textmasterformate durch Klicken bearbeitenZweite Ebene
Dritte EbeneVierte Ebene
Fünfte Ebene

PADO Controllable Losses (1)
26
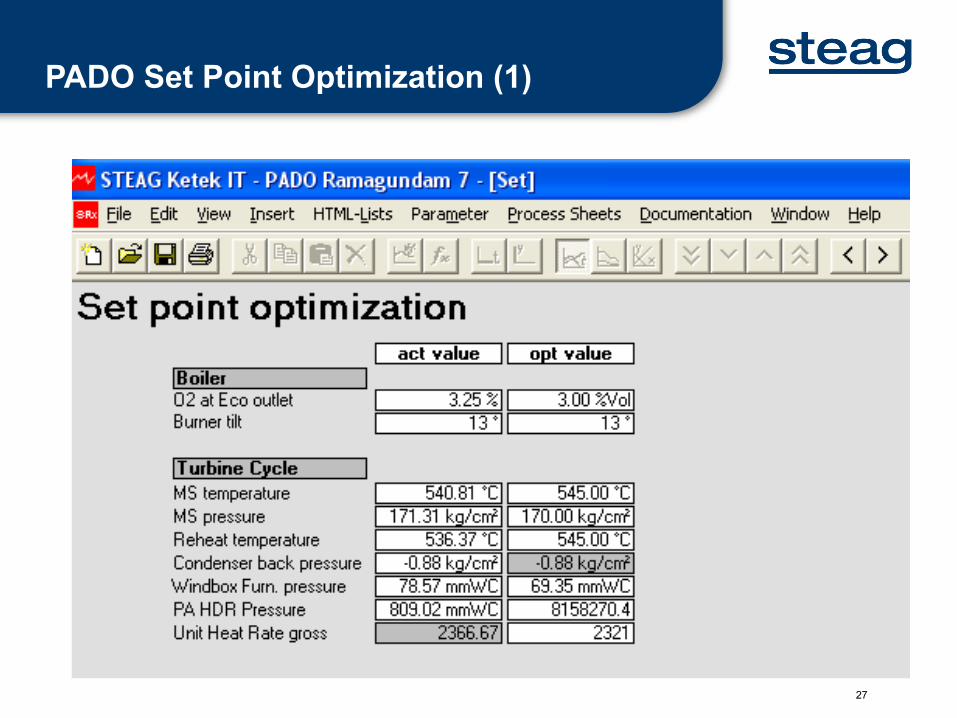
PADO Set Point Optimization (1)
27
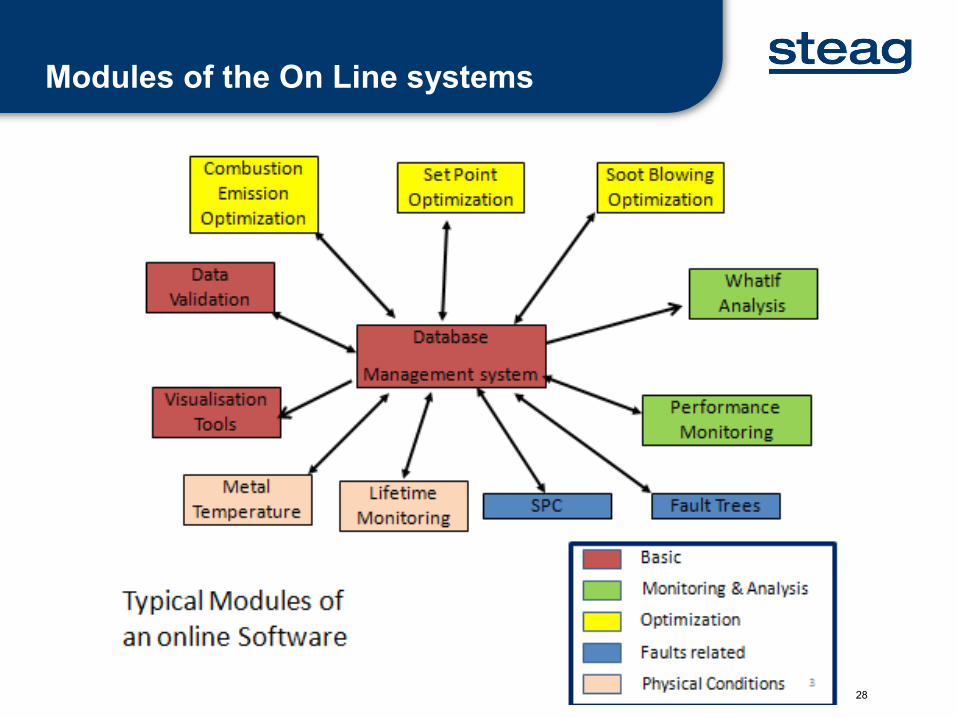
Modules of the On Line systems
28

Advantages of the Online Tool
– Improving the quality of measurements by data validation
– Evaluation of boiler, turbines, condenser and other components
– Optimization of unit operation (sootblowing, setpoints)
– Calculation of what-if scenarios– Generation of daily and monthly reports
– Enhance the efficiency of the power plant!
29

30


![Steam Boilers of Thermal Power Stations [M. I. Reznikov, Yu M. Lipov]](https://img.pdfslide.net/doc/110x75/563db864550346aa9a934584/steam-boilers-of-thermal-power-stations-m-i-reznikov-yu-m-lipov.jpg)