Embed Size (px)
Citation preview

A
lhGBaVd©
K
1
opeaiid
ttstda
k
0d
Journal of Hazardous Materials B138 (2006) 560–573
Performance estimation of a Venturi scrubber using a computationalmodel for capturing dust particles with liquid spray
S.I. Pak a,∗, K.S. Chang b
a National Fusion Research Center, 52 Eoeun-dong, Yuseong-gu, Daejeon 305-333, Republic of Koreab Department of Aerospace Engineering, KAIST, Daejeon, Republic of Korea
Received 5 January 2006; received in revised form 18 May 2006; accepted 28 May 2006Available online 16 June 2006
bstract
A Venturi scrubber has dispersed three-phase flow of gas, dust, and liquid. Atomization of a liquid jet and interaction between the phases has aarge effect on the performance of Venturi scrubbers. In this study, a computational model for the interactive three-phase flow in a Venturi scrubberas been developed to estimate pressure drop and collection efficiency. The Eulerian–Lagrangian method is used to solve the model numerically.as flow is solved using the Eulerian approach by using the Navier-Stokes equations, and the motion of dust and liquid droplets, described by theasset–Boussinesq–Oseen (B–B–O) equation, is solved using the Lagrangian approach. This model includes interaction between gas and droplets,
tomization of a liquid jet, droplet deformation, breakup and collision of droplets, and capture of dust by droplets. A circular Pease–Anthonyenturi scrubber was simulated numerically with this new model. The numerical results were compared with earlier experimental data for pressurerop and collection efficiency, and gave good agreements.2006 Elsevier B.V. All rights reserved.
meth
tsatascr
tatts
eywords: Venturi scrubber; Dispersed three-phase flow; Eulerian–Lagrangian
. Introduction
Micron-sized dust particles are known to have a fatal effectn human bodies, especially the heart and lungs. These finearticles are mainly generated from the internal combustionngines of cars and other motor vehicles, fuel burned at station-ry sources such as power-generating plants, and various otherndustrial processes. A lot of Venturi scrubbers have been usedn industrial plants, starting in the 1940s, to remove the harmfulust particles.
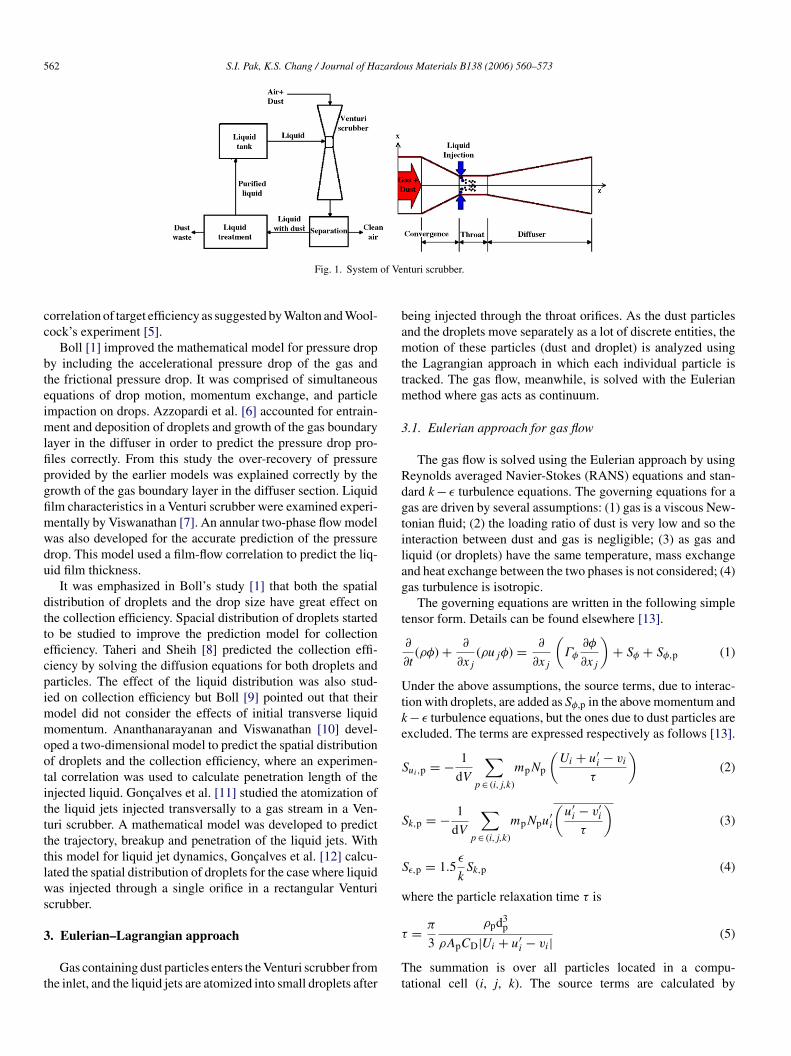
Venturi scrubbers are very high in collection efficiency whilehe establishment and maintenance costs are low. The dust thathe devices can remove is between 0.5∼10 �m in diameter. Fig. 1hows how the system of a Venturi scrubber is composed. A Ven-
uri scrubber consists of three parts: convergence, throat, andiffuser. The dust particles introduced with the air are acceler-ted in the convergence and collide with the liquid droplets at∗ Corresponding author. Tel.: +82 42 870 1635; fax: +82 42 870 1939.E-mail addresses: [email protected] (S.I. Pak),
[email protected] (K.S. Chang).
dtlft
eT
304-3894/$ – see front matter © 2006 Elsevier B.V. All rights reserved.oi:10.1016/j.jhazmat.2006.05.105
od; Computational model
he throat, mainly through inertial impaction. The other colli-ion mechanisms, such as interception and Brownian diffusion,lso work, but they are very weak in comparison with the iner-ial impaction [1]. The droplets that captured the dust particlesre separated at the cyclone separator, connected to the Venturicrubber, and go out through the drain hole. The clean air is dis-harged into the atmosphere and the drained liquid is treated foreuse. This process is drawn in Fig. 1.
Venturi scrubbers can be classified as either the liquid injec-ion type (Pease–Anthony type) or the wetted approach typeccording to how the liquid is supplied [2]. In the former type,he liquid is injected from the orifices located on the Venturihroat as shown Fig. 1. The injected liquid jet breaks up intomall droplets by aerodynamic force. The latter device intro-uces the liquid from the convergence part of the Venturi, andhe liquid flows as liquid film along the wall. At the throat, theiquid sheds the droplets by the shear action of aerodynamicorce. In this paper we studied the Pease–Anthony type of Ven-
uri scrubber.The performance of the gas cleaning equipment has beenvaluated by means of pressure drop and collection efficiency.he pressure drop is directly related to the operational cost. The
S.I. Pak, K.S. Chang / Journal of Hazardous Materials B138 (2006) 560–573 561
Nomenclature
Ap frontal particle (droplet or dust) areaperpendicular to gas stream (m2)
CD drag coefficient of particle (dimensionless)d0 initial droplet diameter (m)dd droplet diameter (m)ddef diameter of deformed droplet due to aerodynamic
force (m)ds density of dust particle (m)dV volume of a computational cell (m3)D32 Sauter mean diameter of droplets (m)D84% diameter corresponding to the 84th percentile (m)DM median diameter (m)k turbulent kinetic energy (m2/s2)l/g liquid-to-gas volume flow ratio (l/m3)mp particle mass (kg)Ncap number of dust particles captured by one droplet
parcelNcell total number of dust particles absorbed by all
droplets within a computational cellNd number of particles represented by one droplet
parcelNs number of particles represented by one dust parcelOh Ohnesorge number (dimensionless)r/Rmax radial distance from throat center of Venturi
(dimensionless)Red droplet Reynolds number (dimensionless)Res Reynolds number of dust particle (dimensionless)Sφ,p source term due to interaction with dropletst time (s)tcb column fracture time of liquid jet (s)T temperature (K)ui instantaneous gas velocity vector (m/s)Ug magnitude of gas velocity (m/s)Ui mean gas velocity vector (m/s)vi instantaneous particle velocity vector (m/s)vdi velocity vector of droplet (m/s)vsi velocity vector of dust particle (m/s)
Vrel relative velocity of droplet for surrounding gas(m/s)
Vg,th gas throat velocity (m/s)We Weber number (dimensionless)xi position vector (m)z distance from Venturi entry (m)zth distance from injection point (mm)
Greek lettersε turbulent energy dissipation rate (m2/s3)φ temporary variable for gas (=1, ui, T, k, or ε)Γ ϕ effective viscosity for ϕηt collection efficiency of a single droplet
(dimensionless)μ viscosity coefficient of gas (Pa s)μ0 mean for diameter of dust particles (m)μd viscosity coefficient of droplet (Pa s)
ρ gas density (kg/m3)ρd droplet density (kg/m3)ρs density of dust particle (kg/m3)σ0 standard deviation for diameter of dust particles
(dimensionless)σd surface tension coefficient of droplet (N/m)τ particle relaxation time (s)ψc, ψ
′c inertial impaction parameter (dimensionless)
Subscriptsd dropleti or j tensor notation (1, 2, or 3)p particle (dust particle or droplet)s dust particle
Superscripts( ) density-averaged
owdbdds(nbog
tLotabddn
2
agWtfmeea
( )′ fluctuating
ptimum design is to achieve the maximum collection efficiencyith the minimum pressure drop. There has been much researchone to predict the performance but the flow in a Venturi scrub-er is very complex: the dispersed three-phase mixture of gas,roplets, and dust particles. Interactions between gas and liquidroplets, atomization of the liquid jet, droplet breakup and colli-ion, and interactions between liquid droplets and dust particlescollision and capturing) also occur. Due to these complex phe-omena, the experimental correlations or simple models haveeen used so far to predict the performance [3]. These meth-ds have limits on the performance prediction when the Venturieometry or the operation condition changes.
In this paper, the dispersed three-phase flow of the Ven-uri scrubber was analyzed numerically using the Eulerian–agrangian method and modelling of the complex phenomenane was done one by one. The gas was assumed to be a con-inuum while liquid droplets and dust particles were treateds discrete entities. Atomization of the liquid jet, interactionetween gas and liquid droplets, dust capture of liquid droplets,roplet breakup and collision, and droplet deformation by aero-ynamic force were all taken into account by making eachumerical model.
. Literature review
Much research has been done to predict the pressure dropnd collection efficiency of Venturi scrubbers. Calvert [4] sug-ested a prediction model for the pressure drop for the first time.ith the assumption that droplets achieve the gas velocity by
he end of the Venturi throat, the pressure drop was derivedrom Newton’s law describing the force required to change the
omentum of the droplets. Calvert [4] also developed a math-matical model to predict collection efficiency. The collectionfficiency was obtained from mass balance for dust where themount of removed dust per droplet was determined from the
562 S.I. Pak, K.S. Chang / Journal of Hazardous Materials B138 (2006) 560–573
of Ve
cc
bteimlfipgfimwdu
dttecpimmootittttlws
3
t
bamttm
3
Rdgtilag
t
Utke
S
S
S
w
Fig. 1. System
orrelation of target efficiency as suggested by Walton and Wool-ock’s experiment [5].
Boll [1] improved the mathematical model for pressure dropy including the accelerational pressure drop of the gas andhe frictional pressure drop. It was comprised of simultaneousquations of drop motion, momentum exchange, and particlempaction on drops. Azzopardi et al. [6] accounted for entrain-
ent and deposition of droplets and growth of the gas boundaryayer in the diffuser in order to predict the pressure drop pro-les correctly. From this study the over-recovery of pressurerovided by the earlier models was explained correctly by therowth of the gas boundary layer in the diffuser section. Liquidlm characteristics in a Venturi scrubber were examined experi-entally by Viswanathan [7]. An annular two-phase flow modelas also developed for the accurate prediction of the pressurerop. This model used a film-flow correlation to predict the liq-id film thickness.
It was emphasized in Boll’s study [1] that both the spatialistribution of droplets and the drop size have great effect onhe collection efficiency. Spacial distribution of droplets startedo be studied to improve the prediction model for collectionfficiency. Taheri and Sheih [8] predicted the collection effi-iency by solving the diffusion equations for both droplets andarticles. The effect of the liquid distribution was also stud-ed on collection efficiency but Boll [9] pointed out that their
odel did not consider the effects of initial transverse liquidomentum. Ananthanarayanan and Viswanathan [10] devel-
ped a two-dimensional model to predict the spatial distributionf droplets and the collection efficiency, where an experimen-al correlation was used to calculate penetration length of thenjected liquid. Goncalves et al. [11] studied the atomization ofhe liquid jets injected transversally to a gas stream in a Ven-uri scrubber. A mathematical model was developed to predicthe trajectory, breakup and penetration of the liquid jets. Withhis model for liquid jet dynamics, Goncalves et al. [12] calcu-ated the spatial distribution of droplets for the case where liquidas injected through a single orifice in a rectangular Venturi
crubber.
. Eulerian–Lagrangian approach
Gas containing dust particles enters the Venturi scrubber fromhe inlet, and the liquid jets are atomized into small droplets after
τ
Tt
nturi scrubber.
eing injected through the throat orifices. As the dust particlesnd the droplets move separately as a lot of discrete entities, theotion of these particles (dust and droplet) is analyzed using
he Lagrangian approach in which each individual particle isracked. The gas flow, meanwhile, is solved with the Eulerianethod where gas acts as continuum.
.1. Eulerian approach for gas flow
The gas flow is solved using the Eulerian approach by usingeynolds averaged Navier-Stokes (RANS) equations and stan-ard k − ε turbulence equations. The governing equations for aas are driven by several assumptions: (1) gas is a viscous New-onian fluid; (2) the loading ratio of dust is very low and so thenteraction between dust and gas is negligible; (3) as gas andiquid (or droplets) have the same temperature, mass exchangend heat exchange between the two phases is not considered; (4)as turbulence is isotropic.
The governing equations are written in the following simpleensor form. Details can be found elsewhere [13].
∂
∂t(ρφ) + ∂
∂xj(ρujφ) = ∂
∂xj
(Γφ∂φ
∂xj
)+ Sφ + Sφ,p (1)
nder the above assumptions, the source terms, due to interac-ion with droplets, are added as Sφ,p in the above momentum and− ε turbulence equations, but the ones due to dust particles arexcluded. The terms are expressed respectively as follows [13].
ui,p = − 1
dV
∑p∈ (i,j,k)
mpNp
(Ui + u′
i − vi
τ
)(2)
k,p = − 1
dV
∑p∈ (i,j,k)
mpNpu′i
(u′i − v′iτ
)(3)
ε,p = 1.5ε
kSk,p (4)
here the particle relaxation time τ is
ρ d3
= π
3p p
ρApCD|Ui + u′i − vi| (5)
he summation is over all particles located in a compu-ational cell (i, j, k). The source terms are calculated by
zardous Materials B138 (2006) 560–573 563
t[
3p
uocdaiputedtavad
m
Ti
3
bacac
td
W
Tcetdtdn
u
S
C
Hd
R
TTdbdn
teac
Wu
A
Ufp
S.I. Pak, K.S. Chang / Journal of Ha
he particle-source-in-cell method proposed by Crowe et al.14].
.2. Lagrangian approach for liquid droplets and dustarticles
The motions of both liquid droplets and dust particles are sim-lated in the Lagrangian approach which requires the trackingf a sufficiently large number of computational particles. Eachomputational particle represents a number of liquid droplets orust particles having equal locations, velocity, size, and temper-ture. This computational particle is called a ‘parcel’. As it ismpossible to track every individual particle because of the com-uter memory needed and the computation time, the parcels aresually used in the numerical simulation. The motion of the par-icles is described by the Basset–Boussinesq–Oseen (B–B–O)quation and their properties are obtained statistically. As theensity of these particles is much higher than the gas density,he effect of the static pressure gradient, the virtual mass termnd the Basset force can be neglected. The gravity force is alsoery small as compared with the aerodynamic drag force. Thepproximate form of the B–B–O equation for liquid droplets andust particles is then
pdvidt
= 1
2CDρAp(ui − vi)|ui − vi| (6)
he particle position can be obtained by integrating the follow-ng equation.
dxidt
= vi (7)
.3. Drag coefficient and droplet deformation
There are two different kinds of particles in the Venturi scrub-er flow: dust particles and liquid droplets. The dust particlesre usually solid and their shape can be assumed to be spheri-al. The liquid droplets, however, can be deformed due to theerodynamic force. In this numerical model, the change of dragoefficient induced by droplet deformation is taken into account.
Hsiang and Faeth [15] showed from their experiment thathe drop deformation and breakup can be classified by the twoimensionless numbers of Weber and Ohnesorge.
e = ρV 2reldd
σd, Oh = μd√
ρdddσd(8)
he Ohnesorge number is less than 0.1 for the normal operationondition in Venturi scrubber; thus, it can be observed from thexperimental regime map for droplet deformation and breakuphat the regime can be divided only by the Weber number. Theroplet is initially spherical and starts to deform at We = 1 dueo the aerodynamic force. As the Weber number increases, the
roplet shape changes from a sphere to a disk. At higher Weberumbers than 12, the droplet breaks up.The drag coefficient of the deformable droplet is obtainedsing the experimental correlation which was suggested by
C
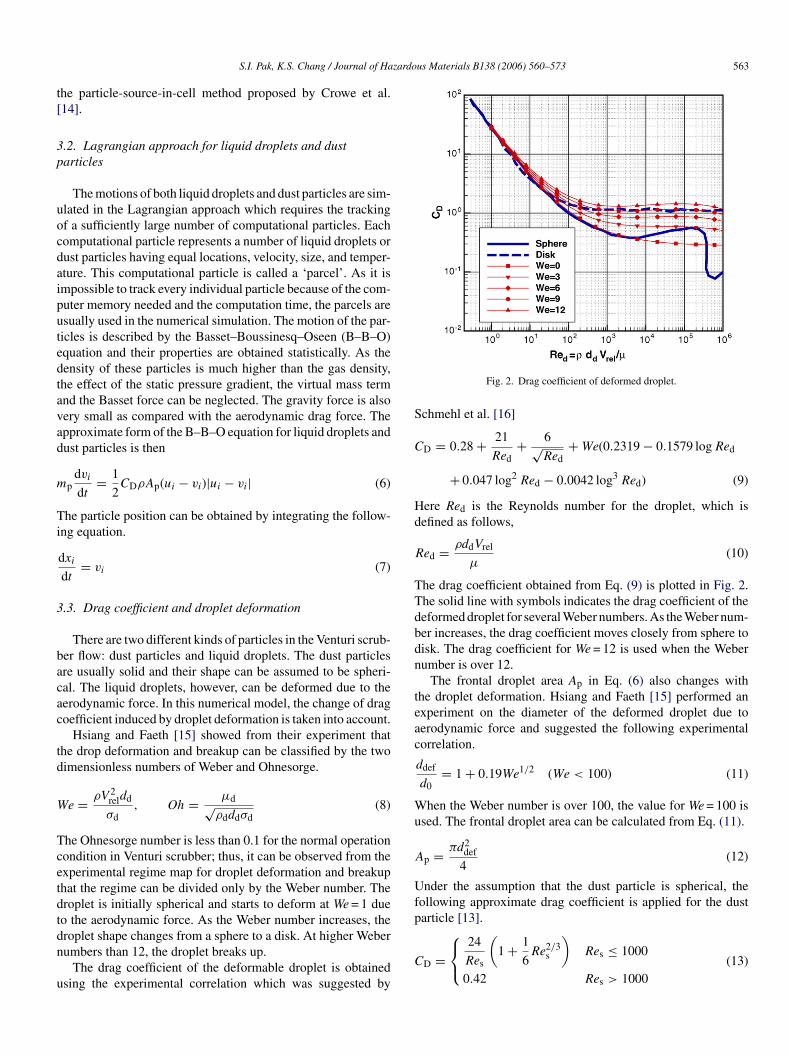
Fig. 2. Drag coefficient of deformed droplet.
chmehl et al. [16]
D = 0.28 + 21
Red+ 6√
Red+We(0.2319 − 0.1579 logRed
+ 0.047 log2 Red − 0.0042 log3 Red) (9)
ere Red is the Reynolds number for the droplet, which isefined as follows,
ed = ρddVrel
μ(10)
he drag coefficient obtained from Eq. (9) is plotted in Fig. 2.he solid line with symbols indicates the drag coefficient of theeformed droplet for several Weber numbers. As the Weber num-er increases, the drag coefficient moves closely from sphere toisk. The drag coefficient for We = 12 is used when the Weberumber is over 12.
The frontal droplet area Ap in Eq. (6) also changes withhe droplet deformation. Hsiang and Faeth [15] performed anxperiment on the diameter of the deformed droplet due toerodynamic force and suggested the following experimentalorrelation.
ddef
d0= 1 + 0.19We1/2 (We < 100) (11)
hen the Weber number is over 100, the value for We = 100 issed. The frontal droplet area can be calculated from Eq. (11).
p = πd2def
4(12)
nder the assumption that the dust particle is spherical, theollowing approximate drag coefficient is applied for the dustarticle [13].
D =⎧⎨⎩
24
Res
(1 + 1
6Re2/3
s
)Res ≤ 1000
0.42 Res > 1000(13)
5 zardous Materials B138 (2006) 560–573
T
R
4
jstab
Lp
ettrceTe
t
Btmiop
dpicTna
5
boadBbi
ed
te
η
H
ψ
Mrvcb
η
w
r
CIosianc
64 S.I. Pak, K.S. Chang / Journal of Ha
he Reynolds number for the dust particle is defined by
es = ρds|ui − vsi |
μ(14)
. Modelling for atomization of liquid jet
After liquid is injected through the throat orifice, the liquidet forms a column. Droplets are stripped from the column byurface breakup. The liquid column then undergoes column frac-ure and disintegrates into large ligaments and droplets, whichre divided into smaller droplets due to secondary breakup ofag, multimode and shear breakup [17].
The atomization of a liquid jet is modelled using theagrangian approach. The liquid jet can be divided into twoarts: the liquid column and the droplets.
The liquid column is simulated using droplets with a diameterqual to the orifice. The column fracture is assumed to occur inhe specified column fracture time after the jet is injected throughhe orifice, and the column is divided into five droplets with aoot-normal size distribution [18]. This number of droplets washosen to keep the computational cost to a manageable levelven though more droplets could give slightly better resolution.he column fracture time is determined from Wu et al.’s [17]xperiment and is defined by
cb = 3.44d0
Ug
√ρd
ρ(15)
esides the column fracture, the droplets are also created fromhe jet by the shear action of aerodynamic force. This breakup
echanism is named the surface breakup of the liquid column. Its modelled using the Reitz’s wave instability model [19]. Bothf the explained breakups, for the liquid column, are called therimary breakup.
Secondly, there is a breakup model for droplets that are pro-uced due to the primary breakup. The droplets generated by therimary breakup undergo a secondary breakup in the character-stic breakup time later [20]. If the Weber number exceeds theritical point, each droplet is separated into five smaller droplets.he size of the produced droplets is assumed to follow the root-ormal size distribution [15]. Details for this atomization modelre explained elsewhere [21].
. Modelling for capture of dust particle by droplet
Dust particles are absorbed into droplets through collisionetween two phases in the Venturi scrubber. The collisionccurs by three mechanisms: inertial impaction, interception,nd Brownian diffusion. The size of the dust particles that theevice can treat is approximately between 0.5 and 10 �m. Asrownian diffusion is dominant below 0.1 �m, the collisionetween dust particles and droplets takes place mainly through
nertial impaction.In this paper the target efficiency, which means the collectionfficiency of a single droplet, is used to model the capture of aust particle by a droplet. Walton and Woolcock [5] carried out
o
N
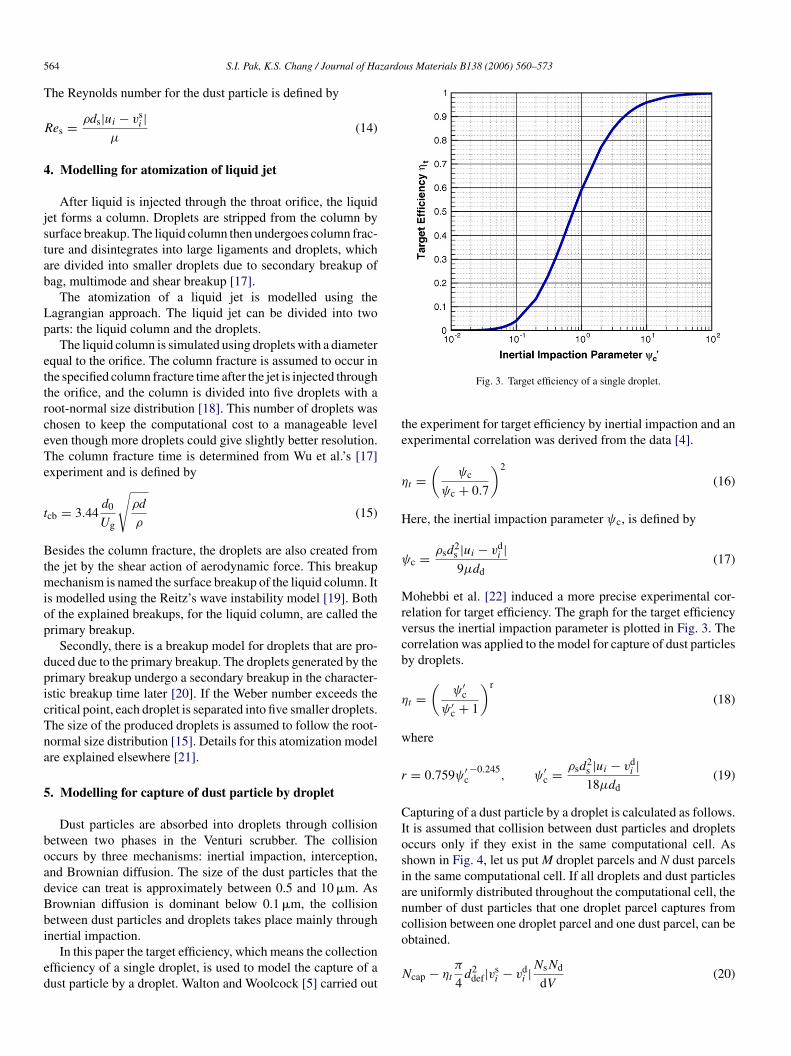
Fig. 3. Target efficiency of a single droplet.
he experiment for target efficiency by inertial impaction and anxperimental correlation was derived from the data [4].
t =(
ψc
ψc + 0.7
)2
(16)
ere, the inertial impaction parameter ψc, is defined by
c = ρsd2s |ui − vd
i |9μdd
(17)
ohebbi et al. [22] induced a more precise experimental cor-elation for target efficiency. The graph for the target efficiencyersus the inertial impaction parameter is plotted in Fig. 3. Theorrelation was applied to the model for capture of dust particlesy droplets.
t =(
ψ′c
ψ′c + 1
)r
(18)
here
= 0.759ψ′c−0.245
, ψ′c = ρsd
2s |ui − vd
i |18μdd
(19)
apturing of a dust particle by a droplet is calculated as follows.t is assumed that collision between dust particles and dropletsccurs only if they exist in the same computational cell. Ashown in Fig. 4, let us put M droplet parcels and N dust parcelsn the same computational cell. If all droplets and dust particlesre uniformly distributed throughout the computational cell, theumber of dust particles that one droplet parcel captures fromollision between one droplet parcel and one dust parcel, can be
btained.cap − ηtπ
4d2
def|vsi − vd
i |NsNd
dV(20)
S.I. Pak, K.S. Chang / Journal of Hazardo
F
Ti
N
6
fsoTtdflai
tcpwliccloah
twTbtbtipec
a
ig. 4. Collision between droplets and dust particles in a computational cell.
he total number of dust particles that all the droplets can absorbn a computational cell is determined as below.
cell =M∑m=1
N∑n=1
Ncap (21)
. Numerical simulation
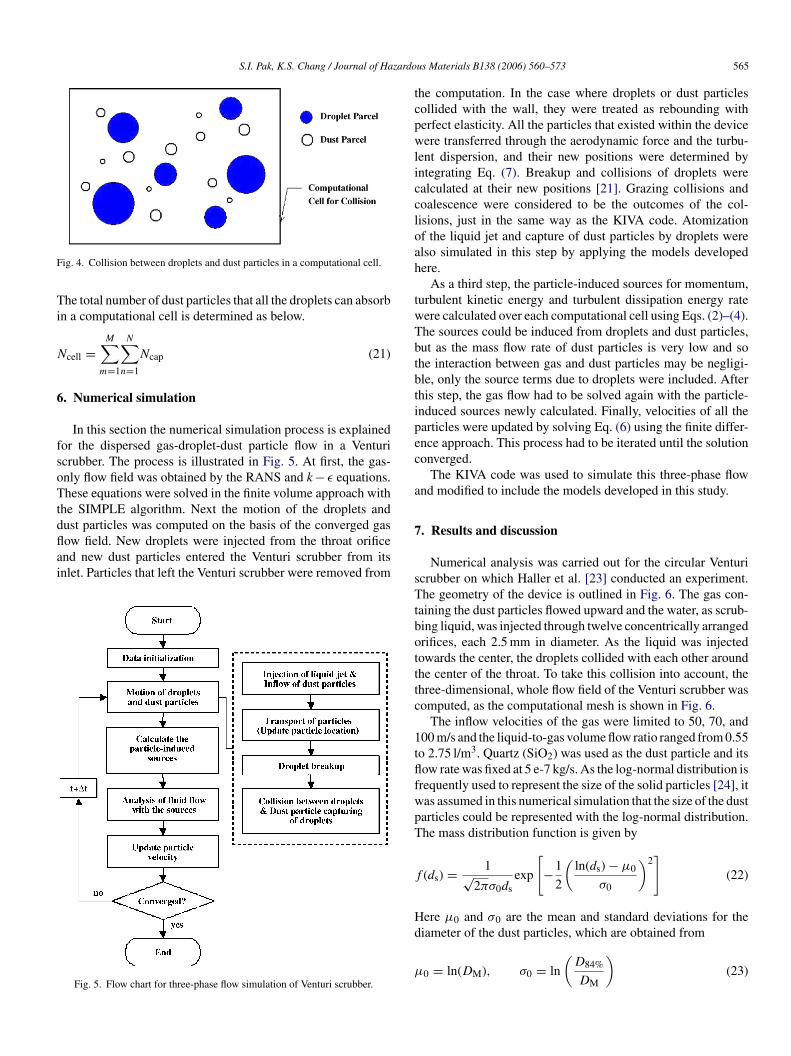
In this section the numerical simulation process is explainedor the dispersed gas-droplet-dust particle flow in a Venturicrubber. The process is illustrated in Fig. 5. At first, the gas-nly flow field was obtained by the RANS and k − ε equations.hese equations were solved in the finite volume approach with
he SIMPLE algorithm. Next the motion of the droplets and
ust particles was computed on the basis of the converged gasow field. New droplets were injected from the throat orificend new dust particles entered the Venturi scrubber from itsnlet. Particles that left the Venturi scrubber were removed fromFig. 5. Flow chart for three-phase flow simulation of Venturi scrubber.
7
sTtbotttc
1tflfwpT
f
Hd
μ
us Materials B138 (2006) 560–573 565
he computation. In the case where droplets or dust particlesollided with the wall, they were treated as rebounding witherfect elasticity. All the particles that existed within the deviceere transferred through the aerodynamic force and the turbu-
ent dispersion, and their new positions were determined byntegrating Eq. (7). Breakup and collisions of droplets werealculated at their new positions [21]. Grazing collisions andoalescence were considered to be the outcomes of the col-isions, just in the same way as the KIVA code. Atomizationf the liquid jet and capture of dust particles by droplets werelso simulated in this step by applying the models developedere.
As a third step, the particle-induced sources for momentum,urbulent kinetic energy and turbulent dissipation energy rateere calculated over each computational cell using Eqs. (2)–(4).he sources could be induced from droplets and dust particles,ut as the mass flow rate of dust particles is very low and sohe interaction between gas and dust particles may be negligi-le, only the source terms due to droplets were included. Afterhis step, the gas flow had to be solved again with the particle-nduced sources newly calculated. Finally, velocities of all thearticles were updated by solving Eq. (6) using the finite differ-nce approach. This process had to be iterated until the solutiononverged.
The KIVA code was used to simulate this three-phase flownd modified to include the models developed in this study.
. Results and discussion
Numerical analysis was carried out for the circular Venturicrubber on which Haller et al. [23] conducted an experiment.he geometry of the device is outlined in Fig. 6. The gas con-
aining the dust particles flowed upward and the water, as scrub-ing liquid, was injected through twelve concentrically arrangedrifices, each 2.5 mm in diameter. As the liquid was injectedowards the center, the droplets collided with each other aroundhe center of the throat. To take this collision into account, thehree-dimensional, whole flow field of the Venturi scrubber wasomputed, as the computational mesh is shown in Fig. 6.
The inflow velocities of the gas were limited to 50, 70, and00 m/s and the liquid-to-gas volume flow ratio ranged from 0.55o 2.75 l/m3. Quartz (SiO2) was used as the dust particle and itsow rate was fixed at 5 e-7 kg/s. As the log-normal distribution isrequently used to represent the size of the solid particles [24], itas assumed in this numerical simulation that the size of the dustarticles could be represented with the log-normal distribution.he mass distribution function is given by
(ds) = 1√2πσ0ds
exp
[−1
2
(ln(ds) − μ0
σ0
)2]
(22)
ere μ0 and σ0 are the mean and standard deviations for the
iameter of the dust particles, which are obtained from0 = ln(DM), σ0 = ln
(D84%
DM
)(23)

566 S.I. Pak, K.S. Chang / Journal of Hazardous Materials B138 (2006) 560–573
F(
wedTtp
n
sldaat
ig. 6. Geometry and computational mesh of circular Venturi scrubberUNIT:m).
here the median diameter DM is defined as the particle diam-ter for which the cumulative distribution is 0.5 and D84% is theiameter corresponding to the 84th percentile on the function.he values of DM and D84% are 1.0e−6 and 1.75e−6m, respec-
ively. This lognormal size distribution for the dust particles islotted in Fig. 7.
The dispersed gas–liquid–dust particle flow was simulatedumerically for the circular Venturi scrubber and the result is
(tmt
Fig. 8. Numerical simulation for circular Venturi scrubber when V
Fig. 7. Log-normal size distribution function for dust particles.
hown in Fig. 8. The throat velocity of the gas was 70 m/s and theiquid-to-gas volume ratio (or loading ratio) was 1.1 l/m3. Theust particles entered the device with uniform spatial distributionnd the liquid was injected from 12 orifices. The liquid wastomized after injection and captured the dust particles throughhe inertial impaction mechanism.
The contour of the gas velocity is displayed in Fig. 8(b) andc) are for the three-phase flow and the gas-only flow respec-
ively. In the Venturi throat, the gas velocity was reduced in theiddle region between the wall and the axis as compared withhe gas-only flow. This is clearly shown in Fig. 9. Most of the
g,th = 70 m/s and l/g = 1.1 U/m3 (Scaled by X to Z ratio = 3).
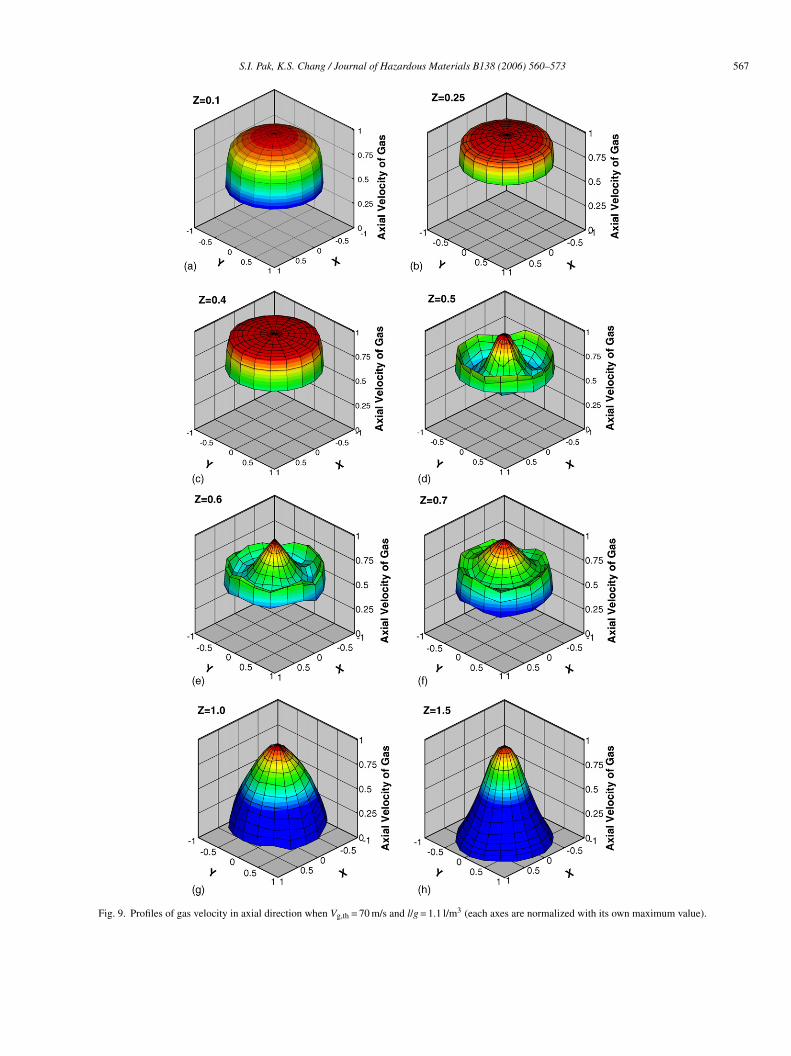
S.I. Pak, K.S. Chang / Journal of Hazardous Materials B138 (2006) 560–573 567
Fig. 9. Profiles of gas velocity in axial direction when Vg,th = 70 m/s and l/g = 1.1 l/m3 (each axes are normalized with its own maximum value).
568 S.I. Pak, K.S. Chang / Journal of Hazardous Materials B138 (2006) 560–573
and l
dwaiaTtp
is
7
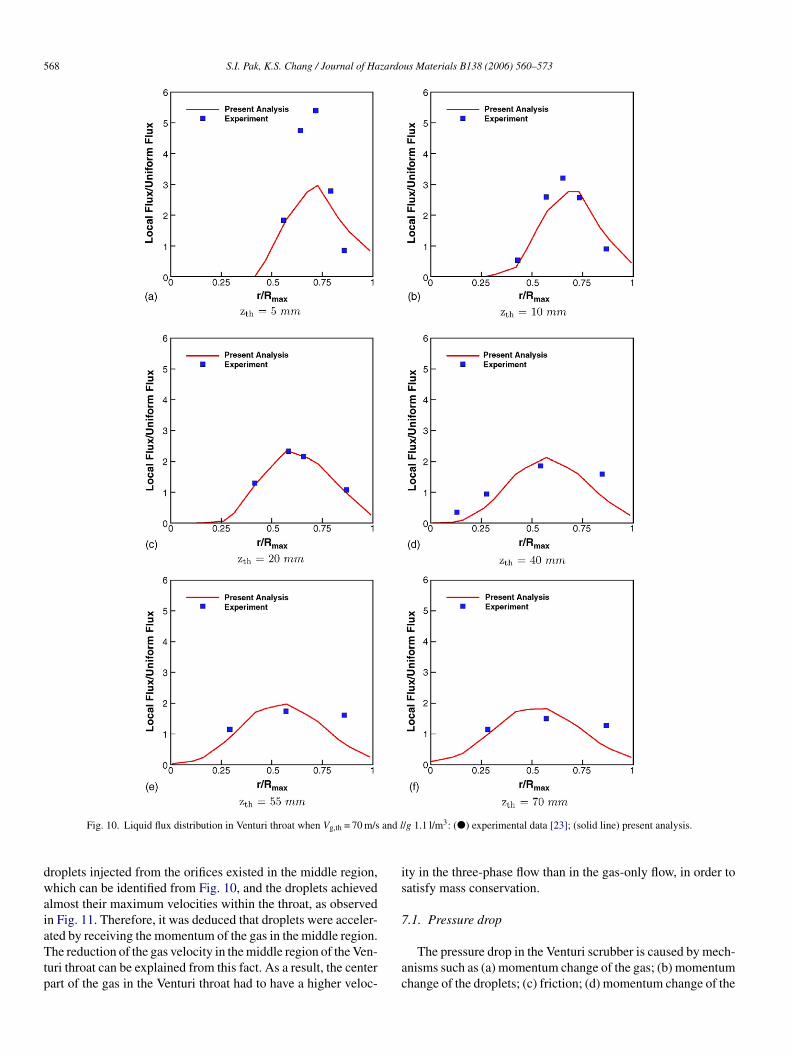
Fig. 10. Liquid flux distribution in Venturi throat when Vg,th = 70 m/s
roplets injected from the orifices existed in the middle region,hich can be identified from Fig. 10, and the droplets achieved
lmost their maximum velocities within the throat, as observedn Fig. 11. Therefore, it was deduced that droplets were acceler-
ted by receiving the momentum of the gas in the middle region.he reduction of the gas velocity in the middle region of the Ven-uri throat can be explained from this fact. As a result, the centerart of the gas in the Venturi throat had to have a higher veloc-
ac
/g 1.1 l/m3: (�) experimental data [23]; (solid line) present analysis.
ty in the three-phase flow than in the gas-only flow, in order toatisfy mass conservation.
.1. Pressure drop
The pressure drop in the Venturi scrubber is caused by mech-nisms such as (a) momentum change of the gas; (b) momentumhange of the droplets; (c) friction; (d) momentum change of the

S.I. Pak, K.S. Chang / Journal of Hazardo
F
ltddcss
dfist
wgwiFtaa
deSlB
ig. 11. Droplet velocity in axial direction when Vg,th = 70 m/s and l/g = 1.1 l/m3.
iquid film; and (e) gravity [3]. Azzopardi et al. [6] examinedhe relative importance of the above five components of pressurerop. They concluded from their study that the acceleration and
eceleration of the gas and droplets were the most importantomponents, while film momentum and gravitation had onlymall effects on pressure drop. As implied in Viswanathan’study [7], liquid film needs to be taken into consideration to pre-D
Fig. 12. Pressure drop vs. axial distance when gas throat velocity = 7
us Materials B138 (2006) 560–573 569
ict pressure drop more accurately. However, the effect of liquidlm on pressure drop is small and it is too complex to model andimulate numerically in the three-dimensional way. Because ofhis reason, the liquid film was not considered in this paper.
The pressure drop calculated from this numerical analysisas compared with Haller et al.’s experimental data [23]. Theas velocity at the throat, Vg,th, was 70 m/s. The pressure dropas calculated from the static pressure difference between the
nlet and the outlet of the Venturi scrubber. It is shown fromig. 12 that the overall pressure drop was about 15% lower than
he experiment at the liquid-to-gas volume ratio l/g = 1.1, 1.65,nd 2.2 l/m3, but the overall numerical result gave comparablegreement with the experiment.
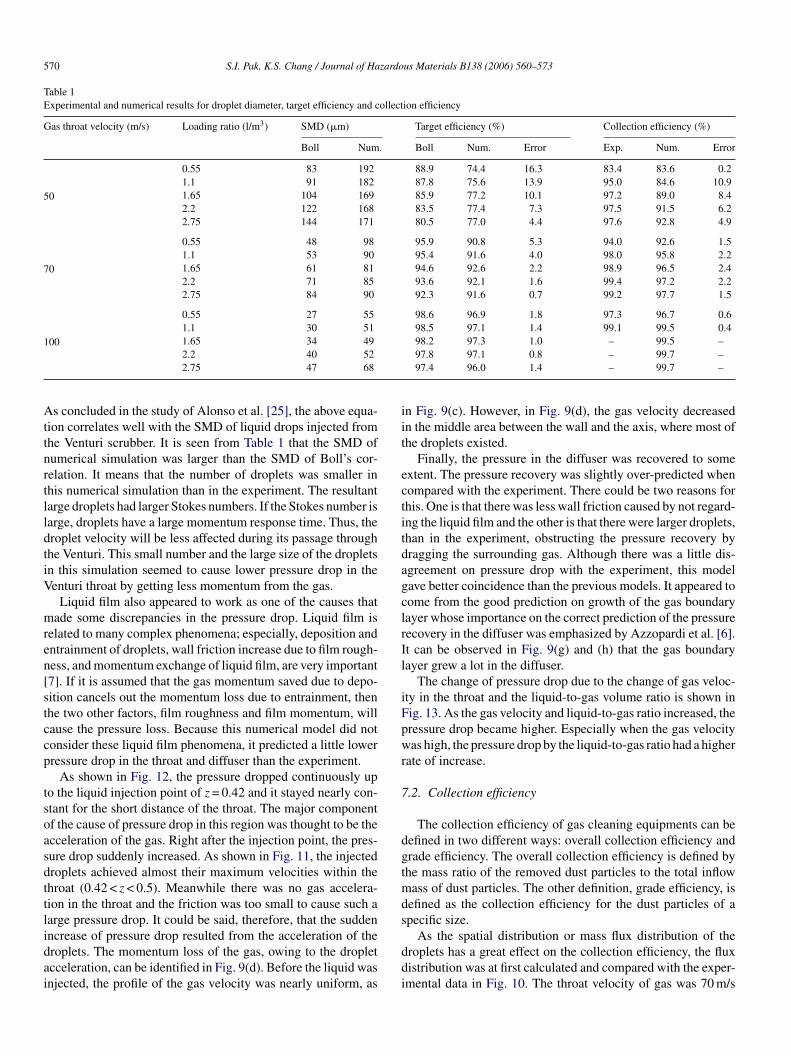
These discrepancies on pressure drop can be explained fromroplet size and liquid film. Table 1 shows the Sauter mean diam-ter (SMD) value for each operation condition. One column ofMD values (Num.) was computed from this numerical simu-
ation and the other (Boll) was calculated from the followingoll’s correlation [1].
32 = 4.2 × 10⁻² + 5.65 × 10⁻³(l/g)1.922
V 1.602rel
(24)
0 m/s: (�) experimental data [23]; (solid line) present analysis.
570 S.I. Pak, K.S. Chang / Journal of Hazardous Materials B138 (2006) 560–573
Table 1Experimental and numerical results for droplet diameter, target efficiency and collection efficiency
Gas throat velocity (m/s) Loading ratio (l/m3) SMD (�m) Target efficiency (%) Collection efficiency (%)
Boll Num. Boll Num. Error Exp. Num. Error
50
0.55 83 192 88.9 74.4 16.3 83.4 83.6 0.21.1 91 182 87.8 75.6 13.9 95.0 84.6 10.91.65 104 169 85.9 77.2 10.1 97.2 89.0 8.42.2 122 168 83.5 77.4 7.3 97.5 91.5 6.22.75 144 171 80.5 77.0 4.4 97.6 92.8 4.9
70
0.55 48 98 95.9 90.8 5.3 94.0 92.6 1.51.1 53 90 95.4 91.6 4.0 98.0 95.8 2.21.65 61 81 94.6 92.6 2.2 98.9 96.5 2.42.2 71 85 93.6 92.1 1.6 99.4 97.2 2.22.75 84 90 92.3 91.6 0.7 99.2 97.7 1.5
100
0.55 27 55 98.6 96.9 1.8 97.3 96.7 0.61.1 30 51 98.5 97.1 1.4 99.1 99.5 0.41.65 34 49 98.2 97.3 1.0 – 99.5 –
AttnrtlldtiV
mren[stccp
tsoasdttlidai
iit
ectitdagclrIl
iFpwr
7
dgtmds
2.2 40 522.75 47 68
s concluded in the study of Alonso et al. [25], the above equa-ion correlates well with the SMD of liquid drops injected fromhe Venturi scrubber. It is seen from Table 1 that the SMD ofumerical simulation was larger than the SMD of Boll’s cor-elation. It means that the number of droplets was smaller inhis numerical simulation than in the experiment. The resultantarge droplets had larger Stokes numbers. If the Stokes number isarge, droplets have a large momentum response time. Thus, theroplet velocity will be less affected during its passage throughhe Venturi. This small number and the large size of the dropletsn this simulation seemed to cause lower pressure drop in theenturi throat by getting less momentum from the gas.
Liquid film also appeared to work as one of the causes thatade some discrepancies in the pressure drop. Liquid film is
elated to many complex phenomena; especially, deposition andntrainment of droplets, wall friction increase due to film rough-ess, and momentum exchange of liquid film, are very important7]. If it is assumed that the gas momentum saved due to depo-ition cancels out the momentum loss due to entrainment, thenhe two other factors, film roughness and film momentum, willause the pressure loss. Because this numerical model did notonsider these liquid film phenomena, it predicted a little lowerressure drop in the throat and diffuser than the experiment.
As shown in Fig. 12, the pressure dropped continuously upo the liquid injection point of z = 0.42 and it stayed nearly con-tant for the short distance of the throat. The major componentf the cause of pressure drop in this region was thought to be thecceleration of the gas. Right after the injection point, the pres-ure drop suddenly increased. As shown in Fig. 11, the injectedroplets achieved almost their maximum velocities within thehroat (0.42 < z < 0.5). Meanwhile there was no gas accelera-ion in the throat and the friction was too small to cause such aarge pressure drop. It could be said, therefore, that the sudden
ncrease of pressure drop resulted from the acceleration of theroplets. The momentum loss of the gas, owing to the dropletcceleration, can be identified in Fig. 9(d). Before the liquid wasnjected, the profile of the gas velocity was nearly uniform, asddi
97.8 97.1 0.8 – 99.7 –97.4 96.0 1.4 – 99.7 –
n Fig. 9(c). However, in Fig. 9(d), the gas velocity decreasedn the middle area between the wall and the axis, where most ofhe droplets existed.
Finally, the pressure in the diffuser was recovered to somextent. The pressure recovery was slightly over-predicted whenompared with the experiment. There could be two reasons forhis. One is that there was less wall friction caused by not regard-ng the liquid film and the other is that there were larger droplets,han in the experiment, obstructing the pressure recovery byragging the surrounding gas. Although there was a little dis-greement on pressure drop with the experiment, this modelave better coincidence than the previous models. It appeared toome from the good prediction on growth of the gas boundaryayer whose importance on the correct prediction of the pressureecovery in the diffuser was emphasized by Azzopardi et al. [6].t can be observed in Fig. 9(g) and (h) that the gas boundaryayer grew a lot in the diffuser.
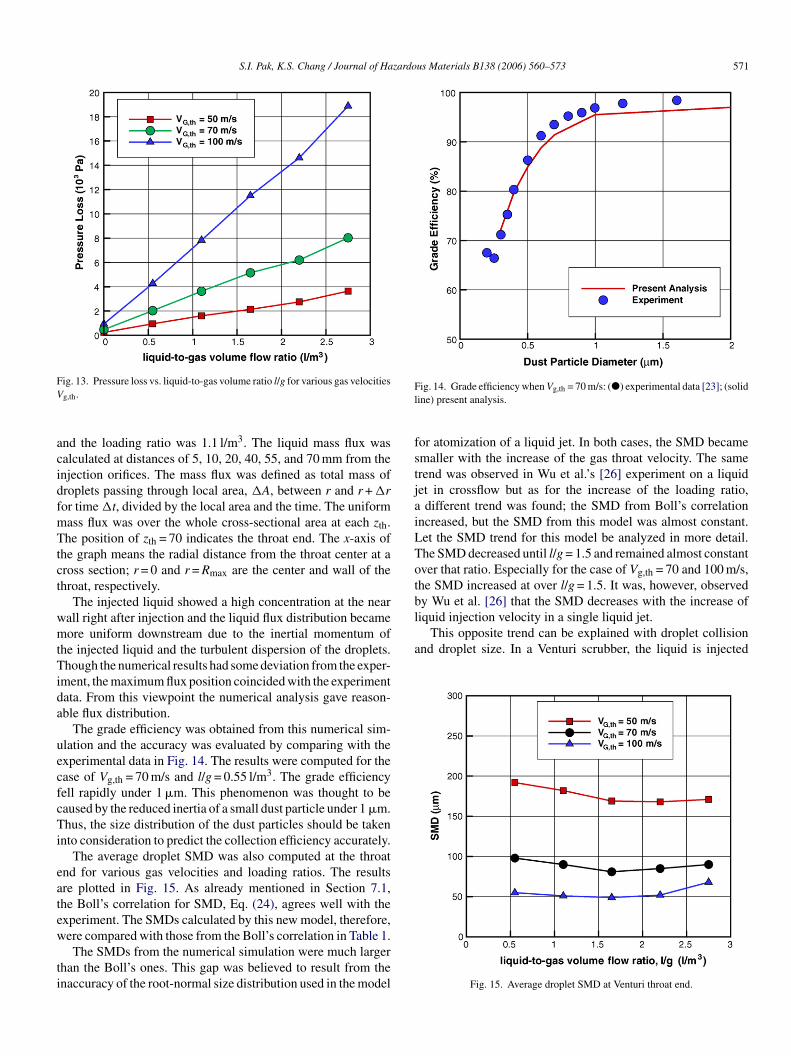
The change of pressure drop due to the change of gas veloc-ty in the throat and the liquid-to-gas volume ratio is shown inig. 13. As the gas velocity and liquid-to-gas ratio increased, theressure drop became higher. Especially when the gas velocityas high, the pressure drop by the liquid-to-gas ratio had a higher
ate of increase.
.2. Collection efficiency
The collection efficiency of gas cleaning equipments can beefined in two different ways: overall collection efficiency andrade efficiency. The overall collection efficiency is defined byhe mass ratio of the removed dust particles to the total inflow
ass of dust particles. The other definition, grade efficiency, isefined as the collection efficiency for the dust particles of apecific size.
As the spatial distribution or mass flux distribution of theroplets has a great effect on the collection efficiency, the fluxistribution was at first calculated and compared with the exper-mental data in Fig. 10. The throat velocity of gas was 70 m/s
S.I. Pak, K.S. Chang / Journal of Hazardous Materials B138 (2006) 560–573 571
FV
acidfmTtct
wmtTida
uecfcTi
eatew
ti
Fl
fstjaiLTotbliquid injection velocity in a single liquid jet.
This opposite trend can be explained with droplet collisionand droplet size. In a Venturi scrubber, the liquid is injected
ig. 13. Pressure loss vs. liquid-to-gas volume ratio l/g for various gas velocities
g,th.
nd the loading ratio was 1.1 l/m3. The liquid mass flux wasalculated at distances of 5, 10, 20, 40, 55, and 70 mm from thenjection orifices. The mass flux was defined as total mass ofroplets passing through local area, A, between r and r + ror time t, divided by the local area and the time. The uniformass flux was over the whole cross-sectional area at each zth.he position of zth = 70 indicates the throat end. The x-axis of
he graph means the radial distance from the throat center at aross section; r = 0 and r = Rmax are the center and wall of thehroat, respectively.
The injected liquid showed a high concentration at the nearall right after injection and the liquid flux distribution becameore uniform downstream due to the inertial momentum of
he injected liquid and the turbulent dispersion of the droplets.hough the numerical results had some deviation from the exper-
ment, the maximum flux position coincided with the experimentata. From this viewpoint the numerical analysis gave reason-ble flux distribution.
The grade efficiency was obtained from this numerical sim-lation and the accuracy was evaluated by comparing with thexperimental data in Fig. 14. The results were computed for thease of Vg,th = 70 m/s and l/g = 0.55 l/m3. The grade efficiencyell rapidly under 1 �m. This phenomenon was thought to beaused by the reduced inertia of a small dust particle under 1 �m.hus, the size distribution of the dust particles should be taken
nto consideration to predict the collection efficiency accurately.The average droplet SMD was also computed at the throat
nd for various gas velocities and loading ratios. The resultsre plotted in Fig. 15. As already mentioned in Section 7.1,he Boll’s correlation for SMD, Eq. (24), agrees well with thexperiment. The SMDs calculated by this new model, therefore,ere compared with those from the Boll’s correlation in Table 1.
The SMDs from the numerical simulation were much largerhan the Boll’s ones. This gap was believed to result from thenaccuracy of the root-normal size distribution used in the model
ig. 14. Grade efficiency when Vg,th = 70 m/s: (�) experimental data [23]; (solidine) present analysis.
or atomization of a liquid jet. In both cases, the SMD becamemaller with the increase of the gas throat velocity. The samerend was observed in Wu et al.’s [26] experiment on a liquidet in crossflow but as for the increase of the loading ratio,
different trend was found; the SMD from Boll’s correlationncreased, but the SMD from this model was almost constant.et the SMD trend for this model be analyzed in more detail.he SMD decreased until l/g = 1.5 and remained almost constantver that ratio. Especially for the case of Vg,th = 70 and 100 m/s,he SMD increased at over l/g = 1.5. It was, however, observedy Wu et al. [26] that the SMD decreases with the increase of
Fig. 15. Average droplet SMD at Venturi throat end.
572 S.I. Pak, K.S. Chang / Journal of Hazardo
Fp
tweSlsdlttpd
inwttr
woSicuw
ctbewat
t9matc
8
oogamlpaed
tdfwiwttpiTtwe
Vnss
R
model for pressure drop in Venturi scrubbers, Trans. IChemE 69 (1991)
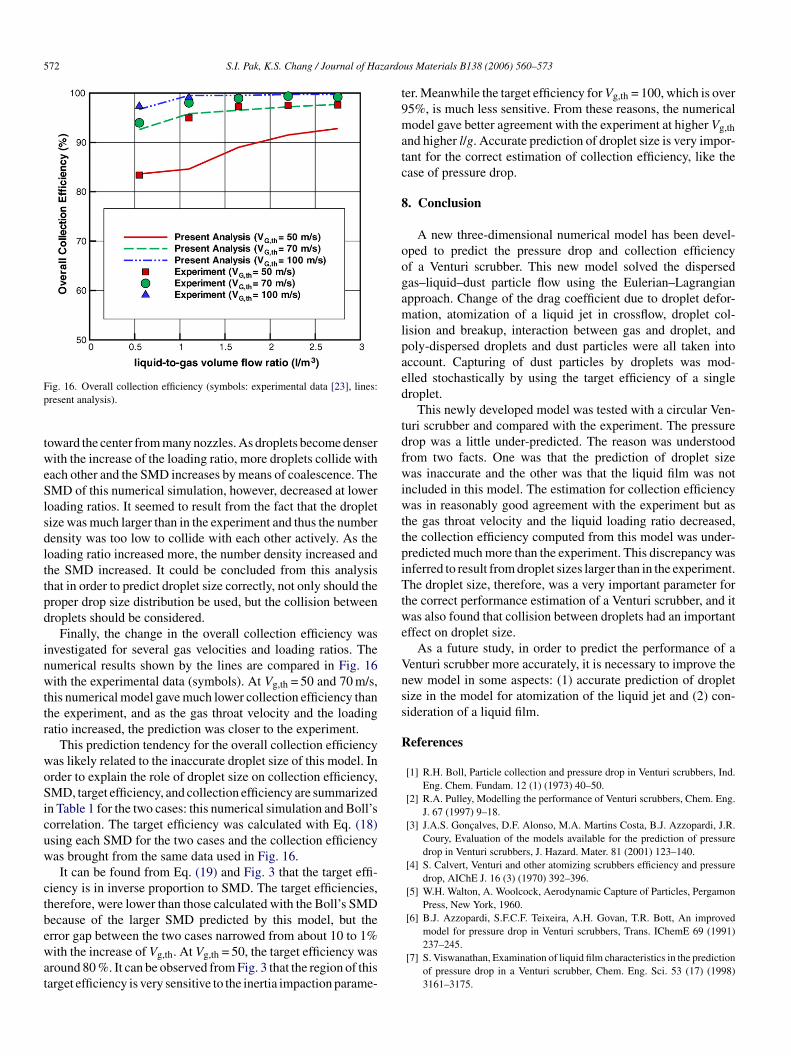
ig. 16. Overall collection efficiency (symbols: experimental data [23], lines:resent analysis).
oward the center from many nozzles. As droplets become denserith the increase of the loading ratio, more droplets collide with
ach other and the SMD increases by means of coalescence. TheMD of this numerical simulation, however, decreased at lower
oading ratios. It seemed to result from the fact that the dropletize was much larger than in the experiment and thus the numberensity was too low to collide with each other actively. As theoading ratio increased more, the number density increased andhe SMD increased. It could be concluded from this analysishat in order to predict droplet size correctly, not only should theroper drop size distribution be used, but the collision betweenroplets should be considered.
Finally, the change in the overall collection efficiency wasnvestigated for several gas velocities and loading ratios. Theumerical results shown by the lines are compared in Fig. 16ith the experimental data (symbols). At Vg,th = 50 and 70 m/s,
his numerical model gave much lower collection efficiency thanhe experiment, and as the gas throat velocity and the loadingatio increased, the prediction was closer to the experiment.
This prediction tendency for the overall collection efficiencyas likely related to the inaccurate droplet size of this model. Inrder to explain the role of droplet size on collection efficiency,MD, target efficiency, and collection efficiency are summarized
n Table 1 for the two cases: this numerical simulation and Boll’sorrelation. The target efficiency was calculated with Eq. (18)sing each SMD for the two cases and the collection efficiencyas brought from the same data used in Fig. 16.It can be found from Eq. (19) and Fig. 3 that the target effi-
iency is in inverse proportion to SMD. The target efficiencies,herefore, were lower than those calculated with the Boll’s SMDecause of the larger SMD predicted by this model, but therror gap between the two cases narrowed from about 10 to 1%
ith the increase of Vg,th. At Vg,th = 50, the target efficiency wasround 80 %. It can be observed from Fig. 3 that the region of thisarget efficiency is very sensitive to the inertia impaction parame-
us Materials B138 (2006) 560–573
er. Meanwhile the target efficiency for Vg,th = 100, which is over5%, is much less sensitive. From these reasons, the numericalodel gave better agreement with the experiment at higher Vg,th
nd higher l/g. Accurate prediction of droplet size is very impor-ant for the correct estimation of collection efficiency, like thease of pressure drop.
. Conclusion
A new three-dimensional numerical model has been devel-ped to predict the pressure drop and collection efficiencyf a Venturi scrubber. This new model solved the dispersedas–liquid–dust particle flow using the Eulerian–Lagrangianpproach. Change of the drag coefficient due to droplet defor-ation, atomization of a liquid jet in crossflow, droplet col-
ision and breakup, interaction between gas and droplet, andoly-dispersed droplets and dust particles were all taken intoccount. Capturing of dust particles by droplets was mod-lled stochastically by using the target efficiency of a singleroplet.
This newly developed model was tested with a circular Ven-uri scrubber and compared with the experiment. The pressurerop was a little under-predicted. The reason was understoodrom two facts. One was that the prediction of droplet sizeas inaccurate and the other was that the liquid film was not
ncluded in this model. The estimation for collection efficiencyas in reasonably good agreement with the experiment but as
he gas throat velocity and the liquid loading ratio decreased,he collection efficiency computed from this model was under-redicted much more than the experiment. This discrepancy wasnferred to result from droplet sizes larger than in the experiment.he droplet size, therefore, was a very important parameter for
he correct performance estimation of a Venturi scrubber, and itas also found that collision between droplets had an important
ffect on droplet size.As a future study, in order to predict the performance of a
enturi scrubber more accurately, it is necessary to improve theew model in some aspects: (1) accurate prediction of dropletize in the model for atomization of the liquid jet and (2) con-ideration of a liquid film.
eferences
[1] R.H. Boll, Particle collection and pressure drop in Venturi scrubbers, Ind.Eng. Chem. Fundam. 12 (1) (1973) 40–50.
[2] R.A. Pulley, Modelling the performance of Venturi scrubbers, Chem. Eng.J. 67 (1997) 9–18.
[3] J.A.S. Goncalves, D.F. Alonso, M.A. Martins Costa, B.J. Azzopardi, J.R.Coury, Evaluation of the models available for the prediction of pressuredrop in Venturi scrubbers, J. Hazard. Mater. 81 (2001) 123–140.
[4] S. Calvert, Venturi and other atomizing scrubbers efficiency and pressuredrop, AIChE J. 16 (3) (1970) 392–396.
[5] W.H. Walton, A. Woolcock, Aerodynamic Capture of Particles, PergamonPress, New York, 1960.
[6] B.J. Azzopardi, S.F.C.F. Teixeira, A.H. Govan, T.R. Bott, An improved
237–245.[7] S. Viswanathan, Examination of liquid film characteristics in the prediction
of pressure drop in a Venturi scrubber, Chem. Eng. Sci. 53 (17) (1998)3161–3175.
zardo
[
[
[
[
[
[
[
[
[
[
[
[
[
[
[
S.I. Pak, K.S. Chang / Journal of Ha
[8] M. Taheri, C. Sheih, Mathematical modeling of atomizing scrubbers,AIChE J. 21 (1) (1975) 153–157.
[9] Letters to the editor AIChE J. 21 (4) (1975) 831.10] N.V. Ananthanarayanan, S. Viswanathan, Predicting the liquid flux distri-
bution and collection efficiency in cylindrical Venturi scrubbers, Ind. Eng.Chem. Res. 38 (1999) 223–232.
11] J.A.S. Goncalves, M.A.M. Costa, P.R. Henrique, J.R. Coury, Atomizationof liquids in a Pease–Anthony Venturi scrubber Part I. Jet dynamics, J.Hazard. Mater. 97 (2003) 267–279.
12] J.A.S. Goncalves, M.A.M. Costa, M.L. Aguiar, J.R. Coury, Atomizatin ofliquids in a Pease–Anthony Venturi scrubber. Part II. Droplet dispersion, J.Hazard. Mater. 116 (2004) 147–157.
13] A.A. Amsden, P.J. O’Rourke, T.D. Butler, KIVA-II: a computer programfor chemically reactive flows with sprays, Los Alamos National LaboratoryReport, LA-11560-MS, 1985.
14] C.T. Crowe, M.P. Sharma, D.E. Stock, The particle-source-in cell (PSI-CELL) model for gas-droplet flows, J. Fluid. Eng., Trans. ASME 99 (1977)325–332.
15] L.P. Hsiang, G.M. Faeth, Near-limit drop deformation and secondary
breakup, Int. J. Multiphas. Flow 18 (5) (1992) 635–652.16] R. Schmehl, G. Maier, S. Wittig, CFD analysis of fuel atomization, sec-ondary droplet breakup and spray dispersion in the premix duct o f a LPPcombustor, in: Proceedings of the 8th International Conference on LiquidAtomization and Spray Systems, Pasadena, CA, USA, 2000.
[
[
us Materials B138 (2006) 560–573 573
17] P.K. Wu, K.A. Kirkendall, R.P. Fuller, A.S. Nejad, Breakup processes ofliquid jets in subsonic crossflows, J. Propul. Power 13 (1) (1997) 64–73.
18] R.K. Madabhushi, A model for numerical simulation of breakup of a liquidjet in crossflow, Atomization Spray 13 (2003) 413–424.
19] R.D. Reitz, Modeling atomization process in high-pressure vaporizingsprays, Atom. Spray Tech. 3 (1987) 309–337.
20] M. Pilch, C.A. Erdman, Use of breakup time data and velocity history datato predict the maximum size of stable fragments for acceleration-inducedbreakup of a liquid drop, Int. J. Multiphas. Flow 13 (6) (1987) 741–757.
21] S.I. Pak, Numerical modeling for performance analysis of three-phase flowin Venturi scrubber, Doctoral thesis, KAIST, Daejeon, South Korea, 2005.
22] A. Mohebbi, M. Taheri, J. Fathikaljahi, M.R. Talaie, Simulation of an orificescrubber performance based on Eulerian/Lagrangian method, J. Hazard.Mater. 100 (2003) 13–25.
23] H. Haller, E. Muschelknautz, T. Schultz, Venturi scrubber calculation andoptimization, Chem. Eng. Technol. 12 (1989) 188–195.
24] C. Crowe, M. Sommerfeld, Y. Tsuji, Multiphase Flows with Droplets andParticles, CRC Press LLC, 1998.
25] D.F. Alonso, J.A.S. Goncalves, B.J. Azzopardi, J.R. Coury, Drop size mea-surements in Venturi scrubbers, Chem. Eng. Sci. 56 (2001) 4901–4911.
26] P.K. Wu, K.A. Kirkendall, R.P. Fuller, A.S. Nejad, Spray structure of liq-uid jets atomized in subsonic crossflows, J. Propul. Power 14 (2) (1998)173–182.