Embed Size (px)
Citation preview

Performance Evaluation and Metrics
Prepared by: Jerry Gao
Date: 9/14/00
Copyright 2000 by Jerry Gao

Presentation Outline
• Introduction Performance Testing, Process, and Tools Performance Evaluation and Models Performance Evaluation and Metrics
• Performance Evaluation Models: Event-Based Function Scenario Model for System Performance Evaluation Event-Based Transition Model for System Performance Evaluation
• Performance Metrics• Performance, throughput, availability, reliability, scalability, and utilization
• Supporting Environment
Copyright by Jerry Gao

Performance Testing
Performance testing – refers to test activities on checking system performance
The major objectives of performance testing:
To confirm and validate the specified system performance requirements. To check the current product capacity to answer the questions from customers and marketing people. To identify performance issues and performance degradation in a given system
Copyright by Jerry Gao

Performance Testing - Focuses
System process speed (Max./Min./Average)o system processes, tasks, transactions, responses.o data retrieval, data loading
System throughput (Max./Min./Average)o loads, messages, tasks, processes
System latency (Max./Min./Average)o Message/event, task/process
System utilization (Max./Min./Average)o Network, server/client machines.
System availability (component-level/system-level)o component/system, services/functionso system network, computer hardware/software
Copyright by Jerry Gao

Performance Testing - Focuses
System reliability (component-level/system-level)o component/system, services/functionso system network, computer hardware/software
System scalability (component-level/system-level)o load/speed/throughput boundaryo improvements on process speed, throughput
System successes/failures rates foro communications, transactions, connectionso call processing, recovery, …
Domain-specific/application-specifico agent performanceo real-time report generation speedo workflow performance
Copyright by Jerry Gao

Performance Testing - Test Process
Understand system and identify performance requirements Identify performance test objectives and focuses Define performance test strategy:
o Define/select performance evaluation modelso Define/select performance test criteriao Define and identify performance test metrics.
Identify the needs of performance test tools and define performance test environment Write performance test plan Develop performance test tools and support environment Set up the target system and performance test beds Design performance test cases and test suite Performance test execution and data collection Performance analysis and reporting
Copyright by Jerry Gao

Performance Test - Tools
Performance test tools can be classified into: Simulators and data generators:
o Message-based or table-based simulatorso State-based simulatorso Model-based data generators, such as
o Pattern-based data generatorso Random data generators
Performance data collectors and tracking toolso Performance tracking tools
Performance evaluation and analysis toolo Performance metric computationo Model-based performance evaluation tool
Performance monitorso For example, sniffer, Microsoft performance monitoro External third-party tools
Performance report generatorsCopyright by Jerry Gao

Performance Evaluation
What is performance evaluation? Using a well-defined approach to study, analyze, and measure the performance of a given system.
The basic tasks and scope:
Collect system performance data Define system performance metrics Model system performance Measure, analyze, estimate system performance Present and report system performance
Copyright by Jerry Gao

Performance Evaluation – Objectives and Needs
The major objectives:
Understand product capacity Discover system performance issues Measure and evaluate system performance Estimate and predict system performance
The basic needs are: Well-defined performance metrics Well-defined performance evaluation models Performance evaluation tools and supporting environment
Copyright by Jerry Gao

Performance Evaluation - Approaches
Performance testing: (during production)o measure and analyze the system performance based on performance test data and results
Performance simulation: (pre-production)o study and estimate system performance using a simulation approach
Performance measurement at the customer site: (post-production)o measure and evaluation system performance during system operations
Copyright by Jerry Gao

Performance Evaluation - Models
What is a performance evaluation model?A well-defined formal model which depicts different prospects of system performance of a system.
Why do we need performance evaluation models?To present the system performance propertiesTo provide a guideline for engineers to find the strategy on performance evaluation.To set up a foundation to define performance metrics.To identify the needs of the target performance environment.
Copyright by Jerry Gao

Performance Evaluation - Models
Type of performance evaluation models:
Queuing model Scenario-based evaluation model Architecture-based evaluation model
o Component-based evaluation model Process-based evaluation model Transaction-based evaluation model Transition-based models
o State-based evaluation model Domain-oriented evaluation model
Copyright by Jerry Gao

Performance Evaluation - Models for Portal V5
Two performance evaluation models are defined:
Event-Based Function Scenario Model for System Performance EvaluationEvent-Based Transition Model for System Performance Evaluation
Portal V5 systems can be viewed as a component-based distributed system over the Internet. It accepts, processes,and supports the following types of event messages. System-caller interaction event messages System-agent interaction event messages Call-oriented event interactions between components
Copyright by Jerry Gao

Event-Based Function Scenario Model
Model definition: An event-based function scenario model is an event-based scenario diagram with tracked time stamps.
We use G(N, E, T, O) to represent a functional scenario diagram.• N is a set of component nodes. •E represents a set of direct links. Each link e is a direct edge (Cr, Cd), which
represents an event that is sent by component Cr and received by the component Cd.
•T is a set of tracked time stamps for links. Each link has a pair of time stamps (ti, to),
where ti indicates the incoming time stamp of event e in Cr, and where to indicates the
outgoing time stamp of event Ep in Cd.
•O is a set of pairs (Ep, order), each of them represents the order of for an event
occurred in the scenario.
An event-based functional scenario Sq is a sequence of interaction events between
components in a system. Sq can be represented as a path in a functional scenario
diagram. Thus, Sq can be denoted as Ei1, …., Eim, where Ei1 is the starting event of Sq,
and Eim is the ending event of Sq.
Copyright by Jerry Gao

Event-Based Function Scenario Model
Applications and benefits:
To provide a sound and theoretic foundation to help performance evaluation in the following aspects:
Assist and enforce performance test engineers to understand the functional scenarios, system structures and behaviors.
Provide a fundamental base to develop a systematic performance solution.
Provide a guideline to develop a performance test environment.
Model Limitation:
Each component receives and processes incoming/outgoing events in a sequential way although these events can be processed in a concurrent way inside the component.
The sequence of events in a functional scenario is fixed according to the system behaviors and implementations.
Each scenario has only one starting event and ending event.
Each outgoing event must depend on at least one incoming event.
Copyright by Jerry Gao

Event-Based Function Scenario Model: An Example
Caller Desktop
Desktop App Server
DMS
eFLow
1
2
ChatREQ (T1, T1’)
Return Addinfo (T10, T10’)10
Callinit ChatREQ (T2, T2’)
5Create Session (T6, T6’)
ContactControl Incom.Conn (T3, T3’)
3ContactControl Accept (T4, T4’)
Session Created (T5, T5’)6
Participant Add (T8, T8’)
Add Participant (T7, T7’)
7
8
Return Addinfo (T9, T9’)
9
Figure 2. An Event-Based Functional Scenario for TextChat Sequence #1
4
Incoming timestamp
Outgoing timestamp
Copyright by Jerry Gao

Event-Based Transition Model
Model definition: An event-based system evaluation model is an event-based transition diagram with a set of tracked time stamps.
We use D(S, L) to represent an event-based transition diagram,S is a set of event transition states. Each transition state node represents a component’s transition state from an incoming event to an outgoing event. L represents a set of direct links between state nodes. Each link li in L is a direct
edge (Sr, Sd), which indicates an event (either an incoming/outgoing event) between
two transitions. Each link (say li) has a pair of count vectors (Ict, Oct). Ict = (Ict1,…, Ictm) is a count
vector, each element indicates the total number of tracked incoming events in a test time frame for the link. Oct = (Oct1,…, Octm) is a count vector, each element indicates
total number of tracked outgoing events in a test time frame for the link.
Copyright by Jerry Gao
Event-Based Transition Model
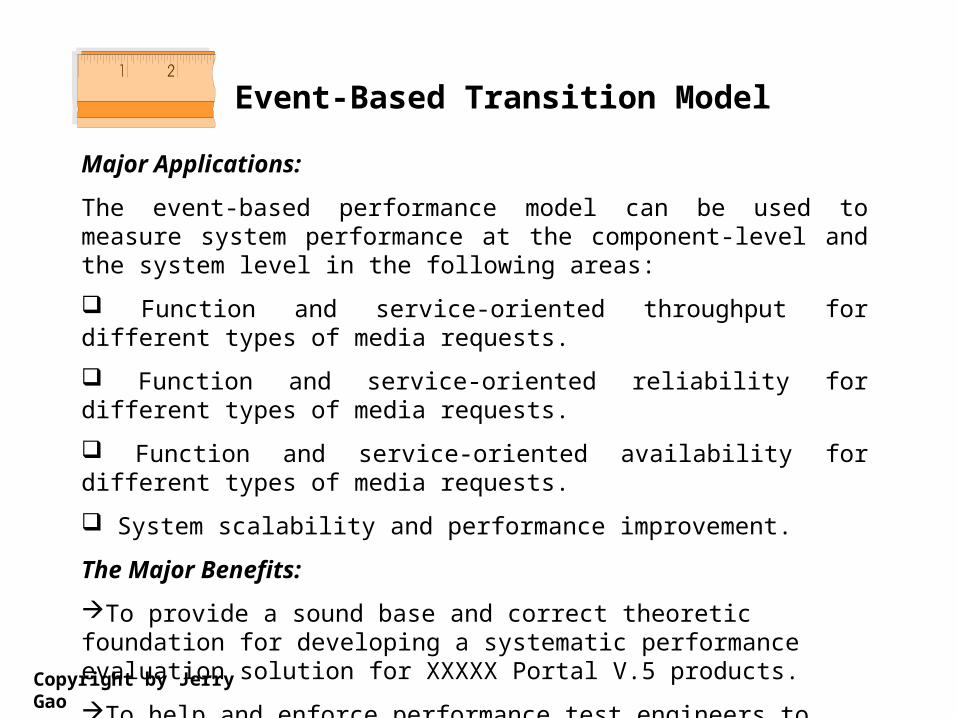
Major Applications:
The event-based performance model can be used to measure system performance at the component-level and the system level in the following areas:
Function and service-oriented throughput for different types of media requests.
Function and service-oriented reliability for different types of media requests.
Function and service-oriented availability for different types of media requests.
System scalability and performance improvement.
The Major Benefits:
To provide a sound base and correct theoretic foundation for developing a systematic performance evaluation solution for XXXXX Portal V.5 products.
To help and enforce performance test engineers to understand the behaviors of a system.
Copyright by Jerry Gao

Event-Based Transition Model: An Example
S1(ChatREQ, CallInit ChatREQ)
S2(CallInit ChatREQ, Incoming.Conn)
S3(Icom.Conn, Accept)
S4(Accept, Create Session)
S5(Create Session, Session Created)
S6(Session Created, Add Participant)
S7(Add Participant, Participant Add)
S8(Participant Add, Return Addinfo)
S9(Return Addinfo, Return Addinfo’)
Figure 3(b). An Event-Based Transition Diagram for TexChat Sequence #1
ChatREQ (Ict, Oct)
CallInit ChatREQ (Ict, Oct)
Incoming Conn (Ict, Oct)
Accept (Ict, Oct)
Create Session (Ict, Oct)
Return AddInfo’ (Ict, Oct)
Return AddInfo (Ict, Oct)
Session Create (Ict, Oct)
Add Participant (Ict, Oct)
Participant Add(Ict, Oct)
EventTransition
Copyright by Jerry Gao

Performance Evaluation - Metrics
Copyright by Jerry Gao
Performance metrics
oCall request process time
oEvent interaction latency
Throughput metrics (component and system level)
oCall processing throughput
oCall load throughput rate
Availability metrics (component and system level)
Reliability metrics (component and system level)
Scalability metrics
Utilization metrics

Performance Metrics
Common used performance metrics: (for components/systems) Functional or process speed metrics User response time metric Communication speed metric Transaction speed metric Latency metric
Performance metrics for Portal V.5 products: Call process time metric Call process speed metric Event latency metric
Copyright by Jerry Gao

Performance Metric – Call Process Time
Ej(Ti,To) Ej+1 (Ti,To)
Incoming timestamp Outgoing timestamp
Ck
Incoming Event
Component
Component Process Time Metric for a call request reqi:
Process-TimeSq (Ck,, reqi)
= Ej+1’s outgoing timestamp – Ej’s incoming timestamp
Outgoing Event
Copyright by Jerry Gao

Performance Metric – Call Process Time
Component Process Time Metric for call requests Req(media type):
Req(media type) = { req1, …., reqn }
Max-Process-TimeSq (Ck,, Req(media type))
= Maxi { Process-TimeSq (Ck,, reqi) } (i = 1,…n)
Min-Process-TimeSq (Ck,, Req(media type))
= Mini { Process-TimeSq (Ck,, reqi) } (i = 1,…n)
Avg-Process-TimeSq (Ck,, Req(media type))
= [i Process-TimeSq (Ck,, reqi)] / n (i = 1,…n)
Copyright by Jerry Gao

Performance Metric – Call Process Time
E1(Ti,To)
Incoming timestamp
Outgoing timestamp
Caller Simulator(media type #I)
Agent desktopsimulator
DMS
eFlow
ASP
Em(Ti,To)
MDRC-MDR
Portal V5
Copyright by Jerry Gao

Performance Metric – Call Process Time
C1 C2 Cm
E1
E2Em+1
Component
Event-Based Functional Scenario Path S for a special type of media requests:
Ck
System Call Process Time Metric for a call request reqi:
Process-Time(S,, reqi)
= Em+1’s outgoing timestamp – E1’s incoming timestamp
Caller simulator
Agent simulator
Copyright by Jerry Gao

Performance Metric –Call Process Time
System Call Process Time Metric for a specific media load.
Req(media type) = { req1, …., reqn }
Max-Process-Time (S,, Req(media type))
= Maxi { Process-Time (S,, reqi) } (i = 1,…n)
Min-Process-Time(S,, Req(media type))
= Mini { Process-Time (S,, reqi) } (i = 1,…n)
Avg-Process-Time (S,, Req(media type))
= [i Process-Time (S,, reqi)] / n (i = 1,…n)
Copyright by Jerry Gao

Performance Metric – Latency
Latency metrics are used to measure the delays of:- Messages, transactions, tasks, …..
We can define an event message latency metric for Portal V.5to measure delay of event messages between components.
Event-LatencySq (Ei, reqj) = Ej’s incoming timestamp – Ej’s outgoing timestamp = Ti - To
We can compute the Max, Min, and Average of Latency.
Ej(Ti,To) Ej+1 (Ti,To)
Incoming timestamp Outgoing timestamp
Ck
Incoming Event
Outgoing Event
Copyright by Jerry Gao

Performance Metrics –Call Process Speed
System Call Process Speed for a specific media load in a given test time Tp.
Req(media type) = { req1, …., reqn }
System-Process-SpeedTp(Req(media type))= Total number of processed requests / |Tp|
Definition: The system call process speed for a special type of media requests Req(media-type). in a given performance test period Tp refers to
the ratio of the total number of processed requests by the system to the test time |Tp|.
Copyright by Jerry Gao

T0 T1 T2
Minimum
Maximum
Average
Time Slots
10000
8000
6000
4000
2000
0
Figure 8(b). System Process Speed Measurement
System Process Speed (n/second)
Performance Metric – Call Process Speed

Throughput Metrics
Copyright by Jerry Gao
Objective: To measure the call processing capacity of a system.
The four types of throughput metrics are defined:
System processing throughput for a special type of media requestsSystem processing throughput for all types of media requestsSystem-load throughput rate for a special type of media requestsSystem-load throughput rate for all types of media requests
Concerns: Maximum of the throughput Minimum of the throughput Average of the throughput

Throughput Metric- Component Process Throughput
Definition: In a given functional scenario, the component-process throughput for a special type of media requests Req(media-type) in a given performance test period Tp refers to the total number of its
outgoing events which are generated by processing its incoming events for these media requests.
Ck
Ek+1Ek
Total No. of Outgoing Ek+1
Ek+1(Ict, Oct)Ek(Ict, Oct)
Total count of Incoming Ek
Sk1
Transition
System-Process-Throughput Tp (Req(media type))= total number of outgoing Ek

Throughput Metric- Component Process Throughput Rate
Definition: In a given functional scenario, the component-process throughput rate for a special type of media requests Req(media-type) in a given performance test period Tp refers to the ratio of the total number
of its outgoing events (which are generated by processing its incoming events for these media requests) to the total number of its incoming events.
Ck
Ek+1Ek
Total No. of Outgoing Ek+1
Ek+1(Ict, Oct)Ek(Ict, Oct)
Total count of Incoming Ek
Sk1
Transition
System-Process-Throughput-Rate Tp (Req(media type))= total number of outgoing Ek+1 / total number of incoming Ek

Ck
Ek+1
Throughput Metric- Component Process Throughput
Ek
Total No. of Outgoing Ek+1
Ek+1(Ict, Oct)Ek(Ict, Oct)
Total count of Incoming Ek
Sk1
Transition
Ck
Ek+1EkEk+1(Ict, Oct)Ek(Ict, Oct)
Sk1
Transition
Ek+jEk+j+1
Ek+j+1(Ict, Oct)Ek+j(Ict, Oct)Sk2

Throughput Metric- System Process Throughput
Definition: The system-process throughput for a special type of media requests Req(media-type) in a given performance test period Tp refers to the total number of processed requests in the
incoming request set Req(media-type).
m n
Portal V.5
Total No. of Loaded Media Requests in Tp
Total No. of Processed Media Requests in Tp
System Process Throughput in Tp = n

m n
Portal V.5
Total No. of Loaded Media Requests in Tp
Total No. of Processed Media Requests in Tp
System ProcessThroughput in Tp
C1 C2 Cm
Component
Event-Based Functional Scenario Path:
Ck
E1(Ict, Oct) Em+1(Ict, Oct)
Throughput Metric- System Process Throughput
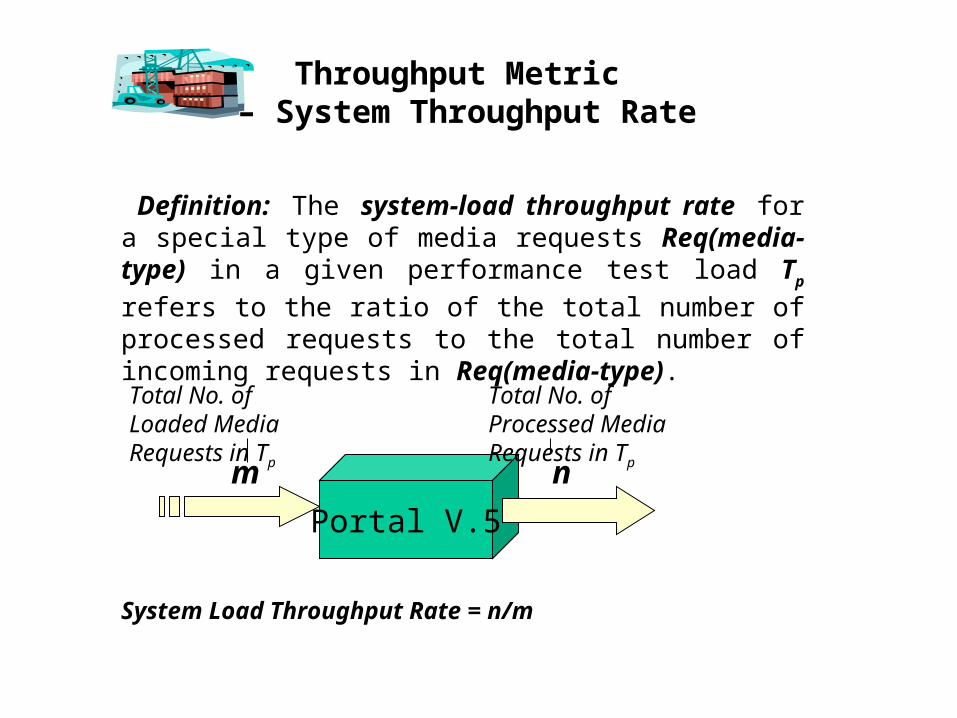
Throughput Metric – System Throughput Rate
Definition: The system-load throughput rate for a special type of media requests Req(media-type) in a given performance test load Tp refers to the ratio of the total number of processed
requests to the total number of incoming requests in Req(media-type).
m n
Portal V.5
Total No. of Loaded Media Requests in Tp
Total No. of Processed Media Requests in Tp
System Load Throughput Rate = n/m

T0 T1 T2
Minimum
Maximum
Average
Time Slots
10000
8000
6000
4000
2000
0
Figure 8(a). Throughput Measurement
System Process Throughput
Throughput Metric - Throughput

T0 T1 T2
Minimum
Maximum
Average
Time Slots
1.0
0.8
0.6
0.4
0.2
0
Figure 8(b). Throughput Rate Measurement
System Throughput Rate (%)
Throughput Metric –Throughput Rate

Availability Metrics
Objectives:
Availability metrics are defined to evaluate the availability of components and systems in providing their specified functions and services to system users and customers.
Several availability metrics are defined here:
Component-levelComponent Availability MetricsComponent Service Availability Metrics
System-levelSystem Availability MetricSystem-Service Availability Metric

Availability Metric - Component Availability
Definition: The component availability of a component Ck in a
system during a time period T refers to the ratio of the total available time of the component to the total time T, including both available and unavailable time.
Component Availability Metric:
Component-Availability T (Ck)
= available-time(Ck) / (available-time(Ck) +unavailable-time(Ck))
= available-time(Ck) / |T|
Where available-time(Ck) represents the available time of Ck during
Tp, and unavailable-time(Ck) includes the time when the component
can not provide the specified functions and services.
Application: to measure the availability of components.

Availability Metrics – HA Component Availability
For a HA component with a cluster of redundant components,how to compute the available time or unavailable time of a HA component?
The first approach is to use the single failure criterion:
“Under the single failure criterion, any failure of its component in a HA component is a failure of the HA component, hence the downtime of a HA component refers to the time slots when at least one of its components is down.” downtime (C ) = Union k (downtime(Ck)) (k = 1, …n)uptime (C ) = |T| – downtime(C )Component-Reliability T(C ) = uptime (C ) / |T|

Availability Metrics – HA Component Availability
For a HA component with a cluster of redundant components,how to compute the available time or unavailable time of a HA component?
The other approach is to use the reliable service criterion:
“Under the reliable service criterion, when a HA component is up, at least one of its component is up and provides the reliable functions and services. Hence, the uptime of a HA component refers to the time slots where at least one of its components is up, and supports the specified functions and services.” uptime (C ) = Union k (uptime(Ck)) (k = 1, …n)Component-Reliability T(C ) = uptime (C ) / |T|

C = {C1, C2} C = {C1, C2}
C1
C2
C1
C2
Unavailable-time(C1)
T
Unavailable-time(C2)
Unavailable-time(C ) = unavailable-time(C1) U unavailable-time(C2)
T
Unavailable-time(C)Unavailable-time(C2)
Unavailable-time(C1)
Unavailable-time(C)
Unavailable-time(C ) = unavailable-time(C1) intersect unavailable-time(C2)
Comparison of Two Approaches
Approach #1: Approach #2:

Availability Metrics - System Availability
Definition: For a system S, its system availability during a given test period Tp refers to the ratio of its total available time to
provide all specified function sets for its users in all given media types to the total test time |Tp|.
Let use System-Availability Tp (S) to denote the system availability
for system S. S = {C1,…., Cm} consists of M components. To help engineers evaluate system availability, we define the following metric by considering the single failure criterion: System-Availability Tp (S)
= available-time(S) / (available-time(S) +unavailable-time(S))= available-time(S) / |Tp|
available-time(S) = Min k { available-time(Ck) } k = 1,..M.
Where uptime(S) refers to the system uptime in Tp, and
downtime(S) represents the system downtime in TP.

Availability Metric - System Service Availability
Definition: For a system S, its system availability of function services during a given test period Tp to process user requests
in a given media type Req(media type) is a function, denoted as System-Service-Availability(Req(media type),Tp), which
represents the probability of the system that is able to deliver the specified functional services to users in Tp.

System Service Availability Model
C1 C2 Ck
S1 S2Sk
E1 E2E3,…,EK EK+1
E3,…,EK EK+1 (Ict,Oct)E1(Ict,Oct)
A1 A2 AkComponentAvailability Parameter
E2 (Ict,Oct)
Event
Component
Event-Based Transition
Event-Based Functional Scenario Path:
Total No. of Incoming E2 Total No. of Outgoing E2
Event-Based Transition Path:

Availability Metric - System Service Availability Metric
System Service Availability Metric:
System-Service-Availability(Req(media type),Tk)
= A1* A2* … * Am
Aj = 0 if there is no incoming event Ej during test time T. Otherwise,
total number of outgoing Ej+1 / total number of incoming Ej.
Sj
Ej(Ict,Oct)
AjComponent Availability Parameter
Ej+1 (Ict,Oct)
Total No. of Incoming EjTotal No. of Outgoing Ej

Availability Metrics
T0 T1 T2
Media Type #1
Media Type #2
Media Type #3
Time Slots
1.0
0.8
0.6
0.4
0.2
0
Figure 15. System Service Availability Measurement
Service Availability (%)

Reliability Metrics
Objectives:
Reliability metrics are defined to evaluate the system reliability in a given time to support the reliable functions and services to system users.
Several availability metrics are defined here:
Component-levelComponent Reliability MetricComponent Service Reliability Metric
System-levelSystem Reliability MetricSystem-Service Reliability Metric
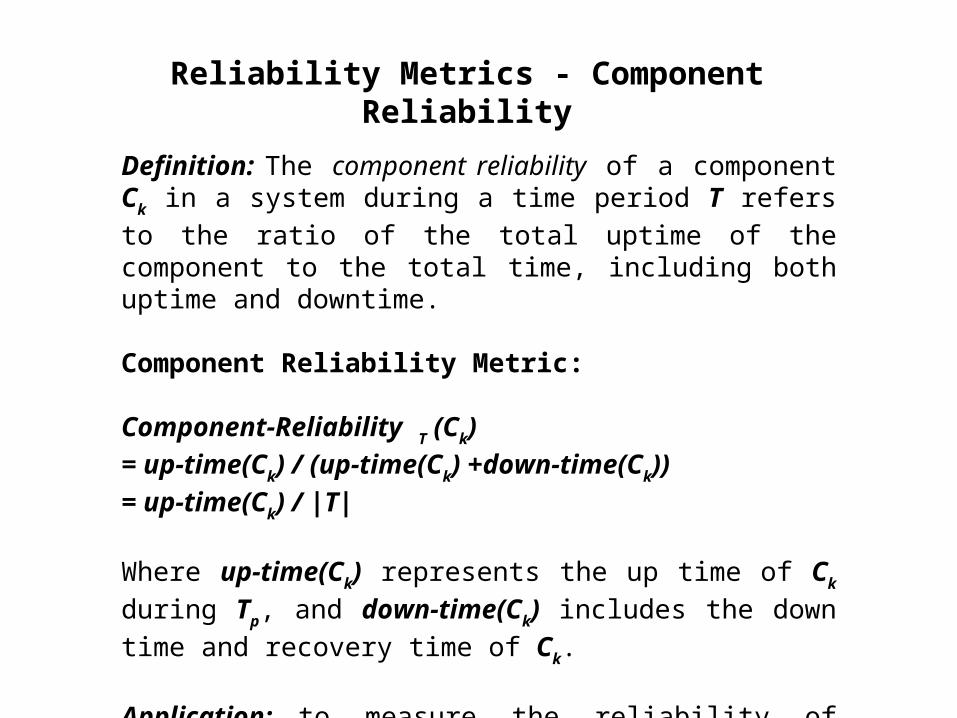
Reliability Metrics - Component Reliability
Definition: The component reliability of a component Ck in a
system during a time period T refers to the ratio of the total uptime of the component to the total time, including both uptime and downtime.
Component Reliability Metric:
Component-Reliability T (Ck)
= up-time(Ck) / (up-time(Ck) +down-time(Ck))
= up-time(Ck) / |T|
Where up-time(Ck) represents the up time of Ck during Tp, and
down-time(Ck) includes the down time and recovery time of Ck.
Application: to measure the reliability of components.

Reliability Metrics – HA Component Reliability
For a HA component with a cluster of redundant components,how to compute the uptime or downtime of a HA component?
The first approach is to use the single failure criterion:
“Under the single failure criterion, any failure of its component in a HA component is a failure of the HA component, hence the downtime of a HA component refers to the time slots when at least one of its components is down.” downtime (C ) = Union k (downtime(Ck)) (k = 1, …n)uptime (C ) = |T| – downtime(C )Component-Reliability T(C ) = uptime (C ) / |T|

Reliability Metrics – HA Component Reliability
For a HA component with a cluster of redundant components,how to compute the uptime or downtime of a HA component?
The other approach is to use the reliable service criterion:
“Under the reliable service criterion, when a HA component is up, at least one of its component is up and provides the reliable functions and services. Hence, the uptime of a HA component refers to the time slots where at least one of its components is up, and supports the specified functions and services.” uptime (C ) = Union k (uptime(Ck)) (k = 1, …n)Component-Reliability T(C ) = uptime (C ) / |T|

C = {C1, C2} C = {C1, C2}
C1
C2
C1
C2
downtime(C1)
T
downtime(C2)
downtime(C ) = downtime(C1) U downtime(C2)
T
downtime(C)
downtime(C2)
downtime(C1)
downtime(C)
downtime(C ) = downtime(C1) intersect downtime(C2)
Comparison of Two Approaches
Approach #1: Approach #2:

Reliability Metrics - System Reliability
Definition: For a system S with a single failure criterion, its system reliability during a given test period Tp refers to the ratio of
its total time to support all specified function sets for its users through all given media types to the total test time |Tp|.
Let use System-Reliability Tp (S) to denote the system reliability
for system S. S = {C1,…., Cm} consists of M components. To help engineers evaluate system reliability, we define the following metric by applying single failure criterion: System-Reliability Tp (S)
= uptime(S) / (downtime(S) +uptime(S)) = uptime(S) / |Tp|
Uptime(S) = Min k { uptime(Ck) } k = 1,…M.
Where uptime(S) refers to the system uptime in Tp, and
downtime(S) represents the system downtime in TP.

Reliability Metrics - System Service Reliability
Definition: For a system S, its system reliability of function services during a given test period Tp to process user requests in a
given media type Req(media type) is a function, denoted as System-Service-Reliability(Req(media type),Tp), which represents
the probability of the system that is reliable enough to deliver the specified functional services to users in Tp.
Application: evaluate the system reliability on providing the specified functional services to process the requests from users using a given media type.

System Service Reliability Model
C1 C2 Ck
S1 S2Sk
E1 E2E3,…,EK EK+1
E3,…,EK EK+1 (Ict,Oct)E1(Ict,Oct)
R1 R2 RkComponentReliability Parameter
E2 (Ict,Oct)
Event
Component
Event-Based Transition
Event-Based Functional Scenario Path:
Total No. of Incoming E2 Total No. of Outgoing E2
Event-Based Transition Path:

Reliability Metrics - System Service Reliability Metric
System Service Reliability Metric:
System-Service-Reliability(Req(media type),Tk)
= R1* R2* … * Rm
Rj = 0 if there is no incoming event Ej during test time T. Otherwise,
total number of outgoing Ej+1 / total number of incoming Ej.
Sj
Ej(Ict,Oct)
RjComponent Reliability Parameter
Ej+1 (Ict,Oct)
Total No. of Incoming Ej Total No. of Outgoing Ej

Reliability Metrics - System Service Reliability
Now let’s examine this metric in the following special cases:
If there is Rj with 0 value, then System-Service-
Reliability(Req(media type),Tk) must be 0. This indicates that at
least one component on the path P is not available during the time period of T.If all Rj (j=1,.., m) with value of 1, then System-Service-
Reliability(Req(media type),Tk) = 1.
The system service reliability during the test period Tp can be
evaluated below. System-Service-Reliability(Req(media type),Tp)
= Σk System-Service-Relilability(Req(media type), Tk)
(k =1,... z)= Σk (Πj Rj) / z (j = 1,…, m, k =1,…, z)

T0 T1 T2
Media Type #1
Media Type #2
Media Type #3
Time Slots
1.0
0.8
0.6
0.4
0.2
0
Figure 15. System Service Reliability Measurement
Service Reliability (%)
System Service Reliability

Scalability Metrics
The major applications of scalability metrics:To check the boundary and threshold of a system and its components.To check the speed-up of a system and its components when more hardware machines and application servers are added into a system.To evaluate the throughput improvement of a system (or its components) when more hardware machines and application servers are added into a system.
The scalability metrics defined here:Speed-upThroughput Improvement

Load Boundary and Threshold
5000
4000
3000
2000
1000
0
Threshold Point
Load Throughput
Figure 16. Load Boundary and Threshold
Load Increase Rate (%)
0.0 0.2 0.4 0.6 0.8 1.0 Load#1 Load#2 Load#3 Load#4 Load#5

Throughput Improvement
Definition: The throughput improvement for a system (or a component cluster) for a fixed load Req(S) in a given time Tp, denoted
as Throughput-Improvement(A,B) refers to the throughput rate increase from configuration setting A to configuration setting B. The detailed metric can be defined below:
Throughput-Improvement (A,B) = (system load throughput under B
– system load throughput under A)/|Req(S)|
Application: to measure the improvement of system throughput

Figure 17. Throughput Improvement
100
80
60
40
20
0
Load Throughput Increase (%)
Configuration Setting
Setting (#0, /#1) Setting( #1, #2) Setting (#2, #3)…..
threshold point for changing configurations
threshold point for throughput improvement
Throughput Improvement
Speed-Up
Definition: The process speed-up for a system (or a component cluster) under a fixed load Req(S) in a given time Tp, denoted as
Speed-up(A,B), refers to the process speed increase from configuration setting A to configuration setting B. The detailed metric can be defined below:
Speed-up (A,B) = (process speed under B – process speed under A)/ process speed under A
Application: to measure the improvement of the system process speed

Figure 18. Speed-up
100
80
60
40
20
0
Speed Increase (%)
Configuration Setting
Setting (#0, /#1) Setting( #1, #2) Setting (#2, #3)…..
threshold point for changing configurations
threshold point for speed improvement
Speed-Up

Utilization Metrics
The major applications of utilization metrics:
Network utilization:To check the network utilization of different protocols at a specific node on a given network.Example: HTTP. H.323, TCP/IP, ASAI, SMTP/POP, ..
Server machine utilization:To check the utilization of system resource of each server machine, including CPU, RAM, Cache, and disk.Example:DMS, MDR, eFlow, ASP servers and clusters
Client machine utilization:To check the utilization of system resources of a client machine, including CPU, RAM, Cache, and disk.Example: Agent and caller machine.

Utilization Metrics
80
60
40
20
0Test Loads (avg. per second)
T0 T1 T2 T3 T4 T5
Machine Resource Utilization (%)
Disk
RAMCPU
Figure 20. Utilization of Single Client/Server Machine
Cache

Utilization Metrics
80
60
40
20
0Test Loads (avg. per second)
T0 T1 T2 T3 T4 T5
Network Utilization (%)
Protocol TCP/IP
Protocol ASAIProtocol H.323 and others
Figure 19. Network Utilization
Protocol HTTP
Supporting Environment for Performance Evaluation
The major applications of utilization metrics:
Basic ComponentsTo check the network utilization of different protocols at a specific node on a given network.Example: HTTP. H.323, TCP/IP, ASAI, SMTP/POP, ..
System Infrastructure:To check the utilization of system resource of each server machine, including CPU, RAM, Cache, and disk.Example:DMS, MDR, eFlow, ASP servers and clusters
Construction Step:To check the utilization of system resources of a client machine, including CPU, RAM, Cache, and disk.Example: Agent and caller machine.

References
Jerry Gao and Tim Lui, “XXXXX Performance Test Environment for Portal V.5 Products”, July, 2000.
Jerry Gao “Performance Test Strategy and Test Metrics for XXXX Portal V.5 Products”, August, 2000.
Jerry Gao, “A Set of Performance Notes”. July, 2000.
Jerry Gao, “Performance Testing and Measurement for DistributedComponent-Based Systems: A Systematic Approach”, in March 2001.
A Collection of Technical Research Papers on Performance Evaluation and Metrics.