Embed Size (px)
Citation preview
PERFORMANCE EVALUATION OF CONDIMENTS AS ENVIRONMENTALLY
FRIENDLY CORROSION INHIBITORS FOR AMINE–BASED
CARBON DIOXIDE ABSORPTION PROCESS
A Thesis
Submitted to the Faculty of Graduate Studies and Research
In Partial Fulfillment of the Requirements
For the Degree of
Master of Applied Science
In Process Systems Engineering
University of Regina
By
Sockalingam Sekkappan
Regina, Saskatchewan
February, 2018
Copyright 2018: Sockalingam Sekkappan

UNIVERSITY OF REGINA
FACULTY OF GRADUATE STUDIES AND RESEARCH
SUPERVISORY AND EXAMINING COMMITTEE
Sockalingam Sekkappan, candidate for the degree of Master of Applied Science in Process Systems Engineering, has presented a thesis titled, Performance Evaluation of Condiments as Environmentally Friendly Corrosion Inhibitors for Amine-Based Carbon Dioxide Absorption Process, in an oral examination held on January 12, 2018. The following committee members have found the thesis acceptable in form and content, and that the candidate demonstrated satisfactory knowledge of the subject material. External Examiner: Dr. Daoyong Yang, Petroleum Systems Engineering
Supervisor: Dr. Amornvadee Veawab, Process Systems Engineering
Committee Member: Dr. Stephanie Young, Environmental Systems Engineering
Committee Member: Dr. Adisorn Aroonwilas, Process Systems Engineering
Chair of Defense: Dr. Doug Durst, Faculty of Social Work

ii
ABSTRACT
Corrosion of process equipment and piping in the amine-based carbon dioxide
(CO2) absorption process causes considerable expenditures for maintenance and repair.
The addition of effective corrosion inhibitors to the amine solutions is a common practice
for corrosion mitigation. Despite their inhibition effectiveness, those corrosion inhibitors
used in the amine-based CO2 absorption process are not environmentally friendly and
require costly waste handling and disposal. To reduce such cost and prepare for more
stringent environmental regulations for chemical uses and disposal, this work
investigated the feasibility of using condiments as environmentally friendly corrosion
inhibitors in the amine-based CO2 absorption process. In this study, five condiments
including powders of garlic, mustard, horseradish, onion and turmeric were selected and
evaluated for their corrosion inhibition performance on carbon steel (CS1018) in the
environment of 5.0 kmol/m3 aqueous solutions of monoethanolamine (MEA) saturated
with dissolved CO2. The evaluation was carried out in corrosion experiments that
employed cyclic and poteniodynamic polarization and electrochemical impedance
spectroscopy for corrosion measurement and analysis. Results show that the powders of
garlic, mustard, horseradish, onion showed great promise for corrosion reduction in both
MEA-CO2 and MEA-CO2-oxygen (O2) solutions. They performed well with inhibition
efficiencies in the range of 80- 95% even at elevated temperatures and the presence of
process contaminants (i.e., chloride and oxalate) which were found to slightly affect the
inhibition performance. These four condiments were proved to be mixed-type (anodic
and cathodic) corrosion inhibitors that protected the metal surface by undergoing
endothermic physical and chemical adsorption with the Langmuir adsorption isotherm.

iii
Sulfur, nitrogen, phosphorus functional groups were the primary contributors to the
inhibition effectiveness. Unlike these four condiments, the powder of turmeric was not
promising as it yielded lower inhibition efficiency and induced pitting corrosion for most
tested conditions.
iv
ACKNOWLEDGEMENTS
I would really like to thank Dr. Amornvadee (Amy) Veawab for providing this
research opportunity .Dr.Amy has always given me the freedom throughout my entire
course and provided a positive environment to try new things as solutions when there
were obstacles in my research. Also, I would like to thank Dr. Adisorn Aroonwillas for
providing lot of support through his suggestions and feedbacks to set up my experiments.
I also gratefully acknowledge the financial support through scholarship and teaching
assistantship from the Faculty of Engineering and Applied Science and Faculty of
Graduate Studies and Research at the University of Regina. I express my earnest
gratefulness for financial support provided by Natural Sciences and Engineering
Research Council (NSERC).
I take this opportunity to express my heartfelt gratitude to my father and brother
for understanding the situation and helping me to overcome the anxiety hurdles and
stresses. With a special mention I would like to thank Mohanned Alammeen and Prathap
IVS for their technical advice and mentorship for completing this project. Also, I take this
opportunity to express my special thanks to Rajesh Murugesan for his innovative ideas
during my research which ignited my curiosity in this project. Finally I would like to
thank my best friends for being my inspiration during my entire research work at difficult
times. So, thanks to Sanjog, Ameer, Ranga, Prakashpathi, Venky, Vaikunth, Vinith
Manoj, Gina and Robyn for their motivation. Thanks are just a word but I am glad to
have met everyone mentioned here and now being a part of my world.

v
TABLE OF CONTENTS
ABSTRACT ii
ACKNOWLEDGEMENTS iv
LIST OF TABLES ix
LIST OF FIGURES xi
NOMENCLATURE xvii
CHAPTER 1 INTRODUCTION 2
1.1 Carbon Dioxide (CO2) Absorption Process 2
1.2 Corrosion Problems and Control 2
1.2.1 Plant practices 3
1.2.2 Corrosion resistant materials 5
1.2.3 Chemical treatment 6
1.3 Corrosion Inhibitor History and Current Status 6
1.3.1 Environmental regulations 8
1.3.2 Eco-friendly corrosion inhibitors 9
1.4 Research Motivation 10
1.5 Research Objectives and Scope 11
CHAPTER 2 FUNDAMENTALS AND LITERATURE REVIEW 13
2.1 Corrosion of Metals 13
vi
2.2 Corrosion Mechanisms in Amine Based CO2 Absorption Process 14
2.3 Factors Affecting Corrosion 15
2.3.1 Amine Type and Concentration 16
2.3.2 CO2 loading 16
2.3.3 Oxygen 17
2.3.4 Operating temperature 18
2.3.5 Heat stable salts (HSS) 18
2.4 Corrosion Inhibitors Classification 18
2.5 Green Corrosion Inhibitors 19
2.6 Criteria for Classification of Inhibitors 21
2.6.1 Open circuit potential (OCP) 21
2.6.2 Tafel slopes 23
2.7 Adsorption 24
2.7.1 Physical adsorption 24
2.7.2 Chemical adsorption 24
2.8 Adsorption Isotherm 25
2.8.1 Langmuir isotherm 25
2.8.2 Temkin isotherm 26
2.8.3 Frumkin isotherm 26
2.9 Standard Free Energy of Adsorption 27
2.10 Arrhenius Plots 29
2.11 Thermodynamic Properties 31

vii
2.12 Electrochemical Impedance Analysis 32
2.13 Theoretical Quantum Chemical Methods 35
CHAPTER 3 EXPERIMENTS 40
3.1 Experimental Setup 40
3.2 Materials 42
3.2.1 Electrodes 42
3.2.2 Chemicals 42
3.3 Experimental Procedure 44
3.4 Data Analysis 47
3.4.1 Tafel extrapolation method 47
3.4.2 Pitting tendency 49
3.4.3 EIS analysis 50
CHAPTER 4 RESULTS AND DISCUSSIONS 52
4.1 Uninhibited System 52
4.1.1 Effect of O2 Concentration in Feed gas 52
4.1.2 Effect of temperature 58
4.1.3 Effect of process contaminants 63
4.2 Inhibited Systems 69
4.2.1 Garlic 69
4.2.2 Mustard 88
4.2.3 Horseradish 105

viii
4.2.4 Onion 124
4.2.5 Turmeric 142
CHAPTER 5 CONCLUSIONS AND RECOMMENDATIONS 148
5.1 Conclusions 148
5.2 Recommendations 150
REFERENCES 151
APPENDIX 168

ix
LIST OF TABLES
Table 1.1 Summary of plant experience on corrosion in CO2 gas absorption
process using alkanolamines 04
Table 1.2 Summary of corrosion inhibitor used in CO2 capture process using
alkanolamines 07
Table 2.1 Green corrosion inhibitors for protecting steel in various corrosive
environments 22
Table 3.1 Summary of the chemicals used 46
Table 4.1 Summary of the parameters and experimental test conditions 53
Table 4.2 Summary of experimental and electrochemical parameters for
uninhibited systems 57
Table 4.3 Summary of experimental and electrochemical parameters for garlic
inhibited systems 71
Table 4.4 Summary of Quantum chemical analysis of garlic 86
Table 4.5 Summary of experimental and electrochemical parameters for mustard
inhibited systems 91
Table 4.6 Summary of quantum chemical analysis of mustard 104
Table 4.7 Summary of experimental and electrochemical parameters for
horseradish inhibited systems 111
Table 4.9 Summary of experimental and electrochemical parameters for onion
inhibited systems 127
Table 4.10 Summary of quantum chemical analysis of onion 140

x
Table 4.11 Summary of experimental and electrochemical parameters for Turmeric
inhibited systems 147
Table 5.1 Summary of Corrosion inhibitors performance 149
Table A.1 Uninhibited MEA solutions under the influence of temperature 168
Table A.2 Garlic inhibited MEA solutions for various inhibitor concentrations 168
Table A.3 Mustard inhibited MEA solutions for inhibitor concentrations 169
Table A.4 Horseradish inhibited MEA solutions for inhibitor concentrations 169
Table A.5 Onion inhibited MEA solutions for Inhibitor concentrations 170
xi
LIST OF FIGURES
Figure 1-1 Schematic Diagram for CO2 gas absorption process 1
Figure 2-1 Adsorption isotherm models: (a) Langmuir isotherm,
(b) Temkin isotherm, and (c) Frumkin Isotherm 28
Figure 2-2 Arrhenius Plots (a) Type I (b) Type II 30
Figure 2-3 (a) Nyquist Plot (b) Bode-Phase Plot and equivalent electrical circuit 33
Figure 3-1 Schematics of experimental setup for electrochemical corrosion testing 41
Figure 3-2 Dimensions and chemical composition of (CS 1018) 43
Figure 3-3 Chittick apparatus CO2 loading and MEA conc. measurement 45
Figure 3-4 Tafel extrapolation methods 48
Figure 3-5 Pitting tendency from poteniodynamic polarization curves
(a) Pitting (b) No Pitting 51
Figure 4-1 Polarization corrosion behavior of uninhibited MEA solutions
in the presence of oxygen 55
Figure 4-2 Corrosion behavior comparison of uninhibited MEA solutions in
the presence and absence of oxygen 56
Figure 4-3 Corrosion behavior comparison of uninhibited MEA solutions under
the influence of temperature 59
Figure 4-4 Corrosion behavior comparison of uninhibited MEA solutions under
influence of temperature (a) Conductivity, (b) Nyquist Plot,and (c) Rp 60
Figure 4-5 Photos (before and after experiment) comparison of uninhibited
MEA solutions under the influence of temperature at (a) 80°C (b) 40°C 61
xii
Figure 4-6 Corrosion behavior of uninhibited MEA solutions under the influence
of temperature (a) Bode-phase plot (b) Equivalent electrical circuit 62
Figure 4-7 Arrhenius Plots for uninhibited MEA solutions under the influence
of temperature (a) Type I (b) Type II 64
Figure 4-8 Corrosion behavior comparison of uninhibited MEA solutions under the
influence of process contaminants (a) Tafel plot (b) Corrosion rate 66
Figure 4-9 Comparison of uninhibited MEA solution under the influence of
process contaminants (a) Nyquist Plot (b) Rp 67
Figure 4-10 Photos of uninhibited MEA solution under the influence of process
contaminants (a) Chloride, (b) Oxalate,(c) Thiosulfate,and (d) Formate 68
Figure 4-11 Comparison of garlic inhibited MEA solutions in the presence
and absence of oxygen 70
Figure 4-12 Comparison of garlic inhibited MEA solutions for Inhibitor
concentrations (a) Polarization behavior (b) Inhibition efficiency 73
Figure 4-13 Comparison of garlic inhibited MEA solutions for inhibitor
concentrations (a) Nyquist plot (b) Rp 74
Figure 4-14 Corrosion behavior of garlic inhibited MEA solutions for Inhibitor
concentrations (a) Bode phase plot (b) Equivalent electrical circuit 75
Figure 4-15 Corrosion behavior of garlic inhibited MEA solutions for inhibitor
concentrations (a) tafel slope (b) Langmuir adsorption isotherm 77
Figure 4-16 Corrosion behavior of garlic inhibited MEA solutions under the
influence of temperature at (a) 40°C, (b) 60°C,and(c) 80°C 78
xiii
Figure 4-17 Comparison of garlic inhibited MEA solutions under the
influence of temperature 79
Figure 4-18 Arrhenius Plots for garlic inhibited MEA solutions under the
influence of temperature (a) Type I (b) Type II 81
Figure 4-19 Comparison of garlic inhibited MEA solutions under
the influence of process contaminants 82
Figure 4-20 Comparison of garlic inhibited MEA solutions under the
influence of process contaminants (a) Nyquist Plot (b) Rp 84
Figure 4-21 Quantum Chemistry structures for Allicin and Diallyl Sulfide 87
Figure 4-22 Comparison of mustard inhibited MEA solutions in the presence and
absence of oxygen (a and b) Polarization behavior,
(c) Open circuit potential, and (d) Inhibition efficiency 89
Figure 4-23 Comparison of mustard inhibited MEA solutions for Inhibitor
concentrations (a) Polarization behavior (b) Inhibition efficiency 90
Figure 4-24 Comparison of mustard inhibited MEA solutions for Inhibitor
concentrations (a) Nyquist plot (b) Rp 93
Figure 4-25 Corrosion behavior of mustard inhibited MEA solutions for inhibitor
concentrations (a) Bode phase plot (b) Equivalent electrical circuit 94
Figure 4-26 Corrosion behavior of garlic inhibited MEA solutions for inhibitor
concentrations (a) Langmuir adsorption isotherm (b) tafel slope 95
Figure 4-27 Corrosion behavior of mustard inhibited MEA solutions under the
influence of temperature Tafel plot at (a) 40°C, (b) 60°C,and (c) 80°C 97

xiv
Figure 4-28 Comparison of mustard inhibited MEA solutions under the influence
of temperature (a) Inhibition efficiency, (b) Nyquist plot, and (c) Rp 98
Figure 4-29 Arrhenius plots for mustard inhibited MEA solutions
(a) Type I (b) Type II 99
Figure 4-30 Comparison of mustard inhibited MEA solutions under the influence
of process contaminants (a) Tafel plot (b) corrosion rate 101
Figure 4-31 Comparison of mustard inhibited MEA solutions under the influence
of process contaminants (a) Nyquist Plot (b) Rp 103
Figure 4-32 Quantum Chemistry structures for Allyl isothiocyanate
Benzyl isothiocyanate and Sinigrin (a, b, and c) Optimized molecular
structures (d, e, and f) HOMO (g, h, and i) LUMO 106
Figure 4-33 Comparison of horseradish inhibited MEA solutions in the
presence and absence of oxygen 107
Figure 4-34 Comparison of horseradish inhibited MEA solutions for inhibitor
concentrations (a) Polarization behavior (b) Inhibition efficiency 109
Figure 4-35 Comparison of horseradish inhibited MEA solutions for inhibitor
concentrations (a) Nyquist plot (b) Rp 110
Figure 4-36 Corrosion behavior of horseradish inhibited MEA solutions for
Inhibitor concentrations (a) Bode phase plot (b) electrical circuit 113
Figure 4-37 Corrosion behavior of horseradish inhibited MEA solutions for
Inhibitor concentrations (a) tafel slope (b) Langmuir isotherm 114
Figure 4-38 Corrosion behavior of horseradish inhibited MEA solutions under
the influence of temperature at (a) 40°C, (b) 60°C, and (c) 80°C 115

xv
Figure 4-39 Comparison of horseradish inhibited MEA solutions under
the influence of temperature 116
Figure 4-40 Arrhenius Plots for horseradish inhibited MEA solutions
(a) Type I (b) Type II 118
Figure 4-41 Comparison of horseradish inhibited MEA solutions under
the influence of process contaminants 120
Figure 4-42 Comparison of horseradish inhibited MEA solutions under
the influence of process contaminants (a) Nyquist Plot (b) Rp 121
Figure 4-43 Quantum Chemistry structures for Peroxidase, Phenethyl
isothiocyanate and Theaflavin (a, b, and c) Optimized molecular
structures (d, e, and f) HOMO (g, h, and i) LUMO 123
Figure 4-44 Corrosion behavior of onion inhibited MEA solutions under the
influence of oxygen (a and b) Polarization behavior (c) Open circuit 125
Figure 4-45 Comparison of onion inhibited MEA solutions for inhibitor
concentrations (a) Polarization behavior (b) Inhibition efficiency 126
Figure 4-46 Comparison of onion inhibited MEA solutions for Inhibitor
concentrations (a) Nyquist plot (b) Rp 129
Figure 4-47 Corrosion behavior of onion inhibited MEA solutions for inhibitor
concentrations (a) Bode phase plot (b) Equivalent electrical circuit 130
Figure 4-48 Corrosion behavior of onion inhibited MEA solutions (a) tafel slope
comparison (b) Langmuir adsorption isotherm 131
Figure 4-49 Corrosion behavior of onion inhibited MEA solutions under
the influence of temperature at (a) 40°C , (b) 60°C, and (c) 80° C 132

xvi
Figure 4-50 Comparison of onion inhibited MEA solutions under the influence
of temperature 134
Figure 4-51 Arrhenius Plots for onion inhibited MEA solutions under
(a) Type I (b) Type II 135
Figure 4-52 Comparison of onion inhibited MEA solutions under the influence of
process contaminants (a) Tafel plot (b) corrosion rate 137
Figure 4-53 Comparison of onion inhibited MEA solutions under the influence
of process contaminants 139
Figure 4-54 Quantum Chemistry for Dipropyl disulphide and quercetin 141
Figure 4-55 Comparison of turmeric inhibited MEA solutions in the presence and
absence of oxygen 144
Figure 4-56 Comparison of turmeric inhibited MEA solutions for
inhibitor concentrations 145
Figure 4-57 Comparison of turmeric inhibited MEA solutions for inhibitor
concentrations (a) Nyquist plot (b) Rp 146

xvii
NOMENCLATURE
ASTM American Society for Testing and Materials
C Capacitance (farad)
CCS Carbon capture and storage
Cdl Double layer capacitance (μF/cm2)
CE Counter electrode
CPE Constant phase element
CP Cyclic Polarization
CR Corrosion rate (mmpy)
CS Carbon steel
oC Degree Celsius
D Density (g/cm3)
DFT Density Functional Theory
DC Direct current
E Electrode potential (V)
Eo Standard electrode potential (V)
Eb Breakdown potential or pitting potential (V)
Ecorr Corrosion potential (V)
EHOMO Highest occupied molecular orbital energy (eV)
ELUMO Lowest unoccupied molecular orbital energy (eV)
EIS Electrochemical Impedance Spectroscopy
EPA Environmental Protection Agency

xviii
Epp Primary passivation potential (V)
Erev Equilibrium potential (or Reversible potential) (V)
Erp Re-passivation potential (V)
EW Equivalent weight (g/equivalent)
ΔE Energy gap (eV)
f Frequency (Hz)
F Faraday’s constant (96,500 coulombs per mole)
HSAB Hard and soft acid and base
HSS Heat stable salts
ΔG Free energy change
ΔH Enthalpy change
ia Anodic current density (A/cm2)
ic Cathodic current density (A/cm2)
icorr Corrosion current density (A/cm2)
icrit Critical current density (A/cm2)
iL Limiting current density (A/cm2)
io Equilibrium exchange current density (A/cm2)
ipass Passivation current density (A/cm2)
I Ionization potential (eV)
LC50 Lethal concentration
mmpy millimeter per year
MEA Monoethanolamine
n Number of electrons per atom of the species involved in the reaction
xix
n Hardness (eV)
ΔN Fraction of electrons transferred
OCP Open circuit potential
PC Post combustion
PARCOM Paris Commission
R Gas constant (JK-1mol-1)
RE Reference electrode
RP Polarization resistance (ohm cm2)
RS Solution resistance (ohm cm2)
ΔS Change in entropy
T Absolute temperature (oC)
W Warburg impedance (ohm cm2)
WE working electrode
wt. % Weight percent
vol. % Volume percent
Z Impedance (ohm cm2)
Z' Real impedance (ohm cm2)
Z" Imaginary impedance (ohm cm2)
Greek Letters
βa Anodic Tafel slope (mV/decade of current density)
βc Cathodic Tafel slope (mV/decade of current density)
Ƞa Activation polarization (V)
xx
Ƞc Concentration polarization (V)
θ Phase angle (degree)
μ Dipole moment (Debye)
χ Electronegativity (eV)
ω Angular frequency

2
CHAPTER 1 INTRODUCTION
1.1 Carbon Dioxide (CO2) Absorption Process
The CO2 absorption process is commonly used for removing CO2 from gas
streams for either natural gas purification or flue gas treatment purposes. The process is
operated using amine-based solvents that have the capability to react preferentially with
CO2 [Kohl and Nielsen, 1997]. It is a regenerative process with temperature-dependent
reversible chemical reactions. This process consists of two sequential steps, namely CO2
absorption and solvent regeneration (or CO2 stripping). As illustrated in Figure 1.1, the
gas stream containing CO2 enters the bottom of absorber while the stream of lean amine
solution enters the top of the absorber. The CO2 in the gas stream is absorbed into the
lean amine solution and the gas stream leaves the absorber top with little CO2 contents.
As a result of the CO2 absorption, the lean amine solution becomes rich amine that is
loaded with CO2. The rich amine solution is then preheated through a heat exchanger and
fed to the regenerator where the CO2 is stripped from the rich amine solution by means of
heat. After being regenerated, the rich amine solution becomes the lean amine solution,
leaves the regenerator and is sent back to the absorber for the CO2 absorption cycle.
The amine-based absorption process is widely used in oil and gas industries as
natural gas sweetening plants for gas purification operations. Due to the effect of climate
change, carbon capture and storage (CCS) technologies are gaining momentum
worldwide to control greenhouse gas emissions. Power plants and cement industries are
the major contributors of CO2 emitted into the atmosphere.

1
Figure 1-1 Schematic diagram for CO2 absorption process
2
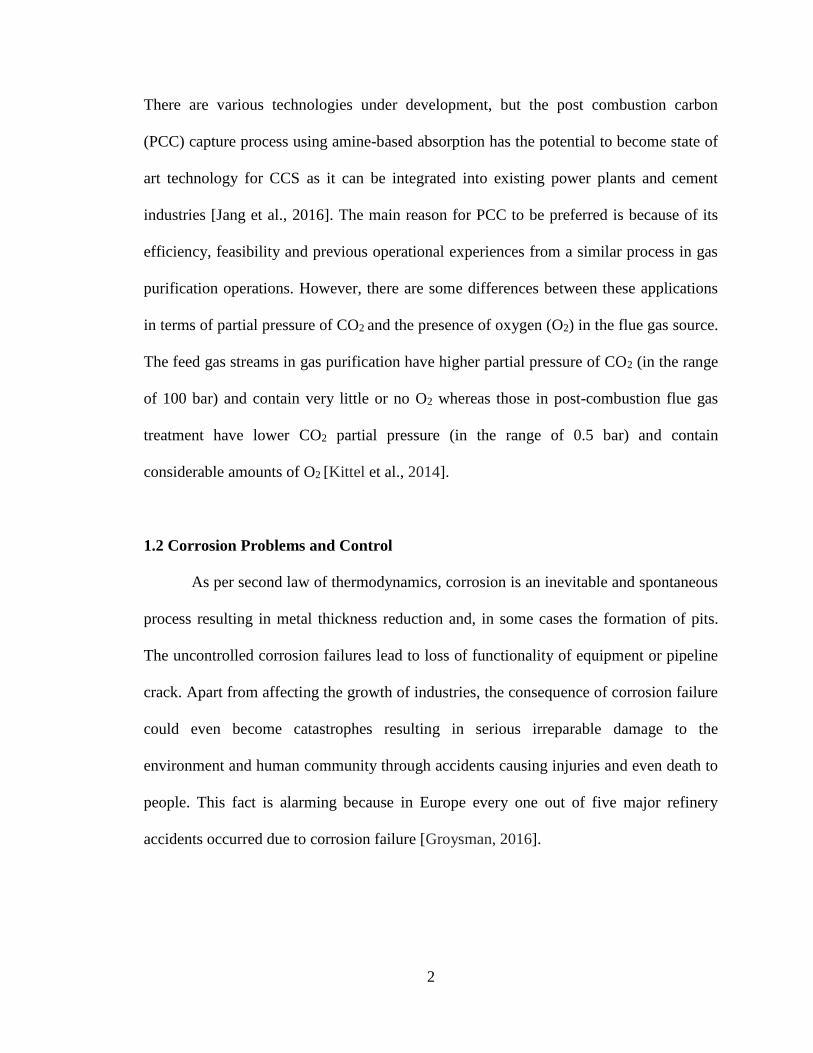
There are various technologies under development, but the post combustion carbon
(PCC) capture process using amine-based absorption has the potential to become state of
art technology for CCS as it can be integrated into existing power plants and cement
industries [Jang et al., 2016]. The main reason for PCC to be preferred is because of its
efficiency, feasibility and previous operational experiences from a similar process in gas
purification operations. However, there are some differences between these applications
in terms of partial pressure of CO2 and the presence of oxygen (O2) in the flue gas source.
The feed gas streams in gas purification have higher partial pressure of CO2 (in the range
of 100 bar) and contain very little or no O2 whereas those in post-combustion flue gas
treatment have lower CO2 partial pressure (in the range of 0.5 bar) and contain
considerable amounts of O2 [Kittel et al., 2014].
1.2 Corrosion Problems and Control
As per second law of thermodynamics, corrosion is an inevitable and spontaneous
process resulting in metal thickness reduction and, in some cases the formation of pits.
The uncontrolled corrosion failures lead to loss of functionality of equipment or pipeline
crack. Apart from affecting the growth of industries, the consequence of corrosion failure
could even become catastrophes resulting in serious irreparable damage to the
environment and human community through accidents causing injuries and even death to
people. This fact is alarming because in Europe every one out of five major refinery
accidents occurred due to corrosion failure [Groysman, 2016].

3
1.2.1 Plant practices
In the CO2 absorption process, corrosion is one of the major operational
difficulties that directly affect plant economy by causing equipment failure and
unplanned downtime, and indirectly affect the integrity of process by catalyzing
degradation of amine solutions in the presence of O2 and CO2 [Gouedard et al., 2012].
Corrosion failures were observed and well documented for the CO2 absorption process
used in natural gas sweetening process. Approximately 10-30% of maintenance budget
was accounted for corrosion [Garcia-Arriaga et al., 2010]. Types of corrosion found in
the gas plants were general corrosion, stress corrosion cracking, pitting corrosion, and
hydrogen embrittlement [Gui et al., 2008]. The factors affecting corrosion are
temperature, CO2 loading, and solution contaminants (such as amine degradation
products) [Pearson et al., 2013]. Examples of plant corrosion experiences reported for the
amine-based CO2 absorption process are provided in Table: 1.1. It is apparent from Table
1.1 that the integrity of equipment was threatened by corrosion. The process components
including absorbers, regenerators, and heat exchangers were prone to different forms of
corrosion on carbon steel which was a common material of construction for process
equipment. To control corrosion at acceptable levels, process parameters were commonly
adjusted to reduce the corrosiveness of amine solutions [Strazisar et al., 2003]. For
example, the concentration of monoethanolamine (MEA) solutions was kept at 3.0
kmol/m3. In addition, the corrosion was also controlled by using alternative corrosion
resistant materials and chemical treatment.

4
Table 1.1 Summary of plant experience on corrosion in CO2 gas absorption process using alkanolamine
Plant Name Location Material of
Construction Type of Plant Applications Corrosive areas Reference
Tarong Australia Carbon Steel Pilot Plant PCC Absorber section [Cousins et al., 2013]
-- USA Carbon Steel Petroleum
Refinery GP
Mechanical failure
due to cracking at
absorber, regenerator
and heat exchanger.
[McHenry et al.,
1987]
LNG Indonesia Carbon Steel
Natural gas
liquefaction
company,
CO2 removal
unit
Cracking at Amine
Regenerator and
Absorber Columns
due to erosion
corrosion.
[Safruddin et al.,
2000]
NEA USA Carbon Steel
CO2 recovery
Plant from gas
turbine flue gas
Food and
beverage
industry
Both absorber and
stripper [DeHart et al., 1999]
CO2 capture China
Carbon Steel
Pilot Plant PCC
Bottom of the
absorber and rich-
liquid outlet of heat
exchanger
[Gao et al., 2012]
Castor and
CESAR Denmark Carbon Steel Pilot Plant PCC
Liquid outlet from the
stripper and Pitting
corrosion was
observed at the CO2
outlet from the
stripper.
[De Vroey et al.,
2013]
ITC Canada Carbon Steel Pilot Plant PCC Inlet of the stripper [Kittel et al., 2012]
-- USA Carbon Steel Gas Treatment GP
Corrosion products
found as solid
contaminants in heat
exchanger and
regenerator.
[Dingman et al., 1966]
5
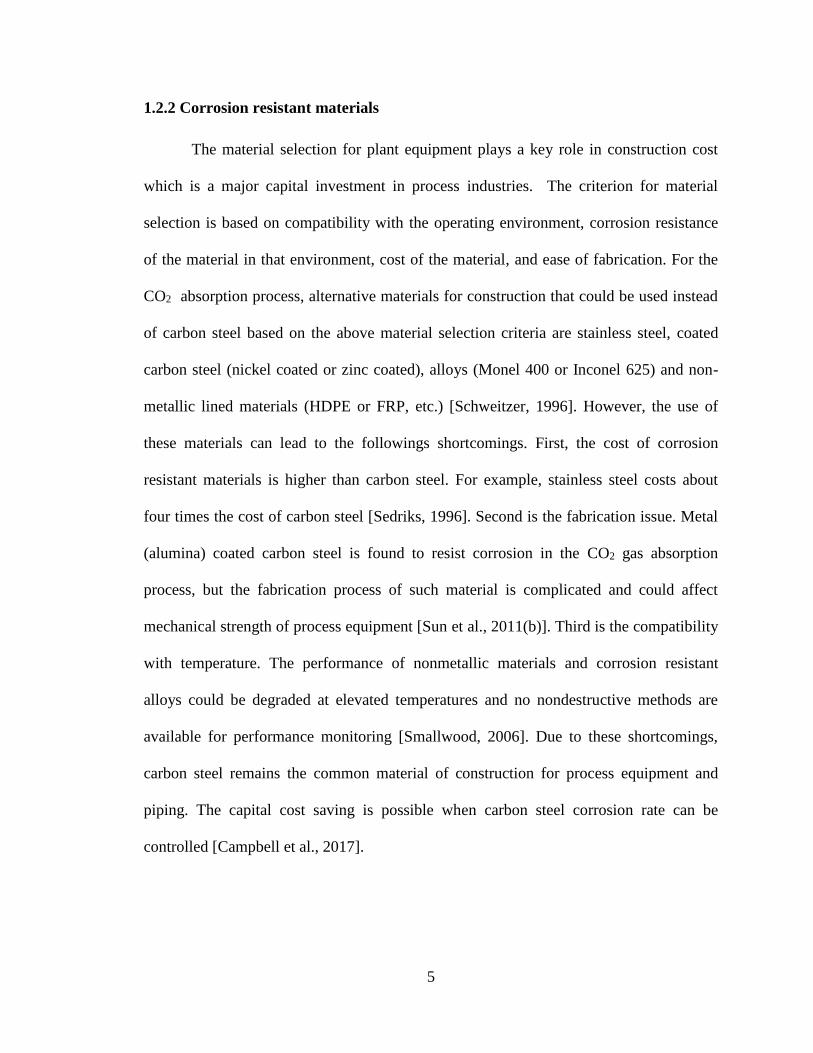
1.2.2 Corrosion resistant materials
The material selection for plant equipment plays a key role in construction cost
which is a major capital investment in process industries. The criterion for material
selection is based on compatibility with the operating environment, corrosion resistance
of the material in that environment, cost of the material, and ease of fabrication. For the
CO2 absorption process, alternative materials for construction that could be used instead
of carbon steel based on the above material selection criteria are stainless steel, coated
carbon steel (nickel coated or zinc coated), alloys (Monel 400 or Inconel 625) and non-
metallic lined materials (HDPE or FRP, etc.) [Schweitzer, 1996]. However, the use of
these materials can lead to the followings shortcomings. First, the cost of corrosion
resistant materials is higher than carbon steel. For example, stainless steel costs about
four times the cost of carbon steel [Sedriks, 1996]. Second is the fabrication issue. Metal
(alumina) coated carbon steel is found to resist corrosion in the CO2 gas absorption
process, but the fabrication process of such material is complicated and could affect
mechanical strength of process equipment [Sun et al., 2011(b)]. Third is the compatibility
with temperature. The performance of nonmetallic materials and corrosion resistant
alloys could be degraded at elevated temperatures and no nondestructive methods are
available for performance monitoring [Smallwood, 2006]. Due to these shortcomings,
carbon steel remains the common material of construction for process equipment and
piping. The capital cost saving is possible when carbon steel corrosion rate can be
controlled [Campbell et al., 2017].
6
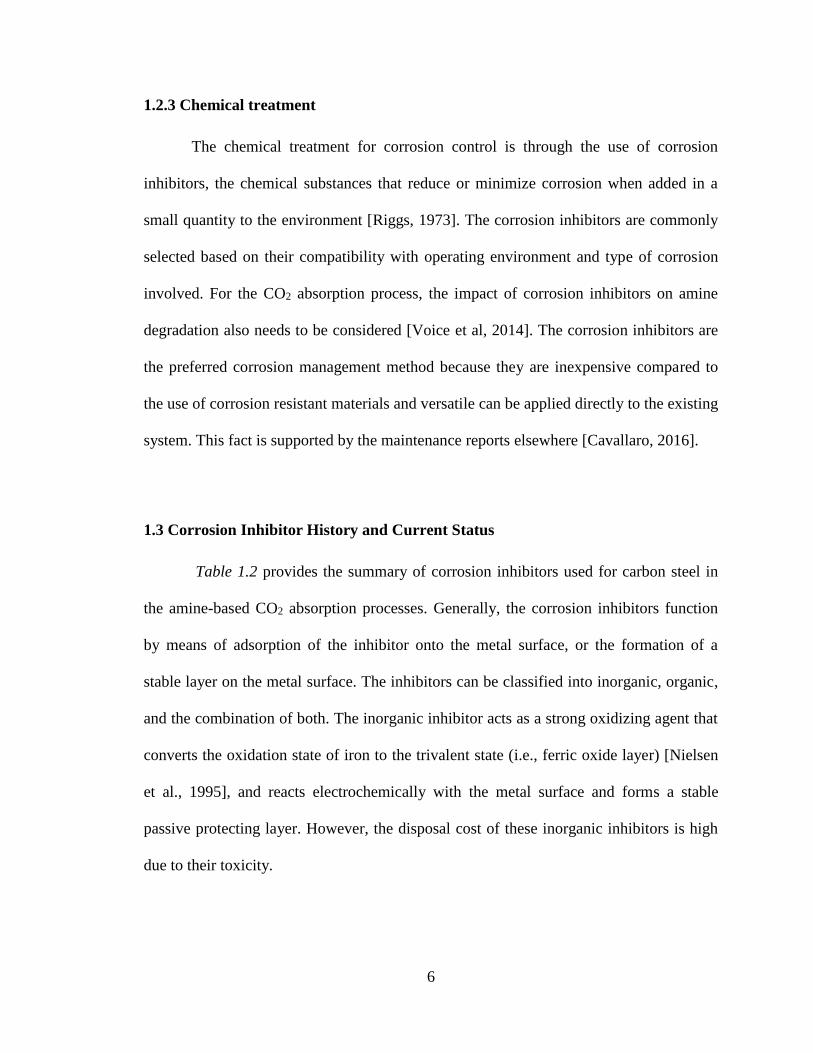
1.2.3 Chemical treatment
The chemical treatment for corrosion control is through the use of corrosion
inhibitors, the chemical substances that reduce or minimize corrosion when added in a
small quantity to the environment [Riggs, 1973]. The corrosion inhibitors are commonly
selected based on their compatibility with operating environment and type of corrosion
involved. For the CO2 absorption process, the impact of corrosion inhibitors on amine
degradation also needs to be considered [Voice et al, 2014]. The corrosion inhibitors are
the preferred corrosion management method because they are inexpensive compared to
the use of corrosion resistant materials and versatile can be applied directly to the existing
system. This fact is supported by the maintenance reports elsewhere [Cavallaro, 2016].
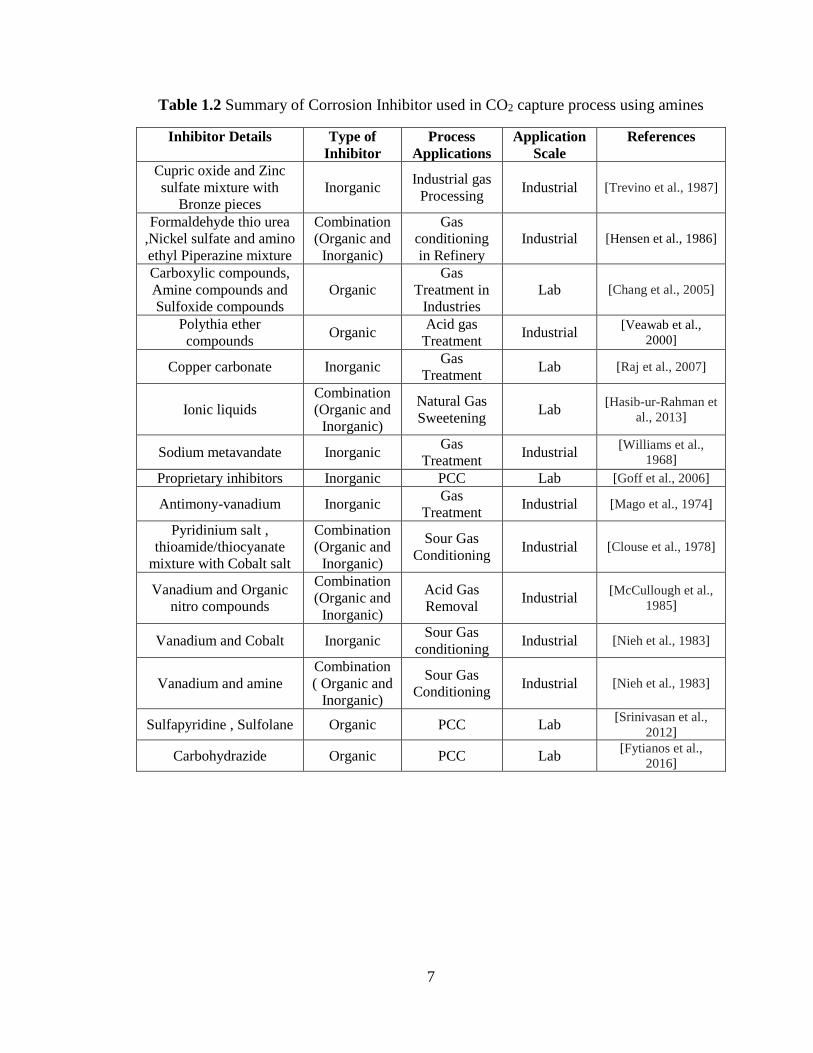
1.3 Corrosion Inhibitor History and Current Status
Table 1.2 provides the summary of corrosion inhibitors used for carbon steel in
the amine-based CO2 absorption processes. Generally, the corrosion inhibitors function
by means of adsorption of the inhibitor onto the metal surface, or the formation of a
stable layer on the metal surface. The inhibitors can be classified into inorganic, organic,
and the combination of both. The inorganic inhibitor acts as a strong oxidizing agent that
converts the oxidation state of iron to the trivalent state (i.e., ferric oxide layer) [Nielsen
et al., 1995], and reacts electrochemically with the metal surface and forms a stable
passive protecting layer. However, the disposal cost of these inorganic inhibitors is high
due to their toxicity.
7
Table 1.2 Summary of Corrosion Inhibitor used in CO2 capture process using amines
Inhibitor Details Type of
Inhibitor
Process
Applications
Application
Scale
References
Cupric oxide and Zinc
sulfate mixture with
Bronze pieces
Inorganic Industrial gas
Processing Industrial [Trevino et al., 1987]
Formaldehyde thio urea
,Nickel sulfate and amino
ethyl Piperazine mixture
Combination
(Organic and
Inorganic)
Gas
conditioning
in Refinery
Industrial [Hensen et al., 1986]
Carboxylic compounds,
Amine compounds and
Sulfoxide compounds
Organic
Gas
Treatment in
Industries
Lab [Chang et al., 2005]
Polythia ether
compounds Organic
Acid gas
Treatment Industrial
[Veawab et al.,
2000]
Copper carbonate Inorganic Gas
Treatment Lab [Raj et al., 2007]
Ionic liquids
Combination
(Organic and
Inorganic)
Natural Gas
Sweetening Lab
[Hasib-ur-Rahman et
al., 2013]
Sodium metavandate Inorganic Gas
Treatment Industrial
[Williams et al.,
1968]
Proprietary inhibitors Inorganic PCC Lab [Goff et al., 2006]
Antimony-vanadium Inorganic Gas
Treatment Industrial [Mago et al., 1974]
Pyridinium salt ,
thioamide/thiocyanate
mixture with Cobalt salt
Combination
(Organic and
Inorganic)
Sour Gas
Conditioning Industrial [Clouse et al., 1978]
Vanadium and Organic
nitro compounds
Combination
(Organic and
Inorganic)
Acid Gas
Removal Industrial
[McCullough et al.,
1985]
Vanadium and Cobalt Inorganic Sour Gas
conditioning Industrial [Nieh et al., 1983]
Vanadium and amine
Combination
( Organic and
Inorganic)
Sour Gas
Conditioning Industrial [Nieh et al., 1983]
Sulfapyridine , Sulfolane Organic PCC Lab [Srinivasan et al.,
2012]
Carbohydrazide Organic PCC Lab [Fytianos et al.,
2016]
8
Unlike the inorganic inhibitors, the organic corrosion inhibitor forms a thin layer as a
result of physical and/or chemical adsorption onto the metal surface. This thin film layer
acts a barrier between metal and corrosive solution [Kosseim et al., 1984]. In most cases,
the organic inhibitor yields lower corrosion inhibition efficiencies compared to the
inorganic inhibitor.
1.3.1 Environmental regulations
Due to the increasing impact of process effluents over the environment, stringent
environment policies have been developed by governments in all parts of the world for
ecological awareness. The environmental regulations are being enforced by the
continuous monitoring of the process effluent disposed by industry. The North Sea
(United Kingdom, Norway, Denmark, and Netherlands) and the North American
countries have their own sets of environment regulations under various policies. They use
three criteria for considering any chemicals to be environmentally friendly chemicals [Taj
et al., 2006]. These are as follows: 1) toxicity in terms of LC50 (Lethal Concentration) or
EC50 (Effective Concentration) must be greater than 10 mg/L, 2) biodegradation, in 28
days, must be greater than 60% in the North Sea countries, and 3) bioaccumulation in
terms of Log P o/w ( Partition coefficient) must be less than 3.
In UK, the policy does not accept chemicals with carcinogenic and mutagenic
characteristics. Among the above criteria, toxicity plays a key role in the selection of
corrosion inhibitors as it relates to the cost of waste disposal. As the alkanolamine has
been registered under the European Chemicals Agency (ECHA) the production of these
chemicals are expected to increase tenfold by 2050 due to its importance in post-

9
combustion carbon capture [Lag et al., 1984]. As such, environmental standards and
regulations for chemicals use would be strictly monitored.
In the amine-based CO2 absorption process, use of inorganic corrosion inhibitors,
such as vanadium (V) and copper (Cu) leads to the formation of complex compounds
containing dissolved metal ions and inorganic inhibitors, resulting in hazardous reclaimer
waste due to the presence of heavy metal [Thitakamol et al., 2007 ; Léonard et al., 2014].
In addition to the inorganic inhibitors, organic-based inhibitors may not be used due to
their probable connection with toxicity. For instances, despite its inhibition performance,
hydrazine is not used because of carcinogenetic characteristics [Fytianos et al., 2016].
The long aliphatic chains in organic molecules promote corrosion inhibition, but their
toxicity hinders their use in practice [Singh et al., 1996]. Gas emissions from absorbers
also makes things more complicated as the toxicity of used chemicals defines the
maximum permissible concentration limit [Gjernes et al., 2013]. As such, there is a
serious need to find alternative chemicals to control corrosion while complying with the
environment regulations.
1.3.2 Eco-friendly corrosion inhibitors
Global ecological awareness and stringent environment policies of governments
on toxic chemicals have generated a need to replace the toxic chemicals with
environmentally friendly chemicals. Such need has led to a new rapidly growing research
area known as the Green Chemistry or Sustainable Chemistry. Its aim is to reduce or
eliminate the generation of hazardous wastes and replace toxic chemicals with
environmentally friendly ones. As part of this, a new avenue has been created where

10
corrosion inhibitors are derived from the green chemistry. According to the PARCOM
(Paris Commission), the corrosion inhibitor which is non-toxic, readily biodegradable,
and has no bioaccumulation could be termed as the green corrosion inhibitors [Taj et al.,
2006].
1.4 Research Motivation
From plant experience as observed in Table: 1.1, corrosion is one of the most
operational problems in the CO2 absorption process. The corrosion affects not only plant
economy, but also has potential to become one of the key risk factors to initiate
catastrophic industrial accidents. Since the fatal damage to human society by risking
human lives could not be tolerated, the corrosion prevention and control strategies are
considered to be of great importance. Owing to the fact that carbon steel is the preferred
material of construction for the process equipment, the corrosion control using corrosion
inhibitors is an appealing choice. The application of corrosion inhibitors is economical
due to low cost of inhibitors and can be easily integrated to the existing process.
With due diligence and keeping in mind that in the coming years, the amine-based
CO2 absorption process would become major capital investment all around the globe
because of its extensive usage in various applications. The stringent environmental laws
and regulations have been implemented and monitored in most countries. This has put the
use of corrosion inhibitors in the CO2 absorption process in a difficult situation. The
industry is required to implement safer and less hazardous chemical practices to prevent
the generation of toxic wastes. Most corrosion inhibitors that have been used in the CO2
absorption process are not environmentally friendly and could cause unsafe operations.
For instance, sodium metavandate, the conventional corrosion inhibitor, is a heavy metal

11
and highly toxic. Carbohydrazide, the recent corrosion inhibitor tested at the laboratory,
has its own disadvantage as it could explode on heating and proved to be highly toxic.
This has led to serious speculations about the successful possible implementation of the
CO2 absorption process using corrosion inhibitors. Thus, corrosion management using
environmentally friendly corrosion inhibitors is necessary at this moment of time to
tackle corrosion problems and also satisfy the environment regulatory needs. Although
there are intensive database for organic and inorganic corrosion inhibitors used in this
process, there is a still gap of knowledge of eco-friendly corrosion inhibitors to solve
corrosion issues.
1.5 Research Objectives and Scope
The objective of this work was to screen and evaluate effective eco-friendly
corrosion inhibitors for the amine-based CO2 absorption process. Based on the green
chemistry literature [Zaferani et al., 2013], a wide range of plant extracts and food-based
products was reported to perform well as the corrosion inhibitors in various
environments. As such, it is expected that such plant extracts and food-based products
would also be effective in the CO2 absorption process. Thus, five condiments including
powders of garlic, onion, mustard, turmeric, and horseradish were chosen as the tested
inhibitors in this work due to their availability, cost and ease of production in large
volumes.
To evaluate the performance of five condiments, a series of electrochemical
corrosion experiments were carried out in 5.0 kmol/m3 monoethanolamine (MEA)
solutions saturated with CO2 under various test conditions that simulate the operating

12
conditions of the CO2 absorption process. MEA was used to represent the amine solution
and carbon steel 1018 was used to represent the material of equipment and piping in the
CO2 absorption process. Parametric effects, including the effects of dissolved O2,
inhibitor concentration, temperature and process contaminants, on inhibition performance
of the tested inhibitors were examined. In addition, quantum chemical analysis was
performed to gain an understanding of corrosion inhibition mechanism.

13
CHAPTER 2 FUNDAMENTALS AND LITERATURE REVIEW
2.1 Corrosion of Metals
Corrosion is an electrochemical reaction through which a material deteriorates
due to its interaction with the environment. Metal could be considered as electrodes while
the ionically conducting liquid is the electrolyte for the reaction. The two electrochemical
reactions related with the electrode are anodic and cathodic reaction, respectively. They
may involve either oxidation or reduction reactions which lead to the formation of
charged species, i.e., ions. Due to these reactions, the metal deteriorates, leading to the
formation of corrosion products which may be soluble or solid. Oxidation reaction taking
place at anode is known as anodic reaction, i.e., loss of electrons from the metal state
resulting in an increase in valence. As a result, electron is released into the electrolyte. At
cathode, reduction reaction takes place, i.e., accepting electrons from metal resulting in a
decrease in valence is known as cathodic reaction. These reactions occur as evolution
reactions as water is normally the electrolyte involved.
Anodic reaction: Metal → Metal2+ + 2e- (2.1)
Cathodic reaction: 2e- + 2H+ → H2 (2.2)
Corrosion could be prevented when the primary corrosion causing agent or
reactions related with that could be either averted or minimized. Also, it could be
prevented through adsorption of chemical species over the metal surface. This chemical
species is transported from electrolyte to metal mainly by diffusion. Thus, anodic
dissolution reaction occurring at the metal surface could be prevented due to adsorption
of these metal ions [Shaw et al., 2003].
14
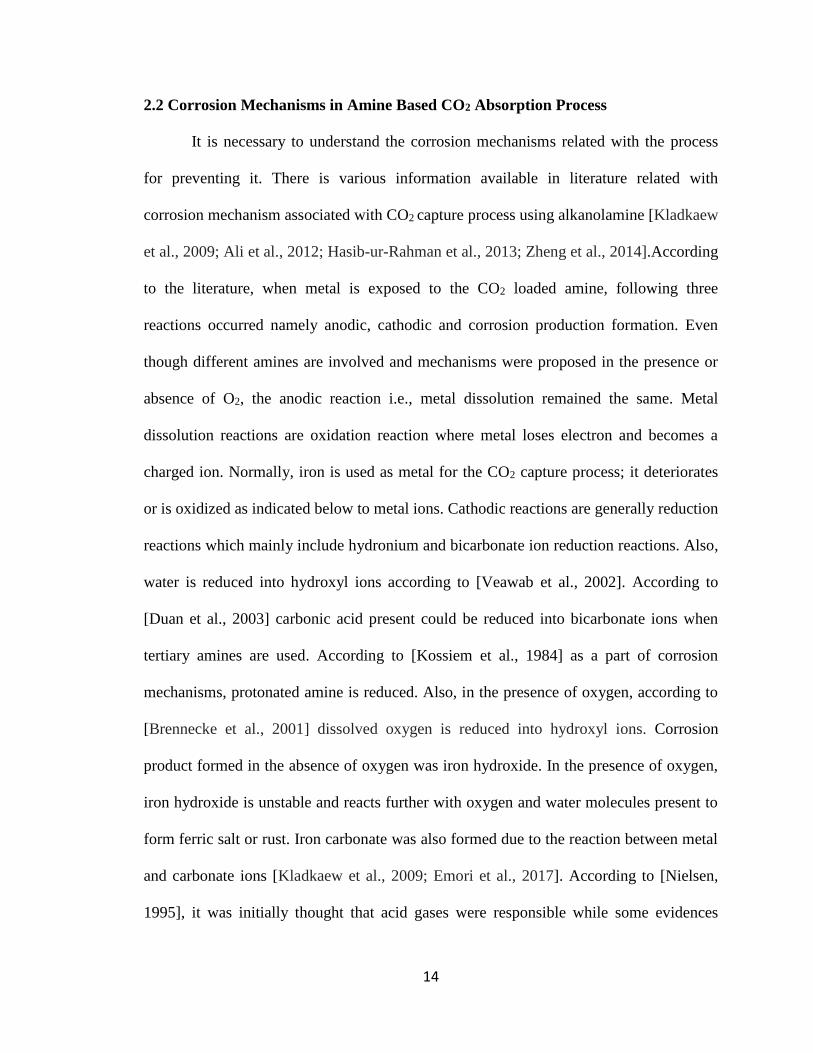
2.2 Corrosion Mechanisms in Amine Based CO2 Absorption Process
It is necessary to understand the corrosion mechanisms related with the process
for preventing it. There is various information available in literature related with
corrosion mechanism associated with CO2 capture process using alkanolamine [Kladkaew
et al., 2009; Ali et al., 2012; Hasib-ur-Rahman et al., 2013; Zheng et al., 2014].According
to the literature, when metal is exposed to the CO2 loaded amine, following three
reactions occurred namely anodic, cathodic and corrosion production formation. Even
though different amines are involved and mechanisms were proposed in the presence or
absence of O2, the anodic reaction i.e., metal dissolution remained the same. Metal
dissolution reactions are oxidation reaction where metal loses electron and becomes a
charged ion. Normally, iron is used as metal for the CO2 capture process; it deteriorates
or is oxidized as indicated below to metal ions. Cathodic reactions are generally reduction
reactions which mainly include hydronium and bicarbonate ion reduction reactions. Also,
water is reduced into hydroxyl ions according to [Veawab et al., 2002]. According to
[Duan et al., 2003] carbonic acid present could be reduced into bicarbonate ions when
tertiary amines are used. According to [Kossiem et al., 1984] as a part of corrosion
mechanisms, protonated amine is reduced. Also, in the presence of oxygen, according to
[Brennecke et al., 2001] dissolved oxygen is reduced into hydroxyl ions. Corrosion
product formed in the absence of oxygen was iron hydroxide. In the presence of oxygen,
iron hydroxide is unstable and reacts further with oxygen and water molecules present to
form ferric salt or rust. Iron carbonate was also formed due to the reaction between metal
and carbonate ions [Kladkaew et al., 2009; Emori et al., 2017]. According to [Nielsen,
1995], it was initially thought that acid gases were responsible while some evidences

15
pointed towards bicarbonate or carbonate ions. It was very unclear and difficult to find
out the cathodic reactions responsible for corrosion process. However, there are reports
related such as type of amine, amine concentration and other factors affecting corrosion
in CO2 capture process.
Dissolution of iron/anodic reaction: Fe ↔Fe2++2e- (2.3)
Hydronium ion reduction: 2H3O++2e- ↔2H2O+H2 (2.4)
Bicarbonate ion reduction: 2HCO3-+2e- ↔ 2CO3
2-+H2 (2.5)
Undissociated water reduction: 2H2O + 2e- ↔2OH-+H2 (2.6)
Carbonic acid reduction: 2H2CO3 + 2e- ↔2HCO3-+H2 (2.7)
Protonated amine reduction: RNH2+ 2e- ↔RNH+ H2 (2.8)
Dissolved O2 reduction: O2+2H2O ↔ 4 OH- (2.9)
Iron hydroxide formation: Fe2++2OH- ↔Fe (OH)2 (2.10)
Iron Oxide formation: 2Fe (OH) 2+H2O + ½ O2 ↔ 2Fe (OH)3 (2.11)
Iron carbonate formation: Fe2++CO3
2- ↔ FeCO3 (2.12)
where H2O, H3O+, OH-, HCO3
-, CO32-, RH3, RNH2, RNHCOOH, Fe,H2CO3,Fe(OH)2,
Fe(OH)3, and Fe2CO3 are representing water, hydronium ion, hydroxyl ion, bicarbonate
ion, carbonate ion, amines, carbamic acid, Iron, carbonic acid, iron hydroxide, iron oxide,
and iron carbonate, respectively.
2.3 Factors Affecting Corrosion
Corrosion in the amine-based CO2 capture process is influenced by type of amine,
amine concentration, CO2 loading of amine solution, O2 in feed gas, temperature of the
systems and heat stable salts (HSS).
16
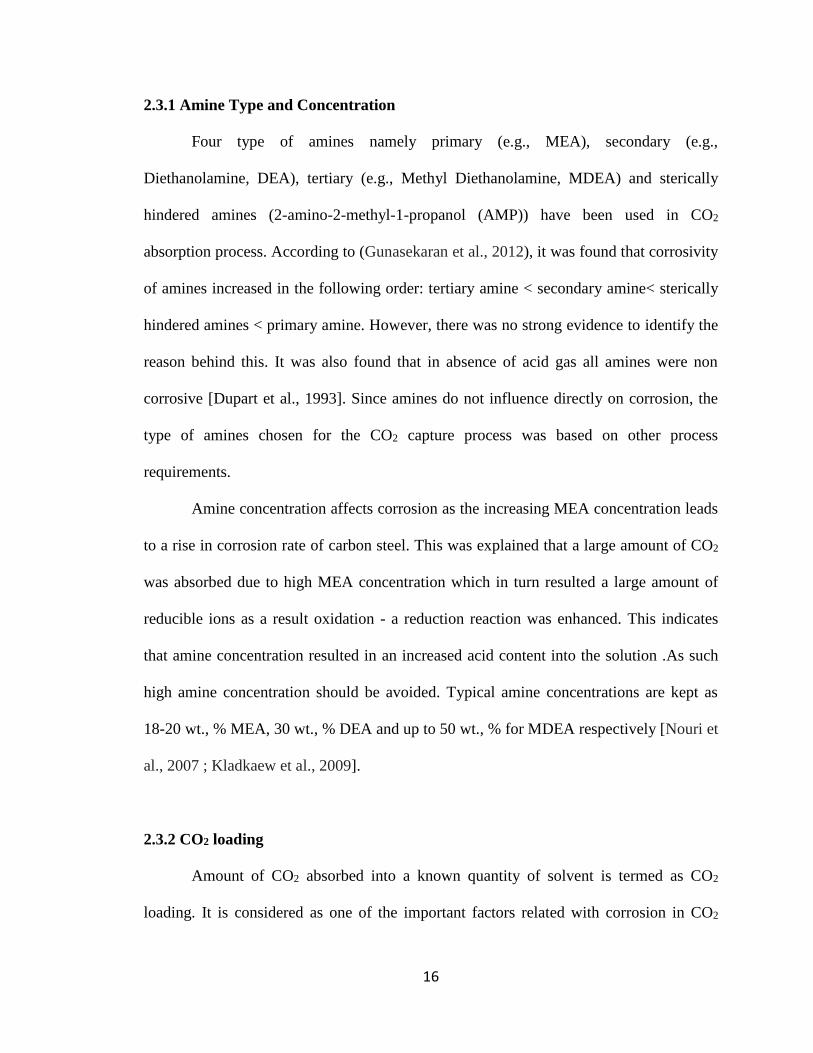
2.3.1 Amine Type and Concentration
Four type of amines namely primary (e.g., MEA), secondary (e.g.,
Diethanolamine, DEA), tertiary (e.g., Methyl Diethanolamine, MDEA) and sterically
hindered amines (2-amino-2-methyl-1-propanol (AMP)) have been used in CO2
absorption process. According to (Gunasekaran et al., 2012), it was found that corrosivity
of amines increased in the following order: tertiary amine < secondary amine< sterically
hindered amines < primary amine. However, there was no strong evidence to identify the
reason behind this. It was also found that in absence of acid gas all amines were non
corrosive [Dupart et al., 1993]. Since amines do not influence directly on corrosion, the
type of amines chosen for the CO2 capture process was based on other process
requirements.
Amine concentration affects corrosion as the increasing MEA concentration leads
to a rise in corrosion rate of carbon steel. This was explained that a large amount of CO2
was absorbed due to high MEA concentration which in turn resulted a large amount of
reducible ions as a result oxidation - a reduction reaction was enhanced. This indicates
that amine concentration resulted in an increased acid content into the solution .As such
high amine concentration should be avoided. Typical amine concentrations are kept as
18-20 wt., % MEA, 30 wt., % DEA and up to 50 wt., % for MDEA respectively [Nouri et
al., 2007 ; Kladkaew et al., 2009].
2.3.2 CO2 loading
Amount of CO2 absorbed into a known quantity of solvent is termed as CO2
loading. It is considered as one of the important factors related with corrosion in CO2
17
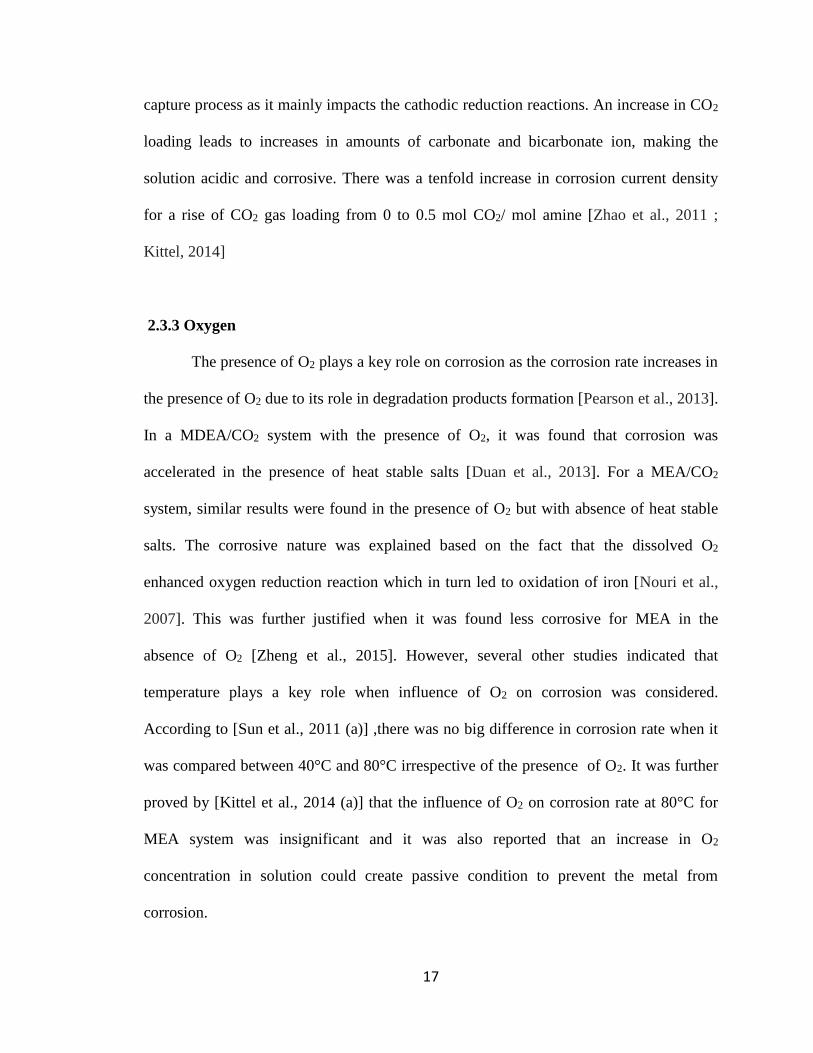
capture process as it mainly impacts the cathodic reduction reactions. An increase in CO2
loading leads to increases in amounts of carbonate and bicarbonate ion, making the
solution acidic and corrosive. There was a tenfold increase in corrosion current density
for a rise of CO2 gas loading from 0 to 0.5 mol CO2/ mol amine [Zhao et al., 2011 ;
Kittel, 2014]
2.3.3 Oxygen
The presence of O2 plays a key role on corrosion as the corrosion rate increases in
the presence of O2 due to its role in degradation products formation [Pearson et al., 2013].
In a MDEA/CO2 system with the presence of O2, it was found that corrosion was
accelerated in the presence of heat stable salts [Duan et al., 2013]. For a MEA/CO2
system, similar results were found in the presence of O2 but with absence of heat stable
salts. The corrosive nature was explained based on the fact that the dissolved O2
enhanced oxygen reduction reaction which in turn led to oxidation of iron [Nouri et al.,
2007]. This was further justified when it was found less corrosive for MEA in the
absence of O2 [Zheng et al., 2015]. However, several other studies indicated that
temperature plays a key role when influence of O2 on corrosion was considered.
According to [Sun et al., 2011 (a)] ,there was no big difference in corrosion rate when it
was compared between 40°C and 80°C irrespective of the presence of O2. It was further
proved by [Kittel et al., 2014 (a)] that the influence of O2 on corrosion rate at 80°C for
MEA system was insignificant and it was also reported that an increase in O2
concentration in solution could create passive condition to prevent the metal from
corrosion.

18
2.3.4 Operating temperature
Most electrochemical reactions are thermally activated, on this account, corrosion
rate increases with temperature. This was further justified from the report of [Ali et al.,
2011 (a)], that a higher anodic current density was observed when the temperature was
increased from 40 to 80°C due to the shift of corrosion potential towards active
directions, and anodic metal dissolution.
2.3.5 Heat stable salts (HSS)
Heat stable salts (HSS) such as formate, sulfate, oxalate and chloride are formed
when amines reacts with acids stronger than CO2 .HSS are thermally irreversible and
cannot be regenerated and also increase corrosion rate of the process by increasing
conductivity and lowering pH of the amine solution [Nielsen et al., 1995].According to
[Nouri et al., 2007], the heat stable salt content in amine solution should be limited to 1-2
wt., % to maintain free amine concentration.
2.4 Corrosion Inhibitors Classification
Corrosion inhibitors could be classified based on their mode of blocking the
corrosion reactions or mechanisms or chemistry. Generally, in applications perspective,
they are classified based on their mode of blocking corrosion reactions into three
categories known as anodic, cathodic, and mixed corrosion inhibitors. Anodic corrosion
inhibitors affect anodic reactions to prevent corrosion are known as passivation
inhibitors. Common anodic inhibitors contain ions such as chromate, nitrite and

19
orthophosphate. In CO2 absorption process using alkanolamine, sodium metavandate an
anodic corrosion inhibitor is used to shift the potential and promote passivation resulting
in formation of passive layer over the anodic metal surface and retardation of metal
dissolution reaction. Cathodic corrosion inhibitors act as a barrier in preventing cathodic
corrosion reactions to take place. They achieve this by shifting pH of the solution towards
alkaline forming precipitates, thus reducing sites available for cathodic reaction. In
addition, the cathodic inhibitors can block the diffusion of ions between anodic and
cathodic sites and forming layers over the metal surface. Examples of cathodic corrosion
inhibitors are selenides, arsenic and polyphosphates [Anbarasi et al., 2013]. Majority of
corrosion inhibitors falls under the mixed category as they neither affect anodic or
cathodic corrosion reactions alone, rather affect them both. The mode of inhibition
mechanism for this type of inhibitors is through adsorption at metal solution interface
either through stable bond (chemisorption) or by simply blocking the reaction sites (i.e.,
Physisorption). Because of this nature, they are also known as adsorption inhibitors while
their efficiency is purely based on metal surface coverage [Osokogwu et al., 2012]. This
classification could be done with the help of data obtained from electrochemical
techniques such as open circuit potential (OCP) and observing the shift in Tafel slopes
and current density.
2.5 Green Corrosion Inhibitors
Molasses and vegetable oils used as corrosion inhibitors for acid pickling is the
first patent in corrosion inhibitors category [Putilova et al., 1960] dating back to 1960s.
Then toxic inorganic inhibitors were used for corrosion prevention because of their high

20
efficiency. Due to toxicity and other environment regulations forced the shift towards
developing alternate inorganic corrosion inhibitors. This led to the development of
organic corrosion inhibitors for various corrosion-prone processes. However, they were
not able to meet the requirements for a green ecofriendly demand. Thus, the focus has
been shifted now towards green corrosion inhibitors. According to PARCOM (Paris
Commission), the corrosion inhibitor which is readily biodegradable with no
bioaccumulation and also nontoxic could be termed as green corrosion inhibitors [Frenier
et al., 2000]. Green corrosion inhibitors normally perform the inhibition mechanism by
being adsorbed over the metal surface through either physical or chemical adsorption and
then affect the corrosion reactions .Also, the electric resistance of the solution is
increased by this inhibition mechanism protecting the metal surface from corrosion.
Table 2.1 provides information about the green corrosion inhibitors used for protecting
steel in various corrosive environment. The table mainly focuses on protecting steel in
acidic conditions because it has been reported in various corrosion studies that acidic pH
indicates the most corrosive condition. Even though, in other corrosion environments,
various natural products have been tested and performed well as green corrosion
inhibitors, those kinds of reports have been found lacking for CO2 absorption process.
Developing a green corrosion inhibitor is really a challenging task and requires
the knowledge obtained from the mechanisms of standard corrosion inhibitors used in
that process. Also, factors like availability and cost play an important role in the selection
of green corrosion inhibitor. The following information about the corrosion products and
corrosion inhibitors used in CO2 absorption process environment using alkanolamine
would be really useful. FeCO3 and FeS are the corrosion products formed due to

21
corrosion. It was found that FeS formed over the metal surface acted as a protected film
when carbon steel was immersed in DEA solution [Garcia-Arriaga et al., 2010]. FeS was
found effective and performed well when amines were changed and carbon steel was
immersed in MDEA solutions [Emori et al., 2017]. On the other hand, FeCO3 was found
ineffective to form a protective film, while FeS performed very well and protected the
metal from further corrosion [Nouri et al., 2007]. Because of superior electron donating
ability than nitrogen or oxygen, sulfur containing compounds were found to be effective
corrosion inhibitors. [Hackerman et al., 1954; Khaled et al., 2003]. Also, in natural gas
solutions, sulfur may inhibit corrosion [Emori et al., 2007], while metal thiocyanate was
found as effective corrosion inhibitors in alkanolamine plants [Rooney et al., 2000]. 2-
mercaptobenzimidazole was used as corrosion inhibitor and found effective up to 80° C
for carbon steel in 5 M MEA solutions CO2 absorption process. [Zheng et al.,
2015].Based on this information from the inorganic corrosion inhibitors, it was found that
corrosion inhibition depends largely on electron donating ability of atoms present in the
compounds. Therefore, it could be assumed that sulfur containing natural compounds
could be used as green corrosion inhibitors.
2.6 Criteria for Classification of Inhibitors
2.6.1 Open circuit potential (OCP)
When an inhibitor is added to a corrosive solution, generally there would be a
shift in corrosion potential compared to that of blank solution without inhibitors. If this
displacement on comparison with blank solution is more than 85 mV, then it could be

22
Table 2.1 Green corrosion inhibitors for protecting steel in various corrosive environments
Inhibitor Corrosive Environment Adsorption Type References
Aloe Vera
Multiphase environment with
CO2 gas, sand and brine
solution
- [Ige et al., 2012]
Garlic Peel Extract 1 M HCl Chemisorption [Pereira et al., 2012]
Garcinia Kola Seed 2 M HCl and 1 M H2SO4 Physical adsorption [Oguzie et al., 2007]
Musa sapientum peels H2SO4 Physical adsorption [Africa et al., 2008]
henna (law Sonia) 1 M HCl Chemisorption [Ostovari et al., 2009]
Khillah (Ammi visnaga) seeds 2 M HCl Chemisorption [El-Etre et al., 2006]
Natural Mimosa tannin H2SO4 Chemisorption [Martinez et al., 2002]
Zenthoxylum alatum plant
extract 1 M HCl Chemisorption [Chauhan et al., 2007]
Tryptamine 0.5 M H2SO4 Chemisorption [Moretti et al., 2004]
Olive Leaves 2 M HCl Physical adsorption [El-Etre et al., 2006]
Berberine 1 M H2SO4 Chemisorption [Li et al., 2005]
G.Kola 1 M HCl Physical adsorption [Oguzie et al., 2007]
Alizarin yellow GG 2 M H2SO4 Physical adsorption [Ebenso et al., 2008]
J. Gendarussa extract 1 M HCl Physical adsorption [Satapathy et al., 2009]
Fenugreek Leaves H2SO4 Chemisorption [Noor et al., 2007]
P.Amarus 2 M HCl Chemisorption [Okafor et al., 2008]
Pennyroyal mint 1 M HCl Physical adsorption [Bouyanzer et al., 2006]
Methylene Blue (MB) 2 M HCl Physical adsorption [Oguzie et al., 2007]
Caffeic Acid 0.1 M H2SO4 Chemisorption [de Souza et al., 2009]

23
called as anodic or cathodic inhibitor based on their shift direction., i.e., the difference is
in negative sign and it could be termed as anodic inhibitors, whereas vice versa for
cathodic inhibitors [Riggs et al., 1973 ; Ferreira, 2004]. If the difference is in potential
displacement is less than 25 mV, then those inhibitors could be termed as “modest”
anodic/cathodic corrosion inhibitors [Zheng et al., 2015].
2.6.2 Tafel slopes
On comparing Tafel slopes (βa and βc) of an inhibited solution with that of blank
solution, the inhibitors could be classified either as anodic, cathodic or mixed inhibitor.
When there is no change in Tafel slopes after the addition of inhibitor on comparison
with blank solution, the inhibition mechanism could be due to geometric blocking effect,
i.e., an inhibitor simply blocks the reaction sites on the metal surface, thus decreasing the
available reaction area and it neither affects cathodic or anodic corrosion reaction [Shukla
et al., 2009]. If there is a shift in anodic Tafel slope (βa),while cathodic Tafel slope (βc)
remains same of inhibited solution on comparison with blank solution , the inhibitor
could be termed as anodic and could be assumed affecting the anodic metal dissolution
reaction. For cathodic corrosion inhibitor the criteria are reverse, i.e., cathodic Tafel slope
(βc) varies for inhibited solution on comparison with blank solution whereas anodic Tafel
slope (βa) remains constant. For the mixed inhibitors, shifts on both tafel slopes (βa and
βc) are observed indicating the corrosion inhibition affects both side of corrosion
reactions. [De Souza et al., 2009]

24
2.7 Adsorption
Adsorption is a surface phenomenon where molecules adsorb onto the surface
either through physical or chemical attraction. Performance of corrosion inhibitors is
attributed by adsorption performance of an inhibitor onto the metal surface or interaction
between the inhibitor and the surface and it is classified into two types: namely physical
and chemical adsorption [Jain et al., 1976]
2.7.1 Physical adsorption
The adsorbed molecules attach onto the surface through weak physical attraction
forces known as Van der Waal’s making adsorption of molecules reversible and it
requires less enthalpy to break the bond and retain the interface to its initial state. This
adsorption process increases with a rise in pressure or concentration of adsorbed
molecule while decreases with a rise in temperature. This adsorption occurs in multilayer
and also requires less activation energy for establishing equilibrium. No byproducts are
formed as a result of this type of adsorption [Jain et al., 1976; Atkins et al., 2011].
2.7.2 Chemical adsorption
Chemical reaction occurs between the adsorbed molecules and the metal surface
leading to formation of covalent bands. As a result, surface products are formed and
make the adsorption irreversible. This kind of adsorption requires high activation energy
and time to attain the equilibrium. The adsorption process decreases with an increase in
pressure or concentration of adsorbed molecule while increases with a rise in

25
temperature. This adsorption occurs in monolayer but the forces of attraction are strong.
Chemisorption is said to be an exothermic process [Jain et al., 1976 ; Atkins et al., 2011].
2.8 Adsorption Isotherm
Adsorption is a surface phenomenon. In adsorption, some materials (adsorbate)
from a concentrated source such as bulk vapor or liquid phase gets attached onto the
surface of a solid surface (adsorbent). When a plot is made to understand the amount of
adsorbed as a function of the partial pressure or a concentration at a given temperature is
defined as adsorption isotherm [Adamson et al., 1990]. As the interaction between
inhibitor molecule and the metal surface determines degree of inhibition .Adsorption
isotherms could be used as it relates the amount of inhibitor (or surface coverage)
adsorbed over the metal surface with the inhibitor concentration. Adsorption isotherms
are helpful to understand better about the corrosion mechanism, adsorption equilibrium
constant and surface coverage [Desimone et al., 2011; Manimegalai et al., 2015; Yilmaz
et al., 2016]. The surface coverage (Θ) for corrosion inhibitors [Zhang et al., 2015] is
given by the following equation:
100
(2.13)
where ŋ is inhibition efficiency. Various isotherm models such as Langmuir, Temkin and
Frumkin adsorption isotherms are available for fitting the data related with corrosion
inhibitors.
2.8.1 Langmuir isotherm
This assumes that there is no interaction between adsorbed molecules, and the
metal surface is uniform where all the adsorption occurs through the same mechanism.

26
This kind of isotherm mainly emphasizes chemisorption with some exceptions [Paul et
al., 2012; Kıcır et al., 2016] Langmuir adsorption isotherm is expressed below:
1cc
k
(2.14)
where, c is inhibitor concentration and k is the adsorption equilibrium constant.
2.8.2 Temkin isotherm
This assumes that there is a molecular interaction between adsorbed molecules and
metal surface, resulting in a protecting layer which is non uniform. According to this
isotherm, adsorption heat of all those molecules in the layer decreases with an increase in
coverage. This is valid when Θ is between 0.2 - 0.8 [Paul et al., 2012; Nwabanne et al.,
2012; Nnanna et al., 2013] Temkin adsorption isotherm takes the following form:
2.303log 2.303log
2 2
k c
a a
(2.15)
where, a is the attractive parameter.
2.8.3 Frumkin isotherm
It is based on the assumption that the metal surface is heterogeneous and also takes
lateral interaction between adsorbed inhibitor and metal into account. It also considers
multi molecular layer adsorption and has advantages over other isotherms when
explaining about equilibrium [Sharma et al., 2010; Paul et al., 2012; Al-Mhyawi et al.,
2014]. It is given by the following equation:
log 2.303log 21
c k
(2.16)

27
where, α is lateral interaction term.
The adsorption isotherm models are plotted in Figure 2.1 to represent the above
discussed isotherm models and indicate how the parameters can be obtained from the
plots. For example, an equilibrium adsorption constant (k) can be obtained. The k value is
used for determining the type of adsorption, i.e., physical or chemical adsorption.
According to literature [Desimone et al., 2011; Yilmaz et al., 2016 ], when k value
decreases with a rise in temperature, the interaction between inhibitor molecules and the
metal surface is not flexible and its force is strong due to structural formation over the
metal surface.
2.9 Standard Free Energy of Adsorption
Standard free energy of adsorption (ΔG°ads) could be calculated from k using the
following equation,
ln(1000 )adsG Rt k (2.17)
where R is the Universal gas constant (KJ mol-1 K-1), t is the temperature (K), 1000:
molar concentration of water (gL-1). It should be noted that, to have a correct ΔG°ads it is
necessary to use same concentration unit for both water molecules in the above
expression with that of inhibitor concentration. Generally, the common mistake
committed would be using 55.5 mol/L as concentration of water, while the inhibitor
concentration expressed in different units such as mass/volume or volume/volume %
[Noor et al., 2009; Mourya et al., 2014]. Based on the following fact about ΔG°ads , type
of adsorption could be found out as the interaction between metal surface and inhibitor
molecules are electrostatic and known as physical adsorption when ΔG°ads values is -20
KJ mol-1 or more positive. While ΔG°ads is -40 KJ mol-1 or more negative, it could be said

28
(a)
(b)
(c)
Figure 2-1 Adsorption isotherm models: (a) Langmuir isotherm, (b) Temkin isotherm, and
(c) Frumkin Isotherm
c (g/L)
c /
Θ
log c (g/L)
Θ
Θ
log1
c
29
that adsorption between metal surface and inhibitor is due to electron transfer and
formation of covalent bonds. On the other hand, when ΔG°ads values are found between -
20 KJ mol-1 and -40 KJ mol-1, it could be said that adsorption is of mixed type (both
chemisorption and physisorption occurs) [Atkins et al., 2010; Kıcır et al., 2016].
2.10 Arrhenius Plots
Temperature plays a key role in the performance of corrosion inhibitor which
indicates the Arrhenius type of dependence. For example, with an increase in
temperature, there was an exponential increase in corrosion rate in acid solutions due to
the decrease in hydrogen evolution over potential [Popova et al., 2003]. Apparent
activation energy (Ea) could be calculated using the following Arrhenius equation and
Tafel extrapolation method,
log log2.303
acorr
Ei A
Rt (2.18)
where icorr is corrosion current density (A/cm2), Ea is activation energy (KJ/mol), A is
Arrhenius pre-exponential constant. Arrhenius Plots (Type I) were made by plotting
Log icorr against (1
𝑇) (Lebrini, 2011) to produce a straight line as shown in Figure 2.2.
Inhibitors could be further classified into three groups based on its relation with
Ea and inhibition efficiency. They are as follows: (1) With an increase in temperature,
inhibition efficiency decreases and for those inhibitors Ea of inhibited solution was found
to be greater than that of uninhibited solution; (2) No change in inhibition efficiency
irrespective of the change in temperature and for those cases Ea remains same for
inhibited and uninhibited solutions; and (3) Those inhibitors whose inhibition efficiency

30
(a)
(b)
Figure 2-2 Arrhenius Plots: (a) Type I (b) Type II
1/ T (K-1
)
log i
corr
(A/c
m2)
1/ T (K-1
)
log i
corr
/T (
A /
cm2.K
)
31
increases with increase in temperature, Ea of inhibited solution is smaller than that of
uninhibited solution [Radovici et al., 1965].
From Ea values, lot of information related with adsorption type could be inferred
as it indicates the energy barrier related with corrosion process. If Ea value in the
presence of inhibitor was low on comparison with that of the uninhibited solution, it
indicates chemisorption as the energy barrier of corrosion process decreased in the
presence of inhibitor. If Ea in the presence of inhibitor is higher than Ea of the uninhibited
solution then it indicates physisorption as it could be assumed that physical barrier is
formed by formation of adsorptive film of electrostatic nature over the metal surface
reducing the corrosion rate [de Souza et al.,2009 ; Mourya et al.,2014].
2.11 Thermodynamic Properties
The Arrhenius Equation could be expressed as follows [Lebrini et al., 2011]:
exp expa a
corrRt S H
iNh R Rt
(2.19)
where N is Avogadro’s number, h is Planck’s constant, ΔSa is entropy of activation, ΔHa
is enthalpy of activation. When logcorri
t
was plotted against 1
t
straight lines as
Arrhenius Plot (Type: II) are obtained as shown in Figure 2.2. Showing the intercept as
log2.303
aR S
Nh R
and slope as
aH
R
. From this, thermodynamic properties such
as ΔSa and ΔHa could be found.
When ΔHa is negative, inhibitor adsorption is an exothermic process signifying
either physisorption or chemisorption. While ΔHa is positive it reflects inhibitor
32
adsorption is an endothermic process. Endothermic process is generally chemisorption
for inhibition phenomenon [Singh et al., 2010; Lebrini et al., 2011]. For electrolytic
solutions, Ea should be ideally equal to ΔHa for chemical reactions [Mourya et al.,
2014].If ΔSa of inhibited solution is higher than that of uninhibited solution, then it could
be due to the increase in disorder as a result of shift in adsorption from reactants present
in inhibitors to form adsorption complex. On the other hand, if ΔSa of inhibited solution is
lower than that of uninhibited solution, it is due to the ordering of adsorbed molecules in
the presence of inhibitor [Mourya, 2014 & Lebrini, 2011].
2.12 Electrochemical Impedance Analysis
Electrochemical impedance technique provides mechanistic information of a
corrosion using the frequency-dependent response relationship of corrosion process. This
is useful for evaluating corrosion inhibitor performance through impedance diagrams
such as Nyquist plots and Bode-phase angle plots. From Figure 2.3(a), metal and solution
interface properties such as resistance and capacitance are revealed based on size and
shape of curves obtained.
When a depressed semicircle is observed in the Nyquist plot, indicating surface
heterogeneity due to metal surface roughness, resulting in frequency dispersion
attributing to one of the characteristics of solid electrode [Lebrini et al., 2011 & Zhang et
al., 2015] and a non – ideal electrochemical behavior for the metal solution interface.
When the Nyquist plot of an inhibited solution is compared with that of an uninhibited
solution, if there was a change in shape of the semicircle, it could be said that the
mechanism of corrosion process is altered due to the presence of corrosion inhibitor.

33
(a)
(b)
Figure 2-3 : (a) Nyquist plot (b) Bode-phase angle plot along with its typical equivalent
electrical circuit.
Zreal
(ohms)
Zim
ag (
oh
ms)
Frequency
low high
R1 R
2
Frequency (Hz)
Phas
e an
gle
of
Z (
deg
ree)
CPE

34
If the shape of semicircle remains the same but its size changes, it indicates no change in
corrosion mechanism with change in magnitude of anodic and cathodic reaction rate
[Singh et al., 2012; Zhang et al., 2015].
Bode-phase angle plots as shown in Figure 2.3(b) the influence of inhibitor
concentration can be examined. For example, when a single narrow peak was observed in
the Bode-phase plot, it indicates that the corrosion process has a single time constant
while the increase in height of the peak could be attributed due to the presence of
inhibitor molecules and capacitive nature of the metal solution interface [Mourya et al.,
2014]. From the Nyquist plots, charge transfer resistance (Rp) could be obtained from the
difference in impedance values at lower and higher frequencies [Torres et al., 2011].
The double layer capacitance (Cdl) can be calculated using the following relation
[Ferreira, 2016].
max
1
2dl
p
Cf R
(2.20)
where fmax is the frequency at which imaginary component (Y axis) is maximum for a
Nyquist plot. The relationship between Rp and Cdl plays a key role when influence of
inhibitor concentration is investigated. The fact that there was a reverse dependence
observed between Rp and Cdl results in decreasing Cdl, and it indicates the adsorption of
corrosion inhibitors over the metal surface forming a protective film. When Cdl decreases
with increase in inhibitor concentration, it could be due to an increase in thickness of
protective film by reducing the local dielectric constant of the electrical double layer at
metal-solution interface [de Souza et al., 2009; Zheng et al., 2015].
Generally, a corrosion process can be represented as electrical circuit. As the
double layer at the metal-solution interface does not act as a capacitor or resistor, it is

35
replaced by an imaginary element known as the constant phase element (CPE) which can
provide the electrical circuit with an accurate fit and represent parameters related to mass
transfer and energy barrier related with the corrosion process. However, the CPE is
complicated in terms of physical interpretation with various parameters associated with it.
A typical fit for the results obtained from Bode-phase plots is shown in Figure 2.3(b).
The (ZCPE) impedance related with CPE is given by following relation as follows,
ZCPE = Y0-1(jω)-n (2.21)
where Y0 is proportionality coefficient, ω is angular frequency (rad s-1), j is imaginary
number (j2 is -1), and n is exponent used to measure surface inhomogenitiy and related to
the phase shift. The CPE turns into different electrical circuits based on its value of n.
The CPE becomes capacitor, inductor, resistor and Warburg impedance when n is 1,-1, 0,
and 0.5 respectively, (Lebrini et al., 2011; Yadav et al., 2012).
2.13 Theoretical Quantum Chemical Methods
Generally, traditional experimental methods such as weight loss and
electrochemical techniques such as poteniodynamic polarization and electrochemical
impedance are used to evaluate the performance of corrosion inhibitors. Due to time
constraints and cost effectiveness, computer simulation using quantum corrosion
electrochemistry is used as an advanced tool. Quantum chemical methods have been used
by researchers since 1990s to investigate corrosion inhibitors based on their structures.
These methods relate inhibition efficiency with molecular structure and other related
parameters of corrosion inhibitor. For performing these quantum calculations, various
semi-empirical methods have been developed such as PM6 (parameterized model number
36
6), AM1 (Austin model 1), and MNDO (modified neglect of diatomic overlap). Among
these methods, due to the advantage of its accuracy and providing information on
complex molecules at very cheap cost, density functional theory (DFT) has garnered
attention and used as quantum theoretical method in most of the cases [Becke et al.,
1993] is based on Hohenberg–Kohn theorem with electron density as the fundamental
parameter instead of a single electron wave function for expressing the chemical
quantities of the system [Lee, 1988 & Hohenberg, 1964]. The electron density could
reduce the complexity and simplify the many-bodied Schrodinger equation. The DFT is
helpful to simulate even complex molecules to obtain information related with properties,
structure, reactivity, and dynamics for better understanding of reaction mechanisms
[Lesar et al., 2009]. Corrosion inhibitors are adsorbed over metal surface; the DFT can be
used to explain the inhibitor mechanism through analysis of interaction of inhibitor and
the metal surface [Masoud et al., 2010]. Inhibition efficiency is correlated and
rationalized with chemical indices through DFT using the frontier orbital theory [Parr et
al., 1989].
Corrosion inhibition through adsorption over the metal surface is due to the
exchange of electrons from inhibitor molecules through interactions to fill the vacant
spots in the metal surface atoms [Khalil et al., 2003]; this can be also explained in terms
of reactivity through frontier orbital concepts. The selectivity of the chemical reactions
and the ease of interactions are governed by the Lowest Unoccupied Molecular Orbital
Energy (ELUMO), Energy gap (ΔE), Highest Occupied Molecular Orbital Energy (EHOMO),
dipole moment and electron transfer factor (ΔN) [Fukui et al., 1982].

37
EHOMO indicates the electron donating tendency of inhibitor molecules (i.e., donor)
to metal surface (i.e., acceptor) which has a low energy or an empty molecular orbital.
For high inhibition efficiency, EHOMO values should be high to promote adsorption of
inhibitor molecules over the metal surface [Khaled et al., 2008]. The ionization potential
(I) of the molecule is directly related to EHOMO [Gece et al., 2008] as follows:
I = - EHOMO (2.22)
ELUMO denotes the ability of acceptor (metal) to accept electrons from the donor
(i.e., inhibitor) molecules in their vacant orbitals. The ELUMO values should be low for
high inhibition efficiencies and it is directly related to the electron affinity (A) as follows,
A= - ELUMO (2.23)
Electro negativity (χ) for any system is constant and based on mulliken electro
negativity it [Pearson et al., 1988] is given by the following relation.
( )
2
I A
(2.24)
whereas absolute hardness (ŋh) is a variable and has different values. It can be expressed
as:
( )
2h
I A
(2.25)
As the electron transfer is driven due to the difference in electro-negativity of
inhibitor and metal surface molecules, hardness denotes the resistance to this transfer. As
such hard molecules are characterized with low polarizability and small atomic radius.
While, global softness (σ) is simply the inverse of hardness as shown below:
1
h
(2.26)

38
Soft molecules are characterized as high polarizability and low electro-negativity
[Sastri et al., 2001]. Since there is a transfer of electrons due to the interaction of
corrosion inhibitor over the metal surface, the number of electrons transferred (ΔN) could
be calculated using the following relation,
2( )
m i
m i
N
(2.27)
where χm and χi are electro negativity of metal and corrosion inhibitor respectively and
ŋm and ŋi is absolute hardness of metal and corrosion inhibitor, respectively.
In terms of orbital theory, this electron transfer could be described through energy
gap (ΔE) of the molecule based on the fact that, due to electron transfer in a lower
chemical potential, there is a decrease in energy levels. Reactivity of the corrosion
inhibitor molecule is obtained from this ΔE when the adsorption of the inhibitor molecule
over the metal surface occurs [Obi-Egbedi et al., 2011].
In terms of EHOMO and ELUMO, ΔE is given by the following relation,
ΔE = ELUMO - EHOMO (2.28)
Reactivity is inversely proportional to ΔE as less energy is required for the electron
transfer from inhibitor molecules to the vacant spots in metal surface orbital. Apart from
this, hardness (ŋ) and softness (χ) could be explained in terms of ΔE: Large ΔE results in
hard molecules due to large EHOMO and ELUMO gap with high stability. While soft
molecule has low ΔE due to small EHOMO and ELUMO gap with easier polarizability.
Inhibition efficiency is high when the reactivity of inhibitor molecules is high.i.e. ΔE
should be low. This was proved during the evaluation of Xanthione inhibitors based on

39
their inhibition efficiency performance [Obi-Egbedi et al., 2001] using DFT method and
these concepts.
Polarity of a molecule can be used to relate to inhibition performance using the
dipole moment (µ) which arises due to the non-uniform distribution of polarity charges
on atoms present in molecules. It was found that adsorption strength of corrosion
inhibitor molecules over the metal surface increases for high values of µ and that, if there
is positive values for µ,it denotes the adsorption happening between metal and inhibitor
molecules due to physisorption [Obot et al., 2015].
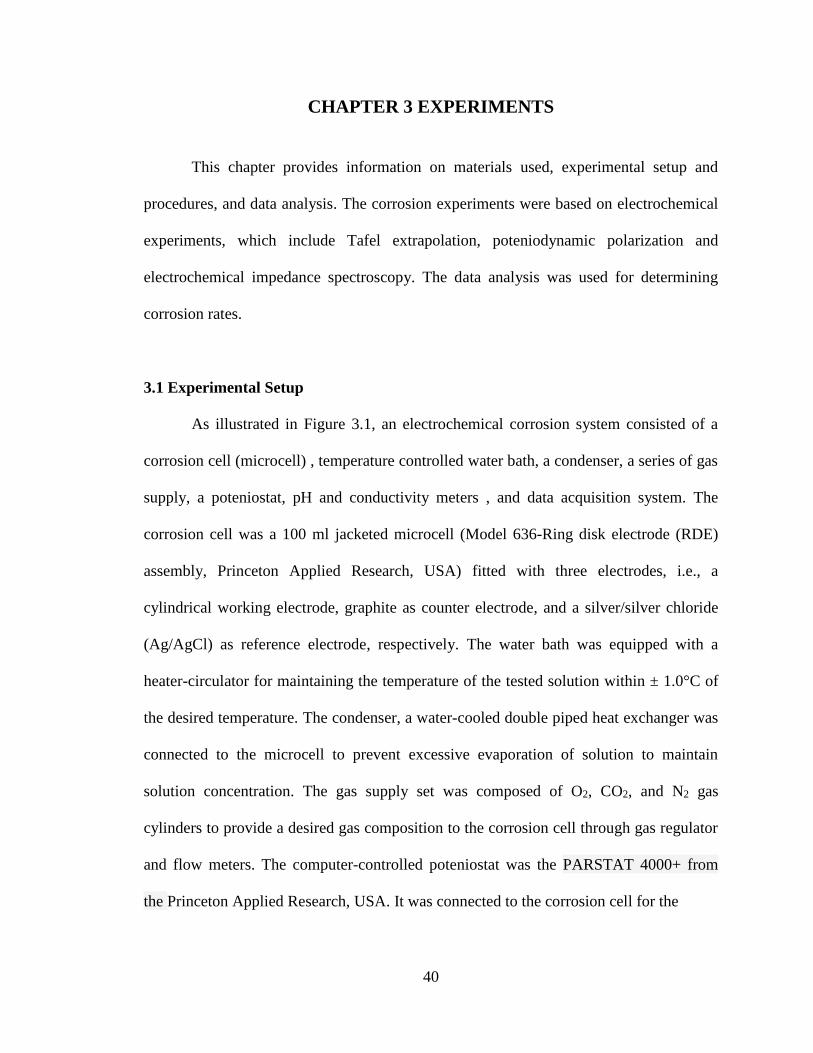
40
CHAPTER 3 EXPERIMENTS
This chapter provides information on materials used, experimental setup and
procedures, and data analysis. The corrosion experiments were based on electrochemical
experiments, which include Tafel extrapolation, poteniodynamic polarization and
electrochemical impedance spectroscopy. The data analysis was used for determining
corrosion rates.
3.1 Experimental Setup
As illustrated in Figure 3.1, an electrochemical corrosion system consisted of a
corrosion cell (microcell) , temperature controlled water bath, a condenser, a series of gas
supply, a poteniostat, pH and conductivity meters , and data acquisition system. The
corrosion cell was a 100 ml jacketed microcell (Model 636-Ring disk electrode (RDE)
assembly, Princeton Applied Research, USA) fitted with three electrodes, i.e., a
cylindrical working electrode, graphite as counter electrode, and a silver/silver chloride
(Ag/AgCl) as reference electrode, respectively. The water bath was equipped with a
heater-circulator for maintaining the temperature of the tested solution within ± 1.0°C of
the desired temperature. The condenser, a water-cooled double piped heat exchanger was
connected to the microcell to prevent excessive evaporation of solution to maintain
solution concentration. The gas supply set was composed of O2, CO2, and N2 gas
cylinders to provide a desired gas composition to the corrosion cell through gas regulator
and flow meters. The computer-controlled poteniostat was the PARSTAT 4000+ from
the Princeton Applied Research, USA. It was connected to the corrosion cell for the

41
Figure 3-1 Schematic diagram of experimental setup for electrochemical corrosion testing

42
electrochemical measurements. The potential and currents were recorded and analyzed
using the Versa Studio software (Princeton Applied Research, USA). A pH meter
(Oakton pH510 series) and a conductivity meter (YSI 3200 conductivity instrument)
were used for measuring pH and conductivity of the test solutions, respectively.
3.2 Materials
3.2.1 Electrodes
Carbon steel 1018 (CS 1018) was chosen as the working electrode (specimen) as
it is a common construction material for process equipment and piping in gas treating
plants. All specimens were cylindrical in shape with dimensions of height, outside
diameter and center hole diameter of 0.80, 1.20, and 0.60 cm, respectively as shown in
Figure 3.2 also indicating the chemical composition of metal specimen (CS 1018) used.
Prior to each test, each specimen was cleaned and surface prepared by polishing it with
600 grit silicon carbide paper using deionized water and then degreased with methanol
and dried with hot air in accordance with ASTM G1-03 (2003) standard.
3.2.2 Chemicals
Four types of chemicals were used in this work such as test solution, chemicals for
titration, specimen preparation chemicals and corrosion inhibitors. The test solution was
monoethanolamine (MEA) chosen because it has been used as the benchmark solvent in
CO2 absorption process due to its reactivity and low cost. The MEA concentration was
5.0 kmol/m3 or 30 wt. % which represents MEA solution’s strength in industries [Kohl et
al., 1997; Luis et al., 2016; Niegodajew et al., 2016].This aqueous solution was prepared
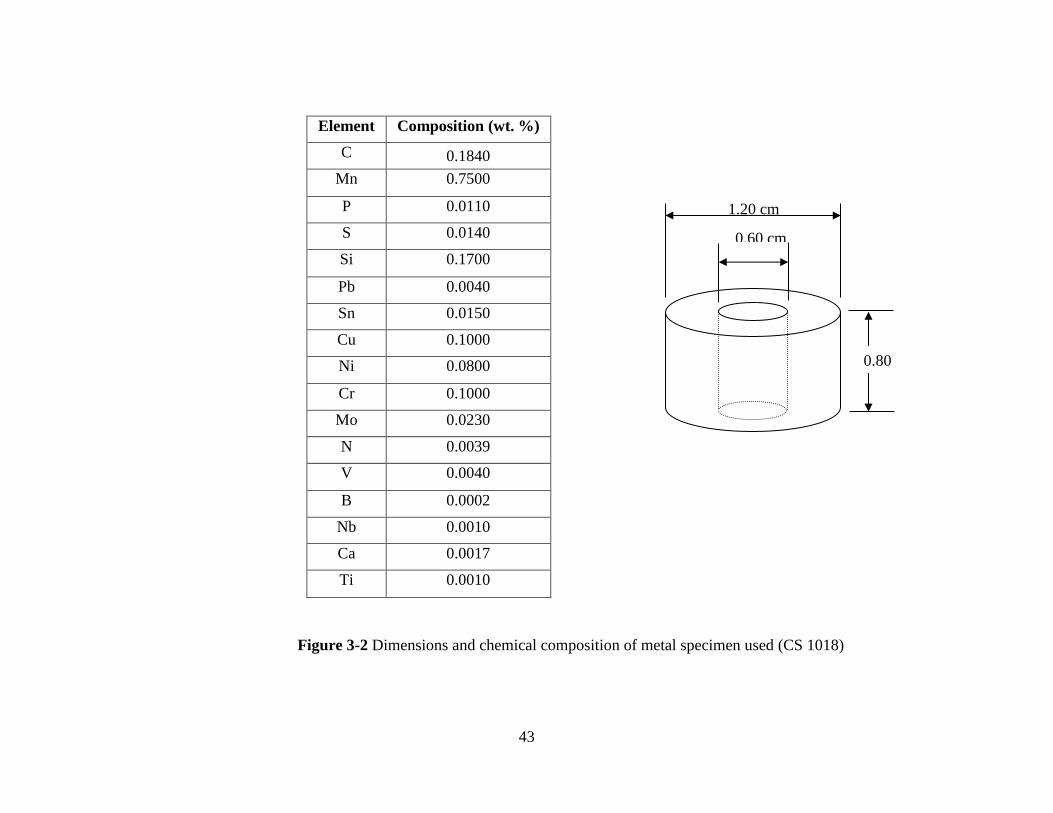
43
Element Composition (wt. %)
C 0.1840
Mn 0.7500
P 0.0110
S 0.0140
Si 0.1700
Pb 0.0040
Sn 0.0150
Cu 0.1000
Ni 0.0800
Cr 0.1000
Mo 0.0230
N 0.0039
V 0.0040
B 0.0002
Nb 0.0010
Ca 0.0017
Ti 0.0010
1.20 cm
0.60 cm
0.80
cm
Figure 3-2 Dimensions and chemical composition of metal specimen used (CS 1018)

44
from MEA and deionized water, and then purged with CO2 gas to achieve a desired CO2
loading or saturation. To this CO2 loaded MEA solution, a measured weight of tested
corrosion inhibitor was added. Inhibitor concentrations (250-10000 ppm) were varied
based on test conditions. The MEA concentration was determined by titrating it against
hydrochloric acid (1 M HCl) with methyl orange as an indicator. The CO2 loading of
MEA solutions was determined using a chittick apparatus [Horwitz et al., 1975] shown in
Figure 3.3. This apparatus is operated based on the fact that for every drop of HCl added
to the solution a corresponding volume of CO2 was liberated. Using the volume of
liberated CO2 loading, the value of CO2 loading in the solution can be calculated. Table
3.1 presents the summary of the chemicals and main chemical compounds found in the
condiments which are used for the experiments. The chemicals used for titration were
hydrochloric acid and the methyl orange while the chemical for specimen preparation
was methanol. The rest of chemicals were used as corrosion inhibitor.
3.3 Experimental Procedure
The corrosion cell was assembled with three electrodes (working electrode
(specimen), a counter electrode, and a reference electrode) and fitted with a condenser.
The prepared MEA solution is charged into the corrosion cell and purged with CO2 to
control the CO2 loading of the solution. The temperature of solution was raised gradually
to the prespecified value by circulating hot water through the outer jacket of the corrosion
cell. Then, the corrosion cell was connected electrically to the poteniostat. Using the
Versa Software, open circuit potentials (OCP) were recorded.
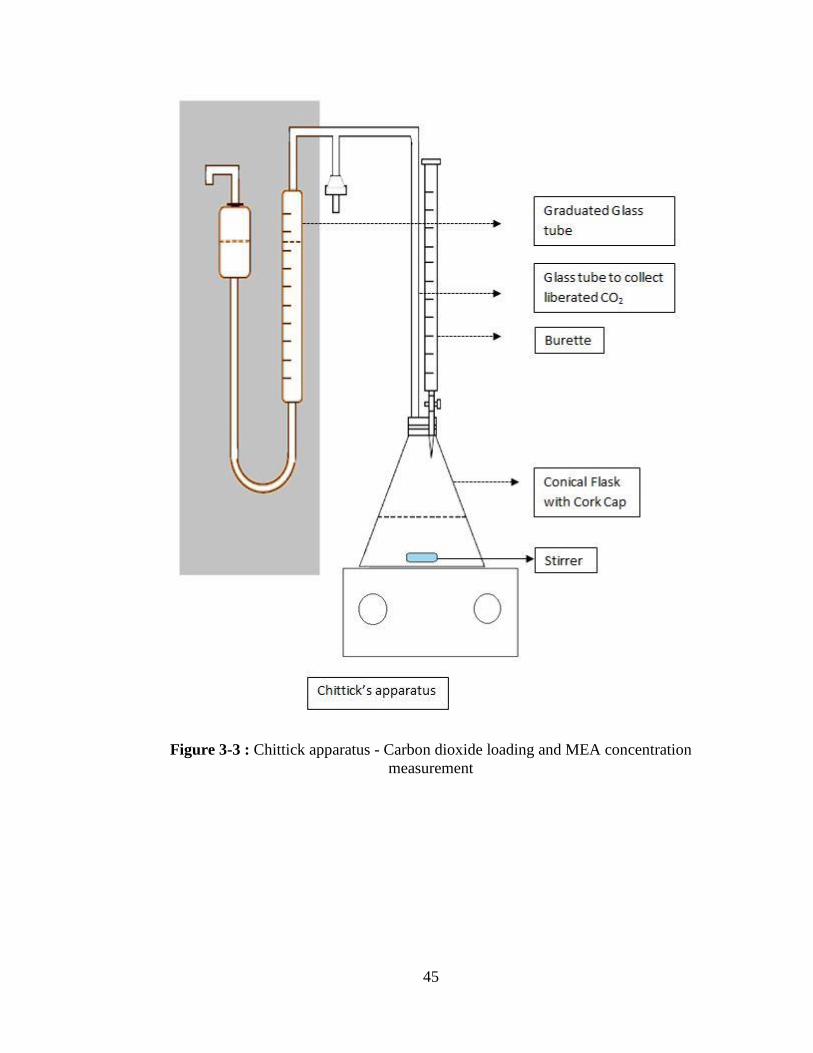
45
Figure 3-3 : Chittick apparatus - Carbon dioxide loading and MEA concentration
measurement

46
Table 3.1 Summary of the chemicals used
Chemical Formula Supplier
Monoethanolamine C2H7NO Sigma Aldrich
Hydrochloric acid HCl Sigma Aldrich
Methyl orange C14H14N3NaO3.S Sigma Aldrich
Methanol CH4O Fischer-Scientific
Sulfa pyridine C11H11N3O2S Sigma Aldrich
Sodium Metavandate NaVO3 Sigma Aldrich
Turmeric powder - Curcumin C21H20O6 McCormick Canada
Garlic powder
Allicin
Diallyl Sulfide
C6H10OS2
C6H10S
McCormick Canada
Onion powder
Dipropyl disulfide
Quercetin
C6H14S2
C15H10O7
Club House
Mustard powder
Benzyl isothiocyanate
Sinigrin
C8H7NS
C10H16KNO9S2
Club House
Horse radish powder
Allyl isothiocyanate
Peroxidase
C4H5NS
C14H16N2O2
S&B Selected
Spices

47
as a function of time against the reference electrode until a steady state value was reached
at the corrosion potential. After that, electrochemical impedance spectroscopy (EIS)
studies were performed at the open circuit potential using AC signals of 10 mV amplitude
for the frequency ranging from 0.01 Hz to 10 kHz.
Open circuit potentials were then recorded to check the stability of the system
before DC poteniodynamic cyclic polarization studies, where a scan rate of 0.166 mV/s
was initiated. When the scan is completed, all the experimental data and polarization
curves were recorded and stored. Finally, the pH and temperature were measured
followed by taking samples for determining MEA concentration and CO2 loading at the
end of the experiment after breaking the seal of corrosion cell.
3.4 Data Analysis
3.4.1 Tafel extrapolation method
From the data of poteniodynamic polarization experiment, a graph is plotted with
log i (log current density) against the potential. Using this method as illustrated in Figure
3.4, the Tafel extrapolation method was employed to determine the corrosion current
density (icorr) through which the corrosion rate could be calculated as shown below:
CR 0.13 ( . )corri E W
d (3.1)
where CR is Corrosion rate, miles per year (mpy), icorr is corrosion current density,
(µA/cm2), E.W is equivalent weight of corroding species,(g),and d is density of corroding
species,(g/cm3),Inhibition efficiency (IE) could be calculated as follows:
.uninhibited inhibited
uninhibited
CR CRI E
CR
(3.2)

48
Figure 3-4: Tafel extrapolation methods
E
(V
vs
Ag/A
gC
l)
Ecorr
β
a
(Anodic Tafel slope)
βc
(Cathodic Tafel slope)
Log icorr
(A/cm2)
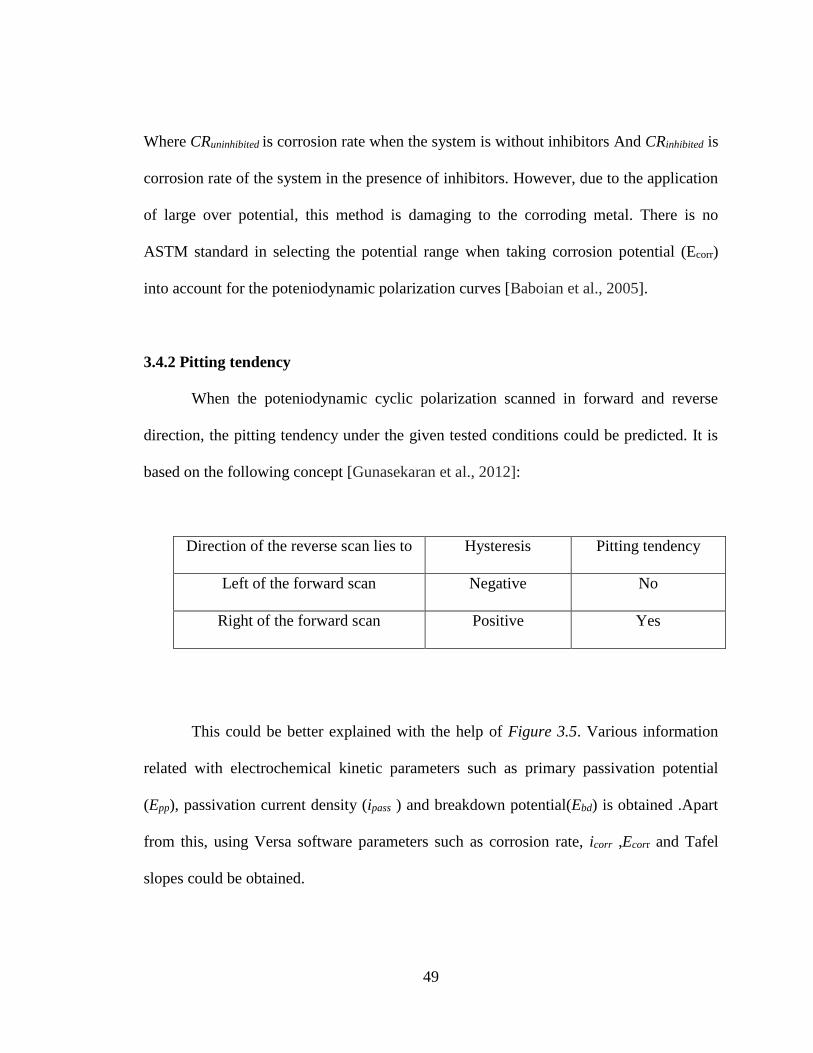
49
Where CRuninhibited is corrosion rate when the system is without inhibitors And CRinhibited is
corrosion rate of the system in the presence of inhibitors. However, due to the application
of large over potential, this method is damaging to the corroding metal. There is no
ASTM standard in selecting the potential range when taking corrosion potential (Ecorr)
into account for the poteniodynamic polarization curves [Baboian et al., 2005].
3.4.2 Pitting tendency
When the poteniodynamic cyclic polarization scanned in forward and reverse
direction, the pitting tendency under the given tested conditions could be predicted. It is
based on the following concept [Gunasekaran et al., 2012]:
Direction of the reverse scan lies to Hysteresis Pitting tendency
Left of the forward scan Negative No
Right of the forward scan Positive Yes
This could be better explained with the help of Figure 3.5. Various information
related with electrochemical kinetic parameters such as primary passivation potential
(Epp), passivation current density (ipass ) and breakdown potential(Ebd) is obtained .Apart
from this, using Versa software parameters such as corrosion rate, icorr ,Ecorr and Tafel
slopes could be obtained.

50
3.4.3 EIS analysis
Using the data from EIS technique plots such as Nyquist plots was made. From
this plot, important parameters such as Rp (charge transfer resistance) were obtained from
the semicircles related with the Nyquist plots. Size and shape of this semicircle provide
information about the corrosion.
From Rp values, inhibition efficiency (I.E) was calculated using the formula
below:
( ) ( )
( )
.p i p blank
p i
R RI E
R
(3.3)
Where Rp(i) is the charge transfer resistance in the presence of inhibitor, and
Rp(blank): charge transfer resistance in the absence of inhibitor. Apart from this, double
layer capacitance (Cdl) could be calculated using the relation as shown in Equation (2.20)
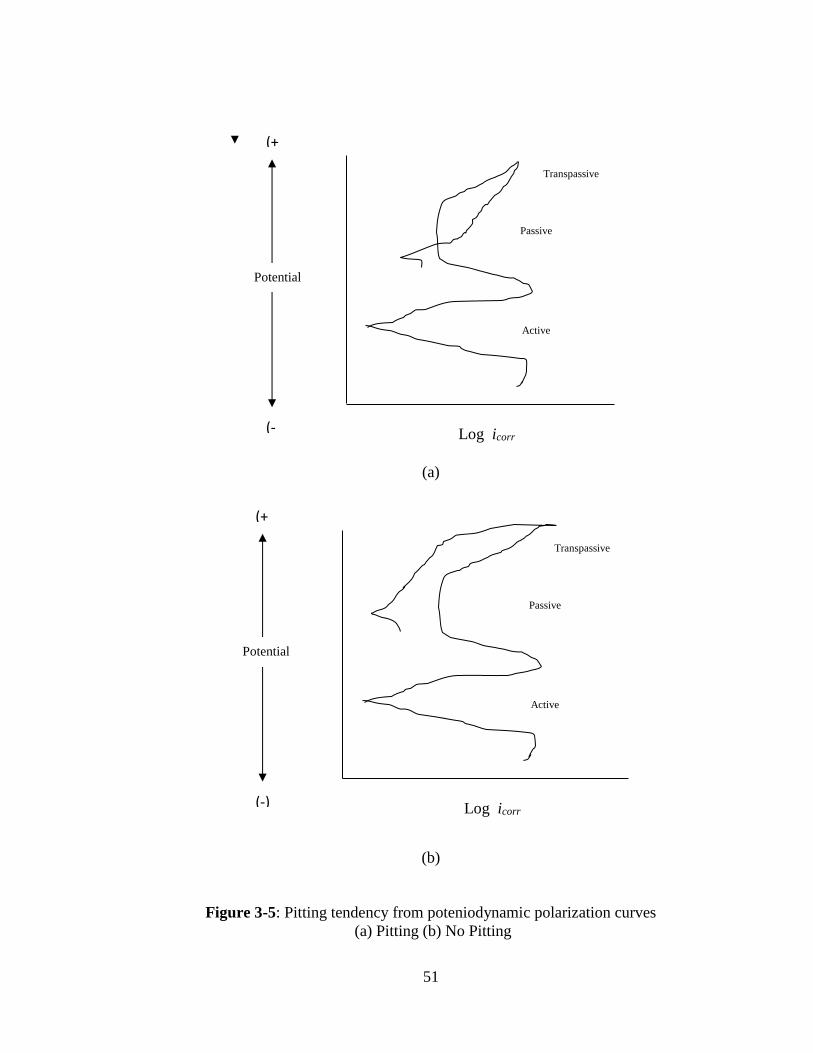
51
(a)
(a)
(b)
Figure 3-5: Pitting tendency from poteniodynamic polarization curves
(a) Pitting (b) No Pitting
(+)
(-)
Potential
Log icorr
Active
Passive
Transpassive
(+)
(-)
Potential
Log icorr
Active
Passive
Transpassive

52
CHAPTER 4 RESULTS AND DISCUSSIONS
This chapter presents results of the electrochemical corrosion experiments that
were carried out to evaluate the inhibition performance of five condiments including
powders of garlic, mustard, horseradish, anion, and turmeric. The evaluation began with
obtaining a set of baseline corrosion data of the carbon steel (CS1018) immersed in the
uninhibited monoethanolamine (MEA) solution (i.e., containing no corrosion inhibitor)
saturated with carbon dioxide (CO2). These data were reported in respect of the effects of
process parameters, including the presence of oxygen (O2) in feed gas, solution
temperature, and the presence of process contaminants. Once the baseline uninhibited
corrosion data were in place, the inhibition performance of the tested condiments was
evaluated under a range of test conditions that enabled the study of parametric effects on
inhibition performance as shown in Table 4.1. The obtained corrosion data were
subsequently analyzed to gain an understanding of inhibition behavior and mechanism of
all tested condiments.
4.1 Uninhibited System
4.1.1 Effect of O2 Concentration in Feed Gas
The O2 concentration in feed gas is an important process parameter that may
contribute to corrosion of carbon steel in the amine-based CO2 absorption process.
Contradicting findings on the effect of O2 on corrosion were reported in literature. No
findings confirm whether the O2 promotes or inhibits corrosion [Pearson et al., 2013].
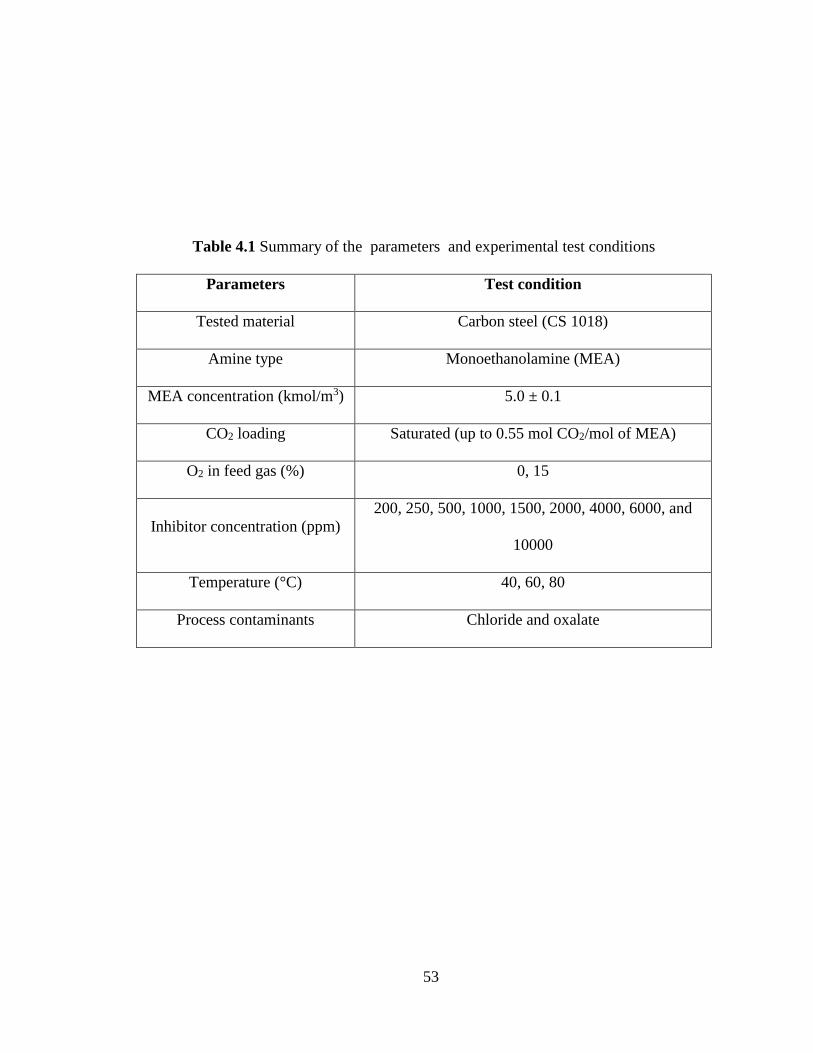
53
Table 4.1 Summary of the parameters and experimental test conditions
Parameters Test condition
Tested material Carbon steel (CS 1018)
Amine type Monoethanolamine (MEA)
MEA concentration (kmol/m3) 5.0 ± 0.1
CO2 loading Saturated (up to 0.55 mol CO2/mol of MEA)
O2 in feed gas (%) 0, 15
Inhibitor concentration (ppm)
200, 250, 500, 1000, 1500, 2000, 4000, 6000, and
10000
Temperature (°C) 40, 60, 80
Process contaminants Chloride and oxalate

54
Therefore, in this work, corrosion of carbon steel (CS 1018) was studied in the 5.0
kmol/m3 MEA solutions saturated with CO2 at 80°C was experimentally tried at two
different conditions, i.e. 0 and 15 vol.% O2 in feed gas (referred to as the absence and
presence of O2, respectively). The cyclic polarization curves for the MEA-CO2 solutions
with and without O2 show that the carbon steel in both conditions was in the active state
(as illustrated in Figure 4.1 as an example). With the increase in potential, the carbon
steel progressed from active to passive and eventually transpassive state. The negative
hysteresis was developed, indicating that the carbon steel had no pitting tendency.
Figure 4.2 (a) shows that the open circuit potential (OCP) of the MEA solution
exposed to O2 was lower and reached more quickly than that of the solution without O2.
The poteniodynamic polarization curves in Figure 4.2(b) indicate that, with the presence
of O2, there was an increase in icorr along with a shift in cathodic polarization side. This is
also well supported by a decrease in CO2 loading and an increase in conductivity of the
solution (Table 4.2). From these observations, it could be inferred that there was more
iron dissolution in anodic side and a small change in cathodic reactions favoring more
corrosion of the metal specimen. This is further justified when the corrosion rate of the
metal specimen was compared at both conditions as shown in Figure 4.2(c) indicating in
the presence of oxygen, corrosion process was enhanced.
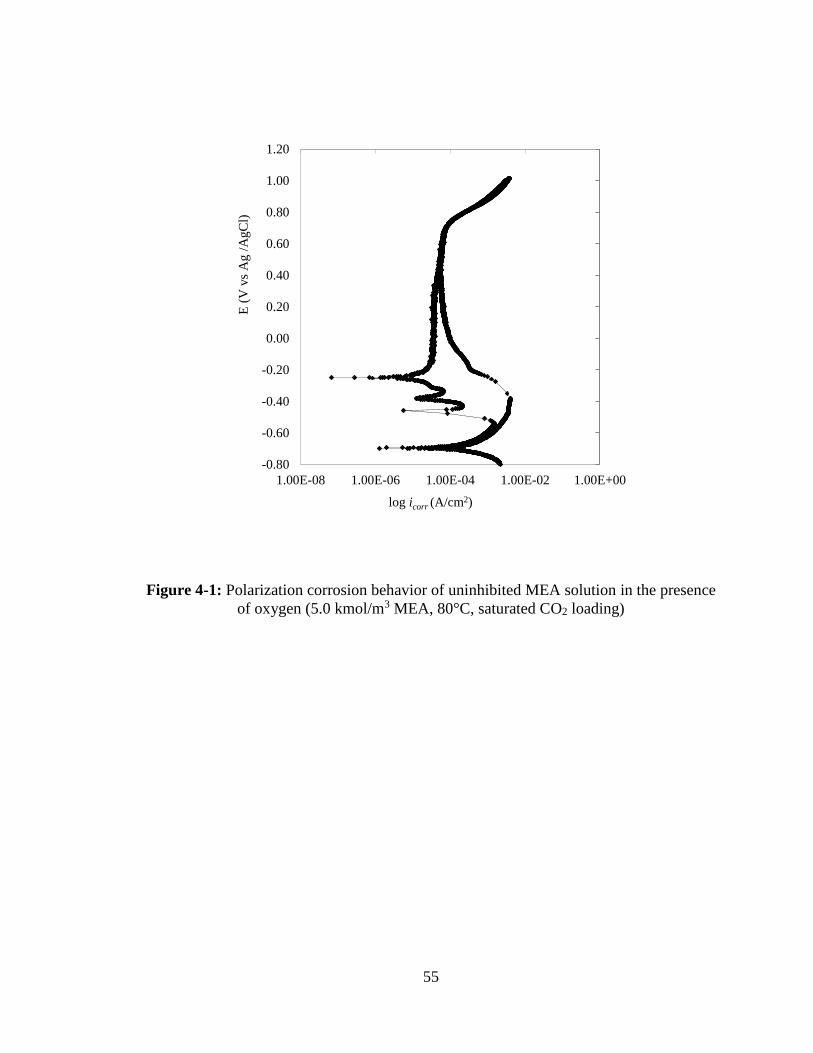
55
Figure 4-1: Polarization corrosion behavior of uninhibited MEA solution in the presence
of oxygen (5.0 kmol/m3 MEA, 80°C, saturated CO2 loading)
-0.80
-0.60
-0.40
-0.20
0.00
0.20
0.40
0.60
0.80
1.00
1.20
1.00E-08 1.00E-06 1.00E-04 1.00E-02 1.00E+00
E (
V v
s A
g /
AgC
l)
log icorr (A/cm2)

56
Figure 4-2: Corrosion behavior comparison of uninhibited MEA solution in the presence
and absence of oxygen (5.0 kmol/m3 MEA, 80°C, saturated CO2 loading)
(a) Open circuit potential, (b) Tafel plot, and(c) Corrosion rate comparison
(Original in color)
(a) (b)
(c)
-0.90
-0.80
-0.70
-0.60
-0.50
-0.40
1.00E-08 1.00E-05 1.00E-02
E (
Vvs
Ag /
AgC
l)
log icorr (A/cm2)
Presence of oxygen
Absence of oxygen
0
1
2
3
4
Absence of oxygen Presence of oxygen
Co
rro
sio
n r
ate
(mm
py)
-0.8
-0.6
-0.4
-0.2
-10 40 90 140
E (
V v
s A
g /
AgC
l )
Time(s)
Absence of oxygen
Presence of oxygen

57
Table 4.2
Table 4.2 Summary of experimental and electrochemical parameters for uninhibited systems
Experimental Condition
5 kmol/m3
satd.CO2 loading
pH Conductivity
mS/cm
Ecorr,
mV
icorr
µA/cm2
βa
mV/decade
βc
mV/decade
CR
mmpy
Rp
Ωcm2
Pitting
tendency
80°C,absence of oxygen 8.11
±0.02
75.04
±0.07
-697.05
±2.45
317.45
±0.03
144.69
±2.15
87.24
±4.80
3.75
±0.03 - No
80°C,presence of oxygen
15 vol.% O2 8.16
±0.04
82.09
±0.04
-748.31
±1.85
360.41
±0.04
110.62
±1.85
73.19
±5.20
4.26
±0.01 - No
presence of 15 vol.% O2, 40°C 7.77 53.33 -738.48 138.21 135.04 219.35 1.63 239.44 No
presence of 15 vol.% O2, 60°C 7.98 64.56 -740.44 142.14 92.07 111.20 1.68 138.43 No
presence of 15 vol.% O2, 80°C 8.16
±0.04
82.09
±0.04
-748.31
±1.85
360.41
±0.04
110.62
±1.85
73.19
±5.20
4.26
±0.01 60.25 No
80°C, presence of 15 vol.% O2,
Chloride 8.03 87.31 -737.48 235.00 100.22 77.46 2.78 84.64 No
80°C, presence of 15 vol.% O2,
Oxalate 8.05 73.87 -763.20 212.25 57.09 28.44 2.51 44.56 No
80°C, presence of 15 vol.% O2,
Formate 8.08 84.10 -756.08 199.11 70.86 51.59 2.35 59.75 No
80°C, presence of 15 vol.% O2,
Thiosulfate 8.08 74.70 -681.90 17.50 124.63 67.20 0.21 294.08 No
58
4.1.2 Effect of temperature
The corrosion behavior of carbon steel (CS 1018) immersed in the 5.0 kmol/m3
MEA solutions saturated with CO2 was studied at various temperatures, i.e., 40, 60, and
80°C. Results show that as the temperature increased, there was a continuous rise in the
conductivity of the solution. This indicates that anodic metal dissolution was rapidly
increased with the increase in temperature. The pH of the solution became more alkaline.
There was a slight anodic shift observed in Ecorr with the increase in temperature as
shown in the Figure 4.3(a). From Figure 4.3(b), the corrosion rate for the uninhibited
solution increased with temperature. This is also further justified as icorr was increased
with temperature while βc decreased with the increase in temperature. The decrease in βc
was due to the oxidizer reduction reaction at the cathodic side which promotes corrosion.
However, there was no pitting tendency observed under any circumstances.
When the Nyquist plots were compared, it was observed that size of the
semicircle decreases with the increase in temperature as shown in Figure 4.4(b). This is
well supported from the trend observed for Rp comparisons in Figure 4.4(c). This
indicates that resistance for the corrosion reaction was decreased with temperature. In
addition, the temperature also plays a key role in degradation of amine solution. This was
evidenced by the changes in solution color (Figure 4.5). Bode phase plots in Figure 4.6
(a) was found in good agreement when the data were fitted to the electrical circuit (R
(QR) (Q(R (LR)))) as shown in Figure 4.6(b). The parameter values shown in Appendix
indicate the inverse relationship between the resistors present in the circuit and the
temperature.

59
Figure 4-3: Corrosion behavior comparison of uninhibited MEA solution under the influence of
temperature (5.0 kmol/m3 MEA, 40-80°C, saturated CO2 loading, presence of 15 vol. % O2)
(a) Tafel plot (b) Corrosion rate (Original in color)
(a)
(b)
-1.00
-0.90
-0.80
-0.70
-0.60
1.00E-08 1.00E-06 1.00E-04 1.00E-02 1.00E+00
E (
V v
s A
g /
AgC
l )
log icorr(A/cm2)
80 °C
60 °C
40 °C
0
1
2
3
4
5
40 60 80
Co
rro
sio
n r
ate
(mm
py)
Temperature (°C)
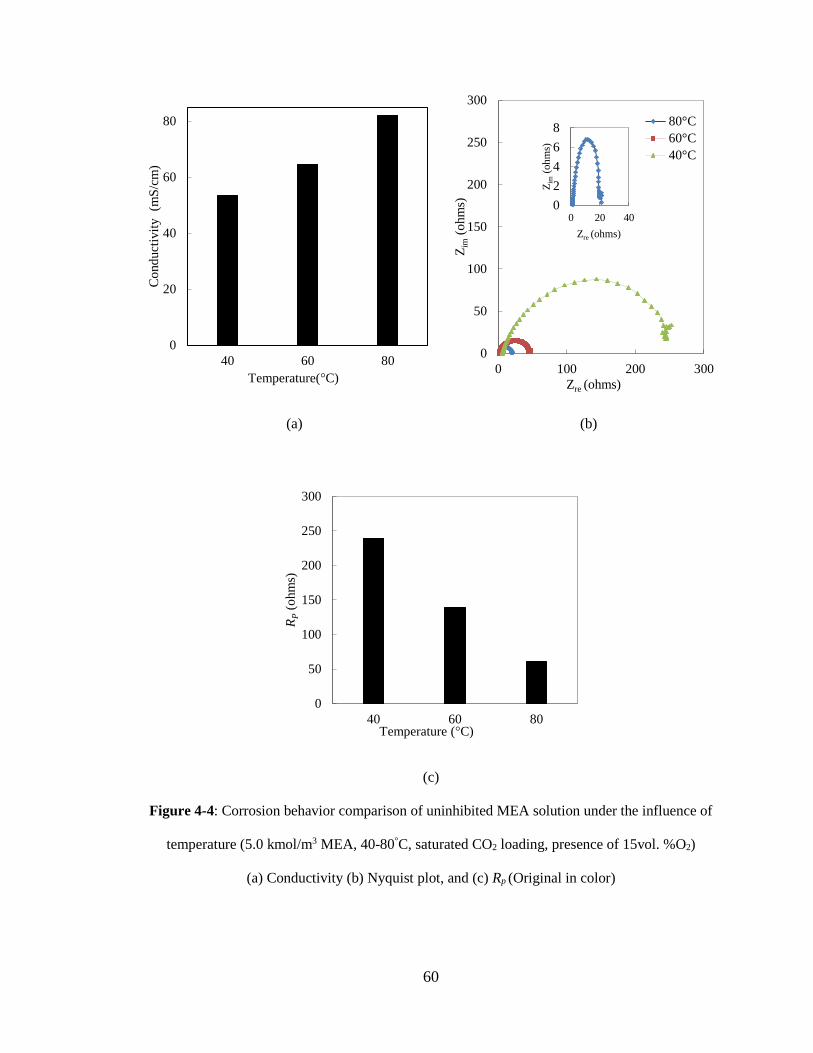
60
(a) (b)
(c)
Figure 4-4: Corrosion behavior comparison of uninhibited MEA solution under the influence of
temperature (5.0 kmol/m3 MEA, 40-80°C, saturated CO2 loading, presence of 15vol. %O2)
(a) Conductivity (b) Nyquist plot, and (c) Rp (Original in color)
0
20
40
60
80
40 60 80
Co
nd
uct
ivit
y
(mS
/cm
)
Temperature(°C)
0
50
100
150
200
250
300
40 60 80
RP
(ohm
s)
Temperature (°C)
0
50
100
150
200
250
300
0 100 200 300
Zim
(ohm
s)
Zre (ohms)
80°C
60°C
40°C
0
2
4
6
8
0 20 40
Zim
(oh
ms)
Zre (ohms)

61
Before After
Before (a) After
(b)
Figure 4-5: Photos (before and after experiment) comparison of uninhibited MEA
solution under the influence of temperature (5.0 kmol/m3 MEA, 40-80°C, saturated CO2
loading, presence of 15vol.% O2) (a) 80°C (b) 40°C (Original in color)

62
(a)
(b)
Figure 4-6: Corrosion behavior of uninhibited MEA solution under the influence of temperature
(5.0 kmol/m3 MEA, 40-80°C, saturated CO2 loading, presence of 15vol. % O2) (a) Bode-phase
plot comparison (b) Equivalent electrical circuit (Original in color)
0
10
20
30
40
50
60
0.01 1 100 10000
Phas
e an
gle
(d
egre
e)
log frequency (Hz)
40°C
60°C
80°C

63
There are two peaks where one of the peaks is more visible with the rise in
temperature indicating two constant phase elements in the corrosion mechanism. The
Arrhenius plots in Figure 4.7 were developed to obtain thermodynamic properties such as
Ea, ΔHa° and ΔSa
° using two different plots as mentioned previously in Chapter 2. The
positive value of ΔHa° indicates that the metal dissolution reaction is endothermic, and
other data are useful in assessing the corrosion inhibition performance. As the corrosion
rate for this environment is dependent on temperature, the performance of inhibitor needs
to be checked under these temperatures for its recommendation in industrial use.
4.1.3 Effect of process contaminants
The effect of process contaminants including formate, chloride, oxalate, and
thiosulfate, was examined using carbon steel (CS1018) in the 5.0 kmol/m3 MEA-CO2
solution with 15 vol. % O2 at 80°C. The pH of the system indicates the effect of process
contaminants in the uninhibited system. It is apparent that an addition of process
contaminants to the system lowers the pH towards acidic. The pH of the solution
containing no process contaminants is greater than formate, thiosulfate, oxalate, and
chloride. On this basis, it could be said that chloride makes the system more acidic when
compared with no process contaminant containing solutions, making it more favorable
for corrosion reaction. In general, the conductivity of the system changes accordingly
with pH, which is not the case here. The order in which conductivity was decreased is as
follows: Chloride > Formate > No process contaminants > Thiosulfate > Oxalate.
Chloride with more conductivity indicates the condition favorable for anodic metal
dissolution.

64
(a)
(b)
Figure 4-7: Arrhenius Plots for uninhibited MEA solution under the influence of temperature
(5.0 kmol/m3 MEA, 40-80°C, saturated CO2 loading, presence of 15 vol. % O2)
(a) Type I (b) Type II
R² = 0.7422
0.00
0.50
1.00
1.50
2.00
2.50
3.00
2.80 2.90 3.00 3.10 3.20 3.30
log i
corr
(µA
/cm
2)
1/T x103 (K-1)
Ea = 21.57 KJ/mol
R² = 0.688
-0.45
-0.40
-0.35
-0.30
-0.25
-0.20
-0.15
-0.10
-0.05
0.00
0.05
2.80 2.90 3.00 3.10 3.20 3.30
log i
corr
/T (
µA
/cm
2.K
)
1/T x103 (K-1)
ΔH0a = 18.82 KJ/mol
ΔS0a = - 161.23 J/mol.K

65
From the poteniodynamic polarization curves in the Figure 4.8(a), it was apparent
that Ecorr shifted towards anodic for chloride and thiosulfate, but other way around for
oxalate and formate when compared with no process contaminant system. This was
further explained by βa and βc. For chloride and thiosulfate, βa was greater than the no
process contaminant condition while βc was less than that. This proves that corrosion
reaction equilibrium was shifted due to the influence of process contaminants on the
anodic metal dissolution reaction. Both βa and βc were lower than those in the MEA
solutions containing oxalate and formate. However, there was no significant impact in the
corrosion rate of the system as shown in Figure 4.8(b). The corrosion rates of carbon
steel in MEA-CO2-O2 solution are as follows: no process contaminants > chloride >
oxalate > formate > thiosulfate. In the case of thiosulfate, the corrosion rate was low
similar to a behavior of an inhibitor due to the formation of a protective film over the
metal surface by the sulfur atoms present in the thiosulfate molecule. However, there was
no pitting tendency observed in any of the cases. The Nyquist plots in Figure 4.9(a) show
that there was no change in shape of the semicircle for all the cases except thiosulfate.
The Rp in Figure 4.9(b) decreases in the following order: thiosulfate > chloride > no
process contaminant > formate > oxalate. This suggests that thiosulfate acts as an
inhibitor forming a black protective layer over the metal surface as shown in Figure 4.10.
This was also reported by [Suresh et al., 2012] but not found effective as an inhibitor
when tested for long term exposure. From Figure 4.10, it was also evident that the color
formation in amine was due to the presence of formate as a process contaminant in amine
solution. Based on the high Rp and corrosion rate, oxalate and chloride were chosen to be
tested process contaminants along with the inhibitors in the following sections.

66
(a)
(b)
Figure 4-8: Corrosion behavior comparison of uninhibited MEA solution under the influence of
process contaminants (5.0 kmol/m3 MEA, 80°C, saturated CO2 loading, presence of 15vol. % O2)
(a) Tafel plot and (b) Corrosion rate (Original in color)
-0.95
-0.90
-0.85
-0.80
-0.75
-0.70
-0.65
-0.60
1.00E-07 1.00E-05 1.00E-03 1.00E-01
E (
V v
s A
g /
AgC
l)
log icorr (A/cm2)
Uninhibited
Chloride
Oxalate
Formate
Thiosulfate
0
1
2
3
4
5
Co
rro
sio
n r
ate
(mm
py)
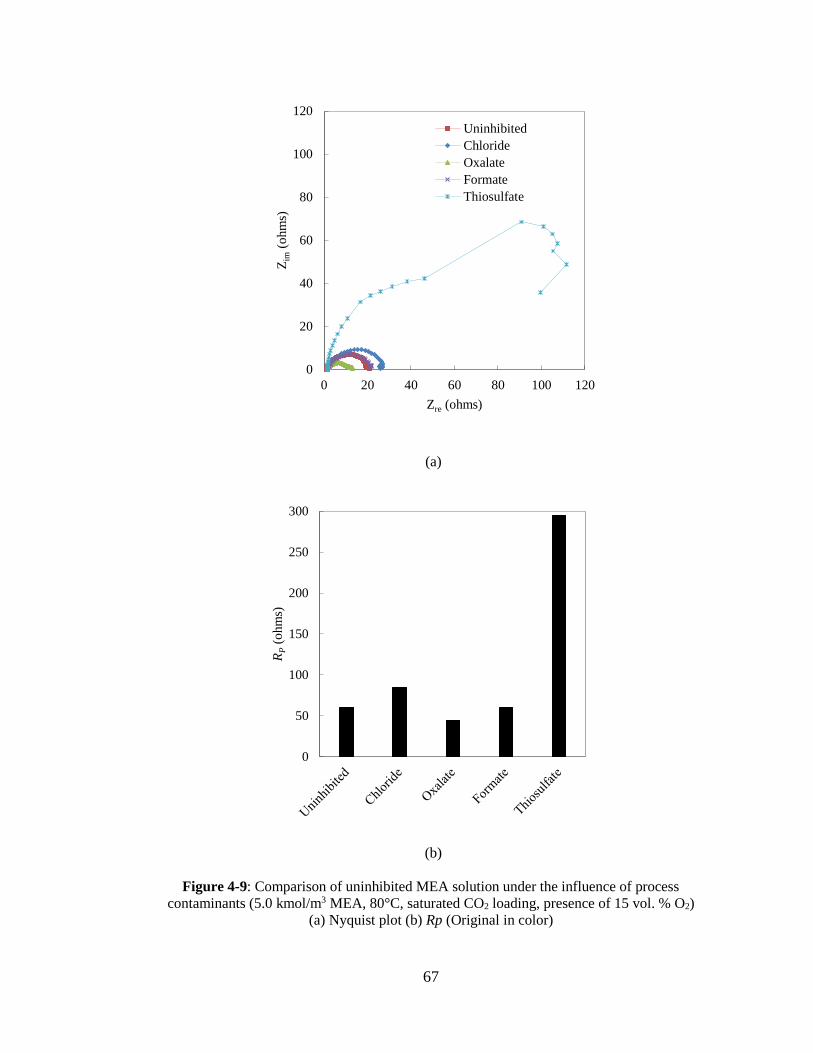
67
(a)
(b)
Figure 4-9: Comparison of uninhibited MEA solution under the influence of process
contaminants (5.0 kmol/m3 MEA, 80°C, saturated CO2 loading, presence of 15 vol. % O2)
(a) Nyquist plot (b) Rp (Original in color)
0
20
40
60
80
100
120
0 20 40 60 80 100 120
Zim
(ohm
s)
Zre (ohms)
Uninhibited
Chloride
Oxalate
Formate
Thiosulfate
0
50
100
150
200
250
300
RP
(ohm
s)

68
(a) (b)
(c) (d)
Figure 4-10: Photos of uninhibited MEA solution at the end of experiment under the influence of
process contaminants (5.0 kmol/m3 MEA, 80°C, saturated CO2 loading, presence of 15 vol.% O2)
(a) Chloride, (b) Oxalate, (c) Thiosulfate, and (d) Formate (Original in color)
69
4.2 Inhibited Systems
4.2.1 Garlic
4.2.1.1 Effect of O2
The poteniodynamic polarization curves in the Figures 4.11(a and b) indicate that
the presence of O2, increases icorr and Tafel slopes along with a shift in cathodic
polarization side. The pH and conductivity are also found to increase in the presence of
oxygen. The open circuit potentials were compared as shown in Figure 4.11(c), a shift
towards anodic side was observed similar to that of uninhibited systems. The inhibition
efficiencies were compared at both conditions as shown in Figure 4.11(d) and there was
no great change observed in the performance of inhibitor due to the presence of oxygen.
As such, the powder of garlic performs well and the presence of O2 does not have any
impact on its inhibitor performance.
4.2.1.2 Effect of inhibitor concentration
The inhibitor concentration is an important factor because pitting corrosion often
occurs when an insufficient quantity of inhibitors is provided in the solution. In this work,
the garlic concentration was varied from 200 to 10,000 ppm. The test condition was
carbon steel (CS 1018) immersed in the 5.0 kmol/m3 MEA solutions saturated with CO2
and containing 15% O2 at 80°C. Results in Table 4.3 show there was no change in pH of
the solution when the inhibitor concentration was varied. The conductivity of solution
however decreased with increasing inhibitor concentration.
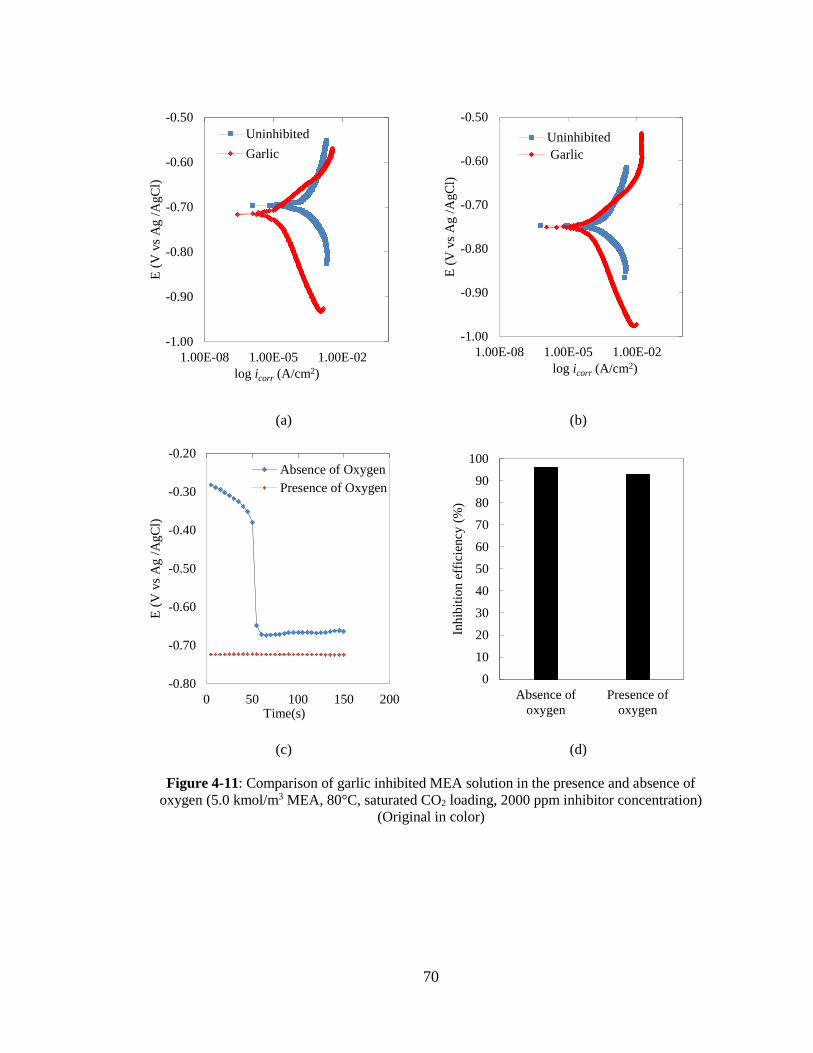
70
(a) (b)
(c) (d)
Figure 4-11: Comparison of garlic inhibited MEA solution in the presence and absence of
oxygen (5.0 kmol/m3 MEA, 80°C, saturated CO2 loading, 2000 ppm inhibitor concentration)
(Original in color)
-1.00
-0.90
-0.80
-0.70
-0.60
-0.50
1.00E-08 1.00E-05 1.00E-02
E (
V v
s A
g /
AgC
l)
log icorr (A/cm2)
Uninhibited
Garlic
-1.00
-0.90
-0.80
-0.70
-0.60
-0.50
1.00E-08 1.00E-05 1.00E-02
E (
V v
s A
g /
AgC
l)
log icorr (A/cm2)
Uninhibited
Garlic
-0.80
-0.70
-0.60
-0.50
-0.40
-0.30
-0.20
0 50 100 150 200
E (
V v
s A
g /
AgC
l)
Time(s)
Absence of Oxygen
Presence of Oxygen
0
10
20
30
40
50
60
70
80
90
100
Absence of
oxygen
Presence of
oxygen
Inhib
itio
n e
ffic
iency
(%
)

71
Table 4.3 Summary of experimental and electrochemical parameters for garlic inhibited systems
Experimental Condition
5 kmol/m3,satd.CO2 loading pH
σ
mS/cm
Ecorr
mV
icorr
µA/cm2
βa
mV/decade
βc
mV/decade
CR
mmpy
CP
I.E
(%)
Pitting
tendency
Rp
Ωcm2
EIS
I.E
(%)
80°C,absence of oxygen,
inhibitor conc: 2000 ppm 8.07
±0.02
76.63
±0.08
-712.60
±2.65
13.27
±1.89
46.70
±2.10
119.78
±4.10
0.16
±0.08 95.83
Yes - -
80°C,presence of 15 vol.% O2 inhibitor conc: 2000 ppm
8.14
±0.04
78.03
±0.07
-759.50
±3.25
25.74
±1.15
52.96
±4.20
123.20
±3.60
0.30
±0.04 92.85
No - -
80°C,
15 vol.% O2
250 8.18 78.29 -734.94 26.13 39.46 122.18 0.31 92.75 No 112.55 46.47
500 8.23 78.88 -734.88 23.02 35.14 127.61 0.27 93.61 No 231.73 74.00
1000 8.16 80.65 -748.09 24.95 48.37 128.51 0.29 93.07 No 263.92 77.17
2000 8.14
±0.04
78.03
±0.07
-759.50
±3.25
25.74
±1.15
52.96
±4.20
123.20
±3.60
0.30
±0.04 91.85 No 399.47 84.91
4000 8.23 78.51 -754.45 37.13 67.93 158.17 0.44 89.69 No 224.67 73.18
10000 8.18 77.67 -760.75 27.52 54.20 127.12 0.32 92.35 No 337.02 82.12
15 vol.% O2 Inhibitor conc.:
2000 ppm
40°C 7.76 52.52 -714.69 4.69 41.29 169.19 0.05 96.61 No 1536.33 84.42
60°C 7.94 67.24 -755.96 10.21 57.13 140.58 0.12 92.82 No 860.22 83.91
80°C 8.14
±0.04
78.03
±0.07
-759.50
±3.25
25.74
±1.15
52.96
±4.20
123.20
±3.60
0.30
±0.04
8.14
±0.04 No 399.47 84.92
80°C,
15 vol.% O2
Inhibitor conc.:
2000 ppm
Chloride 8.03 92.27 -722.38 24.08 58.74 123.03 0.28 89.75 No 246.07 65.60
Oxalate 8.14 81.45 -726.85 47.09 64.86 155.79 0.55 77.82 No 265.97 83.24
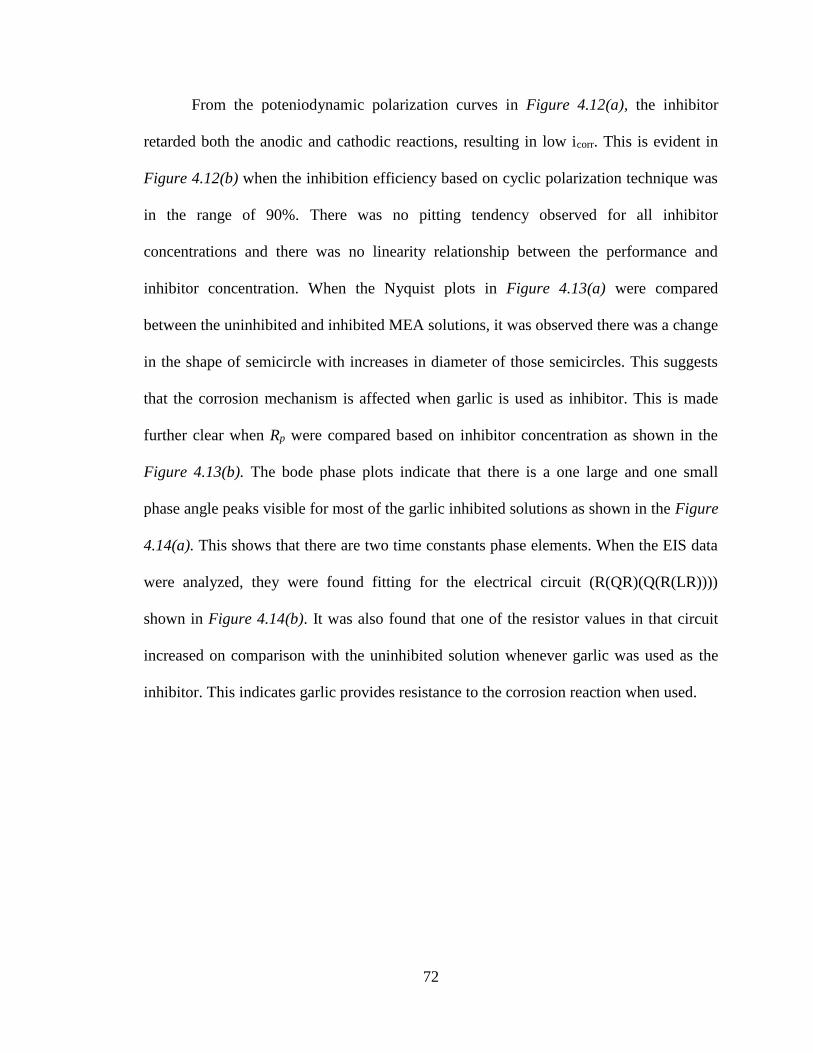
72
From the poteniodynamic polarization curves in Figure 4.12(a), the inhibitor
retarded both the anodic and cathodic reactions, resulting in low icorr. This is evident in
Figure 4.12(b) when the inhibition efficiency based on cyclic polarization technique was
in the range of 90%. There was no pitting tendency observed for all inhibitor
concentrations and there was no linearity relationship between the performance and
inhibitor concentration. When the Nyquist plots in Figure 4.13(a) were compared
between the uninhibited and inhibited MEA solutions, it was observed there was a change
in the shape of semicircle with increases in diameter of those semicircles. This suggests
that the corrosion mechanism is affected when garlic is used as inhibitor. This is made
further clear when Rp were compared based on inhibitor concentration as shown in the
Figure 4.13(b). The bode phase plots indicate that there is a one large and one small
phase angle peaks visible for most of the garlic inhibited solutions as shown in the Figure
4.14(a). This shows that there are two time constants phase elements. When the EIS data
were analyzed, they were found fitting for the electrical circuit (R(QR)(Q(R(LR))))
shown in Figure 4.14(b). It was also found that one of the resistor values in that circuit
increased on comparison with the uninhibited solution whenever garlic was used as the
inhibitor. This indicates garlic provides resistance to the corrosion reaction when used.

73
(a)
(b)
Figure 4-12: Comparison of garlic inhibited MEA solutions for Inhibitor concentrations (250
ppm to 10000 ppm) (5.0 kmol/m3 MEA, 80°C, saturated CO2 loading, 15 vol. % O2)
(a) Polarization behavior (b) Inhibition efficiency (Original in color)
-1.00
-0.90
-0.80
-0.70
-0.60
-0.50
-0.40
1.00E-08 1.00E-06 1.00E-04 1.00E-02 1.00E+00
E (
V v
s A
g /
AgC
l)
log icorr (A/cm2)
Uninhibited250 ppm500 ppm1000 ppm2000 ppm4000 ppm10000 ppm
0
10
20
30
40
50
60
70
80
90
100
250 500 1000 2000 4000 10000
Inhib
itio
n e
ffic
iency
(%
)
Inhibitor concentration (ppm)
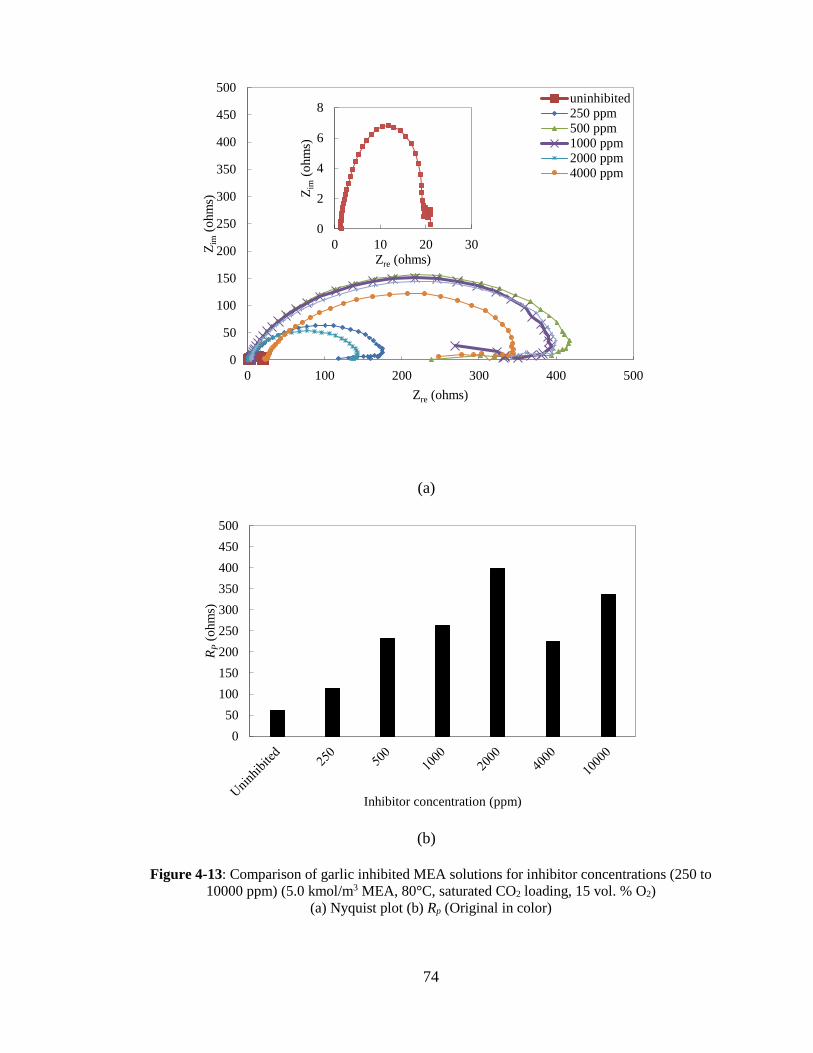
74
(a)
(b)
Figure 4-13: Comparison of garlic inhibited MEA solutions for inhibitor concentrations (250 to
10000 ppm) (5.0 kmol/m3 MEA, 80°C, saturated CO2 loading, 15 vol. % O2)
(a) Nyquist plot (b) Rp (Original in color)
0
50
100
150
200
250
300
350
400
450
500
RP
(ohm
s)
Inhibitor concentration (ppm)
0
50
100
150
200
250
300
350
400
450
500
0 100 200 300 400 500
Zim
(ohm
s)
Zre (ohms)
uninhibited250 ppm500 ppm1000 ppm2000 ppm4000 ppm
0
2
4
6
8
0 10 20 30
Zim
(ohm
s)
Zre (ohms)

75
(a)
(b)
Figure 4-14: Corrosion behavior of garlic inhibited MEA solutions for inhibitor concentrations
(250 ppm to 10000 ppm) (5.0 kmol/m3 MEA, 80°C, saturated CO2 loading, 15 vol. % O2)
(a) Bode phase plot comparison (b) Equivalent electrical circuit (Original in color)
0
10
20
30
40
50
60
70
0.01 0.1 1 10 100 1000 10000
Phas
e an
gle
(d
egre
e)
log frequency (Hz)
250 ppm
Uninhbited
500 ppm
1000 ppm
2000 ppm
4000 ppm
10000 ppm

76
When the Tafel slopes were compared as shown in Figure 4.15(a), to understand
the type of corrosion inhibition mechanisms, it was found that, with increasing garlic
concentration, βa decreased, while the βc performed the other way around, indicating
garlic as a mixed type corrosion inhibitor. To understand the adsorption mechanism,
electrochemical data were fitted for different isotherms and it was found that garlic
followed Langmuir adsorption isotherm as shown in Figure 4.15(b).The standard free
energy of adsorption (ΔG°ads) was found to be in -32.87 KJ/mol indicating mixed
adsorption involving both physisorption and chemisorption between inhibitor molecule
and the metal surface.
4.2.1.3 Effect of temperature
The Poteniodynamic polarization curves were compared for the garlic inhibited
and uninhibited condition for various temperatures as shown in Figure 4.16(a). It was
apparent that there was a shift in Ecorr from anodic to cathodic side with the increase in
temperature. Apart from this as observed in the uninhibited solution, the same trend was
found for pH and conductivity with the rise in temperature. There was no pitting
tendency observed for inhibitor at any of the temperature range. The icorr increased with
temperature, reflecting a higher corrosion rate. On the other hand, there was an inverse
linear relationship observed between βc and the temperature. Inhibitor efficiency obtained
from cyclic polarization (over the range of 90%) decreased with the increase in
temperature as shown in Figure 4.16(b).

77
(a)
(b)
Figure 4-15: Corrosion behavior of garlic inhibited MEA solutions for inhibitor concentrations
(250 ppm to 10000 ppm) (5.0 kmol/m3 MEA, 80°C, saturated CO2 loading, 15 vol. % O2)
(a) Tafel slope comparison (b) Langmuir adsorption isotherm
0
20
40
60
80
100
120
140
160
0 2000 4000 6000 8000 10000
β(m
V/d
ecad
e)
Inhibitor concentration (ppm)
βa Garlic
βc Garlic
R² = 0.9998
0
2
4
6
8
10
12
0 2 4 6 8 10 12
c/Θ
Inhibitor Concentration (g/L)
ΔG°ads = - 32.87 KJ/mol

78
(a) (b)
(c)
Figure 4-16: Corrosion behavior of garlic inhibited MEA solutions under the influence of
temperature (5.0 kmol/m3 MEA, saturated CO2 loading, presence of 15vol.% O2) Tafel plot
comparison (a) 40°C, (b) 60°C,and (c) 80°C (Original in color)
-1.00
-0.90
-0.80
-0.70
-0.60
-0.50
-0.40
1.00E-08 1.00E-05 1.00E-02
E (
V v
s A
g /
AgC
l)
log icorr (A/cm2)
Uninhibited
Garlic
-1.10
-1.00
-0.90
-0.80
-0.70
-0.60
-0.50
-0.40
1.00E-08 1.00E-05 1.00E-02
E (
V v
s A
g /
AgC
l)
log icorr (A/cm2)
Uninhibited
Garlic
-1.10
-1.00
-0.90
-0.80
-0.70
-0.60
-0.50
-0.40
1.00E-08 1.00E-05 1.00E-02
E (
V v
s A
g /
AgC
l)
log icorr (A/cm2)
uninhibited
Garlic

79
(a) (b)
(c)
Figure 4-17: Comparison of garlic inhibited MEA solutions under the influence of temperature
(5.0 kmol/m3 MEA, saturated CO2 loading, presence of 15 vol. % O2, 40-80°C)
(a) Inhibition efficiency, (b) Nyquist plot, and (c) Rp
0
10
20
30
40
50
60
70
80
90
100
40 60 80
Inhib
itio
n e
ffic
iency
(%
)
Temperature ( ° C )
0
100
200
300
400
500
600
700
0 100 200 300 400 500 600 700
Zim
(ohm
s)
Zre (ohms)
80°C
60°C
40°C
0
200
400
600
800
1000
1200
1400
1600
40 60 80
RP
(ohm
s)
Temperature (°C)
Garlic
Uninhibited
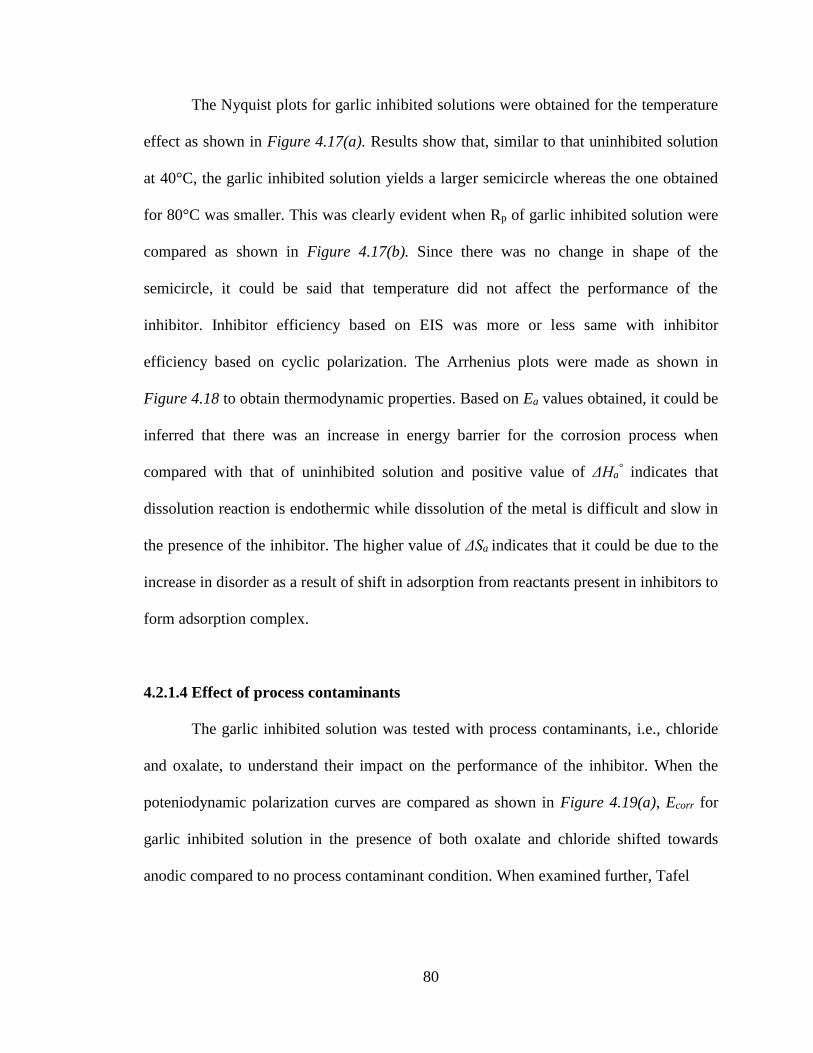
80
The Nyquist plots for garlic inhibited solutions were obtained for the temperature
effect as shown in Figure 4.17(a). Results show that, similar to that uninhibited solution
at 40°C, the garlic inhibited solution yields a larger semicircle whereas the one obtained
for 80°C was smaller. This was clearly evident when Rp of garlic inhibited solution were
compared as shown in Figure 4.17(b). Since there was no change in shape of the
semicircle, it could be said that temperature did not affect the performance of the
inhibitor. Inhibitor efficiency based on EIS was more or less same with inhibitor
efficiency based on cyclic polarization. The Arrhenius plots were made as shown in
Figure 4.18 to obtain thermodynamic properties. Based on Ea values obtained, it could be
inferred that there was an increase in energy barrier for the corrosion process when
compared with that of uninhibited solution and positive value of ΔHa° indicates that
dissolution reaction is endothermic while dissolution of the metal is difficult and slow in
the presence of the inhibitor. The higher value of ΔSa indicates that it could be due to the
increase in disorder as a result of shift in adsorption from reactants present in inhibitors to
form adsorption complex.
4.2.1.4 Effect of process contaminants
The garlic inhibited solution was tested with process contaminants, i.e., chloride
and oxalate, to understand their impact on the performance of the inhibitor. When the
poteniodynamic polarization curves are compared as shown in Figure 4.19(a), Ecorr for
garlic inhibited solution in the presence of both oxalate and chloride shifted towards
anodic compared to no process contaminant condition. When examined further, Tafel

81
(a)
(b)
Figure 4-18: Arrhenius Plots for garlic inhibited MEA solutions under the influence of temperature
(5.0 kmol/m3 MEA, 40-80°C, saturated CO2 loading, presence of 15 vol. % O2)
(a) Type I (b) Type II
R² = 0.7422
R² = 0.9851
0.00
0.50
1.00
1.50
2.00
2.50
3.00
2.80 2.90 3.00 3.10 3.20 3.30
log i
corr
(µA
/cm
2)
1/T x103 (K-1)
Uninhibited
Garlic
Ea = 41.98 KJ/mol
R² = 0.688
R² = 0.9833-2.00
-1.50
-1.00
-0.50
0.00
0.50
2.80 2.90 3.00 3.10 3.20 3.30
log i
corr
/T (
µA
/cm
2.K
)
1/T x103 (K-1)
Uninhibted
Garlic
ΔH0a = 39.22 KJ/mol
ΔS0a = - 123.44 J/mol.K
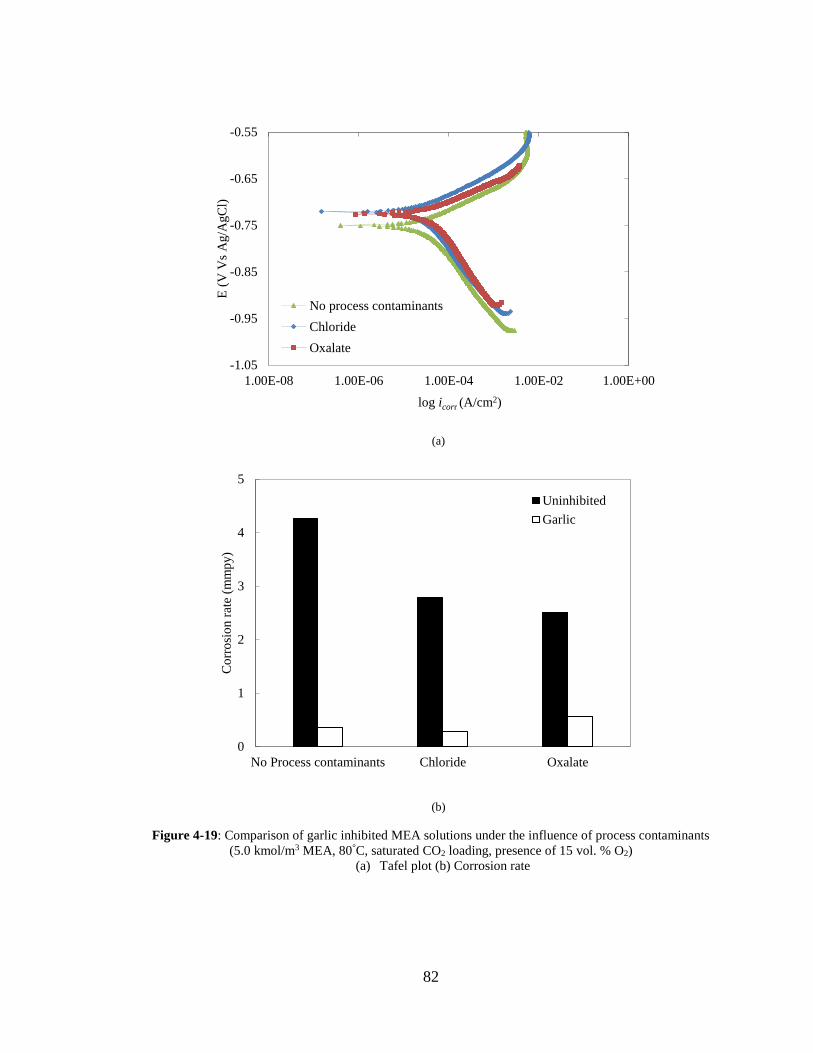
82
(a)
(b)
Figure 4-19: Comparison of garlic inhibited MEA solutions under the influence of process contaminants
(5.0 kmol/m3 MEA, 80°C, saturated CO2 loading, presence of 15 vol. % O2)
(a) Tafel plot (b) Corrosion rate
-1.05
-0.95
-0.85
-0.75
-0.65
-0.55
1.00E-08 1.00E-06 1.00E-04 1.00E-02 1.00E+00
E (
V V
s A
g/A
gC
l)
log icorr (A/cm2)
No process contaminants
Chloride
Oxalate
0
1
2
3
4
5
No Process contaminants Chloride Oxalate
Co
rro
sio
n r
ate
(mm
py)
Uninhibited
Garlic
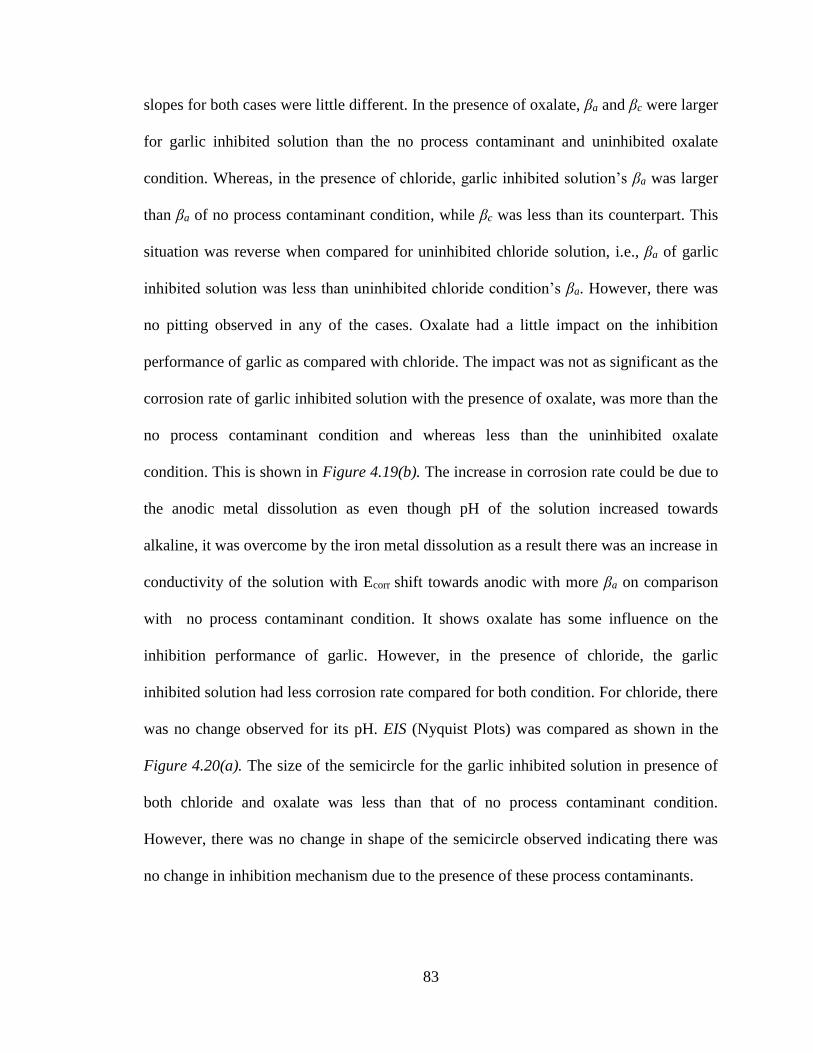
83
slopes for both cases were little different. In the presence of oxalate, βa and βc were larger
for garlic inhibited solution than the no process contaminant and uninhibited oxalate
condition. Whereas, in the presence of chloride, garlic inhibited solution’s βa was larger
than βa of no process contaminant condition, while βc was less than its counterpart. This
situation was reverse when compared for uninhibited chloride solution, i.e., βa of garlic
inhibited solution was less than uninhibited chloride condition’s βa. However, there was
no pitting observed in any of the cases. Oxalate had a little impact on the inhibition
performance of garlic as compared with chloride. The impact was not as significant as the
corrosion rate of garlic inhibited solution with the presence of oxalate, was more than the
no process contaminant condition and whereas less than the uninhibited oxalate
condition. This is shown in Figure 4.19(b). The increase in corrosion rate could be due to
the anodic metal dissolution as even though pH of the solution increased towards
alkaline, it was overcome by the iron metal dissolution as a result there was an increase in
conductivity of the solution with Ecorr shift towards anodic with more βa on comparison
with no process contaminant condition. It shows oxalate has some influence on the
inhibition performance of garlic. However, in the presence of chloride, the garlic
inhibited solution had less corrosion rate compared for both condition. For chloride, there
was no change observed for its pH. EIS (Nyquist Plots) was compared as shown in the
Figure 4.20(a). The size of the semicircle for the garlic inhibited solution in presence of
both chloride and oxalate was less than that of no process contaminant condition.
However, there was no change in shape of the semicircle observed indicating there was
no change in inhibition mechanism due to the presence of these process contaminants.

84
(a)
(b)
Figure 4-20: Comparison of garlic inhibited MEA solutions under the influence of process contaminants
(5.0 kmol/m3 MEA, 80°C, saturated CO2 loading, presence of 15 vol. % O2) (a) Nyquist plot (b) Rp
(Original in color)
0
25
50
75
100
125
150
0 25 50 75 100 125 150
Zim
(ohm
s)
Zre (ohms)
No process contaminantsChlorideOxalate
0
50
100
150
200
250
300
350
400
450
No Process contaminants Chloride Oxalate
RP
(ohm
s)
Uninhibited
Garlic

85
This was further supported by comparing Rp as shown in Figure 4.20(b).It was observed
that Rp of garlic inhibited solution was less when compared with no process contaminant
condition, but Rp was more than their corresponding uninhibited solution with
contaminants.
4.2.1.4 Quantum chemical analysis
Quantum studies of corrosion inhibitors based on their chemical structure is
useful in assessing their performance and understands the underlying inhibition
mechanism. In this case, condiments are used as corrosion inhibitors. Since they do not
have a specific chemical structure, it could be better assumed to do quantum studies on
the main constituents of chemicals present in it. According to literature [Lanzotti, 2006],
the garlic powder mainly consists of Allicin and Diallyl sulfide. The quantum analyses of
these compounds have been obtained and parameters related with them were obtained as
shown in Table 4.4, it could be understood that EHOMO values on comparison with MEA
were higher, indicating the tendency to donate electrons to metal atom also ELUMO values
of those compounds was less on comparison with MEA indicating higher corrosion
inhibition efficiency. Energy gap (ΔE) was lower when compared with MEA indicates
the binding ability of the inhibitor over the metal surface. A higher electronegativity (χ)
and lower hardness (γ) of these compounds on comparison with MEA are the
characteristics of good inhibitors. For this compounds, fraction of electrons transferred
(ΔN) was less than 3.6 and this shows they could donate electrons to the metal surface for
forming an adsorbed layer to prevent corrosion. The optimized structures of these
compounds are shown in Figures 4.21(a and b), respectively. It is clearly visible this

86
structure has sulfur atoms with different functional groups. From Figures 4.21(c and d)
electron densities in HOMO level are more surrounding the sulfur atoms and same is
observed for LUMO levels from Figures 4.21(e and f) indicating the presence of sulfur
atom is responsible for the inhibition quality of garlic.
Table 4.4 Summary of quantum chemical analysis of chemicals related with garlic
Properties MEA Allicin Diallyl sulfide
EHOMO -6.77 -6.56 -6.17
ELUMO -0.31 -1.71 -0.68
Energy gap (ΔE) 6.46 4.85 5.48
Dipole moment 1.04 2.54 1.69
I 6.77 6.56 6.17
A 0.31 1.71 0.68
Electro-negativity (χ) 3.54 4.14 3.43
Hardness (γ) 3.23 2.42 2.74
(χ)Metal (Fe) 7.00 7.00 7.00
Absolute hardness of Fe
(Hardness (γ)) 0.00 0.00 0.00
Fraction of electrons
transferred (ΔN) 0.54 0.58 0.65
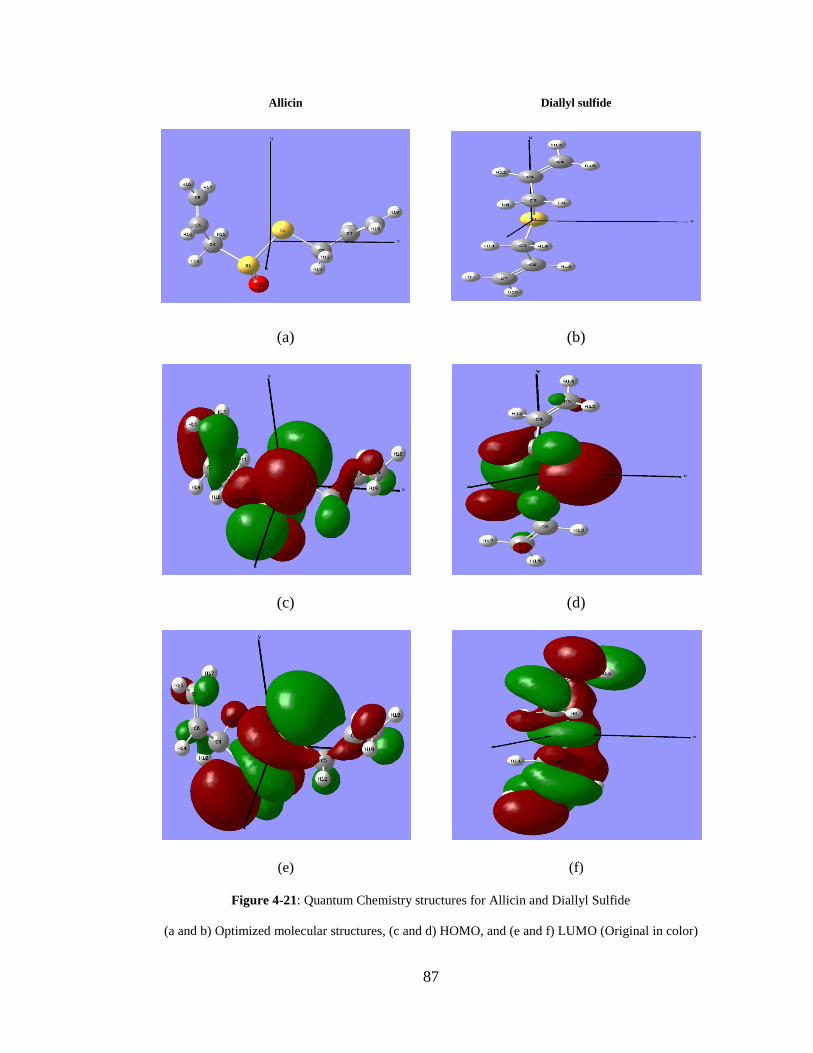
87
Allicin Diallyl sulfide
(a) (b)
(c) (d)
(e) (f)
Figure 4-21: Quantum Chemistry structures for Allicin and Diallyl Sulfide
(a and b) Optimized molecular structures, (c and d) HOMO, and (e and f) LUMO (Original in color)
88
4.2.2 Mustard
4.2.2.1 Effect of O2
When compared with the presence of oxygen, there is an increase in icorr which
ultimately resulted in increase in corrosion rate with a slight decrease in anodic Tafel
slope with an increase in cathodic Tafel slope. This is clearly shown in Figures 4.22 (a
and b) . There is an increase in pH of inhibited solution due to the presence of oxygen.
When the open circuit potentials were compared as shown in the Figure 4.22(c), there
was a shift towards anodic side observed in the presence of oxygen similar to the trend
observed for uninhibited systems. The presence of oxygen does not affect the
performance of the inhibitor as it is obvious from Figure 4.22(d).
4.2.2.2 Effect of inhibitor concentration
The inhibitor concentration of mustard was varied between 250 ppm to 10000
ppm. When the experimental conditions were monitored to examine the effect of
inhibitor concentration with performance, there were some interesting facts found. With
the increase in inhibitor concentration the pH of the solution increased, i.e., it turns to be
more alkaline in nature and the same trend was observed for the conductivity of the
solution. This type of conditions was more favorable for changing the nature of the
corrosive environment making the inhibitor more effective irrespective of the inhibitor
concentration. When electrochemical corrosion results were observed through
comparison of poteniodynamic polarization curves as shown in the following Figure
4.23(a). It could be observed there was a shift of Ecorr more towards cathodic side for all
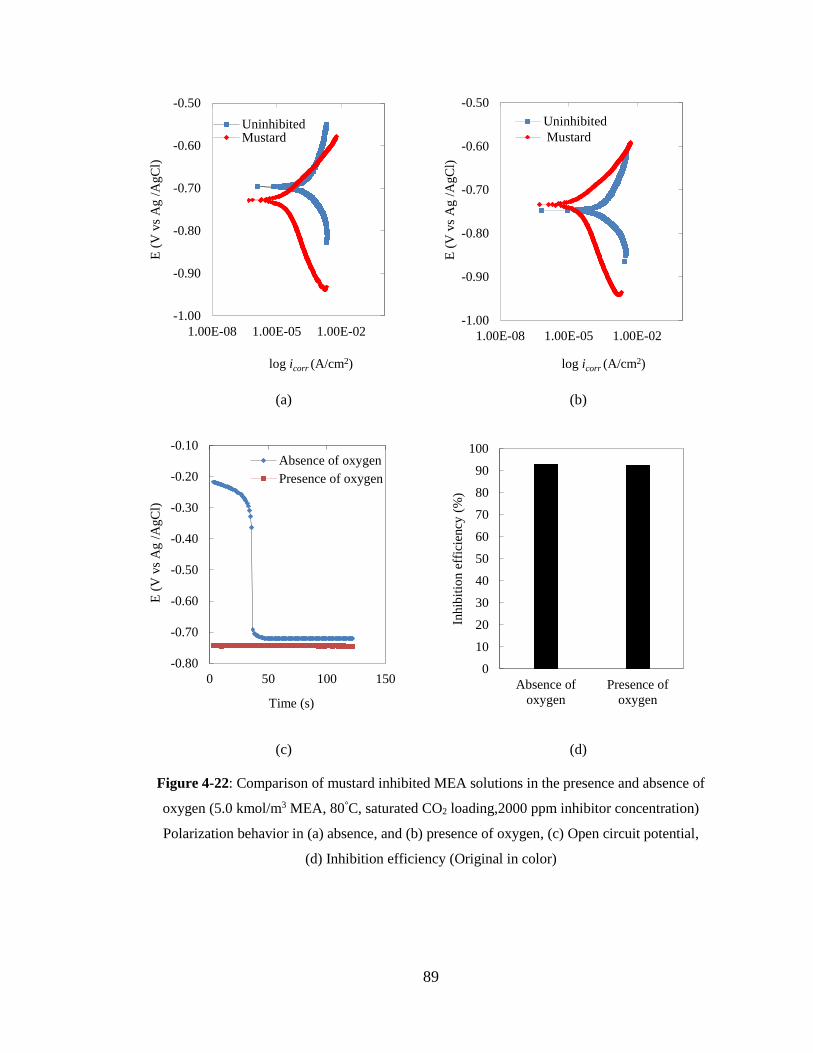
89
(a) (b)
(c) (d)
Figure 4-22: Comparison of mustard inhibited MEA solutions in the presence and absence of
oxygen (5.0 kmol/m3 MEA, 80°C, saturated CO2 loading,2000 ppm inhibitor concentration)
Polarization behavior in (a) absence, and (b) presence of oxygen, (c) Open circuit potential,
(d) Inhibition efficiency (Original in color)
-1.00
-0.90
-0.80
-0.70
-0.60
-0.50
1.00E-08 1.00E-05 1.00E-02
E (
V v
s A
g /
AgC
l)
log icorr (A/cm2)
UninhibitedMustard
-1.00
-0.90
-0.80
-0.70
-0.60
-0.50
1.00E-08 1.00E-05 1.00E-02
E (
V v
s A
g /
AgC
l)
log icorr (A/cm2)
Uninhibited
Mustard
-0.80
-0.70
-0.60
-0.50
-0.40
-0.30
-0.20
-0.10
0 50 100 150
E (
V v
s A
g /
AgC
l)
Time (s)
Absence of oxygen
Presence of oxygen
0
10
20
30
40
50
60
70
80
90
100
Absence of
oxygen
Presence of
oxygen
Inhib
itio
n e
ffic
iency
(%
)

90
(a)
(b)
Figure 4-23: Comparison of mustard inhibited MEA solutions for Inhibitor concentrations
(250 ppm to 10000 ppm) (5.0 kmol/m3 MEA, 80°C, saturated CO2 loading, 15 vol. % O2)
(a) Polarization behavior (b) Inhibition efficiency (Original in color)
-1.00
-0.90
-0.80
-0.70
-0.60
1.00E-08 1.00E-06 1.00E-04 1.00E-02 1.00E+00
E (
V v
s A
g /
AgC
l)
log icorr (A/cm2)
Uninhibited
250 ppm
500 ppm
1000 ppm
2000 ppm
4000 ppm
10000 ppm
0
10
20
30
40
50
60
70
80
90
100
250 500 1000 2000 4000 10000
Inhib
itio
n e
ffic
iency
(%
)
Inhibitor concentration (ppm)

91
Table 4.5 Summary of experimental and electrochemical parameters for mustard inhibited systems
Experimental Condition
5 kmol/m3,satd.CO2
loading
pH σ
mS/cm
Ecorr
mV
icorr
µA/cm2
βa
mV/decade
βc
mV/decade
CR
mmpy
CP
I.E
(%)
Pitting
tendency
Rp
Ωcm2
EIS
I.E
(%)
80°C,absence of oxygen,
inhibitor conc: 2000 ppm 8.10
±0.03
79.43
±0.09
-727.80
±2.15
22.64
±0.04
57.67
±1.75
125.81
±2.05
0.27
±0.02 92.87 Yes - -
80°C, 15 vol.% O2
inhibitor conc:2000 ppm 8.15
±0.04
75.76
±0.08
-751.28
±3.75
27.21
±0.07
53.74
±2.15
124.84
±3.15
0.32
±0.03 92.45 No - -
80°C,
15 vol.% O2
250 8.36 77.07 -778.57 24.06 56.55 117.80 0.28 93.38 Yes 319.35 81.13
500 8.29 75.97 -776.01 26.06 50.05 127.21 0.31 92.77 Yes 336.97 82.12
1000 8.31 77.52 -773.79 28.73 58.69 127.46 0.34 92.03 No 436.82 86.21
2000 8.15
±0.04
75.76
±0.08
-751.28
±3.75
27.21
±0.07
53.74
±2.15
124.84
±3.15
0.32
±0.03 92.56 No 339.79 82.27
4000 8.52 72.19 -800.39 25.36 61.08 105.14 0.30 92.96 No 386.56 84.41
10000 8.39 71.50 -788.57 43.54 79.43 116.01 0.51 87.92 No 433.94 86.12
15 vol.% O2 Inhibitor
conc:2000 ppm
40°C 7.81 47.21 -737.19 3.76 58.77 128.73 0.04 97.00 No 1973.88 87.86
60°C 7.89 63.52 -738.30 10.26 37.41 126.23 0.12 93.00 No 354.78 60.98
80°C 8.15
±0.04
75.76
±0.08
-751.28
±3.75
27.21
±0.07
53.74
±2.15
124.84
±3.15
0.32
±0.03 92.56 No 339.80 82.27
80°C,
15 vol.% O2 Inhibitor
conc:2000 ppm
Chloride 8.13 70.20 -714.58 31.42 59.82 137.27 0.37 86.63 No 326.92 74.11
Oxalate 8.15 68.85 -774.64 33.49 59.22 134.95 0.39 84.23 No 269.33 83.45

92
Inhibitor concentrations except 2000 ppm. In that case, the shift was towards anodic side
rather than the other cases. βa obtained for all the cases on comparison with blank
solution was low, while βc was reverse with vice versa. Pitting tendency was only
observed up to the inhibitor concentration range of 500 ppm. When the inhibitor
performance was compared together based on ƞ as shown in the Figure 4.23(b), the
efficiency range of mustard as inhibitor was in the range of 90 % except the case where
the inhibitor concentration was 10000 ppm. When EIS Nyquist plots of mustard based on
their inhibitor concentration were compared together as shown in the Figure 4.24(a)
below. It could be observed that there was a change in size and shape of the semicircle on
comparison with uninhibited solution but with no linearity in relation with inhibitor
concentration. This is evident when Rp of different inhibitor concentration comparisons is
made as shown in Figure 4.24(b). From the inhibitor concentration range above 500 ppm,
the usage could be suggested. Also, the trend observed in the ƞ (obtained from cyclic
polarization technique) was comparable with EIS (ƞ) as well. Bode phase plots
comparisons are shown in Figure 4.25(a).There is only one peak loop indicating
irrespective of inhibitor concentration. This indicates only one constant phase element
associated with inhibitor mechanism. EIS data was found fitted for electrical circuit (LR
(QR(C))) as shown in Figure 4.25(b).This indicated there was a rise in resistance for
inhibited solutions on comparison with uninhibited solution which was also in agreement
with the corresponding obtained Rp values. But, there was no linearity relationship found
between inhibitor concentrations. Mustard followed Langmuir adsorption isotherm as
shown in Figure 4.26(a). Standard free energy of adsorption (ΔG°ads) obtained was
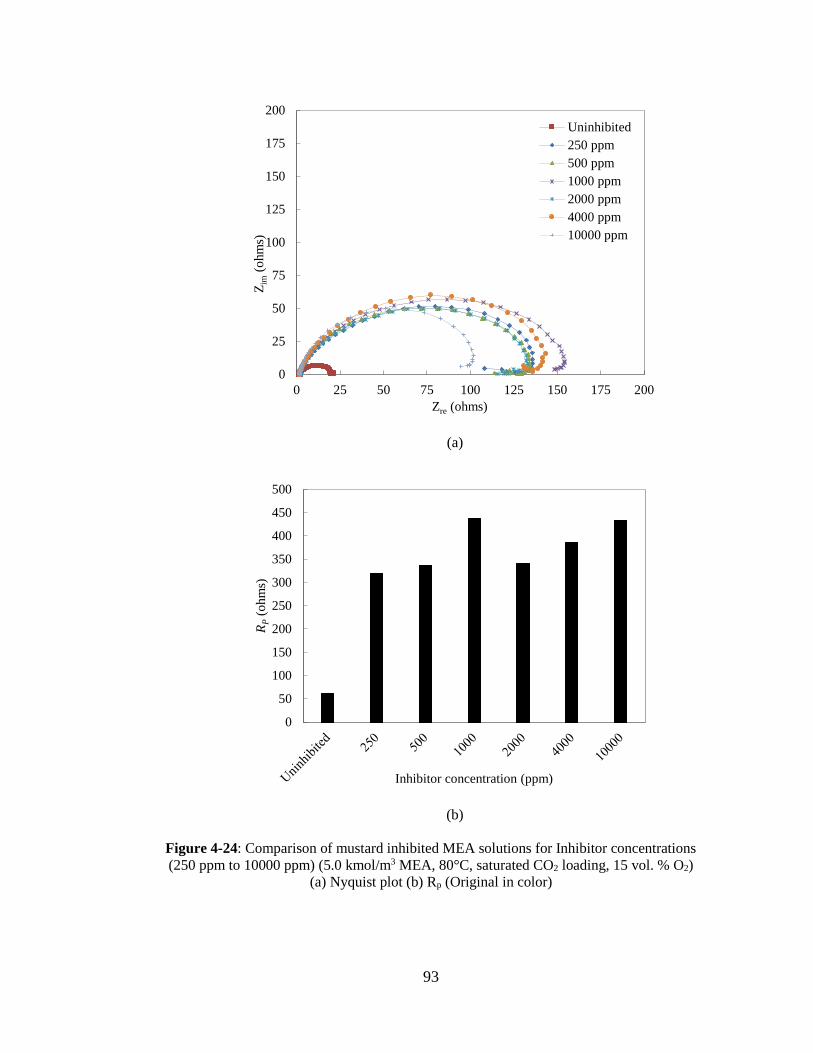
93
(a)
(b)
Figure 4-24: Comparison of mustard inhibited MEA solutions for Inhibitor concentrations
(250 ppm to 10000 ppm) (5.0 kmol/m3 MEA, 80°C, saturated CO2 loading, 15 vol. % O2)
(a) Nyquist plot (b) Rp (Original in color)
0
25
50
75
100
125
150
175
200
0 25 50 75 100 125 150 175 200
Zim
(ohm
s)
Zre (ohms)
Uninhibited
250 ppm
500 ppm
1000 ppm
2000 ppm
4000 ppm
10000 ppm
0
50
100
150
200
250
300
350
400
450
500
RP
(ohm
s)
Inhibitor concentration (ppm)
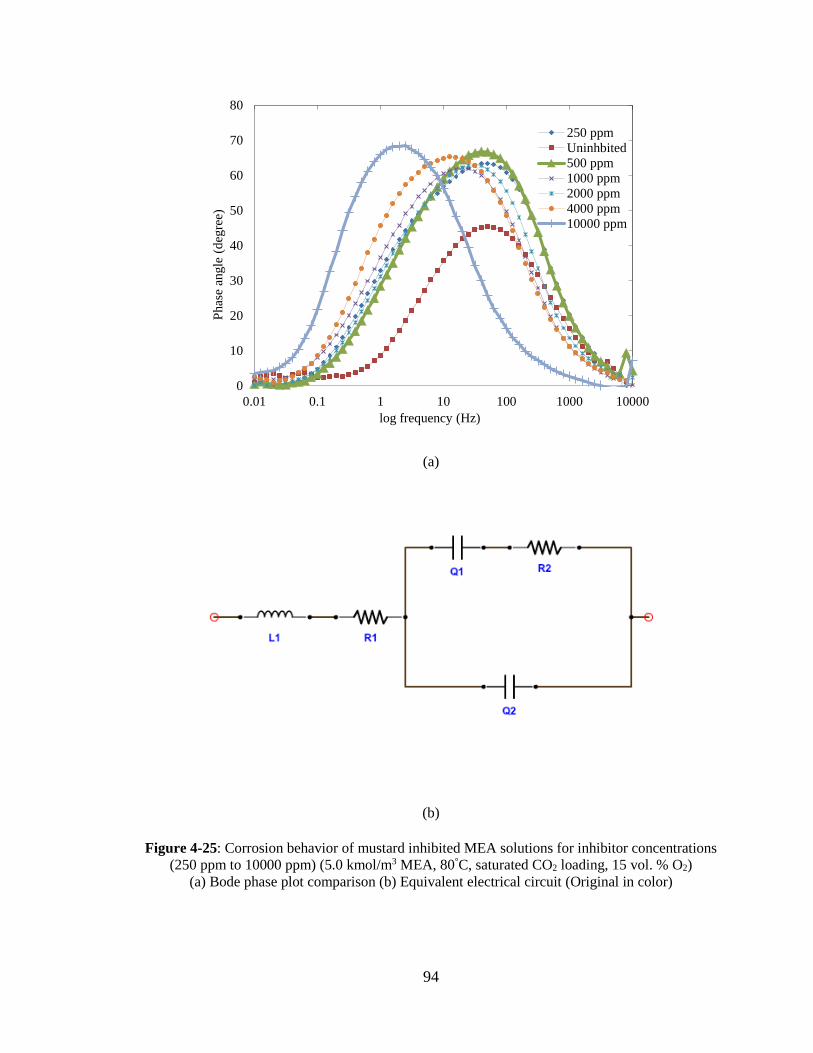
94
(a)
(b)
Figure 4-25: Corrosion behavior of mustard inhibited MEA solutions for inhibitor concentrations
(250 ppm to 10000 ppm) (5.0 kmol/m3 MEA, 80°C, saturated CO2 loading, 15 vol. % O2)
(a) Bode phase plot comparison (b) Equivalent electrical circuit (Original in color)
0
10
20
30
40
50
60
70
80
0.01 0.1 1 10 100 1000 10000
Phas
e an
gle
(d
egre
e)
log frequency (Hz)
250 ppm
Uninhbited
500 ppm
1000 ppm
2000 ppm
4000 ppm
10000 ppm

95
(a)
(b)
Figure 4-26: Corrosion behavior of garlic inhibited MEA solutions for inhibitor concentrations
(250 ppm to 10000 ppm) (5.0 kmol/m3 MEA, 80°C, saturated CO2 loading, 15 vol. % O2)
(a) Langmuir adsorption isotherm (b) Tafel slope comparison (Original in color)
R² = 0.9999
0
2
4
6
8
10
12
14
0 2 4 6 8 10 12
c/Θ
Inhibitor Concentration (g/L)
ΔG°ads = -27.71 kJ/mol
0
20
40
60
80
100
120
140
160
0 2000 4000 6000 8000 10000
β(m
V/d
ecad
e)
Inhibitor concentration (ppm)
βa Mustard
βc Mustard
96
-27.71 KJ/mol, indicating the inhibitor involved mixed type of adsorption.
4.2.2.3 Effect of temperature
The poteniodynamic polarization behavior of mustard inhibited solution was
compared with their corresponding uninhibited conditions at various temperatures as
shown in Figure 4.27. Ecorr was found slightly shifting from cathodic to anodic side with
rise in temperature of the solution. As observed in previous cases, the same trend was
observed for pH but there was no linearity in rise of temperature. The conductivity of
mustard inhibited solution on comparison with baseline at the corresponding temperature
was less. There was no pitting tendency observed when the cyclic polarization
performance was analyzed. icorr increased with temperature which was evident in the
corrosion rate as well. But there was no big change in βa while βc remained constant
irrespective of the rise in temperature. Inhibitor efficiency based on cyclic polarization
were compared as shown in Figure 4.28(a) remained in 90% range but decreased with
the increase in temperature. Figure 4.28(b) represents EIS (Nyquist plots) obtained for
mustard at various temperatures as the size of semicircle got reduced with increase in
temperature and this reciprocated as EIS efficiency too decreased with rise in
temperature. This is in a good agreement when Rp was compared as shown in Figure
4.28(c). But the shape of inhibited condition remained same, indicating temperature does
not affect the corrosion inhibition mechanism or its performance. Arrhenius plots were
made as shown in Figure 4.29. The higher values of Ea of the inhibited solution indicate
physical barrier is formed by formation of adsorptive film of electrostatic nature

97
(a) (b)
(c)
Figure 4-27: Corrosion behavior of mustard inhibited MEA solutions under the influence of
temperature (5.0 kmol/m3 MEA, saturated CO2 loading, presence of 15 vol.% O2)
Tafel plot comparison: (a) 40°C, (b) 60°C, and (c) 80°C (Original in color)
-1.00
-0.90
-0.80
-0.70
-0.60
-0.50
-0.40
1.00E-08 1.00E-05 1.00E-02
E (
V v
s A
g /
AgC
l)
log icorr (A/cm2)
Uninhibited
Mustard
-1.00
-0.90
-0.80
-0.70
-0.60
-0.50
-0.40
1.00E-08 1.00E-05 1.00E-02
E (
V v
s A
g /
AgC
l)
log icorr (A/cm2)
Uninhibited
Mustard
-1.00
-0.90
-0.80
-0.70
-0.60
-0.50
-0.40
1.00E-08 1.00E-05 1.00E-02
E (
V v
s A
g /
AgC
l)
log icorr (A/cm2)
Uninhibited
Mustard

98
Figure 4-28: Corrosion behavior comparison of mustard inhibited MEA solutions under the
influence of temperature (5.0 kmol/m3 MEA, saturated CO2 loading, presence of 15vol. % O2,
40-80°C): (a) Inhibition efficiency, (b) Nyquist plot, and (c) Rp (Original in color)
(a) (b)
(c)
0
10
20
30
40
50
60
70
80
90
100
40 60 80
Inhib
itio
n e
ffic
iency
(%
)
Temperature (°C)
0
100
200
300
400
500
600
700
800
0 100 200 300 400 500 600 700 800
Zim
(ohm
s)
Zre (ohms)
80°C
60°C
40°C
0
500
1000
1500
2000
40 60 80
RP
(ohm
s)
Temperature (°C)
Mustard
uninhibted
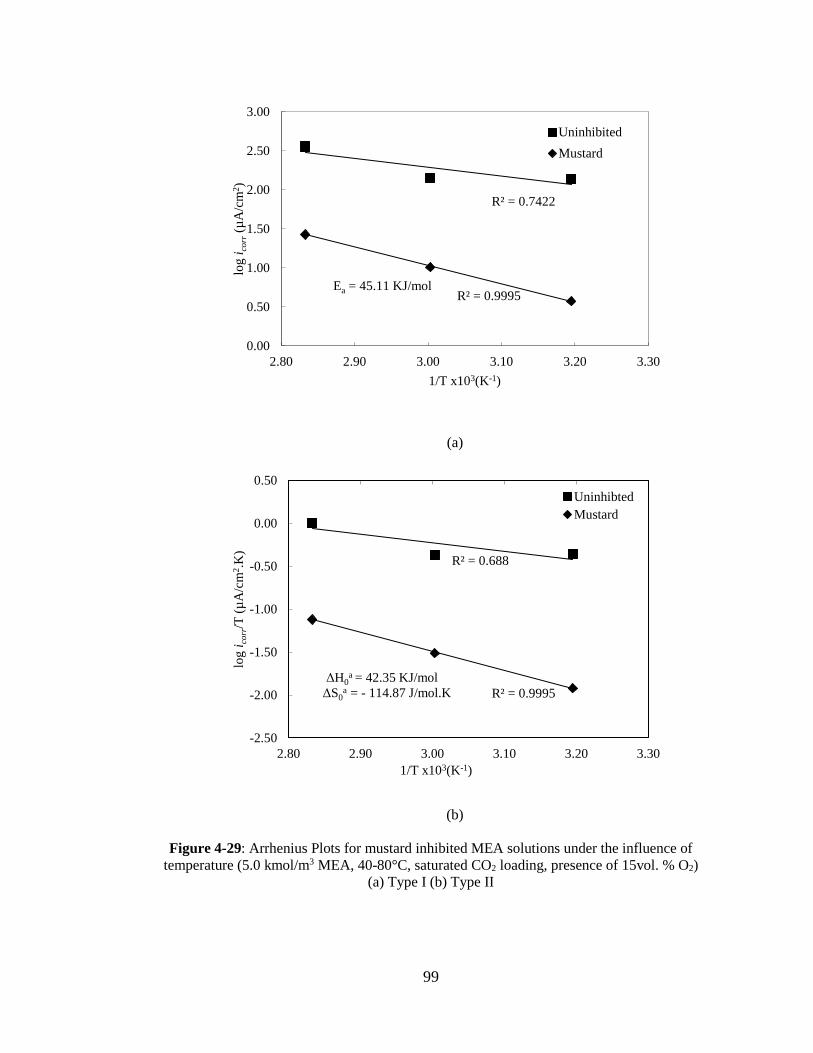
99
(a)
(b)
Figure 4-29: Arrhenius Plots for mustard inhibited MEA solutions under the influence of
temperature (5.0 kmol/m3 MEA, 40-80°C, saturated CO2 loading, presence of 15vol. % O2)
(a) Type I (b) Type II
R² = 0.7422
R² = 0.9995
0.00
0.50
1.00
1.50
2.00
2.50
3.00
2.80 2.90 3.00 3.10 3.20 3.30
log i
corr
(µA
/cm
2)
1/T x103(K-1)
Uninhibited
Mustard
Ea = 45.11 KJ/mol
R² = 0.688
R² = 0.9995
-2.50
-2.00
-1.50
-1.00
-0.50
0.00
0.50
2.80 2.90 3.00 3.10 3.20 3.30
log i
corr
/T (
µA
/cm
2.K
)
1/T x103(K-1)
Uninhibted
Mustard
ΔH0a = 42.35 KJ/mol
ΔS0a = - 114.87 J/mol.K
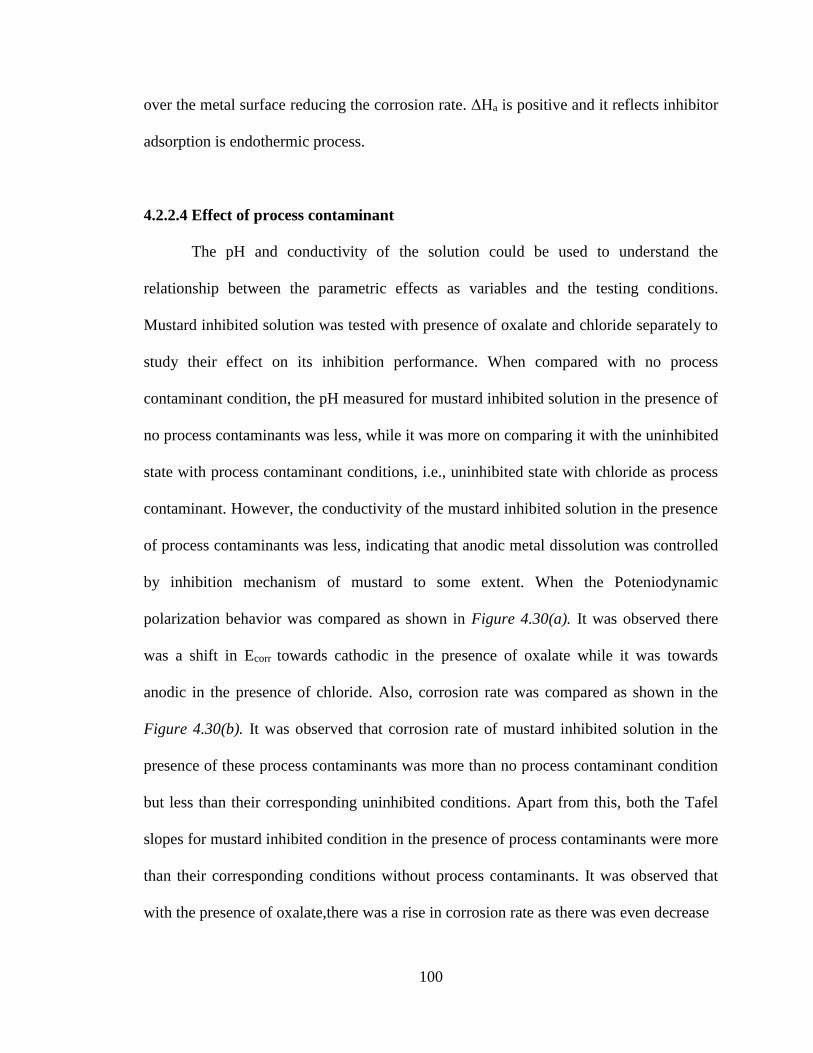
100
over the metal surface reducing the corrosion rate. ΔHa is positive and it reflects inhibitor
adsorption is endothermic process.
4.2.2.4 Effect of process contaminant
The pH and conductivity of the solution could be used to understand the
relationship between the parametric effects as variables and the testing conditions.
Mustard inhibited solution was tested with presence of oxalate and chloride separately to
study their effect on its inhibition performance. When compared with no process
contaminant condition, the pH measured for mustard inhibited solution in the presence of
no process contaminants was less, while it was more on comparing it with the uninhibited
state with process contaminant conditions, i.e., uninhibited state with chloride as process
contaminant. However, the conductivity of the mustard inhibited solution in the presence
of process contaminants was less, indicating that anodic metal dissolution was controlled
by inhibition mechanism of mustard to some extent. When the Poteniodynamic
polarization behavior was compared as shown in Figure 4.30(a). It was observed there
was a shift in Ecorr towards cathodic in the presence of oxalate while it was towards
anodic in the presence of chloride. Also, corrosion rate was compared as shown in the
Figure 4.30(b). It was observed that corrosion rate of mustard inhibited solution in the
presence of these process contaminants was more than no process contaminant condition
but less than their corresponding uninhibited conditions. Apart from this, both the Tafel
slopes for mustard inhibited condition in the presence of process contaminants were more
than their corresponding conditions without process contaminants. It was observed that
with the presence of oxalate,there was a rise in corrosion rate as there was even decrease
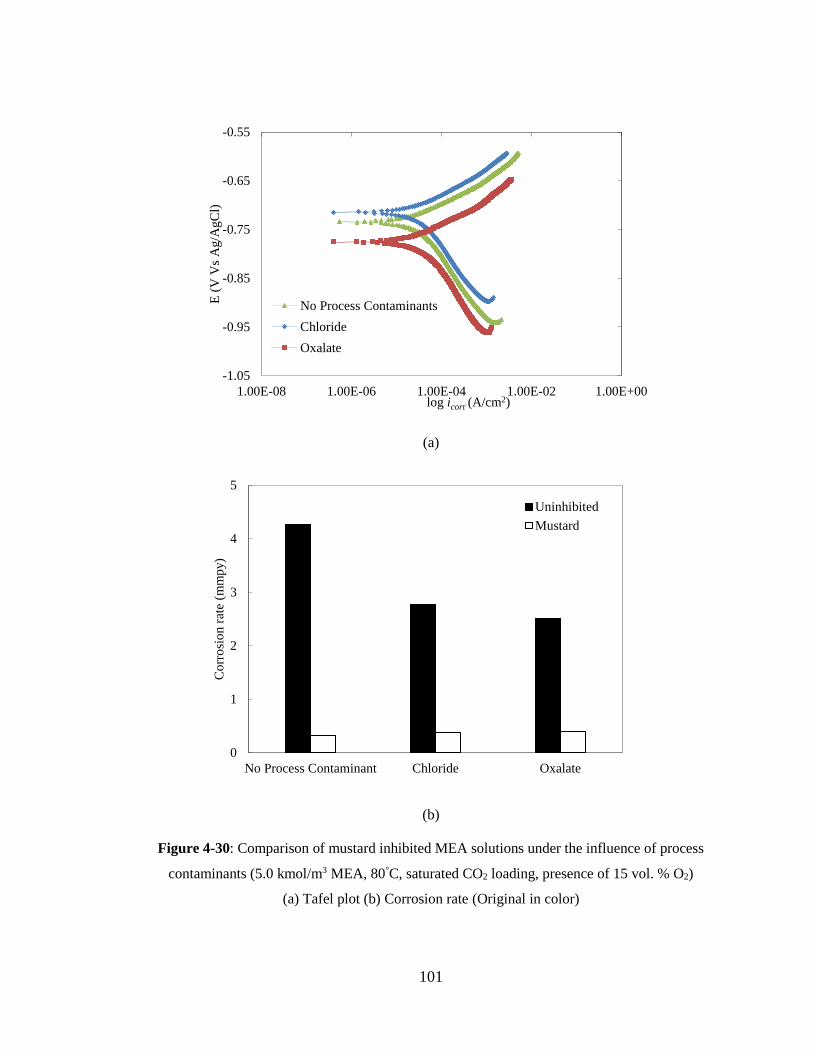
101
(a)
(b)
Figure 4-30: Comparison of mustard inhibited MEA solutions under the influence of process
contaminants (5.0 kmol/m3 MEA, 80°C, saturated CO2 loading, presence of 15 vol. % O2)
(a) Tafel plot (b) Corrosion rate (Original in color)
-1.05
-0.95
-0.85
-0.75
-0.65
-0.55
1.00E-08 1.00E-06 1.00E-04 1.00E-02 1.00E+00
E (
V V
s A
g/A
gC
l)
log icorr (A/cm2)
No Process Contaminants
Chloride
Oxalate
0
1
2
3
4
5
No Process Contaminant Chloride Oxalate
Co
rro
sio
n r
ate
(mm
py)
Uninhibited
Mustard

102
in conductivity of the solution the corrosion rate was more which might be due to
cathodic side reactions which is well supported by the fact that shift in Ecorr was towards
cathodic with more βc on comparison with no process contaminant condition.There was
no pitting tendency observed for any of the cases.EIS (Nyquist Plots) comparison was
shown in the Figure 4.31(a). The size of the semicircle decreased in the presence of
oxalate and chloride but there was no change in shape of it. Thus, it is clear that
inhibition mechanism remains the same irrespective of the presence of process
contaminants. Also, Rp for mustard inhibited solution in the presence of process
contaminants was compared as shown in the Figure 4.31(b). It is observed that Rp was
less for mustard inhibited solution than that without process contaminant condition,
indicating the resistance of inhibited solution got reduced in the presence of process
contaminants leading to increase in corrosion rate.
4.2.2.4 Quantum Chemical Analysis
The main constituents of chemicals present in mustard are namely Allyl
isothiocyanate, Sinigrin and Benzyl isothiocyanate [Bhattacharya, 2010; Herzallah et al.,
2012]. Parameters obtained for these chemicals through quantum chemical analysis are
shown in Table.4.6. It could be understood that ELUMO values of those compounds were
less on comparison with MEA indicates the tendency to accept electrons while EHOMO
values are less in comparison with MEA, indicating that corrosion inhibition is due to the
vacant innermost orbital present in the inhibitor for accepting electrons. Energy gap (ΔE)
values are lower in comparison with MEA indicating the corrosion inhibition is due to
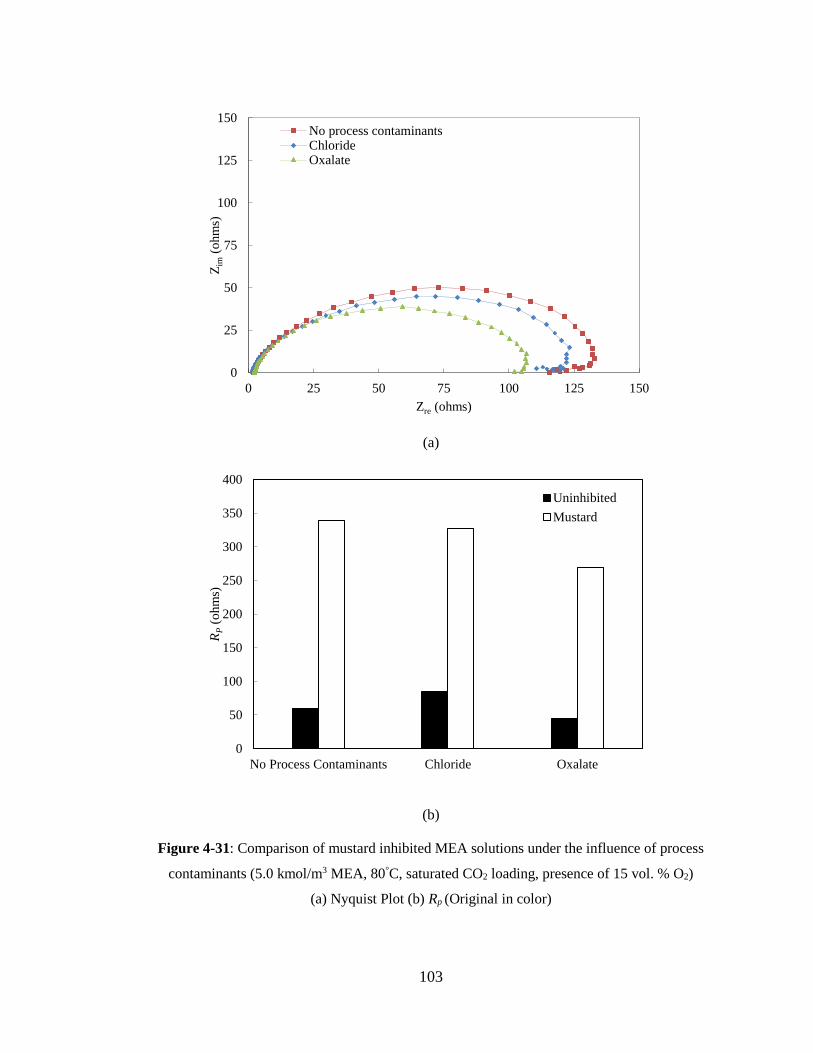
103
(a)
(b)
Figure 4-31: Comparison of mustard inhibited MEA solutions under the influence of process
contaminants (5.0 kmol/m3 MEA, 80°C, saturated CO2 loading, presence of 15 vol. % O2)
(a) Nyquist Plot (b) Rp (Original in color)
0
25
50
75
100
125
150
0 25 50 75 100 125 150
Zim
(ohm
s)
Zre (ohms)
No process contaminantsChlorideOxalate
0
50
100
150
200
250
300
350
400
No Process Contaminants Chloride Oxalate
RP
(ohm
s)
Uninhibited
Mustard

104
Table 4.6 Summary of Quantum Chemical Analysis of chemicals related with mustard
Properties MEA Allyl
isothiocyanate
Benzyl
isothiocyanate Sinigrin
EHOMO -6.77 -6.84 -6.76 -7.14
ELUMO -0.31 -0.92 -1.11 -1.32
Energy gap (ΔE) 6.46 5.92 5.64 5.82
Dipole moment 1.04 3.57 3.68 5.66
I 6.77 6.84 6.76 7.14
A 0.31 0.92 1.11 1.32
Electro-negativity (χ) 3.54 3.88 3.93 4.23
Hardness (γ) 3.23 2.96 2.82 2.91
(χ)Metal (Fe) 7.00 7.00 7.00 7.00
Absolute hardness of Fe
(Hardness (γ)) 0.00 0.00 0.00 0.00
Fraction of electrons
transferred (ΔN) 0.54 0.58 0.54 0.47

105
chemical adsorption (Salarvand, 2017).Electro-negativity (χ) values were high on
comparison with MEA, signifying that chemical potential required for corrosion
inhibition is high and hardness (γ), a representation for higher polarizability and better
inhibition, is low [Yilmaz, 2016].Fraction of electrons transferred (ΔN) was less than 3.6,
indicating the formation of adsorption layer to inhibit corrosion through electrons getting
donated from the inhibitors to the metal surface (Salarvand,2017). The optimized
structures of this compounds are shown in Figures 4.32 (a, b, and c) respectively. It is
clearly visible this structure has sulfur and nitrogen atoms with different functional
groups. From Figures 4.32 (c, d, and e) ,electron densities in LUMO level are more
surrounding the sulfur and nitrogen atoms and same is observed for HOMO levels from
Figure 4.32 (f, g, and h) indicating the presence of sulfur and nitrogen atom is
responsible for the inhibition quality of mustard.
4.2.3 Horseradish
4.2.3.1 Effect of O2
When the inhibited solution was compared in the presence of O2, there was not a
big shift in Tafel slopes as shown in Figures 4.33(a and b) and this was also evident in
the inhibition efficiency comparison as shown in Figure 4.33(d). But, for uninhibited
systems, there was a shift in Open circuit potential towards anodic side as shown in
Figures 4.33(c). Thus, it is evident that the inhibitor performance was not affected due to
the presence of oxygen.

106
Allyl isothiocyanate Benzyl isothiocyanate Sinigrin
(a) (b) (c)
(d) (e) (f)
(g) (h) (i)
Figure 4-32: Quantum Chemistry structures for Allyl isothiocyanate, Benzyl isothiocyanate and
Sinigrin (a, b, and c) Optimized molecular structures (d, e, and f) HOMO (g, h, and i) LUMO
(Original in color)
107
(a) (b)
(c) (d)
Figure 4-33: Comparison of horseradish inhibited MEA solutions in the presence and absence of
oxygen (5.0 kmol/m3 MEA, 80°C, saturated CO2 loading, 2000 ppm inhibitor concentration)
Polarization behavior in (a) absence, and (b) presence of oxygen (c) open circuit potential
(d) Inhibition efficiency (Original in color)
-1.00
-0.90
-0.80
-0.70
-0.60
1.00E-08 1.00E-05 1.00E-02
E (
V v
s A
g /
AgC
l )
log icorr (A/cm2)
Uninhibited
Horseradish
-1.00
-0.90
-0.80
-0.70
-0.60
1.00E-08 1.00E-05 1.00E-02
E (
V v
s A
g /
AgC
l)
log icorr (A/cm2)
Uninhibited
Horseradish
-0.80
-0.70
-0.60
-0.50
-0.40
-0.30
0 100 200 300
E (
V v
s A
g /
AgC
l)
Time(s)
Absence of oxygen
Presence of oxygen
0
10
20
30
40
50
60
70
80
90
100
Absence of
oxygen
Presence of
oxygen
Inhib
itio
n e
ffic
iency
(%
)

108
4.2.3.2 Effect of inhibitor concentration
To examine the effect of inhibitor concentration with the inhibitor performance,
various concentration ranges were tried from 250 ppm to 10000 ppm. When the
experimental conditions were monitored based on the concentration range, pH of testing
solution tended to be more alkaline with usage of inhibitors along with the decrease in
conductivity of the solution. There was also a shift in Ecorr towards cathodic side observed
when the Poteniodynamic polarization behavior was compared as shown in Figure
4.34(a). Irrespective of the inhibitor concentration, βa was low for all the inhibitor
concentrations when compared with uninhibited solution whereas the values of βc were
high irrespective of inhibitor concentrations. However, there was pitting tendency
observed above the concentration level of 250 ppm. The ƞ (based on cyclic polarization
curves) remained same in the range of 90% irrespective of inhibitor concentrations as
shown in the Figure 4.34(b). EIS Nyquist plots of horseradish inhibitor concentrations
were compared as shown in the Figure 4.35(a) below. There was a change in shape; size
of the semicircles obtained for the inhibited solution irrespective of their concentration
range, indicating that the inhibitor performs well .It was observed from the comparisons
shown in Figure 4.35(b) that Rp was more than that of the uninhibited solution indicating
that the horseradish inhibits corrosion reaction by increasing the resistance of the
solution. The experimental data related with the horseradish inhibited systems is shown
in Table 4.7 along with electrochemical data obtained. Bode phase plots as shown in
Figure 4.36 (a) indicates that there is only one constant phase element as all the inhibited
solution had a single peak on comparison with that of uninhibited solution.

109
(a)
(b)
Figure 4-34: Comparison of horseradish inhibited MEA solutions for inhibitor concentrations
(250 ppm to 10000 ppm) (5.0 kmol/m3 MEA, 80°C, saturated CO2 loading, 15 vol. % O2)
(a) Polarization behavior (b) Inhibition efficiency (Original in color)
-1.00
-0.90
-0.80
-0.70
-0.60
1.00E-08 1.00E-06 1.00E-04 1.00E-02 1.00E+00
E (
V v
s A
g /
AgC
l)
log icorr (A/cm2)
Uninhibited
250 ppm
500 ppm
1000 ppm
2000 ppm
4000 ppm
10000 ppm
0
10
20
30
40
50
60
70
80
90
100
250 500 1000 2000 4000 10000
Inhib
itio
n e
ffic
iency
(%
)
Inhibitor concentration (ppm)
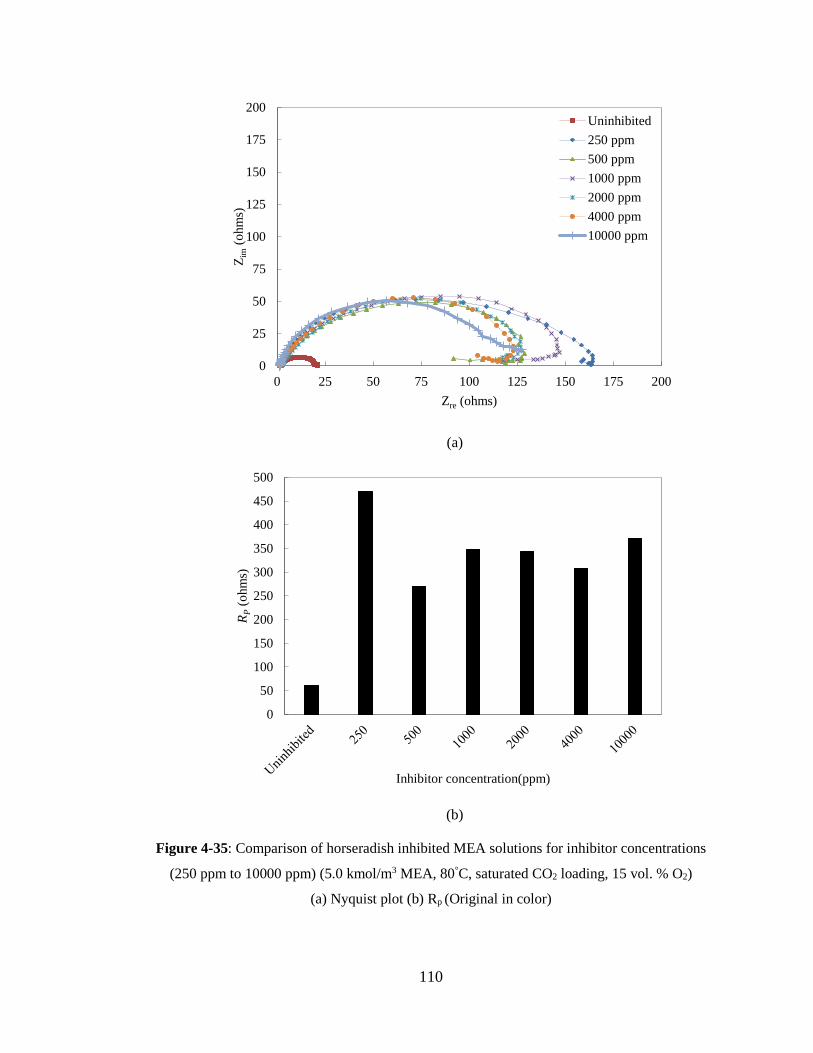
110
(a)
(b)
Figure 4-35: Comparison of horseradish inhibited MEA solutions for inhibitor concentrations
(250 ppm to 10000 ppm) (5.0 kmol/m3 MEA, 80°C, saturated CO2 loading, 15 vol. % O2)
(a) Nyquist plot (b) Rp (Original in color)
0
25
50
75
100
125
150
175
200
0 25 50 75 100 125 150 175 200
Zim
(ohm
s)
Zre (ohms)
Uninhibited
250 ppm
500 ppm
1000 ppm
2000 ppm
4000 ppm
10000 ppm
0
50
100
150
200
250
300
350
400
450
500
RP
(ohm
s)
Inhibitor concentration(ppm)

111
Table 4.7 Summary of experimental and electrochemical parameters for horseradish inhibited systems
Experimental Condition
5 kmol/m3,satd.CO2
loading
pH
σ
mS/c
m
Ecorr
mV
icorr
µA/cm2
βa
mV/decade
βc
mV/decade
CR
mmpy
CP
I.E
(%)
Pitting
tendency
Rp
Ωcm2
EIS
I.E
(%)
80°C,
absence of oxygen, inhibitor conc: 2000 ppm
8.05
±0.02
79.46
±0.11
-734.11
±2.18
19.88
±0.02
53.09
±1.45
125.63
±1.85
0.23
±0.03 93.74 Yes - -
80°C, 15 vol.% O2
Inhibitor conc.: 2000 ppm 8.15
±0.03
75.76
±0.07
-751.28
±4.25
27.21
±0.04
53.74
±1.85
124.85
±2.75
0.32
±0.02 92.45 No - -
80°C,
15 vol.% O2
250 8.41 77.25 -787.39 29.61 58.33 118.43 0.35 91.78 Yes 470.09 87.18
500 8.27 75.86 -758.01 24.76 52.79 127.45 0.29 93.13 No 269.61 77.65
1000 8.28 77.28 -752.35 25.53 55.45 125.14 0.31 92.92 No 347.96 82.69
2000 8.15
±0.03
75.76
±0.07
-751.28
±4.25
27.21
±0.04
53.74
±1.85
124.85
±2.75
0.32
±0.02 92.45 No 343.16 82.44
4000 8.38 77.21 -776.13 21.55 57.36 109.48 0.25 94.02 No 308.34 80.46
10000 8.28 75.35 -766.23 34.23 65.68 117.20 0.40 90.50 No 371.78 83.79
15 vol.% O2, Inhibitor conc:
2000 ppm
40°C 7.79 56.00 -730.89 7.17 46.63 140.05 0.08 94.80 No 227.17 -
60°C 7.93
±0.04
52.63
±0.09
-743.11
±3.15
38.84
±0.02
52.34
±2.96
153.21
±3.15
0.16
±0.01 90.73 No 485.82 71.5
80°C 8.15
±0.03
75.76
±0.07
-751.28
±4.25
27.21
±0.04
53.74
±1.85
124.85
±2.75
0.32
±0.02 92.45 No 342.22 82.39
80°C,
15 vol.% O2, Inhibitor conc:
2000 ppm
Chloride 8.08 71.30 -708.66 34.41 56.17 152.35 0.41 85.36 No 294.89 71.30
Oxalate 8.26 66.68 -787.36 33.31 65.45 131.38 0.39 84.31 No 254.82 82.51

112
The electrical circuit R(QR) as shown in the Figure 4.36(b),was found fitting for
the data obtained and the values are shown in Appendix, it indicates that there is a rise in
resistance of the solution whenever the inhibitor is used and this in good accordance with
the trend observed for Rp data. When Tafel slopes were compared with uninhibited
condition as shown in Figure 4.37(a), shows that horseradish acts as a mixed type
corrosion inhibitor affecting both sides of the corrosion reactions. To understand the
adsorption mechanism involved electrochemical data when fitted for adsorption isotherm
it followed Langmuir isotherm as shown in Figure 4.37(b) with standard free energy of
adsorption (ΔG°ads) as -29.59 KJ/mol, showing that inhibitor undergoes both
physisorption and chemisorption interaction with the metal surface.
4.2.3.3 Effect of temperature
Poteniodynamic polarization behavior of Horseradish inhibited solutions were
compared with their corresponding uninhibited solutions at various temperatures as
shown in Figure 4.38. As observed, Ecorr shifted from anodic to cathodic with the rise in
temperature. As observed in previous cases, there was an increase in pH and shifting it
towards alkaline nature. There was no pitting tendency observed while the corrosion rate
increased with rise in temperature. There was no linearity observed in icorr whereas βa
increased with increase in temperature. But βa of horseradish inhibited solution was less
on comparison with corresponding baseline at respective temperatures. However, the
inhibition efficiency remained in the range of 90% for all temperature range as shown in
Figure 4.39(a).EIS Nyquist plots for the Horseradish inhibited solutions at various
temperatures were compared as shown in Figure 4.39(b). There was a change in size of

113
(a)
(b)
Figure 4-36: Corrosion behavior of horseradish inhibited MEA solutions for inhibitor
concentrations (250 ppm to 10000 ppm) (5.0 kmol/m3 MEA, 80°C, saturated CO2 loading,
15 vol. % O2): (a) Bode phase plot comparison (b) Equivalent electrical circuit (Original in color)
0
10
20
30
40
50
60
70
0.01 0.1 1 10 100 1000 10000
Phas
e an
gle
(d
egre
e)
log frequency (Hz)
250 ppm
Uninhbited
500 ppm
1000 ppm
2000 ppm
4000 ppm
10000 ppm
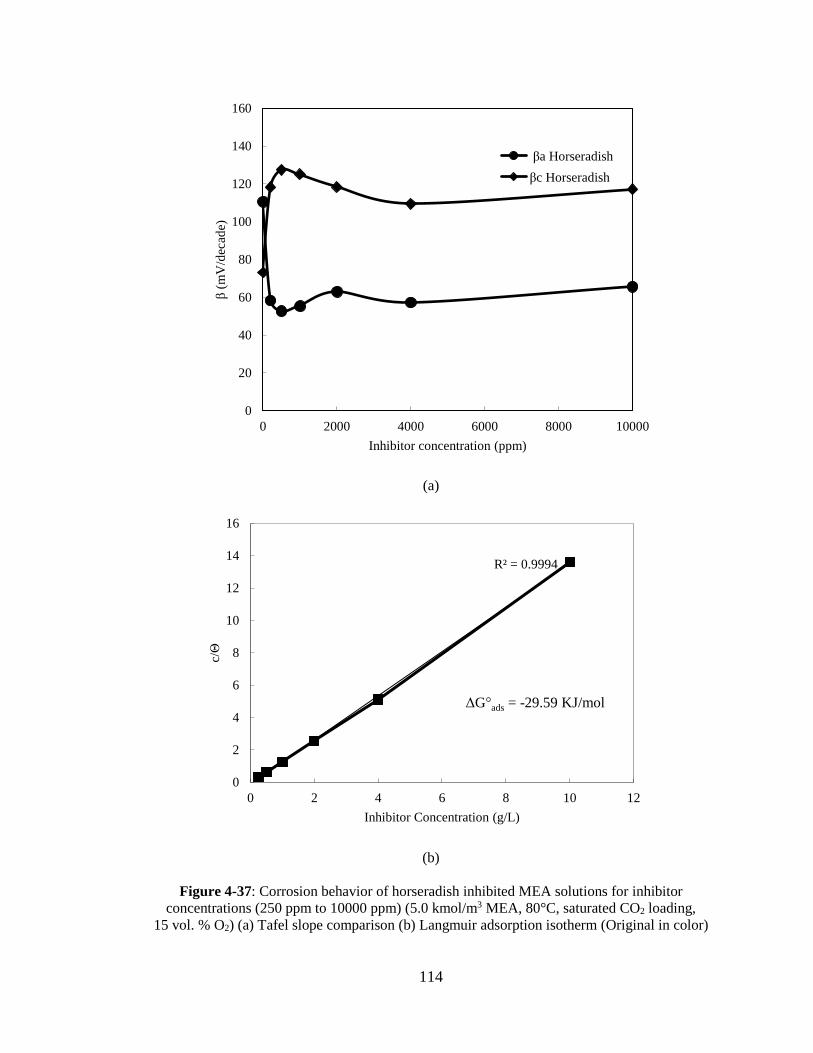
114
(a)
(b)
Figure 4-37: Corrosion behavior of horseradish inhibited MEA solutions for inhibitor
concentrations (250 ppm to 10000 ppm) (5.0 kmol/m3 MEA, 80°C, saturated CO2 loading,
15 vol. % O2) (a) Tafel slope comparison (b) Langmuir adsorption isotherm (Original in color)
0
20
40
60
80
100
120
140
160
0 2000 4000 6000 8000 10000
β(m
V/d
ecad
e)
Inhibitor concentration (ppm)
βa Horseradish
βc Horseradish
R² = 0.9994
0
2
4
6
8
10
12
14
16
0 2 4 6 8 10 12
c/Θ
Inhibitor Concentration (g/L)
ΔG°ads = -29.59 KJ/mol

115
(a) (b)
(c)
Figure 4-38: Corrosion behavior of horseradish inhibited MEA solutions under the influence of
temperature (5.0 kmol/m3 MEA, saturated CO2 loading, presence of 15vol.% O2)Tafel plot
comparison: (a) 40°C, (b) 60°C,and (c) 80°C (Original in color)
-1.00
-0.90
-0.80
-0.70
-0.60
-0.50
1.00E-08 1.00E-05 1.00E-02
E (
V V
s A
g/A
gC
l)
log icorr (A/cm2)
Uninhibited
Horseradish
-1.00
-0.90
-0.80
-0.70
-0.60
-0.50
-0.40
1.00E-08 1.00E-05 1.00E-02
E (
V V
s A
g/A
gC
l)
log icorr (A/cm2)
Uninhibited
Horseradish
-1.00
-0.90
-0.80
-0.70
-0.60
-0.50
1.00E-08 1.00E-05 1.00E-02
E (
V V
s A
g/A
gC
l)
log icorr (A/cm2)
uninhibited
Horseradish

116
(a) (b)
(c)
Figure 4-39: Comparison of horseradish inhibited MEA solutions under the influence of
temperature (5.0 kmol/m3 MEA, saturated CO2 loading, presence of 15 vol. % O2, 40-80°C)
(a) Inhibition efficiency, (b) Nyquist plot, and (c) Rp (Original in color)
0
10
20
30
40
50
60
70
80
90
100
40 60 80
Inhib
itio
n e
ffic
iency
(%)
Temperature (°C)
0
100
200
300
400
500
600
700
0 100 200 300 400 500 600 700
Zim
(ohm
s)
Zre (ohms)
80°C
60°C
40°C
0
50
100
150
200
250
300
350
400
450
500
40 60 80
RP
(ohm
s)
Temperature (°C)
Horseradish
uninhibted

117
the semicircle with rise in temperature but there was linearity in that as 60°C was found
more optimum for the performance of the horseradish which was further justified when
their Rp was compared as shown in Figure 4.39(c). Arrhenius plots were made as shown
in Figure 4.40 and thermodynamic parameters were obtained. Higher Ea values indicate
that there was rise in energy barrier due to corrosion inhibition process. Since dissolution
of the metal is slow in the presence of inhibitors positive value of ΔHa° was obtained
indicating corrosion inhibition process as endothermic.
4.2.3.3 Effect of process contaminants
Horseradish inhibited solution was tested in the presence of process contaminants
seperately to study their effect on the performance.In the presence of oxalate,pH of the
inhibited solution was more on comparision with no process contaminant condition while
in the presence of chloride it was less.But,on comparision with uninhibited conditions
with process contaminants, pH of the horseradish inhibited solution was more for both
cases, and thus proving that inhibitior clearly increases the pH of the solution. When
conductivity of the inhibited solution was taken into consideration,it was less when
compared with both cases.This is also a clear indication that anodic metal dissolution is
clearly controlled due to the influence of inhibitor as shown in Figure 4.41(a). It could be
observed that process contaminants influence in the performance of this inhibitor. Ecorr
with the presence of oxalate shifted towards cathodic ,whereas in the presence of
chloride shifted towards anodic on comparision with no process contaminant
condition.This shift is clearly supported when Tafel slopes were considered as βa in the

118
(a)
(b)
Figure 4-40: Arrhenius Plots for horseradish inhibited MEA solutions under the influence of
temperature (5.0 kmol/m3 MEA, 40-80°C, saturated CO2 loading, presence of 15 vol. % O2)
(a) Type I (b) Type II
R² = 0.7422
R² = 0.604
0.00
0.50
1.00
1.50
2.00
2.50
3.00
2.80 2.90 3.00 3.10 3.20 3.30
log i
corr
(µA
/cm
2)
1/T x103(K-1)
Uninhibited
Horseradish
Ea = 31.88 KJ/mol
R² = 0.688
R² = 0.5591
-1.80
-1.60
-1.40
-1.20
-1.00
-0.80
-0.60
-0.40
-0.20
0.00
0.20
2.80 2.90 3.00 3.10 3.20 3.30
log i
corr
/T (
µA
/cm
2.K
)
1/T x103(K-1)
Uninhibted
Horseradish
ΔH0a = 29.12 KJ/mol
ΔS0a = -149.14 J/mol.K

119
presence of oxalate was more than that without process contaminant condition with vice
versa for βc in the presence of chloride. The corrosion rates are compared as shown in
Figure 4.41(b),in the presence of oxalate and chloride corrosion rates were larger than
that of no process contaminant condition but less than their corresponding uninhibited
conditions.There was no pitting tendency reported for any of the cases and there was a
decrease in inhibition effieicincy in the presence of this process contaminants.EIS
Nyquist plots were compared asshown in the Figure 4.42(a). It was clearly visible that, in
the presence of process contaminants size of the semicircle got decreased without any
change in the shape indicating the effect of process contaminant in the performance of the
inhibitior. Horseradish inhibited systems performed well as seen from their increased Rp
when compared correspondingly with their uninhibited conditions as shown in the Figure
4.42(b).
4.2.3.4 Quantum Chemical Analysis
According to literature (Wu et al., 2009; Chen et al., 2012), Allyl isothiocyanate,
Peroxidase, Phenethyl isothiocyanate and Theaflavin were the main chemicals present in
horseradish. The quantum analyses of these compounds have been obtained and
parameters related with them were obtained as shown in Table 4.8. It could be understood
that EHOMO values are less in comparison with MEA, while ELUMO values of those
compounds were also less on comparison with MEA. This indicates the tendency to
accept electrons could be the reason behind corrosion inhibition. Low energy gap (ΔE)
values on comparison with MEA indicating the corrosion inhibition is due to chemical
adsorption (Salarvand, 2017). Electro negativity (χ) values were high on comparison with
MEA, signifying that chemical potential required for corrosion inhibition is high and

120
(a)
(b)
Figure 4-41: Comparison of horseradish inhibited MEA solutions under the influence of process
contaminants (5.0 kmol/m3 MEA, 80°C, saturated CO2 loading, presence of 15 vol. % O2)
(a) Tafel plot (b) Corrosion rate (Original in color)
-1.05
-0.95
-0.85
-0.75
-0.65
-0.55
1.00E-08 1.00E-06 1.00E-04 1.00E-02 1.00E+00
E (
V V
s A
g/A
gC
l)
log icorr (A/cm2)
No Process contaminants
Chloride
Oxalate
0
1
2
3
4
5
No Process contaminants Chloride Oxalate
Co
rro
sio
n r
ate
(mm
py)
Uninhibited
Onion

121
(a)
(b)
Figure 4-42: Comparison of horseradish inhibited MEA solutions under the influence of process
contaminants (5.0 kmol/m3 MEA, 80°C, saturated CO2 loading, presence of 15 vol. % O2)
(a) Nyquist Plot (b) Rp (Original in color)
0
25
50
75
100
125
150
0 25 50 75 100 125 150
Zim
(ohm
s)
Zre (ohms)
No process contaminantsChlorideOxalate
0
50
100
150
200
250
300
350
400
No Process contaminants Chloride Oxalate
RP
(ohm
s)
Uninhibited
Onion
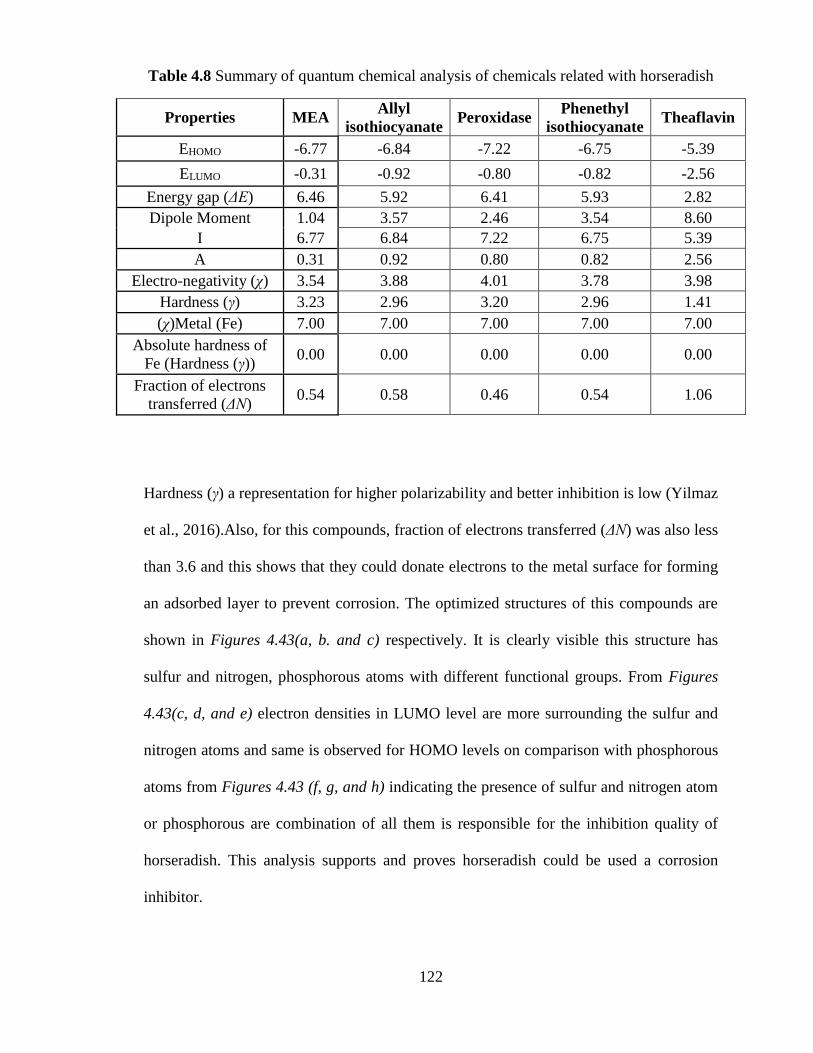
122
Hardness (γ) a representation for higher polarizability and better inhibition is low (Yilmaz
et al., 2016).Also, for this compounds, fraction of electrons transferred (ΔN) was also less
than 3.6 and this shows that they could donate electrons to the metal surface for forming
an adsorbed layer to prevent corrosion. The optimized structures of this compounds are
shown in Figures 4.43(a, b. and c) respectively. It is clearly visible this structure has
sulfur and nitrogen, phosphorous atoms with different functional groups. From Figures
4.43(c, d, and e) electron densities in LUMO level are more surrounding the sulfur and
nitrogen atoms and same is observed for HOMO levels on comparison with phosphorous
atoms from Figures 4.43 (f, g, and h) indicating the presence of sulfur and nitrogen atom
or phosphorous are combination of all them is responsible for the inhibition quality of
horseradish. This analysis supports and proves horseradish could be used a corrosion
inhibitor.
Table 4.8 Summary of quantum chemical analysis of chemicals related with horseradish
Properties MEA Allyl
isothiocyanate Peroxidase
Phenethyl
isothiocyanate Theaflavin
EHOMO -6.77 -6.84 -7.22 -6.75 -5.39
ELUMO -0.31 -0.92 -0.80 -0.82 -2.56
Energy gap (ΔE) 6.46 5.92 6.41 5.93 2.82
Dipole Moment 1.04 3.57 2.46 3.54 8.60
I 6.77 6.84 7.22 6.75 5.39
A 0.31 0.92 0.80 0.82 2.56
Electro-negativity (χ) 3.54 3.88 4.01 3.78 3.98
Hardness (γ) 3.23 2.96 3.20 2.96 1.41
(χ)Metal (Fe) 7.00 7.00 7.00 7.00 7.00
Absolute hardness of
Fe (Hardness (γ)) 0.00 0.00 0.00 0.00 0.00
Fraction of electrons
transferred (ΔN) 0.54 0.58 0.46 0.54 1.06
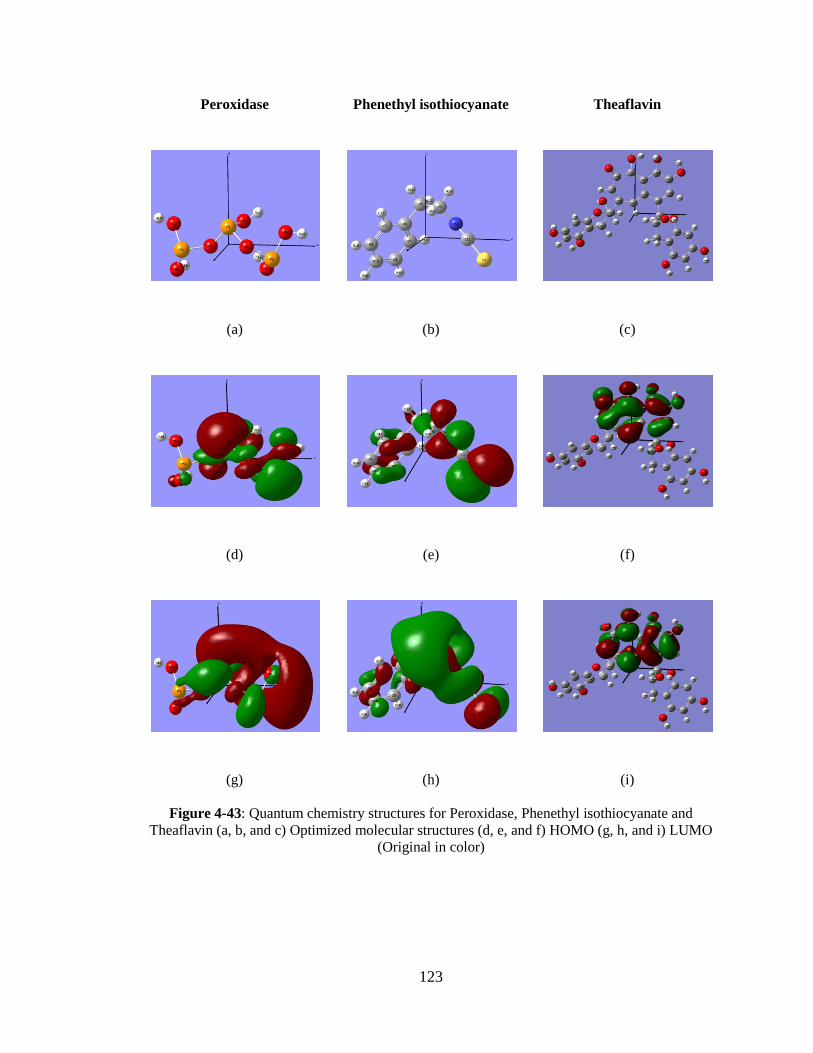
123
Peroxidase Phenethyl isothiocyanate Theaflavin
(a) (b) (c)
(d) (e) (f)
(g) (h) (i)
Figure 4-43: Quantum chemistry structures for Peroxidase, Phenethyl isothiocyanate and
Theaflavin (a, b, and c) Optimized molecular structures (d, e, and f) HOMO (g, h, and i) LUMO
(Original in color)

124
4.2.4 Onion
4.2.4.1 Effect of O2
The inhibited solution in the presence of O2 had a shift from cathodic side to
anodic side on comparison with corresponding blank solutions as shown in Figure
4.44(a). There is a decrease in conductivity and in both Tafel slopes. Also, there is a
sharp increase in inhibition efficiency under the influence of O2 and also there is a shift
towards to anodic side when open circuit potentials were compared in the presence of
oxygen as shown in Figure 4.44(d).The inhibitor performance got enhanced with the
presence of oxygen. Based on the relation between conductivity of solution and the I corr
which is indirectly related with corrosion rate of metal specimen. It could be found that
whenever there is a decrease in conductivity of the inhibited solution due to the influence
of oxygen there was a less corrosion rate. This could be further explained by the fact that
conductivity of the solution is mainly due to the presence of dissociated Fe ions (metal
ions) as a result of anodic corrosion reaction, i.e., metal dissolution. So, it could be
assessed that under the influence of oxygen, onion forms a passive layer over the metal
surface which prevents the metal dissolution to a certain extent.
4.2.4.2 Effect of inhibitor concentration
It was observed that the conductivity of inhibited solution decreased but not so
drastically. Also, βa of inhibited solution was low when compared with blank solution
while the trend of βc was vice versa. icorr of inhibited solution was low too for all
inhibition concentrations as shown in the Figure 4.45(a),while the corrosion rate
decreased linearly with increase in concentration of inhibitor. ƞ increased after 1000 ppm

125
(a) (b)
(c) (d)
Figure 4-44: Corrosion behavior comparisons of onion inhibited MEA solutions in the presence
and absence of oxygen (5.0 kmol/m3 MEA, 80°C, saturated CO2 loading, 2000 ppm inhibitor
concentration) Polarization behavior in (a) absence (b) presence of oxygen, and (c) Open circuit
(Original in color)
-1.00
-0.90
-0.80
-0.70
-0.60
-0.50
1.00E-08 1.00E-05 1.00E-02
E (
V v
s A
g /
AgC
l )
log icorr (A/cm2)
Uninhibted
Onion-1.00
-0.90
-0.80
-0.70
-0.60
-0.50
1.00E-08 1.00E-05 1.00E-02
E (
V v
s A
g /
AgC
l)
log icorr (A/cm2)
Uninhibted
Onion
-0.80
-0.70
-0.60
-0.50
-0.40
-0.30
0 200 400 600
E (
V v
s A
g /
AgC
l)
Time(s)
Absence of oxygen
Presence of oxygen
0
10
20
30
40
50
60
70
80
90
100
Absence of
oxygen
Presence of
oxygen
Inhib
itio
n e
ffic
iency
(%
)

126
(a)
(b)
Figure 4-45: Corrosion behavior comparison of onion inhibited MEA solutions for inhibitor
concentrations (200 ppm to 10000 ppm) (5.0 kmol/m3 MEA, 80°C, saturated CO2 loading,
15 vol. % O2): (a) Polarization behavior (b) Inhibition efficiency comparison (Original in color)
-1.00
-0.90
-0.80
-0.70
-0.60
1.00E-08 1.00E-05 1.00E-02
E (
V v
s A
g /
AgC
l)
log icorr (A/cm2)
Uninhibited
250 ppm
500 ppm
1000 ppm
2000 ppm
4000 ppm
10000 ppm
1500 ppm
6000 ppm
0
10
20
30
40
50
60
70
80
90
100
200 500 1000 1500 2000 4000 6000 10000
Inhib
itio
n e
ffic
iency
(%
)
Inhibitor concentration (ppm)
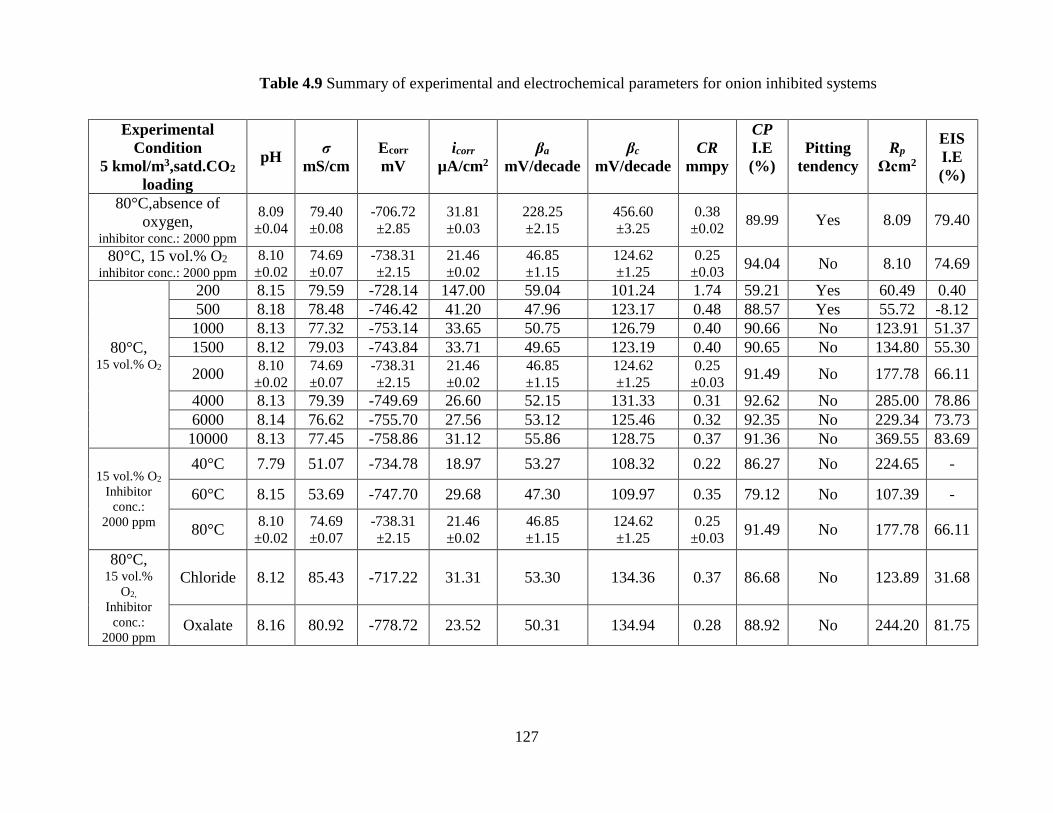
127
Experimental
Condition
5 kmol/m3,satd.CO2
loading
pH σ
mS/cm
Ecorr
mV
icorr
µA/cm2
βa
mV/decade
βc
mV/decade
CR
mmpy
CP
I.E
(%)
Pitting
tendency
Rp
Ωcm2
EIS
I.E
(%)
80°C,absence of
oxygen, inhibitor conc.: 2000 ppm
8.09
±0.04
79.40
±0.08
-706.72
±2.85
31.81
±0.03
228.25
±2.15
456.60
±3.25
0.38
±0.02 89.99 Yes 8.09 79.40
80°C, 15 vol.% O2 inhibitor conc.: 2000 ppm
8.10
±0.02
74.69
±0.07
-738.31
±2.15
21.46
±0.02
46.85
±1.15
124.62
±1.25
0.25
±0.03 94.04 No 8.10 74.69
80°C, 15 vol.% O2
200 8.15 79.59 -728.14 147.00 59.04 101.24 1.74 59.21 Yes 60.49 0.40
500 8.18 78.48 -746.42 41.20 47.96 123.17 0.48 88.57 Yes 55.72 -8.12
1000 8.13 77.32 -753.14 33.65 50.75 126.79 0.40 90.66 No 123.91 51.37
1500 8.12 79.03 -743.84 33.71 49.65 123.19 0.40 90.65 No 134.80 55.30
2000 8.10
±0.02
74.69
±0.07
-738.31
±2.15
21.46
±0.02
46.85
±1.15
124.62
±1.25
0.25
±0.03 91.49 No 177.78 66.11
4000 8.13 79.39 -749.69 26.60 52.15 131.33 0.31 92.62 No 285.00 78.86
6000 8.14 76.62 -755.70 27.56 53.12 125.46 0.32 92.35 No 229.34 73.73
10000 8.13 77.45 -758.86 31.12 55.86 128.75 0.37 91.36 No 369.55 83.69
15 vol.% O2
Inhibitor
conc.:
2000 ppm
40°C 7.79 51.07 -734.78 18.97 53.27 108.32 0.22 86.27 No 224.65 -
60°C 8.15 53.69 -747.70 29.68 47.30 109.97 0.35 79.12 No 107.39 -
80°C 8.10
±0.02
74.69
±0.07
-738.31
±2.15
21.46
±0.02
46.85
±1.15
124.62
±1.25
0.25
±0.03 91.49 No 177.78 66.11
80°C, 15 vol.%
O2,
Inhibitor
conc.:
2000 ppm
Chloride 8.12 85.43 -717.22 31.31 53.30 134.36 0.37 86.68 No 123.89 31.68
Oxalate 8.16 80.92 -778.72 23.52 50.31 134.94 0.28 88.92 No 244.20 81.75
Table 4.9 Summary of experimental and electrochemical parameters for onion inhibited systems

128
of inhibitor concentration as it could be seen from Figure 4.45(b),whereas the pitting
tendency was observed up to the concentration level of 500 ppm. Nyquist plots from EIS
was compared for various concentration range of onion as shown in Figure 4.43(a), it was
observed that there was change in size and shape of semicircle on comparison with
uninhibited solutions. Also, from Figure 4.46(b), it was evident that Rp increased after
1000 ppm of inhibitor concentration and this performance is in accordance with ƞ trend
observed from cyclic polarization technique. Bode phase plots when compared as shown
in Figure 4.47(a), two peaks were observed for inhibited solution, indicating two
constant phase elements could be present in inhibition mechanism. Data were fitted for
the electrical circuit (R(QR)(Q(R (LR)))) mentioned in Figure 4.47(b).Also, the values of
those parameters were mentioned in Appendix. It was well understood from these values
that resistance of the solution increased when the inhibitor concentration was over 1000
ppm and this looks in total agreement with Rp values reported above. Onion as a
corrosion inhibitor followed Langmuir adsorption isotherm as shown in Figure 4.48(a),
and standard free energy of adsorption (ΔG°ads) obtained was -30.57 KJ/mol, indicating it
as a mixed type inhibitor. When the Tafel slopes were compared as shown in Figure 4.48
(b), it could be seen that both anodic and cathodic Tafel slopes varied in comparison with
uninhibited condition with a rise in inhibitor concentration, indicating the indicator
follows a mixed type of adsorption.
4.2.4.3 Effect of temperature
Cyclic polarization behaviors were compared with their uninhibited solution as
shown above in Figure 4.49(a-c). It was observed there was no big shift in Ecorr with the

129
(a)
(b)
Figure 4-46: Comparison of onion inhibited MEA solutions for inhibitor concentrations
(200 ppm to 10000 ppm) (5.0 kmol/m3 MEA, 80°C, saturated CO2 loading, 15 vol. % O2)
(a) Nyquist plot (b) Rp (Original in color)
0
50
100
150
200
250
300
350
400
RP
(ohm
s)
Inhibitor concentration( ppm)
0
20
40
60
80
100
120
140
160
180
200
0 20 40 60 80 100 120 140 160 180 200
Zim
(ohm
s)
Zre (ohms)
Uninhibited
200 ppm
500 ppm
1000 ppm
2000 ppm
4000 ppm
10000 ppm
1500 ppm
6000 ppm
0
2
4
6
8
0 10 20 30
Zim
(ohm
s)
Zre (ohms)

130
(a)
(b)
Figure 4-47: Corrosion behavior of onion inhibited MEA solutions for inhibitor concentrations
(200 ppm to 10000 ppm) (5.0 kmol/m3 MEA, 80°C, saturated CO2 loading, 15 vol. % O2)
(a) Bode phase angle plot comparison (b) Equivalent electrical circuit (Original in color)
0
10
20
30
40
50
60
70
0.01 0.1 1 10 100 1000 10000
Phas
e an
gle
(d
egre
e)
log frequency (Hz)
200 ppm
Uninhbited
500 ppm
1000 ppm
4000 ppm
10000 ppm
1500 ppm
2000 ppm
6000 ppm

131
(a)
(b)
Figure 4-48: Corrosion behavior of onion inhibited MEA solutions for inhibitor concentrations
(200 ppm to 10000 ppm) (5.0 kmol/m3 MEA, 80°C, saturated CO2 loading, 15 vol. % O2)
(a) Tafel slope comparison (b) Langmuir adsorption isotherm
0
2
4
6
8
10
12
0 2 4 6 8 10 12
C/Θ
Inhibitor concentration (g/L)
ΔG°ads = -30.57 KJ/mol
0
20
40
60
80
100
120
140
160
0 2000 4000 6000 8000 10000
β(m
V/d
ecad
e)
Inhibitor concentration (ppm)
βa Onion
βc Onion

132
(a) (b)
(c)
Figure 4-49: Corrosion behavior of onion inhibited MEA solutions under the influence of
temperature (5.0 kmol/m3 MEA, saturated CO2 loading, presence of 15 vol.% O2) Tafel plot
comparison (a) 40°C, (b) 60°C, and (c) 80° C (Original in color)
-1.00
-0.90
-0.80
-0.70
-0.60
-0.50
1.00E-08 1.00E-05 1.00E-02
E (
V V
s A
g/A
gC
l)
log icorr (A/cm2)
Uninhibted
Onion
-1.00
-0.90
-0.80
-0.70
-0.60
-0.50
1.00E-08 1.00E-05 1.00E-02
E (
V V
s A
g/A
gC
l)
log icorr (A/cm2)
Uninhibted
Onion
-1.10
-1.00
-0.90
-0.80
-0.70
-0.60
-0.50
1.00E-08 1.00E-05 1.00E-02
E (
V V
s A
g/A
gC
l)
log icorr (A/cm2)
uninhibted
Onion

133
increase in temperature. There was a change in pH from temperature 40 to 60°C, but there
was a linear increase in conductivity of the solution. The conductivity of inhibited
solution was less than their uninhibited counterparts at corresponding temperatures.
There was no pitting tendency observed while the icorr increased with rise in temperature.
Similar trend was observed for βc and βa remained almost constant with the increase in
temperature. There was no linearity observed for inhibitor efficiency based on cyclic
poteniodynamic behaviors as shown in Figure 4.50(a).EIS Nyquist plots for the onion
inhibited solution for various temperatures as shown in Figure 4.50(b) resembled there
was change in size of the semicircle with no linearity, while 60°C was not found suitable
for the performance of inhibitor whereas the inhibitor performed well for 80°C. This was
further justified when Rp was compared for the onion inhibited solution at various
temperatures as shown in Figure 4.50(c). Arrhenius plots were made as shown in Figure
4.51. Ea values of inhibited solution were low than those of the uninhibited state due to
the lowering of energy barrier for the corrosion process so that chemical adsorption could
be favored. Also, the values of Ea and ΔHa° ideally should be equal for a chemical
reaction in electrolytic solutions. Similarly, it was observed here as well with almost a
constant and small difference between the two values in all the cases. The positive value
of ΔHa° indicates that dissolution reaction is endothermic while dissolution of the metal is
difficult and slow in the presence of all the inhibitors. The superior performance of onion
could be further justified when ΔSa° was considered as it is lower than uninhibited state
due to the ordering of adsorbed molecules in the presence of inhibitor

134
(a) (b)
(c)
Figure 4-50: Comparison of onion inhibited MEA solutions under the influence of temperature
(5.0 kmol/m3 MEA, saturated CO2 loading, presence of 15 vol. % O2, 40-80°C)
(a) Inhibition efficiency, (b) Nyquist plot, and (c) Rp (Original in color)
0
10
20
30
40
50
60
70
80
90
100
40 60 80
Inhib
itio
n e
ffic
iency
(%)
Temperature (°C)
0
50
100
150
200
250
300
350
400
0 50 100 150 200 250 300 350 400
Zim
(ohm
s)
Zre (ohms)
80°C
60°C
40°C
0
50
100
150
200
250
300
40 60 80
RP
(ohm
s)
Temperature (°C)
Onion
uninhibted
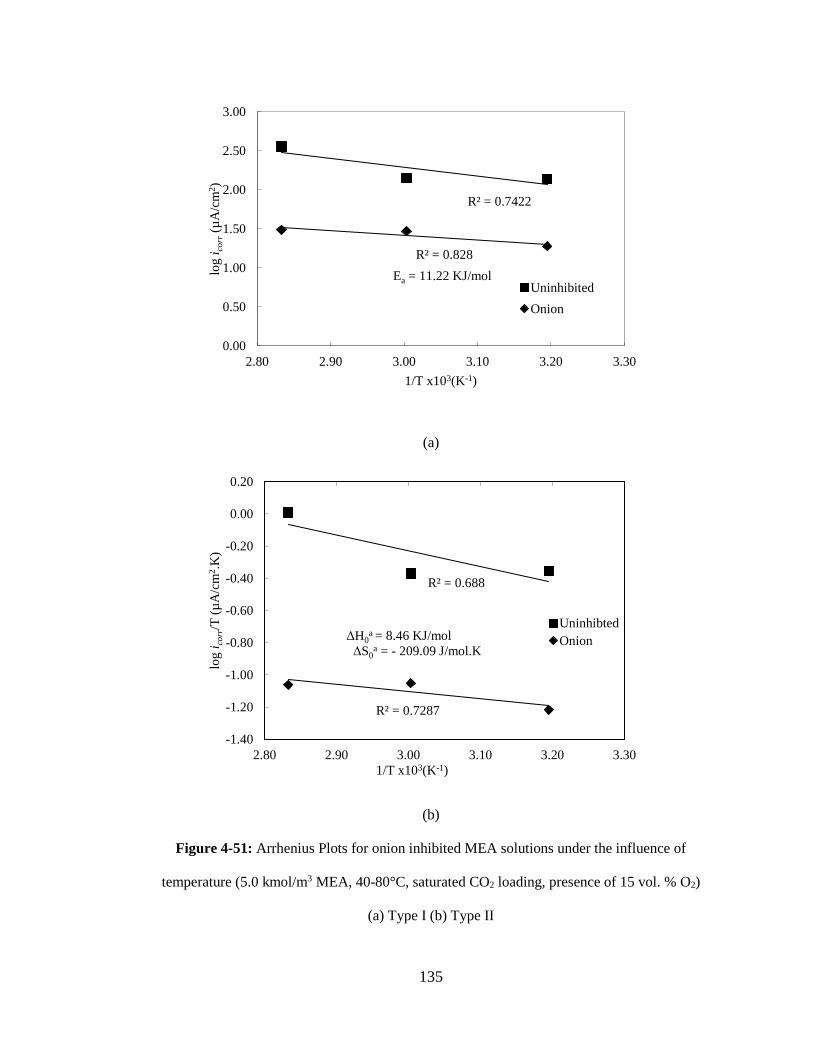
135
(a)
(b)
Figure 4-51: Arrhenius Plots for onion inhibited MEA solutions under the influence of
temperature (5.0 kmol/m3 MEA, 40-80°C, saturated CO2 loading, presence of 15 vol. % O2)
(a) Type I (b) Type II
R² = 0.7422
R² = 0.828
0.00
0.50
1.00
1.50
2.00
2.50
3.00
2.80 2.90 3.00 3.10 3.20 3.30
log i
corr
(µA
/cm
2)
1/T x103(K-1)
Uninhibited
Onion
Ea = 11.22 KJ/mol
R² = 0.688
R² = 0.7287
-1.40
-1.20
-1.00
-0.80
-0.60
-0.40
-0.20
0.00
0.20
2.80 2.90 3.00 3.10 3.20 3.30
log i
corr
/T (
µA
/cm
2.K
)
1/T x103(K-1)
Uninhibted
OnionΔH0a = 8.46 KJ/mol
ΔS0a = - 209.09 J/mol.K

136
4.2.4.4 Effect of process contaminants
Onion inhibited solution was tested in the presence of oxalate and chloride
separately to understand their influence in the performance of inhibitors.When pH of the
onion inhibted solution was taken into consideration,it was found that the solution tended
to be more alkaline in nature in the presence of oxalate while in the presence of chloride
it almost remained same on comparision with that of no process contamination
condition.When compared with their blank conditions, pH was more, indicating that
inhibitor still has influence in the presence of inhibitor.Conductivity of the solution was
compared with no process contaminant condition and found that it almost remained same
in the presence of oxalate whereas it is increased in the presence of
chloride.Poteniodynamic polarization behaviours were compared as shown in Figure
4.52(a). There was a shift in Ecorr with the presence of process contaminants. In the
presence of Oxalate,shift was towards cathodic while it was towards anodic with the
presence of chloride.This could be further supported when their Tafel slopes were
considered.Compared with the no process contaminant condition, βc was more in the
presence of oxalate and in the presence of chloride βc was more. This clearly explains the
reason behind the shift in Ecorr.The corrosion rate was compared as shown in Figure
4.52(b). It was found that in the presence of oxalte corrosion rate was less on comparison
for both cases,i.e., no process contaminants and corresponding blank condition.In the
presence of chloride the corrosion rate was only less when compared with uninhibited
condition whereas it was larger when compared with no process contaminant case.
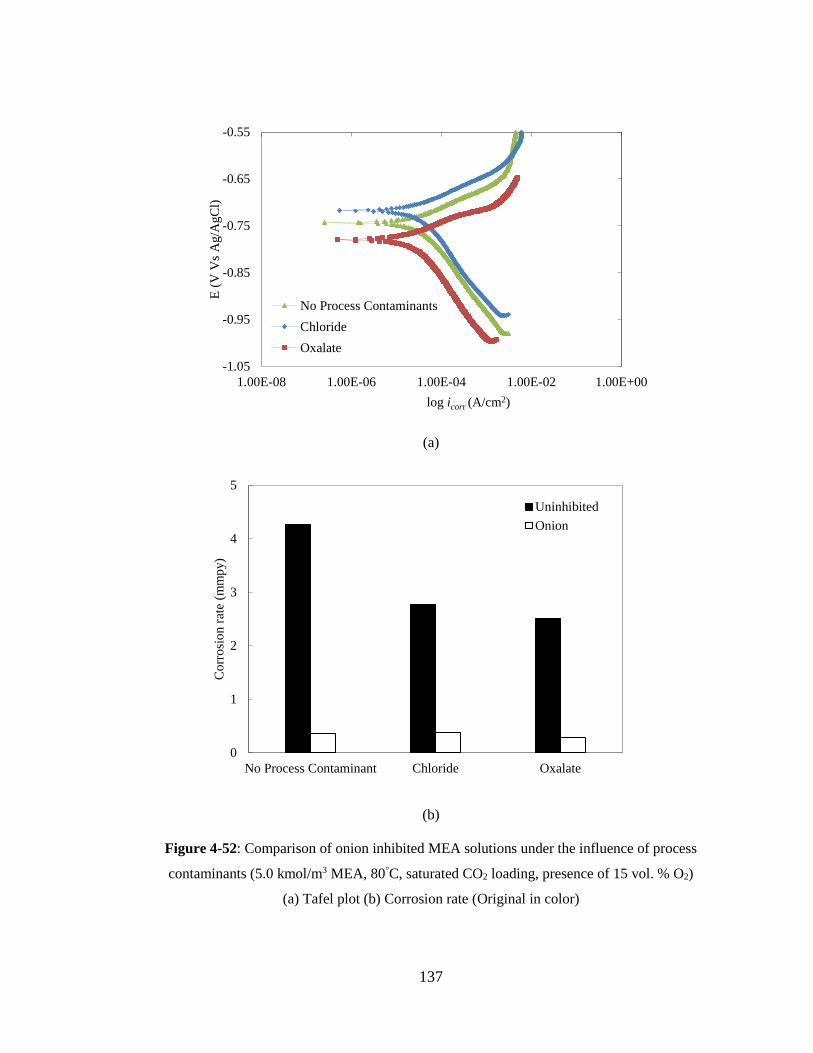
137
(a)
(b)
Figure 4-52: Comparison of onion inhibited MEA solutions under the influence of process
contaminants (5.0 kmol/m3 MEA, 80°C, saturated CO2 loading, presence of 15 vol. % O2)
(a) Tafel plot (b) Corrosion rate (Original in color)
-1.05
-0.95
-0.85
-0.75
-0.65
-0.55
1.00E-08 1.00E-06 1.00E-04 1.00E-02 1.00E+00
E (
V V
s A
g/A
gC
l)
log icorr (A/cm2)
No Process Contaminants
Chloride
Oxalate
0
1
2
3
4
5
No Process Contaminant Chloride Oxalate
Co
rro
sio
n r
ate
(mm
py)
Uninhibited
Onion
138
There was no pitting tendency observed in any of the cases.EIS Nyquist plots
were compared as shown in the Figure 4.53(a).In the presence of oxalate,the size of the
semicircle obtained was big while in the presence of chloride,it got decreased without any
change in shape of the semicircle.Rp was compared as shown in Figure 4.53(b). It was
found that, in the presence of chloride,it was decreased on comparing it with no process
contaminant conditions and increased when compared with its corresponding uninhibited
condition. This was well supported when Rp of onion inhibted solution was taken into
consideration.
4.2.4.5 Quantum chemical analysis
According to literature [Corzo-Martínez et al., 2007], dipropyl disulphide and
quercetin were the main chemicals present in onion. The quantum analyses of these
compounds have been obtained and parameters related with them were obtained as shown
in Table: 4.10.EHOMO values on comparison with MEA were higher, indicating the
tendency to donate electrons to metal atom also ELUMO values of those compounds was
less on comparison with MEA Indicating higher corrosion inhibition efficiency due to the
tendency to accept electrons from the metal surface. Energy gap (ΔE) values are lower on
comparison with MEA indicating the corrosion inhibition is due to chemical adsorption
(Salarvand,2017).Electro-negativity(χ) values were high on comparison with MEA
signifies that chemical potential required for corrosion inhibition is high and hardness (γ)
a representation for higher polarizability and better inhibition is low (Yilmaz et al.,2016).
Fraction of electrons transferred (ΔN) was also less than 3.6 and this shows they could
donate electrons to the metal surface for forming an adsorbed layer to prevent corrosion
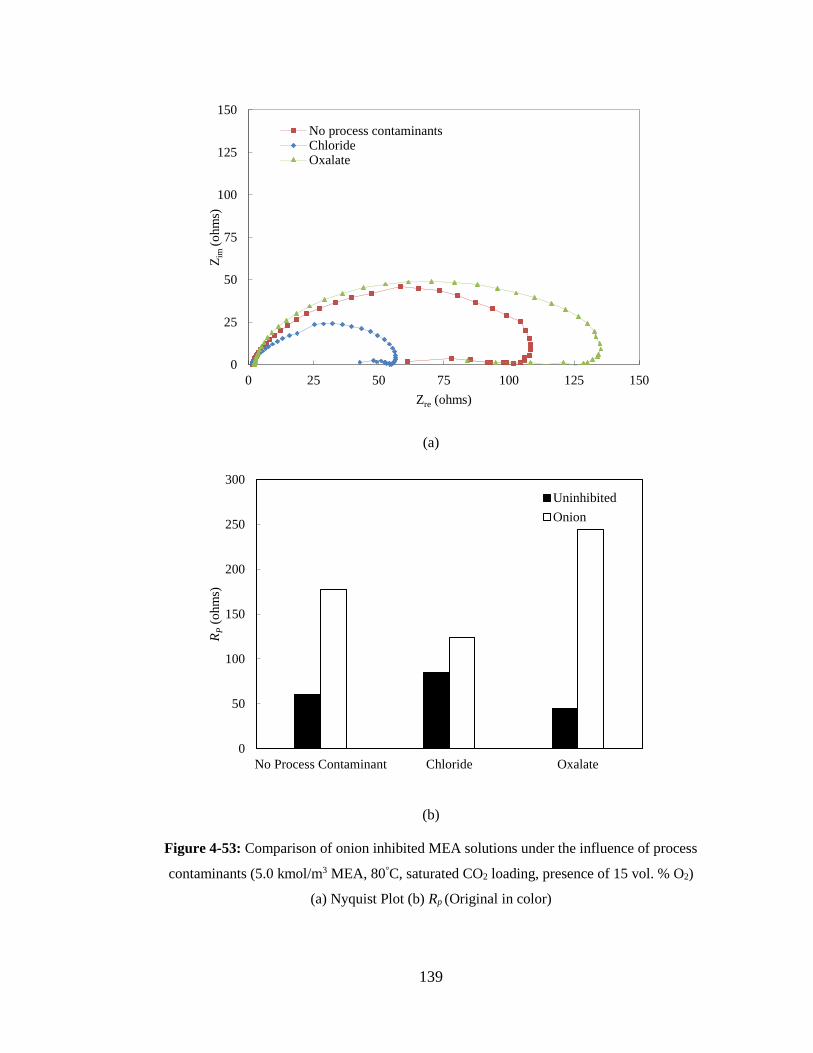
139
(a)
(b)
Figure 4-53: Comparison of onion inhibited MEA solutions under the influence of process
contaminants (5.0 kmol/m3 MEA, 80°C, saturated CO2 loading, presence of 15 vol. % O2)
(a) Nyquist Plot (b) Rp (Original in color)
0
25
50
75
100
125
150
0 25 50 75 100 125 150
Zim
(o
hm
s)
Zre (ohms)
No process contaminantsChlorideOxalate
0
50
100
150
200
250
300
No Process Contaminant Chloride Oxalate
RP
(ohm
s)
Uninhibited
Onion

140
Table 4.10 Summary of Quantum Chemical Analysis of chemicals related with onion
[Salarvand, 2017].The optimized structures of this compounds are shown in Figures 4.54
(a and b), respectively. It is clearly visible that this structure has sulfur and oxygen atoms
with different functional groups. From Figures 4.54(c and d) electron densities in HOMO
level are more surrounding the both the atoms and same is observed for LUMO levels
from Figures 4.54(e and f) indicating the presence of sulfur and oxygen atom could be
responsible for the inhibition quality of onion. This analysis proves onion could be used a
corrosion inhibitor.
Properties MEA Dipropyl
disulphide Quercetin
EHOMO -6.77 -6.44 -6.05
ELUMO -0.31 -0.76 -2.08
Energy gap (ΔE) 6.46 5.68 3.96
Dipole Moment 1.04 2.38 3.72
I 6.77 6.44 6.05
A 0.31 0.76 2.08
Electro-negativity (χ) 3.54 3.60 4.07
Hardness (γ) 3.23 2.84 1.98
(χ)Metal (Fe) 7.00 7.00 7.00
Absolute hardness of Fe
(Hardness (γ)) 0.00 0.00 0.00
Fraction of electrons
transferred (ΔN) 0.54 0.59 0.73

141
Dipropyl disulphide Quercetin
(a) (b)
(c) (d)
(e) (f)
Figure 4-54: Quantum Chemistry structures for Dipropyl disulphide and Quercetin
(a, b) Optimized molecular structures (c, d) HOMO (e, f) LUMO (Original in color)

142
4.2.5 Turmeric
4.2.5.1 Effect of O2
There was a slight shift from cathodic to anodic when the poteniodynamic
polarization performances of inhibited solutions were compared with their corresponding
blank solutions. With the presence of oxygen there was a decrease in icorr and Tafel
slopes which resulted in less corrosion rate. This was evident from the increase in
inhibition efficiency under the influence of oxygen as shown in Figure 4.55(c) and as
observed for the uninhibited systems, open circuit potential is deviated towards anodic
side with the presence of oxygen. It could be found that, with the presence of oxygen,
inhibitor performance of turmeric was enhanced due to the formation of passive layer
over the metal surface preventing the metal dissolution.
4.2.5.2 Effect of inhibitor concentration
Turmeric was varied with inhibitor concentration ranges from 250-10000 ppm .It
was observed that conductivity of the solution decreased while pH of the solution
tended towards alkalinity on comparison with the uninhibited solutions irrespective of
the inhibitor concentrations. However as shown in Figure 4.56(a). There was no decrease
in icorr with an occasional rise at 1000 ppm for βa and βc at 1000 ppm inhibitor range. This
is evident from Figure 4.56(b) as inhibition efficiency improved after 1000 ppm of
inhibitor concentration. When EIS (Nyquist Plots) were compared as shown in Figure
4.57(a) ,there was no change in shape of the inhibited solution on comparison with
uninhibited solution but there was increase in diameter of the semicircle which looks in
good agreement when Rp values were compared for different inhibitor concentration as

143
shown in Figure 4.57 (b), it was observed from Table 4.11 that for most of inhibition
concentration range the inhibitor had the pitting tendency and also the inhibition
efficiency was not consistent as it could be seen from its performances. So, this inhibitor
was not investigated for further trials and studies.
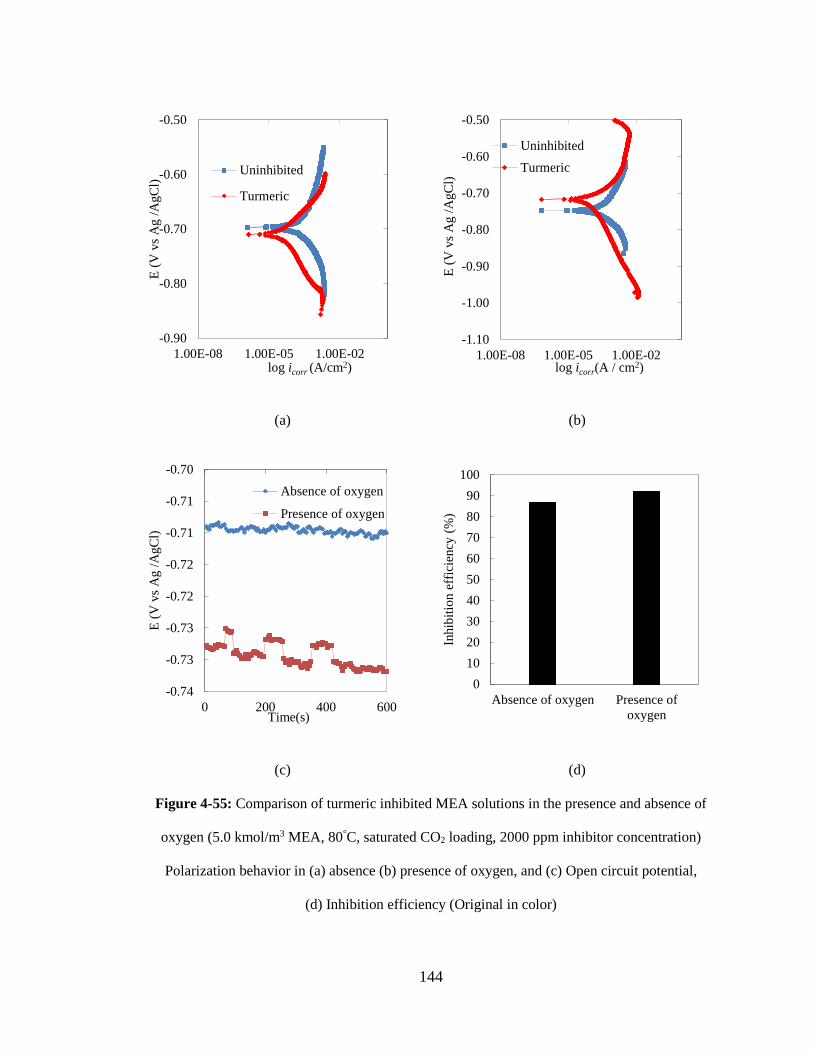
144
(a) (b)
(c) (d)
Figure 4-55: Comparison of turmeric inhibited MEA solutions in the presence and absence of
oxygen (5.0 kmol/m3 MEA, 80°C, saturated CO2 loading, 2000 ppm inhibitor concentration)
Polarization behavior in (a) absence (b) presence of oxygen, and (c) Open circuit potential,
(d) Inhibition efficiency (Original in color)
-0.90
-0.80
-0.70
-0.60
-0.50
1.00E-08 1.00E-05 1.00E-02
E (
V v
s A
g /
AgC
l)
log icorr (A/cm2)
Uninhibited
Turmeric
-1.10
-1.00
-0.90
-0.80
-0.70
-0.60
-0.50
1.00E-08 1.00E-05 1.00E-02
E (
V v
s A
g /
AgC
l)
log icorr(A / cm2)
Uninhibited
Turmeric
-0.74
-0.73
-0.73
-0.72
-0.72
-0.71
-0.71
-0.70
0 200 400 600
E (
V v
s A
g /
AgC
l)
Time(s)
Absence of oxygen
Presence of oxygen
0
10
20
30
40
50
60
70
80
90
100
Absence of oxygen Presence of
oxygen
Inhib
itio
n e
ffic
iency
(%
)

145
(a)
(b)
-1.00
-0.90
-0.80
-0.70
-0.60
1.00E-08 1.00E-06 1.00E-04 1.00E-02 1.00E+00
E (
V v
s A
g /
AgC
l)
log icorr (A/cm2)
Uninhibited
200 ppm
500 ppm
1000 ppm
2000 ppm
4000 ppm
10000 ppm
-60
-40
-20
0
20
40
60
80
100
200 500 1000 2000 4000 10000
Inhib
itio
n e
ffic
iency
(%
)
Inhibitor concentration (ppm)
Figure 4-56 : Comparison of turmeric inhibited MEA solutions for inhibitor concentrations
(200 ppm to 10000 ppm) (5.0 kmol/m3 MEA, 80°C, saturated CO2 loading, 15 vol. % O2)
(a) Polarization behavior (b) Inhibition efficiency (Original in color)
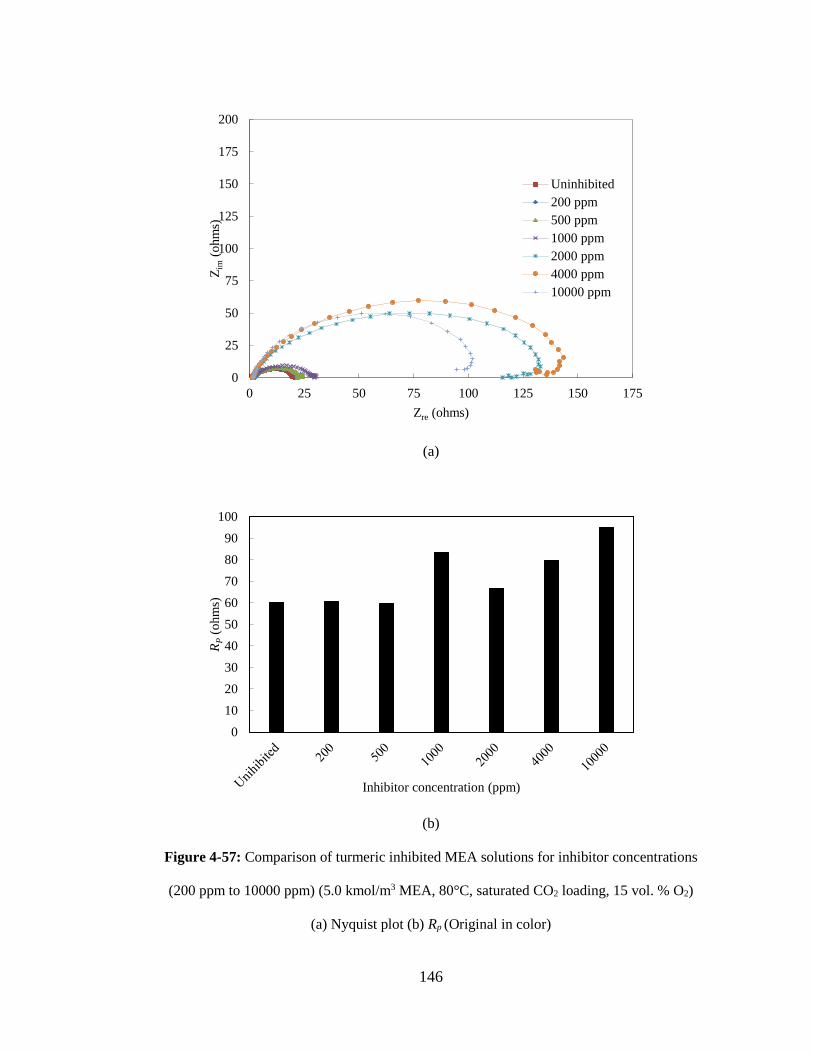
146
Figure 4-57: Comparison of turmeric inhibited MEA solutions for inhibitor concentrations
(200 ppm to 10000 ppm) (5.0 kmol/m3 MEA, 80°C, saturated CO2 loading, 15 vol. % O2)
(a) Nyquist plot (b) Rp (Original in color)
(a)
(b)
0
25
50
75
100
125
150
175
200
0 25 50 75 100 125 150 175
Zim
(ohm
s)
Zre (ohms)
Uninhibited
200 ppm
500 ppm
1000 ppm
2000 ppm
4000 ppm
10000 ppm
0
10
20
30
40
50
60
70
80
90
100
RP
(ohm
s)
Inhibitor concentration (ppm)

147
Table 4.11 Summary of experimental and electrochemical parameters for Turmeric inhibited systems
Experimental
Condition
5 kmol/m3,satd.CO2
loading
pH σ
mS/cm
Ecorr
mV
icorr
µA/cm2
βa
mV/decade
βc
mV/decade
CR
mmpy
CP
I.E (%)
Pitting
tendency
Rp
Ωcm2
EIS
I.E
(%)
80°C,absence of oxygen, inhibitor conc.: 2000 ppm
8.17
±0.02
79.76
±3.20
-709.13
±2.25
41.54
±0.04
49.60
±2.25
74.26
±3.48
0.49
±0.02 86.91 No - -
80°C, 15 vol.% O2 inhibitor conc.: 2000 ppm
8.17±
0.05
77.62
±4.70
-743.56
±3.40 29.49
±0.01
43.94
±3.75
106.14
±1.85
0.35
±0.04 91.82 Yes - -
80°C, 15
vol.%
O2
200 8.23
±0.03 78.44
±3.98 -732.31 314.26 94.91 68.01 3.71 12.81 Yes 60.38
22.65
500 8.20
±0.01 78.57
±2.70 -723.95 169.93 56.53 43.79 2.09 52.85 Yes 59.75
-
1000 8.17±
0.05
77.62
±4.70
-743.56
±3.40
29.49
±0.01
43.94
±3.75
106.14
±1.85
0.35
±0.04 91.82 Yes
83.32
27.69
2000 8.17
±0.04 77.62
±4.70 -743.56
±3.40
29.49 43.94 106.14 0.35 91.82 Yes 66.88
9.91
4000 8.23
±0.05 77.40
±3.86 -743.35 43.84 49.09 96.06 0.52 87.84 Yes 79.61
24.32
10000 8.18±0.
03 79.05
±2.89 -735.14 29.17 45.97 132.86 0.34 91.91 Yes 94.99
36.57

148
CHAPTER 5 CONCLUSIONS AND RECOMMENDATIONS
5.1 Conclusions
The inhibition performance of five condiment including powders of garlic,
mustard, onion, horseradish, and turmeric were evaluated under a wide range of
operational conditions of the amine-based CO2 absorption process. The following are the
main findings:
Table 5.1 indicates the compatibility of condiments when used as corrosion
inhibitors along with their effective concentration range. The powders of garlic, mustard,
onion, and horseradish show great promise as the environmentally friendly corrosion
inhibitors for the amine-based CO2 absorption process. They are mixed-type corrosion
inhibitors that protect the metal surface by retarding both rate of anodic reaction (metal
dissolution) and rate of cathodic reaction (reduction of corroding agents). They undergo
both physical and chemical adsorption onto the metal surface. The adsorption is
endothermic and Langmuir-type that forms a monolayer of the inhibitor onto the metal
surface. The sulfur-functional group in garlic powder, sulfur- and nitrogen-functional
groups in mustard powder, sulfur- and oxygen-functional groups in onion, and sulfur-,
nitrogen- and phosphorous-functional groups in horseradish play a key role in
chemisorption onto the metal surface.
Garlic powder performs well with inhibition efficiencies of up to 96% for the
concentration range of 250-10,000 ppm. Its performance is slightly affected by solution
temperature, the presences of O2 in feed gas, and the presence of process contaminants
(chloride and oxalate) in the amine solution.
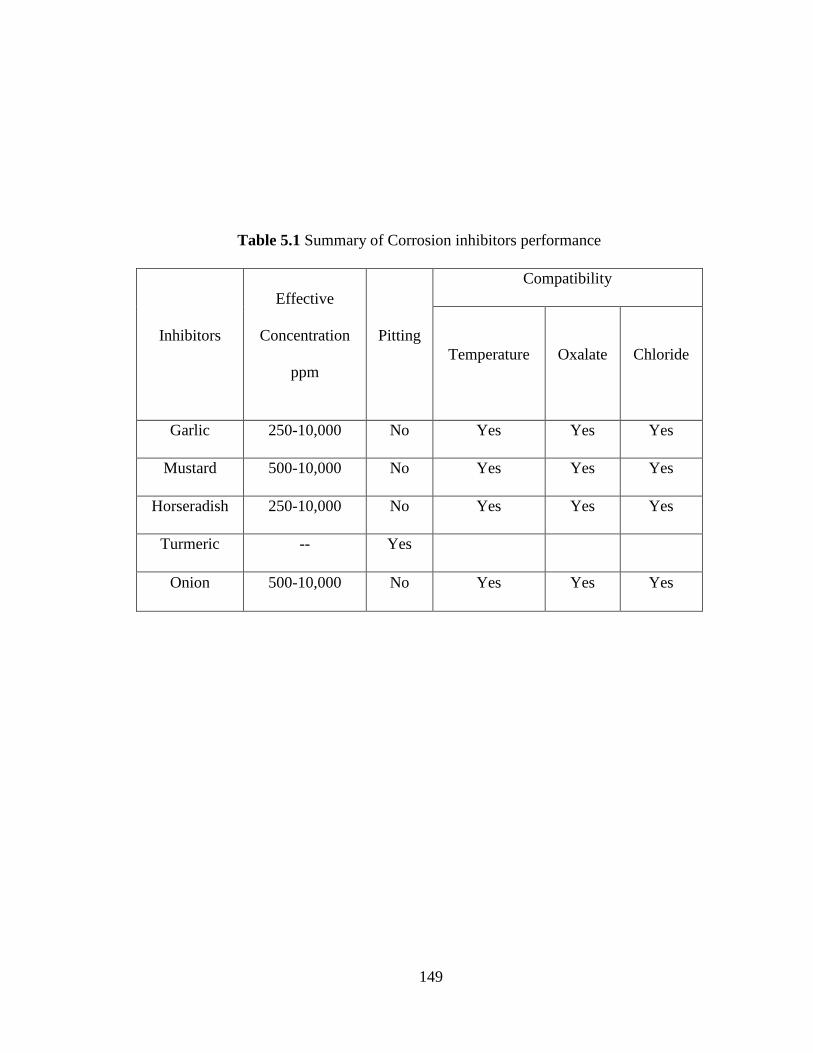
149
Table 5.1 Summary of Corrosion inhibitors performance
Inhibitors
Effective
Concentration
ppm
Pitting
Compatibility
Temperature Oxalate Chloride
Garlic 250-10,000 No Yes Yes Yes
Mustard 500-10,000 No Yes Yes Yes
Horseradish 250-10,000 No Yes Yes Yes
Turmeric -- Yes
Onion 500-10,000 No Yes Yes Yes
150
Mustard powder can yield up to 97% inhibition efficiency depending on operating
conditions. Its performance is not affected by the presence of O2, but can be reduced at
elevated temperatures and in the presence of chloride and oxalate. Pitting corrosion may
be induced when insufficient mustard powder (less than 500 ppm) is applied.
Onion powder yields satisfactory inhibition performance with up to 94%
efficiency. Its performance is improved in the presence of O2, but reduced at elevated
temperature and in the presence of chloride and oxalate. Pitting corrosion is observed
when 500 ppm (and less) of onion powder is used.
Horseradish is an effective inhibitor with up to 94% efficiency for the
concentration range of 250-10,000 ppm. Its performance is not affected by the presence
of O2, but slightly decreases with elevated temperature.
Turmeric powder is not recommended as the corrosion inhibitor in the amine-
based CO2 absorption. It induces pitting corrosion in all ranges of test conditions.
5.2 Recommendations
Corrosion inhibitors investigated in this work seems to have a promising future.
In order to use it at industrial level lot of additional experimental work is required. So,
following recommendations are made:
To evaluate the inhibitor performance under the influence of other parametric
effects such as solution velocity and other process contaminants (bicine and acetate).Flow
loop and autoclave experiments to support the electrochemical experimental results.
To examine the effectiveness of these inhibitors, they could be checked using
weight loss experiments conducted which are using solution samples collected from
industries to simulate the actual plant environment.
151
REFERENCES
Adamson, A. W. (1990). Physical Chemistry of Surfaces. (5th edn). Wily. New York.
Africa, S. (2008). Adsorption and inhibitive properties of ethanol extracts of Musa
sapientum peels as a green corrosion inhibitor for mild steel in H2SO4. Afr. J. Pure. Appl.
Chem. 2(6), 46-54.
Ali, B.S., Ali, B. H, Yusoff, R., & Aroua, M. K. (2012). Carbon steel corrosion behaviors
in carbonated aqueous mixtures of Monoethanolamine and 1-n-butyl-3-
methylimidazolium tetrafluoroborate. International Journal of Electrochemical
Science, 7(5), 3835-3853.
Ali, B. S. (2011). Corrosion of carbon steel in aqueous carbonated solution of MEA/
[bmim] [DCA]. Int. J. Electrochem. Sci., 6, 181-198.
Al-Mhyawi, S. R. (2014). Inhibition of mild steel corrosion using Juniperus plants as
green inhibitor. African journal of pure and applied chemistry, 8(1), 9-22.
Anbarasi, M., Rajendran, S., Pandiarajan, M., & Krishnaveni, A. (2013). An encounter
with corrosion inhibitors. European Chemical Bulletin, 2(4), 197-207.
Atkins, P., & De Paula, J. (2011). Physical chemistry for the life sciences. Oxford
University Press, USA.
Baboian, R. R. B. (2005). Corrosion tests and standards: application and
interpretation (No. Sirsi) (i9780803120983).
Becke, A. D. (1993). A new mixing of Hartree–Fock and local density‐ functional
theories. The Journal of chemical physics, 98(2), 1372-1377.

152
Bhattacharya, A., Li, Y., Wade, K. L., Paonessa, J. D., Fahey, J. W., & Zhang, Y. (2010).
Allyl isothiocyanate-rich mustard seed powder inhibits bladder cancer growth and muscle
invasion. Carcinogenesis, 31(12), 2105-2110.
Bouyanzer, A, Hammouti, B., & Majidi, L. (2006). Pennyroyal oil from Mentha
pulegium as corrosion inhibitor for steel in 1M HCl. Materials Letters, 60(23), 2840-
2843.
Brennecke, J. F., & Maginn, E. J. (2001). Ionic liquids: innovative fluids for chemical
processing. AIChE Journal, 47(11), 2384-2389.
Campbell, K. L. S., Louis, C. Y., & Williams, D. R. (2017). Siderite corrosion protection
for carbon steel infrastructure in post-combustion capture plants. International Journal of
Greenhouse Gas Control, 58 , 232-245.
Cavallaro, B., Clayton, R., & Campos, M. (2016, May). Cost-Conscious Corrosion
Control. In SPE International Oilfield Corrosion Conference and Exhibition. Society of
Petroleum Engineers.
Chang, Z. Y., Minevski, L., & Lue, P. (2005). U.S. Patent No. 6,974,553. Washington,
DC: U.S. Patent and Trademark Office.
Chauhan, L. R., & Gunasekaran, G. (2007). Corrosion inhibition of mild steel by plant
extract in dilute HCl medium. Corrosion Science, 49(3), 1143-1161.
Chen, H., Wang, C., Ye, J., Zhou, H., & Chen, X. (2012). Antimicrobial activities of
Phenethyl isothiocyanate isolated from horseradish. Natural product research, 26(11),
1016-1021.
Clouse, R. C., & Asperger, R. G. (1978). U.S. Patent No. 4,100,100. Washington, DC:
U.S. Patent and Trademark Office.

153
Corzo-Martinez, M., Corzo, N., & Villamiel, M. (2007). Biological properties of onions
and garlic. Trends in food science & technology, 18(12), 609-625.
Cousins, A., Ilyushechkin, A., Pearson, P., Cottrell, A., Huang, S., & Feron, P. H. (2013).
Corrosion coupon evaluation under pilot‐ scale CO2 capture conditions at an Australian
coal‐ fired power station. Greenhouse Gases: Science and Technology, 3(3), 169-184.
DeHart, T. R., Hansen, D. A., Mariz, C. L., & McCullough, J. G. (1999). Solving
corrosion problems at the NEA Bellingham Massachusetts carbon dioxide recovery
plant (No. CONF-990401). NACE International, Houston, TX (United States).
Desimone, M. P., Gordillo, G., & Simison, S. N. (2011). The effect of temperature and
concentration on the corrosion inhibition mechanism of an amphiphilic amido-amine in
CO 2 saturated solution. Corrosion Science, 53(12), 4033-4043.
De Souza, F. S., & Spinelli, A. (2009). Caffeic acid as a green corrosion inhibitor for
mild steel. Corrosion science, 51(3), 642-649
Dingman, J. C., Allen, D. L., & Moore, T. F. (1966). Minimize corrosion in MEA
units. Hydrocarbon Processing, 45(9), 285.
Duan, D., Choi, Y. S., Jiang, S., & Nešić, S. (2013). Corrosion Mechanism of Carbon
steel in MDEA-Based CO2 Capture Plants. CORROSION/2013, paper, (51313-02345).
DuPart, M. S., Bacon, T. R., & Edwards, D. J. (1993). Understanding corrosion in
alkanolamine gas treating plants: Part 1. Hydrocarbon Processing ;( United States), 72(4).
De Vroey, S., Huynh, H., Lepaumier, H., Absil, P., & Thielens, M. L. (2013). Corrosion
investigations in 2-ethanolamine based post-combustion CO2 capture pilot plants. Energy
Procedia, 37, 2047-2057.

154
Ebenso, E. E., Alemu, H., Umoren, S. A., & Obot, I. B. (2008). Inhibition of mild steel
corrosion in sulphuric acid using alizarin yellow GG dye and synergistic iodide
additive. Int. J. Electrochem. Sci, 3, 1325-1339.
El-Etre, A. Y. (2006). Khillah extract as inhibitor for acid corrosion of SX 316
steel. Applied Surface Science, 252(24), 8521-8525.
Emori, W., Jiang, S. L., Duan, D. L., Ekerenam, O. O., Zheng, Y. G., Okafor, P. C., &
Qiao, Y. X. (2017). Corrosion behavior of carbon steel in amine‐ based CO2 capture
system: effect of sodium sulfate and sodium sulfite contaminants. Materials and
Corrosion, 68(6), 674-682.
Ferreira, K. C., Cordeiro, F. B., Nuries, J. C., Orofino, H., Magalhaes, M., Torres, A. G.,
& Elia, E. D. (2016). Corrosion inhibition of carbon steel in HCl solution by Aqueous
Brown onion peel extract. Int. J. Electrochem. Sci, 11, 406-418.
Ferreira, E. S., Giacomelli, C., Giacomelli, F. C., & Spinelli, A. (2004). Evaluation of the
inhibitor effect of L-ascorbic acid on the corrosion of mild steel. Materials Chemistry and
Physics, 83(1), 129-134.
Frenier, W. W. (2000, September). Review of green chemistry corrosion inhibitors for
aqueous systems. In Proceedings of 9th European symposium on corrosion and scale
inhibitors. In: Proceedings of the 9th European symposium on corrosion and scale
inhibitors (p. 24).
Fukui, K. (1982). Role of frontier orbitals in chemical reactions. Science, 218(4574),
747-754.
155
Fytianos, G., Vevelstad, S. J., & Knuutila, H. K. (2016). Degradation and corrosion
inhibitors for MEA-based CO 2 capture plants. International Journal of Greenhouse Gas
Control, 50, 240-247.
Garcia-Arriaga, V., Alvarez-Ramirez, J., Amaya, M., & Sosa, E. (2010). H 2 S and O 2
influence on the corrosion of carbon steel immersed in a solution containing 3M
Diethanolamine. Corrosion Science, 52(7), 2268-2279.
Gao, J., Wang, S., Sun, C., Zhao, B., & Chen, C. (2012). Corrosion behavior of carbon
steel at typical positions of an amine-based CO2 capture pilot plant. Industrial &
Engineering Chemistry Research, 51(19), 6714-6721.
Gece, G. (2008). The use of quantum chemical methods in corrosion inhibitor
studies. Corrosion science, 50(11), 2981-2992.
Gjernes, E., Helgesen, L. I., & Maree, Y. (2013). Health and environmental impact of
amine based post combustion CO 2 capture. Energy Procedia, 37, 735-742.
Goff, G. S., & Rochelle, G. T. (2006). Oxidation inhibitors for copper and iron catalyzed
degradation of Monoethanolamine in CO2 capture processes. Industrial & engineering
chemistry research, 45(8), 2513-2521.
Gouedard, C., Picq, D., Launay, F., & Carrette, P. L. (2012). Amine degradation in CO 2
capture. I. A review. International Journal of Greenhouse Gas Control, 10, 244-270.
Groysman, A. (2016, June). The role of corrosion management in prevention of corrosion
failures. In Corrosion 2016. NACE International.
Gui, F., Sridhar, N., Thala, R., & Borussia, C. S. (2008). Corrosion of Carbon Steel in
Ethanolamine. In 17th International Corrosion Congress on Corrosion Control in the
Service of Society (pp. 207-215). Las Vegas: NACE International.

156
Gunasekaran, P. (2012). Corrosion Evaluation for Absorption-Based CO2 Capture
Process Using Single and Blended Amines (Doctoral dissertation, Faculty of Graduate
Studies and Research, University of Regina).
Hackerman, N., & Makrides, A. C. (1954). Action of polar organic inhibitors in acid
dissolution of metals. Industrial & Engineering Chemistry, 46(3), 523-527.
Hasib-ur-Rahman, M., & Larachi, F. (2013). Prospects of using room-temperature ionic
liquids as corrosion inhibitors in aqueous ethanolamine-based CO2 capture
solvents. Industrial & Engineering Chemistry Research, 52(49), 17682-17685.
Heisler, L., & Weiss, I. H. (1975). Operating Experience at Aderklaa with Alkanolamine
Gas Treating Plants for Sour Natural Gas Sweetening. In Proceedings of Gas
Conditioning conference, 25 th Annual, University of Oklahoma.
Hensen, E.R., Tipton, T.M., Courtwright, J.G., (1986), Corrosion inhibitors for
Alkanolamine, US Patent 4595723
Herzallah, S., & Holley, R. (2012). Determination of Sinigrin, sinalbin, allyl-and benzyl
isothiocyanate by RP-HPLC in mustard powder extracts. LWT-Food Science and
Technology, 47(2), 293-299.
Hoenig, V., Hoppe, H., & Emberger, B. (2007). Carbon capture technology-options and
potentials for the cement industry. PCA R&D Serial, (3022), 98.
Hohenberg, P., & Kohn, W. (1964). Inhomogeneous electron gas. Physical
review, 136(3B), B864.
Horwitz, William, et al. "Official methods of analysis of the Association of Official
Analytical Chemists." Official methods of analysis of the Association of Official
Analytical Chemists. Ed. 12 (1975).
157
Ige, O. O., Shittu, M. D., Oluwasegun, K. M., Olorunniwo, O. E., & Umoru, L. E. ECO-
FRIENDLY INHIBITORS FOR EROSION-CORROSION MITIGATION OF API-
X65STEELIN CO2 ENVIRONMENT.
Jain, P. C. (1976). Engineering Chemistry. Dhanpat Rai Pub Company.
Jang, J. G., Kim, G. M., Kim, H. J., & Lee, H. K. (2016). Review on recent advances in
CO2 utilization and sequestration technologies in cement-based materials. Construction
and Building Materials, 127 , 762-773.
Khaled, K. F., & Amin, M. A. (2008). Computational and electrochemical investigation
for corrosion inhibition of nickel in molar nitric acid by piperidines. Journal of applied
electrochemistry, 38(11), 1609-1621.
Khaled, K. F., & Hackerman, N. (2003). Investigation of the inhibitive effect of ortho-
substituted anilines on corrosion of iron in 1 M HCl solutions. Electrochemical
Acta, 48(19), 2715-2723.
Khalil, N. (2003). Quantum chemical approach of corrosion inhibition. Electrochimica
Acta, 48(18), 2635-2640.
Kıcır, N., Tansuğ, G., Erbil, M., & Tüken, T. (2016). Investigation of ammonium (2, 4-
dimethylphenyl)-dithiocarbamate as a new, effective corrosion inhibitor for mild
steel. Corrosion Science, 105, 88-99.
Kittel, J., & Gonzalez, S. (2014). Corrosion in CO2 Post-Combustion Capture with
Alkanolamine–A Review. Oil & Gas Science and Technology–Revue d’IFP Energies
nouvelles, 69(5), 915-929

158
Kittel, J., Fleury, E., Vuillemin, B., Gonzalez, S., Ropital, F., & Oltra, R. (2012).
Corrosion in alkanolamine used for acid gas removal: From natural gas processing to
CO2 capture. Materials and Corrosion, 63(3), 223-230.
Kladkaew, N., Idem, R., Tontiwachwuthikul, P., & Saiwan, C. (2009). Corrosion
behavior of carbon steel in the Monoethanolamine− H2O− CO2− O2− SO2 system:
Products, Reaction Pathways, and Kinetics. Industrial & Engineering Chemistry
Research, 48(23), 10169-10179.
Kohl, A. L., & Nielsen, R. (1997). Gas purification. Gulf Professional Publishing.
Kosseim, A. J., McCullough, J. G., & Butwell, K. F. (1984). Corrosion-inhibited amine
guard ST process. Chemical engineering progress, 80(10), 64-71.
Låg, M., Lindeman, B., Instanes, C., Brunborg, G., & Schwarze, P. (1984). Health effects
of amines and derivatives associated with CO2 capture. IARC Sci Publ, 57.
Lanzotti, V. (2006). The analysis of onion and garlic. Journal of chromatography
a, 1112(1), 3-22.
Lebrini, M., Robert, F., Lecante, A., & Roos, C. (2011). Corrosion inhibition of C38 steel
in 1M hydrochloric acid medium by alkaloids extract from Oxandra asbeckii
plant. Corrosion Science, 53(2), 687-695.
Lee, C., Yang, W., & Parr, R. G. (1988). Development of the Colle-Salvetti correlation-
energy formula into a functional of the electron density. Physical review B, 37(2), 785.
Léonard, G., Voice, A., Toye, D., & Heyen, G. (2014). Influence of dissolved metals and
oxidative degradation inhibitors on the oxidative and thermal degradation of
Monoethanolamine in post combustion CO2 capture. Industrial & Engineering Chemistry
Research, 53(47), 18121-18129.

159
Lesar, A., & Milošev, I. (2009). Density functional study of the corrosion inhibition
properties of 1, 2, 4-triazole and its amino derivatives. Chemical physics letters, 483(4),
198-203.
Li, Y., Zhao, P., Liang, Q., & Hou, B. (2005). Berberine as a natural source inhibitor for
mild steel in 1M H 2 SO 4. Applied Surface Science, 252(5), 1245-1253.
Luis, P. (2016). Use of Monoethanolamine (MEA) for CO 2 capture in a global scenario:
consequences and alternatives. Desalination, 380, 93-99.
Mago, B., & West, C. (1974). U.S. Patent No. 3,808,140. Washington, DC: U.S. Patent
and Trademark Office
Manimegalai, S., & Manjula, P. (2015). Thermodynamic and Adsorption studies for
corrosion Inhibition of Mild steel in Aqueous Media by Sargasam swartzii (Brown
algae). Journal of Material and Environmental Science, 6(6), 1629-1637.
Martinez, S., & Stern, I. (2002). Thermodynamic characterization of metal dissolution
and inhibitor adsorption processes in the low carbon steel/mimosa tannin/sulfuric acid
system. Applied Surface Science, 199(1), 83-89.
Masoud, M. S., Awad, M. K., Shaker, M. A., & El-Tahawy, M. M. T. (2010). The role of
structural chemistry in the inhibitive performance of some aminopyrimidines on the
corrosion of steel. Corrosion Science, 52(7), 2387-2396.
McCullough, J. G., & Barr, K. J. (1985). U.S. Patent No. 4,502,979. Washington, DC:
U.S. Patent and Trademark Office.
McHenry, H. I., Read, D. T., & Shives, T. R. (1987). Failure analysis of an amine-
absorber pressure vessel. Mater. Performance ;( United States), 26(8).

160
Moretti, G., Guidi, F., & Grion, G. (2004). Tryptamine as a green iron corrosion inhibitor
in 0.5 M deaerated sulphuric acid. Corrosion science, 46(2), 387-403.
Mourya, P., Banerjee, S., & Singh, M. M. (2014). Corrosion inhibition of mild steel in
acidic solution by Tagetes erecta (Marigold flower) extract as a green
inhibitor. Corrosion Science, 85, 352-363.
Niegodajew, P., & Asendrych, D. (2016). Amine based CO 2 capture–CFD simulation of
absorber performance. Applied Mathematical Modeling, 40(23), 10222-10237.
Nieh, E. C. (1983). U.S. Patent No. 4,371,450. Washington, DC: U.S. Patent and
Trademark Office.
Nielsen, R. B., Lewis, K. R., McCullough, J. G., & Hansen, D. A. (1995, February).
Controlling corrosion in amine treating plants. In Proceedings of the Laurence Reid Gas
Conditioning Conference, Norman, Oklahoma.
Noor, E. A. (2007). Temperature effects on the corrosion inhibition of mild steel in acidic
solutions by aqueous extract of fenugreek leaves. International Journal of
Electrochemical Science, 2(12).
Nnanna, L. A., Owate, I. O., Nwadiuko, O. C., Ekekwe, N. D., & Oji, W. J. (2013).
Adsorption and Corrosion Inhibition of Gnetum Africana Leaves Extract on Carbon
Steel. International Journal of Materials and Chemistry, 3(1), 10-16.
Noor, E. A. (2009). Potential of aqueous extract of Hibiscus sabdariffa leaves for
inhibiting the corrosion of aluminum in alkaline solutions. Journal of applied
electrochemistry, 39(9), 1465-1475.
N.O. Obi-Egbedi, I.B. Obot, M.I. El-Khaiary, Quantum chemical investigation and
statistical analysis of the relationship between corrosion inhibition efficiency and

161
molecular structure of xanthene’s and its derivatives on mild steel in sulphuric acid, J.
Mol. Struct. 1002 (2001) 86–96.
Nouri, M., & Clarida, D. R. (2007). Interaction of Process Design, Operating Conditions
and Corrosion in Amine Systems. In CORROSION 2007. NACE International.
Nwabanne, J. T., & Okafor, V. N. (2012). Adsorption and thermodynamics study of the
inhibition of corrosion of mild steel in H2SO4 medium using vernonia
amygdalina. Journal of Minerals and Materials Characterization and Engineering, 11(09),
885.
Obi-Egbedi, N. O., Obot, I. B., El-Khaiary, M. I., Umoren, S. A., & Ebenso, E. E. (2011).
Computational simulation and statistical analysis on the relationship between corrosion
inhibition efficiency and molecular structure of some phenanthroline derivatives on mild
steel surface. Int. J. Electrochem. Sci, 6, 5649-5675.
Obot, I. B., Macdonald, D. D., & Gasem, Z. M. (2015). Density functional theory (DFT)
as a powerful tool for designing new organic corrosion inhibitors. Part 1: an
overview. Corrosion Science, 99, 1-30.
Oguzie, E. E., & Onuchukwu, A. I. (2007). Inhibition of mild steel corrosion in acidic
media by aqueous extracts from Garcinia kola seed. Corrosion Reviews, 25(3-4), 355-
362.
Okafor, P. C., Ikpi, M. E., Uwah, I. E., Ebenso, E. E., Ekpe, U. J., & Umoren, S. A.
(2008). Inhibitory action of Phyllanthus amarus extracts on the corrosion of mild steel in
acidic media. Corrosion Science, 50(8), 2310-2317.
O.L. Riggs Jr., Corrosion Inhibitors, 2nd ed., C.C. Nathan, Houston, TX, 1973

162
O. L. Riggs, Jr., in C. C. Nathan (Ed.), Corrosion Inhibitors, NACE, Houston, TX, 1973,
p. 11
Ostovari, A., Hoseinieh, S. M., Peikari, M., Shadizadeh, S. R., & Hashemi, S. J. (2009).
Corrosion inhibition of mild steel in 1M HCl solution by henna extract: A comparative
study of the inhibition by henna and its constituents (Lawsone, Gallic acid, α-d-Glucose
and Tannic acid). Corrosion Science, 51(9), 1935-1949.
Osokogwu, U., & Oghenekaro, E. (2012). Evaluation of corrosion inhibitors effectiveness
in oilfield production operations. International Journal of Scientific & Technology
Research, 1(4), 19-23.
Parr, R. G., & Yang, W. (1989). Density-Functional Theory of Atoms and Molecules
Oxford Univ. Press, New York.
Paul, S., & Kar, B. (2012). Mitigation of mild steel corrosion in acid by green inhibitors:
Yeast, pepper, garlic, and coffee. ISRN Corrosion, 2012.
Pearson, R. G. (1988). Absolute electro negativity and hardness: application to inorganic
chemistry. Inorganic chemistry, 27(4), 734-740.
Pearson, P., Hollenkamp, A. F., & Meuleman, E. (2013). Electrochemical investigation
of corrosion in CO 2 capture plants—influence of amines. Electrochemical Acta, 110,
511-516.
Pereira, S. S. D. A. A., Pêgas, M. M., Fernández, T. L., Magalhães, M., Schöntag, T. G.,
Lago, D. C. ... & D’Elia, E. (2012). Inhibitory actions of aqueous garlic peel extract on
the corrosion of carbon steel in HCl solution. Corrosion Science, 65, 360-366.

163
Popova, A., Sokolova, E., Raicheva, S., & Christov, M. (2003). AC and DC study of the
temperature effect on mild steel corrosion in acid media in the presence of benzimidazole
derivatives. Corrosion Science, 45(1), 33-58.
Putilova, I. N. (1960). Metallic corrosion inhibitors. Pergamon Press
Radovici O (1965) Proceedings of the 2nd European symposium on corrosion inhibition,
Ferrara, Italy, p 178
Raj, S., & Veawab, A. (2007, January). Inhibition performance of copper carbonate in
CO2 absorption process using aqueous MEA. In CORROSION 2007. NACE
International.
Rooney, P. C., & DuPart, M. (2000, January). Corrosion in alkanolamine plants: causes
and minimization. In CORROSION 2000. NACE International.
Safruddin, R. (2000, January). Twenty Year Experience in Controlling Corrosion in
Amine Unit of Badak LNG Plant. In CORROSION 2000. NACE International.
Sastri, V. S., (2001), Corrosion Inhibitors: Principles and Applications, West Sussex,
England: John Wiley & Sons Ltd
Satapathy, A. K., Gunasekaran, G., Sahoo, S. C., Amit, K., & Rodriguez, P. V. (2009).
Corrosion inhibition by Justicia gendarussa plant extract in hydrochloric acid
solution. Corrosion science, 51(12), 2848-2856.
Schweitzer, Philip A. Corrosion Engineering Handbook, -3 Volume Set. CRC Press,
1996.
Sedriks, A. J. (1996). Corrosion of stainless steel, 2.
164
Sharma, S. K., Mudhoo, A., Jain, G., & Sharma, J. (2010). Corrosion inhibition and
adsorption properties of Azadirachta indica mature leaves extract as green inhibitor for
mild steel in HNO3. Green Chemistry Letters and Reviews, 3(1), 7-15.
Shukla, S. K., & Quraishi, M. A. (2009). Cefotaxime sodium: a new and efficient
corrosion inhibitor for mild steel in hydrochloric acid solution. Corrosion Science, 51(5),
1007-1011
Shaw, B. A. (2003). ASM handbook volume 13a: corrosion: fundamentals, testing and
protection. D. Stephen, ASM International, Materials Park, Ohio, USA.
Singh, A. K., & Quraishi, M. A. (2010). Effect of Cefazolin on the corrosion of mild steel
in HCl solution. Corrosion Science, 52(1), 152-160.
Singh, A., Ebenso, E. E., & Quraishi, M. A. (2012). Stem extract of brahmi (Bacopa
Monnieri) as green corrosion inhibitor for aluminum in NaOH solution. Int. J.
Electrochem. Sci, 7, 3409-3419.
Singh, W. P., & Bockris, J. O. M. (1996). Toxicity issues of organic corrosion inhibitors:
applications of QSAR model (No. CONF-960389--). NACE International, Houston, TX
(United States).
Smallwood, R. E. (2006, January). Life Cycle Maintenance Considerations of Non-
Metallic Process Equipment Compared to Metallic Equipment. In CORROSION 2006.
NACE International.
Srinivasan, S. (2012). Environmentally-Friendly Corrosion Inhibitors for the Amine-
Based CO2 Absorption Process (Doctoral dissertation, Faculty of Graduate Studies and
Research, University of Regina).
165
Strazisar, B. R., Anderson, R. R., & White, C. M. (2003). Degradation pathways for
Monoethanolamine in a CO2 capture facility. Energy & fuels, 17(4), 1034-1039.
Sun, Y., Remias, J. E., Neathery, J. K., & Liu, K. (2011-a). Electrochemical study of
corrosion behavior of carbon steel A106 and stainless steel 304 in aqueous
Monoethanolamine. Corrosion Engineering, Science and Technology, 46(6), 724-731.
Sun, Y., Remias, J. E., Peng, X., Dong, Z., Neathery, J. K., & Liu, K. (2011-b). Corrosion
behavior of an aluminized nickel coating in a carbon dioxide capture process using
aqueous Monoethanolamine. Corrosion Science, 53(11), 3666-3671.
Taj, S., Papavinasam, S., & Revie, R. W. (2006, January). Development of green
inhibitors for oil and gas applications. In CORROSION 2006. NACE International.
Thitakamol, B., Veawab, A., & Aroonwillas, A. (2007). Environmental impacts of
absorption-based CO 2 capture unit for post-combustion treatment of flue gas from coal-
fired power plant. International Journal of Greenhouse Gas Control, 1(3), 318-342.
Torres, V. V., Amado, R. S., De Sá, C. F., Fernandez, T. L., da Silva Riehl, C. A., Torres,
A. G., & D’Elia, E. (2011). Inhibitory action of aqueous coffee ground extracts on the
corrosion of carbon steel in HCl solution. Corrosion Science, 53(7), 2385-2392.
Trevino, J. A. (1987). U.S. Patent No. 4,714,597. Washington, DC: U.S. Patent and
Trademark Office.
Veawab, A., (2000), Corrosion and corrosion control in CO2 absorption process using
aqueous amine solutions, Ph.D. Thesis, University of Regina, Regina, Saskatchewan,
Canada.

166
Veawab, A., & Aroonwillas, A. (2002). Identification of oxidizing agents in aqueous
amine–CO 2 systems using a mechanistic corrosion model. Corrosion Science, 44(5),
967-987.
Voice, A. K., & Rochelle, G. T. (2014). Inhibitors of Monoethanolamine oxidation in
CO2 capture processes. Industrial & Engineering Chemistry Research, 53(42), 16222-
16228.
Williams, E., & Leckie, H. P. (1968). Corrosion and its prevention in a
Monoethanolamine gas treating plant. MATER PROTECT, 7(7), 21-25.
Wu, H., Zhang, G. A., Zeng, S., & Lin, K. C. (2009). Extraction of allyl isothiocyanate
from horseradish (Armoracia rusticana) and its fumigant insecticidal activity on four
stored‐ product pests of paddy. Pest management science, 65(9), 1003-1008.
Yadav, D. K., Quraishi, M. A., & Maiti, B. (2012). Inhibition effect of some
benzylidenes on mild steel in 1M HCl: an experimental and theoretical
correlation. Corrosion Science, 55, 254-266.
Yilmaz, N., Fitoz, A., Ergun, Ü, & Emregül, K. C. (2016). A combined electrochemical
and theoretical study into the effect of 2-((thiazole-2-ylimino) methyl) phenol as a
corrosion inhibitor for mild steel in a highly acidic environment. Corrosion Science, 111,
110-120.
Zaferani, S. H., Sharifi, M., Zaarei, D., & Shishesaz, M. R. (2013). Application of eco-
friendly products as corrosion inhibitors for metals in acid pickling processes–A
review. Journal of Environmental Chemical Engineering, 1(4), 652-657.

167
Zhang, K., Xu, B., Yang, W., Yin, X., Liu, Y., & Chen, Y. (2015). Halogen-substituted
imidazoline derivatives as corrosion inhibitors for mild steel in hydrochloric acid
solution. Corrosion Science, 90, 284-295.
Zhao, B., Sun, Y., Yuan, Y., Gao, J., Wang, S., Zhuo, Y., & Chen, C. (2011). Study on
corrosion in CO2 chemical absorption process using amine solution. Energy Procedia, 4,
93-100.
Zheng, L., Landon, J., Zou, W., & Liu, K. (2014). Corrosion benefits of Piperazine as an
alternative CO2 capture solvent. Industrial & Engineering Chemistry Research, 53(29),
11740-11746.
Zheng, L., Landon, J., Koebcke, N. C., Chandan, P., & Liu, K. (2015). Suitability and
stability of 2-mercaptobenzimidazole as a corrosion inhibitor in a post-combustion CO2
capture system. Corrosion, 71(6), 692-702.
Zheng, X., Zhang, S., Li, W., Gong, M., & Yin, L. (2015). Experimental and theoretical
studies of two imidazolium-based ionic liquids as inhibitors for mild steel in sulfuric acid
solution. Corrosion Science, 95, 168-179.

168
APPENDIX
Table A.0.1 Uninhibited MEA solutions under the influence of temperature
Table A.0.2 Garlic inhibited MEA solutions for various inhibitor concentrations
Equivalent Electrical circuit for Uninhibited Systems : R(QR)(Q(R(LR)))
Temperature, °C R Q-Yo Q-Yn R Q-Yo Q-Yn R L R
80 1.21E+00 1.86E+00 7.88E-01 2.30E+00 2.69E-03 7.70E-01 1.84E+01 4.60E-01 1.46E+00
60 1.63E+00 2.28E-02 7.39E-01 3.00E+01 1.99E-03 7.76E-01 1.73E+01 1.24E+01 1.68E+01
40 2.12E+00 1.38E+00 1.00E+00 5.19E+07 1.74E-03 7.76E-01 8.25E+01 1.97E-01 1.68E+09
Equivalent Electrical circuit for Garlic inhibited Systems : R(QR)(Q(R(LR)))
Inhibitor Conc, ppm R Q-Yo Q-Yn R Q-Yo Q-Yn R L R
250 1.49E+00 5.22E-01 1.00E+00 2.79E+08 9.74E-04 8.24E-01 1.73E-02 1.23E+03 5.41E+01
500 1.67E+00 2.12E-01 1.00E+00 6.21E+09 8.75E-04 8.58E-01 6.67E-02 2.77E+02 1.34E+02
1000 1.42E+00 1.32E-03 8.89E-01 1.11E+02 1.12E-03 9.28E-01 2.70E+01 6.01E+01 1.94E+01
2000 1.46E+00 1.21E-03 8.94E-01 3.11E+01 1.60E-03 9.20E-01 1.09E+01 3.49E+04 1.00E-02
4000 7.85E+00 2.67E-01 1.00E+00 2.05E+11 1.28E-03 7.77E-01 1.96E-02 2.48E+03 1.11E+02
10000 1.47E+00 1.73E-03 9.75E-01 8.30E+01 8.87E-04 8.70E-01 4.51E+01 4.27E-02 5.63E+09

169
Equivalent Electrical circuit for Mustard inhibited Systems LR(QR(C))
Inhibitor Conc, ppm L R Q-Yo Q-Yn R C
250 2.44E-03 1.40E+00 1.26E-03 7.04E-01 1.38E+02 1.80E-04
500 1.00E-20 1.45E+00 9.00E-04 7.09E-01 1.34E+02 2.21E-01
1000 5.98E-07 2.13E+00 1.40E-03 8.00E-01 1.58E+02 2.40E-04
2000 1.36E-05 1.94E+00 1.09E-03 7.27E-01 1.32E+02 2.08E-04
4000 6.39E-04 1.38E+00 1.92E-03 8.49E-01 1.44E+02 6.61E-12
10000 1.95E-20 1.50E+00 6.78E-03 9.07E-01 1.06E+02 1.29E-20
Table A.0.3 Mustard inhibited MEA solutions for Inhibitor concentrations
Equivalent Electrical circuit for Horseradish inhibited Systems: R(QR)
Inhibitor Conc, ppm R Q-Yo Q-Yn R
250 2.54E+00 1.63E-03 8.00E-01 1.68E+02
500 1.33E+00 8.88E-04 8.27E-01 1.24E+02
1000 1.31E+02 1.03E-03 8.36E-01 1.42E+02
2000 2.28E+01 2.36E-03 7.72E-01 1.33E+02
4000 1.41E+00 2.22E-03 8.20E-01 1.25E+02
10000 1.44E+01 6.05E-03 9.07E-01 1.20E+02
Table A.0.4 Horseradish inhibited MEA solutions for Inhibitor concentrations
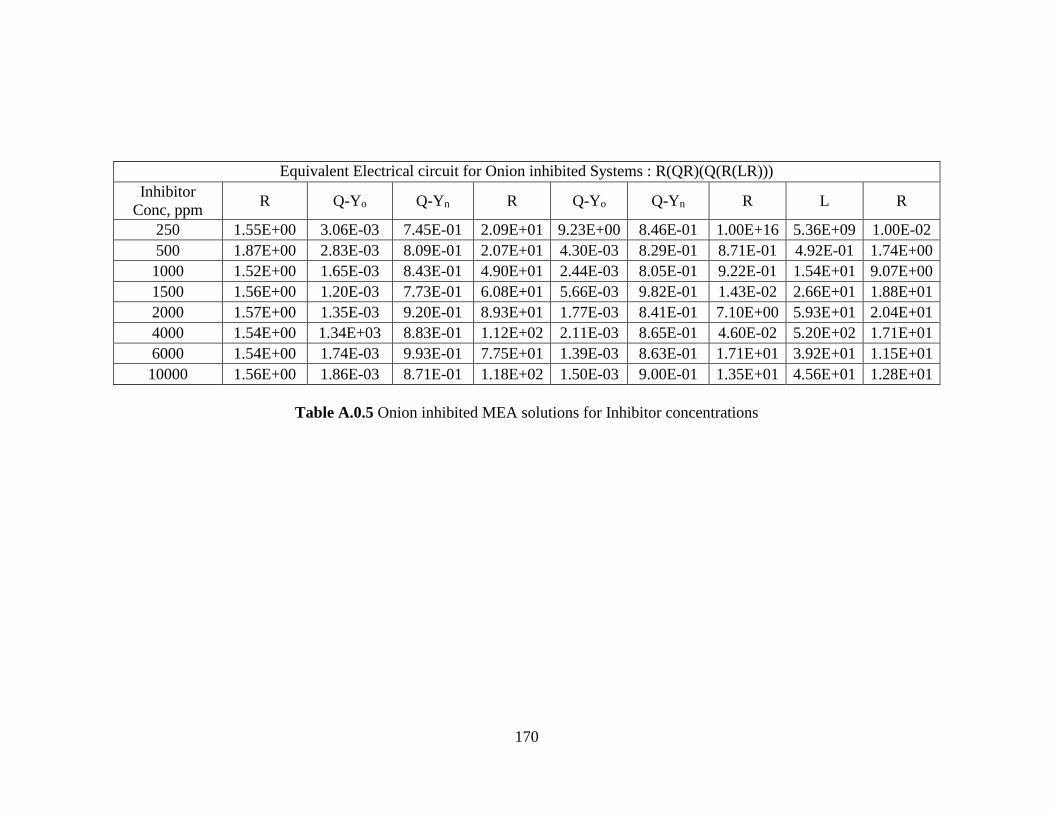
170
Equivalent Electrical circuit for Onion inhibited Systems : R(QR)(Q(R(LR)))
Inhibitor
Conc, ppm R Q-Yo Q-Yn R Q-Yo Q-Yn R L R
250 1.55E+00 3.06E-03 7.45E-01 2.09E+01 9.23E+00 8.46E-01 1.00E+16 5.36E+09 1.00E-02
500 1.87E+00 2.83E-03 8.09E-01 2.07E+01 4.30E-03 8.29E-01 8.71E-01 4.92E-01 1.74E+00
1000 1.52E+00 1.65E-03 8.43E-01 4.90E+01 2.44E-03 8.05E-01 9.22E-01 1.54E+01 9.07E+00
1500 1.56E+00 1.20E-03 7.73E-01 6.08E+01 5.66E-03 9.82E-01 1.43E-02 2.66E+01 1.88E+01
2000 1.57E+00 1.35E-03 9.20E-01 8.93E+01 1.77E-03 8.41E-01 7.10E+00 5.93E+01 2.04E+01
4000 1.54E+00 1.34E+03 8.83E-01 1.12E+02 2.11E-03 8.65E-01 4.60E-02 5.20E+02 1.71E+01
6000 1.54E+00 1.74E-03 9.93E-01 7.75E+01 1.39E-03 8.63E-01 1.71E+01 3.92E+01 1.15E+01
10000 1.56E+00 1.86E-03 8.71E-01 1.18E+02 1.50E-03 9.00E-01 1.35E+01 4.56E+01 1.28E+01
Table A.0.5 Onion inhibited MEA solutions for Inhibitor concentrations