Embed Size (px)
Citation preview
8/2/2016
1
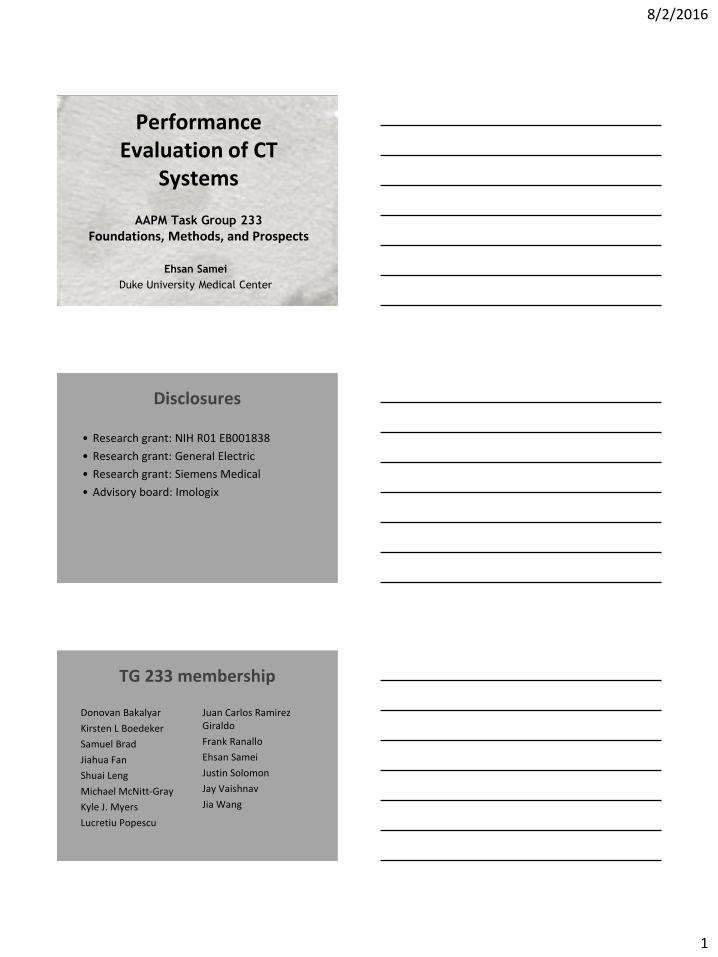
Performance Evaluation of CT
Systems
AAPM Task Group 233
Foundations, Methods, and Prospects
Ehsan Samei
Duke University Medical Center
Disclosures
• Research grant: NIH R01 EB001838
• Research grant: General Electric
• Research grant: Siemens Medical
• Advisory board: Imologix
TG 233 membership
Donovan Bakalyar
Kirsten L Boedeker
Samuel Brad
Jiahua Fan
Shuai Leng
Michael McNitt-Gray
Kyle J. Myers
Lucretiu Popescu
Juan Carlos Ramirez Giraldo
Frank Ranallo
Ehsan Samei
Justin Solomon
Jay Vaishnav
Jia Wang

8/2/2016
2
Carl E Ravin Advanced Imaging Laboratories Clinical Imaging Physics Group
Duke Imaging Physics
Outline
• Foundation
– What has led to TG233
• Methods
– Select procedures
• Prospects
– Possibilities
– Future extensions
Outline
• Foundation
– What has led to TG233
• Methods
– Select procedures
• Prospects
– Possibilities
– Future extensions

8/2/2016
3
Foundation
• New physics perspective
• New CT features
New physics perspective
• Medical physics metrology is most relevant to the extend it relates to the clinical need
1. Conformance-based testing
– Validating physical specifications: pass/fail
– Relevance of non-compliance?
2. Performance-based testing
– Metrics relevant to clinical accuracy
– Application to optimization of use: precision medicine and patient-centric care
Medical Physics 3.0
Medical physics extending from
specifications to performance
equipment to operation
quality check to process consistency
Presumption to actual utility
compliance to excellence

8/2/2016
4
Features of modern CT
• Variable kernels
• Iterative reconstruction
• Tube current modulation
• Special applications
– Spectral methods and applications
– Cone-beam CT
– Cardiac CT
– Perfusion imaging
Iterative recons
• Significant potential for dose reduction
• Potential for improved image quality
• Increased vendor-dependence
• Unconventional image appearance
• Limited utility of prior quality metrics
• Need for nuanced implementation for effective improvement in patient care
ASiR (GE)
Veo (GE)
IRIS (Siemens)
SAFIRE (Siemens)
AIDR (Toshiba)
iDose (Philips)
courtesy of University of Erlangen, Germany
Iterative
Reconstruction FBP
Reconstruction

8/2/2016
5
Low Dose CT @ 114 DLP, 1.9 mSv Courtesy of Dr de Mey and Dr Nieboer, UZ Brussel, Belgium
FBP
Reconstruction Iterative
Reconstruction
Resolution and noise, eg 1
Comparable resolution
Lower noise but different texture
0 0.2 0.4 0.6 0.8 0
0.2
0.4
0.6
0.8
1
Spatial frequency
MT
F
0 0.2 0.4 0.6 0.8 0
0.5
1
1.5
2
2.5
x 10 -6
Spatial frequency
NP
S
-FBP
-IRIS
-SAFIRE
-FBP
-IRIS
-SAFIRE
Higher resolution Lower noise but different texture
-MBIR
-ASIR
-FBP
0 0.2 0.4 0.6 0.8 0
0.1
0.2
0.3
0.4
0.5
0.6
0.7
0.8
0.9
1
Spatial frequency
MT
F
0 0.2 0.4 0.6 0.8 0
0.05
0.1
0.15
0.2
0.25
0.3
0.35
0.4
0.45
0.5
Spatial frequency
NP
S
x 10-5
Resolution and noise, eg 2
-MBIR
-ASIR
-FBP

8/2/2016
6
0
1
Non-Stationary Noise and Resolution
MTF
0
2.5 x10⁻⁶
NPS The Local NPS and MTF
Noise and resolution model for Penalized Likelihood (PL) model-based reconstruction.* Predictive framework for NPS, MTF, and detectability index (d’) enables task-based design and optimization of new systems using iterative reconstruction.
*Fessler et al. IEEE-TIP (1996) G. Gang et al. Med Phys 41 (2014)
Outline
• Foundation
– What has led to TG233
• Methods
– Select procedures
• Prospects
– Possibilities
– Future extensions
Methods
1. Visual inspection
2. Basic performance Summarizing existing methods in tabular form
3. Operational performance Tube current modulation
Spatial resolution
Noise
Quasi-linear task-based performance
Spatial domain task-based performance
Appendix

8/2/2016
7
Basic performance
TCM
• Use:
– Variable-sized, continuous and step-wise phantoms imaged with TCM
• Measure:
– mA and noise per size
• Evaluate:
– mA and noise size dependencies
– Phase concordance
Resolution
• Use:
– Phantom with 2 cm circular inserts of relevant contrast imaged using representative protocols
• Measure:
– Task transfer function (TTF)
• Evaluate:
– TTF at defined noise and contrast
– Frequencies at 50% and 10% TTF (f50 and f10)

8/2/2016
8
Noise
• Use:
– Variable-sized, uniform phantom imaged using representative protocols
• Measure:
– Noise magnitude and NPS
• Evaluate:
– SD and NPS at defined noise levels
– Peak, average frequencies of the NPS (fP and fA)
Spatial-domain task-based detectability
• Use:
– Uniform phantoms with rod and sphere targets imaged using representative protocols
• Measure:
– Human or observer model target detection
• Evaluate:
– Localization success rate for targeted tasks
– Area under the LROC curve for targeted tasks
– Area under the EFROC curve for targeted tasks
Quasi-linear task-based detectability index
• Use:
– TTF and NPS evaluation phantom imaged using representative protocols
• Measure:
– TTF and NPS
• Evaluate:
– Detectability indices for reference tasks (1, 5, 10 mm, 10 and 100 HU, designer, rect, Gaussian)
dNPWE'( )
2
=MTF 2(u,v)WTask
2 (u,v)òò E 2(u,v)dudv[ ]2
MTF 2(u,v)WTask
2 (u,v)òò NPS(u,v)E 4 (u,v) + MTF 2(u,v)WTask
2 (u,v)Ni dudv
8/2/2016
9
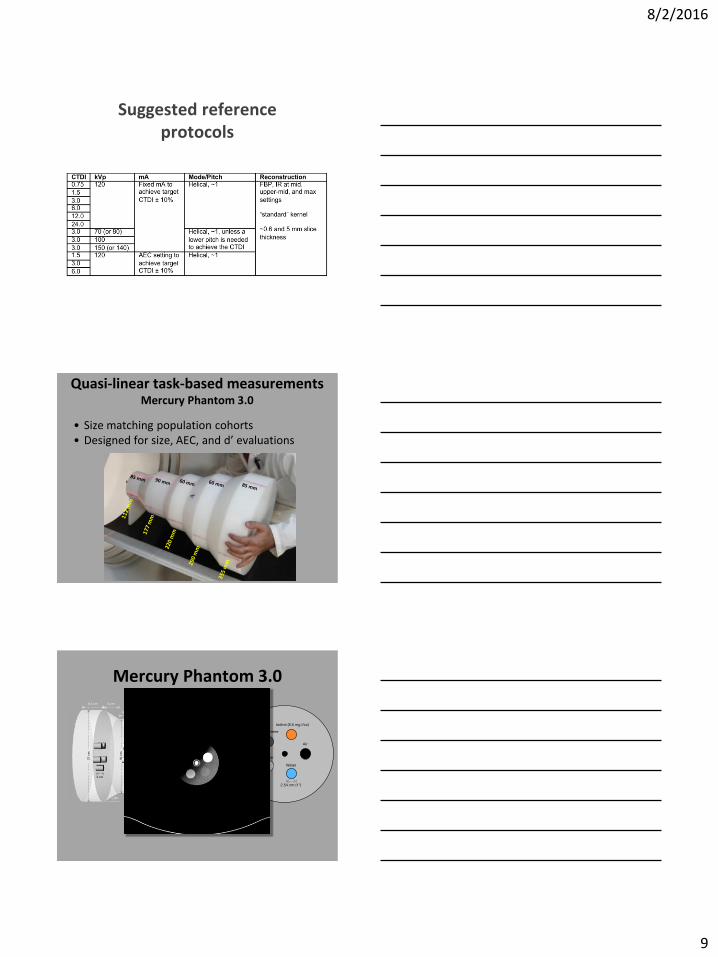
Suggested reference protocols
Quasi-linear task-based measurements Mercury Phantom 3.0
• Size matching population cohorts • Designed for size, AEC, and d’ evaluations
Mercury Phantom 3.0 8.5 cm
6 cm
6 cm
8.5 cm
6 cm
6 cm
6 cm
3.9 cm
5.63 cm
3 cm
37
cm
30
cm
23
cm
18
.5 c
m
12
cm
30°

8/2/2016
10
Design: Size Pediatric representation percentages
MP 3.0 section
Water size equivalent
Abdomen Chest Head
Age Percentile Age Percentile Age Percentile
120 mm 112 mm 0 12 0 50
0 5 7 5 5.5 5
185 mm 177 mm 6 50 10 50 3 95
15 5 16 5 12 50
230 mm 220 mm
3 95 8 95
- - 12 50 16 50
21 5
300 mm 290 mm 12 95
19 95 - - 21 50
370 mm 355 mm 20 95 - - - -
Design: Size Adult representation percentages
MP 3.0 section
Water size equivalent
Abdomen Chest Head
M F M F M F
120 mm 112 mm - - - - - -
185 mm 177 mm - - - - 25 75
230 mm 220 mm 0.4 9 0.06 1.4 - -
300 mm 290 mm 27.1 61 14 48 - -
370 mm 355 mm 80 90.3 60 87 - -
30
• Representation of abnormality-relevant HUs
• Sizes large enough for resolution sampling
• Maximum margin for individual assessment
• Iso-radius resolution properties
• Matching uniform section for noise assessment
Design: Resolution, HU, noise

8/2/2016
11
Image Quality Evaluation Software HU, Contrast, Noise, CNR, MTF, NPS, d’ per patient size, fixed mA and TCM
Expected release through AAPM TG 233
d’ vs observer performance
Christianson et al, Radiology, 2015
Comparing observer models Model: CNR CNRa NPW NPWE CHO CHOi
Task Properties
Lesion Contrast x x x x x x
Lesion Size x x x x x
Image Properties
Noise Magnitude x x x x x x
Noise Texture x x x x
Resolution x x x x
Observer Properties
Visual System x x x
Observer Noise x
Assumptions
Quasi LSI System x x
Noise Stationarity x x

8/2/2016
12
Criteria for goodness of d’ calculation methods
• Strong correlation with human results
– Coefficient of determination (R2) used as goodness of fit metric.
• Correlation independent of reconstruction algorithm
– Error, E, of linear discriminator used (bigger = better).
• Confidence interval for d’ should be small
– Average CI95% used.
FBP
ADMIRE
Fit
Lin. Disc.
Model
Hum
an
Normalized to unity slope
(c) Ehasn Samei
Humans vs. Models Simple Metrics Fourier-Based Image Based
ACNR
0.5 0.6 0.7 0.8 0.9 1
Dete
ctio
n A
ccu
racy
0.5
0.6
0.7
0.8
0.9
1
R2 = 0.114
E = 0.3CI
95% = 5.60e-03
CNR
ACNRa
0.5 0.6 0.7 0.8 0.9 1
Dete
ction
Accu
racy
0.5
0.6
0.7
0.8
0.9
1
R2 = 0.707
E = 0.15CI
95% = 1.20e-02
CNRa
ANPW
0.5 0.6 0.7 0.8 0.9 1
0.5
0.6
0.7
0.8
0.9
1
R2 = 0.726
E = 0.25CI
95% = 3.32e-03
NPW
ANPWE
0.5 0.6 0.7 0.8 0.9 1
0.5
0.6
0.7
0.8
0.9
1
R2 = 0.77
E = 0.3CI
95% = 5.83e-03
NPWE
ACHO
0.5 0.6 0.7 0.8 0.9 1
0.5
0.6
0.7
0.8
0.9
1
R2 = 0.603
E = 0.4CI
95% = 4.25e-02
CHO
ACHOi
0.5 0.6 0.7 0.8 0.9 1
0.5
0.6
0.7
0.8
0.9
1
R2 = 0.72
E = 0.45CI
95% = 4.59e-02
CHOi
Comparing statistics across models
0
0.2
0.4
0.6
0.8
1
CNR CNRa NPW NPWE CHO CHOi
0
0.1
0.2
0.3
0.4
0.5
CNR CNRa NPW NPWE CHO CHOi
0.00
0.01
0.02
0.03
0.04
0.05
CNR CNRa NPW NPWE CHO CHOi
R2 E
|CI95%|

8/2/2016
13
Model Comparison CNR CNRa NPW NPWE CHO CHOi
Correlated with humans?
Computed for generic tasks not present in phantom?
Handling non-linearity or non-stationary noise?
Correctly characterizing different recons?
Acceptable uncertainty for a reasonable # of images?
No
Somewhat
Yes
Outline
• Foundation
– What has led to TG233
• Methods
– Select procedures
• Prospects
– Possibilities
– Future extensions
F
Iodin
e c
once
ntr
ation
Size
Task-based performance Task characteristics for detection and estimation
C (r ) =Cpeak(1-
r
R
æ
èçç
ö
ø÷÷
2
)n

8/2/2016
14
FBP IRIS SAFIRE3 SAFIRE5
AUC vs. dose
Chen, SPIE, 2013
Task-based dose reduction
Large feature
detection task
FBP
0 1 2 3 4 5 6 7 0.5
0.55
0.6
0.65
0.7
0.75
0.8
0.85
0.9
0.95
1
Eff dose (mSv)
AU
C (
NP
WE
)
0.2
mSv
3.7
mSv
ACR Acrylic insert MBIR
78%
20%
FBP
0 1 2 3 4 5 6 7 0.5
0.55
0.6
0.65
0.7
0.75
0.8
0.85
0.9
0.95
1
Eff dose (mSv)
AU
C (
NP
WE
)
Small feature
detection task
0.2
mSv
3.7
mSv
ACR 0.5 lp/mm bar pattern
64%
29%
MBIR
Task-based dose reduction

8/2/2016
15
Dose-quality optimization
Quality-dose gradient to achieve highest quality at lowest dose
– Iso-gradient operating points
Detectability index across systems
Intra system variability: 1-4% Inter system variability: 6%
6
8
10
12
Det
ecta
bili
ty
Date
6 8 10 12
All Systems
System 1
System 2
System 3
System 4
System 5
System 6
System 7
System 8
System 9
System 10
System 11
System 12
System 13
Detectability index across protocols – pilot national trial
# Protocols 15 13 18 17 4 67
8/2/2016
16
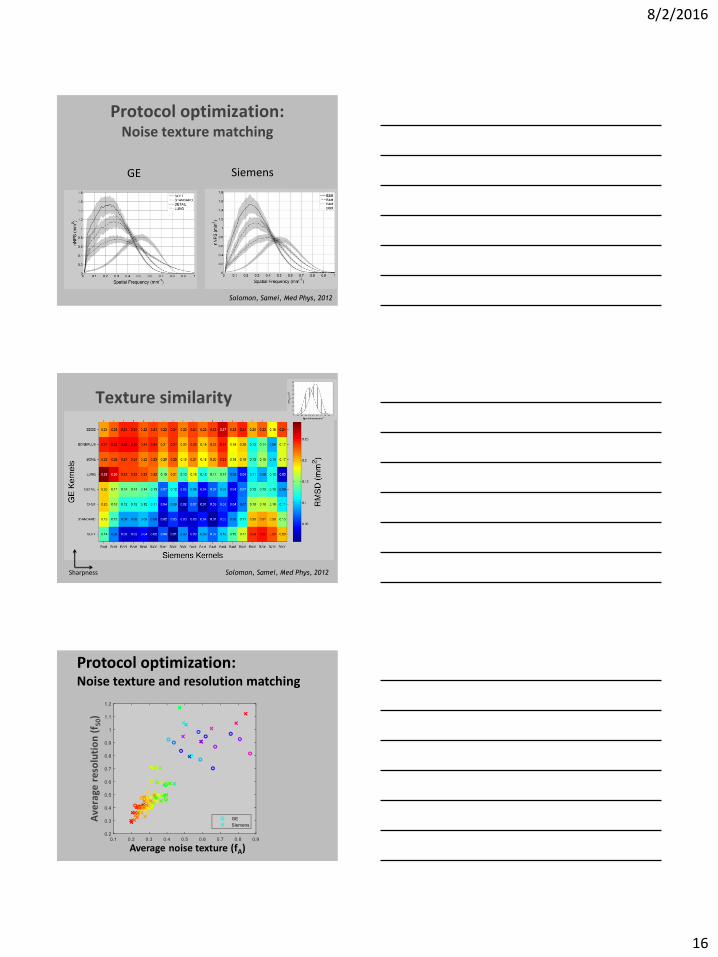
Protocol optimization: Noise texture matching
GE Siemens
Solomon, Samei, Med Phys, 2012
Texture similarity
Sharpness Solomon, Samei, Med Phys, 2012
Ave
rage
res
olu
tio
n (
f 50)
Average noise texture (fA)
Protocol optimization: Noise texture and resolution matching

8/2/2016
17
Ave
rage
res
olu
tio
n (
f 50)
Average noise texture (fA) Lo
g o
f d
ose
ne
ed
ed
fo
r a
targ
et
no
ise
of
10
Protocol optimization: Noise texture and resolution matching
Outline
• Foundation
– What has led to TG233
• Methods
– Select procedures
• Prospects
– Possibilities
– Future extensions
CT performance in anatomically-informed textured phantoms
Lung Texture Soft-Tissue Texture

8/2/2016
18
Noise in textured phantoms
What about noise texture?
FBP IR
0 0.2 0.4 0.6 0.8 10
50
100
150
200
250
300
Spatial Frequency (cycles/mm)
NP
S (
HU
2*m
m2)
Lung Texture NPS
FBP: Red Pixels
IR: Red Pixels
IR: Blue Pixels
0 0.2 0.4 0.6 0.8 10
0.2
0.4
0.6
0.8
1
1.2
1.4
Spatial Frequency (cycles/mm)
nN
PS
(m
m2)
Lung Texture NPS
FBP: Red Pixels
IR: Red Pixels
IR: Blue Pixels

8/2/2016
19
Texture phantom library
• Cylinder phantom – 30 mm thick – 165 mm diameter
• 20 Low contrast signals – 1 size (6 mm) – 5 contrast levels (~3, 5, 7, 10, 14 HU)
• Signal-present and signal-absent regions with identical background
• 4 phantoms made – 3 textured + 1 uniform
57
Conclusions
• New technologies and new paradigm necessitate an
upgrade to performance metrology towards higher
degrees of clinical relevance:
• “Taskful” surrogates of clinical performance
• Application for use optimization
• TG233 – a first step towards uniformity and
relevance of characterization
• TG 233 timeline
• Aug 2016: v. 12 released for committee review
• Release anticipated in late 2016