Embed Size (px)
Citation preview

J Intell Robot SystDOI 10.1007/s10846-016-0334-3
Performance Evaluation of Human Detection Systemsfor Robot Safety
William Shackleford ·Geraldine Cheok ·Tsai Hong ·Kamel Saidi ·Michael Shneier
Received: 9 April 2015 / Accepted: 11 January 2016© Springer Science+Business Media Dordrecht (outside the USA) 2016
Abstract Detecting and tracking people is becom-ing more important in robotic applications becauseof the increasing demand for collaborative work inwhich people interact closely with and in the sameworkspace as robots. New safety standards allow peo-ple to work next to robots, but require that they beprotected from harm while they do so. Sensors thatdetect and track people are a natural way of imple-menting the necessary safety monitoring, and have theadded advantage that the information about where thepeople are and where they are going can be fed backinto the application and used to give the robot greatersituational awareness for performing tasks. The resultsshould help users determine if such a system will pro-vide sufficient protection for people to be able to work
M. Shneier (�) · W. Shackleford · G. Cheok · T. Hong ·K. SaidiIntelligent Systems Division, National Instituteof Standards and Technology, Gaithersburg,MD, USAe-mail: [email protected]
W. Shackleforde-mail: [email protected]
G. Cheoke-mail: [email protected]
T. Honge-mail: [email protected]
K. Saidie-mail: [email protected]
safely in collaborative applications with industrialrobots.
Keywords Human detection · Human-robotcollaboration · Human tracking · Performanceevaluation · Performance metrics · Robot safety
1 Introduction
For most of their history, industrial robots have beenseparated from people for reasons of safety. There aremany disadvantages of this isolation including addi-tional costs for fences and safety sensors, the needfor extra floor space, and the difficulty of movingmaterial through the facility. Until recently, how-ever, both the safety standards and the capabilitiesof human detection sensors were barriers prevent-ing people from working safely in close proximity toindustrial robots. In the last few years robot safetystandards [1–3] have been modified to specify require-ments that allow humans and robots to work togetherin limited circumstances. Simultaneously, there hasbeen a significant improvement in the capabilities ofhuman detection and tracking systems, mainly dueto their greatly increased use in surveillance. Theneeds of surveillance applications, however, are dif-ferent from those of safety. Losing track of a personfor a few frames is usually not critical for concernin surveillance applications, whereas losing track in asafety situation is not acceptable. Similarly, reporting
J Intell Robot Syst
the presence of a person when there is nobody visibleis usually not of major consequence for surveillance,whereas doing the same in a manufacturing environ-ment may result in stopping production and causingunacceptable delays and losses.
The question that arises is whether or not cur-rent human-detection and tracking systems are reliableenough to be used in safety applications. The aim ofthe work described in this paper is not to resolve thequestion, since the answer depends on the plannedapplication. Rather, the goal is to provide a methodol-ogy and set of performance measures to enable poten-tial users to decide for themselves if their applicationcan be safely implemented using human detectionsensors.
In most previous work on performance evaluationfor human detection, ground truth (GT) was estab-lished by manual annotation of the imagery, either bydrawing the outline of the target objects or by plac-ing bounding boxes around them. The capabilities ofthe detection algorithms were then measured by theamount of overlap between the annotations and thealgorithm being evaluated. The current work takes adifferent approach. An independent measurement sys-tem is employed to provide the actual locations andmotion tracks of the people and a number of perfor-mance measures are used to measure the Euclideandistances in three-dimensional space between thelocations detected by the system under test and theground truth instrument.
Section 2 of this paper refers to previous workon human and object detection and tracking. Someof the performance measures used in this paper aretaken from that work. Section 3 describes the groundtruth systems and how the information is transformedinto a common coordinate system for comparison.Sections 4 and 5 describe the performance measuresand their results. Most of the measures are designedspecifically for safety applications. The paper endswith a discussion and conclusions. Detailed informa-tion about the experiments and results may be foundin Shneier et al. [4].
2 Related Work
Detecting and tracking people and objects has a longhistory, including a number of projects that focused
on performance evaluation. Ogale [5] provides asurvey of video-based human detection. The PETS(Performance Evaluation of Tracking and Surveil-lance) workshops, Ferryman, Crowley [6], focusedon algorithm development and performance evalu-ation of tasks such as multiple object detection,event detection, and recognition. Nascimento, Mar-ques [7], proposed a way to evaluate the perfor-mance of object detection systems by comparingalgorithm results to ground-truth data and calculatingperformance metrics such as correct detections, falsealarms, detection failure, and splitting and mergingerrors. CLEAR (Classification of Events, Activitiesand Relationships), Stiefelhagen, Garofolo [8], pro-vides performance evaluation of people, faces, cars,and object tracking and ETISEO, Nghiem et al. [9],was a video understanding and evaluation projectfor tracking systems that used an event detectionalgorithm.
The Image Library for Intelligent Detection Sys-tems (i-LIDS) [10, 11] is a United Kingdom govern-ment initiative that conducts performance evaluationsof vision-based detection systems to ensure that theymeet Government requirements. Other papers specificto tracking-based metrics are Brown et al. [12], whosuggest a motion tracking evaluation framework thatestimates the number of True Positive, False Positiveand False Negative, Merged, and Split trajectories. Yinet al. [13] proposed a large set of metrics to assess dif-ferent aspects of the performance of motion trackingand to help identify shortcomings of motion trackersunder specific conditions. Lazarevic-McManus et al.[14], developed a tracking metric to enable evalua-tion of motion detection based on Receiver OperatingCharacteristic (ROC)-like curves and the F-measure (acombination of precision and recall). Bashir, Porikli[15], presented metrics based on the spatial intersec-tion of ground-truth and system-generated boundingboxes and then calculated a number of performancemetrics, which they then averaged for all the sam-pled frames. Black et al. [16], used synthetic videoto evaluate tracking performance. They varied thescene complexity of the tracking task by adding occlu-sions and clutter and increasing the number of objectsand people in the scene and presented results basedon a number of metrics. Several other performanceevaluation metrics were developed and discussed in[17–22].

J Intell Robot Syst
The National Institute of Standards and Technology(NIST) has helped to develop performance metricsfor object and human detection in a number of dif-ferent applications, ranging from videoconferencesthrough surveillance to counting and tracking peo-ple in stores and commercial establishments. NISThas worked with the United States Department ofHomeland Security, with the British Home Office,and with the European CHIL program (Computers inthe Human Interaction Loop), [14], and the CLEARevaluations, [23]. NIST has also worked with the USArmy Collaborative Technology Alliance (CTA) onRobotics to evaluate systems that locate and trackhuman pedestrians from a moving vehicle (Bodt et al.[24]).
The biggest difference between the current paperand previous work relates to how performance mea-sures make use of ground truth and, particularly, theuse of three-dimensional space instead of the imagedomain to compute the performance measures. Insteadof using windows or manually-outlined regions in theimage as ground truth, the work described here explic-itly equips each person with sensors that provide iden-tity and location information, measured with substan-tially higher accuracy than the system under test. Fur-ther, both the ground truth and system under test pro-vide pose information in the three-dimensional worldrather than the image. This is important because,for safety applications, it is critical to know pre-cisely where in space a person is located in order toguarantee that they will not be endangered by theirenvironment.
3 Measuring Ground Truth
Godil et al. [25], describe four types of ground truthdata for object detection and tracking: annotationor label-based systems that rely on humans to out-line regions in the data, fixture-based systems thatuse physical positioning constraints to locate itemsprecisely, physics-based simulations that depend onmodels of the objects and their locations in the world,and sensor-based systems that use independent meansto sense the world and locate the objects. This paperadopts the last of these methods, making use of asensor-based ground truth system, described in thefollowing subsection.
(a)
(b)
Fig. 1 An iGPS transmitter (a) and two receivers (vector bars)(b) with cables and position computation engine (PCE)
3.1 Indoor Global Positioning System
The Indoor Global Positioning System (iGPS),1 [26],is a high-resolution measurement system, shown inFig. 1, that can locate objects in a large volume ofspace and provide full six degree-of-freedom pose formultiple objects at the same time. The system usesstationary laser transmitters (Fig. 1a) and receivers
1 Commercial equipment and materials are identified in orderto adequately specify certain procedures. In no case does suchidentification imply recommendation or endorsement by theNational Institute of Standards and Technology, nor does itimply that the materials or equipment identified are necessarilythe best available for the purpose.

J Intell Robot Syst
(Fig. 1b) mounted on moving or static objects todetermine the poses of the objects. It requires line ofsight to at least two transmitters to be able to makea measurement. The manufacturer specifies the accu-racy of 3D position measurements of the iGPS as0.25 mm, with a maximum measurement frequencyof 40 Hz. A typical measurement area based on fourto eight transmitters is 1200 m2. Detailed analyses ofthe system are presented by Schmitt et al. [27], andMosqueira et al. [28]. In [29], Wang et al. showedthat the tracking accuracy of an object in motion issimilar to the static accuracy for speeds below 10cm/s. However, they found that as the speed of anobject increases, the tracking accuracy decreases—ata speed of 1 m/s, the mean tracking error could beas high as 4 mm. In another study, Depenthal [30],showed that when tracking objects at velocities of 3m/s, the 3D position deviation is less than 0.3 mm.She described the experimental comparison of thedynamic tracking performance between an iGPS anda laser tracker and showed that the iGPS performedwell under dynamic conditions. In the human-trackingexperiments described in this paper, a pair of iGPSvector bars is attached to the top of a hard hat wornby each person, as shown in Fig. 2. The center of a
iGPS receiver bars
iGPS PCE
Fig. 2 iGPS vector bars attached to hardhat to be worn by ahuman. The position calculation engine (PCE) is worn aroundthe waist
human head was tracked as a point relative to a frame,in global coordinates, defined by the two vector bars.
The iGPS sensor has a fast enough update rate totrack people moving at walking or running speeds andis accurate enough to provide an order of magnitudebetter pose measurement than most sensors used forhuman tracking. Its wide field of view allows a rangeof typical activities to be carried out by the peoplebeing tracked, and the need for only two transmittersto have line of sight to the sensors at any time ensuresthat the system can provide data even in scenes withsignificant clutter. A drawback of this system is thesize of the vector bars, which are difficult to attach tosmall objects.
Note that in the experiments, two ground truth sys-tems were used; the gray spheres on the hard hat in 2are markers for a motion capture system. The resultspresented in this paper make use of the ground truthprovided by the iGPS system because it has beenmore rigorously characterized and it provided datawith fewer dropouts in the experiments.
The human being tracked by the iGPS was repre-sented by a point - the center of the person’s head.An experiment was conducted to determine the uncer-tainty of this point as measured by the iGPS. Theaverage standard deviation of the x, y, z coordinateswas ± 20.5 mm.
4 Methodology
A series of experiments was conducted with humansubjects to collect data to evaluate the performancemetrics. The focus of the metrics is on applicationswhere safety in human-robot interaction is the mainconcern, although some of the measures have beenused in previous, more general studies. A humandetection and tracking algorithm was adopted basedon a literature search and was used to analyze thedata, although the aim was not to evaluate that partic-ular algorithm’s performance. The algorithm and itsimplementation are briefly described in the next sub-section. This is followed by a description of how thedata were collected and what information was gath-ered. The performance metrics are then described andtheir application to the human detection system isevaluated.

J Intell Robot Syst
4.1 The Human Detection and Tracking Algorithm
Over the past several years, human detection has beenthe subject of significant advances, and one of themotivations for this study was to determine if algo-rithms had progressed to the point at which they canbe used in safety applications.
The algorithm that was selected is that of Cham-bers et al. [31], because it claims a very high accuracy:99% recall with less than 10−6 false positives per win-dow on the INRIA person dataset (Dalal [32]). Thealgorithm operates on disparity data acquired fromeither a stereo camera system or an RGB-D cam-era (in this case we used an ASUS Xtion Pro Livesensor). RGB-D sensors provide a color image plusthe depth of each point in the image. The approachtaken by Chambers et al. is to start with computa-tionally non-intensive feature detectors that can ruleout image regions as locations potentially containingpeople. More computationally-intensive detectors arethen applied to the remaining regions in a cascadethat continues to eliminate candidates until, followingthe application of the final detectors, the remainingcandidates have high confidence.
The sequence of detectors starts by using Haar-like features (Papageorgiou et al. [33]), classifiedfirst using adaBoost (Freund, Schapire [34]), then asupport-vector machine (SVM) (Cortes, Vapnik [35]),on a subset of the features and finally, an SVM onall the features. This is followed by a Haar-like fea-ture detector applied to the disparity image using anadaBoost classifier on a subset of the features, butwithout the subsequent SVM classifier. Windows thathave passed the preliminary classifiers are processedwith a histogram of oriented gradients (HOG) (Dalal,Triggs [36]), customized to reflect the expected sil-houette of a person. Two additional constraints areapplied to the data, made possible because dispar-ity is available. The first is a size constraint on theregions that may contain people, while the second isan estimate of the ground plane on which people areexpected to be standing. The algorithm outputs an esti-mate of the position in 3D space of each detectedperson and an identifier for each person. Over time,the same identifier should be given to the same per-son, and the system can tolerate short-time occlusionsor intervals when people move out of the field of view
of the sensors and then come back into view.Each of the classifiers in the algorithm needs to be
trained. A set of training data was collected indepen-dently of the data used for evaluation. Because theHOG classifier is heavily dependent on the appear-ance of the silhouettes of the people, the training datawere collected with people wearing the hard hats withground truth markers, even though no ground truthwas needed for training. It was felt that this would givea fairer evaluation of the algorithm.
4.2 Data Collection
A series of experiments was designed in which humansubjects were asked to stand, walk, or jog in the fieldof view of the sensors.2 The people wore hard hatsinstrumented with detectors from the iGPS system sothat their actual locations and trajectories would beknown, and data from all sensors were collected withtimestamps to enable corresponding readings to becompared. Each of the sensors was calibrated, and theground truth sensors and system being tested were reg-istered to a common coordinate system. The experi-ments started out very simply with stationary people insimple scenes (no obstructions, simple backgrounds).The next experiments involved a single moving per-son in simple scenes and with obstacles. After that,multiple people moved in scenes with some human-to-human or human-to-obstacle occlusions. In some ofthe experiments, an object moved along a straight linethrough the scene on a motorized sled. The obstaclesused were empty cardboard boxes. Figure 3 shows aview of an experiment in progress. Note the hard hatwith reflectors for ground truth measurements.
Due to the limited field of view of the sensors beingtested, in particular the ASUS Xtion sensor, the activearea used for testing was small, only 5 m by 5 m, witha 1 m buffer area surrounding it. One side of the floorwas labeled with letters and the other with numbers.This meant that a person could be asked to stand in a
2 The NIST Institutional Review Board approved the experi-mental protocol before the experiments were conducted. Dueto the possible presence of personally identifiable information,they determined that the data collected during the experimentscould not be made available for use outside NIST.

J Intell Robot Syst
iGPS Transmi�ers
Fig. 3 A view of the test area showing an experiment inprogress with obstacles in place
particular location (e.g., J5) or to move from one loca-tion to another without researchers having to mark thepaths, which changed with different experiments.
There were a total of 34 different experiments, eachof which was repeated five times with different par-ticipants. More details of the 34 different experimentsmay be found in Shneier et al. [4].3 A total of fifteensubjects participated. The experiments were designedto include factors such as distance from the systemunder test, occlusion, clutter, speed of motion, differ-ent types of trajectories, and different human shapesand features. To give a flavor of the experiments, twoare briefly described below. The data collected foreach experiment included a sequence containing, foreach instant (about 20 frames per second), the positionof each person (x, y, z, roll, pitch, yaw), an identifierfor the person, and a time stamp. This was collectedfor both the ground truth system and for the sensorbeing evaluated. Each sensor collected data at its ownrate, but the time stamp made it possible to align thedata for analysis.
4.3 Representative Experiments
In the experiments with moving people, the same tra-jectory was covered for four different cases: walkingwithout obstacles, jogging without obstacles, walkingwith obstacles, and jogging with obstacles. Each per-son was given a trajectory at the start of the experiment
3Available at http://nvlpubs.nist.gov/nistpubs/ir/2015/NIST.IR.8045.pdf.
and told to walk or jog at a comfortable speed (Fig. 4).Data were collected simultaneously from the groundtruth and system under test sensors for the duration ofthe experiment.
To determine howwell the algorithm can keep trackof many people, a number of tests were conductedwith up to five subjects (Fig. 5). In the limited spaceavailable because of the narrow field of view of thesystem being evaluated, there is a lot of crowding and,with obstacles in place, there is also person-to-personand person-to-obstacle occlusion. This is not atypi-cal of a workspace such as an assembly line wherethere will often be equipment and other people in thearea. As in the single person case, each experimentwith multiple people was conducted four times withdifferent speeds and with and without obstacles.
5 Performance Measures
This section presents a new approach for measur-ing the performance of human detection systemsdeveloped specifically for applications in which safetyis critical. We also describe some more traditionalmetrics for detection and tracking that are used tocomplement the new approach. Before describing theperformance measures, we discuss the data obtainedfrom the tests and registration of data from the iGPSground truth (GT) sensors and the system under test(SUT).
5.1 Input Data
There are three types of input files:
GT Data Files There is a separate file for each sen-sor and for each test (i.e., two sensors * 100 tests =200 files). Each row contains a timestamp, ID, X, Y ,Z, where the timestamp represents the time in secondssince Jan 1, 1970 UTC, ID is a unique string corre-sponding to a person or physical target, and X, Y , Z
are the Cartesian coordinates of the target. Each rowmay contain an optional radius which describes thedistance from the center point of a detected person suf-ficient to contain the entire person, measured on theground (XY plane).

J Intell Robot Syst
Fig. 4 A single personwalks along a pre-definedpath starting at A
1.) SUT Data Files. There are separate files for eachtest. Each row contains a timestamp, ID,X, Y ,Z,as above. Each row may contain optional fieldsused by the analysis system if present, including
velocities in X, Y, and Z directions, radius, andconfidence.
2.) Position and Orientation Transform Files. A sin-gle transform file is used for each sensor for
Fig. 5 Five people movingthrough the spacesimultaneously withobstacles. The doublearrows indicate that theperson will move along thepath in both directions
J Intell Robot Syst
all tests because the sensors were not movedbetween tests. The transform is a 4×4 homoge-nous matrix that encodes the registration betweenthe SUT sensor and the GT obtained from acalibration and registration procedure.
5.2 Data Interpolation
The data were converted to units of seconds andmeters and synchronized using the Network Time Pro-tocol and a trigger signal. Data were interpolated sothat the GT system provided the best estimate of theposition of each person at each time given all data,including data collected after that point in time. Forthe SUT data, interpolation used only data producedprior to each sample time. The evaluation softwarelimits the analysis to the common period of time whenboth GT and SUT systems were running.
5.3 Performance Measures for Safe Human-RobotInteraction
A new set of performance measures was defined withthe following goals:
1) Provide safety guarantees: No area is falsely con-sidered to be clear. An area is falsely consideredto be clear if a person may be in the area but thesystem says no human is in the area. Details areprovided in Section 5.6.
2) Be able to compare systems as configured by thevendor with safety guarantees met.
3) Provide fair comparisons between systems withdifferent frame rates, detection mechanisms, anddifferent numbers of outputs
4) Make it easy to combine multiple detection sys-tems.
5) Separate responsibility between human detectionand robot path planning and execution.
All of the software used to compute these measuresand to perform the analysis in Section 6 is availablefrom Shackleford [37]. Full source code is providedto ensure that the algorithms are unambiguously spec-ified and the results are reproducible.
There are two types of mistakes a human-detectionsystem could make. It could report that an area con-tains a human when it is actually safe for the robot totraverse or it could report that an area does not con-
tain a human when in fact it does. The first kind oferror, a false positive, reduces productivity by lead-ing the robot to stop, slow, or take a longer path thannecessary, while the other, a false negative, reducessafety by potentially allowing the robot to collide witha human. The guarantee we expect human detectionsystems to provide is that for all tests conducted, forevery point in time during the test, and for all locationswithin the test area, the detection system never makesthe second, and far more dangerous, kind of error. Toinfer that the system is safe beyond what is reportedby the tests, two additional requirements must be met:
6) The tests cover all possible cases the system willencounter. The tests described in Section 4 pro-vide a minimum set, but are not intended tobe sufficient for this purpose. A more completeset would require designing the test with morespecific information about the application andintended environment.
7) The robot’s planning and path execution mustmeet its own set of requirements, to be brieflydescribed later.
5.4 Detection Area vs Safety Coverage Area
The SUT is only expected to report the positions ofpeople within its field of view and between its min-imum and maximum operating ranges. The safetycoverage area is the area the system could potentiallytell was safe to move through and is smaller than thearea where detections could occur. The reasons forthis are: 1) Part of a person centered just outside thedetection area could extend into the detection area; 2)If the robot has non-zero reaction time, then a personoutside the detection area could move into the detec-tion area before a robot could react [38]; 3) Part ofthe area where detections could normally occur maybe occluded from the system; and 4) At the farthestand nearest ranges of the detection area there may bean area where detections sometimes occur but are notsufficiently reliable for safety applications. The evalu-ation software allows the user to specify a polygon asthe outer edge of the safety coverage area.
Ground-Truth Radius Estimate The GT system pro-vides only a single position at a time for a target

J Intell Robot Syst
attached to the helmet. The positions of the per-son’s shoulders, hands, feet, and other body partscan only be inferred to be located somewhere withina circle centered at the helmet target position (plusoptional offset). This radius is configurable and canbe expanded to include an additional safety mar-gin. If increased accuracy is required, then a groundtruth system that could provide positions and possiblyshapes of each body part would be required.
5.5 False Clear Area/ False Occupied Area
Given the above assumptions, two primary metrics,False Clear area and False Occupied area, are com-puted using a similar procedure except for a changein the order of operations. To compute the false cleararea:
1) Create an image covering the area of interest atthe desired resolution.
2) Paint the entire image black.3) Paint white circles surrounding each GT location
of a person (see Fig. 6). The sizes of the circlesare as described in Section 5.4.
4) Paint black circles surrounding each locationwhere a person was found by the SUT.
5) Count the number of pixels that are white fol-lowing steps 3 and 4 (see Fig. 7) to give the falseclear area.To compute the false occupied area:
6) Create an image covering the area of interest atthe desired resolution.
Fig. 6 Intermediate step in computing the False Clear Area.After Step 3, white circles indicate where GT located people
Fig. 7 The final false clear area, after Step 5
7) Paint the entire image black.8) Paint white circles surrounding each location
where the SUT detected a person.9) Paint black circles surrounding the locations
where the GT detected people.10) The number of pixels that are white follow-
ing this procedure gives the area that is falselydetermined to be occupied (see Fig. 12).
Note: It would be incorrect to assume that falseclear or false occupied regions smaller than the sizethat a person could occupy can or should be ignored. Ifthe area were to be ignored a robot could hit a personwho was partially in that area and partially in an areathat was correctly labeled or was outside the detectionarea. Similarly, false occupied areas of any size mayrequire the robot to stop or take a longer path and thusreduce productivity.
5.6 Occlusions
Some regions of the coverage area will be occludedfrom the sensor by dynamic or static obstacles. A plan-ner that produces a safe path must treat areas that areoccluded as if they contain a person. The procedureabove is therefore modified by painting an additionalpolygon behind each static obstacle and behind thepositions where people were detected by the SUT.Painting these polygons requires that the evaluationsystem know the location of the SUT. If an area is evenpartially occluded a person may be in this area andtherefore the only safe assumption is to treat the area

J Intell Robot Syst
Fig. 8 Top view of occupied areas after occlusions areaccounted for. Grey regions are occluded by static obstacles.White areas are areas occupied or occluded according to thesystem under test. Brown boxes indicate the locations of staticobstacles. The sensor is located below the image
as if it is known to contain a person. This results in anestimate of the occupied areas that appears somethinglike Fig. 8.
5.7 Time Projection for Assumed Reaction Time
No system can react instantaneously. The planningand control system takes time to respond to new detec-tions or changes in the estimated position of a detectedperson. What matters is a guarantee of where peoplecannot be over some time interval into the future. Toaccount for this, false clear and false occupied regionsare computed as in Section 5.6 except now from eachpoint in time we integrate over a period into the future.This means that the SUT must not only estimate thecurrent position of each person, but also predict poten-tial future positions measured from that point until thereaction time has expired (Fig. 9).
Fig. 9 Display of False Occupied regions as computed by inte-grating over the reaction time. SUT Occupied area is whitestretched circle. GT Occupied area is black region
The simplest way of accomplishing this predictionis to increase the radius around each detected per-son until it contains the entire area through whichthe person can travel during the reaction time. Sys-tems that can accurately measure a person’s velocitymay be able to predict their location through shortreaction time periods without increasing the radiusor by increasing it by a small amount. The evalua-tion software is currently limited to projecting alonga single vector at constant speed since this is theonly information the SUT could provide. To test sys-tems capable of more sophisticated predictions, theevaluation software would have to be updated.
5.8 Simulated Examples
In the first simulated example we take only a singleframe of data and both the GT system and the SUTreturn a single position for the only person in the scene(Fig. 10). We assume that occlusions are not an issuefor this system and either that the person is stationaryor the robot reacts fast enough that time projection isnot necessary. We compute the false clear area as inSection 5.5, giving the result in Fig. 11. In this exam-ple, the SUT reported a position that was somewhatto the left of the true position. This, combined withthe fact that the system reported only one position andreported only the same minimum radius the GT wasset to, means that the person is in danger of being hitby the robot on the right side. For the false clear image,the areas in black are areas where no robot-to-human
Fig. 10 Simulated example 1. Ground truth position in redsurrounded by ground truth radius in red. System under testposition in blue surrounded by system under test reported radius

J Intell Robot Syst
Fig. 11 False clear area for simple example 1
collision can occur either because there is no humanthere or because the robot has been told not to enterthat area. The areas in white are regions where a col-lision can occur because it is close enough to the GTposition that a portion of the person occupies that areaand the robot has no reason to avoid the area. Giventhat the false clear area is not zero, the conclusion isthat this sensor is not safe to use and no further anal-ysis is needed, although it may only require a simplefix. Later examples suggest some possible fixes, butone should be careful about allowing system devel-opers to make a large number of changes to workaround each test failure, since the test results may notgeneralize.
The false occupied area is shown in Fig. 12. Here,the SUT reported a position that was somewhat to theleft of the true position. This means there is an area tothe left of the person that the robot will be forced toavoid unnecessarily and this will reduce productivity.The black areas represent regions of maximum pro-ductivity that either the robot is avoiding because ittruly needs to or it is able to traverse. The white areasrepresent areas that the robot cannot use but whichwould be usable if we had chosen a better sensor.There are 95 white pixels with an area of 4 square cen-timeters each. This means the false occupied area is380 square centimeters and the ratio of “Average False
Fig. 12 False occupied region for simulated example 1
Fig. 13 Simulated example 2. Ground truth position in redsurrounded by ground truth radius in red. System under testposition in blue surrounded by system under test reported radius
Occupied Area to Safety Coverage Area” is 0.01 sincethere were 9500 pixels in the entire safety coveragearea (Fig. 13).
The second example is the same as the first exceptthe system reports a larger radius for the person.
In this example, computing the false clear arearesults in a completely black field, indicating that theSUT reported a position somewhat to the left of thetrue position but, since it increased the area aroundthat position sufficiently, there is no position that therobot will go where it may collide with a person.
Figure 14 shows the false occupied area, whichreflects that the SUT reported a position that wassomewhat to the left of the true position. This meansthere is an area to the left of the person that therobot will be forced to avoid unnecessarily and thiswill reduce productivity. The increased radius whichmakes the system safe also increases this area. Thefalse occupied area is 1560 square centimeters and theratio of “Average False Occupied Area to Safety Cov-erage Area” is 0.041 since there were 9500 pixels inthe entire safety coverage area (Figs. 15 and 16).
Fig. 14 False occupied region for example 2

J Intell Robot Syst
Fig. 15 Simulated example 3. Ground truth position in redsurrounded by ground truth radius in red. System under testpositions in blue surrounded by system under test reportedradius
In the third example, the GT reported a single per-son at a single position while the SUT reported twopositions. The radii reported by the SUT are largerthan in example 1 but smaller than in example 2. Onewas somewhat to the left of the true position and oneto the right. This means there is an area on both sidesof the person that the robot will be forced to avoidunnecessarily and this will reduce productivity. Theincreased radius which makes the system safe alsoincreases this area. The false occupied area is 1444square centimeters and the ratio of “Average FalseOccupied Area to Safety Coverage Area” is 0.038.
The conclusion from this set of examples (Table 1)is that the system from example 1 is not suitable byitself as a safety sensor. If it were the only choice avail-able, conventional fences or manual machines shouldbe used instead. No more tests are needed to determinewhether example 1 is safe to use since it has alreadyfailed. Examples 2 and 3 appear to be safe in this lim-ited test, although more testing should be done in the
Fig. 16 False Occupied region for example 3
Table 1 Safety of system under test in the three examplescenarios
System Safe ? Average False
Occupied Area / Safety
Coverage Area
Example 1 NO 0.010
Example 2 Yes (but further testing 0.041
is required)
Example 3 Yes (but further testing 0.038
is required)
target environment. Between example 2 and example3, example 3 allows the robot to traverse more spacewhich should lead to higher productivity.
Note that the metrics are not simply related to aminimum safety radius. The minimum safety radiuscannot be computed from the localization error. If theperson is entirely within the safety coverage area andthere is only one SUT point, then the minimum radiusequals the distance between the two points plus thedistance of the furthest point from the detection to anyportion of the person. However, with more than onepoint the distance need not reach the furthest point onthe person, but only the furthest point not covered byanother detection point. Some portion of the personcould be within a known area of occlusion that therobot would have to avoid anyway. This would changethe position on the person that need be reached bythe minimum safety radius. Some portion of the per-son might also be outside the coverage area and therewould be no need for the minimum safety radius toextend to cover this portion of the person.
With increasing distance it becomes less likely thatthe closest point reported by the SUT corresponds tothe same person as that from the GT. In this case, itis better to mark the area as false clear. The exact dis-tance at which this should be set is sensor dependent.The sensor vendor should commit to a radius beforetests are performed and the tests should determine ifthe results are valid.
The false occupied area also cannot be computedfrom localization errors with or without a knownminimum safe radius. The SUT could report a posi-tion during a period of time when no GT positionsreported. There would therefore be no distances tomeasure during this period of time and therefore no

J Intell Robot Syst
effect on the localization error although there wouldbe a large increase in the false occupied area. Evenwhen there are GT positions in the scene at the sametime, the correspondence function does not guaran-tee that all SUT positions will have a correspondingpoint with which to compute a distance. The corre-spondence function also does not guarantee that whena distance is computed that there is no closer GTposition that could have produced a smaller distance.Even in the absence of GT positions, two sets ofSUT positions of the same size can produce differ-ent amounts of false occupied area. In one set thepoints could largely overlap producing a false occu-pied area only slightly larger than the area of a circlefor one person while in the other set they could bedisjoint, producing an area larger by a factor of thenumber of points reported. Reported positions couldalso be close to the edge of the safety coverage area,thus reducing the increase in the false occupied area.Sensors that are susceptible to occlusion will neces-sarily have to mark large areas of the area as occupiedand thus have a larger false occupied area than sen-sors not susceptible to occlusion even when reportingthe same set of positions with the same minimumsafe radius.
5.9 Conventional Performance Measures
In addition to the new metrics, several others thathave been used for human detection were also applied.Also, since the new approach does not include track-ing, some previously-used tracking metrics were used.These measures allow us to compare human detectionalgorithms to others in the literature and to providean indication of how well the algorithms maintain theidentities of people as they move about in the environ-ment. They do not, however, provide a measure of thesafety of the systems. The human detection metricsthat we used include:
1) False Positive (FP): A human is present in theSUT data but not in the GT data.
2) False Negative (FN): A human is present in theGT data, but not in the SUT data.
3) True Positive (TP): A human is present in the GTdata and the SUT data.
4) False Positive Rate (FPR): The number of falsepositives divided by the sum of the number of
true positives and false positives. FPR is a mea-sure of how well the system correctly rejects falsepositives.
5) Detection Rate (DR): The number of true posi-tives divided by the sum of true positives and falsenegatives. DR is the percentage of true targetsdetected.
6) False Negative Rate (FNR): FNR is the numberof false negatives divided by the sum of true pos-itives and false negatives. FNR is the likelihoodthat a target will be missed given the total numberof actual targets.
7) Detection Precision (DP): DP is the number oftrue positives divided by the sum of the true pos-itives and false positives. That is, precision is thefraction of detected items that are correct
8) Localization: The average distance between theposition of the person detected by the SUT andthe position in the corresponding GT data over thecourse of an experiment.
Unlike the metrics for safety described above, con-ventional metrics provide no clear indication that asystem is or is not safe. They also require a corre-lation between GT data and SUT data. For exampleit may be necessary to know that the third positionreported by the SUT system corresponds to the secondposition reported by the GT system. While correspon-dences may seem obvious in some cases, there is noclear general rule for establishing them. The safetymetrics proposed above require no assumptions aboutcorrespondences. It should also be noted that the con-ventional metrics focus on average or typical behaviorwhile the safety of the system primarily depends onatypical or extreme cases. Furthermore since they dealonly with discrete people they cannot include an effectfor a person only partially within the coverage area oronly partially within an area of known occlusion.
The human tracking metrics measure the ability ofa SUT to track humans over time. The tracking met-rics consider the identity and the complete trajectoryof each object separately over the experiments andcompare the GT tracks with the SUT tracks basedon best correspondence. Based on these correspon-dences, various error rates and performance metricsare computed.
Since the GT track(s) could correspond to morethan one SUT track, a correspondence first has to be
J Intell Robot Syst
established. The method used for determining corre-spondences between humans detected in the SUT dataand the GT data significantly affects the values ofthe performance measures. Our matching method usescentroids of regions labeled as people and is basedon measuring the Euclidean distance between the per-son’s centroid as reported by the SUT and the GT dataat each frame in the system under test data, with athreshold for a successful match. Normalization basedon the size of the bounding box is also used (Bodt,Hong [39]).
Two measures are used to express the performanceof the tracker. The first is the tracking precision, whichexpresses how well the tracker estimates the positionsof objects or people. The second is the tracking accu-racy, which measures how well the system keeps trackof people or objects and how many mistakes are madein terms of misses, false positives, mismatches, fail-ures to recover tracks, etc. The human tracking metricsare:
1) Human Tracking Precision (HTP): is the preci-sion of the tracker in determining the position ofa tracked person or object. HTP is calculated as:
HT P =∑
t,i dit
ct
where dit is the Euclidian distance error between
the matched GT location and the matched SUT
location and ct is the total number of matchesmade. The HTP is a Euclidian distance errorfor matched GT-SUT pairs over all frames, aver-aged over the total number of matches made. Itshows how well positions of persons or objectsare estimated. HTP is reported in units of length(e.g., m).
2) Human Tracking Accuracy (HTA): is the accu-racy of the tracker in keeping correct corre-spondences over time, estimating the number ofhumans, recovering tracks, etc.
HT A = 1 −∑
t (FNt + FPt )∑
t GTt
where FNt and FPt are the number of false neg-atives and false positives in the SUT for time t.HTA is the sum of all errors made by the trackerover all frames, averaged over the total numberof humans detected by the GT sensor. HTA isunitless.
6 Performance Analysis
For reasons of space, we present a performance anal-ysis only for the new metrics introduced in this paper.The results for the conventional measures can befound in Shneier et al. [4].
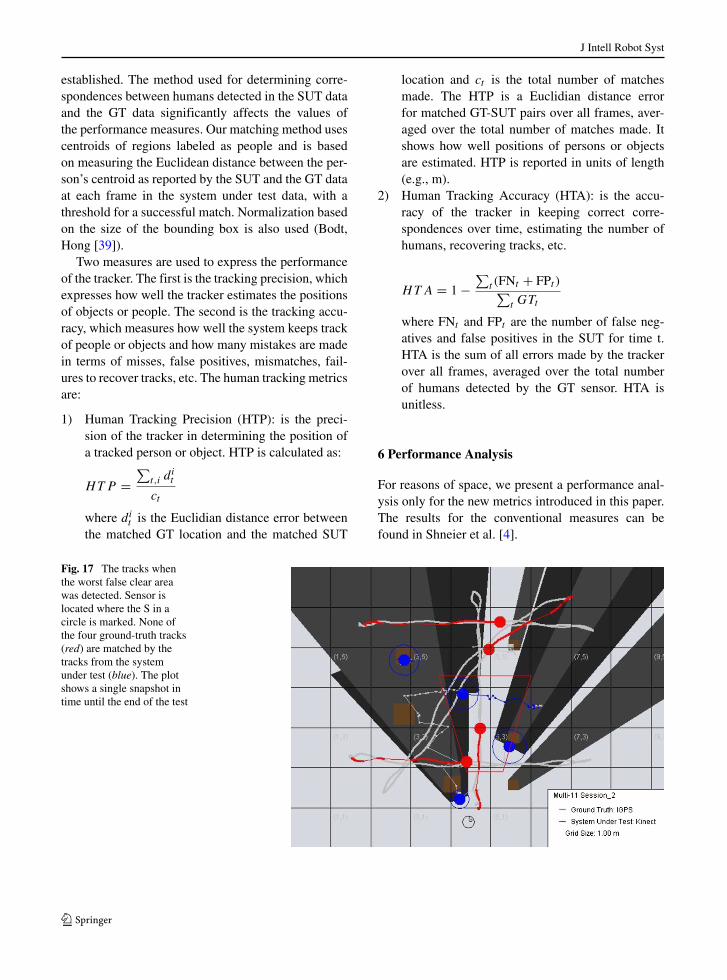
Fig. 17 The tracks whenthe worst false clear areawas detected. Sensor islocated where the S in acircle is marked. None ofthe four ground-truth tracks(red) are matched by thetracks from the systemunder test (blue). The plotshows a single snapshot intime until the end of the test

J Intell Robot Syst
Table 2 Performancestatistics of detection inuncluttered environmentsusing using RGB-D sensor
Run type Speed Tests with Maximum Average False
False Clear Area > 0 Occupied Area /
/Total Tests in category Safety Coverage Area
Stationary humans stationary 0/30a 0.2184750
Single human walk 1/12 0.0655121
Single human jog 1/8 0.0876930
Multiple humans walk 11/15 0.1641399
Multiple humans jog 12/15 0.1975134
Sled & humans walk 2/6 0.1904649
Sled & humans jog 2/4 0.2127153
aMany static tests passed for thetrivial reason that there werenever any people in the safetycoverage area
The systems tested did not achieve the minimumsafety requirement of producing no false clear areas.Even with the ground-truth radius set to 0.1 m, whichis probably too small to provide a reasonable safetyoffset, a 0.5 s startup time to eliminate startup prob-lems, and an assumed 0 s reaction time, and a verysmall coverage area to consider only detections in thecenter of its range limits and field of view, the systemunder test had false clear areas for 97 out of 169 tests(or 57 % of tests). One diagnostic method is to plotthe false clear area versus time and examine traces atthe point in time corresponding to the beginning of thelargest peak. Figure 17 shows an example.
We provide more detailed data below as an exampleof what one might obtain, keeping two questions inmind:
1) Would it be safe to deploy a robotic system thatrelied on this human detection system?
2) If it would be safe to deploy such a system,what insights are available about how the humandetection system would impact productivity?
If the answer for the first question for this SUT is no,there is no reason to even ask the second question.However when a system passes the first hurdle, thesecond question becomes relevant.
Tables 2 and 3 report the data in cluttered anduncluttered environments. If the system can be usedsafely, then the column labeled “Tests with MaximumFalse Clear Area > 0 / Total Tests in category” willhave 0 in the numerator of every cell. This column isdesigned to help answer the first question. The column
Table 3 Performancestatistics of detection incluttered environmentsusing RGB-D sensor
Run type Speed Tests with Maximum Average False
False Clear Area > 0 Occupied Area /
/Total Tests in category Safety Coverage Area
Stationary humans stationary 0/20a 0.1225847
Single human walk 6/11 0.3059522
Single human jog 6/8 0.3686000
Multiple humans walk 17/19 0.2178781
Multiple humans jog 4/10 0.2240100
Sled & humans walk 5/7 0.1848025
Sled & humans jog 4/4 0.2420052

J Intell Robot Syst
Fig. 18 The tracks whenthe worst false clear areawas detected without staticobstacles. The sensor islocated where the S in acircle is marked. None ofthe four ground-truth tracks(red) are matched by thetracks from the systemunder test (blue)
labeled “Average False Occupied Area / Safety Cov-erage Area” then gives a measure of the area a robotwould have to avoid unnecessarily whichis related toloss of productivity. This column is designed to helpanswer the second question and is the column whereone would look to compare two systems that wereboth safe to use and choose the one likely to providethe best productivity. A system with the smallest falseoccupied area would give the highest productivity(Fig. 18).
7 Discussion and Conclusions
The use of performance measures to evaluate humandetection systems has previously been applied mainlyto situations in which occasional false positive or falsenegative results, while undesirable, have not been crit-ically important. In the domain of workplace safety,however, missing a detection is entirely unacceptable,while incorrectly reporting a false detection is highlyundesirable because of the resulting loss of produc-tivity. Thus, traditional performance metrics, whileuseful for comparing different systems, are not bythemselves sufficient to guarantee safety. The addi-tional considerations discussed in this paper must alsobe addressed.
The scenarios used in the performance evaluationwere selected to be representative of real-world situa-tions in which one or more people can be expected tobe present in the environment, there may be a lot ofocclusion, other objects in the environment may haveappearances that are difficult to distinguish from thepeople, and the lighting and people’s clothing are notcontrolled. The ground truth system used in this workis much less susceptible to occlusions than the sys-tem under test. This allows the system to evaluate theeffect of varying amounts of occlusion, which wouldnot be possible with some of the more commonly usedground-truth methods, especially those that rely onmanually annotating the imagery.
The gaits and speeds of the people were also notspecified, except that jogging was expected to befaster than walking. The experiments also included amoving object that moved at a speed similar to a walk-ing person and had the height and aspect ratio of aperson. The scenarios were thus expected to challengeeven the best current human detection and trackingsystems that are not designed for safety or for the envi-ronments used in the experiments. The goal was notto show how well a particular system worked. Rather,it was to develop and test the performance metrics forthis demanding type of application.
Using both traditional performance measures and
J Intell Robot Syst
measures designed specifically for safety may helpto determine what modifications are needed to a sys-tem that performs well according to the traditionalmeasures. This may make it easier to transfer the ben-efits of those high-performing systems to the safetydomain. It must be emphasized, however, that theperformance measures in this report operate in thethree-dimensional world rather than the image domainbecause it is important to know where the people arein relation to objects that may pose hazards. Thus, sys-tems developed for and evaluated only on detectionand tracking in images may not be suitable for safetyapplications.
In many applications, it would be very useful toknow not just where the people are and how they aremoving, but also what their intentions are and, if theyare working collaboratively with a robot, what theirperceptions are about the joint task and the currentgoal. This would both improve task performance andlet the robot make decisions about whether or not aperson is planning to move into a dangerous region.Recognizing individual people would also be usefulbecause the robot could knowwhat role a person has inthe task and how much freedom of motion they shouldbe allowed. This is beyond the scope of the currentwork but will be the subject of future research.
More robots are being installed in factories as co-workers with people and the need for robust humandetection and tracking will grow substantially toensure the safety of the people in these environments.Performance measures such as those in this paper,aimed specifically at this domain, will let develop-ers provide specifications for their products that aremeaningful to buyers and will allow human detec-tion systems to be incorporated into the overall safetysystem with a reasonable guarantee as to how wellthey will work. Because the problem of human detec-tion is extremely complex when the environment isunconstrained, it is expected that detection and track-ing systems will still need to be tested extensively inthe target application domain before being accepted assafe for daily use.
Acknowledgments We are grateful to Afzal Godil for helpwith designing the experiments and participating in the IRB pro-cess. We also appreciate the assistance of Southwest ResearchInstitute, and especially Dr. Chris Lewis, in developing thehuman detection and tracking algorithm.
References
1. ISO TC 184: ISO 10218-2:2011 Robots and robotic devices– Safety requirements for industrial robots – Part 2: Robotsystems and integration. In. (2011)
2. ISO TC 184: ISO 10218-1:2011 Robots and robotic devices– Safety requirements for industrial robots – Part 1: Robots.In. (2011)
3. American National Standards Institute, Robotics IndustriesAssociation: ANSI/RIA R15.06-2012, Industrial Robotsand Robot Systems - Safety Requirements. In. (2012)
4. Shneier, M., Hong, T., Cheok, G., Saidi, K., Shackleford,W.: Performance evaluation methods for human detectionand tracking systems for robotic applications. In., vol. NIS-TIR 8045. National Institute of Standards and Technology,Gaithersburg (2015)
5. Ogale, N.A.: A survey of techniques for human detectionfrom video. University of Maryland (2006)
6. Ferryman, J., Crowley, J.L.: IEEE International Workshopon Performance Evaluation of Tracking and Surveillance.In: Ferryman, J., Crowley, J.L. (eds.) (2013)
7. Nascimento, J.C., Marques, J.S.: Performance evalua-tion of object detection algorithms for video surveil-lance. IEEE Trans. Multimedia 8(4), 761–774 (2006).doi:10.1109/TMM.2006.876287
8. Stiefelhagen, R., Garofolo, J.: Multimodal Technologies forPerception of Humans, First International EvaluationWork-shop on Classification of Events, Activities and Relation-ships, CLEAR 2006, Lecture Notes in Computer Science,vol. 4122. Springer, Southampton (2007)
9. Nghiem, A.T., Bremond, F., Thonnat, M., Valentin, V.:ETISEO, performance evaluation for video surveillancesystems. In: IEEE Conference on Advanced Video and Sig-nal Based Surveillance, 2007. AVSS 2007, pp. 476–481(2007)
10. Home Office Centre for Applied Science and Technol-ogy: Imagery Library for Intelligent Detection Systems(i-LIDS): The i-LIDS User Guide. In. (2011)
11. British Home Office: Imagery Library for Intel-ligent Detection Systems. https://www.gov.uk/imagery-library-for-intelligent-detection-systems (2013).Accessed 30 May 2014
12. Brown, L.M., Senior, A.W., Tian, Y., Connell, J., Ham-papur, A., Shu, C., Merkl, H., Lu, M.: Performance eval-uation of surveillance systems under varying conditions.Paper presented at the IEEE international workshop on per-formance evaluation of tracking and surveillance, Colorado
13. Yin, F., Makris, D., Velastin, S.: Performance evaluationof object tracking algorithms. Paper presented at the 10thIEEE international workshop on performance evaluation oftracking and surveillance (PETS 2007), Rio de Janeiro
14. Lazarevic-McManus, N., Renno, J.R., Makris, D.,Jones, G.A.: An object-based comparative method-ology for motion detection based on the F-Measure.Comput. Vis. Image Underst. 111(1), 74–85 (2008).doi:10.1016/j.cviu.2007.07.007
15. Bashir, F., Porikli, F.: Performance evaluation of objectdetection and tracking systems. Paper presented at the 9th

J Intell Robot Syst
IEEE international workshop on performance evaluation oftracking and surveillance (PETS 2006), New York
16. Black, J., Ellis, T., Rosin, P.: A novel method for videotracking performance evaluation. Paper presented at thejoint IEEE international workshop on visual surveillanceand performance evaluation of tracking and surveillance,Nice, 2003
17. Davis, J., Goadrich, M.: The relationship betweenPrecision-Recall and ROC curves. Paper presented atthe Proceedings of the 23rd international conference onmachine learning, Pittsburgh, 2006
18. Kalal, Z., Matas, J., Mikolajczyk, K.: Online learning ofrobust object detectors during unstable tracking. In: 2009IEEE 12th International Conference on Computer VisionWorkshops (ICCV Workshops), pp. 1417–1424 (2009)
19. Popoola, J., Amer, A.: Performance evaluation for trackingalgorithms using object labels. In: IEEE International Con-ference on Acoustics, Speech and Signal Processing, 2008.ICASSP 2008, pp. 733–736 (2008)
20. Bernardin, K., Elbs, A., Stiefelhagen, R.: Multiple objecttracking performance metrics and evaluation in a smartroom environment. Paper presented at the The 6th IEEEinternational workshop on visual surveillance, VS 2006,Graz
21. Moeslund, T.B., Hilton, A., Kruger, V.: A survey ofadvances in vision-based human motion capture and anal-ysis. Comput. Vis. Image Underst. 104(2), 90–126 (2006).doi:10.1016/j.cviu.2006.08.002
22. Baumann, A., Bolz, M., Ebling, J., Koenig, M., Loos, H.S.,Merkel, M., Niem, W., KarlWarzelhan, J., Yu, J.: A reviewand comparison of measures for automatic video surveil-lance systems. EURASIP Journal on Image and VideoProcessing 2008 (2008). doi:10.1155/2008/824726
23. Stiefelhagen, R., Bowers, R., Fiscus, J.G.: MultimodalTechnologies for Perception of Humans, International Eval-uation Workshops CLEAR 2007 and RT 2007, Baltimore,MD, USA, May 8–11, 2007, Revised Selected Papers.Lecture Notes in Computer Science. Springer, Berlin Hei-delberg (2008)
24. Bodt, B., Camden, R., Scott, H., Jacoff, A., Hong, T.,Chang, T., Norcross, R., Downs, T., Virts, A.: Performancemeasurements for evaluating static and dynamic multiplehuman detection and tracking systems in unstructured envi-ronments. Paper presented at the Proceedings of the 9thworkshop on performance metrics for intelligent systems,Gaithersburg, Maryland, 2009
25. Godil, A., Bostelman, R., Saidi, K., Shackleford, W.,Cheok, G., Shneier, M., Hong, T.: 3D ground-truth sys-tems for object/human recognition and tracking. In: 2013IEEE Conference on 2013 Computer Vision and PatternRecognition Workshops (CVPRW), pp. 719–726. IEEE
26. Nikon Corporation: iGPS/iSpace. http://www.nikon.com/products/instruments/lineup/industrial/metrology assistedproduction/large volume/igps/index.htm. Accessed 2 June2014
27. Schmitt, R., Nisch, S., Schonberg, A., Demeester, F.,Renders, S.: Performance evaluation of iGPS for industrialapplications. In: 2010 International Conference on IndoorPositioning and Indoor Navigation (IPIN), pp. 1–8 (2010)
28. Mosqueira, G., Apetz, J., Santos, K.M., Villani, E., Sute-rio, R., Trabasso, L.G.: Analysis of the indoor GPS
system as feedback for the robotic alignment of fuse-lages using laser radar measurements as comparison.Robot. Comput.-Integr. Manuf. 28(6), 700–709 (2012).doi:10.1016/j.rcim.2012.03.004
29. Wang, Z., Mastrogiacomo, L., Franceschini, F.,Maropoulos, P.G.: Experimental comparison of dynamictracking performance of iGPS and laser tracker. Int.J. Adv. Manuf. Technol. 56(1–4), 205–213 (2011).doi:10.1007/s00170-011-3166-0
30. Depenthal, C.: Path tracking with IGPS. In: InternationalConference on Indoor Positioning and Indoor Navigation(IPIN), pp. 1–6 (2010)
31. Chambers, D.R., Flannigan, C., Wheeler, B.: High-accuracy real-time pedestrian detection system using 2Dand 3D features. SPIE Proceedings Three-DimensionalImaging, Visualization, and Display, vol. 83840G, pp.83840G-83841–83840G-83811 (2012)
32. Dalal, N.: The INRIA Person Dataset. http://pascal.inrialpes.fr/data/human/ (2005)
33. Papageorgiou, C.P., Oren, M., Poggio, T.: A general frame-work for object detection. In: 6th International Conferenceon Computer Vision, pp. 555–562 (1998)
34. Freund, Y., Schapire, R.E.: A short introduction to boost-ing. Journal of Japanese Society for Artificial Intelligence14(5), 771–780 (1999)
35. Cortes, C., Vapnik, V.: Support-vector networks. Mach.Learn. 20(3), 273–297 (1995). doi:10.1007/BF00994018
36. Dalal, N., Triggs, B.: Histograms of oriented gradientsfor human detection. In: IEEE Computer Society Confer-ence on Computer Vision and Pattern Recognition, CVPR,pp. 886–893 (2005)
37. Shackleford, W.: Position tracking performance metrics.https://github.com/usnistgov/PTPM (2014)
38. ISO TC 199: ISO 13855:2010 Safety of machinery – Posi-tioning of safeguards with respect to the approach speeds ofparts of the human body. In: International Organization forStandardization (ed.) (2010)
39. Bodt, B., Hong, T.: UGV safe operations capstone exper-iment. Paper presented at the Army science conference,Orlando, 2010
William Shackleford is an electronics engineer in the Sens-ing and Perception Systems group at the U.S. National Instituteof Standards and Technology in Gaithersburg, Maryland. Hereceived a B.S. in electrical engineering from the Univer-sity of Maryland in 1993, and an M.S. in computer sciencefrom the Johns Hopkins University in 2013. His researchinterests include mobile robotics, autonomous guided vehicles,communications software and sensing. Past projects includethe Enhanced Machine Controller (EMC), and open sourcemachine-tool controller, an entry in the DARPA LearningApplied to Ground Robots (LAGR) challenge, and the AerialMulti-axis Platform (AMP) a cable-driven system used for air-plane de-painting. He is the developer of the Neutral MessageLanguage (NML) and Real-Time Control System (RCS) library.He was a co-author of the book “The RCS Handbook: Tools forReal Time Control Systems Software Development” publishedin 2001 by John Wiley and Sons, Inc.

J Intell Robot Syst
Geraldine Cheok is a research structural engineer in the Sens-ing & Perception Systems Group of the Intelligent SystemsDivision (ISD) of the Engineering Laboratory (EL) at theNational Institute of Standards and Technology (NIST). Ms.Cheok graduated cum laude from the University of Marylandwith a Bachelor of Science in Civil Engineering in 1983. Shereceived her Master in Science in Civil Engineering from theUniversity of Maryland in 1986. While working on her gradu-ate degree, Ms. Cheok joined the National Institute of Standardsand Technology (NIST) Structures Division in 1984, and hasbeen with NIST since. Upon joining NIST, she worked for14 years in the earthquake engineering area, and was mainlyinvolved in the experimental testing and data analysis of modeland prototype bridge columns, steel braced frame connections,and moment resisting precast beam-column connections forseismic regions. She also worked on projects involving the seis-mic response of lightly-reinforced masonry walls and strength-ening of lightly reinforced concrete building frames. Between1998 and present, her work involved the use of 3D imaging sys-tems (e.g., laser scanners, LADAR, laser radars, range cameras)for construction applications. Her efforts involved research thatwill be used to support the development of standard test meth-ods for 3D imaging systems. She has also been involved inthe performance evaluation of perception systems for manufac-turing applications. Ms. Cheok was awarded the Building andFire Research Laboratory’s Communicator Award in 1988 and1997. In 1996, she was named Marylands Outstanding YoungEngineer. In 1997, she received the American Concrete Insti-tute Structural Research Award. That same year, Ms. Cheokaccepted the Department of Commerce Bronze Medal. In 2001,she earned the Department of Commerce Silver Medal. Sheagain received the Bronze Medal in 2004.
Tsai Hong received her PhD in Computer Science from theUniversity of Maryland at College Park in 1982. Dr. Hong playsa major leadership role in research activities of perception sys-tems and perception performance evaluation for manufacturingand human robot interaction perception applications. She wasresponsible for algorithm design and software development ofseveral major modules for areas of perception. Dr. Hong is thechair for the ASTM perception standard group and is respon-sible for development and technical supervision of researchprojects in developing advanced measurements for perceptionmanufacturing applications. Her research activities include real-time vision, world modeling, sensor fusion and calibration. Shehas published over 100 articles on the above research areas.
Kamel Saidi is a Mechanical Engineer in the Manipulation& Mobility Systems Group of the Intelligent Systems Divi-sion (ISD) of the Engineering Laboratory (EL) at the NationalInstitute of Standards and Technology (NIST). His currentresearch includes the development of metrics, test methods andground-truth systems for evaluating the performance of robotperception, safety, dexterity, mapping and autonomy for man-ufacturing as well as emergency response robots. He is alsoinvolved in research aimed at developing performance evalua-tion methods, metrics, and facilities for 3D Imaging Systems(through ASTM E57). Dr. Saidi conducted research in con-struction automation for 10 years prior to shifting his focusto manufacturing and emergency response robotics. Dr. Saidiholds a Ph.D. in Civil Engineering from The University ofTexas at Austin (UT), where he focused his research on infor-mation technology at the construction site and constructionautomation systems. His graduate research included the designand implementation of a tele-operated, hydraulic robot for themaintenance of electric power plant boilers (for which he is aco-inventor on a US patent). Dr. Saidi’s graduate research alsoinvolved the design and implementation of a road crack-sealingrobot and a largescale manipulator (robot arm) for constructionoperations. Dr. Saidi also holds a Master of Science and a Bach-elor of Science in Mechanical Engineering with an emphasison Mechanical Systems and Design (and a minor emphasis onBiomedical Engineering) from UT.
Michael Shneier is Group Leader of the Sensing and Percep-tion Systems Group in the Intelligent Systems Division of theNational Institute for Standards and Technology (NIST). Hereceived his PhD in Artificial Intelligence from the Universityof Edinburgh, Scotland. After a postdoctoral appointment atthe Computer Vision Laboratory at the University of Maryland,College Park, he moved to NIST (then the National Bureau ofStandards), where he worked in the Automated ManufacturingResearch Facility. He then worked at Philips Laboratories inBriarcliff Manor, NY, where he initiated the medical imagingprogram and managed the Intelligent Systems department. Hespent five years managing the Artificial Intelligence researchprogram at the Office of Naval Research before returningto NIST. Dr Shneier has conducted research in the areas ofrobotics, autonomous navigation, object recognition, diagnos-tic imaging, and manufacturing. He participates in standardsactivities related to manufacturing robot safety.