Embed Size (px)
Citation preview

UNLV Theses, Dissertations, Professional Papers, and Capstones
2009
Performance evaluation of network-on-chip interconnect Performance evaluation of network-on-chip interconnect
architectures architectures
Xinan Zhou University of Nevada Las Vegas
Follow this and additional works at: https://digitalscholarship.unlv.edu/thesesdissertations
Part of the Electrical and Computer Engineering Commons, and the Hardware Systems Commons
Repository Citation Repository Citation Zhou, Xinan, "Performance evaluation of network-on-chip interconnect architectures" (2009). UNLV Theses, Dissertations, Professional Papers, and Capstones. 63. http://dx.doi.org/10.34870/1375850
This Thesis is protected by copyright and/or related rights. It has been brought to you by Digital Scholarship@UNLV with permission from the rights-holder(s). You are free to use this Thesis in any way that is permitted by the copyright and related rights legislation that applies to your use. For other uses you need to obtain permission from the rights-holder(s) directly, unless additional rights are indicated by a Creative Commons license in the record and/or on the work itself. This Thesis has been accepted for inclusion in UNLV Theses, Dissertations, Professional Papers, and Capstones by an authorized administrator of Digital Scholarship@UNLV. For more information, please contact [email protected].

PERFORMANCE EVALUATION OF NETWORK-ON-CHIP INTERCONNECT
ARCHITECTURES
by
Xinan Zhou
Bachelor of Science in Engineering East China University of Science and Technology
2007
A thesis submitted in partial fulfillment of the requirements for the
Master of Science Degree in Electrical Engineering Department of Electrical and Computer Engineering
Howard R. Hughes College of Engineering
Graduate College University of Nevada, Las Vegas
August 2009
iii
ABSTRACT
Performance Evaluation of Network-on-Chip Interconnect Architectures
by
Xinan Zhou
Dr. Mei Yang, Examination Committee Chair Assistant Professor of Electrical and Computer Engineering
University of Nevada, Las Vegas
With a communication design style, Network-on-Chips (NoCs) have been
proposed as a new Multi-Processor System-on-Chip paradigm. Simulation and
functional validation are essential to assess the correctness and performance of
the NoC design. In this thesis, a cycle-accurate NoC simulation system in Verilog
HDL is developed to evaluate the performance of various NoC architectures.
First, a library of NoC components is developed based on an existing design.
Each NoC architecture to be evaluated is constructed from the library according
to the topology description which specifies the network topology, network size,
and routing algorithm. The network performance of four NoC architectures under
uniform and three non-uniform traffic patterns is tested on ModelSim 6.4. The
developed NoC simulation system provides useful resources for the future
development of the FPGA-based NoC emulation system.

iv
ACKNOWLEDGEMENTS
This work was funded in part by NSF under grant no. ECCS-0702168.
I am heartily thankful to my mentor, Dr. Mei Yang, whose encouragement,
patience, guidance and support from the initial to the finial level enabled me to
finish this thesis.
I would like to show my gratitude to Dr. Yingtao Jiang for his valuable
comments and suggestions on my thesis work, and Dr. Biswajit Das and Dr.
Yoohwan Kim for serving on my thesis committee. Also I would like to thank Prof.
Peng Liu from Zhejiang University for his guidance to me when I worked in his
group in summer 2008. I would also like to thank Xiaohang Wang, Chunchang
Xiang and Guofan Jiang for their help in understanding the existing design and
using the simulation tools. Lastly, I offer my regards and blessing to my family
and all of those who supported me in any respect during my master study.

v
TABLE OF CONTENTS
ABSTRACT .......................................................................................................... iii ACKNOWLEDGEMENTS .....................................................................................iv LIST OF FIGURES ...............................................................................................vi CHAPTER 1 INTRODUCTION ............................................................................. 1
1.1 Overview of Network-on-Chips (NoCs) ....................................................... 1 1.2 Contribution and Overview of the Thesis .................................................... 5
CHAPTER 2 ON-CHIP INTERCONNECTION NETWORK .................................. 7
2.1 Mesh Topology ........................................................................................... 8 2.2 Torus Topology ......................................................................................... 11 2.3 Folded-Torus Topology ............................................................................. 12 2.4 Perfet Recursive Diagonal Torus (PRDT) Topology ................................. 13 2.5 Butterfly Fat-Tree (BFT) Topology ............................................................ 14
CHAPTER 3 DESIGN METHODOLOGY ........................................................... 16
3.1 Simulation System .................................................................................... 16 3.2 NoC Components ..................................................................................... 17 3.3 Construction of NoC Architecture .............................................................. 24
CHAPTER 4 EXPERIMENTAL RESULTS ......................................................... 26
4.1 Performance Metrics ................................................................................. 26 4.2 Workload Models ...................................................................................... 27 4.3 Simulation Results .................................................................................... 29
CHAPTER 5 CONCLUSION AND FUTURE WORK .......................................... 40
5.1 Conclusion ................................................................................................ 40 5.2 Future Work .............................................................................................. 41
REFERENCES ................................................................................................... 43 VITA ................................................................................................................... 46

vi
LIST OF FIGURES
Figure 1.1 SoC-based consumer portable design complexity trends. ............... 2 Figure 1.2 A mesh based NoCs architecture. ................................................... 4 Figure 2.1 4×4 mesh. ........................................................................................ 9 Figure 2.2 CLICHÉ interconnect architecture. ................................................ 10 Figure 2.3 4×4 torus. ...................................................................................... 11 Figure 2.4 Torus NoC architecture. ................................................................ 12 Figure 2.5 4×4 folded-torus. ........................................................................... 13 Figure 2.6 4×4 PRDT(2, 1). ............................................................................ 14 Figure 2.7 Butterfly fat-tree with 64 PCs. ........................................................ 15 Figure 3.1 NoC simulation system. ................................................................. 16 Figure 3.2 2×2 mesh NoC architecture. .......................................................... 17 Figure 3.3 Packet generator. .......................................................................... 18 Figure 3.4 Finite state machine in packet control module. .............................. 20 Figure 3.5 Flit format. ..................................................................................... 21 Figure 3.6 Overall router structure. ................................................................. 22 Figure 3.7 Input channel. ................................................................................ 23 Figure 3.8 Output channel. ............................................................................. 23 Figure 3.9 Construction of NoC architecture................................................... 25 Figure 4.1 Throughput with different routing algorithms under uniform traffic . 30 Figure 4.2 Average packet latency with different routing algorithms under uniform traffic. ..................................................................... 31 Figure 4.3 Throughput with different routing algorithms under bit reversal traffic. ........................................................................................... 32 Figure 4.4 Average packet latency with different routing algorithms under bit reversal traffic. .............................................................................. 32 Figure 4.5 Throughput with different packet length. ........................................ 33 Figure 4.6 Average packet latency with different packet length. ..................... 33 Figure 4.7 Throughput with different network size. ......................................... 34 Figure 4.8 Average packet latency with different network size. ...................... 34 Figure 4.9 Variation of throughput with different topology. ............................. 36 Figure 4.10 Variation of latency with different topology. ................................... 38

1
CHAPTER 1
INTRODUCTION
1.1 Overview of Network-on-Chips (NoCs)
With the advance of the semiconductor technology, the huge number of
transistors available on a chip allows designers to integrate numerous intellectual
property (IP) blocks in the forms of processors, embedded memories, and smart
interconnect on System-on-Chip (SoC) architectures. According to the 2007
edition of International Technology Roadmap for Semiconductors (ITRS), the
number of available transistors doubles every technology cycle [19]. Table 1.1
[18] shows the trends of functions per chip at introduction in terms of million
transistors for each generation.
Table 1.1 Trends of transistors for product generations.
Year of Production 2008 2009 2012 2015 2018 2021 Functions per chip at introduction (million transistors)
2212 4424 8848 17696 35391 70782
The increasing number of transistors drives the increase of the number of
processing cores (PCs) that can be integrated onto one chip. Fig. 1.1 [18] shows
the quantified design complexity trends for the SoC-based consumer portable
driver.

2
Number of Processing Cores
32 44 58 79 101 126 161 212 268348
424526
669
878
1023
1435
0
200
400
600
800
1,000
1,200
1,400
1,600
2007 2008 2009 2010 2011 2012 2013 2014 2015 2016 2017 2018 2019 2020 2021 2022
Year
Number of Processing Cores
Fig. 1.1 SoC-based consumer portable design complexity trends [18].
The large number of computational resources available on SoCs places
tremendous demands on the communication resources. In addition, the shrinking
feature size in the deep-sub-micron (DSM) era is continuously pushing
interconnection delay and power consumption as the dominant factors in the
optimization of modern systems [17].
Minor evolutionary advances in on-chip interconnection have been developed
from traditional bus-based architectures, including tiered or multi-layered
techniques [24]. These methods enable minor improvements over earlier
approaches and are suitable for the majority of traditional SoC designs. However,
they are proving to be largely inadequate for today’s leading-edge applications,
and cannot effectively handle the complexity of next generation mainstream
SoCs, which will require from dozens up to hundreds of IP blocks integrated on

3
the same die, with operating frequencies in the Gigahertz range [24]. In such
design context, a single bus – or even multiple synchronous busses – is
impractical due to large wire loads and resistances that introduce slower signal
propagation. Managing the communication between multiple on-chip busses
imposes additional design constraints, and results in reduced performance and
increased silicon area [24].
With a communication design style, Network-on-Chips (NoCs) have been
proposed as a new Multi-Processor SoC (MPSoC) paradigm to overcome the
limitations of bus-based communication infrastructure [1, 8]. The NoCs concepts
include distributing the communication structure and using multiple routes for
data transfer. This allows creating flexible, programmable, and even
reconfigurable networks [20].
In general, a packet-based NoC consists of routers, the network interface
between the routers and the processing unit, and the interconnection network
[10]. A 4X4 mesh-based NoC interconnection network is shown in Fig. 1.2. The
processing core can be a general purpose processor, a DSP, an embedded
memory etc. Each PC is attached to a router which connects it to its neighboring
PCs.

4
Fig. 1.2 A mesh based NoCs architecture.
The NoC-based SoCs impose new and critical design challenges. Firstly,
which topology is suitable for the applications of the target NoCs such that the
performance requirements and design constraints can be satisfied? Secondly,
the design of network interfaces to access the on-chip network and routers to
provide the physical interconnection mechanisms to transport data between
processing cores. Thirdly, the selection of communication protocols (including
routing, switching, buffer management, flow control, etc.), which are suitable for
on-chip interconnection networks. Finally, as technology scales and switching
speed increases, future NoCs will become more sensitive and prone to errors
and faults. Fault tolerance is becoming critical for on-chip communications [28].
Simulation and functional validation are essential to assess the correctness
and performance of the NoC design. In the literatures, a number of VHDL or
SystemC-based cycle-accurate simulation models have been proposed,
including [3, 5, 13, 23, 32]. In [3], Bertozzi et al. illustrated a synthesis flow for
customized NoC architecture. Mesh, torus, hypercube, 3-stage Clos, and

5
butterfly topologies can be mapped in their design flow. Chan et al. [5] described
a NoC generator which is used to create a simulatable and synthesizable NoC
description. Only mesh topology was created to verify the capability of the NoC
generator. Goossens et al. [13] introduced the Aethereal NoC with 6X6 mesh
topology which has guaranteed services. In [23], Madsen et al. presented a NoC
model which, together with a multiprocessor real-time operating system (RTOS)
model which is used to model and analyze the behavior of a complex system that
has a real-time application running on a multiprocessor platform. Mesh and torus
are implemented in their design. Nurmi et al. [32] proposed a simulation
environment by creating a library of pre-designed communication blocks that can
be selected from a component library and configured by automated tools.
From simulation point of view, these simulation tools are flexible to perform
NoC design exploration. However, they are limited in topologies, and perform
metrics.
1.2 Contribution and Overview of the Thesis
In this thesis, we propose to develop a cycle-accurate NoC simulation system
in Verilog HDL to evaluate the performance of various NoC interconnect
architectures. The developed simulation system is capable of evaluating the
network performance of mesh, torus/folded torus, PRDT, and butterfly binary tree
under various traffic patterns.
The simulation system is built based on a library of pre-designed NoC
components. The basic NoC components include packet generator, packet

6
receptor, and various routers designed for different network topologies. The
packet generator generates packets under different injection rate and traffic
pattern. The packet receiver receives the packets and calculates the delay of
each flit in clock cycles. The router implements routing, switching, buffering, and
flow control functions.
The NoC architecture to be evaluated is constructed from the library
according to the topology description which specifies the network topology,
network size, and routing algorithm. Each NoC architecture is simulated under
uniform and three non-uniform traffic patterns using ModelSim 6.4 simulation tool.
The performance of the simulated NoC architecture in terms of throughput and
average packet latency is collected and analyzed.
The rest of the thesis is organized as follows. In Chapter 2, the five on-chip
interconnection network topologies implemented in the simulation system will be
introduced. In Chapter 3, the design methodology will be described. In Chapter 4,
the experimental results will be presented and discussed. Chapter 5 concludes
the thesis and discusses the future work.

7
CHAPTER 2
ON-CHIP INTERCONNECTION NETWORK
The on-chip interconnection network topology defines how the PCs are
interconnected by communication links. There are many factors that affect the
choice of an appropriate on-chip interconnection network. Major factors include
the following [10]:
• Performance requirement. These requirements are generally represented by
packet latency and throughput.
• Scalability. A scalable architecture implies that as more PCs are added, the
I/O bandwidth, and network bandwidth should increase proportionally.
• Simplicity. Simple designs often lead to higher clock frequencies and may
achieve higher performance.
• Distance span. In some interconnection networks, links have very different
lengths and some links may very long, producing problems such as coupling,
electromagnetic noise, and heavy link cables.
• Physical constraints. Packing components in an interconnection network,
such as processors, memories, and/or I/O devices, together usually requires
meeting certain physical constraints, such as operating temperature control,
wiring length limitation, and space limitation.

8
• Reliability and fault tolerance. An interconnection network should be able to
deliver information reliably, and be designed for continuous operation in the
presence of a limited number of faults.
In [26], the authors studied a number of interconnection architectures
including fat-tree [15], mesh [22], torus [8], folded torus [6], octagon [21] and
butterfly fat-tree (BFT) [25]. In our study, we consider the four most commonly
used topologies including, mesh, torus, folded torus, butterfly fat-tree, and PRDT
[20, 21, 26], the topology proposed in our previous work.
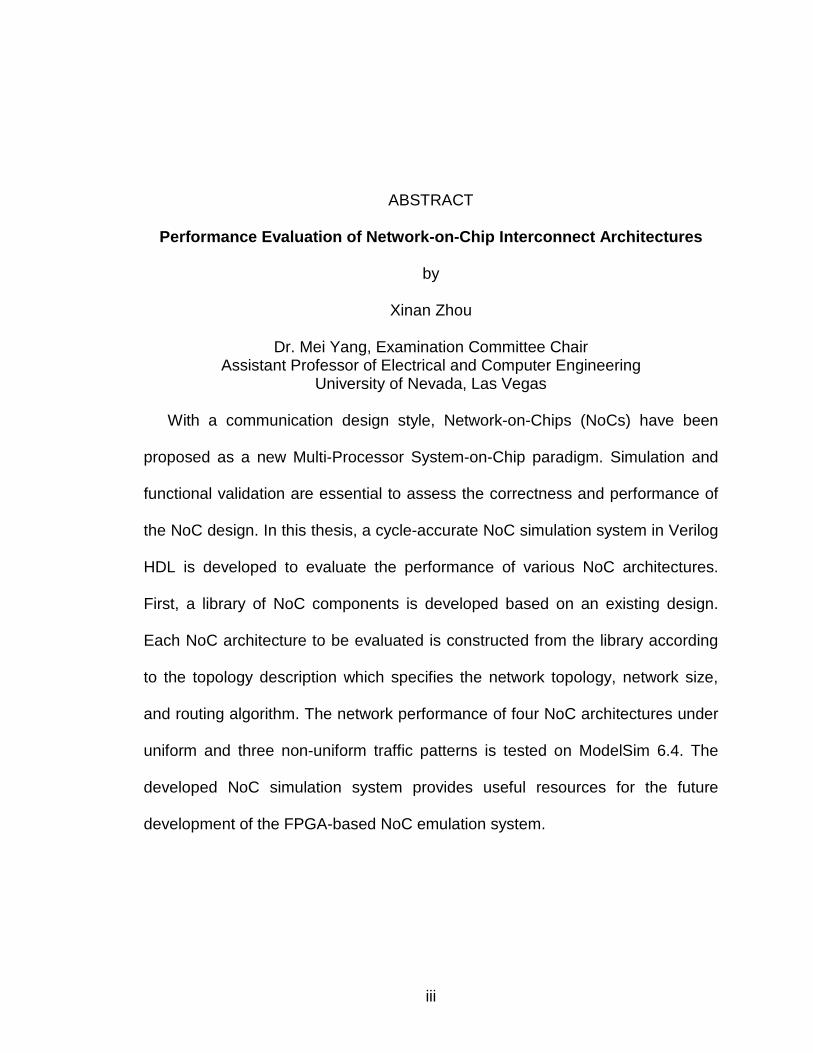
2.1 Mesh Topology
Fig. 2.1 shows a mesh-based NoC architecture, which consists of an m×n
mesh of routers. Each processing core is connected with a router, which is
connected to 2, 3, or 4, neighboring routers. Each router has up to 5 ports, one is
connected with the local PC and others are connected to up to 4 neighboring
routers. The communication channels used to connect two adjacent routers or
one router and one PC consist of two opposite unidirectional links.
9
(0,0) (0,1) (0,2) (0,3)
(1,0) (1,1) (1,2) (1,3)
(2,0) (2,1) (2,2) (2,3)
(3,0) (3,1) (3,2) (3,3)
Fig. 2.1 4×4 mesh.
The routing algorithms used in the mesh-based NoC architecture include XY
routing and two adaptive routing algorithms, west first routing [33] and Duato’s
adaptive routing algorithm [9]. Each input port is configured with 1~4 virtual
channels. The depth of the virtual channel is 2~8 and the width is (32~128) + 11
bits. The 32~128 bits are width of the flit and 11 bits are the width of the head flit
[34].

10
Fig. 2.2 CLICHÉ interconnect architecture.
Kumar et al. [22] have proposed a mesh-based interconnect architecture
called CLICHE (Chip-Level Integration of Communicating Heterogeneous
Elements). This architecture consists of an m n× mesh of switches
interconnecting computational resources (e.g. PCs) placed along with the
switches, as shown in Fig. 2.2 in the particular case of 16 functional PC blocks.
Every switch, except those at the edges, is connected to four neighboring
switches and one PC block. In this case, the number of switches is equal to the
number of PCs. The PCs and the switches are connected through
communication channels. A channel consists of two unidirectional links between
two switches or between a switch and a resource.

11
2.2 Torus Topology
As shown in Fig. 2.3, an m n torus structure is based on an m n mesh
topology by adding a wrap-around channel on each row and each column. The
wrap-around channels help reducing the diameter and average distance of the
network. The diameter and the average distance of 4X4 torus are 4 and 32
15,
respectively. Each router is connected to 4 neighboring routers. As such, each
router has totally five ports.
The routing algorithms used in the torus-based NoC architecture include XY
routing and the *-Channels algorithm [2]. The *-Channels algorithm is fully-
adaptive, minimal, free of deadlock and livelock, and can be implemented using 5
virtual channels per bidirectional physical link in all but one of the dimensions
where only 3 channels suffice.
(0,0) (0,1) (0,2) (0,3)
(1,0) (1,1) (1,2) (1,3)
(2,0) (2,1) (2,2) (2,3)
(3,0) (3,1) (3,2) (3,3)
Fig. 2.3 4 4 torus.

12
Dally and Towles [8] have proposed a 2D torus as an NoC architecture,
shown in Fig. 2.4. Every router has five ports, one connected to the local
resource and the others connected to the closest neighboring routers. Again, the
number of routers is R N= .
Fig. 2.4 Torus NoC architecture.
2.3 Folded-Torus Topology
The folded-torus topology is shown in Fig. 2.5. The connections in folded-
torus are the same as in torus topology network. Hence, the diameter and
average distance are same as those of torus. Compared with torus wherein the
wrap-around channels will introduce extra delay due to the longer wire length, in
folded-torus, each channel is of the same length.
The routing algorithms used in the folded-torus-based NoC are same as
those used in the torus-based NoC.

13
Fig. 2.5 4 4 folded-torus.
2.4 Perfect Recursive Diagonal Torus (PRDT) Topology
The Recursive Diagonal Torus RDT structure is constructed by recursively
overlaying 2-D diagonal meshes (tori) [36]. A perfect RDT (PRDT(n, R)) is a
network in which every node has links to form all possible upper rank tori (i.e.
RDT(n, R, R)). Particularly, we consider PRDT(2, 1), in which each node has a
constant degree of 8 except for PRDT(2, 1) with 4x4 nodes (in this case, the
node degree is 5) [31]. Fig. 2.6 shows the structure of 4 4 PRDT(2, 1), where
each node has 5 channels, one on the rank-1 torus and the other four on the
rank-0 torus [35]. Therefore, each router has 6 ports. Due to its symmetric
structure, smaller diameter and average distance, and embedded mesh/torus
topology, PRDT(2, 1) is shown to be a promising topology for interconnecting
tens to hundreds of nodes in an NoC system [35].

14
The routing algorithms to be implemented on PRDT(2, 1) are the vector
routing algorithm [36] and its adaptive variant. The virtual channel model used in
the *-Channels algorithm can be adopted in the PRDT-based NoC.
Fig. 2.6 4 4 PRDT(2, 1) [35].
2.5 Butterfly Fat-Tree (BFT) Topology
In the Butterfly Fat-Tree (BFT) [25], the PCs are placed at the leaf nodes and
routers are placed at the intermediate and root nodes. Fig. 2.7 shows a BFT with
64 PCs. A pair of coordinates (l, p) is used to label each node, where l denotes a
node’s level and p denotes its position within that level. There are N PCs which
addresses range from 0 to (N - 1). Each intermediate router, labeled as (l, p),
where 1 log4 1l N≤ ≤ − , 0 1 12N
pl
≤ ≤ + −
, has 4 child ports and 2 parent ports.
The routers at the top level (i.e., l = log4N) has 4 child ports only. Each port is
associated with a pair of opposite unidirectional channels.

15
Each router supports three types of connections: forward, backward, and
turnaround. The forward and backward connections support communications
from children nodes to parent nodes and vice versa. The turnaround routing
supports communication between children nodes [25]. The basic routing
algorithm used in BFT-based NoC is routing-table based. Notice that between a
pair of PCs there may exist more than one shortest path which do not share the
same parent node [14]. In this case, a packet from a source PC may follow any
one of the two up links from a router, until arrive at the lowest common ancestor
of the source and destination PCs, and from there, traverse through a unique
path to reach its destination PC.
Fig. 2.7 Butterfly fat-tree with 64 PCs.
In the proposed simulation system, the following topologies are considered:
2X2 mesh, 3X3 mesh, 4X4 mesh, 3X3 torus, 4X4 torus, 4X4 PRDT, and 16
nodes butterfly fat-tree.
16
CHAPTER 3
DESIGN METHODOLOGY
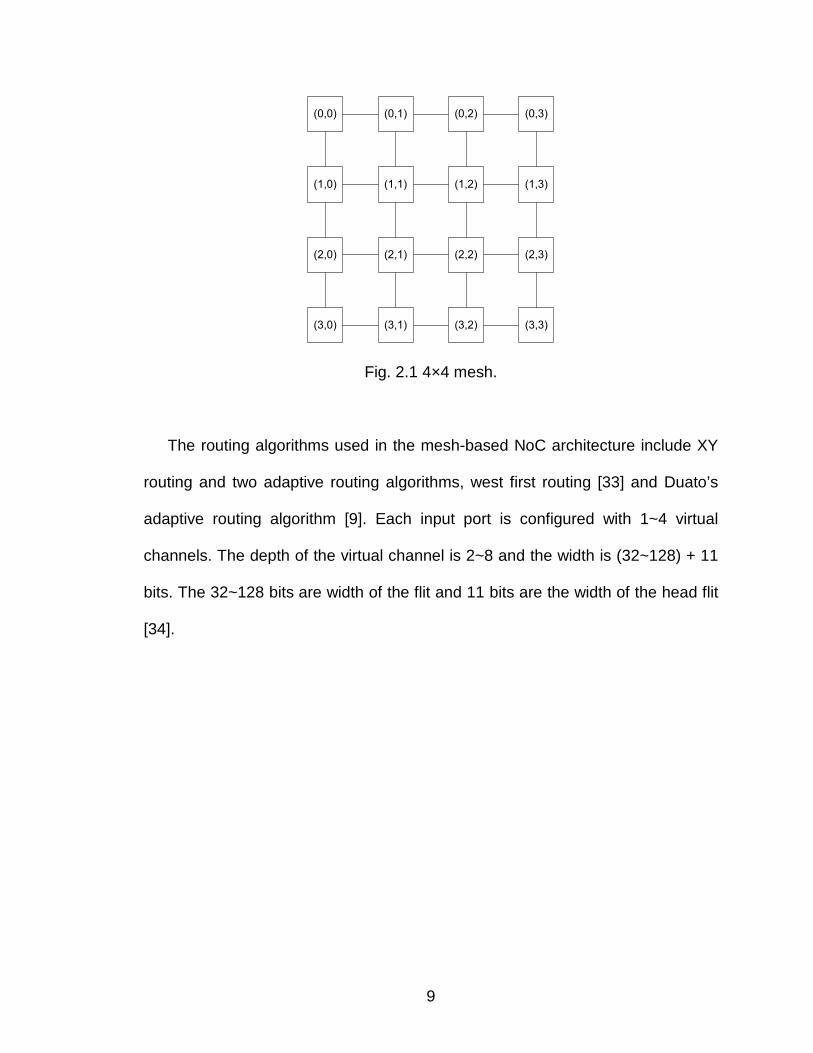
3.1 Simulation System
Fig. 3.1 illustrates the flow of the NoC simulation system. The script file
provides the topology description which specifies the network topology, network
size, and routing algorithm. Given the script file, each NoC architecture to be
evaluated is designed using Verilog HDL in a modular way based on a library of
NoC components.
Fig. 3.1 NoC simulation system.
The constructed NoC systems will then be simulated using testbenches which
specify the simulation parameters, such as traffic pattern, injection rate, packet
length, and number of packets to be generated. The simulation results including

17
the injection time and reception time of each packet will be collected and
displayed. The performance metrics will then be calculated in Excel.
3.2 NoC Components
A library of NoC components is developed based on an existing design [34].
The basic NoC components include packet generator, packet receptor, and
various routers designed for different network topologies. The topology decides
the router size and the routing algorithm. The router used for mesh- and torus-
based NoCs has five ports, one for local communication and others for
interconnecting with other routers. For PRDT- and BFT-based NoCs, each router
has six ports. For mesh, deterministic routing and adaptive routing algorithms are
provided. Deterministic routing algorithm is implemented for other topologies.
Fig. 3.2 2 2 mesh NoC architecture.
Based on the library, the NoC architecture to be evaluated is constructed
according to the script file. Fig. 3.2 shows a 2 2 mesh NoC.

18
3.2.1 Packet generators (PGs)
Packet generator is used to inject packets into the network to be emulated
according to the configure information. The PG generates packets under various
traffic patterns and injunction rate. Each packet consists of fields of packet type,
source address, and destination address. The packet length is parameterized.
Before transmission, each packet is decomposed into multiple flits with fixed size.
Traffic patterns include 1) stochastic traffic in uniform and nonuniform
distributions (bit-reversal and transpose traffic [27], hot spot traffic) in bursty
nature [12] and 2) input traffic traces generated by real-life applications [4]. Each
node has one packet generator including configure module and packet control
module as shown in Fig. 3.3.
Fig. 3.3 Packet generator.
The configure module receive the configure information including start,
destination, packet length, packet number and time between packet
transmissions. The packet is composed of flits. Each packet has one head flit,
one tail flit, and others are data flits.

19
The packet control module injects packets at a certain time. As shown in Fig.
3.4, we use finite state machine (FSM) to achieve the control function. The FSM
has four states: IDLE, PKG_TRANS, WAIT, and STOP. The IDLE is the default
state. When cfg_start signal occurs, the state changes to packet transmission
state (PKG_TRANS). The flit number and packet number which have been
transmitted is counted in FSM. When transmitted flits number reach the
configuration, but the transmitted packets do not reach the configuration, the
state in FSM change to WAIT state. In this state, FSM wait until the next
transmission occurs. When both the flit number and packet number reach the
configuration, the FSM will change to the STOP state. During the transmission,
the FSM control the flit type. The first flit, last flit and other flits are head flit, tail flit
and data flits respectively. When FSM is in the WAIT state, the waiting time is
counted, and when it reaches the configured waiting time, FSM will change to
PKG_TRANS state to transmit the next packet. The packets are injected into the
network via the FSM described above.

20
IDLE
PKG_TRA
NS
WAIT STOP
cfg_start
~(|length_cnt) &
~(|number_cnt)
~(|length_cnt) &
(|number_cnt)
~(|wait_cnt)
~cfg_start
~cfg_start
Fig. 3.4 Finite state machine in packet control module.
3.2.2 Packet receptor (PRs)
The PR performs the following functions. When the flits reach the destination
node, it will be transmitted into the packet receptor module. In order to analyze
the transmission delay, each flit carries a 32 bits time stamp. The packet
generator and receptor modules are synchronized in the simulation system. The
packet receptor takes the time stamp out and calculates the transmission delay
when the flits reach the destination. The packet receptor also calculates the total
flit number and total cycles and sent the packet to the control/analysis module in
Fig. 3.1 for further analysis.
3.2.3 Router
The basic functions of a router include routing, switching, buffering, and flow
control. Two types of routing algorithms are considered: deterministic routing and
adaptive routing. Wormhole switching is used for all topologies in the simulation

21
system. In wormhole switching, a packet is broken up into flits with fixed size,
and pipelined through the network [10]. As shown in Fig. 3.5, a flit consists of
type, source, destination, and data.
Fig. 3.5 Flit format.
Virtual channels are used to improve packet latency and network throughput
[10]. Flits are buffered at the input port of each router using asynchronous buffer
with virtual channels. Flow control is used to synchronize the data transmission
inside a router and between adjacent routers [30].
The number and depth of the virtual channels at each input port can also be
provided as parameters. Considering the tradeoff of performance and
implementation cost, the number of virtual channels is set as two. Following the
study in [10], the depth of virtual channels has minor impact to the network
performance. In the simulation system, the depth of virtual channels is set to 4.
Fig. 3.6 shows an overall structure of a router, which includes a number of
input channels and output channels. For mesh, XY routing, west-first routing, and
Duato routing algorithms are implemented. For other topologies, the deterministic
routing algorithm (XY for torus, vector routing for PRDT, and order-based routing)
is implemented. The switching technique implemented in all routers is wormhole
switching.

22
Fig. 3.6 Overall router structure.
3.2.3.1 Input channel
The input channel module consists of the link control module, virtual channel
buffer, receive broker module, routing algorithm module, and virtual channel
control module, as shown in Fig. 3.7.

23
Fig. 3.7 Input channel.
3.2.3.2 Output channel
The output channel module consists of the modules of arbitration, output
control, and multiplexer. As shown in Fig. 3.8, it is used for arbitration and flow
control cooperating with the link control in the next stage. The arbiter uses Round
Robin Scheduling to guarantee fair arbitration [11].
Fig. 3.8 Output channel.

24
3.3 Construction of NoC Architecture
Fig. 3.9 shows the construction of an NoC architecture from NoC components.
Each NoC system is implemented using Verilog HDL in a modular way. Given
the script file which specifies the topology description, the NoC system is
constructed as follows. The topology determines how the router is constructed
from basic modules. For example, mesh and torus need five-port routers; PRDT
and BFT need six-port routers. Firstly, the bottom modules, such as link control,
rcv broker, FIFO, and xmt broker, are selected to build the frame module.
Secondly, the specific routing algorithm module for the topology and the
arbitration module for the specified port number are selected to build the router
module. Thirdly, the router modules are interconnected to construct a particular
network topology in a top module.

25
Fig. 3.9 Construction of NoC architecture.
26
CHAPTER 4
EXPERIMENTAL RESULTS
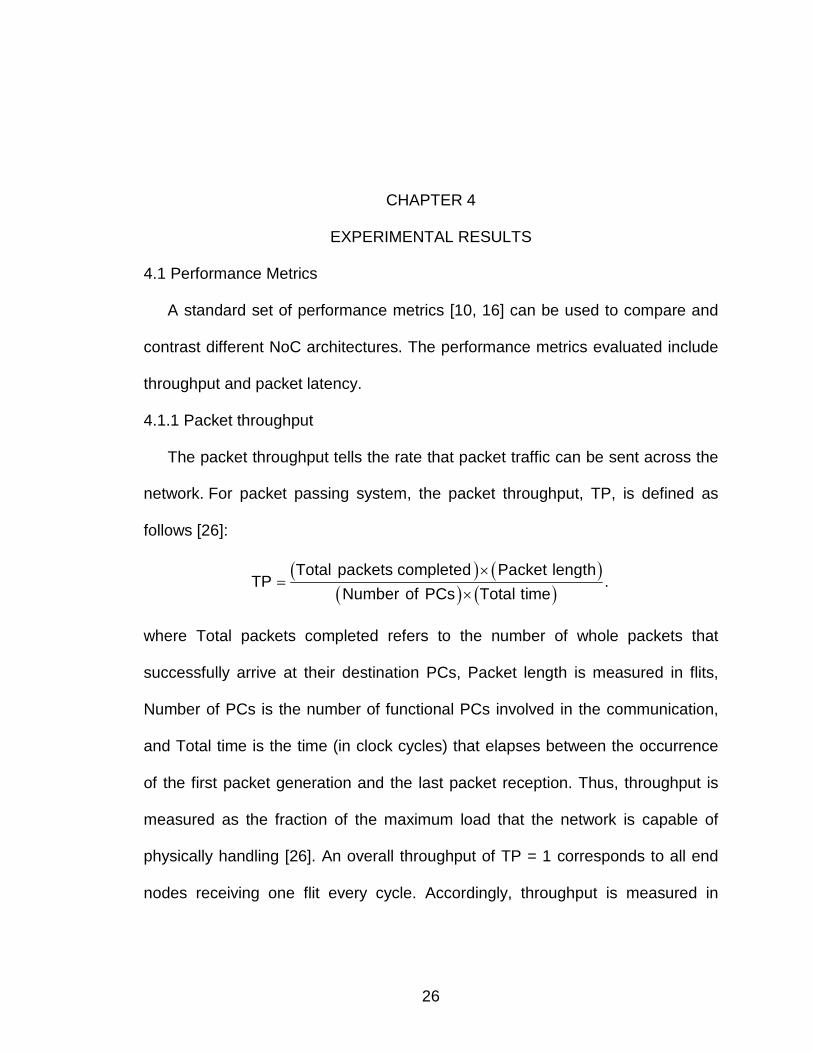
4.1 Performance Metrics
A standard set of performance metrics [10, 16] can be used to compare and
contrast different NoC architectures. The performance metrics evaluated include
throughput and packet latency.
4.1.1 Packet throughput
The packet throughput tells the rate that packet traffic can be sent across the
network. For packet passing system, the packet throughput, TP, is defined as
follows [26]:
( ) ( )( ) ( )
×=
×.
Total packets completed Packet lengthTP
Number of PCs Total time
where Total packets completed refers to the number of whole packets that
successfully arrive at their destination PCs, Packet length is measured in flits,
Number of PCs is the number of functional PCs involved in the communication,
and Total time is the time (in clock cycles) that elapses between the occurrence
of the first packet generation and the last packet reception. Thus, throughput is
measured as the fraction of the maximum load that the network is capable of
physically handling [26]. An overall throughput of TP = 1 corresponds to all end
nodes receiving one flit every cycle. Accordingly, throughput is measured in

27
flits/cycle/PC. Throughput signifies the maximum value of the accepted traffic
and it is related to the peak data rate sustainable by the system [26].
4.1.2 Packet latency
Transport latency is defined as the time (in clock cycles) that elapses from
between the occurrence of head flit injection into the network at the source node
and the occurrence of the tail flit reception at the destination node [25]. In order
to reach the destination node from some starting source node, flits must travel
through a path consisting of a set of routers and interconnects [32]. Depending
on the source/destination pair and the routing algorithm, each packet may have a
different latency [32]. Therefore, for a given packet Pi, the latency Li is defined as:
( ) ( ).i iiL recieving time tail flit of P sending time head flit of P= −
The average packet latency is used as a performance metric in our
evaluation. Let F be the total number of packets reaching their destination PCs
and let Li be the latency of packet Pi, where i ranges from 1 to F. The average
packet latency, Lavg, is then calculated according to the following [32]:
==∑
1 .
F
ii
avg
LL
F
4.2 Workload Models
The evaluation of interconnection networks requires the definition of
representative workload models [10]. The workload model is typically defined by
three parameters: traffic pattern, injection rate, and packet length.

28
4.2.1 Traffic pattern
The traffic pattern indicates the destination for the next message at each
node. The most frequently used traffic pattern is the uniform distribution [10]. In
this distribution, the probability of node i sending a message to node j is the
same for all i and j, i j≠ [29]. The case of nodes sending packets to themselves
is excluded because we are interested in the packet transfers that use the
network [10].
When network traffic is not uniform, several specific traffic patterns have been
used to evaluate the performance of interconnection networks [10]:
• Bit reversal. The node with binary coordinates 1 2 1 0, , , ,n na a a a− − L communicates
with the node 0 1 2 1, , ,n na a a a− −L .
• Matrix transpose. The node with binary coordinates 1 2 1 0, , ,n na a a a− − L
communicates with the node 0 11
2 2
, , , , ,n n na a a a−−
L L .
• Hot point. All the nodes in the network send packets to one single node,
expect itself.
4.2.2 Injection rate and packet length
The injection rate and packet length are simulation parameters. The injection
rate is defined as number of flits injected in each clock cycle. It is converted to
the time interval (in clock cycles) between two adjacent packets in simulations.
The packet length specifies the number of flits in each packet. Packet lengths
may vary depending on the application. The simulation system is capable of
handling variable packet length.

29
4.3 Simulation Results
All NoC architectures are simulated using ModelSim 6.4. The experimental
data is analyzed using Microsoft Excel. We compare the throughput and average
packet latency of various NoC architectures. The simulation parameters are
shown in table 4.1.
Table 4.1 Simulation Parameters
TopologyFIFO Depth
(Flits)Mesh 9 16 64 32 4Torus 4PRDT 4BFT 4 4 6
Network Size
161616
646464
Message Length (Flits)
Router Port Number
556
Each simulation was initially run for a number of cycles to allow the transient
effects to stabilize. The results are collected from the clock cycle when the
network is stabilized to the cycle which is determined by the PC first completing
the packet injection.
In the following, the results of the mesh network with various design and
simulation parameters are presented before the results of other topologies under
different traffic patterns are presented.
4.3.1 Comparison of routing algorithm
Three routing algorithm, XY routing, west first routing and adaptive routing,
are tested under uniform and the bit reversal traffic for 4x4 mesh with packet
length set as 64 flits.

30
As shown in Fig. 4.1, the throughput of the three algorithms increases linearly
with the injection rate up to the throughput saturation point at 0.5 flits per cycle
under uniform traffic. Fig. 4.2 shows that the average packet latency of all three
algorithms increases with the increase of the injection rate generally. The biggest
increase happens between 0.3 flits/cycle and 0.4 flits/cycle. Due to the variance
of the destination sequences generated at different injection rate, the confliction
experienced in the network is different. This results in the fluctuation of the
average packet latency when the injection rate is greater than 0.4 flits/cycle.
Figs. 4.1 and 4.2 also show that under uniform traffic, the west first routing
algorithm improves the throughput (up to 7.3%) and the average packet latency
(up to 4.9%) than the XY routing algorithm. The Duato routing algorithm slightly
improves the average packet latency than the west first routing algorithm.
0
0.1
0.2
0.3
0.4
0.5
0.1 0.2 0.3 0.4 0.5 0.6 0.7 0.8
Injection rate (flits/cycle)
Thr
ough
put (
flits
/cyc
le/P
C)
XY routing
West firstrouting
Duatorouting
Fig. 4.1 Throughput with different routing algorithms under uniform traffic.

31
130
140
150
160
170
180
190
0.1 0.2 0.3 0.4 0.5 0.6 0.7 0.8
Injection rate (flits/cycle)
Ave
rage
pac
ket l
aten
cy
(cyc
les)
XYrouting
West firstrouting
Duatorouting
Fig. 4.2 Average packet latency with different routing algorithms under uniform
traffic.
As stated in [7], adaptive routing significantly increases the network
performance than deterministic routing under nonuniform traffic. Figs. 4.3 and 4.4
show that under the bit reversal traffic, the improvement of the west first routing
algorithm than the XY routing algorithm in throughput (up to 30.8%) and average
packet latency (up to 56.4%) is higher than that under uniform traffic. The Duato
routing algorithm further improves the throughput (up to 39.0%) and packet
latency (up to 44.7%) compared with the west first routing algorithm.

32
0
0.05
0.1
0.15
0.2
0.25
0.3
0.35
0.4
0.1 0.2 0.3 0.4 0.5 0.6 0.7 0.8
Injection rate (flits/cycle)
Thr
ough
put (
flits
/cyc
le/P
C)
XYrouting
WestfirstroutingDuatorouting
Fig. 4.3 Throughput with different routing algorithms under bit reversal traffic.
0
50
100
150
200
250
300
0.1 0.2 0.3 0.4 0.5 0.6 0.7 0.8
Injection rate (flits/cycles)
Ave
rage
pac
ket
lete
ncy
(cyc
les)
XYrouting
WestfirstroutingDuatorouting
Fig. 4.4 Average packet latency with different routing algorithms under bit
reversal traffic.
4.3.2 Comparison of packet length
This set of simulations is based on 4X4 mesh with XY routing under uniform
traffic. Fig. 4.5 and Fig. 4.6 show the throughput and average packet latency vs.
injection rate for packet length=32 and 64 flits, respectively. The throughput
increase linearly when the injection rate is low. However, with the injection rate

33
increasing, the confliction encountered in the network limits the increase of the
throughput. The throughput stays in a certain range (i.e., saturates) when the
injection rate is greater than 0.5 flits per cycle.
Fig. 4.6 shows that the average packet latency for 64 flits/packet is larger
than that for 32 flits/packet. The reason is due to two folds. First, longer packets
will take more time to receive. Second, longer packets will cause more confliction
at intermediate routers on the path from the source to the destination.
0
0.1
0.2
0.3
0.4
0.5
0.1 0.2 0.3 0.4 0.5 0.6 0.7 0.8
Injection rate (flits/cycle)
Thr
ough
put (
flits
/cyc
le/P
C)
64 flits /packet
32 flits /packet
Fig. 4.5 Throughput with different packet length.
0
50
100
150
200
0.1 0.2 0.3 0.4 0.5 0.6 0.7 0.8
Injection rate (flits/cycle)
Ave
rage
pac
ket l
aten
cy
(cyc
les) 64 flits /
packet
32 flits /packet
Fig. 4.6 Average packet latency with different packet length.

34
4.3.3 Comparison of network size
In this comparison, the 3X3 mesh network and 4X4 mesh network are tested
using uniform distribution. The average distance of 3X3 mesh network is smaller
than that of 4X4 mesh network. Thus, there is less conflict in 3X3 mesh than in
4X4 mesh. Therefore, as shown in Fig. 4.7 and 4.8, 3X3 mesh network has
better throughput and packet latency than a 4X4 mesh network.
0
0.1
0.2
0.3
0.4
0.5
0.6
0.1 0.2 0.3 0.4 0.5 0.6 0.7 0.8
Injection rate (flits/cycle)
Thr
ough
put (
flits
/cyc
le/P
C)
Mesh 4X4
Mesh 3X3
Fig. 4.7 Throughput with different network size.
0
50
100
150
200
0.1 0.2 0.3 0.4 0.5 0.6 0.7 0.8
Injection rate (flits/cycle)
Ave
rage
pac
ket l
aten
cy
(cyc
les) Mesh 4X4
Mesh 3X3
Fig. 4.8 Average packet latency with different network size.

35
4.3.4 Comparison of network topology
The four network topologies including mesh, torus, PRDT and BFT are
evaluated under the uniform and three non-uniform traffic patterns as described
in section 4.2.1.
Uniform
0
0.1
0.2
0.3
0.4
0.5
0.6
0.1 0.2 0.3 0.4 0.5 0.6 0.7 0.8
Injection Rate (flits/cycle)
Thr
ough
tput
(f
lits/
cycl
e/P
C)
Mesh
Torus
PRDT
BFT
(a)
Matrix transpose
00.10.20.30.40.50.60.7
0.1 0.2 0.3 0.4 0.5 0.6 0.7 0.8
Injection rate (flits/cycle)
Thr
ough
put
(flit
s/cy
cle/
PC
)
Mesh
Torus
PRDT
BFT
(b)

36
Bit exchange
0
0.10.2
0.3
0.4
0.50.6
0.7
0.1 0.2 0.3 0.4 0.5 0.6 0.7 0.8
Injection Rate (flits/cycle)
Thr
ough
put
(flit
s/cy
cle/
PC
) Mesh
Torus
PRDT
BFT
(c)
Hot point
00.010.020.030.040.050.060.07
0.1 0.2 0.3 0.4 0.5 0.6 0.7 0.8
Injection Rate (flits/cycle)
Thr
ough
put
(flit
s/cy
cle/
PC
) Mesh
Torus
PRDT
BFT
(d)
Fig. 4.9 Variation of throughput with different topologies. (a) Uniform. (b) Matrix
transpose. (c) Bit reversal. (d) Hot point (node a).
As shown in Fig. 4.9, under uniform, matrix transpose and bit reversal traffic
patterns, PRDT has the best throughput. There is no confliction in the PRDT
network under the matrix transpose and bit reversal traffic. Therefore, the
throughput of PRDT increases linearly with the entire injection rate in Fig. 4.9 (b)
and Fig. 4.9 (c). As expected, Fig. 4.9 (a)-(c) shows that torus has better

37
throughput and packet latency than mesh. The BFT network has the worst
throughput. Because it has only six routers in the network, the confliction in the
BFT is more than other topologies.
For the hot point traffic pattern, as shown in Fig. 4.9 (d), the saturation point is
less than 0.1 flits per cycle for mesh, torus and PRDT. For the BFT network,
there are three PCs connected with the hot point PC through the same router.
The packets from the other 12 PCs have to go through a single port of the router
connecting to the hot point PC. This causes the high confliction in the BFT
network, which results its lower throughput. However, compared with other
topologies, BFT uses the smallest number of routers.
Uniform
050
100150200250300
0.1 0.2 0.3 0.4 0.5 0.6 0.7 0.8
Injection Rate (flits/cycle)
Ave
rage
Pac
ket
Late
ncy
(cyc
les)
Mesh
Torus
PRDT
BFT
(a)

38
Matrix transpose
0
100
200
300
400
0.1 0.2 0.3 0.4 0.5 0.6 0.7 0.8
Injection Rate (flits/cycle)
Ave
rage
Pac
ket
Late
ncy
(cyc
les)
Mesh
Torus
PRDT
BFT
(b)
Bit reversal
050
100150200250300350
0.1 0.2 0.3 0.4 0.5 0.6 0.7 0.8
Injuction Rate (flits/cycle)
Ave
rage
Pac
ket
Late
ncy
(cyc
les)
Mesh
Torus
PRDT
BFT
(c)
Hot point
0
500
1000
1500
2000
0.1 0.2 0.3 0.4 0.5 0.6 0.7 0.8
Injection Rate (flits/cycle)
Ave
rage
Pac
ket
Late
ncy
(cyc
les)
Mesh
Torus
PRDT
BFT
(d)
Fig. 4.10 Variation of latency with different topology. (a) Uniform. (b) Matrix
transpose. (c) Bit reversal. (d) Hot point (node a).

39
Fig. 4.10 shows that under uniform, matrix transpose and bit reversal traffic
patterns, PRDT has the lowest average packet latency due to its topology
advantage. Torus has better average packet latency than mesh while BFT has
the worst packet latency. This is consistent with the throughput result.
Under hot point traffic, the average packet latency of PRDT is better than the
other three topologies when injection rate is 0.1 flits/cycle. For injection rate
greater than 0.1 flits/cycle, PRDT has nearly same average packet latency as
mesh and torus. For BFT, packets sent from the three PCs which connect with
the hot point PC through the same router will experience much shorter delay than
the other packets. That is why the average packet latency in BFT in Fig. 4.10(d)
is less than that of other topologies when the injection rate is greater than 0.1
flits/cycle. The variance of packet latency in BFT at 0.1 flits/cycle is large, and the
average packet latency is from the samples before the PC first completing the
injection of packets. So, there is a statistical variance in BFT at 0.1 flits/cycle.

40
CHAPTER 5
CONCLUSION AND FUTURE WORK
5.1 Conclusion
In this thesis, a cycle-accurate NoC simulation system in Verilog HDL has
been developed to evaluate the performance of various NoC topologies. First, a
library of NoC components (including modules for routers, packet generator,
packet receptor), is developed based on an existing design [34]. Then each NoC
architecture to be evaluated is constructed from the library according to the script
file which provides the topology description. The topology description specifies
the network topology, network size, and routing algorithm. The constructed NoC
architectures are simulated using testbenches on ModelSim 6.4. The
performance of the simulated networks in terms of throughput and average
packet latency is collected and analyzed.
Four NoC topologies including mesh, torus, PRDT, and BFT are simulated
and compared under uniform and three types of nonuniform traffic patterns. The
following observations are made from the simulation results:
• Under nonuniform traffic, the improvement of the adaptive routing algorithms
vs. the deterministic routing algorithm in throughput and packet latency is
more significant than under uniform traffic.
• On the same NoC architecture under the same traffic pattern, larger sized
packets will experience longer latency.

41
• Generally, 4x4 PRDT demonstrates better performance than the other
topologies under all four traffic patterns.
5.2 Future Work
The ultimate goal of this project is to develop a FPGA-based NoC emulation
system. The work conducted in this thesis is the first part of the whole project.
Future work includes the extension of the NoC simulation system to support
more network topologies and the implementation of the simulated NoC
architectures on FPGA.

42
REFERENCES
[1] L. Benini and G. D. Micheli, "Network on chips: a new SoC paradigm," Computer, vol. 35, no. 1, pp. 70-78, 2002.
[2] P. E. Berman, L. Gravano, G. D. Pifarr, and J. L. C. Sanz, "Adaptive deadlock-and livelock-free routing with all minimal paths in torus networks," Proc. 4th ACM Symp. Parallel Algorithms and Architectures, 1992, pp. 3-12.
[3] D. Bertozzi, A. Jalabert, S. Murali, R. Tamhankar, S. Stergiou, L. Benini, and G. De Micheli, "NoC synthesis flow for customized domain specific multiprocessor systems-on-chip," IEEE Trans. on Parallel and Distributed Systems, vol. 16, no. 2, pp. 113-129, Feb. 2005.
[4] G. Brebner and D. Levi, "Networking on chip with platform FPGAs," Proc. IEEE Conf. Field-Programmable Technology (FPT), 2003, pp. 13-20.
[5] J. Chan and S. Parameswaran, "NoCGEN: a template based reuse methodology for networks on chip architecture," Proc. 17th Int'l Conf. VLSI Design, 2004, pp. 717-720.
[6] W. J. Dally and C. L. Seitz, "The torus routing chip," Technical Report 5208: TR: 86, C. S. Dept., California Inst. of Technology, pp. 1-19, 1986.
[7] W. J. Dally and H. Aoki, "Deadlock-free adaptive routing in multicomputer networks using virtual channels," IEEE Trans. Parallel and Distributed system, vol. 4, no. 4, pp. 466-475, 1993.
[8] W. J. Dally and B. Towles, "Route packets, not wires: on-chip interconnection networks," Proc. 38th Design Automation Conf. (DAC), pp. 684-689, 2001.
[9] J. Duato, "Deadlock-free adaptive routing algorithms for multicomputers: evaluation of a new algorithm," Proc. 3rd IEEE Symp. Parallel and Distributed Processing, 1991, pp. 840-847.
[10] J. Duato, S. Yalamanchili, and L. Ni, Interconnection networks: an engineering approach, Morgan Kaufmann Publishers, 2003, pp. 62.
[11] P. Fupta and N. McKeown, "Design and Implementation of a fast crossbar scheduler," IEEE Micro, vol. 19, no. 1, pp. 20-28, 1999.
[12] N. Genko, D. Atienza, G. D. Micheli, and L. Benini, "Feature-NoC emulation: a tool and design flow for MPSoC," IEEE Circuits and Systems Magazine, vol. 7, no. 4, pp. 42-51, 4th Quarter 2007.
[13] K. Goossens, J. Dielissen, and A. Radulescu, "AEthereal network on chip: concepts, architectures, and implementations," IEEE Design & Test of Computers, vol. 22, no. 5, pp. 414-421, Sept.-Oct. 2005.
[14] R. I. Greenberg and L. Guan, "An improved analytical model for wormhole routed networks with application to butterfly fat-trees," Proc. Int'l Conf. Parallel Processing, 1991, pp. 44-48.

43
[15] P. Guerrier and A. Greiner, "A generic architecture for on-chip packet-switched interconnections," Proc. Design and Test in Europe (DATE), 2000, pp. 250-256.
[16] J. Hennessey and C. L. Seitz, Computer architecture: a quantitative approach, Morgan Kaufmann, 2003.
[17] J. Hu and R. Marculescu, "Energy-aware mapping for tile-based NoC architectures under performance constraints," Proc. Asia South Pacific Design Automation, 2003, pp. 233-239.
[18] ITRS, "The international technology roadmap for semiconductors 2007 edition: system drivers," Available: http://www.itrs.net, 2007, pp. 7.
[19] ITRS, "The international technology roadmap for semiconductors: 2007," Available: http://www.itrs.net, 2007, pp. 15.
[20] A. Jerraya, H. Tenhunen, and W. Wolf, "Multiprocessor systems-on-chips," Computer, vol. 38, no. 7, pp. 36-41, 2005.
[21] F. Karim, "An interconnect architecture for networking systems on chips," IEEE Micro, vol. 22, no. 5, pp. 36-45, 2002.
[22] S. Kumar, "A network on chip architecture and design methodology," Proc. Int’l Symp. VLSI (ISVLSI), 2002, pp. 117-124.
[23] J. Madsen, S. Mahadevan, K. Virk, and M. Gonzalez, "Network-on-chip modeling for system-level multiprocessor simulation," Proc. 24th IEEE Real-Time Systems Symp. (RTSS), 2003, pp. 265-274.
[24] G. Mas and P. Martin, "Network-on-chip: the intelligence is in the wire," IEEE Int’l. Conf. Computer Design: VLSI in Computer and Processor, pp. 174-177, 2004.
[25] P. P. Pande, C. Grecu, A. Ivanov, and R. Saleh, "Design of a switch for network on chip applications," Proc. Int'l Symp. Circuits and Systems (ISCAS), 2003, pp. 217-220.
[26] P. P. Pande, C. Grecu, M. Jones, A. Ivanov, and R. Saleh, "Performance evaluation and design trade-offs for network-on-chip interconnect architectures," IEEE Trans. Comput., pp. 1025-1040, 2005.
[27] F. Petrini and M. Vanneschi, "K-ary N-trees: high performance networks for massively parallel architectures," Proc. 11th Int'l Parallel Processing Symp., 1997, pp. 87-93.
[28] M. Pirretti, G. M. Link, R. R. Brooks, N. Vijaykrishnan, M. Kandemir, and M. J. Irwin, "Fault tolerant algorithms for network-on-chip interconnect," Proc. IEEE Computer Society Annual Symp. VLSI Emerging Trends in VLSI Systems Design (ISVLSl), 2004, pp. 46-51.
[29] D. A. Reed and D. C. Grunwald, "The performance of multicomputer interconnection networks," IEEE Computer, vol. 20, no. 6, pp. 63-73, 1987.
[30] N. Shankar, "Design and implementation of NoC routers and their application to PRDT-based NoC's," Master Thesis, University of Nevada, Las Vegas, pp. 34, 2007.
[31] N. Shankar, M. Yang, Y. Jiang, L. Zhang, Y. Yang, E. Lu, and X. Yun, "Design and implementation of a parameterized NoC router and its application to build PRDT-based NoCs," Proc. 5th Int'l Conf. Information Technology: New Generations (ITNG), 2008, pp. 259-264.

44
[32] D. Siguenza-Tortosa and J. Nurmi, "VHDL-based simulation environment for proteo NoC," Proc. 7th IEEE Int'l High-Level Design Validation and Test Workshop, 2002, pp. 1-6.
[33] C. C. Xiang and P. Liu, "The design and implementation of NoC router," Technical Report, Zhejiang University, Hangzhou, China, 2008.
[34] C. C. Xiang and P. Liu, "Research on building block design and verification for NoC," Master Thesis, Zhejiang University, Hangzhou, China, pp. 35, 2008.
[35] G. Yang, M. Yang, Y. Yang, and Y. Jiang, "On the physical layout of PRDT-based NoCs," Proc. Int'l Conf. Information Technology: New Generations (ITNG), 2007, pp. 729-733.
[36] Y. Yang, A. Funahashi, A. Jouraku, H. Nishi, H. Amano, and T. Sueyoshi, "Recursive diagonal torus: an interconnection network for massively parallel computers," IEEE Trans. Parallel and Distributed system, vol. 12, no. 7, pp. 701-715, Dec. 2001.
45
VITA
Graduate College University of Nevada, Las Vegas
Xinan Zhou
Local Address:
1852 Desert Forest Way Henderson, NV 89012
Degree:
Bachelor of Science in Engineering, Applied Physics, 2007 East China University of Science and Technology, P. R. China
Thesis Title: Performance Evaluation of Network-on-Chip Interconnect
Architectures Thesis Examination Committee:
Chairperson, Dr. Mei Yang, Ph.D. Committee Member, Dr. Yingtao Jiang, Ph.D. Committee Member, Dr. Biswajit Das, Ph.D. Graduate Faculty Representative, Dr. Yoohwan Kim, Ph.D.